Abstract
Merchant ships sometimes fail to detect small ships at night and in poor visibility, leading to urgent situations and even collisions. Infrared (IR) cameras have inherent advantages in small target detection and become essential environmental awareness equipment on unmanned ships. The existing target detection models are complex and difficult to deploy on small devices. Lightweight detection algorithms are needed with the increase in the number of shipborne cameras. Therefore, herein, a lightweight model for small IR ship detection was selected as the research object. IR videos were collected in the Bohai Strait, the image sampling interval was calculated, and an IR dataset of small ships was constructed. Based on the analysis of the characteristics of the IR ship images, gamma transform was used to preprocess the images, which increased the gray difference between the target and background. The backbone of YOLOv5 was replaced with that of Mobilev3 to improve the computing efficiency. Finally, the results showed that the parameters of the proposed model were reduced by 83% compared with those of the YOLOv5m model, while the detection performance was almost the same.
1. Introduction
Collisions between large and small ships usually cause severe loss of life and marine pollution. The detection of small ships has become a crucial issue in navigation. Statistics show that ships smaller than 100 m have a greater collision probability than large ships [1] owing to their poor radar reflection. Small ships, such as pirate ships, are mostly made of wood or fiberglass and have poor reflectivity toward radar waves. Moreover, small ships, such as fishing boats, sometimes turn off their automatic identification system (AIS), which broadcasts information to surrounding ships and should always be on during sailing. Finally, the use of fog signals is unregulated on small ships. Small ships are usually busy with their operations and do not sound the fog horn in poor visibility.
Small ships burn oil during sailing, so their temperature is higher than the background temperature. IR cameras can convert the temperature difference into grayscale difference, so small ships remain clear in IR images at night and in poor visibility. Therefore, IR equipment has considerable advantages for the detection of small ships and can compensate for the deficiencies of radar and AIS in this respect. Therefore, IR cameras have become essential surveillance sensors for unmanned ships [2,3,4].
Recently, researchers have designed many high-precision object detection models, but these models are usually computationally intensive. The need for lightweight ship detection models becomes stronger with the increasing number of onboard cameras. Detection accuracy is usually proportional to algorithm complexity, making it challenging to deploy high-precision algorithms on unmanned ships. Herein, the contradiction between algorithm accuracy and complexity is investigated, and a lightweight deep learning model for small ship detection in IR images is proposed.
Marine IR images are collected in the Bohai Strait, and the sampling interval of the IR images is analyzed. The coefficients of the gamma transform are then determined by analyzing the characteristics of small ships and their backgrounds. Finally, the experiments confirm that the gamma transform can improve the detection efficiency of small ships.
The main contributions of this study are as follows:
- The dataset built in this study is the first IR image dataset for small ship detection in complex scenarios.
- The backbone of YOLOv5 is replaced by that of MobileNetV3 to make the detection model lightweight. The proposed model is conducive to autonomous navigation in practical scenarios.
- This study analyzes the characteristics of IR ship images and proposes the use of gamma transform to preprocess the images. Small IR ships are evident in the transformed image, assisting the algorithms in detecting small ships.
2. Related Work
2.1. Maritime Video Surveillance
More attention has been paid to maritime video surveillance with the development of unmanned ships in recent years. IR cameras have become essential equipment on unmanned ships [5,6,7]. The Maritime Unmanned Navigation through Intelligence in Networks project combined IR cameras with visible cameras, radars, and AIS. The zero-emission unmanned ship Yara Birkeland, developed by KONGSBERG, was equipped with IR and visible cameras [8]. In addition, video surveillance is increasingly being employed on ordinary ships to assist crews in locating small ships during sailing.
Maritime video surveillance is more complicated than the recognition of vehicles and pedestrians. First, it is challenging to obtain enough data, particularly because deep learning requires numerous training samples. However, compared with the visible ship images [9], the IR dataset is scarcer, limiting the research on IR ship detection, recognition, and tracking. Maritime video collection is more time-consuming and expensive than land traffic video acquisition. Second, the size of the ships in the image changes drastically. The length of ships varies considerably, ranging from 400 m to <10 m. In addition, the distance variations substantially change the scale of the ships in the image. Finally, IR images lack rich colors and textures, which makes many neural network units unable to obtain effective parameters, leading to poor performance.
2.2. Ship Detection Based on Traditional Methods
Traditional ship detection methods mainly focus on mining the unique attributes of ships. These technologies are generally under the scope of background modeling and subtraction, human visual attention, and edge features. A Gaussian mixture model [10,11] and its modifications [12] are often used to model the sea surface, followed by background subtraction. Background modeling usually takes a certain amount of time and is suitable for target detection in fixed scenarios. Background subtraction may fail when the ship is swinging. Mumtaz et al. [13] used a graph-based visual saliency algorithm to compute the saliency maps of the input IR images and determined the salient regions by multilevel thresholding the maps. Fefilatyev et al. [14] exploited gradient information for ship detection and tracking.
Sea–sky line (SSL) detection is also an important content in traditional ship detection methods. The methods for SSL detection can be broadly categorized into three types: transformation [15], region attributes [16], and semantic segmentation [17]. The determination of SSL can reduce the search area and the interference of waves and clouds [18]. However, SSL in visible images cannot be detected in poor visibility.
2.3. Ship Detection Based on Deep Learning
Recently, object detection based on deep learning has attracted considerable research attention and achieved remarkable performance results. Unlike object detection based on manually extracted features, deep learning can automatically optimize parameters based on big data and computing power. Deep learning object detection algorithms are categorized into one-stage and two-stage detection methods. One-stage detectors directly predict the class probability and coordinate offset of the object. Representative one-stage detection algorithms include you only look once (YOLO) [19,20], single shot multibox detector (SSD) [21], and RetinaNet [22]. Unlike one-stage detection methods, two-stage detection methods generate a set of recommended regions and take these regions as input to detect and classify objects. Regions with convolutional neural network (R-CNN) [23] is the first proposed two-stage detection algorithm. Fast R-CNN [24], Faster R-CNN [25], and feature pyramid network (FPN) [26] are the improved R-CNN algorithms.
Both one-stage and two-stage detection methods are used in marine target detection. Zhou et al. [27] improved YOLOv5s by expanding the receptive field area and optimizing the loss function to increase ship detection mAP to 98.6%. Ma et al. [28] built a low-illumination ship dataset containing 1258 images and used RetinaNet to detect ships in dim light. Shao et al. [9] constructed a large visible image dataset containing six types of ships and tested Fast R-CNN, Faster R-CNN, SSD, and YOLOv2 on this dataset. To solve the problem of insufficient samples of small ships, Chen et al. [29] used a generative adversarial network and YOLOv2 to generate training samples and to detect small ships in visible images, respectively. However, it was shown that these ships are relatively large in the images; therefore, ship detection is not considerably difficult. Li et al. [30] used DenseNet and spatial separation convolution to replace the backbone of YOLOv3 and standard convolution. The modified network was lightweight and exhibited better ship detection performance in the case of visible images than the original YOLOv3.
Recently, ship detection methods based on SAR and IR images have become increasingly popular. In complex-scenario SAR images, Chen et al. [31] combined the region proposal network with the FPN to detect small ships. To make the detection network lightweight, Xiong et al. [32] used YOLOv5n as the baseline, used the attention mechanism, and simplified the spatial pyramid pool structure to detect ships in SAR images. In terms of IR ship detection, Wang et al. [33] generated an enhancement map to suppress the background and segment the maritime targets from the IR images. To eliminate the interference of sun-glint clutter in the case of ship detection, Li et al. [34] designed a high-dimensional feature based on the time fluctuation and space structure features to distinguish ships and clutters. Wang et al. [18] analyzed the spectral bands commonly used in ship detection and pointed out that IR images performed better than visible images in harsh maritime environments. Farahnakian et al. [35] investigated the influence of different fusion architectures on ship detection. Chang et al. [36] detected ships on self-built datasets by modifying the network structure of YOLOv3. However, the IR images in their study do not conform to the characteristics of thermal imaging and may be visible under low light.
3. Methodology
3.1. Data Acquisition
3.1.1. Image Collection
On 28 October 2022, FLIR M617CS, a multispectral marine camera with gyro stabilization, was installed on the Sinorail Bohai Train Ferry to collect maritime videos. The ship sailed from Lushun Port at 10:30 am and arrived at Yantai Port at 5:00 pm. The ship crossed the Bohai Strait from north to south and passed through the Laotieshan Channel, one of the busiest waterways in China. The collected videos covered typical navigation scenarios, such as docking, departure, and sailing (Figure 1).
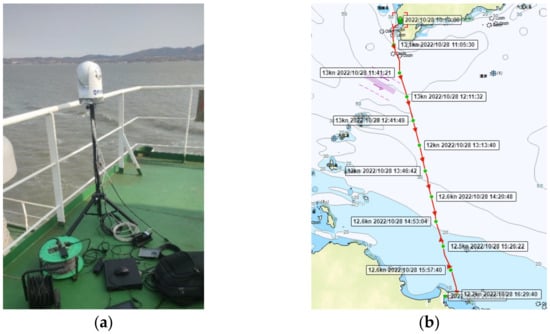
Figure 1.
Maritime image acquisition. (a) Data acquisition on the ship; (b) ship route.
3.1.2. Image Sampling
Ships usually keep a vast distance from obstacles (e.g., other ships, islands, and buoys) to avoid collisions. In addition, compared with land traffic, the speed of ships is relatively slow; therefore, the change in the maritime image is slow. Almost no difference is observed between images at intervals of 1 s, as shown in Figure 2. In the sea image with an interval of 10 s, the nearby ship exhibits a substantial azimuth change, but the distant mountain exhibits a marginal change.
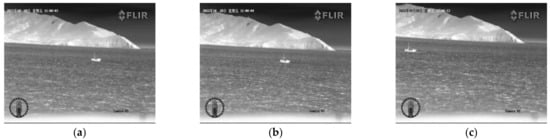
Figure 2.
Marine IR images at different intervals. (a) Marine IR image; (b) marine IR image with a 1 s interval from (a); (c) marine IR image with a 10 s interval from (a).
The original data are in a video format. For the convenience of follow-up research, an 8-bit deep PNG image sequence is extracted from the videos, and the time interval is an important issue. There is a contradiction between the sampling interval and image diversity. When the sampling interval is small, the similarity between images is high. Using these images may lead to overfitting for neural network training. The increase in image sampling time results in a considerable difference between images, but reduces the number of sampled images. It is necessary to deduce the sampling time theoretically to obtain a reasonable sampling interval.
The acquisition ship sails along route AB, as shown in Figure 3. When the own ship is at point A, the distance between the own ship and the target is DA. When the ship sails to point B, the azimuth change angle of the target is .
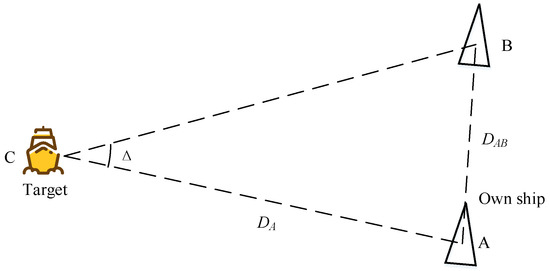
Figure 3.
Schematic of data collection at sea.
The distance from point A to B is calculated as follows:
Assuming the speed of the ship is V, the travel time from point A to point B can be obtained.
As shown in Equation (2), the travel time is related to the target distance, sailing speed, heading, and minimum change azimuth. In this study, the speed of the ship is ~13 knots. Assuming that the distance of the acquisition target is 1 nautical mile, the minimum change angle of the target in the image is 2° and the minimum sampling interval can be obtained as 9.67 s. In addition, ship swaying and platform rotation may cause severely blurred image records. Therefore, these data are eliminated in the preprocessing stage.
3.1.3. Annotation
In this study, LabelMe [37,38] software was used to annotate ships with rectangular boxes and the annotations were converted to PASCAL VOC [39] format. Because there are only dozens of pixels for small ships in thermal images, it is impossible to distinguish the types of ships; therefore, all ships were marked with “ship.” After selection and annotation, 390 images containing 668 ships were retained in the dataset. Figure 4 shows the size of ships in the dataset. According to the definition of target size in MS COCO [40], most ships in the dataset are small.
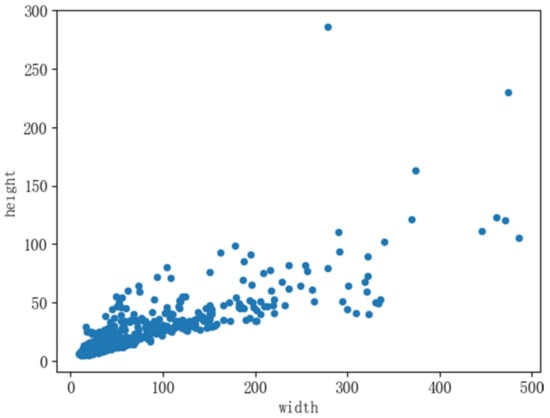
Figure 4.
Size of ships in the dataset.
3.2. Characteristic Analysis of Marine IR Images
3.2.1. Analysis of IR Background
Unmanned ships can navigate not only in open waters, but also in narrow waters and complete berthing and departing automatically. The enormous environmental change poses a considerable challenge to ship detection algorithms. Ships maintain vast distances between each other in open water; therefore, small targets usually appear in the sea–sky line. A slight brightness difference is observed between the sea–sky line and the ship, as seen in Figure 5a.
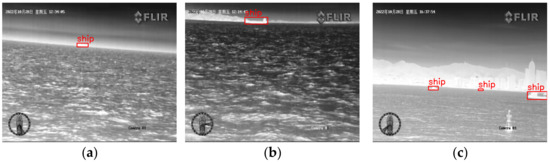
Figure 5.
Typical navigation images. (a) Open water; (b) narrow water; (c) harbor.
The background becomes complex in the narrow waters and harbors. The brightness of mountains and buildings in the IR images is high, affecting the detection of ships in these areas, as shown in Figure 5b,c.
The grayscale value of IR images is counted to obtain the grayscale probability map. The number of pixels with the same gray value is then divided by the total number of pixels to obtain the probability in the entire image, as shown in Figure 6a. As can be seen, the grayscale distribution of the maritime IR image is between 30 and 250, approximately following the normal distribution. The overall grayscale of the image is low because the sky and sea occupy most of the image.
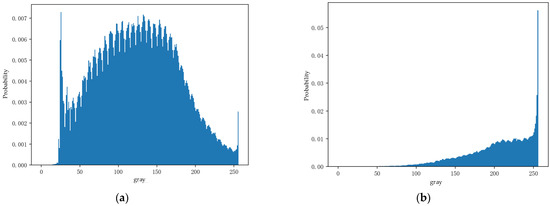
Figure 6.
Grayscale of IR images. (a) Entire image; (b) ship region.
3.2.2. Analysis of IR Ship Images
The statistics of the ship regions were calculated according to the target coordinates in the annotations (Figure 6b). The brightness of the ship areas is higher than the background. Ships emit considerable heat during sailing, resulting in the high brightness of the targets in the IR image. The grayscale of 90% of the pixels is >150, and the maximum probability lies between 250 and 255. A few pixels in the target areas are low in brightness because the annotation boxes contain some background.
3.3. Gamma Transform
3.3.1. Principle
As shown in Figure 6, a large gap is observed between the ships and the background in the grayscale probability distribution. To increase the grayscale difference between foreground and background, in this study, the gamma transform is used to preprocess the IR image. Gamma transform enhances the image through nonlinear transformation and corrects substantially bright or dark images. The formula of gamma transform is as follows:
where r represents the input value, s represents the output value, c represents a constant, and γ (gamma) represents a coefficient. To ensure that the output value is within a reasonable range, the input image needs to be normalized as follows:
Figure 7 shows the gamma transform with the input and output on the horizontal axis and vertical axis, respectively. When gamma is <1, the overall brightness of the transformed image is improved. The brightness and contrast of the dark area are considerably improved, which is conducive to displaying the details. When gamma is >1, the contrast of high-brightness areas increases.
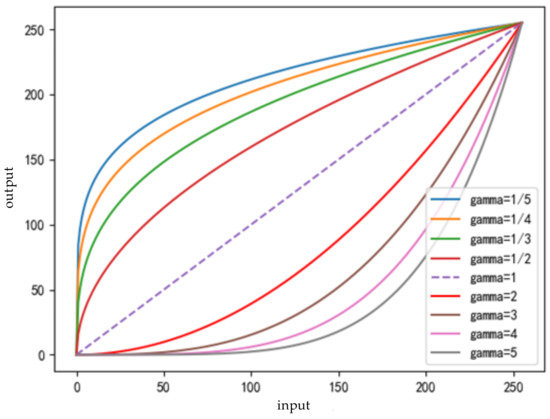
Figure 7.
Gamma transform.
3.3.2. Transformation Coefficient
The selection of the coefficient is crucial in the gamma transform. Different improvements can be obtained for various coefficients [41]. This paper uses signal-to-clutter ratio (SCR) and SCR gain to select an appropriate gamma coefficient. In small IR target detection, SCR is usually used to measure the contrast between the target and the background, and SCR gain is used to measure the ability of the algorithm to suppress background noise [42]. They are defined as follows:
where represents the mean pixel value of the target and and represent the mean pixel value and standard pixel deviation of the background, respectively.
where SCRin and SCRout represent the SCR of the image before and after the gamma transform, respectively.
As presented in Table 1, the mean value of the background decreases sharply, but the mean value of the target region decreases slowly. The difference between the target and background becomes significant after transformation. The transform also improves the standard deviation (std), SCR, and SCR gain of images.

Table 1.
Image evaluation after gamma transform.
Figure 8 displays the images after the gamma transform from the perspective of subjective perception. When gamma is set to 4, the contrast between the foreground and background increases and the clarity of the distant targets increases. When gamma is set to ≥5, some ships at sea with low thermal radiation may disappear from the image. Therefore, comprehensively considering the influence of gamma transform on subjective and objective observation, gamma was set as 4 in this study.
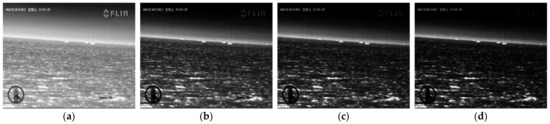
Figure 8.
Gamma-transformed images. (a) Original image; (b) gamma = 3; (c) gamma = 4; (d) gamma = 5.
3.3.3. Analysis of IR Characteristics after Transformation
The statistics of the collected images and targets werecalculated, as shown in Figure 9. Compared with the distribution map before transformation, the gray values of the entire image and the target region shift in different directions. Figure 10 shows the typical navigation images after the gamma transform. It can be seen that the targets become clearer after transformation, which is beneficial for target detection.
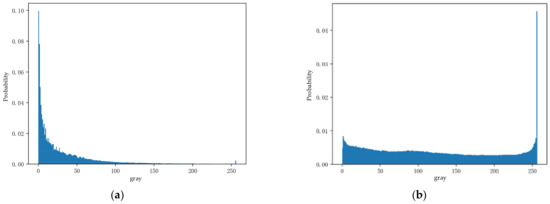
Figure 9.
Grayscale of IR images after transformation. (a) Entire image; (b) ship regions.
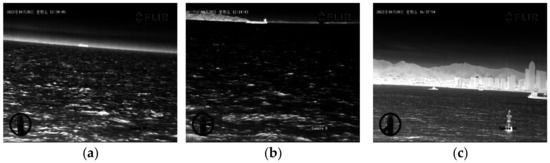
Figure 10.
Typical navigation images after gamma transform. (a) Open water; (b) narrow water; (c) harbor.
4. Lightweight Small Ship Detection Neural Network
4.1. Evaluation Indices
According to the definitions of spectral bands in ISO 20473 [43], IR radiation has three categories: near, mid, and far IR. In this study, the IR camera band is 7.5–13.5 μm, corresponding to the mid-IR category. Furthermore, in this study, the mid-IR images in the ship detection dataset at open sea [44] were used to increase the diversity of images and avoid overfitting. The dataset retained 1434 images. Moreover, 80% of the images were used for training and validation, and the rest were used as test sets.
The evaluation index in the experiments included average precision, recall rate (R), and precision rate (P), which are shown in Equation (7).
where TP, FP, and N represent the number of ships correctly detected, falsely detected, and undetected, respectively.
4.2. Performance of YOLOv5
As a typical version of the current YOLO series, the YOLOv5 [45] model has been a widely used target detection model since its release, exhibiting excellent performance in target detection [27,46]. According to the width and depth of the network, YOLOv5 models can be divided into five models: YOLOv5n, YOLOv5s, YOLOv5m, YOLOv5l, and YOLOv5x. YOLOv5n has the lowest number of parameters, while YOLOv5x has the highest number.
The YOLOv5 models were trained using the dataset and verified on the test set in the case of IR small ship detection. The experiments were conducted on a Linux server with Pytorch 1.7.1. CUDA 11.0 was employed, and the GPU was a GeForce 3070 Ti with an 8 GB memory. Table 2 and Table 3 present the parameters and comparison results of the different models.
Table 2.
Training parameters.
Table 3.
Performance comparison table.
As presented in Table 3, the detection accuracy of the models gradually improved with the increase in network depth and width. YOLOv5n had the shallowest depth and narrowest width of features and could be easily deployed on mobile devices. However, the performance of YOLOv5n was worse than that of other large models and could not meet the requirement of autonomous navigation. Among them, the YOLOv5x model exhibited the best detection accuracy, but it was substantially complex to deploy on mobile devices.
In addition to the YOLOv5 model, Faster R-CNN [25], SSD [21], and RetinaNet [22] were also trained and tested. In terms of the four evaluation indexes, Faster R-CNN exhibited the worst target detection performance, which can be attributed to poor region proposal. SSD achieved the best ship detection precision, but performed poorly on the other three indexes. The performance of RetinaNet was moderate with respect to all indexes, but its performance was lower than that of YOLOv5s.
4.3. YOLOv5-Mobile
The structure of YOLOv5 can be divided into input, backbone, neck, and head. The backbone is the foundation of the entire network, which is used for image feature extraction. The subsequent processes are based on the features extracted from the backbone. The backbone network is the most computationally intensive part of YOLOv5; therefore, it becomes the focus of the model’s lightweight improvement.
The proportion of parameters in different YOLOv5 models was statistically analyzed (Table 4). Among the four parts, the parameter in the backbone occupied the largest proportion, which was approximately 60%. In the case of YOLOv5x, the number of parameters in the backbone was approximately 46 million. The large number of parameters in the backbone made YOLOv5x perform best in the case of small IR ship detection. Therefore, making the backbone network more concise and efficient has become an attractive topic.
Table 4.
Parameter statistics of different parts of YOLOv5.
To solve the contradiction between model precision and complexity, in this study, the backbone of MobileNetV3 [47] was used to replace that of YOLOv5. MobileNet is a high-performance network that can run on mobile devices. Using 1 × 1 and 3 × 3 convolution instead of 5 × 5 convolution reduces the parameters and backpropagation delay in the MobileNet. Adopting the h-swish and attention mechanism improves computing speed and accuracy. The YOLOv5 backbone was replaced with that of the MobileNetV3-Small, and the modified model was named YOLOv5-mobile.
YOLOv5-mobile can also be divided into backbone, neck, and head (Figure 11). The depth and complexity of the backbone are reduced, which helps reduce the overall computation load of the model. The PANet structure is retained in the neck to enhance the detection of ships of different sizes. The PANet structure is a bottom-up path enhancement that shortens the information propagation path and uses precise positioning information from low-level features. In the head, YOLOv5-mobile retains the structure of YOLOv5 using three heads to detect ships of different sizes.
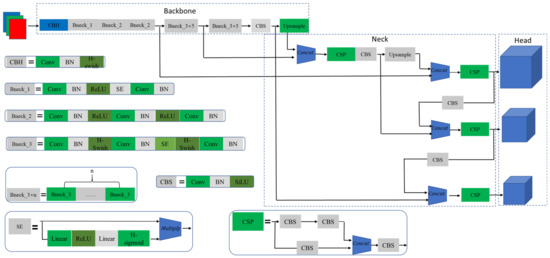
Figure 11.
Structure of YOLOv5-mobile.
5. Experiment and Discussion
Table 5 presents the small IR ship detection results obtained using the test set. The first five algorithms detected ships in original images, while the latest algorithm worked on gamma-transformed images. As can be seen, compared with YOLOv5n, mAP@0.5 and mAP@0.5:0.9 of YOLOv5-mobile increased by 12.7% and 25.1%, respectively. The change in the backbone improved the ability of feature extraction. YOLOv5-mobile exhibited almost the same detection performance as YOLOv5s, but only half the parameters. For the transformed images, the objective indices of YOLOv5-mobile were further improved, indicating that gamma transform was helpful for small ship detection. The performance of YOLOv5-mobile on the transformed image was almost similar to that of YOLOv5m, but the number of parameters decreased by 83%. The parameter number of YOLOv5-mobile only accounted for one-eighth of YOLOv5m, and the complexity of the model was considerably reduced, which was conducive to application.
Table 5.
Comparison of the improved model evaluation.
Three typical images were selected for IR small ship detection (Figure 12). As shown in Figure 12a, YOLOv5n, YOLOv5s, and YOLOv5-mobile failed to detect a small ship in the sea–sky area. The possible reason was that the size of the ship was considerably small and the gray difference between the ship and the background was slight; therefore, the networks could not extract the features. As shown in Figure 12b, YOLOv5n did not detect any ship, possibly owing to the narrow width of the network. As shown in Figure 12c, YOLOv5-mobile (gamma) detected five small ships. In comparison, YOLOv5-mobile detected only two ships, confirming that the gamma transform was indeed helpful in improving small ship detection in IR images.
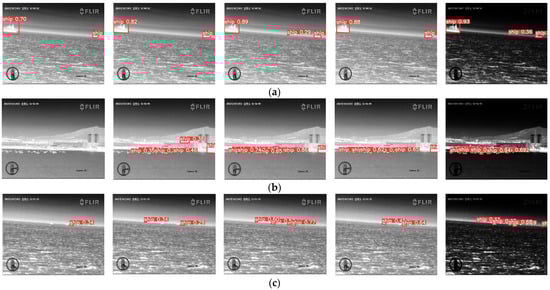
Figure 12.
Visual comparison of detection results. The algorithms from left to right are YOLOv5n, YOLOv5s, YOLOv5m, YOLOv5-mobile, and YOLOv5-mobile (gamma). (a) Open water; (b) harbor; (c) narrow water.
6. Conclusions
Owing to the particularity of the size and materials of small ships, it is difficult for shipborne radar, AIS, and crew members to detect small ships, which becomes a threat to the automatic navigation of ships. IR cameras can convert the temperature difference between small ships and the background into gray difference; therefore, small IR ship detection becomes an essential technology in poor visibility and at night.
Herein, a lightweight small ship detection algorithm combined with IR characteristic analysis was proposed to reduce the complexity of the model and ensure detection performance. First, a small IR ship dataset was constructed, and the detailed design of the dataset was described, including its acquisition procedure, annotation method, and sampling interval calculation. Second, gamma transform was used to preprocess the input images by analyzing the characteristics of IR ships. Furthermore, YOLOv5-mobile was proposed to reduce the complexity of existing detection models. The detection performance of the proposed model was almost the same as that of YOLOv5m, while the model parameters were reduced by 83%. Two inspirations can be drawn from this study, which can also be applied to image segmentation and target tracking. First, in the era of deep learning, traditional image preprocessing is still helpful in improving neural network performance. Second, for a simple task, the performance improvement of complex models is limited, and lightweight models are suitable.
Future research can be focused on the following aspects: (1) continuing to collect maritime IR images under different weather and sea conditions and (2) combining IR detection with AIS and radar.
Author Contributions
Conceptualization, Z.G. and Y.Z.; methodology, Z.G.; software, Z.G.; validation, Z.G.; formal analysis, Z.G.; investigation, Z.G.; resources, Z.G.; data curation, Z.G.; writing—original draft preparation, Z.G.; writing—review and editing, Z.G. and S.W.; visualization, Z.G.; supervision, Y.Z.; project administration, Z.G.; funding acquisition, Y.Z. All authors have read and agreed to the published version of the manuscript.
Funding
This work was funded by the National Natural Science Foundation of China (No. 52231014) and the Fundamental Research Funds of the Central Universities (No. 3132023148).
Institutional Review Board Statement
Not applicable.
Informed Consent Statement
Not applicable.
Data Availability Statement
The datasets analyzed or generated in this study are available from the authors upon reasonable request.
Conflicts of Interest
The authors declare no conflict of interest.
References
- Zhang, J.; Teixeira, Â.P.; Guedes Soares, C.; Yan, X. Quantitative assessment of collision risk influence factors in the Tianjin port. Saf. Sci. 2018, 110, 363–371. [Google Scholar] [CrossRef]
- Thieme, C.A.; Utne, I.B.; Haugen, S. Assessing ship risk model applicability to Marine Autonomous Surface Ships. Ocean Eng. 2018, 165, 140–154. [Google Scholar] [CrossRef]
- Rivkin, B.S. Unmanned Ships: Navigation and More. Gyroscopy Navig. 2021, 12, 96–108. [Google Scholar] [CrossRef]
- Hogg, T.; Ghosh, S. Autonomous merchant vessels: Examination of factors that impact the effective implementation of unmanned ships. Aust. J. Marit. Ocean Aff. 2016, 8, 206–222. [Google Scholar] [CrossRef]
- Rødseth, Ø.J.; Tjora, Å. A system architecture for an unmanned ship. In Proceedings of the 13th International Conference on Computer and IT Applications in the Maritime Industries, Redworth, UK, 12–14 May 2014. [Google Scholar]
- Fan, C.; Wróbel, K.; Montewka, J.; Gil, M.; Wan, C.; Zhang, D. A framework to identify factors influencing navigational risk for Maritime Autonomous Surface Ships. Ocean Eng. 2020, 202, 107–188. [Google Scholar] [CrossRef]
- Jokioinen, E.; Poikonen, J.; Hyvönen, M.; Kolu, A.; Jokela, T. Remote and Autonomous Ships The Next Steps; Rolls-Royce: London, UK, 2016. [Google Scholar]
- Gao, Z.; Zhu, F.; Chen, H.; Ma, B. Maritime Infrared and Visible Image Fusion Based on Refined Features Fusion and Sobel Loss. Photonics 2022, 9, 566. [Google Scholar] [CrossRef]
- Shao, Z.; Wu, W.; Wang, Z.; Du, W.; Li, C. SeaShips: A Large-Scale Precisely Annotated Dataset for Ship Detection. IEEE Trans. Multimed. 2018, 20, 2593–2604. [Google Scholar] [CrossRef]
- Szpak, Z.L.; Tapamo, J.R. Maritime surveillance: Tracking ships inside a dynamic background using a fast level-set. Expert Syst. Appl. 2011, 38, 6669–6680. [Google Scholar] [CrossRef]
- Zhang, Y.; Li, Q.-Z.; Zang, F.-N. Ship detection for visual maritime surveillance from non-stationary platforms. Ocean Eng. 2017, 141, 53–63. [Google Scholar] [CrossRef]
- Zhang, W.; Zheng, Y. Intelligent ship-bridge collision avoidance algorithm research based on a modified Gaussian Mixture Model. In Proceedings of the 2011 International Conference on Multimedia Technology, Hangzhou, China, 26–28 July 2011; pp. 6414–6419. [Google Scholar]
- Mumtaz, A.; Jabbar, A.; Mahmood, Z.; Nawaz, R.; Ahsan, Q. Saliency based algorithm for ship detection in infrared images. In Proceedings of the 2016 13th International Bhurban Conference on Applied Sciences and Technology (IBCAST), Islamabad, Pakistan, 12–16 January 2016; pp. 167–172. [Google Scholar]
- Fefilatyev, S.; Goldgof, D.; Shreve, M.; Lembke, C. Detection and tracking of ships in open sea with rapidly moving buoy-mounted camera system. Ocean Eng. 2012, 54, 1–12. [Google Scholar] [CrossRef]
- Özertem, K.A. A Fast Automatic Target Detection Method for Detecting Ships in Infrared Scenes; SPIE: Baltimore, MD, USA, 2016; Volume 9844. [Google Scholar]
- Fefilatyev, S. Detection of Marine Vehicles in Images and Video of Open Sea. Master’s Thesis, University of South Florida, Tampa, FL, USA, 2008. [Google Scholar]
- Yang, W.; Li, H.; Liu, J.; Xie, S.; Luo, J. A sea-sky-line detection method based on Gaussian mixture models and image texture features. SAGE J. 2019, 16, 1729881419892116. [Google Scholar] [CrossRef]
- Wang, L.Q.; Fan, S.Z.; Liu, Y.X.; Li, Y.F.; Fei, C.; Liu, J.L.; Liu, B.H.; Dong, Y.K.; Liu, Z.J.; Zhao, X. A Review of Methods for Ship Detection with Electro-Optical Images in Marine Environments. J. Mar. Sci. Eng. 2021, 9, 1408. [Google Scholar] [CrossRef]
- Redmon, J.; Divvala, S.; Girshick, R.; Farhadi, A. You Only Look Once: Unified, Real-Time Object Detection. In Proceedings of the 2016 IEEE Conference on Computer Vision and Pattern Recognition (CVPR), Las Vegas, NV, USA, 27–30 June 2016; pp. 779–788. [Google Scholar]
- Redmon, J.; Farhadi, A. YOLO9000: Better, Faster, Stronger. In Proceedings of the 2017 IEEE Conference on Computer Vision and Pattern Recognition (CVPR), Honolulu, HI, USA, 21–26 July 2017; pp. 6517–6525. [Google Scholar]
- Liu, W.; Anguelov, D.; Erhan, D.; Szegedy, C.; Reed, S.; Fu, C.Y.; Berg, A.C. SSD: Single shot multibox detector. In Proceedings of the 14th European Conference on Computer Vision, Amsterdam, The Netherlands, 8–16 October 2016; pp. 21–37. [Google Scholar]
- Lin, T.Y.; Goyal, P.; Girshick, R.; He, K.M.; Dollar, P. Focal loss for dense object detection. In Proceedings of the 16th IEEE International Conference on Computer Vision (ICCV), Venice, Italy, 22–29 October 2017; pp. 2999–3007. [Google Scholar]
- Girshick, R.; Donahue, J.; Darrell, T.; Malik, J. Rich Feature Hierarchies for Accurate Object Detection and Semantic Segmentation. In Proceedings of the 2014 IEEE Conference on Computer Vision and Pattern Recognition, Columbus, OH, USA, 23–28 June 2014; pp. 580–587. [Google Scholar]
- Girshick, R. Fast R-CNN. In Proceedings of the 2015 IEEE International Conference on Computer Vision (ICCV), Santiago, Chile, 7–13 December 2015; pp. 1440–1448. [Google Scholar]
- Ren, S.; He, K.; Girshick, R.; Sun, J. Faster R-CNN: Towards real-time object detection with region proposal networks. IEEE Trans. Pattern Anal. Mach. Intell. 2017, 39, 1137–1149. [Google Scholar] [CrossRef] [PubMed]
- Lin, T.Y.; Dollár, P.; Girshick, R.; He, K.; Hariharan, B.; Belongie, S. Feature Pyramid Networks for Object Detection. In Proceedings of the 2017 IEEE Conference on Computer Vision and Pattern Recognition (CVPR), Honolulu, HI, USA, 21–26 July 2017; pp. 936–944. [Google Scholar]
- Zhou, J.; Jiang, P.; Zou, A.; Chen, X.; Hu, W. Ship target detection algorithm based on improved YOLOv5. J. Mar. Sci. Eng. 2021, 9, 908. [Google Scholar] [CrossRef]
- Ma, R.; Bao, K.; Yin, Y. Improved Ship Object Detection in Low-Illumination Environments Using RetinaMFANet. J. Mar. Sci. Eng. 2022, 10, 1996. [Google Scholar] [CrossRef]
- Chen, Z.J.; Chen, D.P.; Zhang, Y.S.; Cheng, X.Z.; Zhang, M.Y.; Wu, C.Z. Deep learning for autonomous ship-oriented small ship detection. Saf. Sci. 2020, 130, 104812. [Google Scholar] [CrossRef]
- Li, Z.L.; Zhao, L.N.; Han, X.; Pan, M.Y. Lightweight Ship Detection Methods Based on YOLOv3 and DenseNet. Math. Probl. Eng. 2020, 2020, 4813183. [Google Scholar] [CrossRef]
- Chen, P.; Li, Y.; Zhou, H.; Liu, B.X.; Liu, P. Detection of Small Ship Objects Using Anchor Boxes Cluster and Feature Pyramid Network Model for SAR Imagery. J. Mar. Sci. Eng. 2020, 8, 112. [Google Scholar] [CrossRef]
- Xiong, B.L.; Sun, Z.Z.; Wang, J.; Leng, X.G.; Ji, K.F. A Lightweight Model for Ship Detection and Recognition in Complex-Scene SAR Images. Remote Sens. 2022, 14, 53. [Google Scholar] [CrossRef]
- Wang, B.; Benli, E.; Motai, Y.; Dong, L.; Xu, W. Robust Detection of Infrared Maritime Targets for Autonomous Navigation. IEEE Trans. Intell. Veh. 2020, 5, 635–648. [Google Scholar] [CrossRef]
- Li, L.; Liu, G.; Li, Z.; Ding, Z.; Qin, T. Infrared ship detection based on time fluctuation feature and space structure feature in sun-glint scene. Infrared Phys. Technol. 2021, 115, 103693. [Google Scholar] [CrossRef]
- Farahnakian, F.; Heikkonen, J. Deep Learning Based Multi-Modal Fusion Architectures for Maritime Vessel Detection. Remote Sens. 2020, 12, 2509. [Google Scholar] [CrossRef]
- Chang, L.A.; Chen, Y.T.; Wang, J.H.; Chang, Y.L. Modified Yolov3 for Ship Detection with Visible and Infrared Images. Electronics 2022, 11, 739. [Google Scholar] [CrossRef]
- Russell, B.C.; Torralba, A.; Murphy, K.P.; Freeman, W.T. LabelMe: A Database and Web-Based Tool for Image Annotation. Int. J. Comput. Vis. 2008, 77, 157–173. [Google Scholar] [CrossRef]
- Wada, K. Labelme. Available online: https://github.com/wkentaro/labelme (accessed on 3 January 2023).
- Everingham, M.; Van Gool, L.; Williams, C.K.I.; Winn, J.; Zisserman, A. The Pascal Visual Object Classes (VOC) Challenge. Int. J. Comput. Vis. 2010, 88, 303–338. [Google Scholar] [CrossRef]
- Kisantal, M.; Wojna, Z.; Murawski, J.; Naruniec, J.; Cho, K. Augmentation for small object detection. arXiv 2019, arXiv:1902.07296. [Google Scholar]
- Bhandari, A.K.; Kumar, A.; Singh, G.K.; Soni, V. Dark satellite image enhancement using knee transfer function and gamma correction based on DWT–SVD. Multidimens. Syst. Signal Process. 2016, 27, 453–476. [Google Scholar] [CrossRef]
- Zhang, B.; Zhang, T.; Cao, Z.; Zhang, K. Fast new small-target detection algorithm based on a modified partial differential equation in infrared clutter. Opt. Eng. 2007, 46, 106401. [Google Scholar] [CrossRef]
- ISO 20473:2007; Optics and Photonics—Spectral Bands. ISO: Geneva, Switzerland, 2007.
- Center for Optics Research and Engineering of Shandong University. Ship Detection Dataset at Open Sea (10–12 km). Available online: http://www.gxzx.sdu.edu.cn/info/1133/2174.htm (accessed on 10 November 2022).
- YOLOv5. Available online: https://github.com/ultralytics/yolov5 (accessed on 10 February 2023).
- Miao, L.; Li, N.; Zhou, M.; Zhou, H.; Wu, F.; Liu, J.; Chen, Y. CBAM-Yolov5: Improved Yolov5 based on attention model for infrared ship detection. In Proceedings of the International Conference on Computer Graphics, Artificial Intelligence, and Data Processing, Harbin, China, 24–26 December 2021. [Google Scholar]
- Howard, A.; Sandler, M.; Chu, G.; Chen, L.-C.; Chen, B.; Tan, M.; Wang, W.; Zhu, Y.; Pang, R.; Vasudevan, V. Searching for MobileNetV3. In Proceedings of the IEEE/CVF International Conference on Computer Vision, Seoul, Republic of Korea, 27 October–2 November 2019; pp. 1314–1324. [Google Scholar]


Disclaimer/Publisher’s Note: The statements, opinions and data contained in all publications are solely those of the individual author(s) and contributor(s) and not of MDPI and/or the editor(s). MDPI and/or the editor(s) disclaim responsibility for any injury to people or property resulting from any ideas, methods, instructions or products referred to in the content. |
© 2023 by the authors. Licensee MDPI, Basel, Switzerland. This article is an open access article distributed under the terms and conditions of the Creative Commons Attribution (CC BY) license (https://creativecommons.org/licenses/by/4.0/).