1. Introduction
The autonomous navigation of unmanned surface vehicles in complex marine environments requires sensing their own state and the dynamic information of the surrounding environment, based on which they can successfully make collision avoidance strategies to ensure the safety of navigation. The acquisition of this dynamic information relies on a variety of sensors; therefore, the study of the accuracy of the information collected by the sensors is beneficial for guaranteeing the safe navigation of unmanned surface vehicles. A single sensor can only provide partially accurate information and thus cannot exclude ambiguity in the description of the external environment [
1,
2]. The complementary characteristics of the discrepancies in the performance of each sensor are the principle ability of multi-sensor data-fusion technology to combine information from different sources [
3], which is widely used in a variety of fields [
4,
5], e.g., anomaly diagnosis [
6,
7], reliability evaluation [
8,
9], target tracking [
10], etc. Data fusion, which extracts key data from each sensor to provide superior estimation and improves the reliability of the system, has attracted the attention of many scholars and has become a national and international research hotspot [
11].
To realize the effective fusion of multi-sensor data, a variety of approaches have been proposed. Among them, the adaptive weighting data fusion method, which can determine the weighting factor by solving the optimal solution based on the principle of minimizing the total mean square error, is a relatively simple data fusion method [
12]. Zhu et al. [
13] proposed a multi-sensor adaptive fusion method based on fuzzy inference and applied it to the visual inertial measurement unit wheel odometry. Setting the same initial conditions for different aero-propulsion system units cannot solve all faults; to overcome this problem, Li et al. [
14] proposed a new shape-constrained neural data-fusion network for the construction of health indicators. To address the problem that the limitation of an unknown distribution of multi-source data leads to the poor stability of simple wavelet neural networks in a multi-source discrete data environment, Yang et al. [
15] proposed a decision-fusion method combining Bayesian inference and wavelet neural networks. Other data fusion methods include genetic algorithms [
16], particle filtering algorithms [
17], the Kalman filtering algorithm [
18,
19], etc. However, these methods are not capable of resolving uncertain information.
Dempster–Shafer (D–S) evidence theory [
20] provides an effective solution to the problem of data fusion uncertainty without prior information, which has led to its widespread study. To overcome the issue that highly contradictory evidence combination results may not be consistent with human intuition, Mi et al. [
21] proposed a method to fuse the ordered weighted average operator and the soft likelihood function. To address the issue that some existing methods cannot effectively take into account the relevant preferences of decision makers and individual belief degree characteristics, Wang et al. [
22] proposed a dynamic multi-sensor data fusion method based on weighted average operator and evidence theory. To deal with the evidence of higher conflict, Xiao [
23] proposed a new measure of reinforcement belief divergence for measuring discrepancies between basic belief assignments. The Dempster combination rule is potentially counter-intuitive in the case of conflicting evidence; to overcome this challenge, Xiao [
24] developed a hybrid multi-sensor data fusion approach by combining an evidence credibility measure and prospect theory. Song et al. [
25] proposed a temporal evidence adaptive fusion method, which determines the amount of evidence sets based on the temporal fusion results of multiple moments and selects an appropriate fusion method to fuse the evidence based on the maximum power pignometric probability distance to evaluate whether the evidence is contradictory or not. Zhao et al. [
26] proposed a new square mean distance measure method to assess the distance between pieces of evidence, which is combined with modified information volume to devise a new method of conflicting information fusion. Zhou et al. [
27] proposed a new information fusion method to address the counterintuitive and poor robustness issues that appear in traditional D-S evidence theory for the fusion of highly conflicting evidence. However, these methods fuse the probabilities of sensors’ collection of target attributes for target recognition and fault diagnosis, and they cannot fuse the measurements of multi-sensors. To realize the fusion of multi-sensor measurements, a new multi-sensor data fusion method [
28] is proposed to convert each measurement into the corresponding evidence according to its accuracy. Wang et al. [
29] extended the method of [
28] to propose a multiple-attribute fusion algorithm combining improved evidence theory and fuzzy clustering, which uses a fuzzy clustering approach to cluster and group measurements and then uses improved evidence theory for fusion. However, this method requires a large amount of data to achieve the fusion accuracy and is not applicable in the case of a small number of sensors. Therefore, to further improve the accuracy of the method of [
28], a modified multi-sensor data fusion method is proposed in this paper. The main contributions of this study are summarized as follows.
- (1)
The affiliation function in fuzzy set theory is introduced as the support function to assign initial pieces of evidence for the multi-sensor data, and the initial evidence is corrected according to the degree of the data bias.
- (2)
A divergence measure is employed to measure the degree of conflict and discrepancy between the evidence to devise the principle for conflict resolution, and each piece of evidence is allocated proportional weights based on the conflict allocation principle.
- (3)
The evidence is synthesized using a more appropriate evidence combination rule to obtain the weights of measurements, and the data are weighted and summed to obtain the multi-sensor data fusion results.
The remainder of the article is organized as follows.
Section 2 provides the preparatory knowledge that needs to be used. A modified multi-sensor data fusion method is proposed in
Section 3. In
Section 4, the proposed method is tested against other data fusion methods using three multi-sensor measurement experiments. The conclusion is given in
Section 5.
3. The Proposed Method
Assuming that there exist
n sensors to measure the target
z, the measurement obtained by the
jth sensor is
. Inspired by the idea of evidence theory, the overall measurements
are treated as the discriminative framework
. The basic belief assignment can be regarded as the weight assignment function for each measurement. Each measurement is converted into evidence based on its accuracy when synthesized for all pieces of evidence [
28].
The proposed method consists of four main parts: the determination of support function, the basic belief assignment for measurements, the rule of evidence combination, and the conflicting measure and weighting combination. The support function is designed to generate initial evidence, which can reflect the degree of support between the data. The basic belief assignment is arranged to correct the initial evidence and assign more reasonable weights to the data. The conflicting measure and weighting combination is to resolve the highly conflicting contradiction between the pieces of evidence, and the rule of evidence combination is used to fuse the measurements.
3.1. Determination of Support Function
Due to environmental noise, human interference and the limitation of the sensor’s own observation accuracy, the measurement of the sensor is the superposition of the true value of the target and disturbances. Obviously, the overall measurements are within the normal deviation and fall within the neighborhood of the true value. Considering the ambiguity of the measurement error of the sensor, the affiliation function is used as a support function for the data and is defined as
where
and
represent the measurements of the
ith and
jth sensors.
If the support
is larger, it indicates that the
jth sensor’s measurement is closer to the true value and that the support of the measurement is higher; otherwise, the support is lower. The support matrix of the
j sensor for target recognition in the discriminative framework
is written as
The support matrix reflects the degree of ambiguity between each datum and the rest, i.e., the degree of support. It is more roughly equivalent to the probability that the measurement is close to the true value and serves as initial evidence to provide initial values for subsequent corrections.
3.2. Basic Belief Assignment for Measurements
In practical applications, the measurement of each sensor is not completely reliable due to the interference from various factors. Abnormal measurement data can reduce the accuracy of data fusion and even lead to incorrect fusion results. To exclude the influence of outliers, the measurement of each sensor needs to be checked for consistency, and the extent to which the measurement of each sensor agrees with the measurements of other sensors is fused into the evidence assignment as the degree of confidence.
To measure the magnitude of the deviation of the different sensor measurements, the distance between measurements
and
is defined as
where
. The mean of the sum of the distances between measurement
and other measurements are denoted as
where
is the mean value that reflects the degree of discrepancy between the sensor
i and the other sensors. If
is larger, it means that the discrepancy between the sensor and the other sensors is larger, indicating a higher probability that the sensor measurement is an outlier; otherwise, there is a lower probability that it is an outlier. The mean distance between all measurements is described as
From the above analysis, the measurement
can be converted into evidence. The idea of basic belief assignment is that the affiliation matrix can be regarded as initial evidence, i.e.,
, and the degree of discrepancy of each measurement is used to correct it. If
is larger than
, the measurement is considered an outlier and is rejected; otherwise, it is considered a valid value. The basic belief assignment formula is given as follows:
where
and
denote any two valid measurements, and
is a threshold that satisfies
.
In practice, a set of correction coefficients
can be generated from (15), and the correction coefficients are used to normalize and weight each piece of evidence, i.e.,
where
represents any one measurement.
3.3. Rule of Evidence Combination
There may be high conflict among the evidence generated by (16), and the original Dempster evidence combination rule is used to deal with the high-conflict evidence that may present the paradox, resulting in unreasonable data combination results. The evidence combination rule based on [
28] can solve the above problems more effectively and is also more suitable for the fusion of measurements, which is given below.
The probabilities of supporting conflicting evidence are assigned to each measurement in a certain proportion, and the combination formula is given as follows:
where
,
m is the mean basic belief assignment of
among all evidence and
b is a conflict factor, which is written as
where
is expressed as
The basic belief assignment
for measurement
in the synthetic evidence is the weights assigned to the measurements. The fusion results can be expressed as
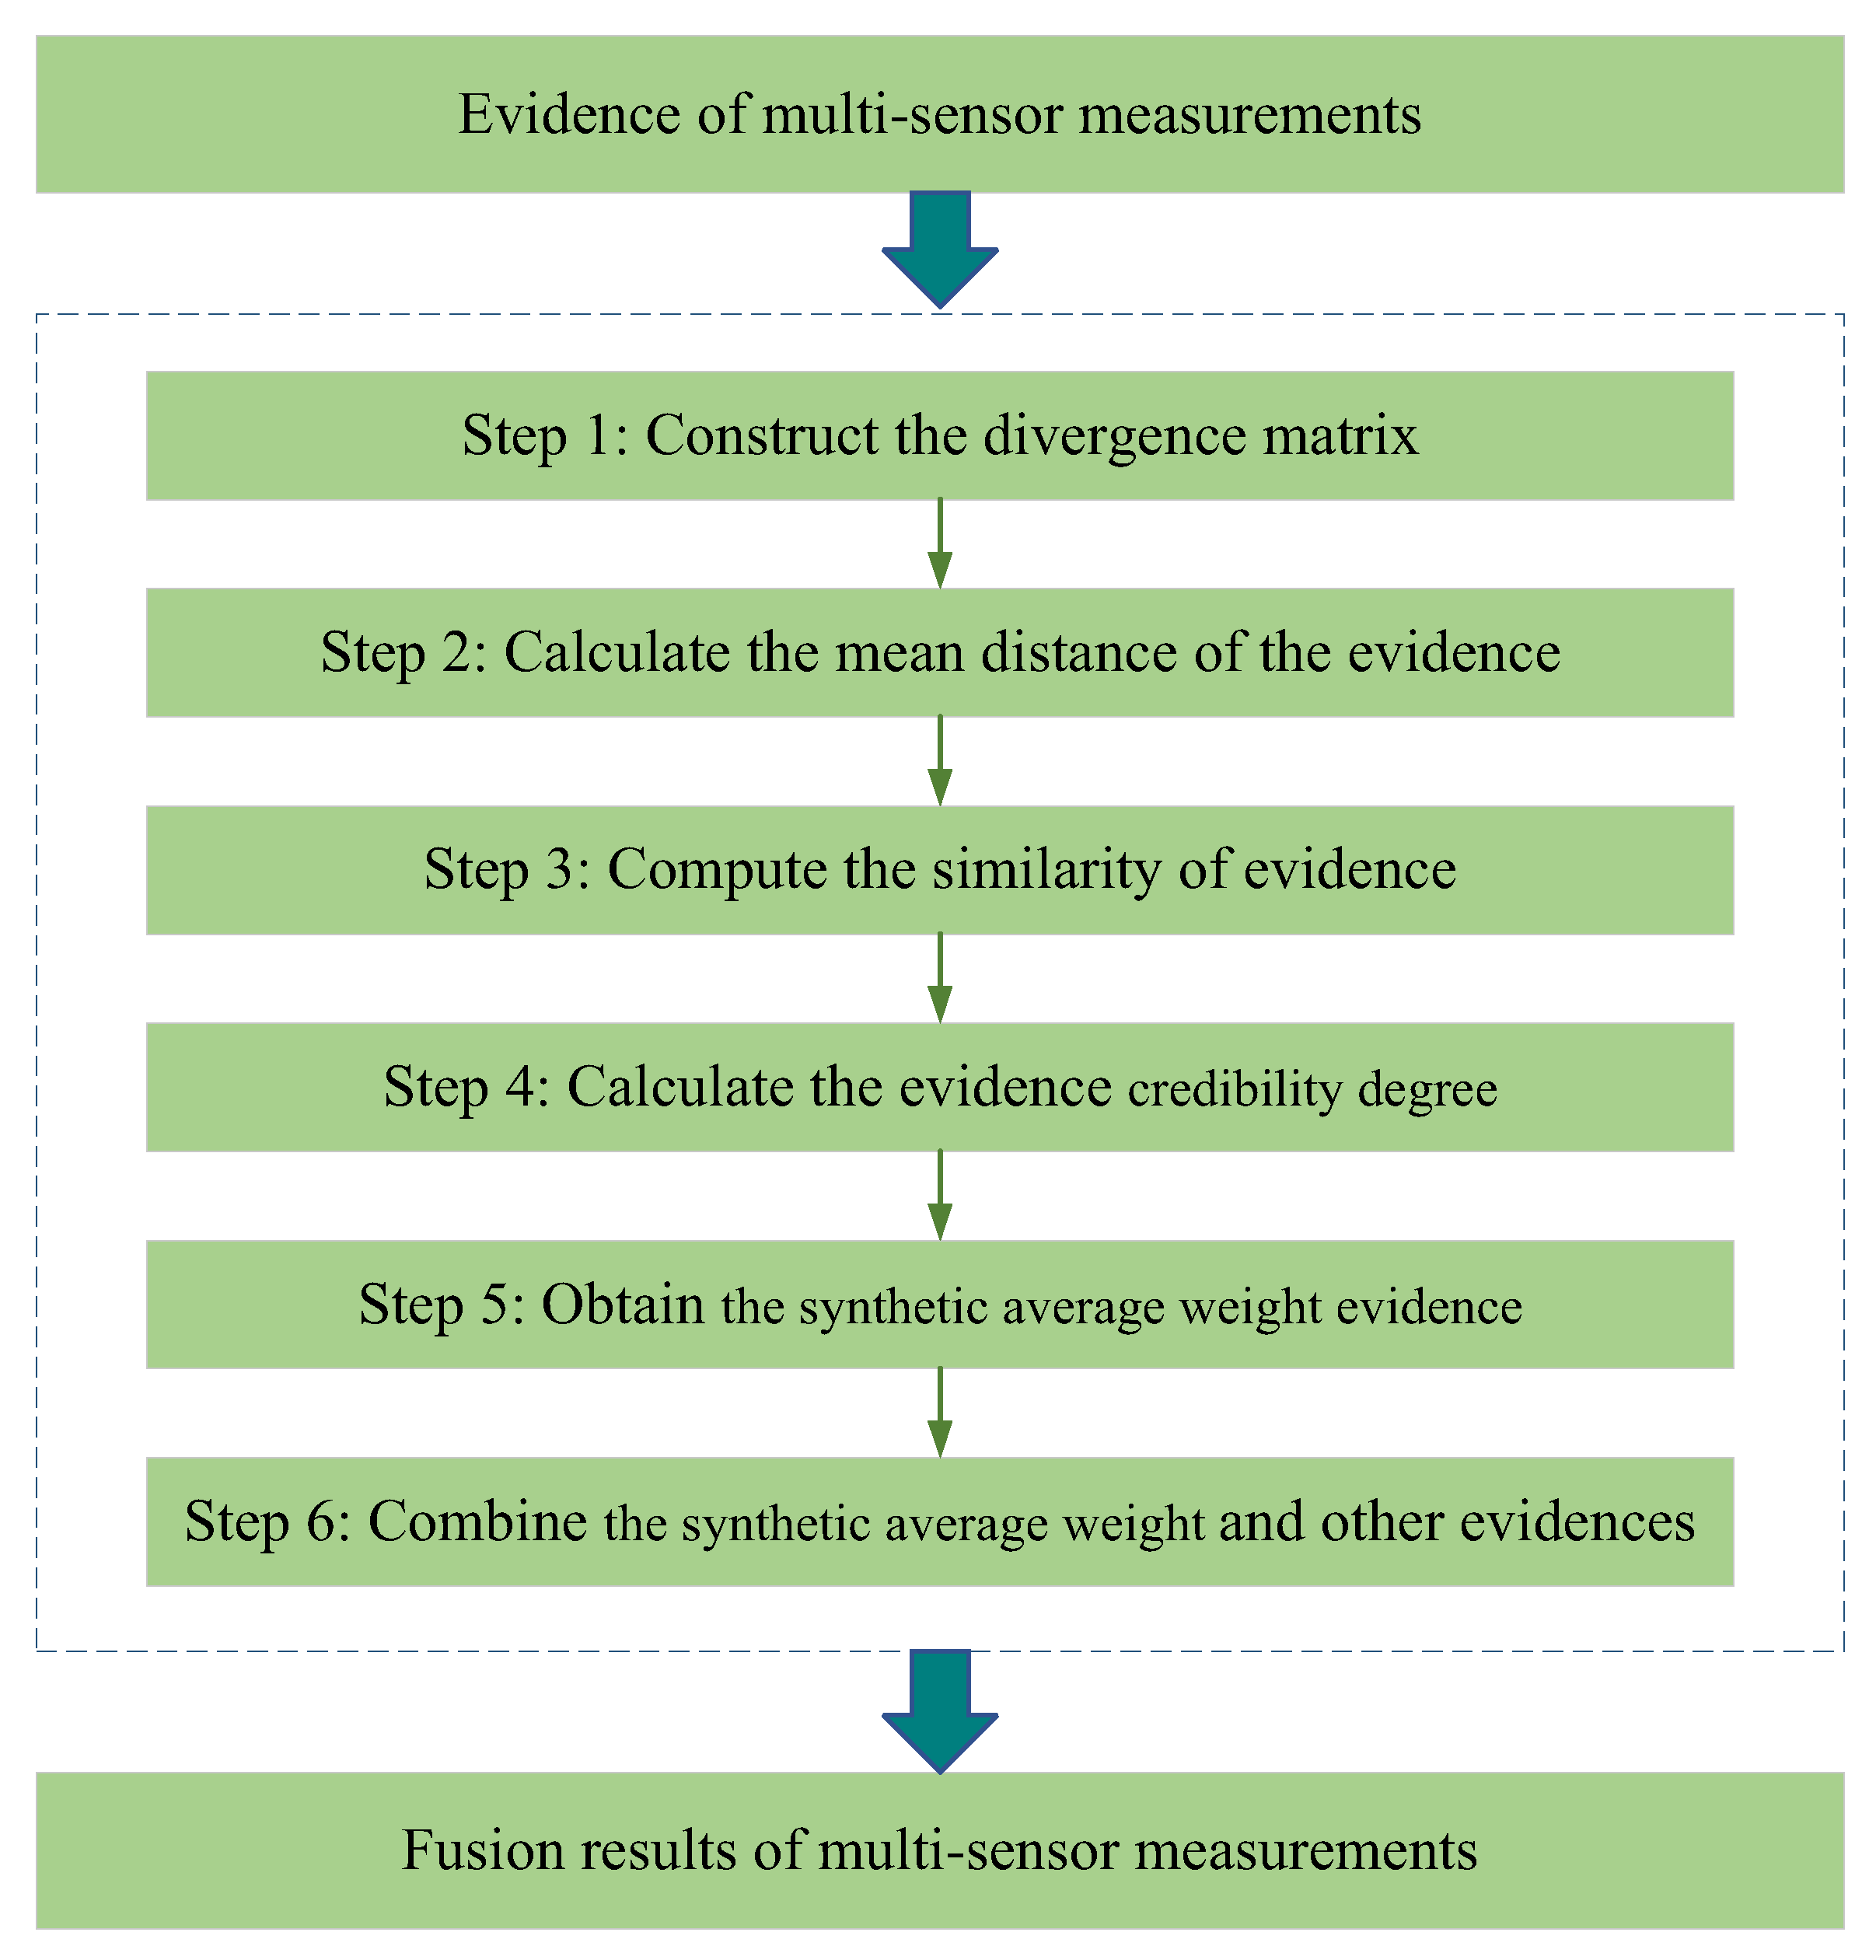
3.4. Conflicting Measure and Weighting Combination
The processes of conflicting measure and weighting combination are also more important as they are the last part of the proposed method. First, they use BJS divergence to measure the conflict and discrepancy between the pieces of evidence to calculate the evidence’s credibility weights. Afterward, the evidence’s credibility weights are converted to evidence for evidence combination. Finally, the evidence is adjusted and combined using the final weights of the evidence [
32]. The flowchart of conflicting measure and weighting combination is illustrated in
Figure 1, whose pseudocode is shown in Algorithm 1.
| Algorithm 1 Conflicting measure and weighting combination. |
| Inputs: , , , |
| for |
| for |
| 1: |
| end for |
| end for |
| 2: |
| 3: |
| 4: |
| 5: |
| 6: |
| 7: |
| 8: |
| 9: |
| Outputs: |
Step 1: The BJS divergence is used to calculate the distance measure of two random
and
. The divergence matrix
is written as
Step 2: The mean evidence distance
across the evidence
is defined as
Step 3: The similarity of the evidence
is described as
Step 4: The credibility degree of the evidence
obtained from the similarity normalization is given by
Step 5: According to the weight
of the evidence, the synthetic average weight evidence is written as
Step 6: The weight evidence, viewed as ordinary evidence, is fused with other pieces of evidence based on the rule of evidence fusion.
4. Experiments
Since the proposed method is universal, the fusion performance of experimental data from other aspects can also reflect the multi-sensor information fusion performance of unmanned surface vehicles. The feasibility and effectiveness of the proposed method and its superiority over other fusion methods were verified by testing all fusion algorithms on the measurement data of two multi-sensor experiments provided by [
28] and the measurement data of one multi-sensor experiment provided by [
40].
4.1. Experiment 1
The nondestructive measurement for the metallization layer thickness of the vacuum electronic device requires that several measurements be averaged to obtain more accurate results, which will consume a significant amount of time and resources. Therefore, eight data are sampled from fifty iterations of sample thickness measurement data collected by the multi-sensors as experimental data for data fusion, and the average value of 65.57
m from the fifty tests is used as the reference accuracy; the sampling data are shown in
Table 1.
According to (11), the initial evidence generated by the support matrix for each measurement of the multi-sensors are
From (13) and (14), the elements consisting of are calculated as , , , , , , , .
The average distance between all measurements is . The correction factors obtained from (15) are calculated as , , , , , , , .
The corrected pieces of evidence are shown in
Table 2. As can be seen from
Table 2, one piece of evidence can be assigned to each measurement of the multi-sensors according to the improved basic belief assignment method, and the probabilities of each piece of evidence corresponding to outliers are assigned to zero, which can exclude the interference of outliers to the data fusion. The divergence matrix
is constructed as follows:
The mean evidence distance across the pieces of evidence can be calculated as , , , , , , , .
The similarity of the evidence is computed as , , , , , , , .
The evidence’s credibility degree can be obtained as , , , , , , , .
The synthetic average weight evidence is calculated as , , , , , , , .
The synthesized evidence is derived as , , , , , , , .
The fusion result obtained from (20) is
, and the data fusion results of the proposed method and other comparative methods are displayed in
Table 3. It can be seen from
Table 3 that the fusion result of the proposed method has higher accuracy compared to other comparative methods. Although the improvement in accuracy of the proposed method is not so obvious, the fusion result of the proposed method is close to the reference true value, which is already considered a more effective performance improvement effect. There are two reasons why the proposed method is capable of achieving approximate equivalence to the true value. One is because the support relationship of the measurements and the mutual evaluation of the sensors can effectively identify anomalous measurements. The second is due to the use of the Belief Jensen-Shannon divergence to measure the credibility of the evidence, which increases the weights of reliable pieces of evidence and decreases the weights of unreliable evidence, thus mitigating its negative impact on the final fusion result.
4.2. Experiment 2
The performance of the proposed method continues to be tested using the measurements of a characteristic parameter as an example.
Table 4 shows the measurements of 10 sensors with variance obtained from historical data and the true value set to 1.
The initial evidence generated by the support matrix for each measurement of the multi-sensors are given by
The elements consisting of are calculated as , , , , , , , , , .
The average distance between all measurements is . The correction factors obtained from (15) are constructed as follows: , , , , , , , , , .
The corrected evidences are shown in
Table 5. It can be seen from
Table 5 that multiple outliers in the measurements are given a weighting of 0, indicating that the proposed method is capable of eliminating the effects of anomalous data, despite the presence of multiple outliers. The divergence matrix is constructed as follows:
The mean evidence distance across the pieces of evidence can be calculated as , , , , , , , , , .
The similarity of the pieces of evidence is computed as , , , , , , , , , .
The evidence’s credibility degree can be obtained as , , , , , , , , , .
The synthetic average weight evidence is calculated as , , , , , , , , , .
The synthesized evidence is derived as , , , , , , , , , .
The fusion result obtained from (20) is 0.9997, and the data fusion result of the proposed method and other methods are displayed in
Table 6. It can be seen from
Table 6 that the fusion result of the proposed method has higher accuracy compared to other methods, which indicates that the proposed method also performs well in additional experiments and is universal, further validating the effectiveness of the proposed method. The proposed method obtains a high fusion accuracy by fusing less data, which is capable of achieving and engineering acceptable measurement accuracy.
4.3. Experiment 3
To further verify the performance of the proposed method, the measurements of the thermostat temperature are tested as an example. The assumed true temperature is 50.50
. Any eight data from the thirty data are selected as test data and are shown in
Table 7.
The initial evidence generated by the support matrix for each measurement of the multi-sensors are
From (13) and (14), the elements consisting of are calculated as , , , , , , , .
The average distance between all measurements is . The correction factors obtained from (15) are calculated as , , , , , , , .
The corrected pieces of evidence are shown in
Table 8. As can be seen from
Table 8, the proposed method can similarly exclude outliers by assigning evidence to the measurements. The divergence matrix
is constructed as follows
The mean evidence distance across the pieces of evidence can be calculated as , , , , , , , .
The similarity of the evidence is computed as , , , , , , , .
The evidence’s credibility degree can be obtained as , , , , , , , .
The synthetic average weight evidence is calculated as , , , , , , , .
The synthesized evidence is derived as , , , , , , , .
The fusion result obtained from (20) is
, the data fusion results of the proposed method and other fusion methods are displayed in
Table 9. It can be observed from
Table 9 that the fusion result of the proposed method has higher accuracy compared to other fusion methods. The fusion accuracy of the proposed method is not significantly improved compared to other fusion methods, which is due to the fact that the fusion result of the proposed method is closer to the true value, and the discrepancy between the measurements is not significant. However, the universality and superiority of the proposed method over other fusion methods are further verified by this experiment.


