Article

Numerical Simulation of the Beach Response Mechanism under Typhoon Lekima: A Case Study of the Southern Beach of Chudao

1
School of Hydraulic Engineering, Ludong University of China, Yantai 264025, China
2
Institute of Coastal Research, Ludong University of China, Yantai 264025, China
3
Centre for Ports and Maritime Safety, Dalian Maritime University of China, Dalian 116081, China
*
Author to whom correspondence should be addressed.
J. Mar. Sci. Eng. 2023, 11(6), 1156; https://doi.org/10.3390/jmse11061156
Submission received: 2 May 2023 / Revised: 21 May 2023 / Accepted: 30 May 2023 / Published: 31 May 2023
(This article belongs to the Section Marine Hazards)

Abstract

:
Typhoons play an important role in beach evolution. The storm surge and large waves caused by typhoons can cause significant changes in beach morphology in a short period of time. The mechanism of beach evolution and profile changes during typhoons is significantly different from that under non-typhoon dynamic conditions. The XBeach numerical model provides an effective tool for predicting the response of sandy coasts to typhoons. This study is based on field-collected long-term beach profile elevations and grain size data, which were used to establish a two-dimensional XBeach model for simulating the morphological evolution of Cudao Island Beach under Typhoon Lekima. The GSA (Generalized Sensitivity Analysis) method was used to determine the sensitivity order of several important parameters in this modeling. Four different moments of wave height variation were selected during the typhoon process to analyze and study beach evolution. The results show that Chudao South Beach is always in a state of erosion during the typhoon period. The wave water increase is apparent in the nearshore wave-breaking area. The beach shoulder in the northeastern part of the beach is short, and the profile, with a short length, responds quickly to the typhoon. The eroded sediment is mainly deposited in the lower part of the intertidal zone or even transported outside of the wave-breaking zone, and a small part is transported to the shore and deposited in the high-tide zone. The continuous sediment transport along the coast of Chudao Beach is an important factor that influenced the evolution of each profile during Typhoon Lekima.

1. Introduction

The beach is an important place for human interaction with the ocean and a sensitive zone for interaction between land and sea; the shore is constantly adjusting its dynamic balance under the influence of marine environmental dynamics. Affected by global warming, sea levels are gradually rising, and the frequency of typhoons is increasing. The response of beaches to storm surges has attracted the attention of many researchers, who have conducted research on aspects such as beach location and profile morphology changes. Model tests show that nonlinear wave near-bottom oscillatory flow acts on the bed, causing net onshore sediment transport, which is the main force driving the transformation of shore profiles from storm profiles to shoulder profiles [1,2]. In coastal evolution processes, low-frequency waves dominate coastal profile changes, especially dune erosion and submersion in extreme storm environments [3]. The increase in the dune erosion rate under extreme water level and wave conditions has been attributed by researchers to the fact that directional sediment transport offshore can only be partially offset by the simultaneous increase in the onshore transport capacity with respect to waves [4]. The decrease in the amplitude of nearshore turbulent oscillatory motion is related to the decrease in water depth caused by sediment deposition, and the suspended sediment concentration depends on the position of the sandbar [5]. Studies have shown that the number and intensity of storms are dominant factors in beach responses to storm surges [6], and shoreline orientation and storm paths can also affect wave incidence angles and thus beach responses [7,8]. The size of the wave period and the change in the wave spectrum shape also affect the amount of dune erosion [9]. In addition to being influenced by dynamics, the beach type [10], beach morphology [11], beach sediment [12], and geological conditions [13] can also cause differences in beach response to storms.
With the continuous development of research methods for beach dynamic geomorphological processes, many new beach geomorphological monitoring technologies have been applied to study the phenomena of beach dynamic geomorphological processes, including the use of RTK GPS, LiDAR, and UAV technology [14] to monitor beaches. In recent years, video image monitoring systems (such as Argus) have also been widely used to evaluate beach nourishment and conduct beach dynamic geomorphology research [15,16], and image monitoring has outstanding advantages in cases when storms and other extreme conditions occur.
Hydrological and sediment data, such as information on nearshore waves and tides, that help us to understand the mechanism of beach geomorphological changes are difficult to observe under extreme weather conditions and have high costs, which hinder research. At present, computer science methods known as artificial intelligence have been implemented to predict sea level measurements [17], reservoir water supply [18], etc., but some studies have found that the lack of certain data has a greater impact on the final prediction results, and the calculation methods still need to be optimized [19]. With the rapid development of computer technology, numerical simulation technology has become more advanced. Among these technologies, Delft3D is one of the most advanced hydrodynamic models in the world, capable of simulating two-dimensional and three-dimensional water flow, waves, water quality, ecology, sediment transport, and bed morphology, as well as the interactions between various processes. The Delft3D model can simulate morphodynamic evolution, and researchers have found that it can validate profile evolution when simulating beach sediment transport [20,21], but it is not ideal for simulating nearshore sandbars [22]. Although the Delft3D model has been widely used by scholars for storm surge and sediment transport simulation, it still has shortcomings in simulating beach overwash and dune erosion [23]. The DUROSTA model, developed by the Dutch Delft Water Research Center, can be used to calculate the evolution of dune profiles under storm conditions and is more suitable for initial beach topography with steeper slopes, but this model does not consider longshore sediment transport and is only suitable for more uniform longshore situations [24]. XBeach is a nearshore beach dynamic geomorphological numerical model which has the advantage of being able to calculate nearshore sediment circulation and morphological evolution, including dune erosion, deposition, and overwash processes, taking into account sediment transport along the coast, and it is applicable to various types of beach topography. It has been widely applied to simulate the natural coastal responses of beaches under storms and typhoons [25,26,27] and also provides a direction for predicting beach bed evolution under storms and on seasonal time scales [28]. Some researchers have used the one-dimensional XBeach model to explore the impacts of storm clusters on beaches and found that in the case of beaches affected by storms, the resilience of beach systems may be reduced on the basis of previous storms, making the beaches more susceptible to erosion [29]. The XBeach model has also been expanded to study the impacts of flexible vegetation on wave attenuation [30], ship wave forecasting in waterways [31], etc. Recent research has shown that the specific parameterization of the XBeach model structure can match the specific bottom boundary conditions used and can effectively predict storm-induced morphological changes under strict model calibration [32]. However, most XBeach model studies have been conducted in conjunction with laboratory flume experiments, and the simulated dimensions are mostly one-dimensional. There is limited research on the use of field measurements to establish two-dimensional XBeach models for simulating changes in nearshore beaches and hydrodynamics between typhoons. Some limitations may affect the simulation of the XBeach model due to certain conditions, such as the inadequate capture of complex offshore morphologies, simplification of the model’s representation of physical processes, or deviations in the effectiveness and accuracy of observational data, resulting in varying sensitivity to parameter changes induced by storm impacts in the XBeach model. Therefore, obtaining reliable estimates of parameter sensitivity in specific regions or hydraulic boundary conditions and tuning these parameters are prerequisites for achieving better simulation results.
This study established a two-dimensional XBeach model and employed a GSA (Generalized Sensitivity Analysis) method to sequentially rank the sensitivity of several key parameters and determine their feasible ranges. Based on this, the morphological response of Chudao South Beach to Typhoon Lekima was simulated and compared with the post-typhoon measured profile topography. The process of nearshore hydrodynamic and beach topography changes is discussed.

2. Materials and Methods

2.1. Study Area and Data

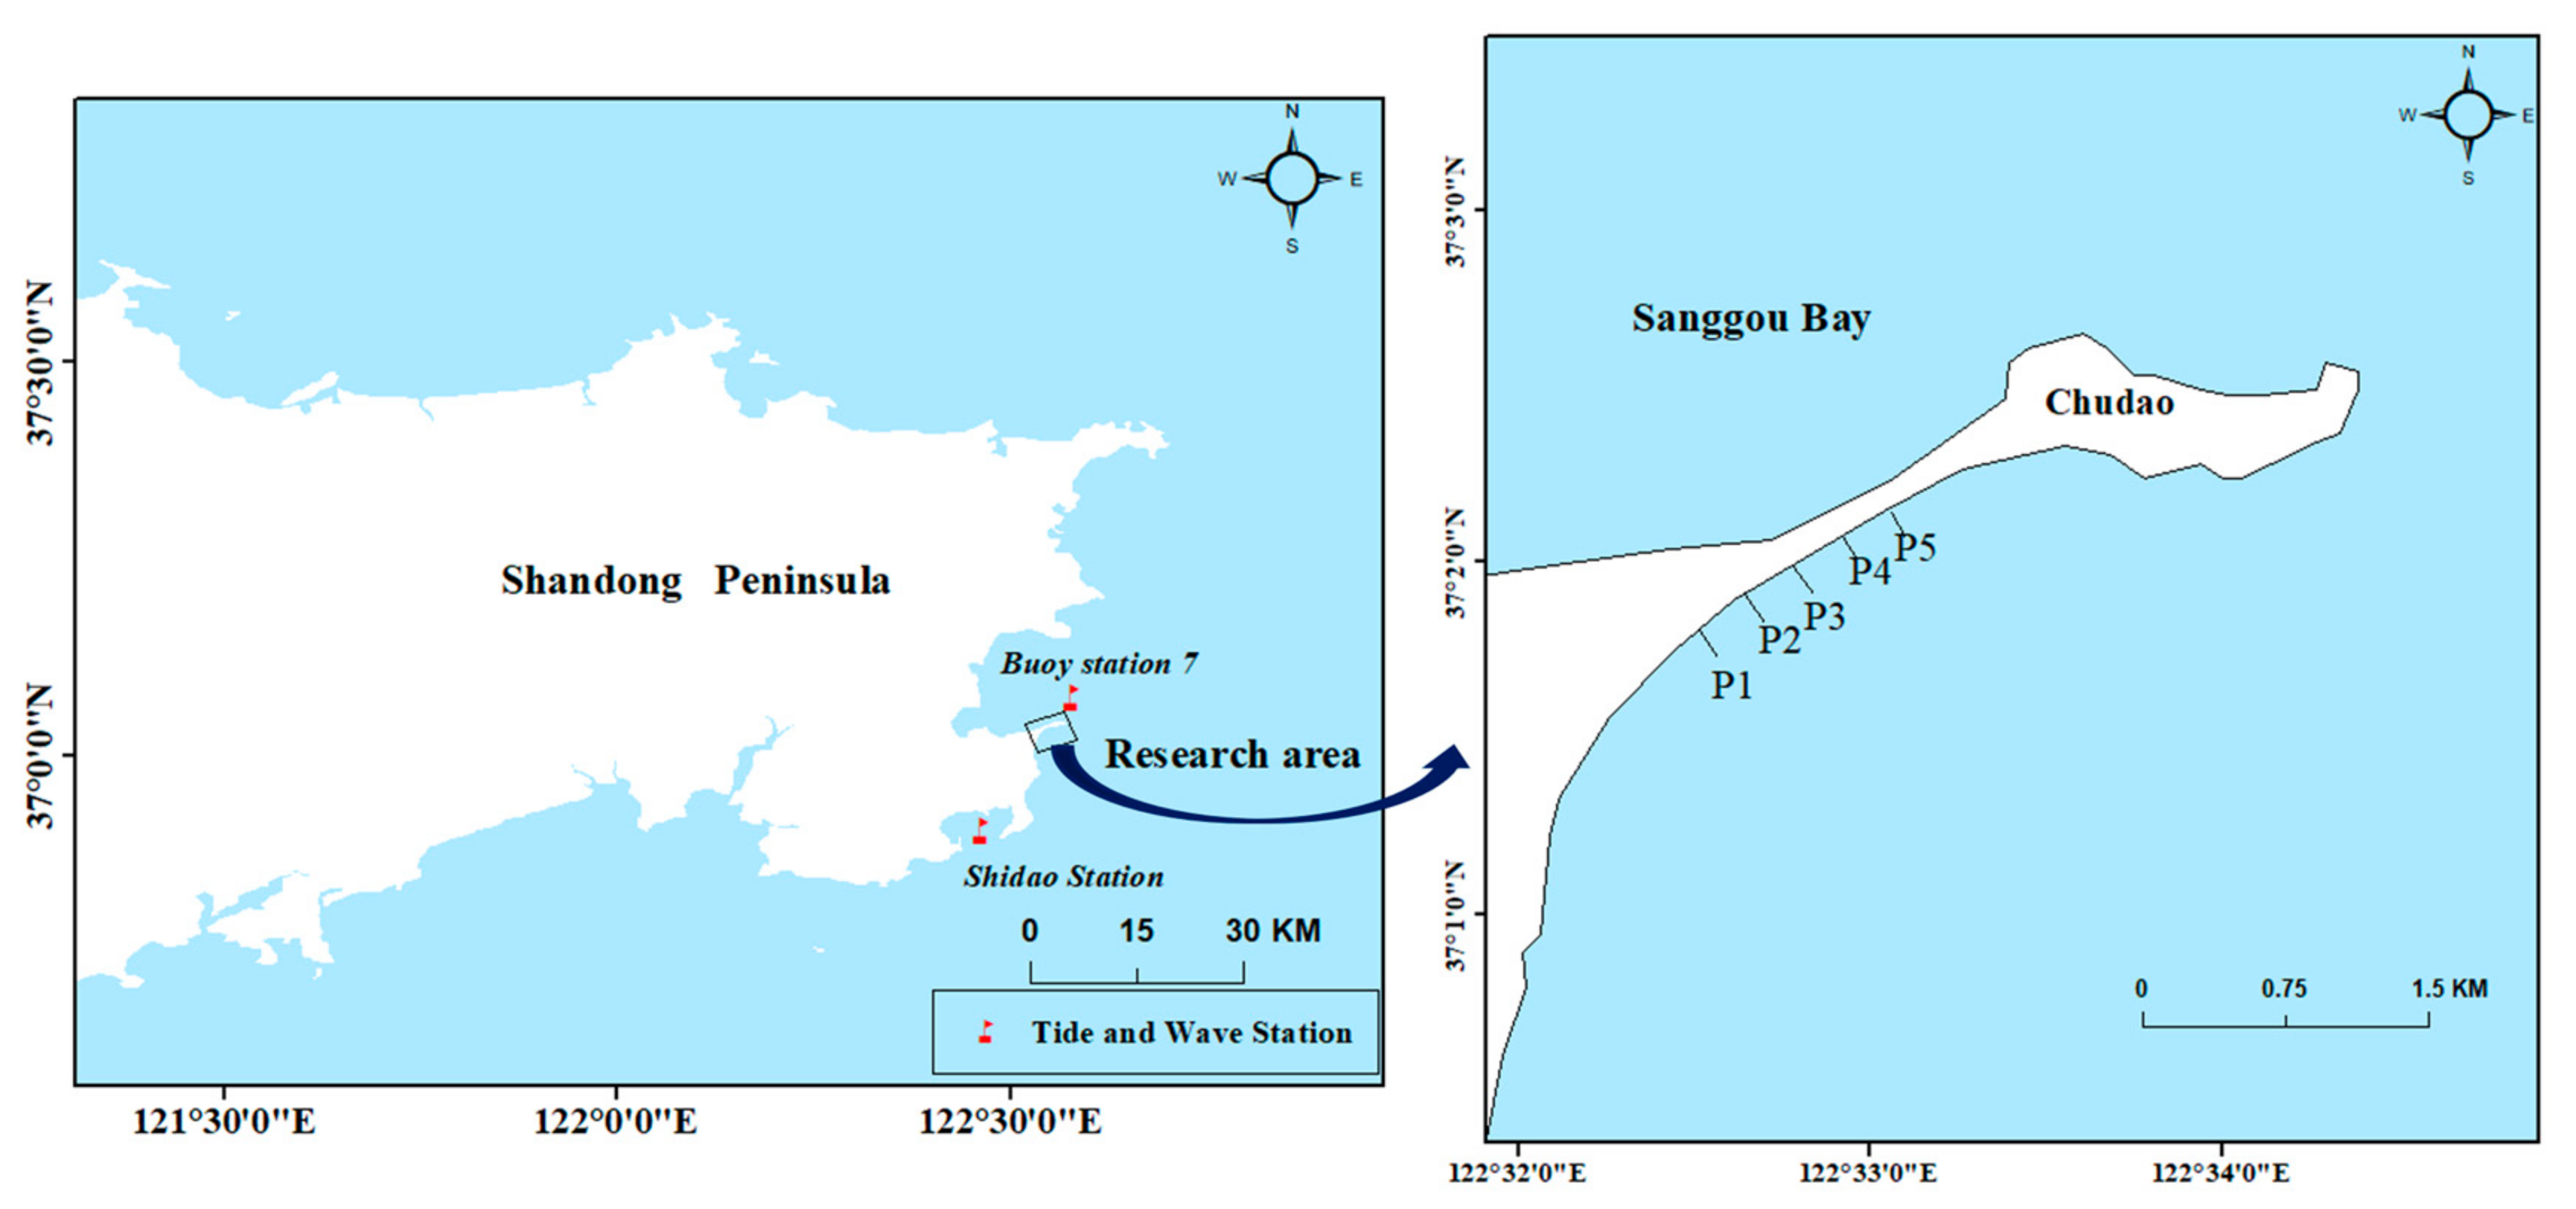
Chudao is located in the southeast of Rongcheng City, Shandong Province, China, with an area of approximately 0.75 km2 (Figure 1). The sediment is mainly composed of fine sand and forms a natural sandy coast. The dune top elevation of the westernmost profile of Chudao South Beach is 3.6 m, and the dune top elevation of the easternmost profile is 2.4 m (based on the national 85 elevation), gradually decreasing from southwest to northeast. The sediment is composed of gravel, medium sand, and fine sand, with a generally soft texture.
The study area has to a temperate monsoon climate with prevailing wind directions of N–NW and average wind speeds of 6.4–6.6 m/s. The annual precipitation distribution is uneven, with summer precipitation accounting for approximately 80% of the total annual precipitation. The sea area in which Chudao is located is mainly dominated by wind waves and is basically unaffected by swells. The main wave directions are SW and SEE, with an annual average effective wave height of 0.41 m, an annual maximum effective wave height of 1.47 m, an annual maximum wave height of 3.6 m, and an annual average period of 5.02 s. The tide is mainly an irregular semidiurnal tide with clear diurnal inequality.
Typhoon Lekima formed in the Pacific on 4 August 2019, and was the strongest typhoon to impact China in that year. It intensified into a super typhoon at 23:00 on August 7. It landed on the coast of Taizhou, Zhejiang, at 01:45 on August 10 and landed again in Qingdao, Shandong, at 20:00 on August 11, entering the scope of Chudao and progressing until it ceased. The central minimum pressure of Lekima was 925 hPa, and the maximum wind speed was 54 m/s [33]. The typhoon’s path is shown in Figure 1.
In order to study the morphological response of Chudao South Beach under the influence of Typhoon Lekima, the elevations of ten profiles from the southwest to northeast were measured on 27 July and 13 August 2019, respectively, and the elevations of six of these profiles were measured before the typhoon on August 10. The profile topography was observed using an altimeter (Beidou Haida TS7 RTK) at low tide. Fixed piles were driven into the hardened roadside, and point placement was performed before each measurement to ensure that the fixed profile was measured. Starting from the fixed pile on the shore, the instrument was handheld and measured at the lowest tide level. The distance between measurement points was set to 2 m, and the measurement distance was shortened in the erosion area to 50 cm.
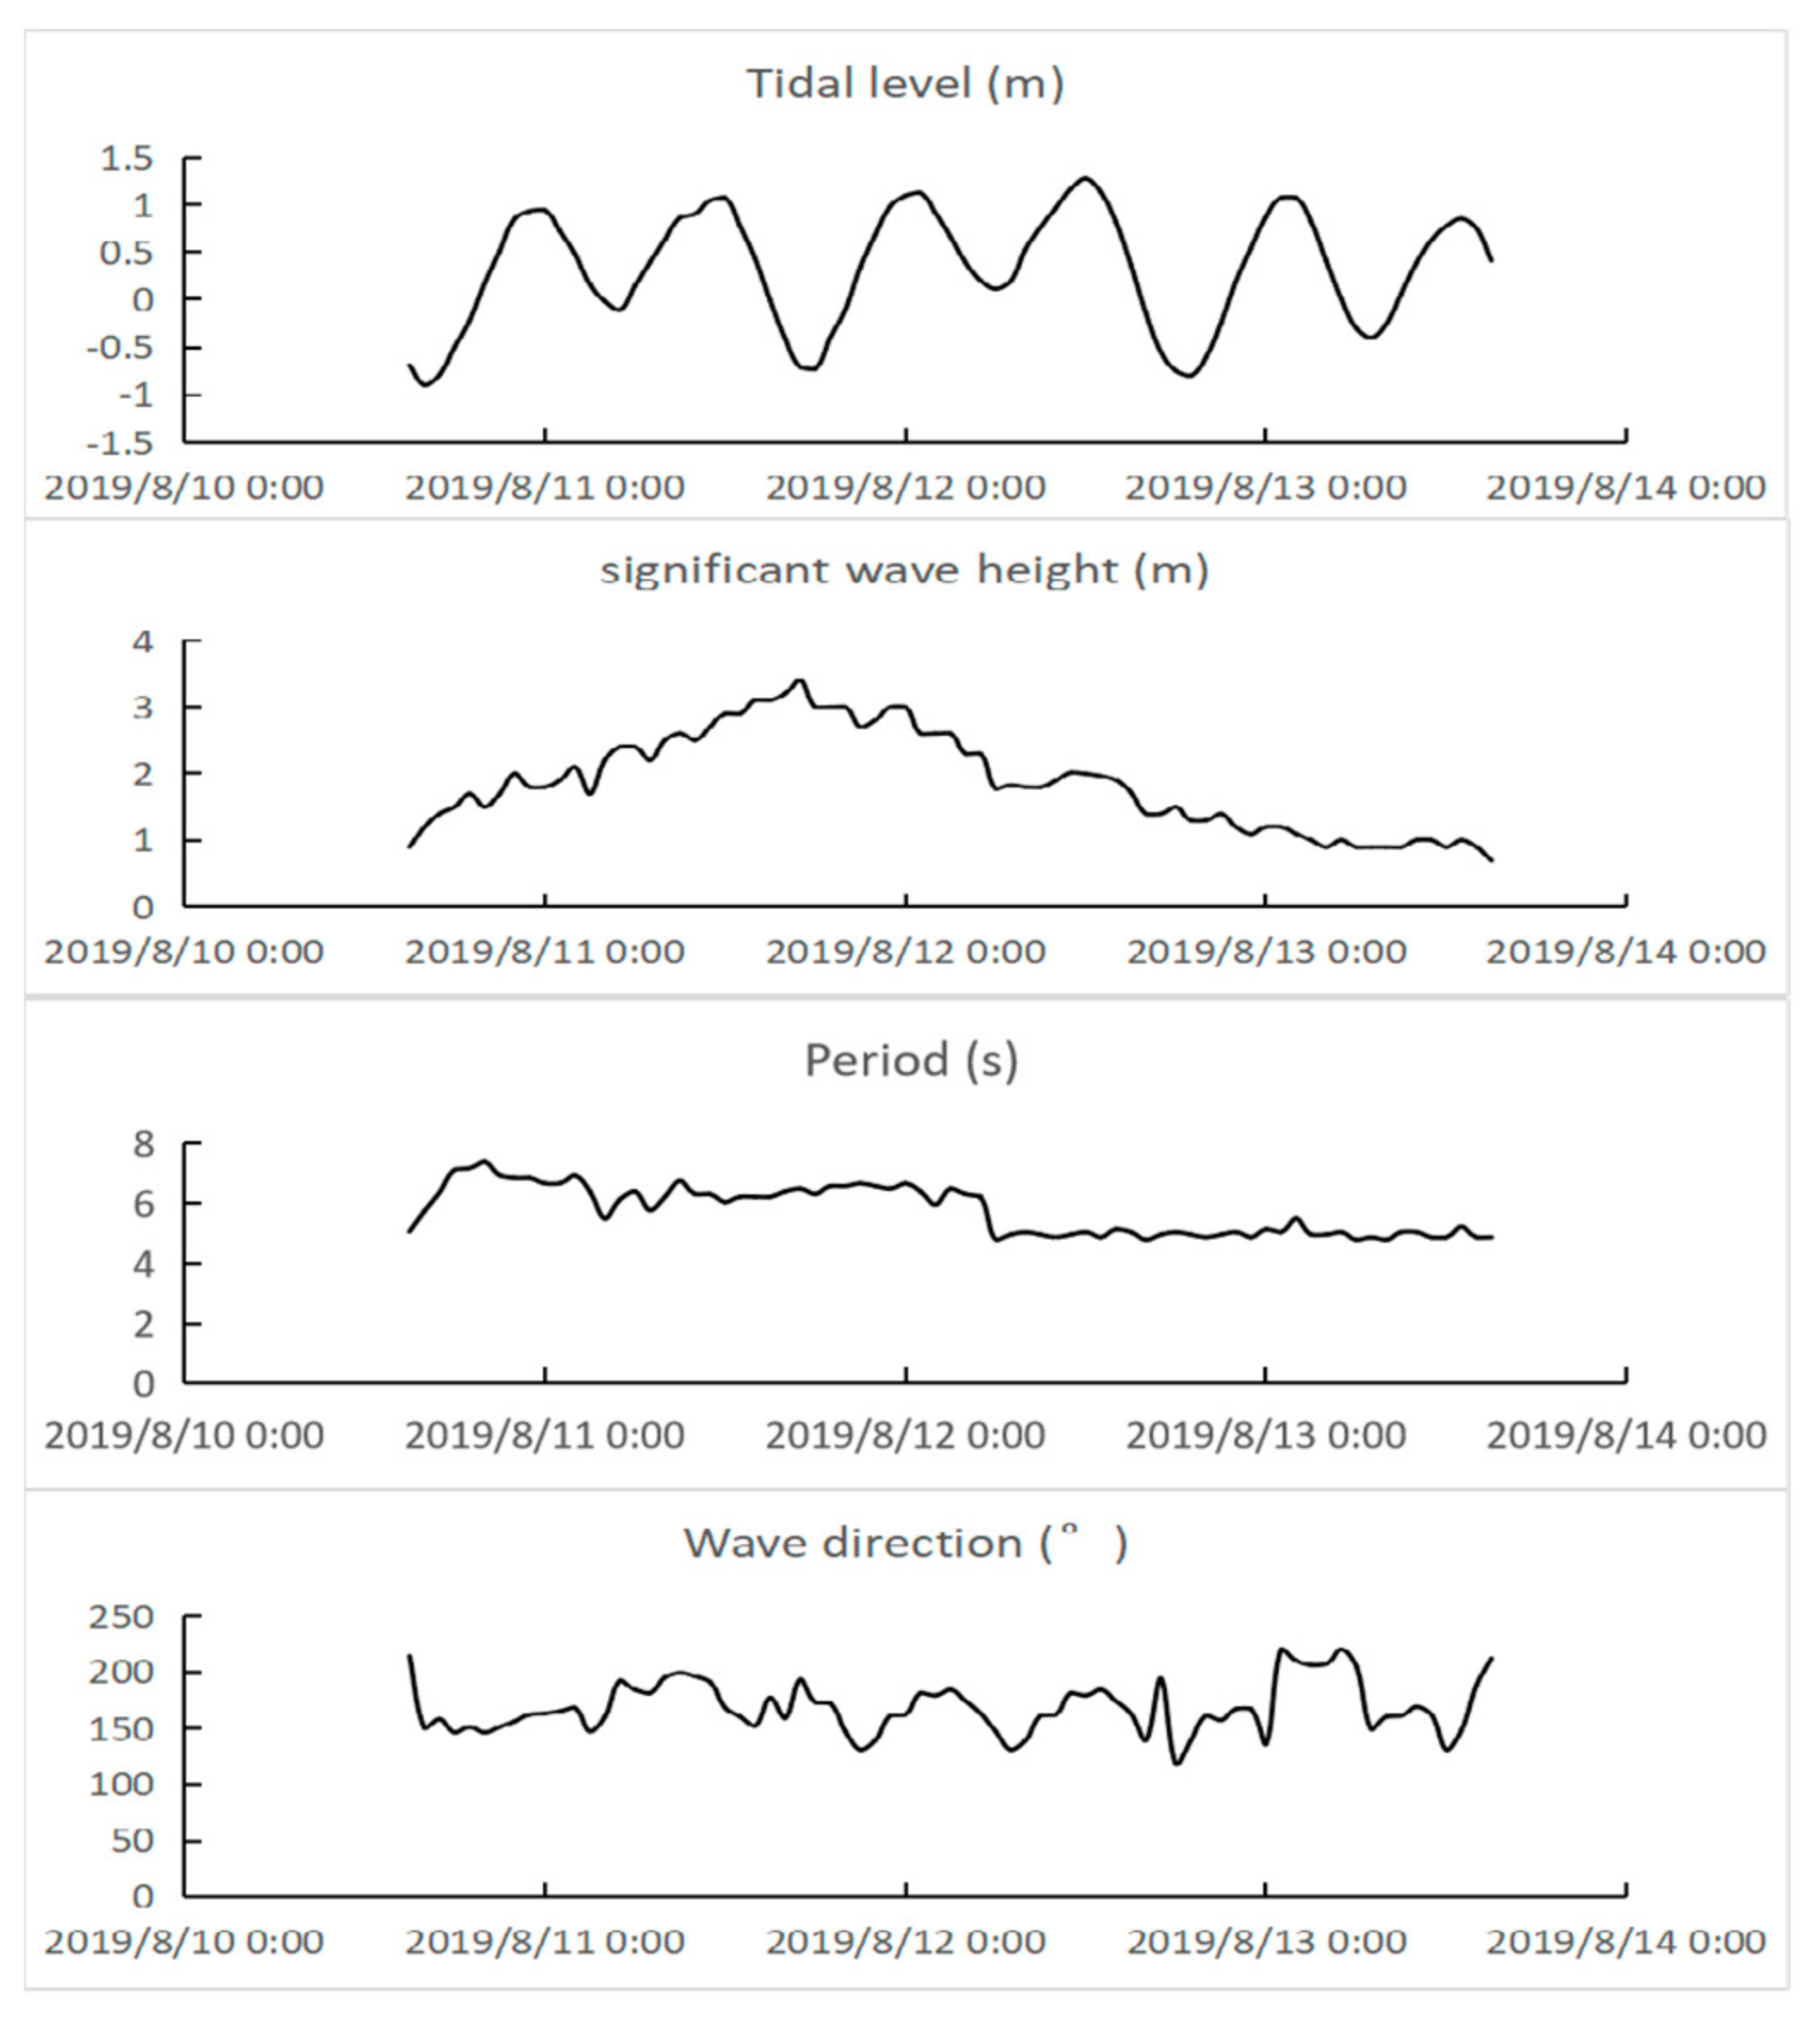
During Typhoon Lekima, Chudao was in neap tide with a small tidal range, and each profile was measured to an underwater depth of approximately 1 m. There are differences in the morphology of each profile of Chudao South Beach. The beach profile in the northwest has a higher beach top elevation and a long shoulder with a gentle slope. The beach top elevation gradually decreases from northwest to southwest. In order to reduce model boundary effects, this paper compares and analyzes five profiles, P1–P5, in the middle that can be used to summarize all the profile characteristics. There are tidal and wave observation stations near Chudao Beach; thus, we collected data on wave processes from the Huanghai No. 7 buoy station (122.5802° E 37.0625° N) and data on tidal processes from the Shidao Ocean Observation Station (122.4148° E 36.8720° N) during this typhoon as hydrodynamic boundary conditions for the XBeach model (Figure 2 and Figure 3). The range of free surface gravity wave fluctuations measured by buoy No. 7’s directional wave rider was −20 to +20 m, with a fluctuation resolution of 1 cm and a wave period range of 1.6 to 30 s. The cross-sensitivity of the waves was less than 3%. The data-recording frequency was 1.28 Hz, and the buoy output frequency was 1 h. Tidal measurements were performed using SCA11-3 self-recording water level meters that could continuously record changes in sea level rise and fall and automatically transmit data in real time to the data reception center in the office area via a CDMA wireless network system.

2.2. Numerical Model Method

2.2.1. Overview of the XBeach Model

In this paper, XBeach is used to establish a detailed morphodynamic model in order to simulate the morphological evolution of Chudao Beach during Typhoon Lekima. The XBeach model includes dynamic processes such as short-wave transformation (refraction, shoaling, and breaking), long-wave transformation (generation, propagation, and dissipation), wave setup, wave-induced currents, and non-viscous sediment transport. Its wave group analysis (“Surfbeat”) mode has been widely used in nearshore dynamic geomorphological modeling and has been validated to reproduce storm response morphological patterns under various hydrodynamic and geometric conditions [34,35]. The control equations use the incompressible N-S equations in Cartesian coordinates [36], and the shallow water equations use the Generalized Lagrangian Mean (GLM) formula to convert wave-induced currents and backflows [37]. The sediment motion model uses a depth-averaged convection–diffusion equation [38]:
h C t + h Cu E x + h Cv E y + x D h h C x + y D h h C y = h C eq h C T s
where C is the depth-averaged sediment concentration, D h is the sediment diffusion coefficient, and T s is the adaptation time used to represent the amount of sediment carried, which can be approximated according to the water depth h and sediment settling velocity:
T s = max ( 0.05 h w s , 0.2 ) s
Here, h is the water depth, and w s is the sediment settling velocity. The equilibrium sediment concentration distinguishes C eq between bedload and suspended load concentrations, and the sum of the minimum values of the bedload C eq , b and suspended load concentrations C eq , s is compared with the maximum allowable concentration C max to determine C eq , as shown in the following formula:
C eq = max min C eq , b , 1 2 C max + min C eq , s , 1 2 C max , 0
The calculation formulas for the bedload C eq , b and suspended C eq , s load concentrations are as follows:
C eq , b = A sb h v mg 2 + 0.018 u rms , 2 2 C d U cr 2.4
C eq , s = A ss h v mg 2 + 0.018 u rms , 2 2 C d U cr 2.4
where A sb and A ss are the bedload and suspended load coefficients, v mg is the Eulerian velocity value, u rms , 2 is the orbital velocity considering short-wave-breaking-induced turbulence, C d is the sediment drag coefficient, and U cr is the critical velocity defining the start of sediment motion. The XBeach model uses a wave energy balance equation to solve the wave field, taking into account wave refraction, shallow water deformation, flow effects on waves, and energy dissipation caused by wave group breaking [39]. The wave energy balance equation is expressed as follows:
A t + c x A x + c y A y + c θ A θ = D w σ
where c denotes the wave energy propagation velocities in each direction, D w is the energy dissipation caused by wave group breaking, σ is the intrinsic frequency of the waves, θ is the angle between the incident waves and x-axis, and A is the directional distribution function of wave energy density, represented as:
A ( x , y , t , θ ) = S w ( x , y , t , θ ) σ ( x , y , t )
where S w is the directional distribution function of wave energy density.

2.2.2. Model Grid Setup

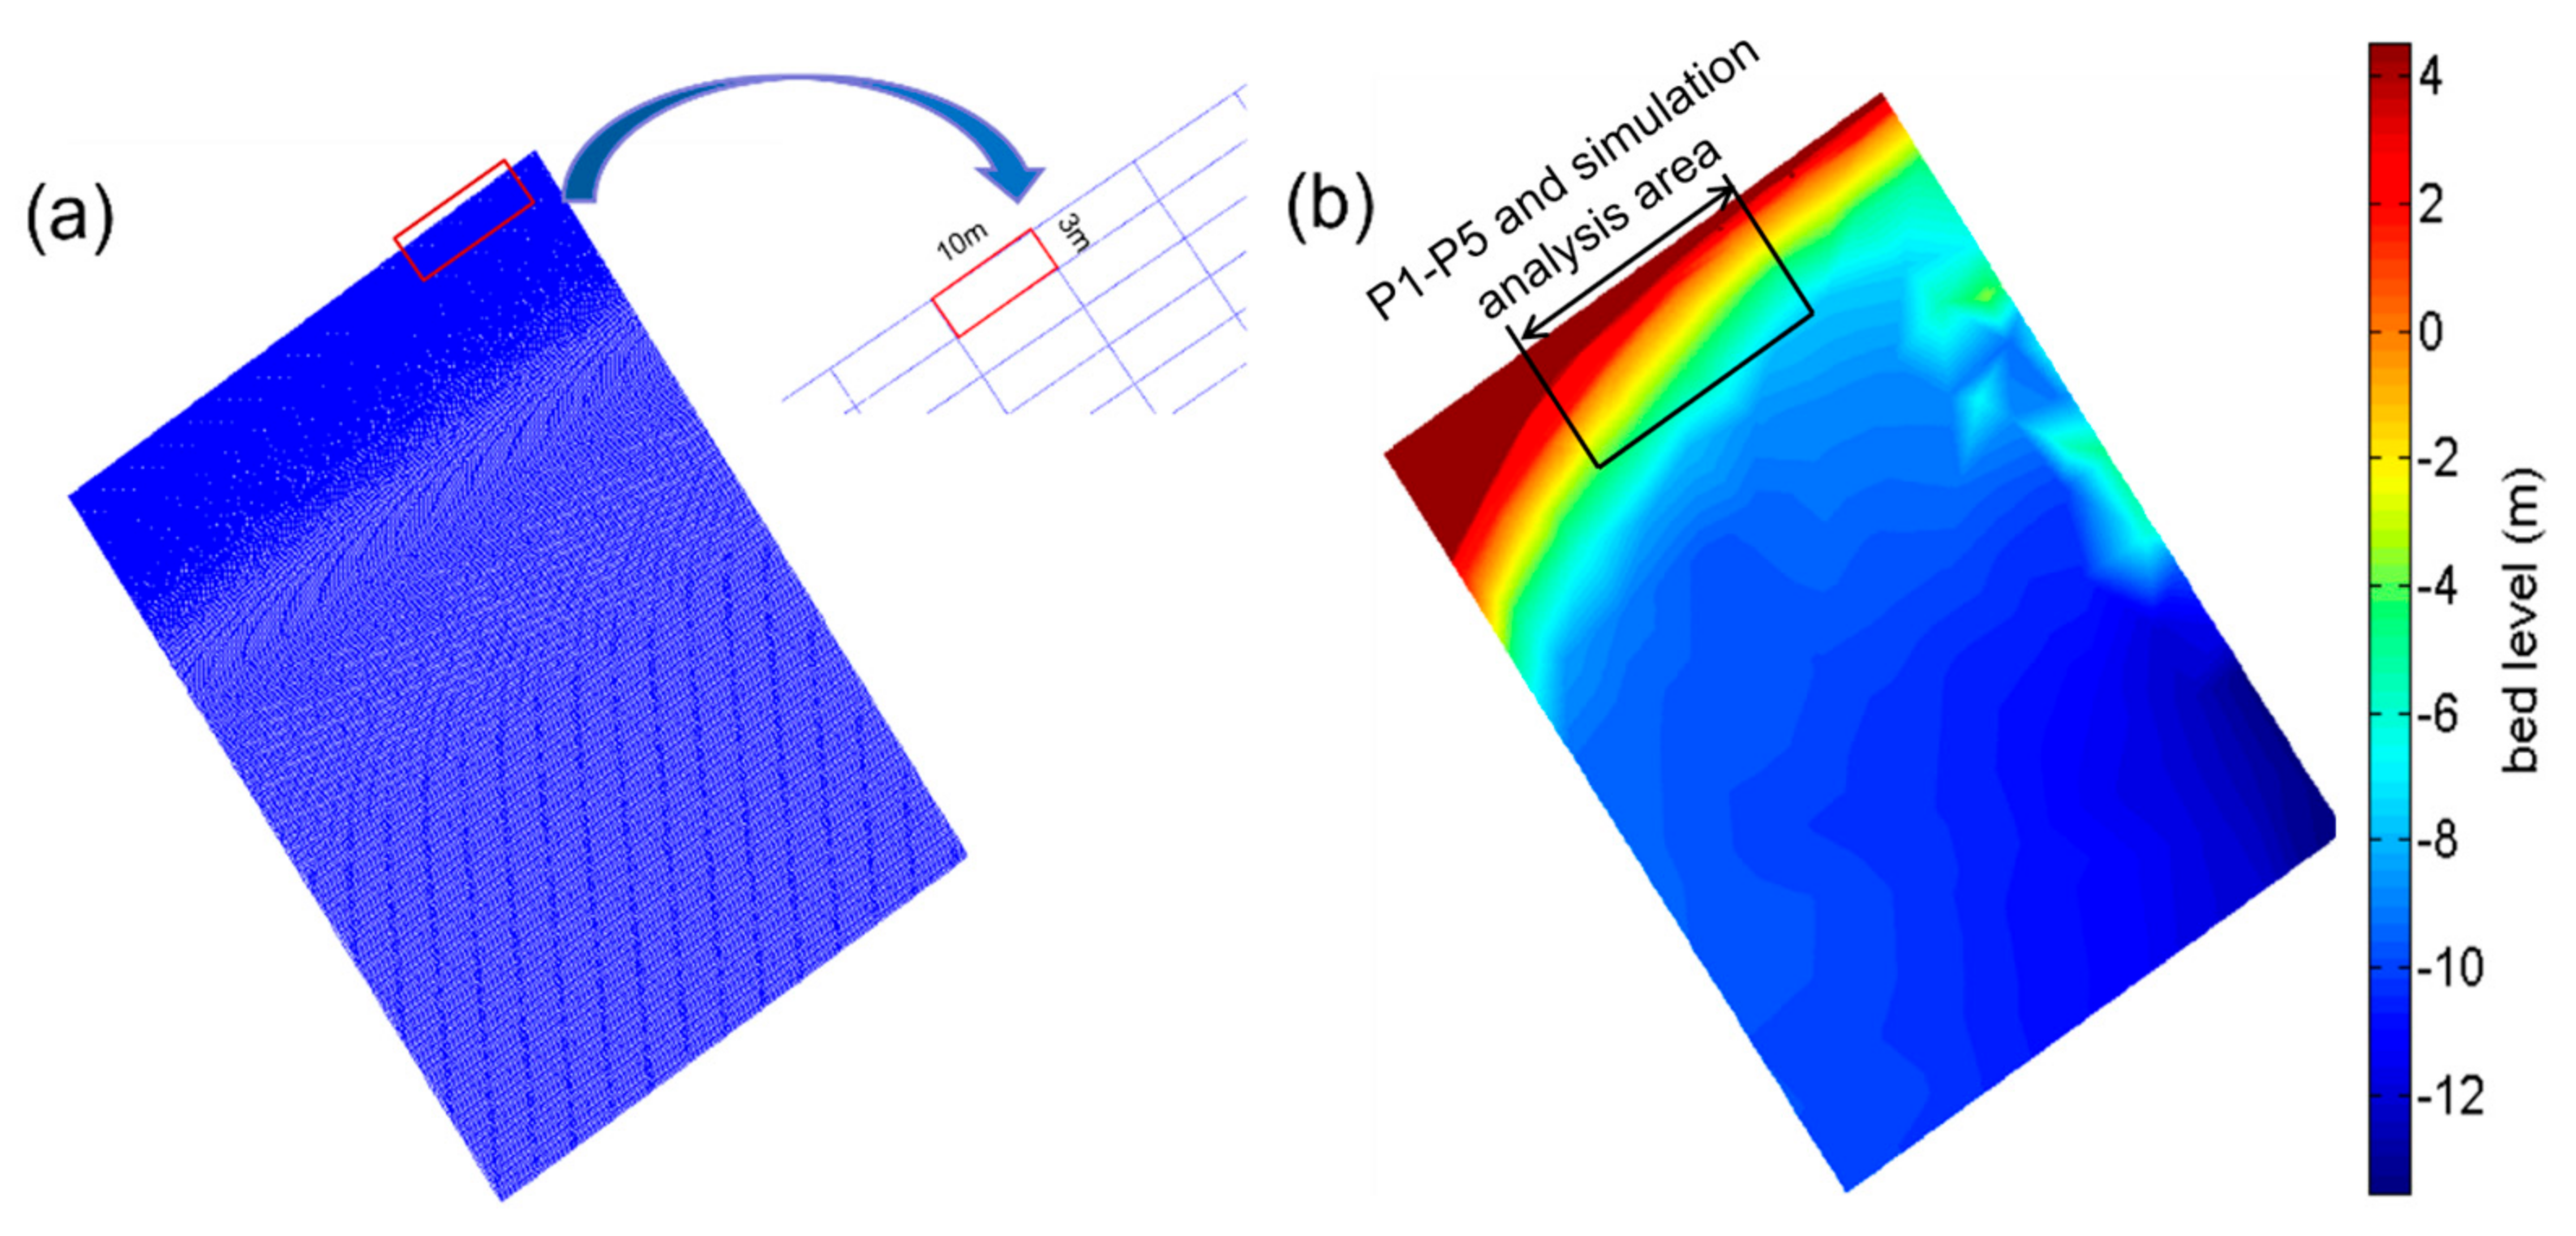
The grid setup and water depth of the XBeach model are shown in Figure 4, which covers Chudao South Beach and its sea area and all the measured profiles. The simulation uses a regular rectangular grid with a total of 360 × 338 grid cells in the study area. The unit grid spatial scale along the coastline is 10 m, the unit grid spatial scale perpendicular to the shoreline at the hydrodynamic boundary is 20 m, and the nearshore beach area is the focus of the research. The unit grid spatial scale perpendicular to the shoreline is densified to 3 m. The measured hydrodynamic data input for the model boundary in this study were sourced from the marine station described in Section 2.1. Based on the water depths at the location of the marine station and following the modeling principles of the model, the water depth at the model boundary is approximately −11 to −12.5 m. The grid sizes in the east–west and north–south directions are approximately 2.2 km and 3.3 km, respectively. The grid was generated using the RGFGRID mode in the Delft3D model. The XBeach model has defects in size and can only simulate calculations within a range of several kilometers; thus, the grid uses CSGS2000 projection coordinates.

2.2.3. Model Parameters Setup

In the current study, a method called GSA (Generalized Sensitivity Analysis) was developed, which can systematically assess the sensitivity of parameter changes induced by storm impacts in the XBeach model [40]. Before introducing GSA, this paper first introduces a method called BSS evaluation. The BSS (Brier Skill Score) evaluation method is a measure of the mean square probability error of event prediction. This evaluation method comprehensively considers reliability, uncertainty, and resolution and uses numerical values to determine the accuracy of event prediction [41]. The larger the BSS value is, the better the prediction effect will be. The range of BSS values and the prediction effects they represent are shown in Table 1. The BSS evaluation method is suitable for coastal dynamic simulation and is widely used in current research [28,42]. In this paper, this method is used to evaluate the accuracy of the numerical simulation of beach profile evolution with the following calculation formula:
BSS = 1.0 MSE ( Y , X ) MSE ( I , X )
MSE ( Y , X ) = 1 n i = 1 n ( Y i X i ) 2
where MSE represents the mean square error value, a series of X represent the actual elevation observation values, Y represent the elevation values after XBeach model simulation, and I represent the initial topographic elevation values.
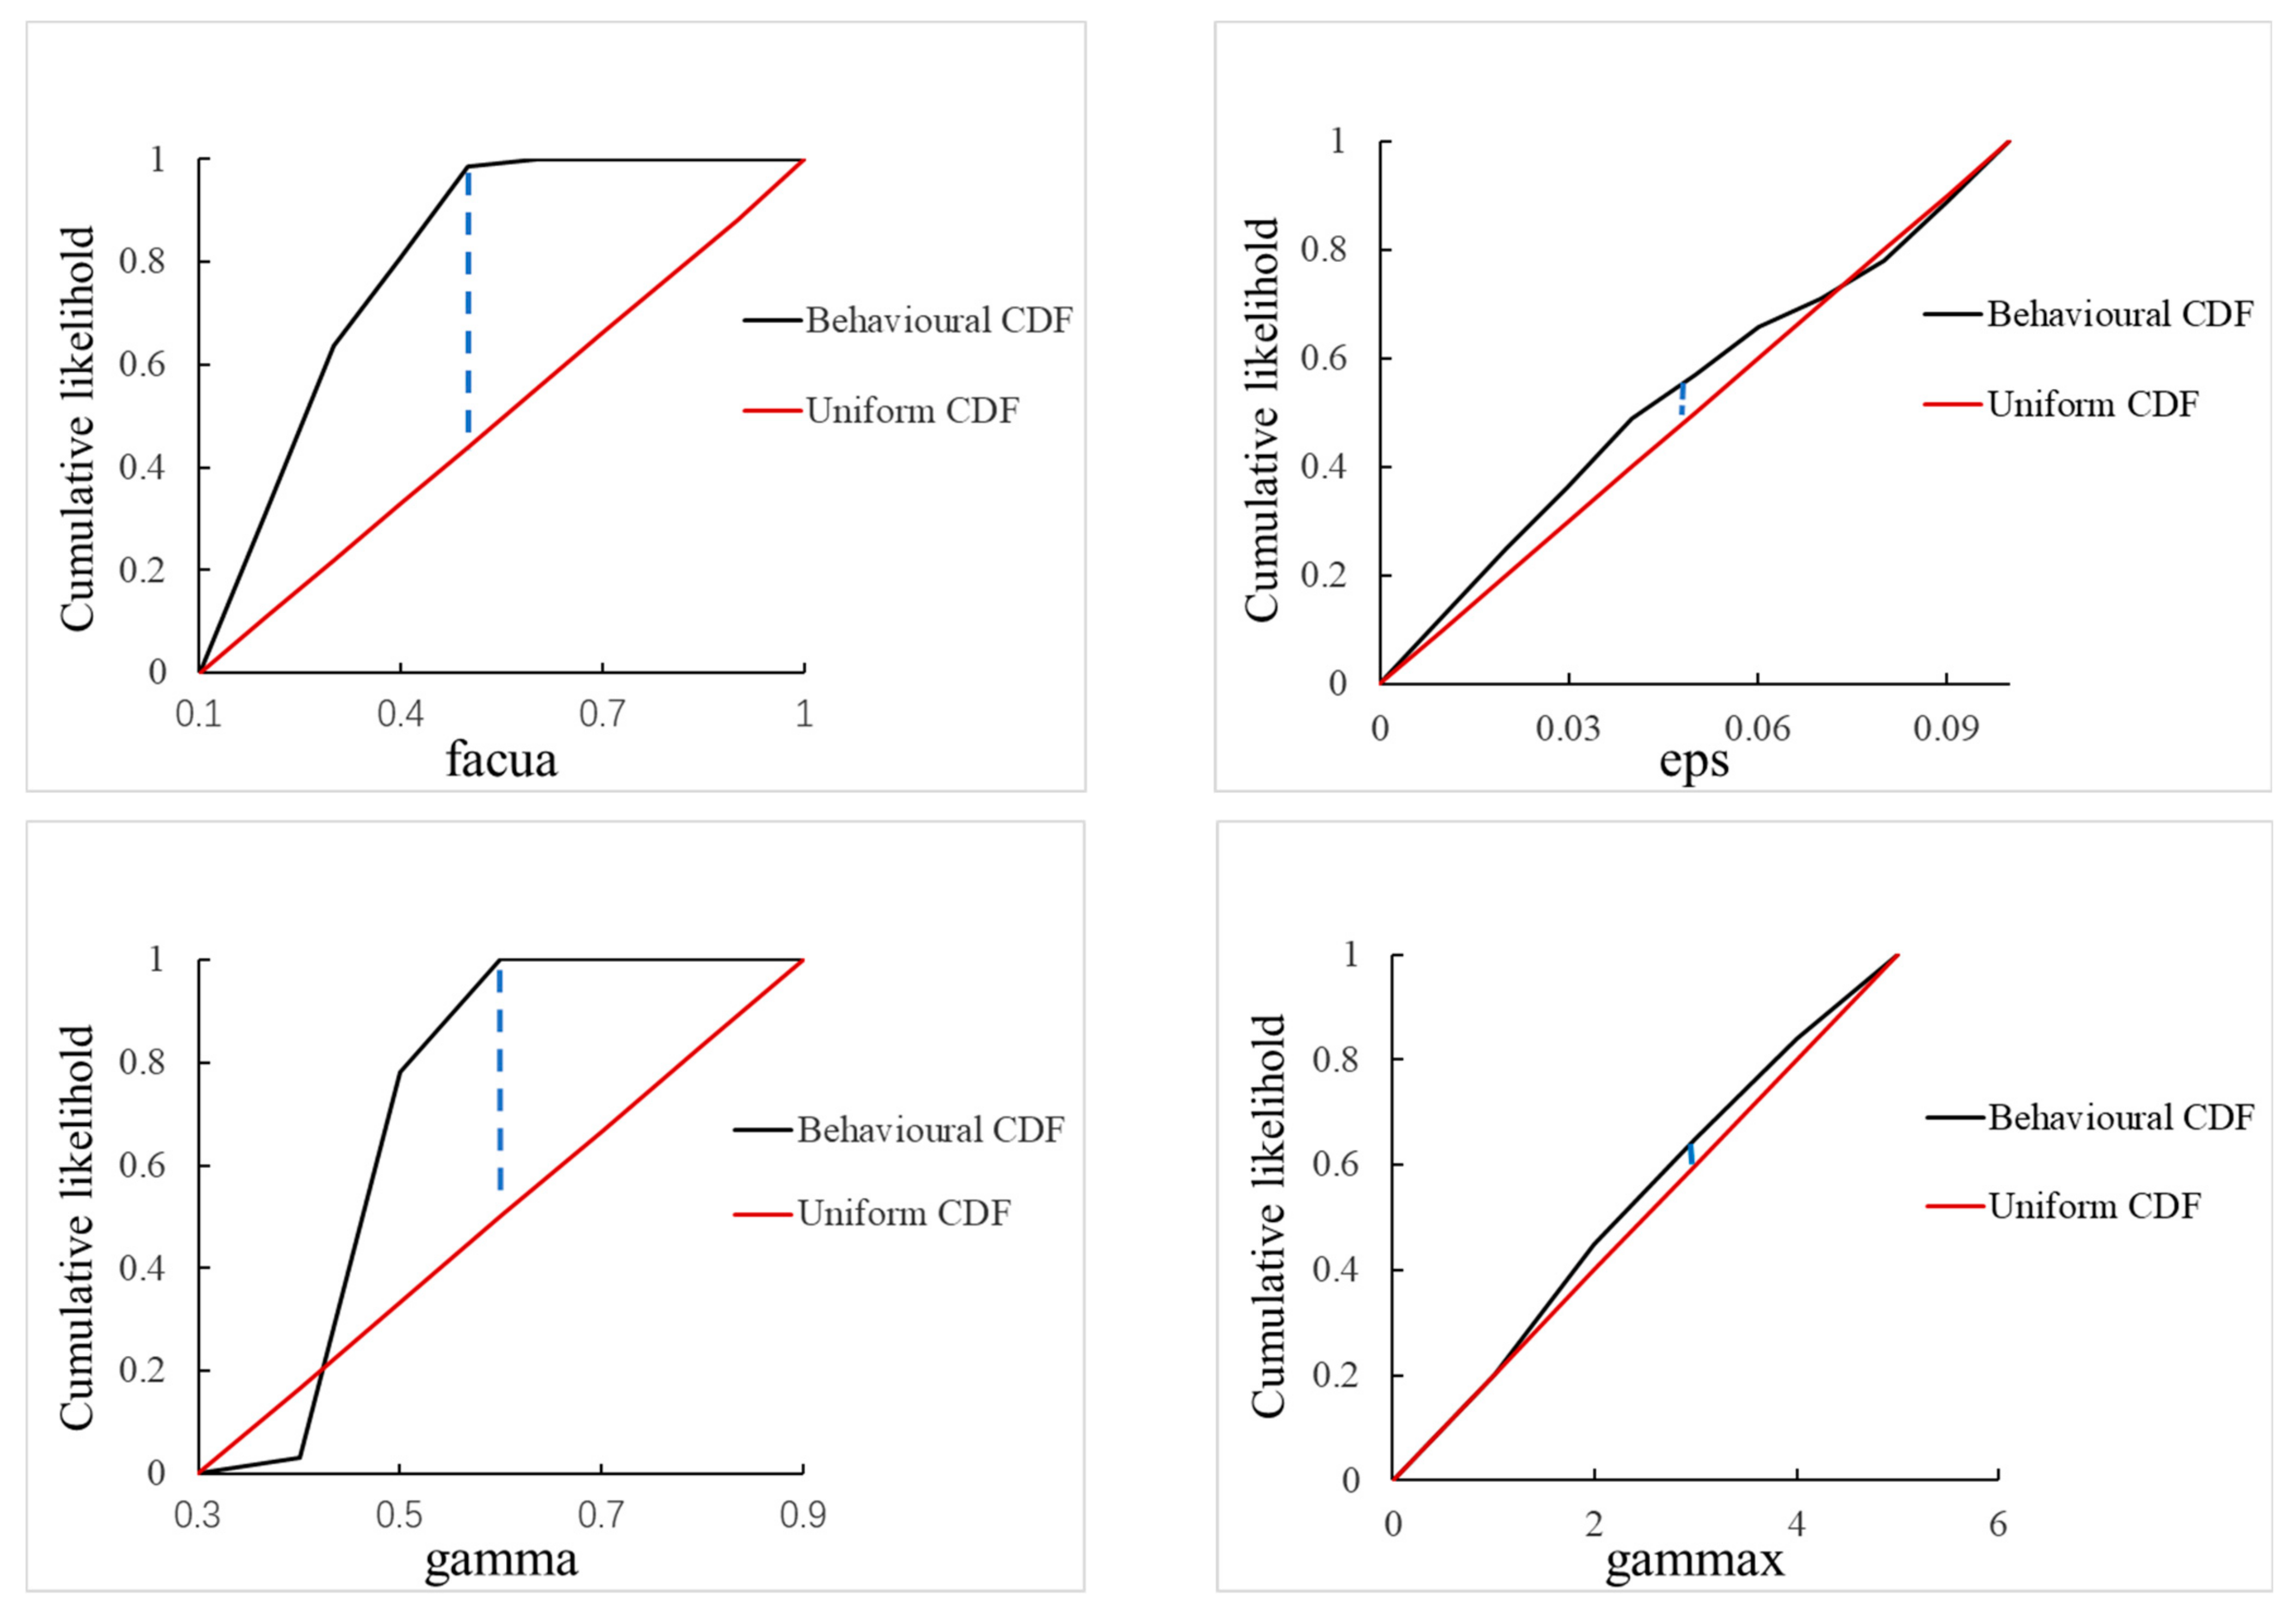
The GSA method allows for the systematic ranking of the relative sensitivity of the model experimental parameters. Using the GSA method, the cumulative distribution functions of behavioral parameter values (such as BSS > 0.3) and non-behavioral parameter values (assuming a uniform distribution of BSS values) are plotted on the same axis. A greater disparity between these two distributions signifies a heightened sensitivity of the model to a particular parameter, whereas a smaller disparity implies a lack of sensitivity towards the given parameter [43]. According to the research conducted by Simmons et al. [44], several important parameters for simulating wave runup and beach erosion processes in the XBeach model were selected in this study (see Table 2). The GSA method requires simulations with different combinations of parameter sets. In this study, a combination parameter set was constructed through uniform random sampling based on the recommended ranges of several fundamental parameters shown in Table 2, selecting the parameters with higher sensitivity. These selected parameters were then manually fine-tuned, ensuring the rigor of the parameter selection process while reducing the computational burden of the model simulations. As it was not feasible to consider all the study profiles in the two-dimensional XBeach model for parameter sensitivity determination, profile 3 (P3) was chosen as the representative profile for the sensitivity analysis. The steps of the GSA method include the construction of a likelihood function, the selection and setting of thresholds for the tuned parameter set, and parameter sensitivity analysis. The specific steps are as follows:
(1)
Constructing the likelihood function:
L BSS = BSS i i = 1 n BSS i
where BSS i represents the BSS value of each parameter set, and n represents the total number of times that the model’s computation exceeds the threshold.
(2)
Setting the threshold: Choosing a threshold that is too low is not conducive to determining the parameter tuning range, while a high threshold may result in fewer occurrences in which the threshold is exceeded. In this paper, a BSS threshold of 0.3 is selected.
(3)
Parameter sensitivity ranking: Assuming the numerical ranges of the base parameters follow a uniform distribution of likelihood functions, the simulated cumulative likelihood functions of each parameter are compared and analyzed against the assumed cumulative uniform functions.
Table 2. Selected parameters for GSA method validation, their meanings, default values, and recommended ranges according to the model.
ParameterDescriptionDefaultRecommended Range
facuaThe extent to which wave skewness and asymmetry impact the directional movement of sediment.0.10–1
epsDepth threshold for distinguishing between wet and dry cells.0.0050.001–0.1
gammaThe wave dissipation model’s breaker index.0.550.4–0.9
gammaxThe maximum permissible ratio of wave height to water depth.20.4–5
The GSA analysis results for the four parameters mentioned above can be seen in Figure 5. From the figure, it can be observed that the ‘facua’ and ‘gamma’ parameters are relatively sensitive, with higher Kolmogorov–Smirnov D statistics values, while ‘eps’ and ‘gammax’ are relatively insensitive. The sensitivity of these four parameters can be ranked from high to low as follows: ‘facua’, ‘gamma’, ‘eps’, and ‘gammax’. Furthermore, parameter ranges with larger cumulative frequency slopes can achieve better simulation results (‘facua’ in the range of 0.1–0.3 and ‘gamma’ in the range of 0.4–0.6). After determining the parameters’ sensitivity, we manually adjusted the highly sensitive parameters ‘facua’ and ‘gamma’, setting the ‘facua’ value to 0.15 and the ‘gamma’ value to 0.50. The ‘eps’ and ‘gammax’ parameters were kept at their default values.
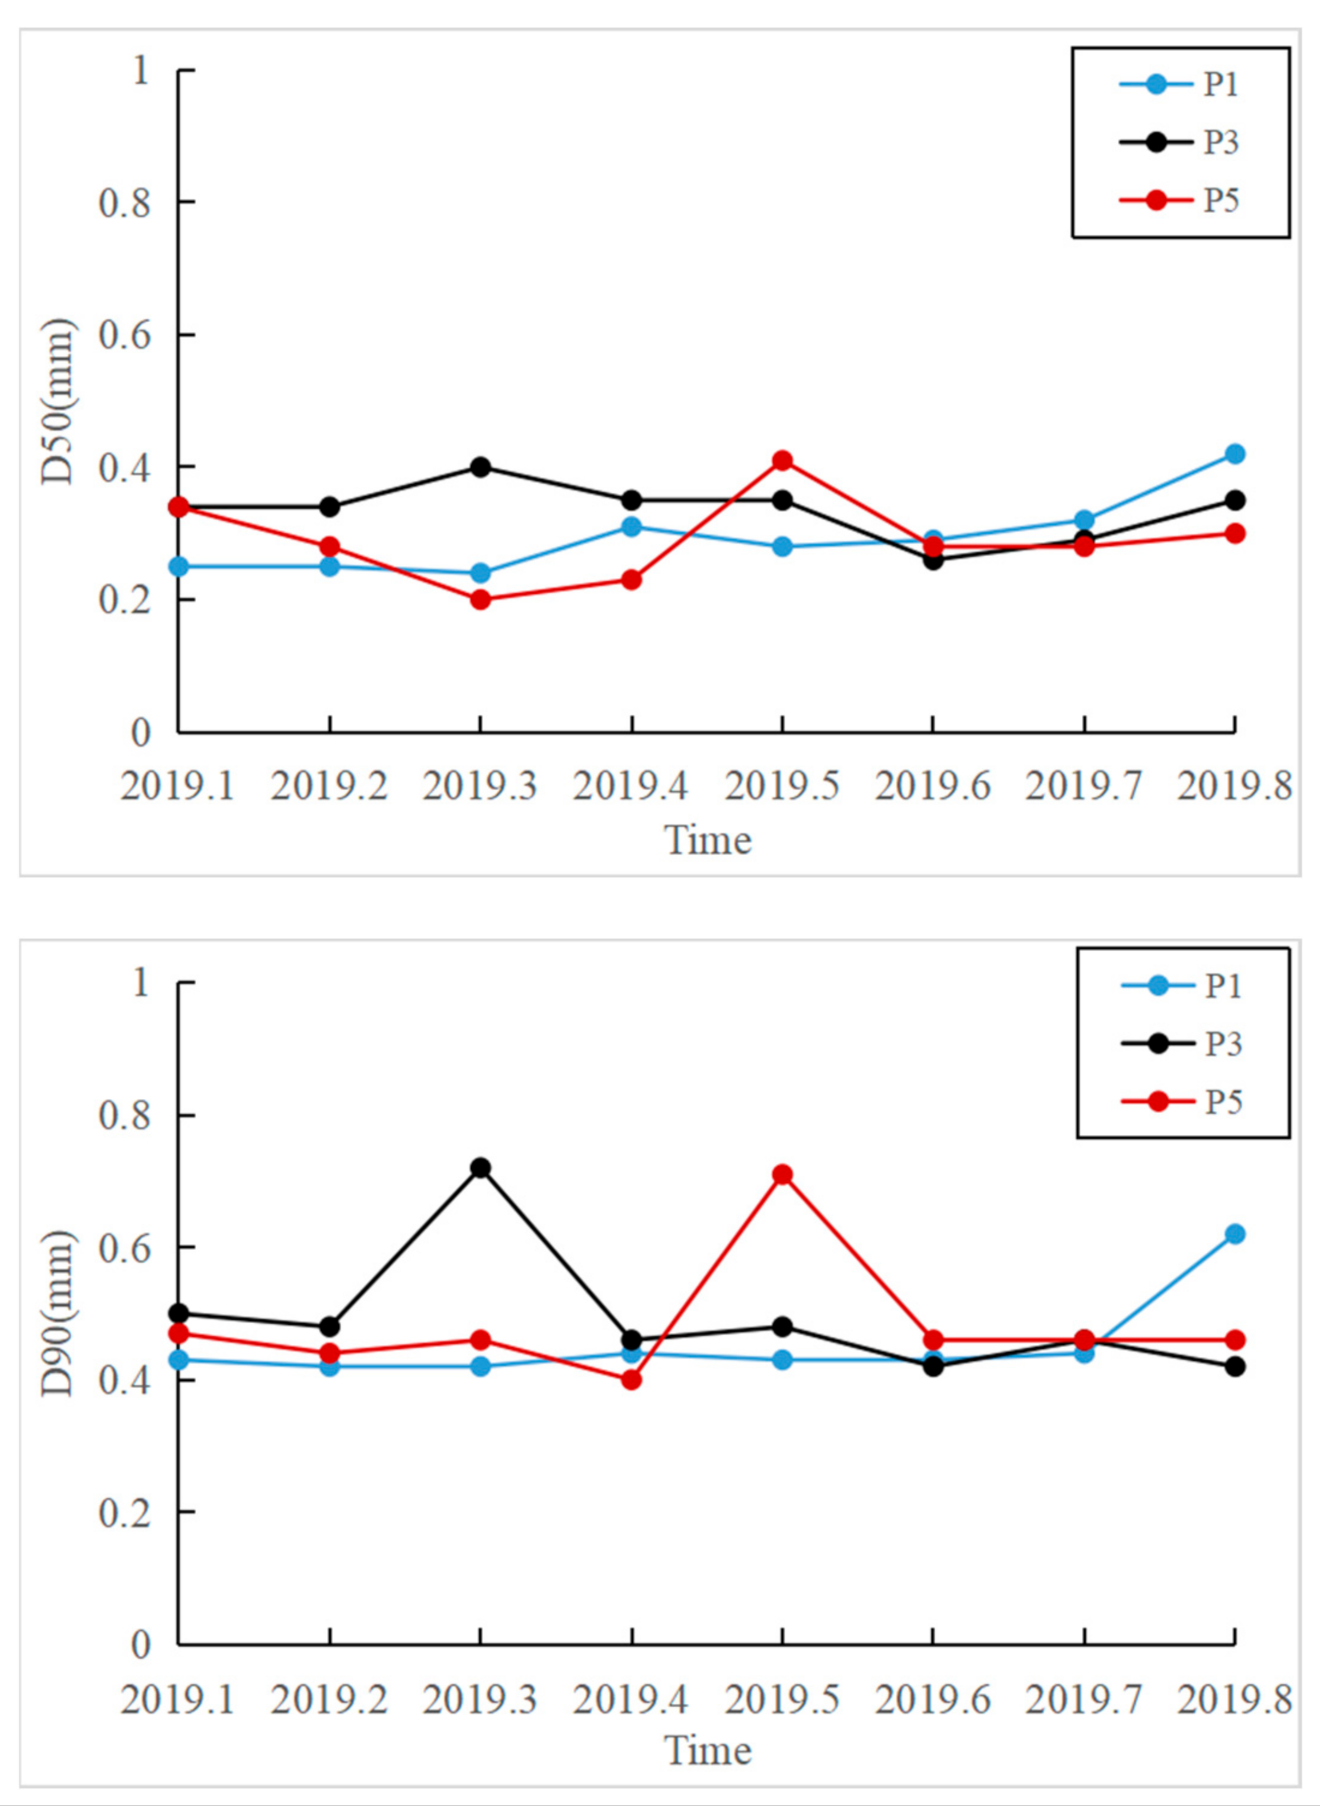
Based on the long-term particle size data of the three profiles of Chudao South Beach collected before Typhoon Lekima, the D50 and D90 sizes of the sand in the intertidal zone of the three above-mentioned research profiles (P1, P3, and P5) were processed and summarized (Figure 6). In the XBeach model, the median sediment size (D50) is taken as the average of multiple measurements per month before the typhoon, being 0.3 mm, and D90 is taken as the average of multiple measurements, being 0.47 mm. Tidal and wave changes measured over time are used as boundary conditions, with wave conditions using JONSWAP wave spectrum files changing hourly (including the time-varying significant wave height, spectral peak period, main wave direction, spectral peak factor, directional coefficient, and duration). The left and right sides of the hydrodynamic boundary use Neumann boundaries, and the other parameters are set to the default values. According to the profile measurement time before and after the typhoon, the simulation time was set from 15:00 on 10 August 2019, to 15:00 on 13 August 2019, for a total of 72 h.

2.2.4. Model Validation

Based on the prepared grid, topography, and parameter files, the evolution process of Chudao Beach during Typhoon Lekima was simulated, and the final simulation evaluation of the five profiles (P1–P5) was conducted using the BSS evaluation method described in Section 2.2.3.
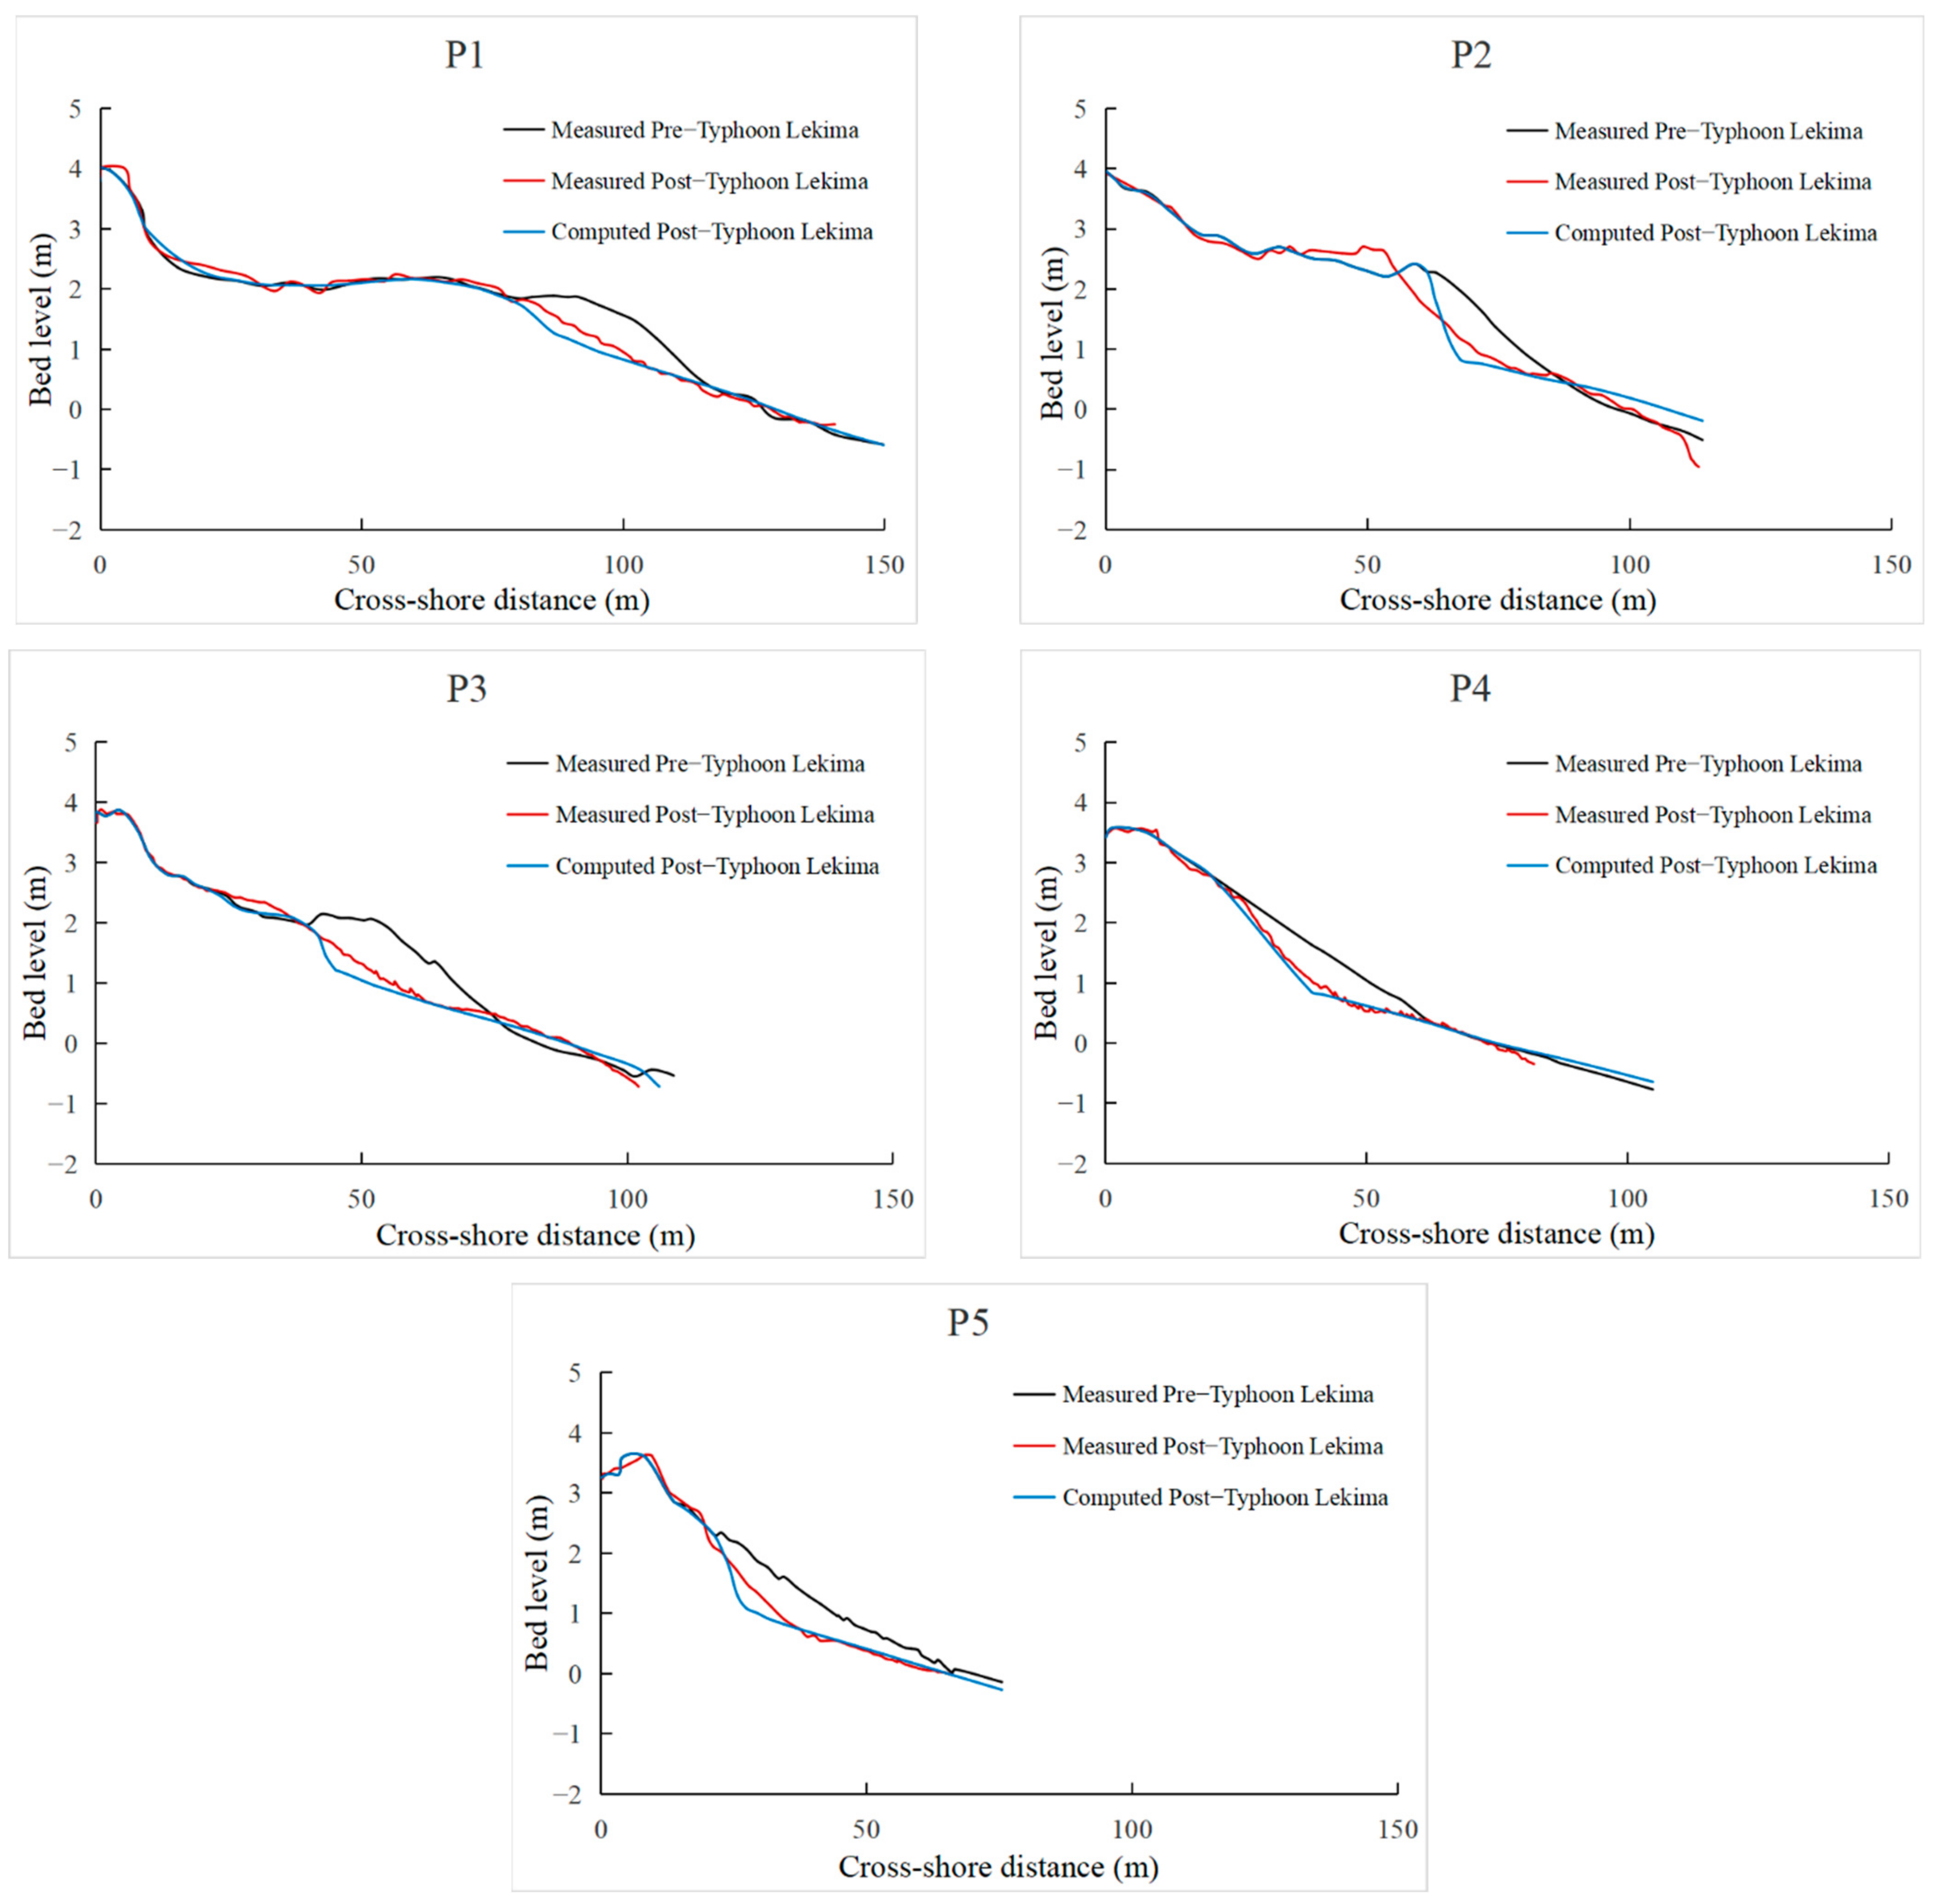
The measured and calculated validation profiles before and after Typhoon Lekima are shown in Figure 7. The simulated morphology of profiles P1, P3, and P5 is consistent with the measured values, but the simulated erosion height at the shoulder is greater than the value measured after the typhoon. The calculated BSS values are 0.81 (good), 0.86 (good), and 0.82 (good), respectively. The simulated erosion length of profile P2 at the shoulder is slightly smaller than the value measured after the typhoon, and the erosion height is also greater than the value measured after the typhoon. The morphology is somewhat different from the measured value, with a calculated BSS value of 0.58 (reasonable). Profile P4 has a high degree of similarity between the simulation and post-typhoon measurements, with a calculated BSS value of 0.89 (good). Overall, the XBeach model can effectively simulate the topographic changes in Chudao Beach that occurred during Typhoon Lekima.

3. Results

3.1. Beach Dynamic Response Status

During Typhoon Lekima, the marine dynamic environment in the study area was enhanced, and the beach responded quickly. The originally dissipative profiles showed a more dissipative state. During this period, the main wave direction was ESE~S, while the beach was oriented NNE and SSW. The large waves generated by the typhoon had a direct impact on nearly all the profiles. The energy produced by the large waves caused the beach shoulder to disappear and the slope to decrease. In this paper, four moments of 9 h (wave height growth), 24 h (maximum wave height), 48 h (wave height decay), and 72 h (stable wave height) are selected to represent the response process of the beach to the typhoon, and the hydrodynamics and evolution morphology of the simulated profiles are analyzed. Profile P3 is selected as the representative profile, with the average sea level height of 0 m as the origin of the coordinates. Its water level and significant wave height values in the four moments are the output (Figure 8), and the average water level and average wave height of the five profiles in each moment are calculated (Figure 9). As can be seen in the figure, during the typhoon period, the water level in each moment generally rises as the distance from the shore decreases, with a significant rise in the water level at 200 m from the shore. At 24 h, when the wave height is large, there is a significant increase in the water level at 400 m from the shore, and the increase in the water level is greater than that at other times when the wave height is small. During the typhoon period, the average water level of each profile shows that there is no significant increase in water level from a depth of −10 m to 100 m from the shore, with an average water level between 0.35 m and 0.40 m. Starting from 100 moffshore, due to the energy loss caused by wave breaking and radiating stress decreasing, in order to balance the stress difference, the water level in the area closer to the shoreline rises significantly. When the wave height is at its maximum, the water level is lower. The wave attenuation becomes more severe as the distance from the shore decreases. The average wave height of each profile shows that there is no significant overall change in the average wave height from a depth of −10 m to 100 m from the shore. Combining Figure 8 and Figure 9, we can see that the distance from 100 m offshore to the point where the mean water surface is 0 is where the waves concentrate in breaking and the wave height drops rapidly.
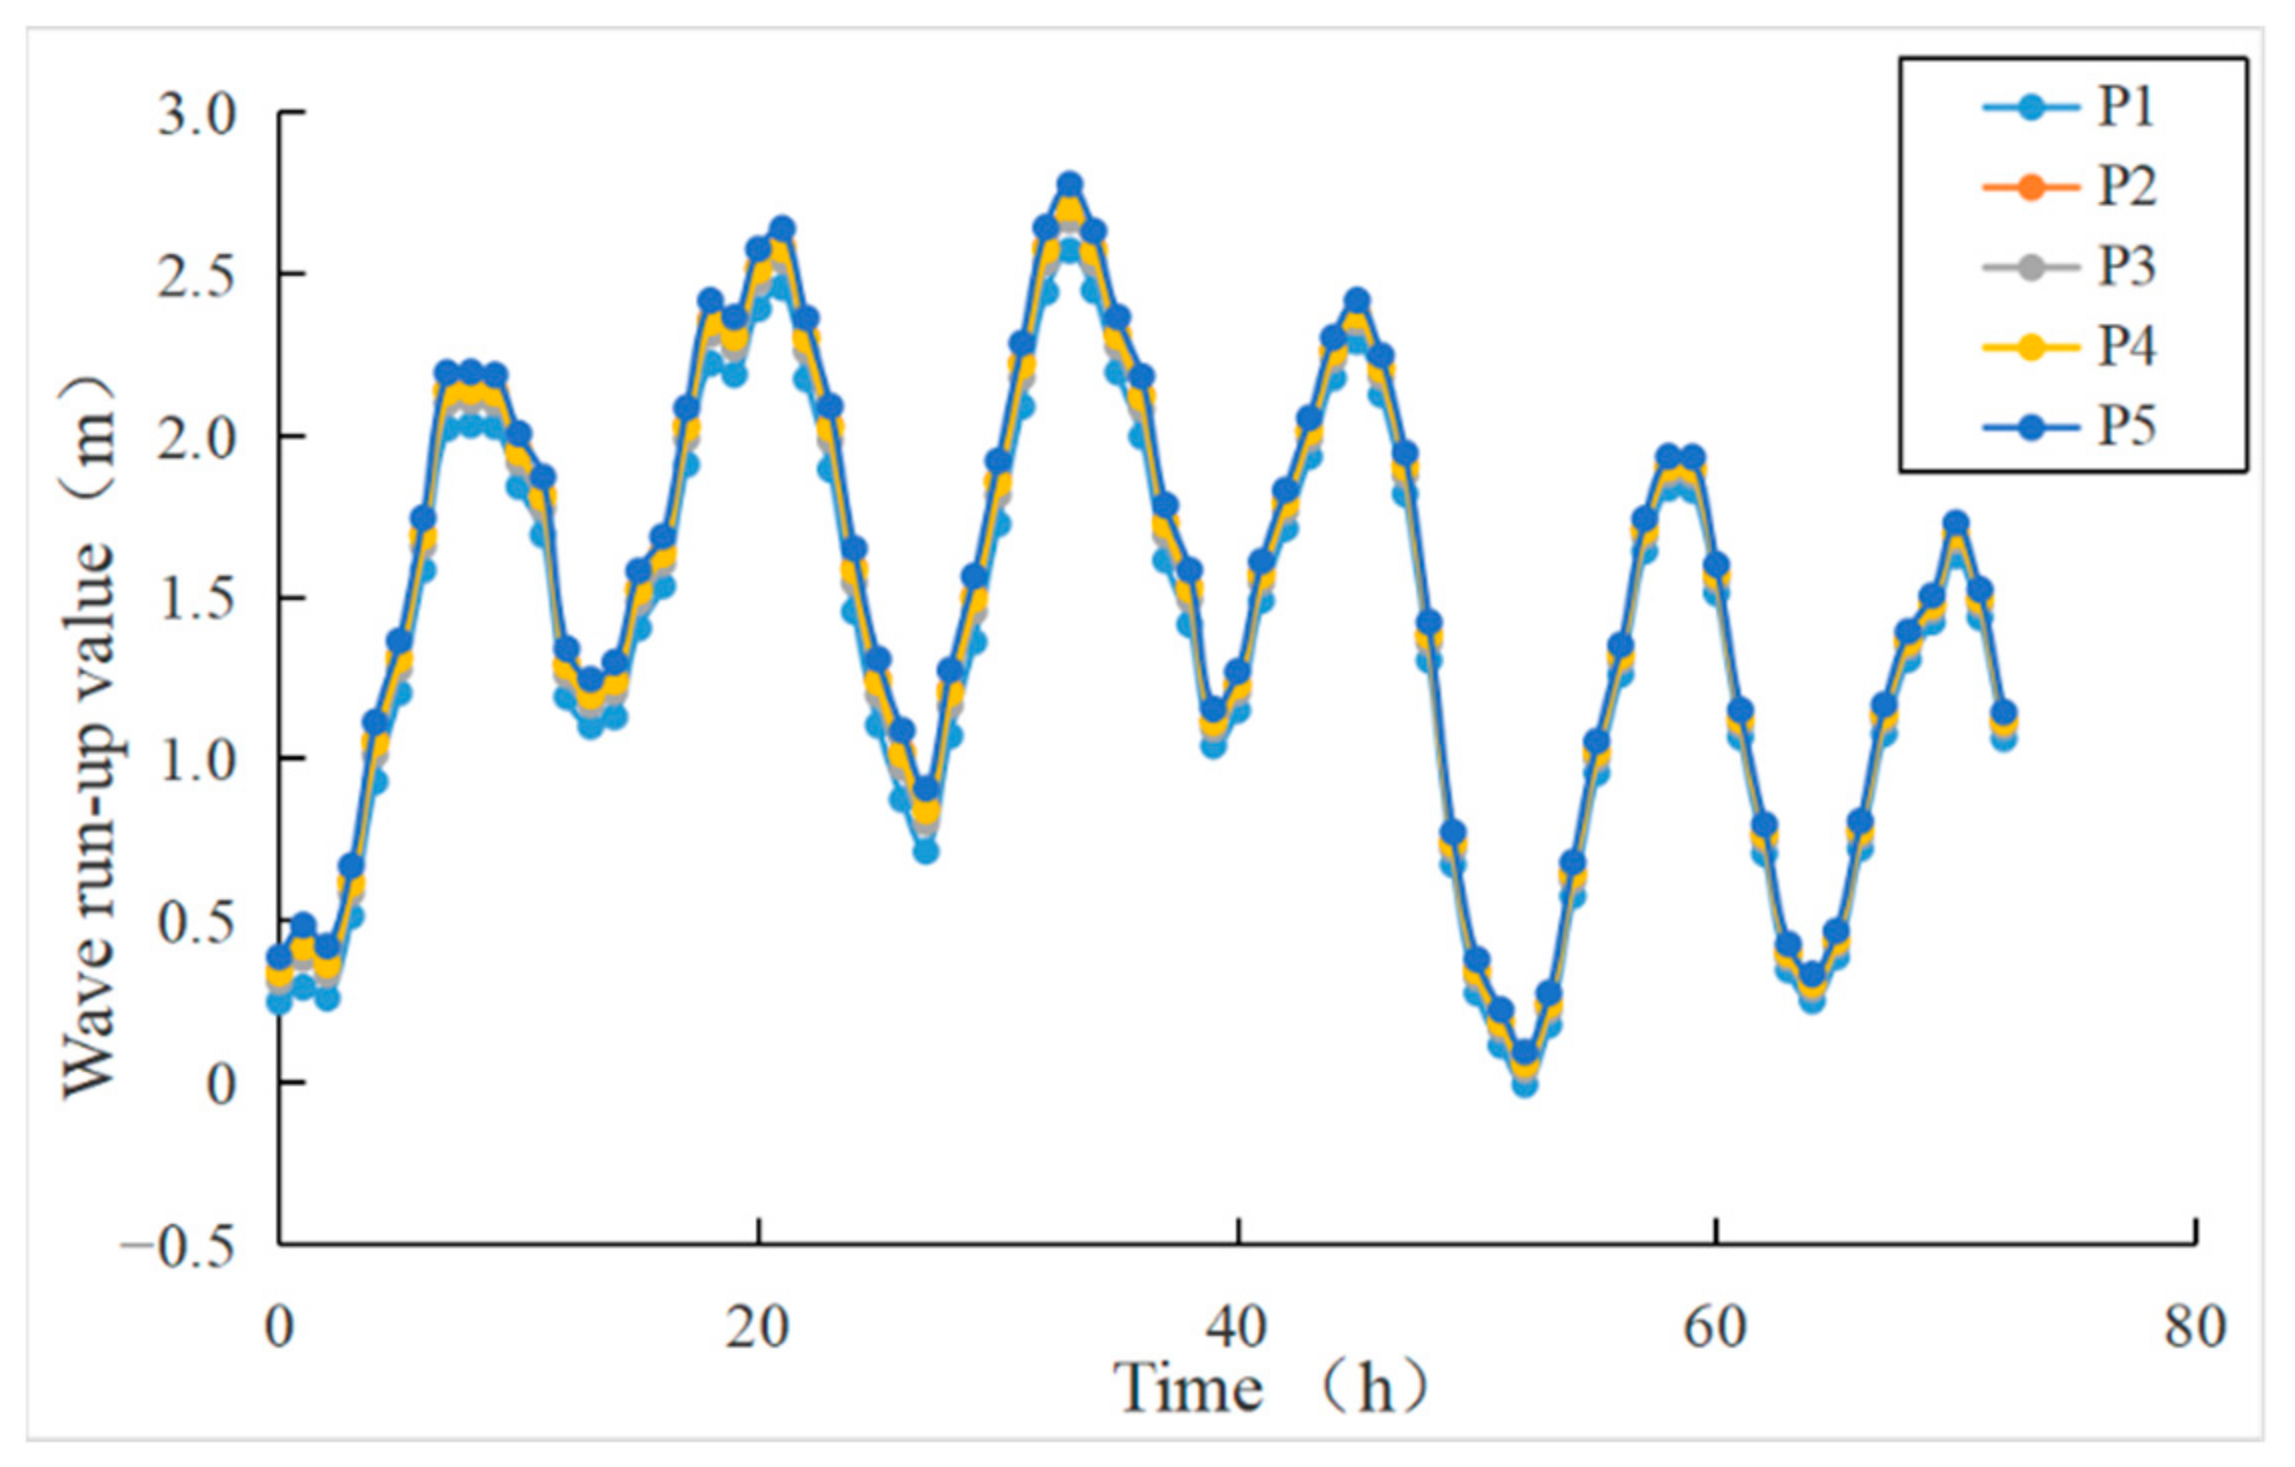
In order to analyze the evolution process of the beach profiles under storm surge conditions, this paper introduces a storm condition response model and calculates the maximum wave runup value R high and maximum wave rundown height value R low of the XBeach model, corresponding to Chudao South Beach during Typhoon Lekima and based on the measured XBeach model boundary hydrodynamic conditions. The response state of Chudao Beach to typhoon-induced storm surges and waves is determined, and the empirical calculation formula is as follows [45]:
R high = H 0 ( 0.83 ξ + 0.20 ) + η SWL
R low = H 0 ( 0.02 ξ + 0.14 ) + η SW
where H 0 is the deep water wave height, ξ is the Iribarren number, ξ = σ H 0 / L 0 is the beach slope, L 0 = g 2 π T 2 , T is the wave period, and η SWL is the water level at the corresponding time. Comparing R high and R low with the beach top elevation B high and beach bottom elevation B low , Table 3 shows the classification of the beach response states. The slope of Chudao South Beach is between 0.04 and 0.06. According to the model output water level and wave elements of each profile model calculation, we can calculate the wave runup of profiles P1–P5 in each moment during the typhoon, as shown in Figure 10. It can be seen from the figure that the maximum calculated R high value for each moment is 2.86 m. Overall, the maximum wave runup is greater than 0 and less than the beach top elevation of each profile. This indicates that during Typhoon Lekima, the study area’s shore beach generally had an erosive morphology. The profile evolution morphology measured and simulated before and after the typhoon (Figure 7) also confirms this.

3.2. Dynamic Changes of Beach Profile

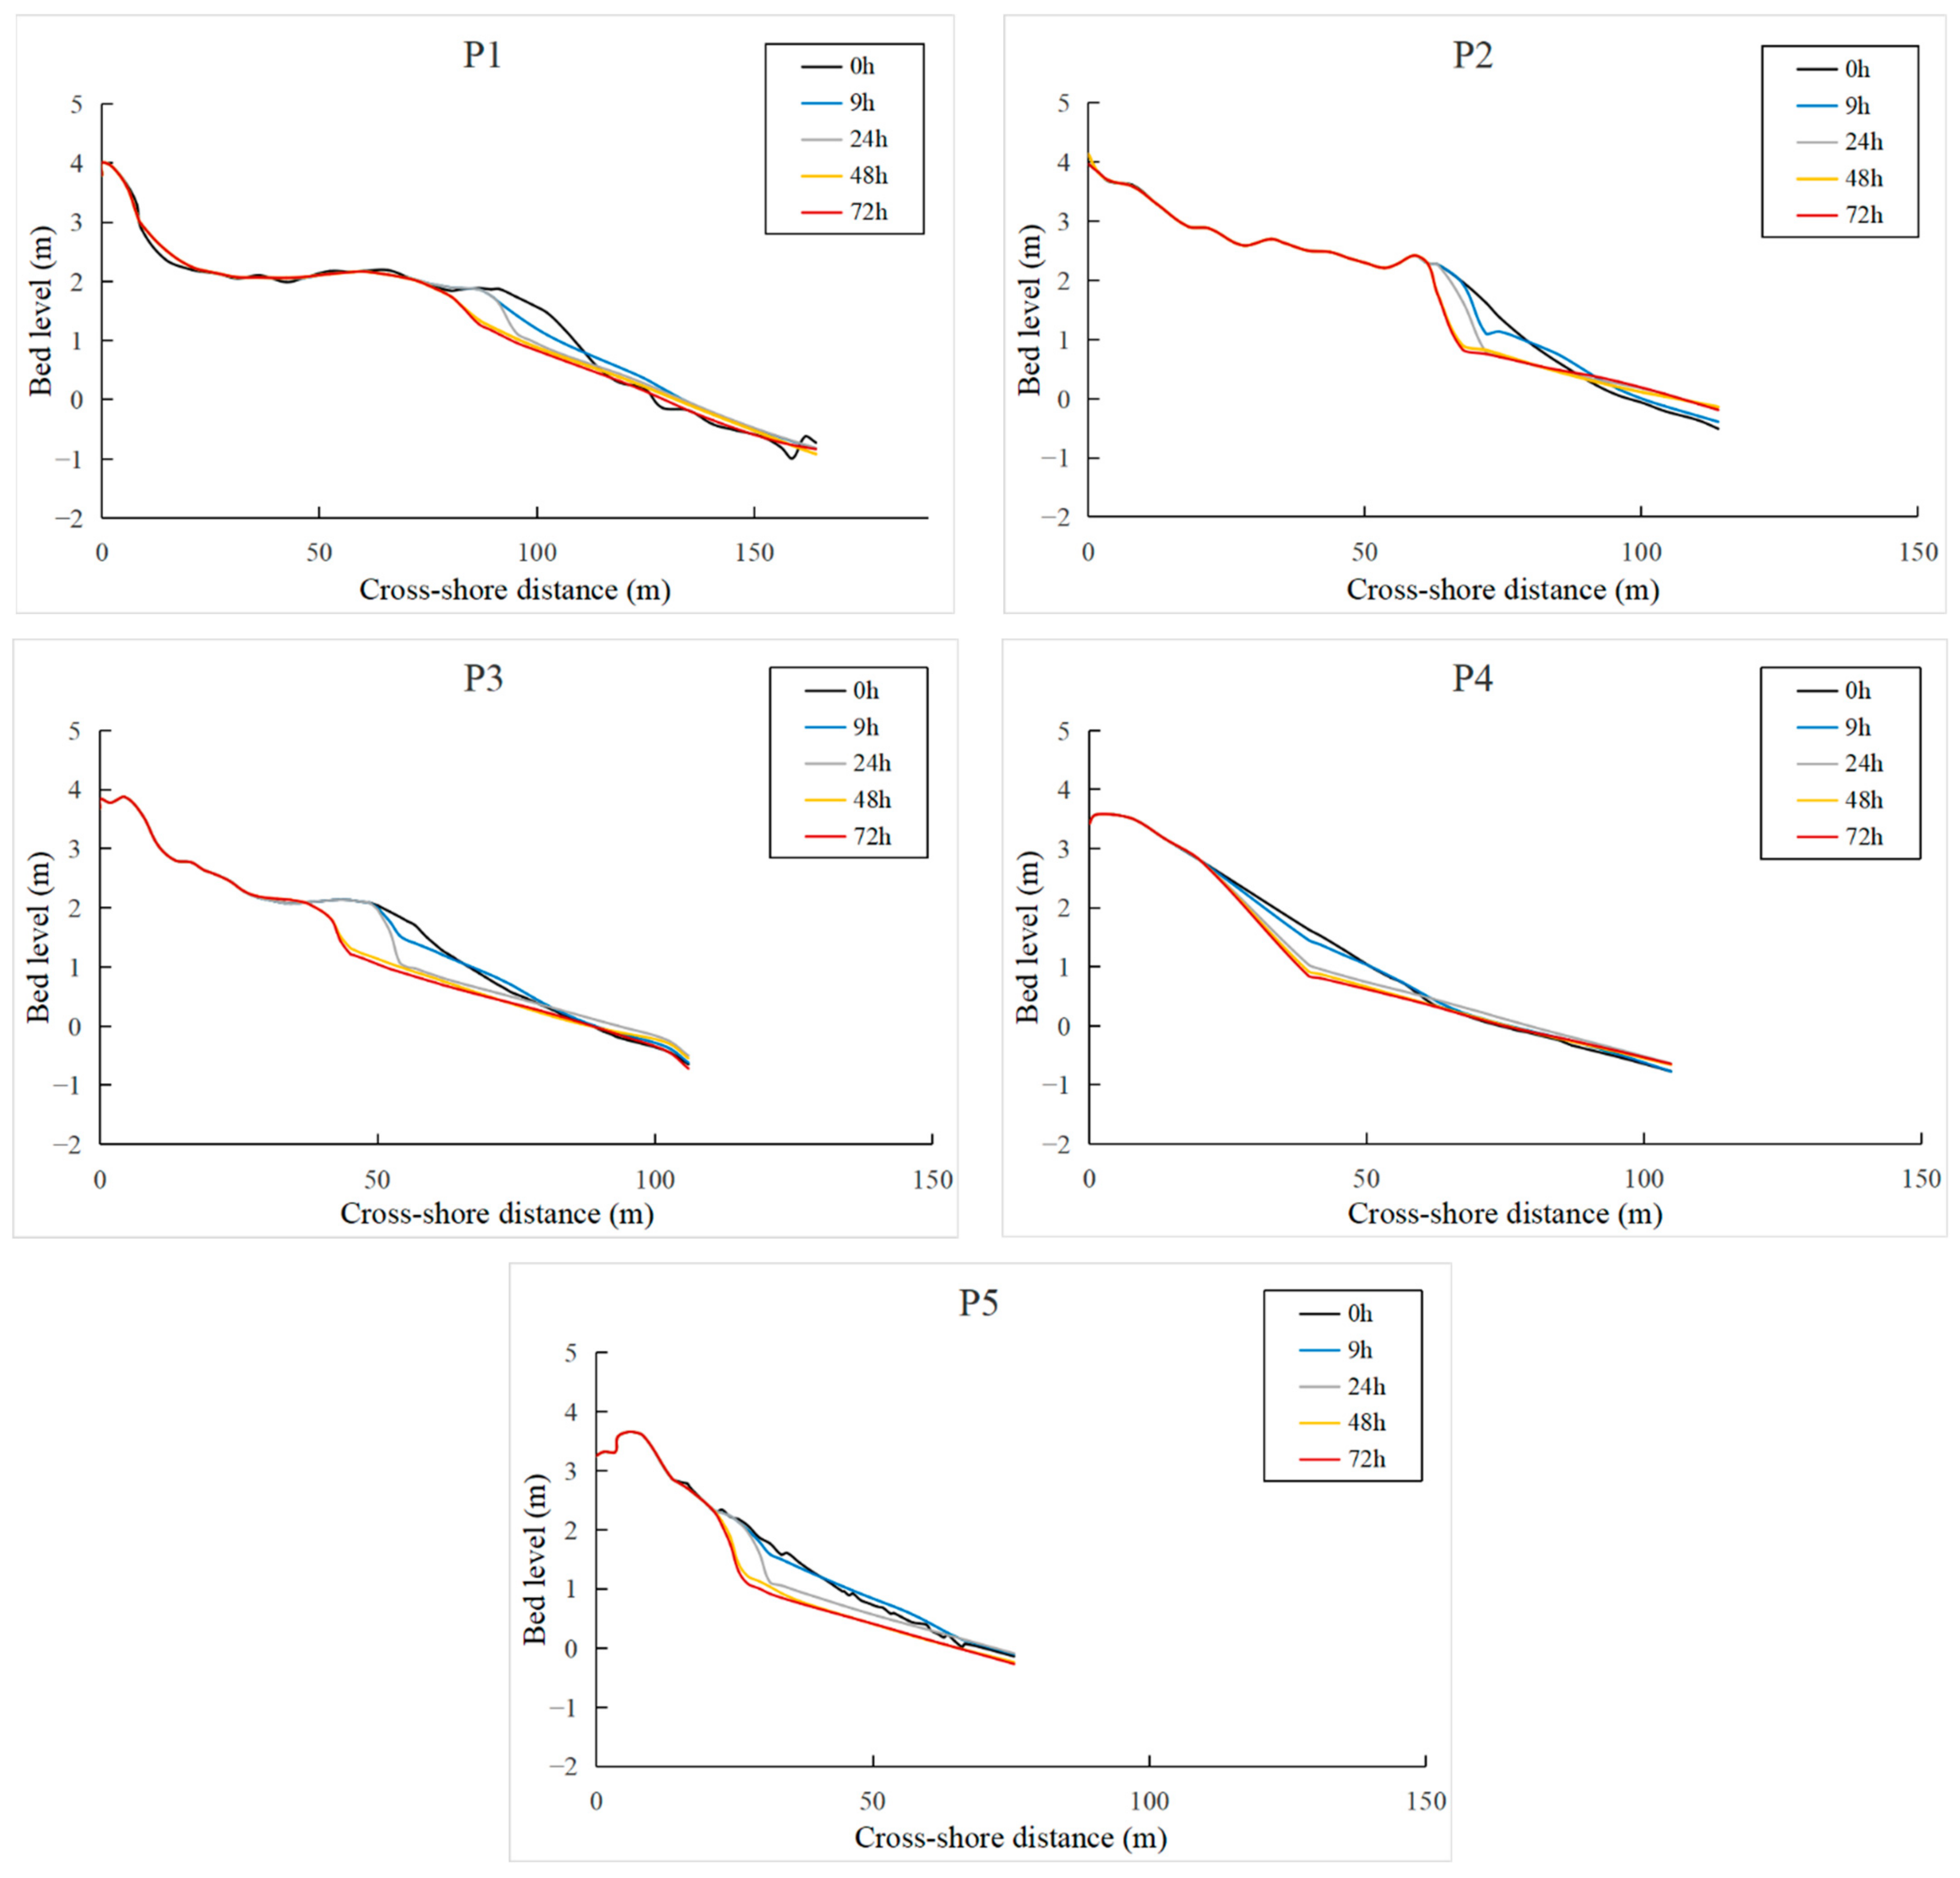
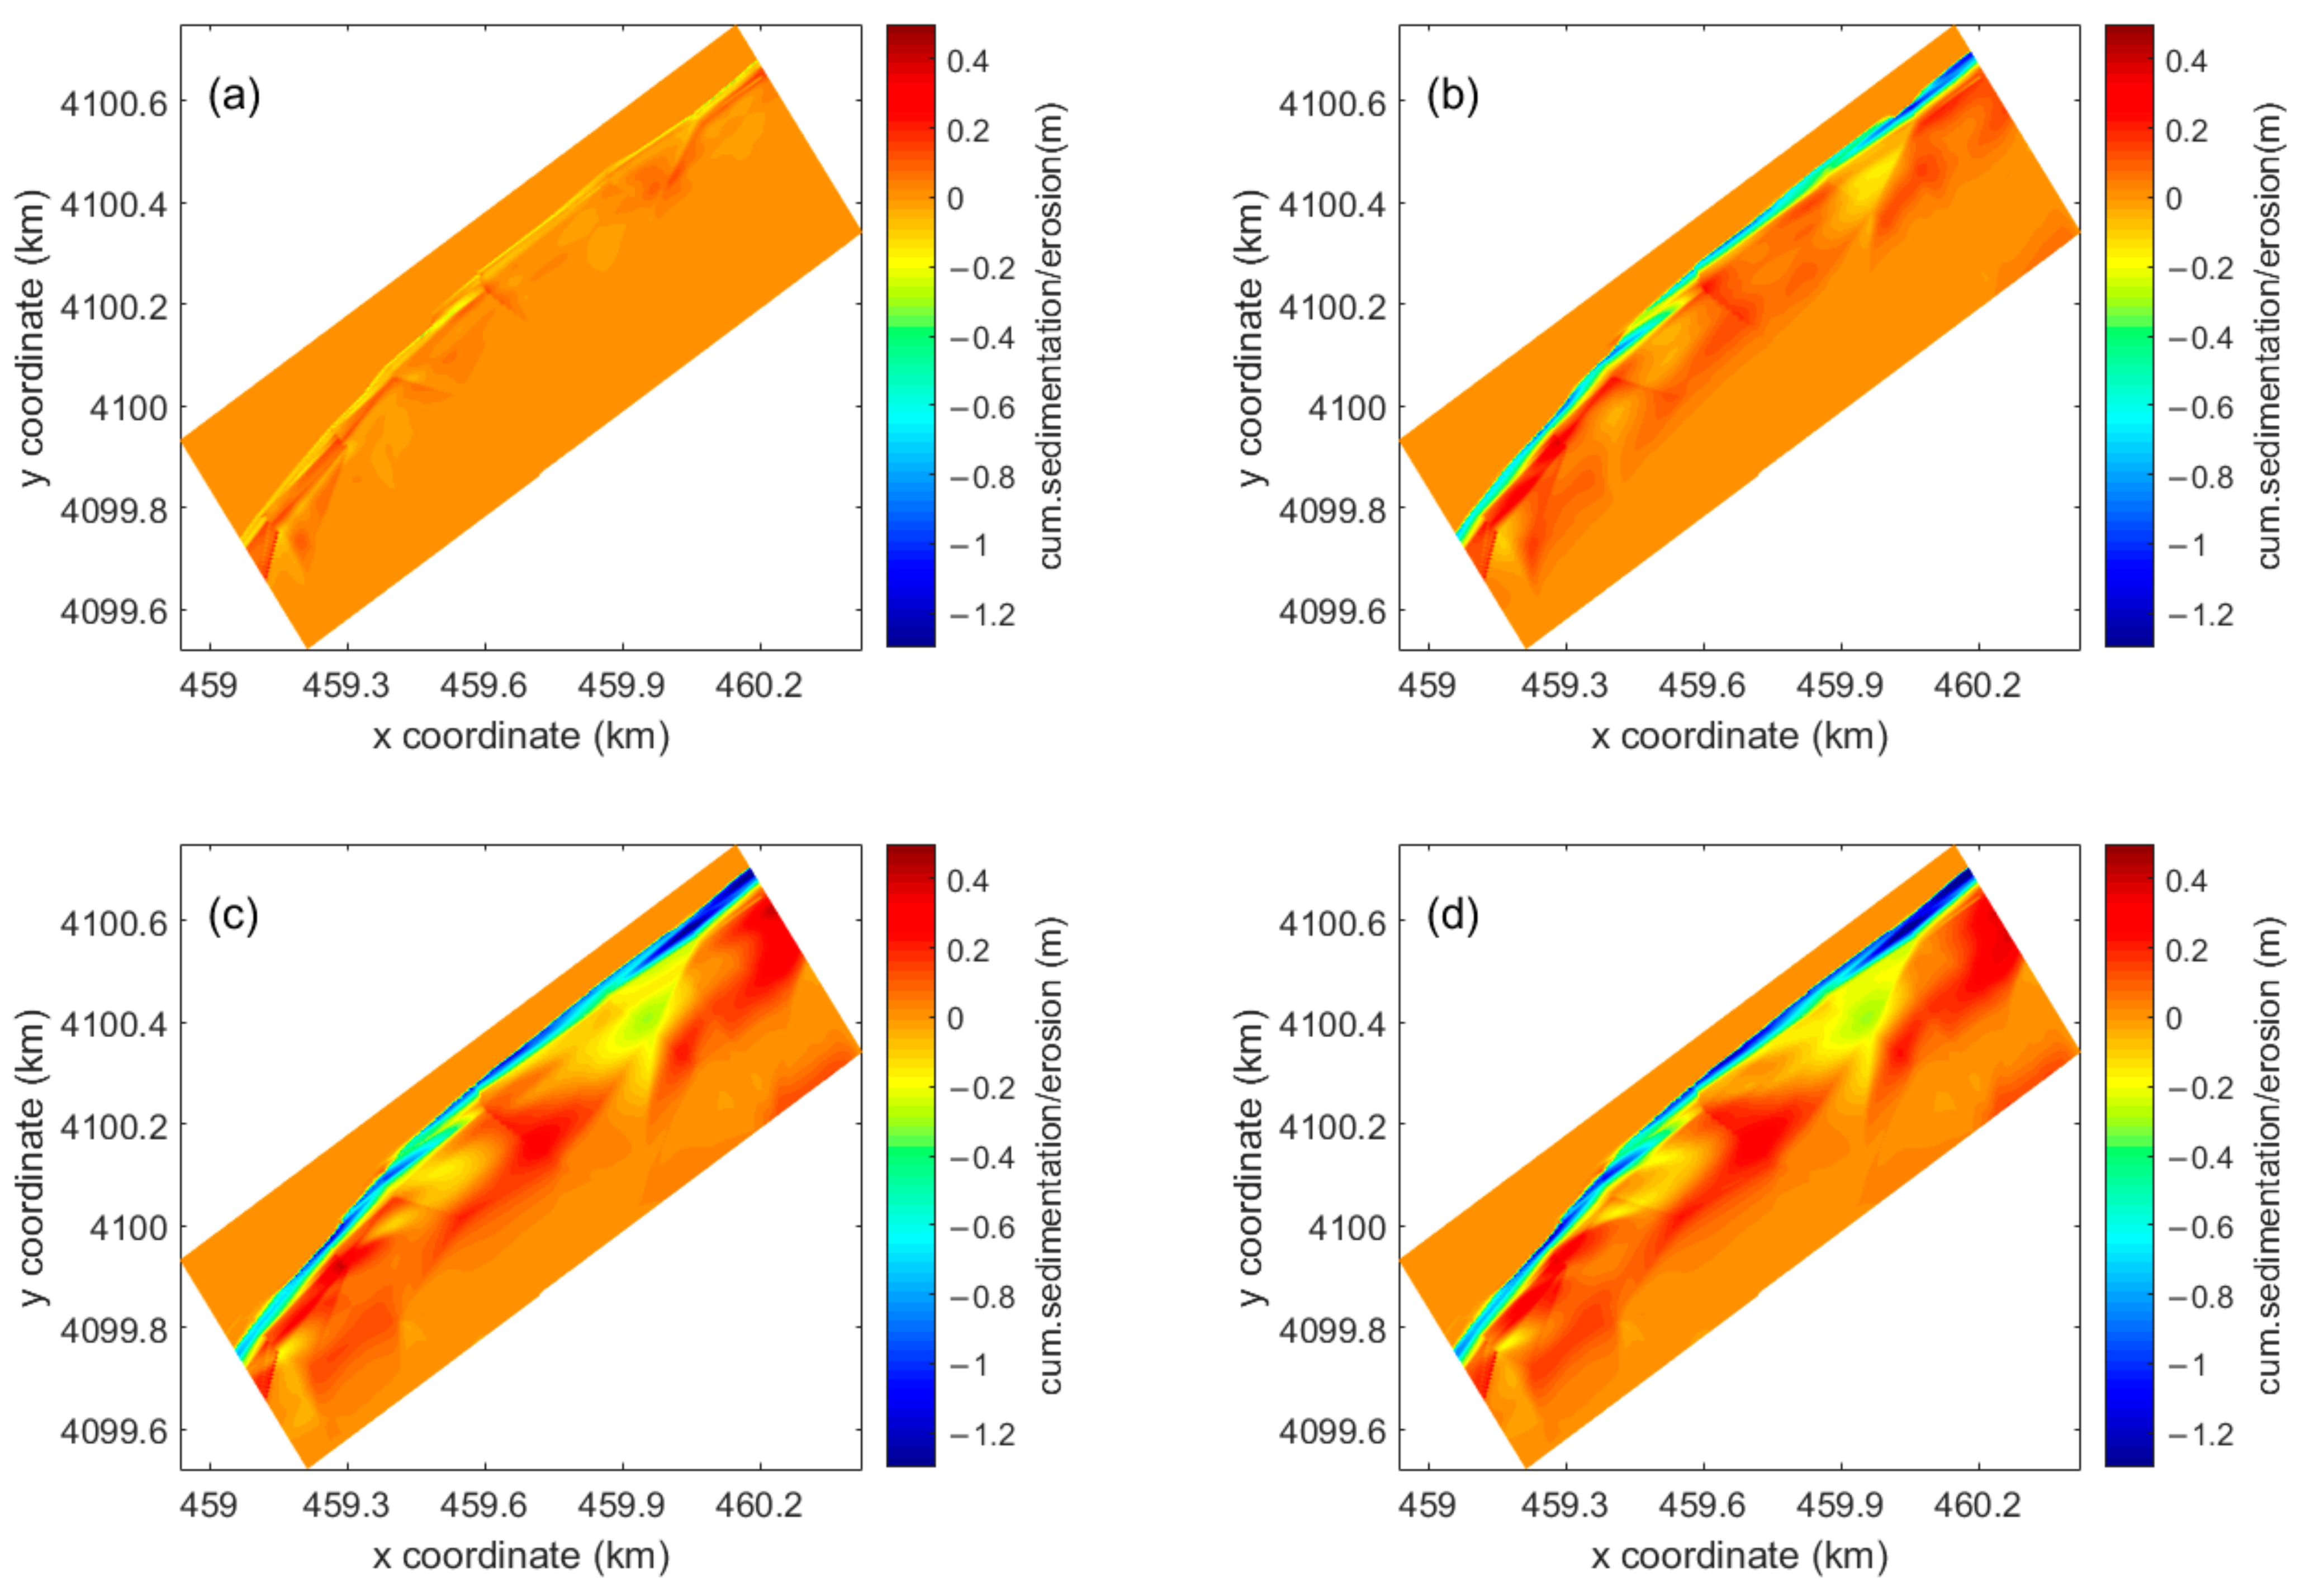
This paper compares and analyzes the simulated profiles and regional topographic changes in the above four moments (Figure 11 and Figure 12). During the first 1–9 h of simulation, the eroded sediment was transported downward and accumulated in the intertidal zone. The maximum erosion height was 0.35 m and the maximum deposition height was 0.25 m. At 24 h of simulation, the profile erosion intensified, the maximum erosion height increased to 0.85 m, and the accumulation continued towards the low tide zone in the lower part of the middle tide zone. The erosion–deposition boundary point also gradually moved downward with the change in wave height. At 48 h of simulation, the beach morphology changed significantly. The maximum erosion height increased to 1.2 m, and the maximum accumulation height was still approximately 0.4 m. The sediment that accumulated in the lower part of the intertidal zone was simultaneously transported by the sea current, resulting in no obvious increase in the accumulation height. At 72 h of simulation, the wave height gradually reached a stable state. The slope of the beach profiles became gentler, and there was no significant change in the beach height. The maximum erosion height was 1.3 m and the maximum accumulation height was still approximately 0.4 m.
Throughout the entire typhoon process, the basic evolution trend of each profile showed that the slope of the upper part of the intertidal zone gradually became steeper, and the slope of the middle and lower parts became much gentler. After the typhoon, each profile in the intertidal zone showed a certain angle, and at the end of simulation, each beach profile had an erosion length of approximately 50 m. The sediment accumulation length of the middle and lower parts of the intertidal zone and the nearshore sea area was larger than the erosion length of the upper part. The eroded sediment was continuously transported towards the sea, ultimately resulting in increased net erosion for each profile of the beach.
At the same time, the formula for calculating the unit width erosion and deposition (UED) [46] to represent the erosion and deposition of the beach profiles above the intertidal zone is as follows:
UED = X 0 X 1 Δ Z dX
where UED represents the unit width erosion and deposition volume; X 0 and X 1 represent horizontal coordinates of the farthest measurement position and starting measurement position in the profile; and X 1 represents the elevation difference at same horizontal coordinate. The UED values simulated at four moments for all the profiles and UED values measured after the typhoon are shown in Table 4 (positive values represent deposition and negative values represent erosion). As can be seen from the table, there are numerical differences between the UED values measured after the typhoon for each profile and the simulated UED values, but both the simulated UED values and measured values are negative, further indicating that the beach profiles are eroded to different degrees, which also indicates that eroded sediment is transported underwater by flow. The UED value change frequency of profiles P1–P5 gradually increases. For example, the UED value of profiles P4 and P5 in the 24 h simulation is close to −10 cm3. In Figure 11, it can also be seen that the erosion height is greater in the northeast part of the beach. According to the analysis of dune beach stability factors by researchers [47], beach profiles with wide shoulders and gentle slopes have better stability. Overall, the southwest shore beach has wide shoulders and gentle slopes; the northeast shore beach has a profile with almost no shoulders, steep slopes, and short shores, causing it to respond faster to typhoons with obvious erosion; thus, it should be given priority when setting protection measures. Combining Figure 7 with Table 3, we can see that during Typhoon Lekima, the periods before and after the wave height reaches the maximum value are key periods in which the regional beach profiles respond to typhoons. The magnitude of beach morphological changes in the later period after the typhoon is smaller than that in the early period before the typhoon.

4. Discussion

As can be seen in Figure 5, compared with the measured values, the elevation of the profile after the typhoon simulated using the XBeach model is generally consistent in terms of the erosion and deposition trends. The elevation differences between the simulated profiles and those measured after the typhoon may be due to sediment particle size. They may also be due to the low-intensity hydrodynamic effects that continuously change the profile elevation before the typhoon, which were not considered in the model [42]. Additionally, compared with post-typhoon measurement analysis, XBeach did not effectively simulate the small amount of deposition at the backshore of the beach shoulder after the typhoon. The default XBeach model does not consider sediment transport towards the shore. However, in shallow water areas, such as nearshore regions, breaker zones, and wave runup zones, sediment transport towards the shore caused by the nonlinear interaction of propagating waves can partially counterbalance the offshore sediment transport induced by bottom-induced backflow.
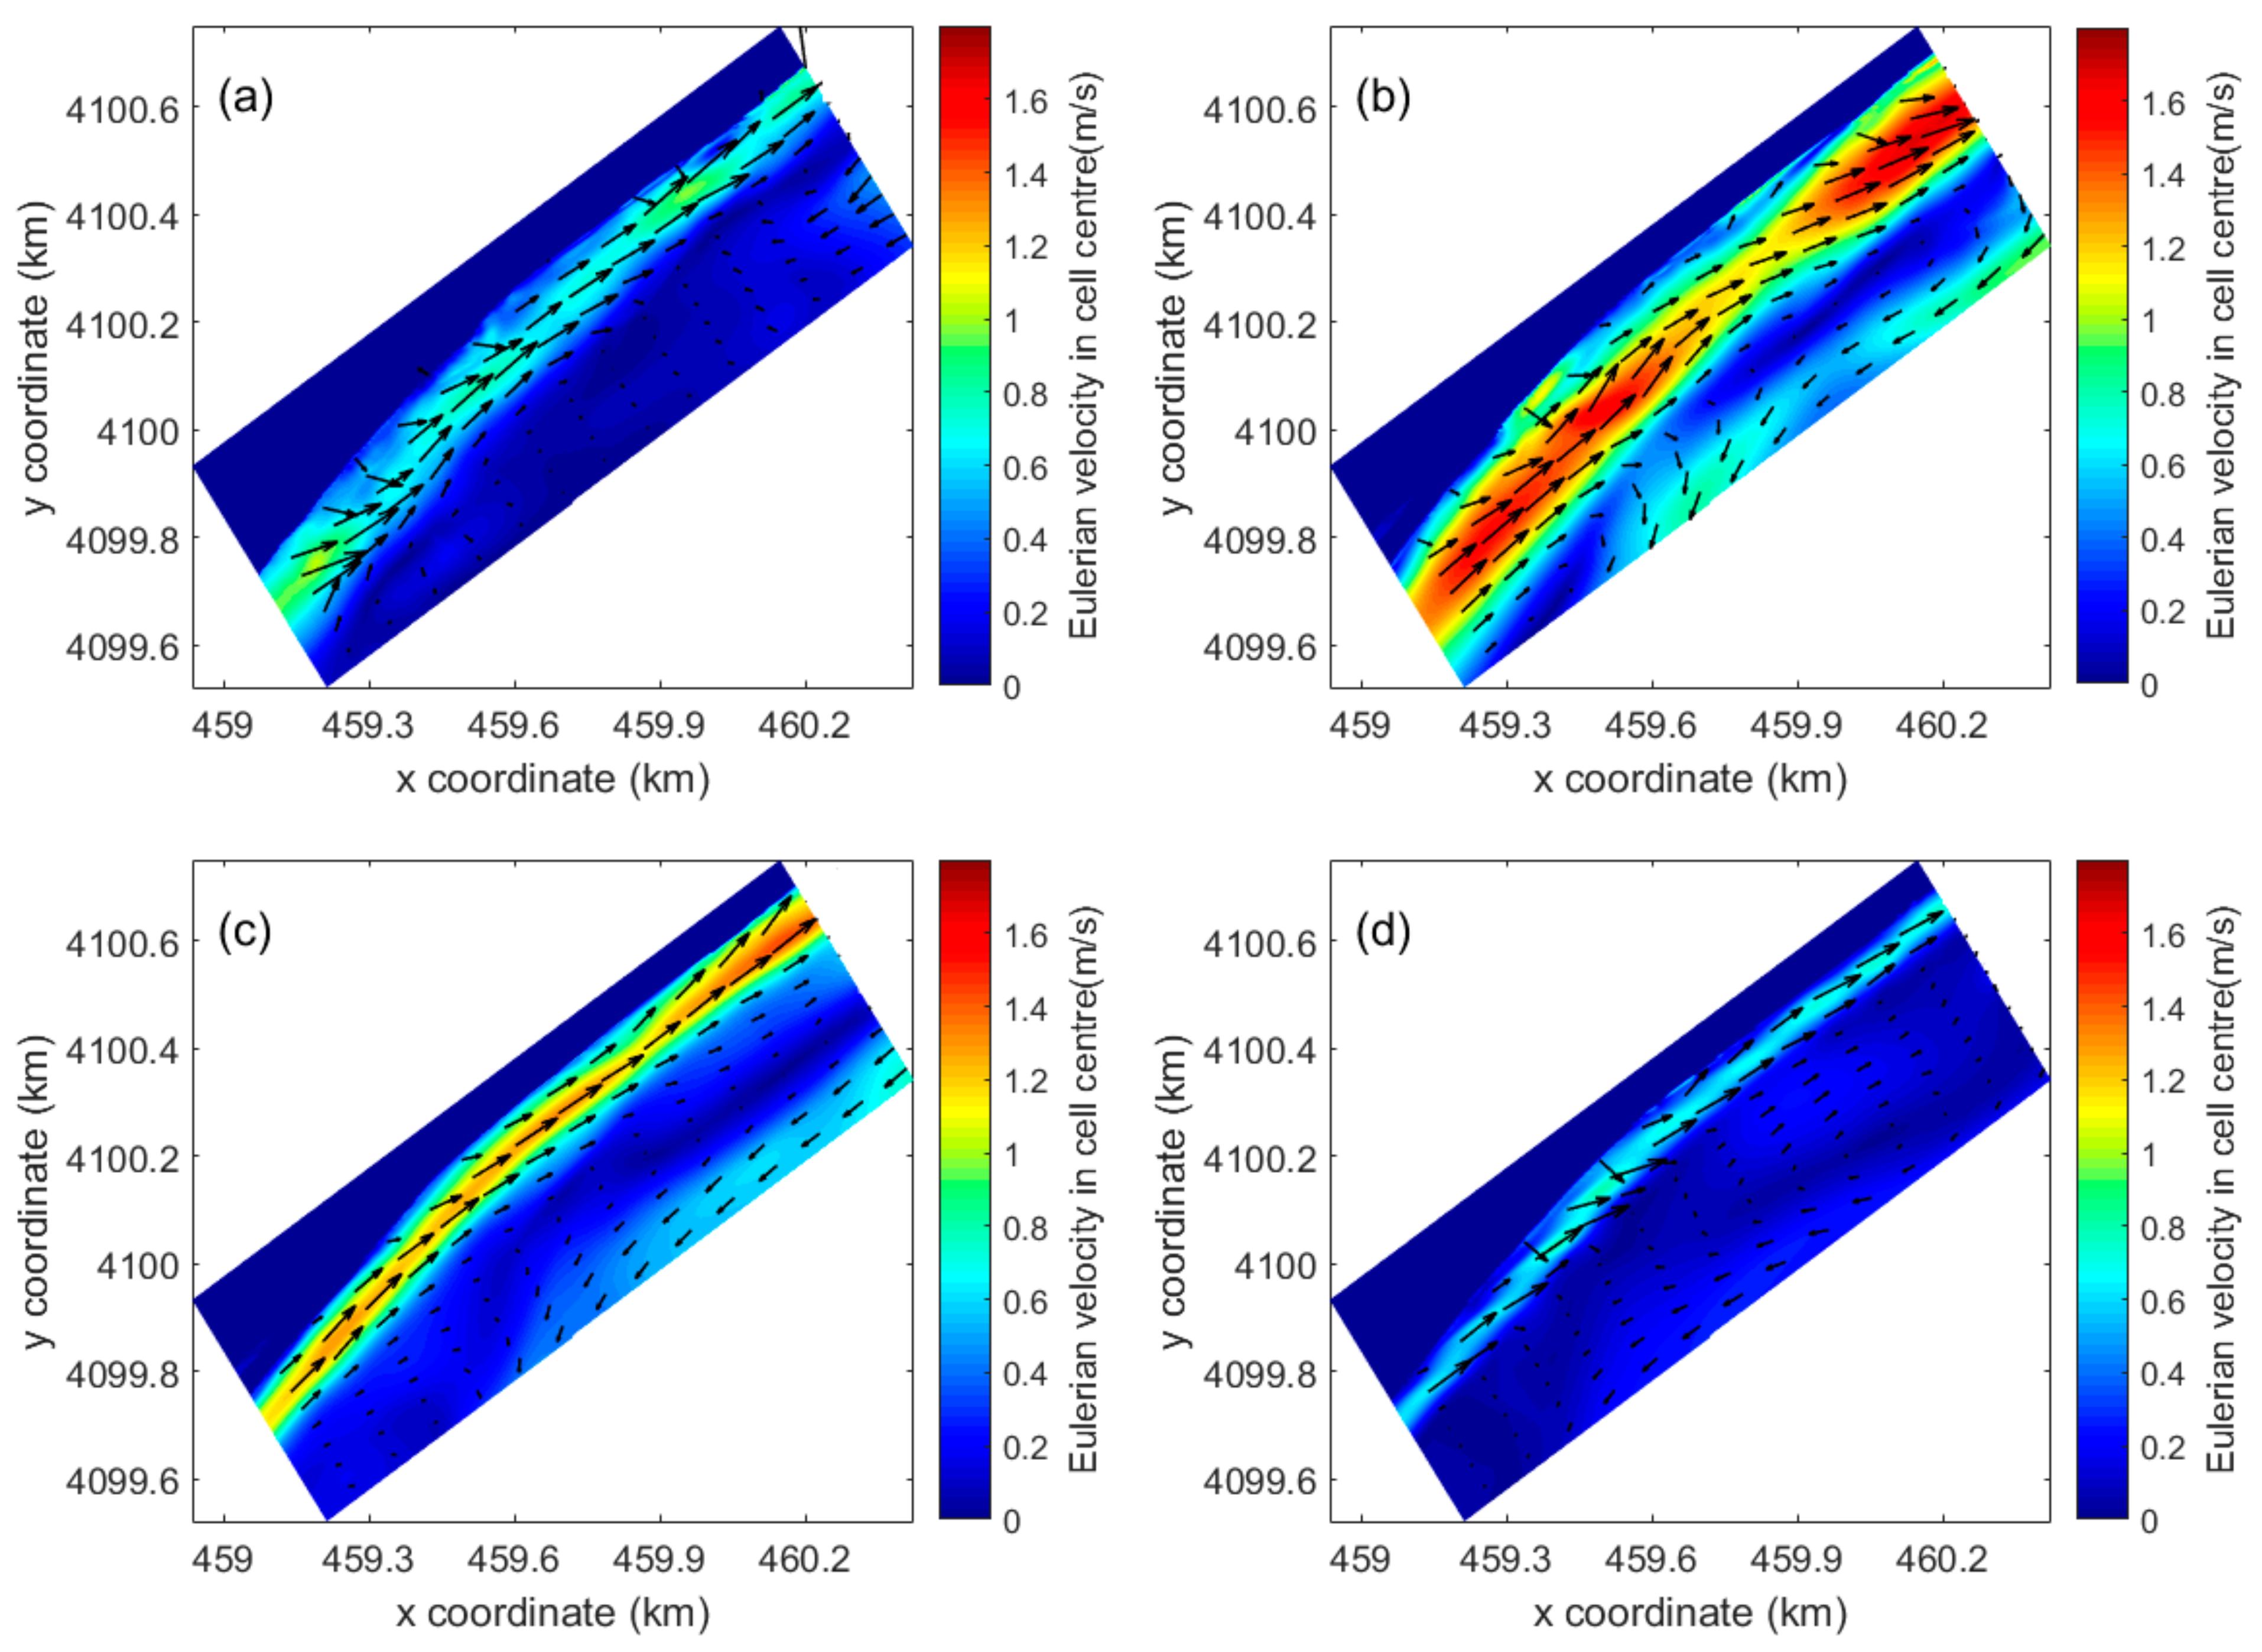
Chudao is situated on the right side of Typhoon Lekima’s forward direction. The typhoon speed and wind speed were superimposed, causing a larger wind force value on the right side of the moving path, resulting in an increased nearshore flow speed value. The flow field distribution simulated at the four moments is shown in Figure 13. During Typhoon Lekima, the wave direction in the Chudao sea area was from ESE to S, with the waves and shore beach angle formed gradually increasing from the southwest to the northeast. As can be seen in the figure, sediment transport along the shore is an important factor influencing the elevation changes of each profile.

5. Conclusions

This study utilized the XBeach numerical model to investigate and analyze the morphodynamics and nearshore hydrodynamic responses of Chudao South Beach during Typhoon Lekima. A GSA (Generalized Sensitivity Analysis) method was employed to determine the sensitivity of important model parameters, and parameter tuning was performed to address the limitations of the model’s simulation under certain conditions. The simulated numerical results show that during Typhoon Lekima, the water level near the shore of Chudao Beach significantly increased, and each profile was continuously in an erosive state. The overall erosion height of the beach area without beach shoulder profiles in the northeast of the research area was greater than that of the southwest side profiles, and the sediment transport along the coast was clear. The superimposition of the typhoon moving speed and wind speed resulted in a larger flow velocity near the shore of the research area. The research reported in this article can help researchers to understand the impacts of typhoons on beach topography and provides a useful reference for human societies to protect and manage beaches. The GSA method used in this study can also provide a reference for other commonly used numerical simulations. In future work, the GSA method could be used to perform combined analyses of different typhoons, profiles, and other factors. This would allow for the identification of parameter patterns under various conditions.

Author Contributions

Conceptualization, H.X. (Hao Xing) and H.S.; methodology, H.X. (Hao Xing) and H.S.; software, Z.Y.; validation, H.X. (Hao Xing), P.L. and L.Z.; formal analysis, H.X. (Hao Xing), P.L., L.Z. and H.X. (Huaiyuan Xue); investigation, H.X. (Huaiyuan Xue); writing—original draft preparation, H.X. (Hao Xing); writing—review and editing, H.S. and Z.Y. All authors have read and agreed to the published version of the manuscript.

Funding

This research was funded by the Major Research Grant (No. U1906231, U1806227) and the Natural Science Foundation of China (No. 51909114) from the Natural Science Foundation of China (NSFC).

Institutional Review Board Statement

Not applicable.

Informed Consent Statement

Not applicable.

Data Availability Statement

Data are available from the corresponding author upon reasonable request.

Conflicts of Interest

The authors declare no conflict of interest.

References

  1. Dominic, A.; O’Donoghue, T.; Ribberink, J.S. Measurements of sheet flow transport in acceleration-skewed oscillatory flow and comparison with practical formulations. Coast. Eng. 2010, 57, 331–342. [Google Scholar]
  2. Silva, P.A.; Abreu, T.; Dominic, A.V.D.A.; Sancho, F.; Ruessink, B.G.; Werf, J.V.D.; Ribberink, J.S. Sediment transport in nonlinear skewed oscillatory flows: Transkew experiments. J. Hydraul. Res. 2011, 49 (Suppl. S1), 72–80. [Google Scholar] [CrossRef]
  3. Daly, C.J. Low Frequency Waves in the Shoaling and Nearshore Zone. Civ. Eng. Geosci. 2009. Available online: http://resolver.tudelft.nl/uuid:035517dd-c0f0-4f58-afa5-8b1bc672fc5c (accessed on 1 May 2023).
  4. Van Thiel de Vries, J.S.M.; Gent, M.; Walstra, D.; Reniers, A. Analysis of dune erosion processes in large-scale flume experiments. Coast. Eng. 2008, 55, 1028–1040. [Google Scholar] [CrossRef]
  5. Karunarathna, H.; Pender, D.; Ranasinghe, R.; Short, A.D.; Reeve, D.E. The effects of storm clustering on beach profile variability. Mar. Geol. 2014, 348, 103–112. [Google Scholar] [CrossRef]
  6. D’Alessandro, F.; Tomasicchio, G.R. Wave–dune interaction and beach resilience in large-scale physical model tests. Coast. Eng. 2016, 116, 15–25. [Google Scholar] [CrossRef]
  7. Castelle, B.; Marieu, V.; Bujan, S.; Splinter, K.D.; Robinet, A.; Senechal, N.; Ferreira, S. Impact of the winter 2013–2014 series of severe Western Europe storms on a double-barred sandy coast: Beach and dune erosion and megacusp embayments. Geomorphology 2015, 238, 135–148. [Google Scholar] [CrossRef]
  8. Cai, F.; Su, X.Z.; Xia, D.X. Study on the diference between storm efects of beaches on two sides of the tropical cyclone track-taking the responses of beaches to No.0307 Typhoon Imbudo as an example. Adv. Mar. Sci. 2004, 22, 436–445. (In Chinese) [Google Scholar]
  9. Gent, M.; van Thiel de Vries, J.S.M.; Coeveld, E.M.; Vroeg, J.; Graaff, J. Large-scale dune erosion tests to study the influence of wave periods. Coast. Eng. 2008, 55, 1041–1051. [Google Scholar] [CrossRef]
  10. Burvingt, O.; Masselink, G.; Russell, P.; Scott, T. Classification of beach response to extreme storms. Geomorphology 2017, 295, 722–737. [Google Scholar] [CrossRef]
  11. Haerens, P.; Bolle, A.; Trouw, K.; Houthuys, R. Definition of storm thresholds for significant morphological change of the sandy beaches along the Belgian coastline. Geomorphology 2012, 143–144, 104–117. [Google Scholar] [CrossRef]
  12. Prodger, S.; Russell, P.; Davidson, M.; Miles, J.; Scott, T. Understanding and predicting the temporal variability of sediment grain size characteristics on high-energy beaches. Mar. Geol. 2016, 376, 109–117. [Google Scholar] [CrossRef]
  13. Loureiro, C.; Ferreira, Ó.; Cooper, J.A.G. Geologically constrained morphological variability and boundary effects on embayed beaches. Mar. Geol. 2012, 329–331, 1–15. [Google Scholar] [CrossRef]
  14. Zeybek, M. Accuracy assessment of direct georeferencing UAV images with onboard global navigation satellite system and comparison of CORS/RTK surveying methods. Meas. Sci. Technol. 2021, 32, 065402. [Google Scholar] [CrossRef]
  15. Angnuureng, D.B.; Almar, R.; Senechal, N.; Castelle, B.; Addo, K.A.; Marieu, V.; Ranasinghe, R. Shoreline resilience to individual storms and storm clusters on a meso-macrotidal barred beach. Geomorphology 2017, 290, 265–276. [Google Scholar] [CrossRef]
  16. Guo, J.; Shi, L.; Pan, S.; Ye, Q.; Chen, S. Monitoring and evaluation of sand nourishments on an embayed beach exposed to frequent storms in eastern China. Ocean. Coast. Manag. 2020, 195, 105284. [Google Scholar] [CrossRef]
  17. Bahari, N.A.A.B.S.; Ahmed, A.N.; Chong, K.L.; Lai, V.; Huang, Y.F.; Koo, C.H.; Ng, J.L.; El-Shafe, A. Predicting Sea Level Rise Using Artificial Intelligence: A Review. Arch. Comput. Methods Eng. 2023, 1–18. [Google Scholar] [CrossRef]
  18. Almubaidin, M.A.A.; Ahmed, A.N.; Sidek, L.B.M.; Elshafie, A. Using Metaheuristics Algorithms (MHAs) to Optimize Water Supply Operation in Reservoirs: A Review. Arch. Comput. Methods Eng. 2022, 29, 3677–3711. [Google Scholar] [CrossRef]
  19. Hanoon, M.S.; Abdulhadi, A.B.A.; Ahmed, A.N.; Razzaq, A.; Birima, A.H.; El-Shafie, A. A comparison of various machine learning approaches performance for prediction suspended sediment load of river systems: A case study in Malaysia. Earth Sci. Inform. 2022, 15, 91–104. [Google Scholar] [CrossRef]
  20. Van Duin, M.J.P.; Wiersma, N.R.; Walstra, D.J.R.; van Rijn, L.C.; Stive, M.J.F. Nourishing The Shoreface:Observations And Hindcasting Of The Egmond Case, The Netherlands. Coast. Eng. 2004, 51, 813–837. [Google Scholar] [CrossRef]
  21. Brakenhoff, L.; Schrijvershof, R.; Werf, J.; Grasmeijer, B.; Ruessink, G.; Vegt, M. From Ripples to Large-Scale Sand Transport: The Effects of Bedform-Related Roughness on Hydrodynamics and Sediment Transport Patterns in Delft3D. J. Mar. Sci. Eng. 2020, 8, 892. [Google Scholar] [CrossRef]
  22. Grunnet, N.M.; Walstra, D.; Ruessink, B.G. Process-Based Modelling of A Shoreface Nourishment. Coast. Eng. 2004, 51, 581–607. [Google Scholar] [CrossRef]
  23. Van Wesenbeeck, B.; van Ormondt, M.; Tonnon, P.K. Model Development for the Design of A Sand Engine. Deltares 2008. [Google Scholar]
  24. Vellinga, P. Beach and dune erosion during storm surges—Reply. Coast. Eng. 1984, 8, 191–192. [Google Scholar] [CrossRef]
  25. Mickey, R.C.; Dalyander, P.S.; Mccall, R.; Passeri, D.L. Sensitivity of Storm Response to Antecedent Topography in the XBeach Model. J. Mar. Sci. Eng. 2020, 8, 829. [Google Scholar] [CrossRef]
  26. Kombiadou, K.; Costas, S.; Roelvink, D. Simulating Destructive and Constructive Morphodynamic Processes in Steep Beaches. J. Mar. Sci. Eng. 2021, 9, 86. [Google Scholar] [CrossRef]
  27. McCall, R.T.; Van Thiel de Vries, J.S.M.; Plant, N.G.; Van Dongeren, A.R.; Roelvink, J.A.; Thompson, D.M.; Reniers, A.J.H.M. Two-dimensional time dependent hurricane overwash and erosion modeling at Santa Rosa Island. Coast. Eng. 2010, 57, 668–683. [Google Scholar] [CrossRef]
  28. Rijn, L.C.V.; Walstra, D.J.R.; Grasmeijer, B.; Sutherland, J.; Pan, S.; Sierra, J.P. The predictability of cross-shore bed evolution of sandy beaches at the time scale of storms and seasons using process-based Profile models. Coast. Eng. 2003, 47, 295–327. [Google Scholar] [CrossRef]
  29. Dongeren, A.V.; Lowe, R.; Pomeroy, A.; Trang, D.M.; Roelvink, D.; Symonds, G.; Ranasinghe, R. Numerical modeling of low-frequency wave dynamics over a fringing coral reef. Coast. Eng. 2013, 73, 178–190. [Google Scholar] [CrossRef]
  30. Yin, K.; Xu, S.; Huang, W.; Liu, S.; Li, M. Numerical investigation of wave attenuation by coupled flexible vegetation dynamic model and XBeach wave model. Ocean. Eng. 2021, 235, 109357. [Google Scholar] [CrossRef]
  31. Almstrm, B.; Roelvink, D.; Larson, M. Predicting ship waves in sheltered waterways—An application of XBeach to the Stockholm Archipelago, Sweden. Coast. Eng. 2021, 170, 104026. [Google Scholar] [CrossRef]
  32. Matheen, N.; Harley, M.D.; Turner, I.L.; Splinter, K.D.; Simmons, J.A.; Thran, M.C. Bathymetric Data Requirements for Operational Coastal Erosion Forecasting Using XBeach. J. Mar. Sci. Eng. 2021, 9, 1053. [Google Scholar] [CrossRef]
  33. Zheng, H.; Zhang, Y.; Wang, Y.; Zhang, L.; Li, A. Characteristics of Atmospheric Kinetic Energy Spectra during the Intensification of Typhoon Lekima (2019). Appl. Sci. 2020, 10, 6029. [Google Scholar] [CrossRef]
  34. Roelvink, D.; Reniers, A.; Dongeren, A.V.; Vries, J.; Mccall, R.; Lescinski, J. Modelling storm impacts on beaches, dunes and barrier islands. Coast. Eng. 2009, 56, 1133–1152. [Google Scholar] [CrossRef]
  35. Mccarroll, R.J.; Masselink, G.; Valiente, N.G.; King, E.V.; Wiggins, M. An XBeach derived parametric expression for headland bypassing. Coast. Eng. 2021, 165, 103860. [Google Scholar] [CrossRef]
  36. Batchelor, G.K. An Introduction to Fluid Dynamics; Cambridge University Press: Cambridge, UK, 2000. [Google Scholar]
  37. Andrews, D.; Mcintyre, M. An exact theory of nonlinear waves on a Lagrangian-mean flow. J. Fluid. Mech. 1978, 89, 609–646. [Google Scholar] [CrossRef]
  38. Galappatti, G.; Vreugdenhil, C. A depth-integrated model for suspended sediment transport. J. Hydraul. Res. 1985, 23, 359–377. [Google Scholar] [CrossRef]
  39. Reniers, A.; Macmahan, J.H.; Thornton, E.B.; Stanton, T.P. Modelling Infragravity Motions on A Rip-Channel Beach. Coast. Eng. 2006, 53, 209–222. [Google Scholar] [CrossRef]
  40. Spear, R.C.; Hornberger, G.M. Eutrophication in peel inlet—II. Identification of critical uncertainties via generalized sensitivity analysis. Water Res. 1980, 14, 43–49. [Google Scholar] [CrossRef]
  41. Lahiri, K.; Liu, Y. Asymptotic Variance of Brier (Skill) Score in the Presence of Serial Correlation. In CESifo Working Paper Series; Elsevier: Amsterdam, The Netherlands, 2015. [Google Scholar]
  42. Liu, X.; Kuang, C.; Huang, S.; Dong, W. Modelling morphodynamic responses of a natural embayed beach to Typhoon Lekima encountering different tide types. Anthr. Coasts 2022, 5, 4–15. [Google Scholar] [CrossRef]
  43. Beven, K.; Binley, A. The future of distributed models: Model calibration and uncertainty prediction. Hydrol. Proc. 1992, 6, 279–298. [Google Scholar] [CrossRef]
  44. Simmons, J.A.; Harley, M.D.; Marshall, L.A.; Turner, A.L.; Splinter, K.D.; Cox, R.J. Calibrating and assessing uncertainty in coastal numerical models. Coast. Eng. 2017, 125, 28–41. [Google Scholar] [CrossRef]
  45. Sallenger, A.H. Storm Impact Scale for Barrier Islands. J. Coast. Res. 2000, 16, 890–895. [Google Scholar]
  46. Qi, H.; Cai, F.; Lei, G.; Cao, H.; Shi, F. The response of three main beach types to tropical storms in South China. Mar. Geol. 2010, 275, 244–254. [Google Scholar] [CrossRef]
  47. You, Z.J.; Ji, Z.Z. Data collection and simulation of coastal erosion disaster in NSW, Australia//China Ocean Engineering Society. In Proceedings of the 17th China Ocean (Coastal) Engineering Symposium (Part I); China Ocean Press: Beijing, China, 2015; pp. 402–407. [Google Scholar]
Figure 1. The tracking of typhoon “Lekima’s” path.
Jmse 11 01156 g001
Figure 2. Study area (the profiles selected for this study are referred to as P1–P5).
Jmse 11 01156 g002
Figure 3. Tidal and wave elements during Typhoon Lekima.
Jmse 11 01156 g003
Figure 4. The grid and bed level of the study area. (a) shows the model grid, while (b) shows the bed level and the analysis area.
Jmse 11 01156 g004
Figure 5. The cumulative likelihood function distribution and the assumed cumulative uniform function distribution of the four parameters. A significant disparity between the cumulative distribution function (CDF) of the observed behavior and that of a uniform distribution indicates that the model is highly sensitive to the parameter.
Jmse 11 01156 g005
Figure 6. Multiple particle size collection results (D50 and D90).
Jmse 11 01156 g006
Figure 7. Measurement and calculation verification of the five profiles.
Jmse 11 01156 g007
Figure 8. Water level and significant wave height at four moments in profile P3.
Jmse 11 01156 g008
Figure 9. The average water level and average wave height for four time points and five profiles.
Jmse 11 01156 g009
Figure 10. Calculation of the wave runup value of then five profiles for each time point.
Jmse 11 01156 g010
Figure 11. Changes in beach profiles at four moments.
Jmse 11 01156 g011
Figure 12. Regional scour and silting height distribution at four moments. (ad) respectively represent the distribution of scour and deposition height at the 9th, 24th, 48th, and 72nd hour in the simulation. Positive values in the figure represent deposition, and negative values represent erosion.
Jmse 11 01156 g012
Figure 13. Flow field distribution at four moments. (ad) respectively represent the flow field distribution at the 9th, 24th, 48th, and 72nd h in the simulation.
Jmse 11 01156 g013
Table 1. BSS evaluation value range and the prediction effects represented.
BSS Value RangePrediction Effect
1~0.8Good
0.8~0.6Preferable
0.6~0.3Reasonable
0.3~0Not good
<0Difference
Table 3. Determination of the beach response state.
Height-Value RelationBeach Response State
R high < B low scouring
R high < B high erosion
R high > B high , R low < B high overwash
R high > B high , R low > B high breaching
Table 4. Unit erosional deformation of profiles (in the table, positive values represent net intertidal deposition and negative values represent net erosion).
TimeP1P2P3P4P5
UED (m3)UED (m3)UED (m3)UED (m3)UED (m3)
9 h1.030.61−0.42−1.650.82
24 h−5.11−3.83−6.95−9.34−9.32
48 h−12.57−8.80−19.25−14.93−19.21
Simulation 72 h−14.50−8.71−21.62−16.79−20.75
Measured 72 h−12.46−13.40−18.71−15.47−18.45
Disclaimer/Publisher’s Note: The statements, opinions and data contained in all publications are solely those of the individual author(s) and contributor(s) and not of MDPI and/or the editor(s). MDPI and/or the editor(s) disclaim responsibility for any injury to people or property resulting from any ideas, methods, instructions or products referred to in the content.