Abstract
Marine emission policies are becoming more demanding; thus, ship propulsion and power generation technologies need to be adapted to current scenarios. LNG is already considered to be a transition fuel, and new alternative marine fuels are emerging. The aim of this study was to develop an innovative methodology to optimize and adapt the combustion system of an LNG internal combustion marine engine to burn alternative marine fuels. The present study was based on LBG, but the methodology could be replicated with other fuels. A total of six tests were carried out, with three prechamber designs and three spark plug designs. Each test was carried out in a single-cylinder engine with two types of high-methane-number fuel. The influence on thermal efficiency parameters such as the prechamber volume, the orientation of the flame holes, and the existence of a central hole was studied. In the case of the spark plug, the influence of the amount of precious metal in the electrode, its shape and its insertion into the prechamber were analysed. Experiments showed that by modifying both the prechamber and the spark plug, maximum improvements in thermal efficiency of 1.9% can be achieved. Those improvements allowed the LBG engine to suffer only a 4.3% thermal efficiency reduction, as opposed to its LNG counterpart. By applying the proposed methodology, the thermal efficiency of commercially available internal combustion gas engines could be improved.
1. Introduction
The usage of fossil fuels, particularly heavy fuel oil (HFO) and marine gas oil, dominates maritime transport, which accounts for more than 80% of world trade by volume [1]. Thus, there is a global concern and need to lessen the environmental and climate impact of shipping, especially focusing on the associated emissions of greenhouse gas (GHG), nitrogen oxide (NOx), and sulphur oxide (SOx). According to the most recent International Maritime Organization’s (IMO) strategy, international shipping’s total yearly GHG emissions should be at least 50% lower by 2050 than they were in 2008. By 2050, the European Union (EU) hopes to have cut annual shipping-related CO2 emissions by at least 40% from 2005 levels [1].
The utilization of cleaner alternative marine fuels with lower CO2 emissions than conventional fuels must be combined with the adoption of energy-efficiency measures to accomplish these CO2 emission reductions [1]. Additionally, this may result in decreases in NOx, SOx, and particulate matter (PM) (all of which are restricted in specific emission control regions).
There is a wide range of potential substitute marine fuels, for instance, liquefied natural gas (LNG), liquefied biogas (LBG), liquefied petroleum gas (LPG), methanol, hydrogen, hydrotreated vegetable oil (HVO), ethanol, ammonia, fuel cells, nuclear power, wind power, solar power, electricity etc. [2]
Amongst all those options, only gaseous/liquid fuels that are subject to use in internal combustion engines will be considered during the present study. However, these fuels’ potential for maritime propulsion is affected by their performance and other factors such as infrastructure, availability, cost, and environmental effect.
Alternative fuels are becoming more and more competitive with respect to oil-based fuels on a global scale. There is no doubt that LNG is the most prevalent fuel substitute for marine bunker oil. Boil-off gas from LNG cargoes has been burnable by LNG tankers for more than 50 years. The introduction of dual-fuel engines in the early 2000s allowed significant fuel savings over conventional turbines [3].
Nonetheless, emissions policies are becoming more stringent and alternatives to LNG must be found. Indeed, according to Brynolf, S et al. [4] using LNG has an equivalent impact on climate change to heavy fuel oil, LBG and biomethanol being the only fuels studied that propose a tangible reduction on climate impact.
Further to this, Bigili [5] compares and evaluates the life cycle environmental damage of eight alternative marine fuels. The results focused on the effects on human health, ecosystem, resource utilization, emission inventory, and social costs, considering not only the operating conditions but also the production process. The study concluded that LBG was the best fuel in the short, medium, and long term in terms of sustainability.
Given the above, even if the methodology proposed would be replicable for any kind of gaseous marine fuel, tests to optimize an LNG engine to burn alternative fuels will be conducted by burning biogas.
It is noteworthy that according to estimates, biomass feedstock has a significant value that can meet the energy requirements of the maritime industry. However, the cost of producing biomethane is substantial, being two to four times more expensive than natural gas [6]. Due to this fact, researchers are making efforts to simplify the business process while decreasing costs as much as possible [7].
In small and medium-sized LNG engines (<160 mm diameter piston) the “open chamber” system is the most common ignition system. In these systems, the air–fuel mixture in the combustion chamber is ignited by an electric spark generated between the electrodes of a spark plug inside the combustion chamber. The spark is produced by an increase in voltage supplied by the engine ignition system, specifically by self-induction in a high-voltage coil. The operating temperature of the spark plug is the key parameter in the spark plug’s service life: generally, the higher the operating temperature is, the shorter the operating hours. This temperature must be low enough to prevent pre-ignition or detonation, but high enough to prevent carbonisation of the mixture and oil in the combustion chamber. The most important factors determining the spark plug’s operating temperature are the combustion chamber’s shape, the AFR (air-to-fuel ratio), the spark plug cooling and the compression ratio (CR).
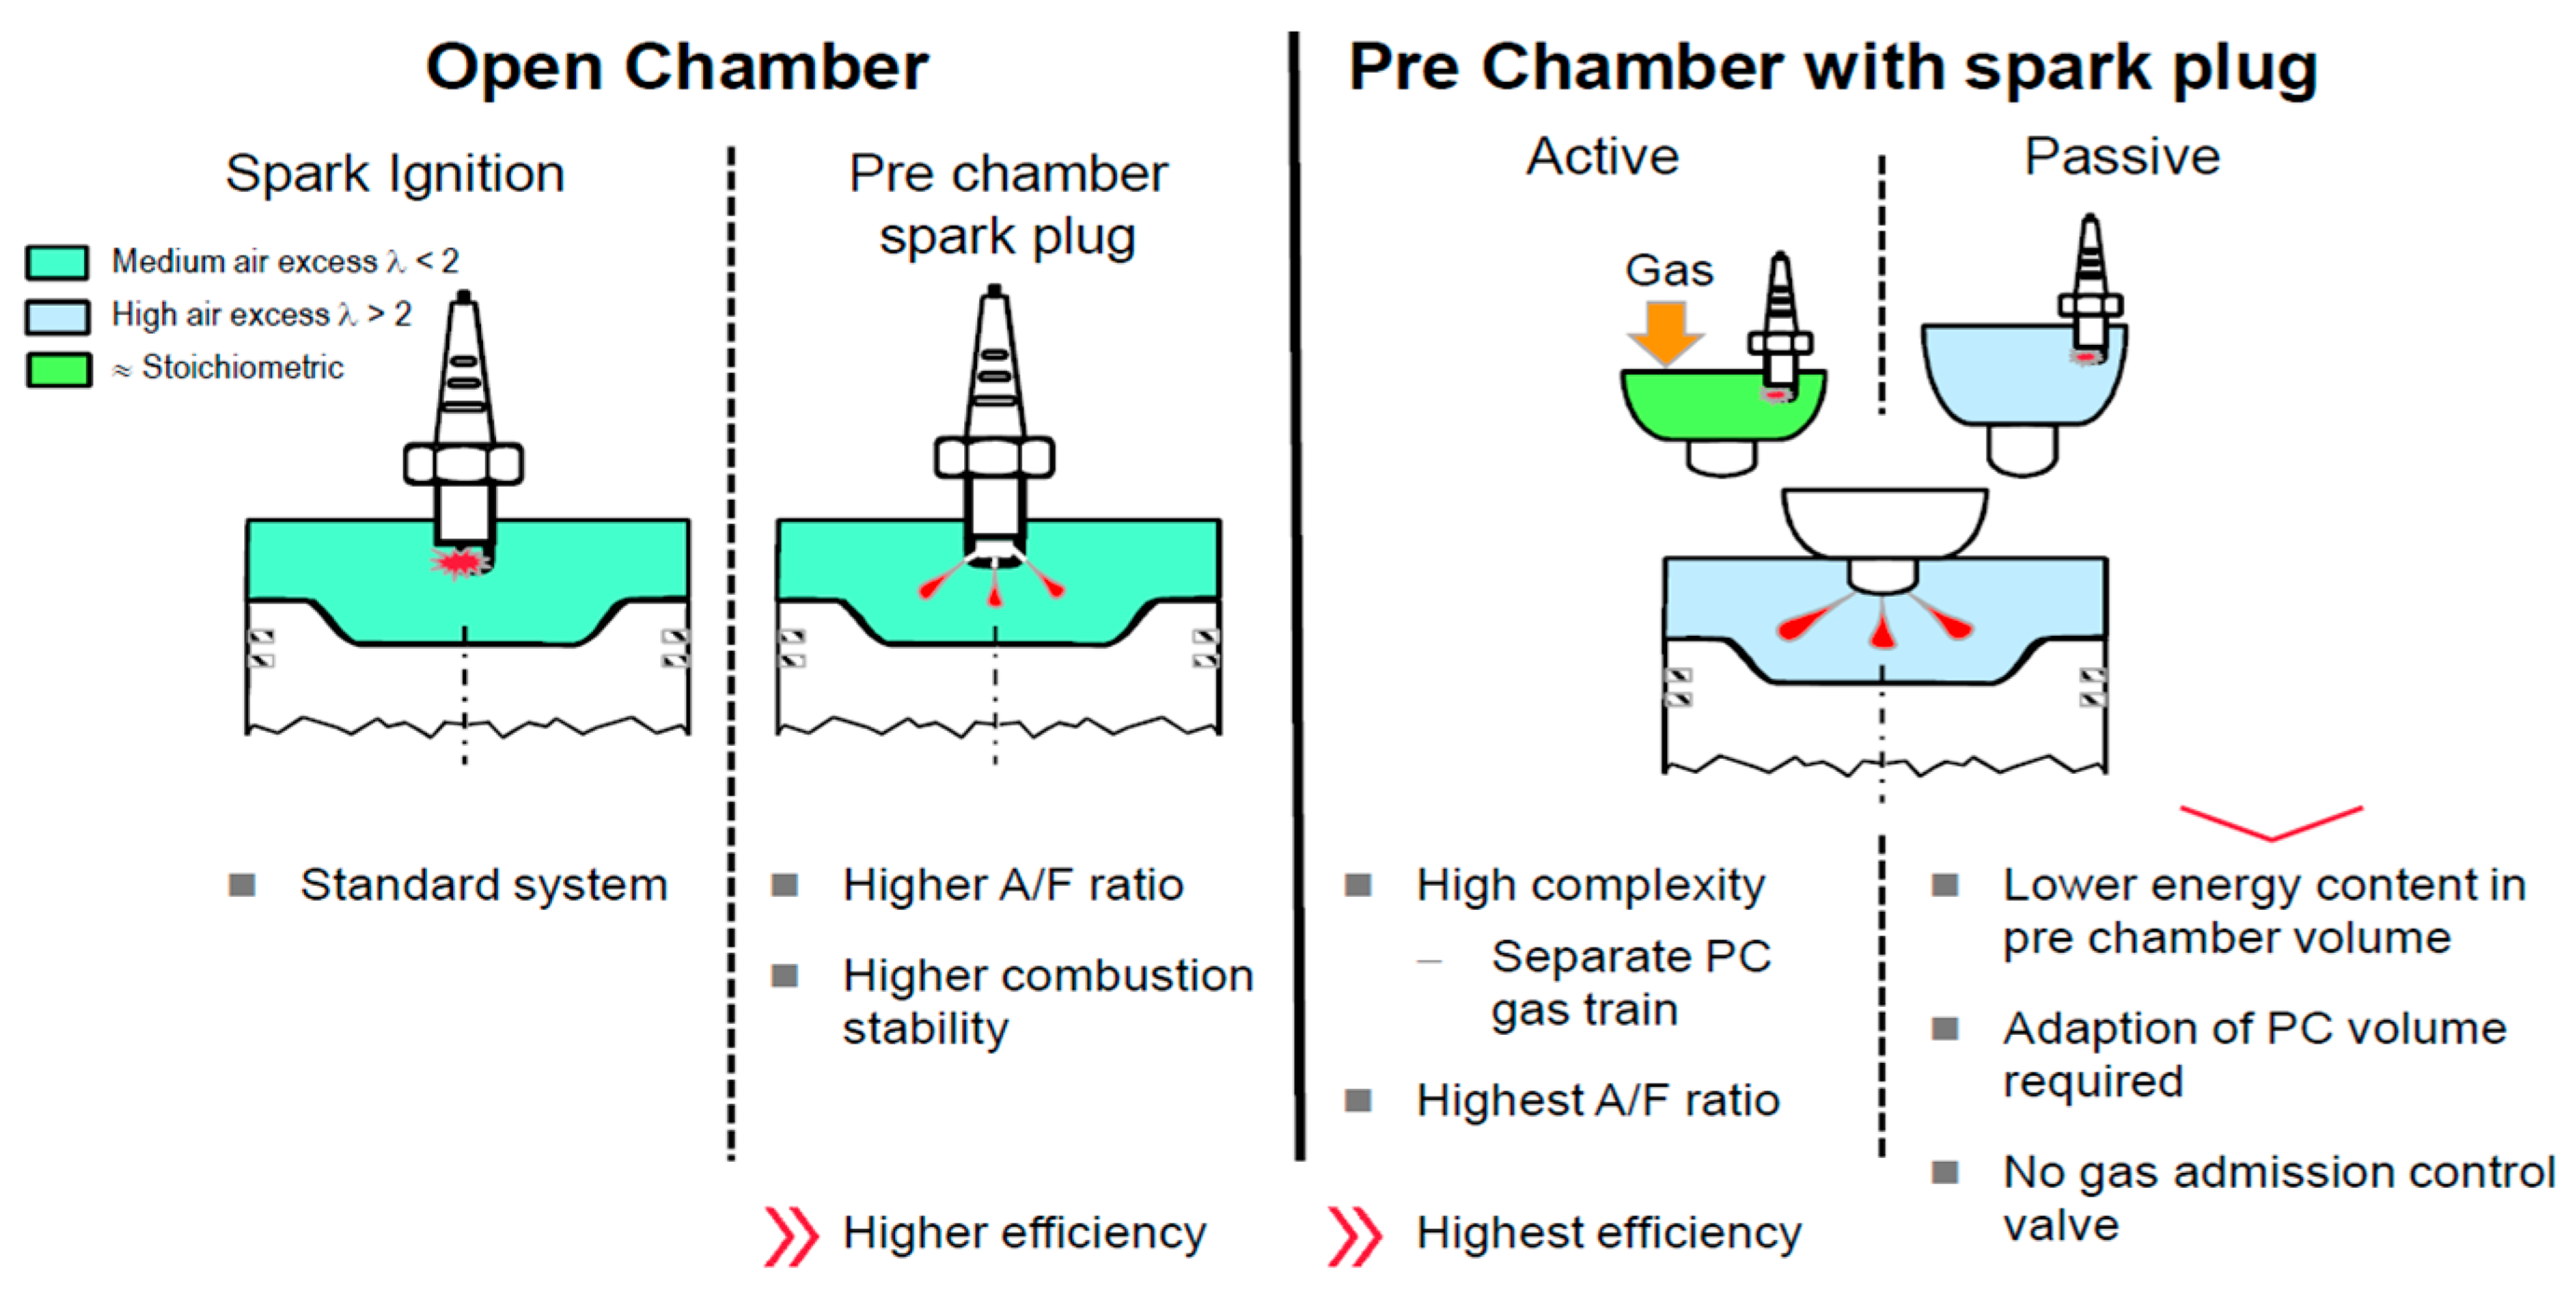
A diagram of the main ignition systems that are used in lean-burn engines is shown in Figure 1. Within the open-chamber systems, the single-spark ignition (see the figure) described in the previous paragraphs is the cheapest and simplest option. It has several advantages in terms of maintenance and robustness, but does not allow operation at an AFR > 2. This system can be improved with the “prechamber spark plug” version, in which the spark plug ignites the mixture introduced into a small cavity within the spark plug structure itself while the torches exit forcefully through holes, penetrating into the combustion chamber and igniting the mixture. This results in faster and more stable combustion, and slightly higher AFR values can be achieved [8].
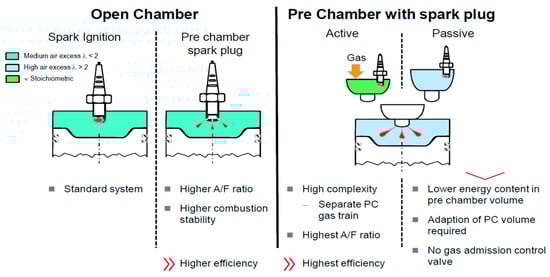
Figure 1.
Most common combustion systems in lean-burn engines [9].
The second option includes a prechamber in addition to the main combustion chamber (right side of Figure 1), and is typically used in engines with power ratings greater than 2 MW (larger pistons, larger diameter, requires stronger torches). The spark plug is placed in the prechamber and the prechamber may be active, i.e., a chamber into which gas is injected, or it may be passive, i.e., without injection, in which case the same mixture present in the combustion chamber is introduced into the prechamber [10,11]. In the first case, pure gas is introduced into the prechamber so that when the spark is generated, the inside of the prechamber contains an AFR close to the stoichiometric AFR. This generates very-high-energy torches that penetrate the main combustion chamber and are capable of igniting very lean mixtures of AFR > 2 efficiently [12].
The active prechamber system has demonstrated the highest efficiencies for lean-burn engines operating at high AFR and with low emission levels of NOx, CO and THC (total hydrocarbons), so it is the perfect choice for a power generation market that has to cope with increasingly stringent emission limits [13]. The stability of the combustion process developed with this system is due to the fact that it is an extremely efficient ignition system, i.e., the torches coming from the prechamber can ignite mixtures with more than 2 AFR, which enables the increase in compression ratio, timing and efficiency. This also allows designing a combustion chamber without excessive turbulence, which increases its thermal efficiency by reducing heat transfer to the cooling system [14,15]. Depending on the location, the engine must be equipped with an injection system that basically consists of a gas compressor, a distribution rail, an electronic gas flow regulator and a set of vent valves.
However, the active prechamber, commonly referred to as “injected,” has three major drawbacks. The first is the cost of implementing the injection system (compressor, rail, regulator, valves, etc.), which increases engine’s complexity and initial cost. The second is the reduced robustness of the engine due to the sensitivity of the parts and the maintenance guidelines set for them to ensure proper operation, which also increases the engine’s operating cost and decreases its availability [16]. In particular, valves require short maintenance intervals due to valve seat wear and tear and fouling from combustion deposits (see Figure 2), which directly affect engine availability. A malfunction of this part can lead to loss of injection flow control and control of torch power, resulting in engine trips due to detonation or instability. The third drawback is the increase in the temperature of the spark plug electrode compared to an open-chamber configuration [17].
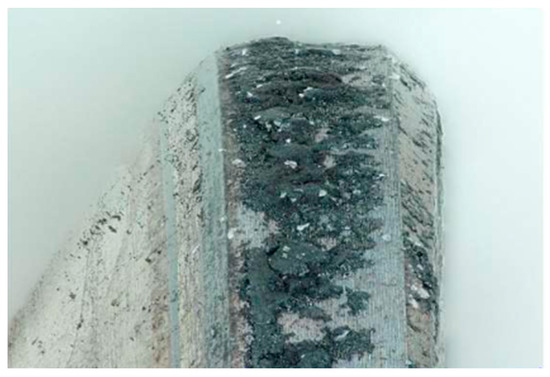
Figure 2.
Accumulation of combustion waste in the check valves.
A passive prechamber would be the alternative to an active prechamber. In the former, there is no separate injection, and only charge from the main chamber is introduced. Therefore, it does not require an injection system and is cheaper in terms of initial investment (CAPEX—capital expenditure) and costs associated with engine maintenance and operation (OPEX—operational expenditure) [18]. However, the fact that there is no injection of a rich mixture into the prechamber means a clear loss of energy in the flames that must ignite the mixture and create stable combustion. Passive prechambers also present greater firing problems (renovation of combustion gases with new air–fuel mixture between two combustion cycles) due to the lack of injection. In active prechambers, the gas injection takes place at a higher pressure than the pressure at the time in the prechamber so that combustion gases can be emptied out. Overall, it must be said that passive prechambers generate a lower energy content in the prechamber and therefore have disadvantages in terms of combustion efficiency and stability, especially when operating with low NOx emissions [18].
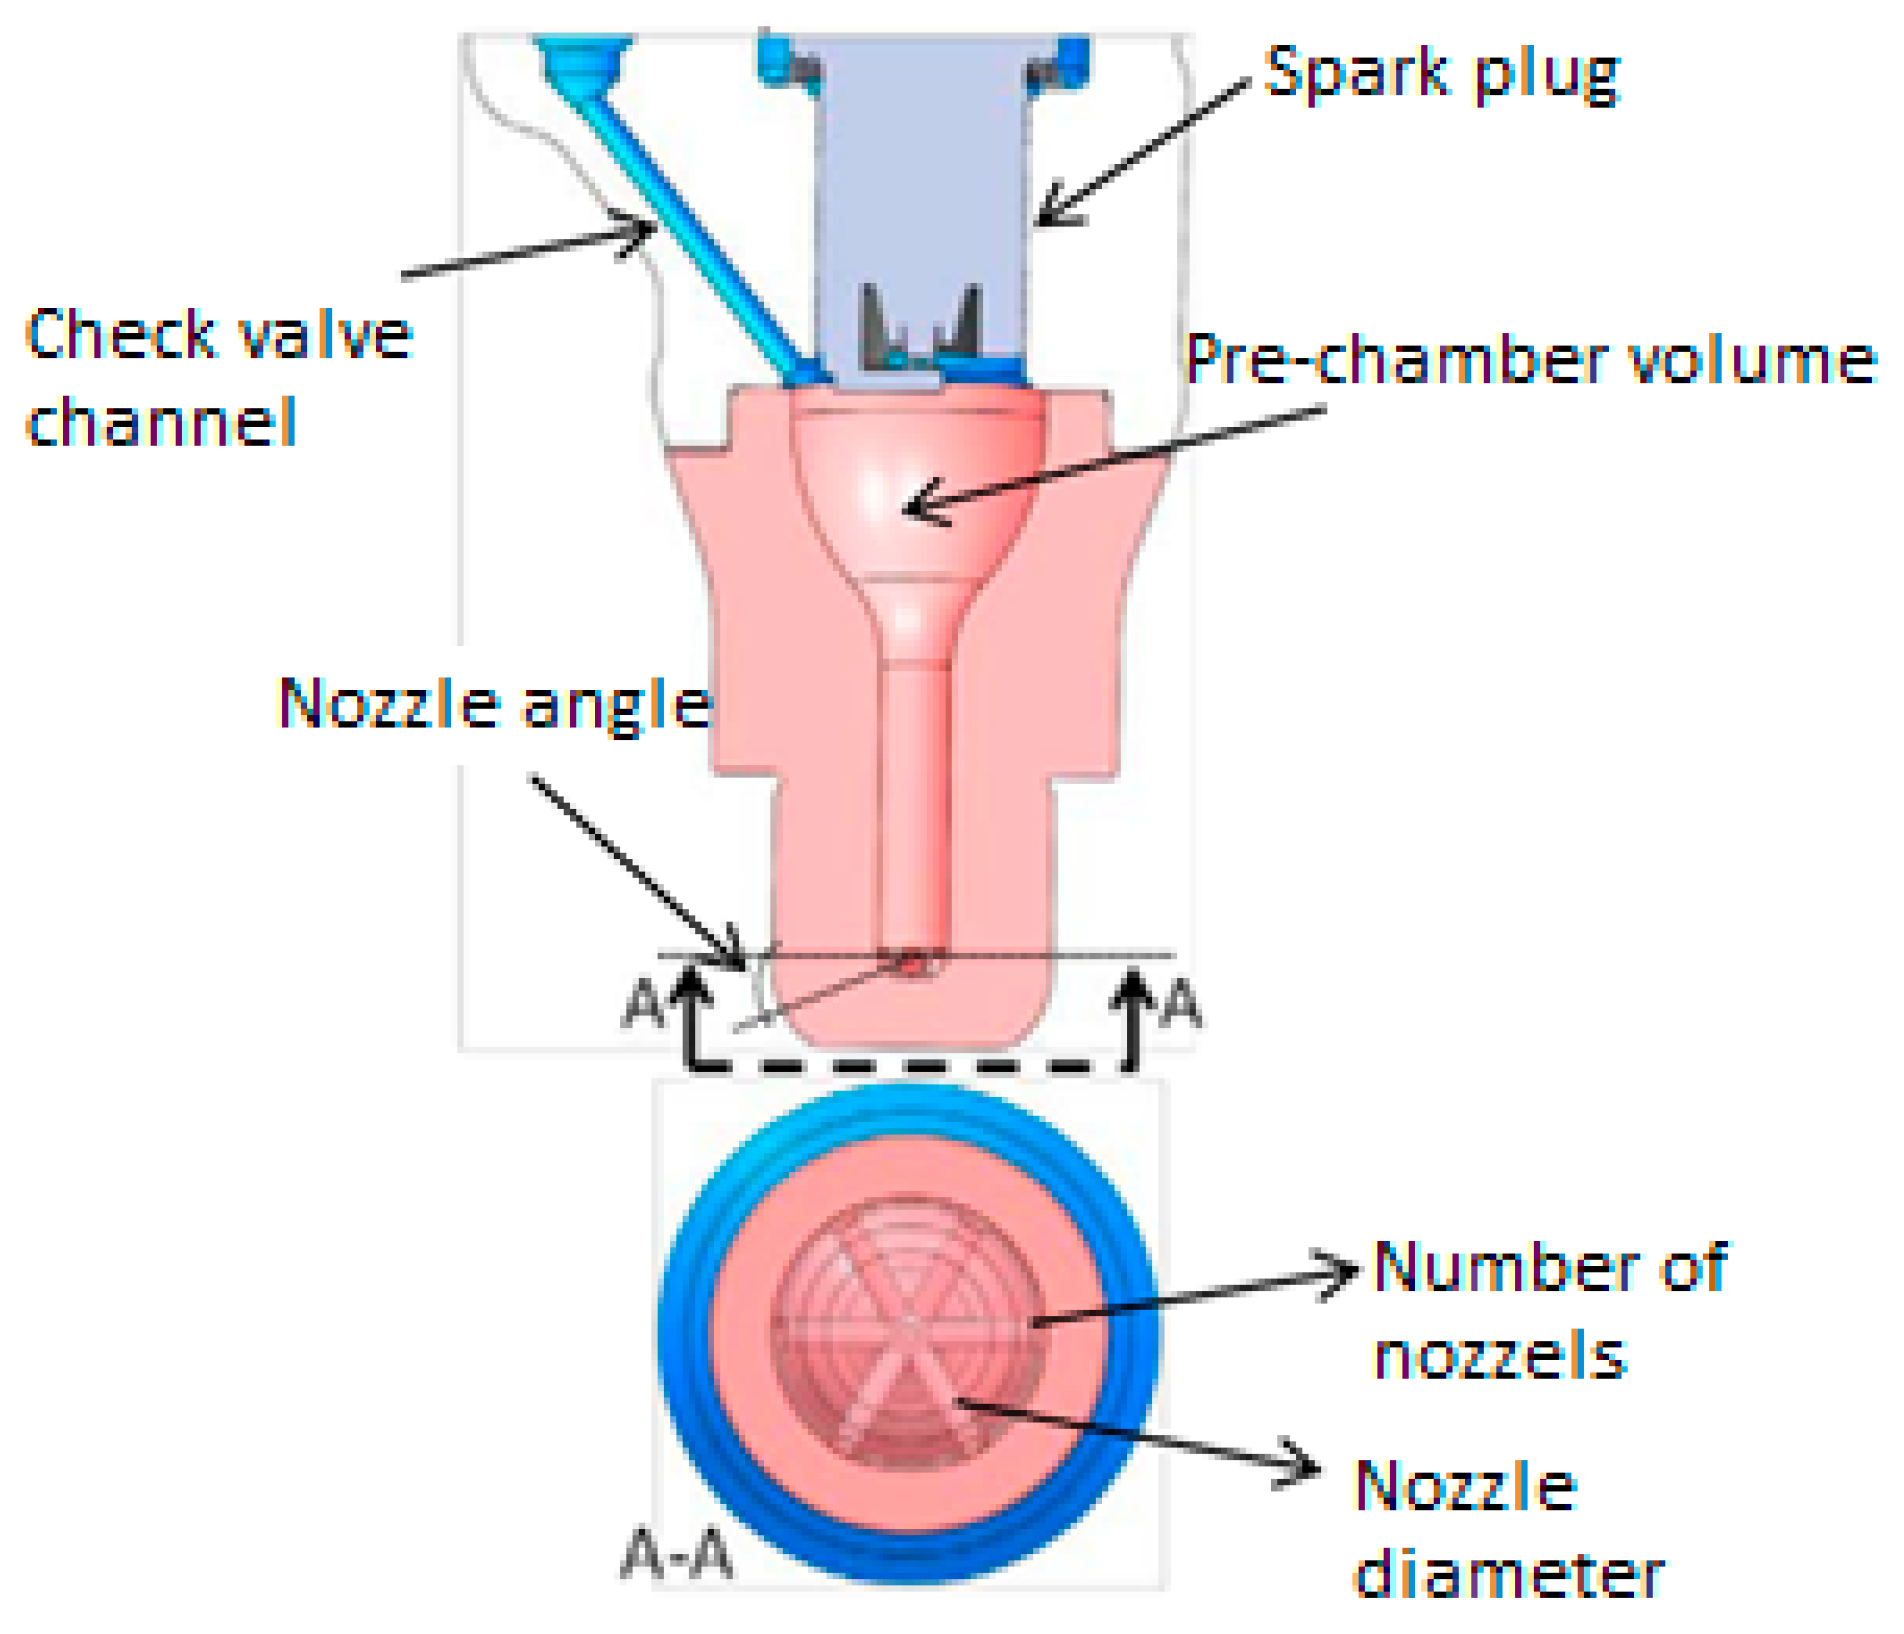
The loss of efficiency and stability must be counteracted by increased turbulence through modifying the design of the main parts involved in the combustion process (piston, cylinder head, spark plug, combustion cycle, etc.) [16], including the prechamber itself, the design of which plays a significant role in combustion efficiency. The main design parameters of a pre-combustion chamber are described below with the help of the schematic representation in Figure 3 [19].
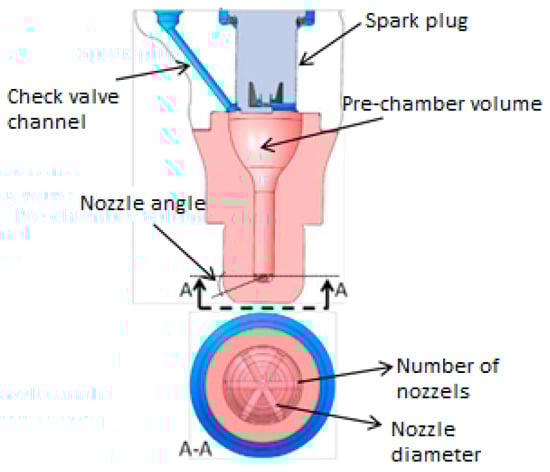
Figure 3.
Diagram of design parameters of a combustion prechamber.
- ○
- Prechamber volume: the smaller the volume, the easier it is to fire inside it, as less gas has to be emptied.
- ○
- Nozzle diameter: the ratio of prechamber volume to nozzle diameter dictates torch velocity, which generally increases as diameters decrease. The higher the velocity, the easier it is to penetrate the main combustion chamber, facilitating combustion.
- ○
- Presence of a central nozzle: this directs the flame towards the middle of the main combustion chamber to prevent unburnt gas. It also has a strong correlation with the renewal of the prechamber charge itself.
- ○
- Nozzle orientation: the direction of the torches can be matched to the piston surface so that there is less unburnt gas in the combustion chamber and the flames generate more turbulence (prechamber swirl).
As a summary, Table 1 gathers the main strengths and weaknesses of each of the ignition systems analysed so far. ↑(high), ↓ (low), ↓↓↓ (very low)

Table 1.
Strengths and weaknesses of different combustion systems for lean-burn engines.
Given the above, it seems obvious that for applications that seek high efficiency, using a fuelled prechamber is the best option. These applications are mainly focused on shore natural gas (NG) applications, as the fuel has a high cost in most countries. Nevertheless, alternative fuels could be found in the market, such as sewage gas, landfill gas, flare gas, or others, where the main driver is not the efficiency, as the gas may be considered a by-product.
Thus, as explained by Ruiz et al. [16] in applications such as flare gas, efficiency shifts to the background and robustness becomes a priority. The same premise could be applied to applications such as the one under analysis, where the engines are installed in a vessel.
The main reason for this to happen is related to the cost of the gas; however, all of those fuels have some other things in common. The most remarkable fact would be that most of them could present impurities and debris in the gas. This fact is determinant to select a combustion system, and as shown in Figure 2, gas and combustion deposits could generate sudden stops, reducing the robustness and increasing the corrective maintenance costs considerably. For these reasons, it is preferred to use an unfuelled prechamber to burn these alternative fuels.
The above solution provides a cheaper and a more robust solution, but unfortunately would present a thermal efficiency reduction in respect to its LNG counterpart with a fuelled prechamber fitted.
To adapt the engine to different fuels and their physical and chemical properties, different manufacturers have optimised design in various ways [16].
Despite the modifications that different manufacturers have made to engines to burn different gases, in all cases there is some drawback between the use of LNG and alternative fuels. All the analysed engines show a considerable loss of performance compared to the LNG engine, and some of them also show a significant loss of power.
In this study, an innovative methodology was developed to increase the thermal efficiency of an engine by using passive prechambers to burn alternative fuels. This increase is achieved through optimising an ignition system that improves the performance of engines using a passive prechamber.
The fact that the combustion system is selected to be optimised to increase the efficiency available in the market is mainly justified by the reasons provided in the following paragraphs.
Firstly, and as mentioned above, alternative fuels are commonly considered by-products. That is why engines running on those fuels use passive prechambers rather than active prechambers. However, these similarities between engine configurations do not occur in other technologies such as pistons or shafts. This is due to the variety of properties that different alternative gases may have. As an example, APG (associated petroleum gas) encounters difficulties in finding correct detonation margins, as it is prone to knocking, while biogas is subject to combustion instability at low emissions. This means that the compression ratio of the pistons must be modified depending on the type of gas (high for biogas and low for APG). Therefore, the combustion system is prioritised over other systems to reach the widest possible range of engines by improving the cost–benefit analysis matrix.
Secondly, as opposed to pistons, cylinder heads, camshafts or other technologies, the ease of replacing prechambers and spark plugs is key to focus on for this component. The components also present benefits on cost saving in terms of part cost and labour. In addition, an important factor that ultimately converts the combustion system optimisation and is especially interesting is the short delivery time for prototype design and manufacturing.
Last but not least, the most important factor relies on its impact on thermal efficiency. Previous studies [7,20] indicate that improvements in the combustion system can involve major changes in thermal efficiency.
For all of the above reasons, the parts to be optimised to increase the efficiency are the prechamber and the spark plug. However, a base gas must be chosen for testing. As indicated in the next section, a simulated biogas will be used that has an LFL (lower flammability limit) beneath the other gases and therefore has the most restrictive conditions for the combustion of the passive prechamber. Therefore, if the results are optimal with biogas, the designed combustion system could be applicable to fuels with higher LFLs.
The Guascor Energy G-86EM liquefied natural gas engine will be used as the benchmark engine for the efficiency comparison. It is a 12-cylinder engine with a rated capacity of 2065 kW and was released in May 2017 in both 50 and 60 Hz versions, offering high performance to date for both primary power generation and cogeneration applications. This engine, operating on liquefied natural gas, has a rated capacity of 2065 kW and mechanical efficiency of 46.9% and 45.9% for emission limits of 500 mg NOx/Nm3 and 250 mg NOx/Nm3, respectively [9].
2. Materials and Methods
2.1. Test Bench
This work was performed at Guascor Energy Engine’s Research and Development (R&D) facility in Vitoria-Gasteiz. The initial tests defined the physicochemical characteristics and combustion properties of the fuel used. These checks were valid for certifying fuel characteristics such as methane number, lower heating value (LHV), hydrogen, nitrogen and carbon contents. These tests were performed at Guascor Energy’s premises, where a chromatograph is available.
The engine employed for the tests conducted during this study was a single-cylinder engine that was specifically designed for developing Guascor Energy’s G-86EM 2 MW engine model. The SCE (single-cylinder engine) offers several benefits compared to a multi-cylinder engine (MCE), as shared by Oregi, I. et al. [9], and it is designed to simulate the combustion of the recently launched MCE version.
During the combustion process, several variables measured were recorded for further computational analysis. Amongst all the measured variables, some of them can be highlighted: ignition timing, pre-combustion period, end of main combustion, main combustion period, post-burning period, maximum rate of heat release, knocking, exhaust temperature, thermal efficiency, and cylinder pressure.
The central system controlling all the subsystems was the AVL PUMA. The PUMA gathers all the data from the sensors fitted and acts as a master controller for all the peripherals that have their own PLC (programmable logic controller), such as the oil system, gas supply system or compressed air system.
So that combustion parameters could be recorded, other measuring equipment was fitted—the AVL IndiCom module with 21529 serial number and 2.5 software version sourced by AVL Ibérica (Madrid, Spain). This is combustion measurement software that is principally employed for the measurement and analysis of the exhaust, intake and combustion chamber pressure curves. Further to this, some other engine-specific variables can also be calculated, for instance, heat release rate, heat losses, energy and thermal balance mass flow, and more parameters. The data acquisition module utilised was the high-speed Indimaster Advanced GigabitTm with 8 channels.
As for measuring components of the exhaust gases, a Horiba Mexa 7100D exhaust gas analyser supplied by Horiba’s distributor in Madrid, Spain (Técnicas de Control y Análisis SA) was used.
After defining the gas properties, which are shown at the end of the present section, engine tests were carried out on the SCE test bench. Figure 4 shows the layout of the test bench while it is monitored by the instrumentation listed in Table 2 and Table 3.
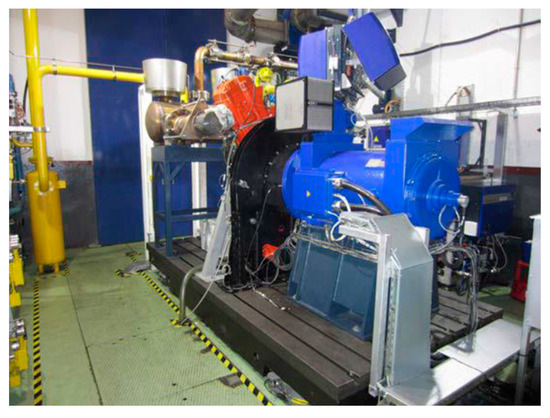
Figure 4.
SCE test bench.
Table 2.
Engine parameters.
Table 3.
Test bench sensors.
2.2. Test Design
2.2.1. Results Format and Targets
All results are displayed in “engine map” mode and combustion conditions range from lean (high AFR, low NOx emissions) to rich mixtures (low AFR, high NOx emissions, with a maximum limit of 2000 mg/Nm3), using “misfire” as the lean mixture upper limit and “knocking” as the rich mixture upper limit. The variables are represented in terms of mg NOx/Nm3 (normal cubic metres refer to exhaust gas flow), which is common practice in the industry, since it provides the user with direct information about the NOx emissions associated with the engine characteristics.
For the knocking and misfire limits, values greater than or equal to 2000 mg NOx/Nm3 and less than or equal to 250 mg NOx/Nm3, respectively, were set (Table 4).
Table 4.
Misfire and detonation limits for the passive prechamber configuration.
The misfire limit was set on the basis of future environmental constraints, while the detonation limit was selected to have enough margin to operate at 500 mg NOx/Nm3 despite variations in the quality of the input gas. In the following paragraphs, deeper information regarding misfire and knocking margins is provided.
The misfire limit is the minimum concentration of NOx (in mg/Nm3) in exhaust at which the engine can operate without presenting cycles without combustion. The point of operation prior to that cycle without combustion shall be taken as the misfire limit.
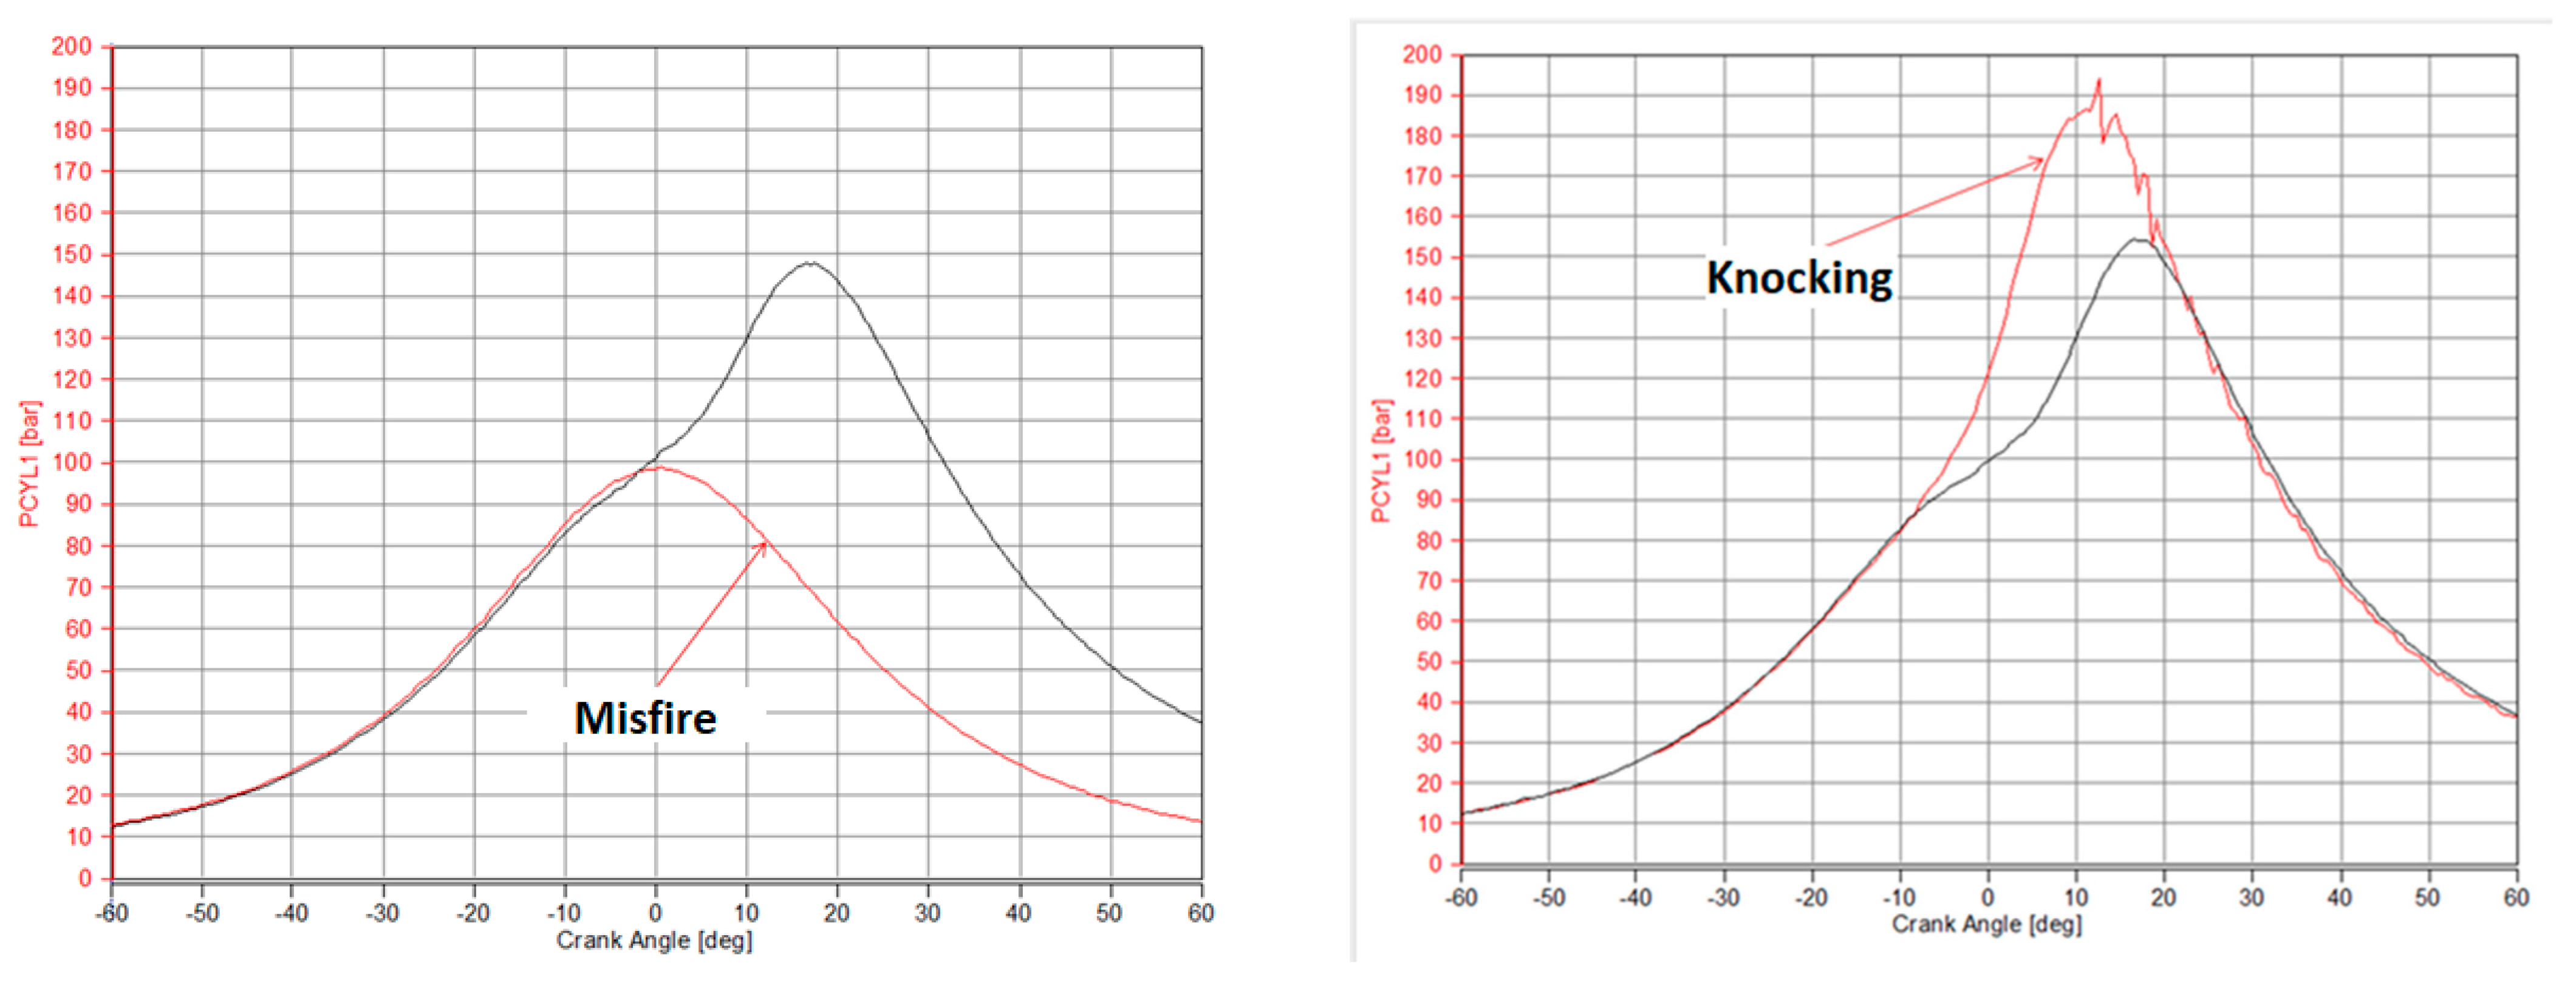
Whereas the knocking margin is the maximum concentration of NOx (in mg/Nm3) in exhaust at which the engine can operate without detonation cycles, the knocking limit shall be taken whenever the 3% over 200 cycles recorded in the IndiCom is overpassed. The defined maximum pressure deviation is known as the KNK_PK (knock peak) value. This is the absolute value of the maximum pressure oscillation at the high-pass of the filtered signal.
The combustion phenomena described above are detected through a pressure transducer in the main chamber and were plotted in the IndiCom as per the examples shown in Figure 5.
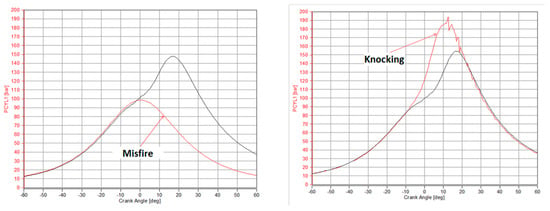
Figure 5.
Misfire (left) and knocking (right) detection through chamber pressure transducers.
The curves shown are those from a test to select the optimal ignition timing for each configuration. This parameter must be modified when changing fuel and/or configuration to find the engine’s optimal operating point. The condition to be fulfilled in all tests is that the engine reaches 175 kW output power (equivalent to 2 MW in the multi-cylinder).
All results shown are arithmetic averages of four 30 s measurements, taken at the same stationary operating point and leaving 60 s between them, which is equivalent to a total sampling time of 5 min. During this time, the PUMA Open system acquires the values of each sample and each peripheral device according to the frequency set in the software. The result is an average of all values recorded in that time interval. The results were plotted and are presented below in the order in which the experiment was carried out. The values are represented as a percentage of reference data, which in this case are the data for the G-86EM multi-cylinder engine running on LNG at an emission level set at 500 mg NOx/Nm3.
2.2.2. Boundary Conditions
The test boundary conditions are the set of variables that are configured in the SCE to replicate the working conditions that the MCE will reach in its operation, including environmental aspects. These assumptions are intended to cover the full range of system behaviours that exist in an MCE and do not exist in an SCE. In addition, the boundary conditions are set to force the most unfavourable conditions possible.
Boundary conditions of the experiments are as follows:
- ○
- Outlet water temperature (TWP_301): 90 °C.
- ○
- Oil temperature (TO5_001): 83 °C
- ○
- Oil pressure (PO5_001): 4.5 bar.
- ○
- Inlet air temperature (TA4_001): 62 °C approx.
- ○
- Water flow (QWP_001): 90 L/min
- ○
- Water pressure (PWP_002): 3 bar.
- ○
- Back-pressure control: constant efficiency; 0.61 turbine and 0.6 compressor.
- ○
- Speed: 1500 rpm
- ○
- Ambient temperature: 0–25 °C
- ○
- Altitude: less than 500 m
- ○
- BMEP: 19.3 bar
- ○
- Variables that depend on the experiment number:
- ○
- Ignition timing: It was adjusted in accordance to fuel knocking limits.
- ○
- Approximate volume percentages of gas for:
- ○
- Landfill gas
- ▪
- Natural gas: 50%
- ▪
- CO2: 50%
2.2.3. Configurations and Tests
The G-86EM, as indicated by Ruiz et al. in their studies [16], has an ignition system based on an active prechamber (OPC) and a J spark plug (SP). Due to the sufficiently energetic ignition created by this system, the engine uses a flat piston that does not generate any extra turbulence in the main combustion chamber. This is the OP flat piston, which works with a high compression ratio (13.5) for the highest possible efficiency. The cylinder head (OCH) has straight-line intake holes for maximum volumetric efficiency without seeking to create extra turbulence in the gas passage through the valves, since that is unnecessary for a natural gas engine with an active prechamber. With regard to the thermodynamic cycle (OM), the camshaft is programmed to work with a Miller cycle, using the EIVC (early inlet valve closing) technique, i.e., the engine closes the intake valves much earlier than in the Otto cycle. Therefore, more intake pressure is needed to introduce the same amount of charge into the main chamber. Following the above, the basic configuration of the LNG engine could be summarised as follows and is shown in Table 5.
Table 5.
G-86EM combustion chamber configuration.
Where:
- ○
- OP: injected prechamber
- ○
- SP: J spark plug
- ○
- OP: flat piston
- ○
- OCH: cylinder head without swirl
- ○
- OM: Miller cycle camshaft
As previously mentioned, the fuel used during these tests will be a biogas to subject the combustion system to the most restrictive conditions. Therefore, it is vital to note that the tests contained in this paper were carried out on a version of this engine modified to be able to burn biogas. Like Ruiz et al. [16] employed for the APG (associated petroleum gas) engine, Guascor Energy decided to use a passive prechamber for its biogas counterpart for the reasons explained in previous sections. Consequently, the changes were focused on increasing the turbulence of the main chamber and favouring firing in the prechamber. For this purpose, a bowl-shaped piston with increased CR, swirl cylinder head, passive prechamber and J spark plug were used (Table 6).
Table 6.
Comparison of LNG and biogas configurations.
Where:
- ▪
- PP: passive prechamber
- ▪
- PB: bowl-shaped piston
- ▪
- CHA: cylinder head with swirl
Ultimately, the modifications implemented are very similar to the configuration presented by Ruiz et al., as both share the same combustion technology. In fact, the methodology described here for optimising combustion by modifying the prechamber and spark plug design would be fully applicable to the APG engine.
Since a configuration for a biogas engine is presented, it should be noted that the tests have been carried out with a biogas simulating the condition of landfill biogas. The biogas used during the experiments is a mixture of natural gas and CO2 prepared by a gas conditioning system with four different lines to mix both in the main chamber and in the prechamber natural gas and CO2 in 20% to 60% concentrations by volume of CO2. Experiments were carried out with the following mixture:
- ▪
- 50% natural gas and 50% CO2 (by volume), simulating landfill biogas.
It is important to note that liquefied industrial CO2 was used throughout the experiment to simulate the composition of the biogas, which made it possible to simulate the physical and chemical properties of the biogas so that the results in terms of efficiency, power, temperature, pressure, turbo conditions, etc. could be reproduced. However, as it is a pure gas, it was not possible to analyse the effect of the main pollutants and impurities associated with the use of biogas (particulate matter, contaminants and moisture). Therefore, longer field-validation tests would be required to complete this type of study where the engine is exposed to site conditions.
The composition of the gas entering the test bench is controlled by chromatography, specifically by the Agilent Micro 490GC gas chromatograph, a continuous analysis device (1 analysis every 5 min). The chromatograph is equipped with 3 channels to analyse possible variations in the composition of natural gas from mains, since it follows the ISO 6974-5:2014 standard for natural gas analysis. In addition, it is gauged to determine CO2 percentages in 15–60% range by volume, so that the composition of the biogas entering the test bed can be known at any time.
Subsequently, the two tests carried out to optimise the engine’s performance will be detailed. The first test involves optimising the shape of the passive prechamber, while the second focuses on improving the spark plug.
Test 1. Optimisation of the Prechamber Design
Three different passive prechamber designs were tested with all other elements held constant. This leads to configurations 2, 3 and 4 (see Table 7). The first part consisted of setting the optimum ignition timing for each configuration. This trial allowed initial conclusions to be drawn on the advantages and disadvantages of the use of each of the prechambers.
Table 7.
Engine parts following configurations 2, 3, and 4.
The three designs in the previous paragraph were achieved by altering the design parameters in Table 8.
Table 8.
Types of prechamber tested for biogas combustion.
In other words, the proposed tests will compare a prechamber with the same volume as the LNG engine (OPC), a prechamber equal to the LNG engine but with smaller volume (PPA, configuration 2), another one with the same volume as the PPA but with an additional central hole (PPB, configuration 3), and finally, a prechamber with an even smaller volume, smaller hole diameter and different hole orientation, but keeping the central hole (PPC, configuration 4).
Test 2. Optimisation of the Spark Plug Design
Once the passive prechamber was selected, three alternative spark plug designs were tested, keeping the selected prechamber while all other elements of configuration 2 remained constant. This gives rise to configurations 5, 6 and 7, as shown in Table 9. The spark plugs were tested by selecting optimum timings for these configurations.
Table 9.
Engine parts following configurations 5, 6, and 7.
The different spark plug designs tested are listed in Table 10, where they are compared with the initial configuration’s spark plug (SP). This table also includes the characteristics of the SPB spark plug, which is the one used in configurations 2, 3 and 4. As is shown, the SPA spark plug is the same as the SP, but inserted further into the prechamber. The SPB maintains the SP’s degree of insertion, but it has an electrode with less precious metal. The objective of testing this modification (cheaper spark plugs due to less precious metal) is to try to determine whether the stability and margin to misfire would justify the higher cost due to more maintenance. Finally, the SPC spark plug is the most different since it has a different type of electrode shape.
Table 10.
Types of spark plug tested for biogas combustion.
3. Results and Discussion
This section presents and discusses the results of the different tests undertaken during this research, following the methodology described in the previous section.
3.1. Influence of Fuel on Combustion in Reciprocating Internal Combustion Engines
The most important properties when assessing the processing and performance of a gaseous fuel in an internal combustion engine are the lower heating value, methane number, flammability, auto-ignition temperature and adiabatic flame temperature [21].
The heating value, which primarily depends on the chemical composition, determines the heat capacity of a fuel and can be expressed as higher heating value (HHV) or lower heating value (LHV). The first is obtained empirically by measuring the enthalpy change in an adiabatic bomb calorimeter in which the water generated in combustion is condensed, while the second results from subtracting the enthalpy of condensation of the water generated from the first [22]. In other words, LHV is the heat obtained when combustion gases are emitted at temperatures above 100 °C, which is the most normal scenario when referring to combustion engines. Therefore, this heating value is the most used at a practical level. Since CO2 does not increase the heating value, the LHV of biogas is around 25–55% lower than that of natural gas, considering as standard those values that are in the ranges of 21.5–23.5 MJ/Nm3 and 5.5–6.5 kWh/Nm3 [23].
Methane number (MN) is a concept analogous to the octane rating in gasoline and describes the tendency of a gas fuel to knock [24]. This property also depends on the composition, since a value of 100 is given to pure methane (low knocking tendency) and a value of 0 to hydrogen (high knocking tendency). The MN can increase above 100 in mixtures with inert gases: in the case of biogas (which contains CO2 and a certain amount of N2) it reaches ranges higher than 130 [25]. Closely related to this concept is the auto-ignition temperature, which is the minimum temperature at which a substance in contact with air burns spontaneously without the action of any external ignition source. In this case, the auto-ignition temperature of biogas is higher than that of natural gas and is in the range of 650–750 °C [22].
Flammability defines the concentration limits (fuel/air) for which the gas ignites when exposed to an ignition source, at a given temperature and pressure. The lowest concentration at which the flame can spread is called the lower flammability limit (LFL) and the richest limit is called the upper flammability limit (UFL) [26]. For lean-burn engines, the main challenge is the LFL, as it defines the difficulty of igniting the mixture and propagating the flame with high AFRs. This is especially important with biogas, since its flammability range is smaller than that of natural gas and other fuels [27]. As explained in the previous section, this is the reason the tests herein were conducted with biogas.
Finally, the adiabatic flame temperature is the maximum theoretical temperature that the combustion gases would reach if this combustion was complete and the fuel had been completely burnt through an adiabatic and isobaric process. It seems obvious that the actual temperature of the combustion gases is always lower due to heat losses and the presence of unburnt substances. However, this theoretical concept allows comparison of the combustion temperatures that would be reached using different fuels. Combustion-inert substances present in biogas, mainly CO2, absorb the heat released in combustion, so the adiabatic flame temperature of biogas is lower than that of LNG [27,28]. This makes the flame speed and combustion speed lower also (longer combustion), which leads to increased combustion instability and promotes in-cylinder misfires [21].
Table 11 compares the properties and combustion behaviours of liquefied biogas and liquefied natural gas. It may be concluded based on these properties that biogas is a fuel with less flexibility for use in internal combustion engines than liquefied natural gas.
Table 11.
Comparison of the properties and behaviours of liquefied biogas and liquefied natural gas engines. ↓ (lower) ↑ (higher).
Due to its natural origin, biogas contains numerous impurities that significantly affect the engine’s robustness and performance. Depending on the origin and the established cleaning or filtering stages, substances such as NH3 (0–0.05% vol.), H2S (0–0.5% vol.), dust (>5 μm), siloxane (0–50 mg/Nm3) and water vapour (1–5% vol.) may be present. The main problems associated with these impurities are condensation, corrosion and erosion of critical parts, the creation of solid deposits with abrasive effects, and dust deposits [28].
3.1.1. Test 1. Optimisation of the Prechamber Design
The objective of this test is to determine the influence of 3 different passive prechambers on thermal efficiency while keeping the rest of the mechanical elements invariable. Configurations 2, 3 and 4 will be tested (see Table 7). Table 8 presents the characteristics of the three prechambers compared to the OPC prechamber used in the LNG engine.
The proposed changes are to:
- increase the energy of the torches exiting the prechamber into the main combustion chamber;
- promote firing in the main combustion chamber; and
- increase the combustion efficiency of the mixture in the prechamber and main combustion chamber. The aim is to mitigate the loss of efficiency and loss of combustion stability associated with eliminating prechamber gas injection, accentuated by the use of biogas as a fuel instead of liquefied natural gas, as much as possible.
Table 12 shows the ignition timings used in these configurations and the knocking and misfire limits achieved. All three configurations met detonation and misfire targets (Table 4), with a particularly large misfire margin with configurations 3 and 4 for landfill gas, improving the results of configuration 2. Regarding the knocking limits, the ignition timing required for optimal engine operation in configuration 4 with landfill gas (28°) causes detonation to appear at lower values than the rest, yet still high enough to meet specifications (2503 mg NOx/Nm3).
Table 12.
Ignition timings and misfire and detonation limits for different passive prechambers.
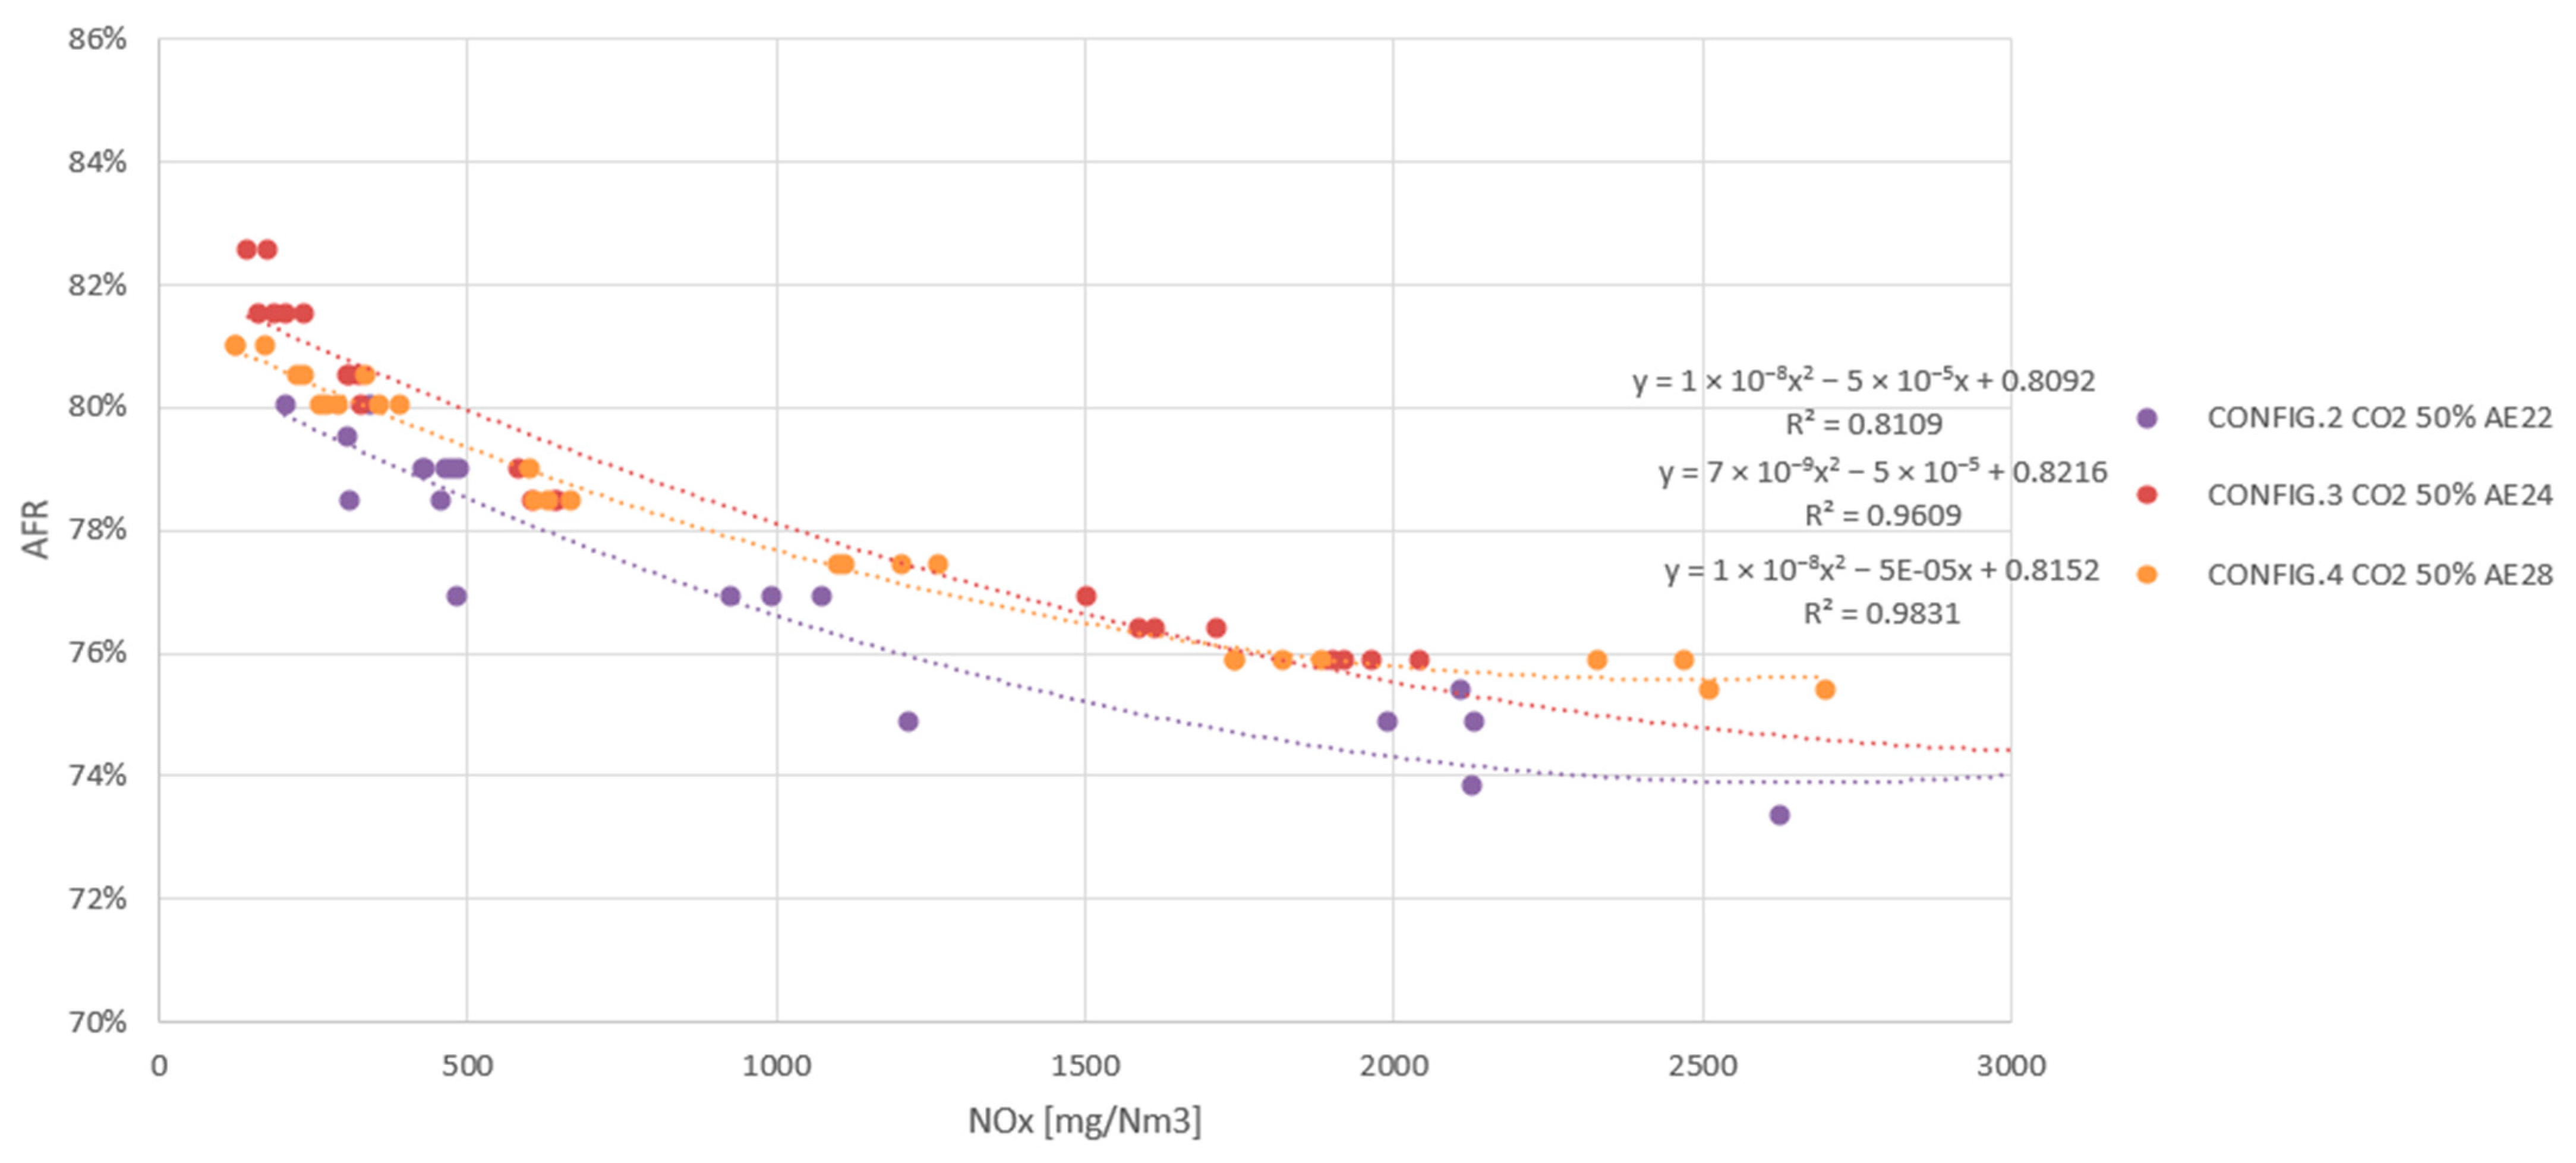
Engine maps with optimised ignition timing and turbo parameters for biogas are presented below. Figure 6 plots the air/fuel ratio the engine requires for each of the configurations.
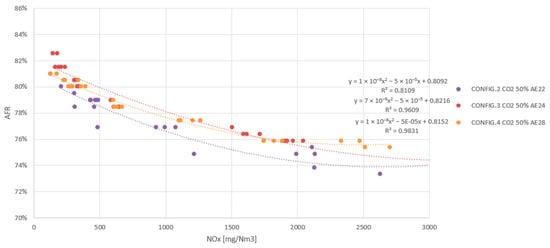
Figure 6.
AFR as a function of exhaust NOx in configurations 2, 3 and 4.
There is a difference in AFR in the configurations, configuration 2 being the highest, followed by configurations 3 and 4. Generally, a lower AFR (richer fuel mixture) tries to compensate for the shortcomings of a slower combustion system. In the case of configuration 4, its AFR is lower because it needs to compensate for a slower combustion system (smaller prechamber volume and therefore weaker torches) with a richer mixture [18]. However, comparing the prechambers of configuration 2 and configuration 3, it can be observed that the only difference between them is the presence of the central hole in the prechamber of configuration 3, that is to say, the PPB prechamber has one extra hole. A priori, increasing the number of holes generates more turbulence, which results in faster combustion in the prechamber, but also blocks the combustion process and the initial flame growth, which can lead to ignition failures [29]. It is therefore necessary to introduce a more fuel-rich air/fuel ratio. However, the visible differences decrease because the combustion has been compensated by the change in ignition timing and there is no need to compensate any further with the AFR.
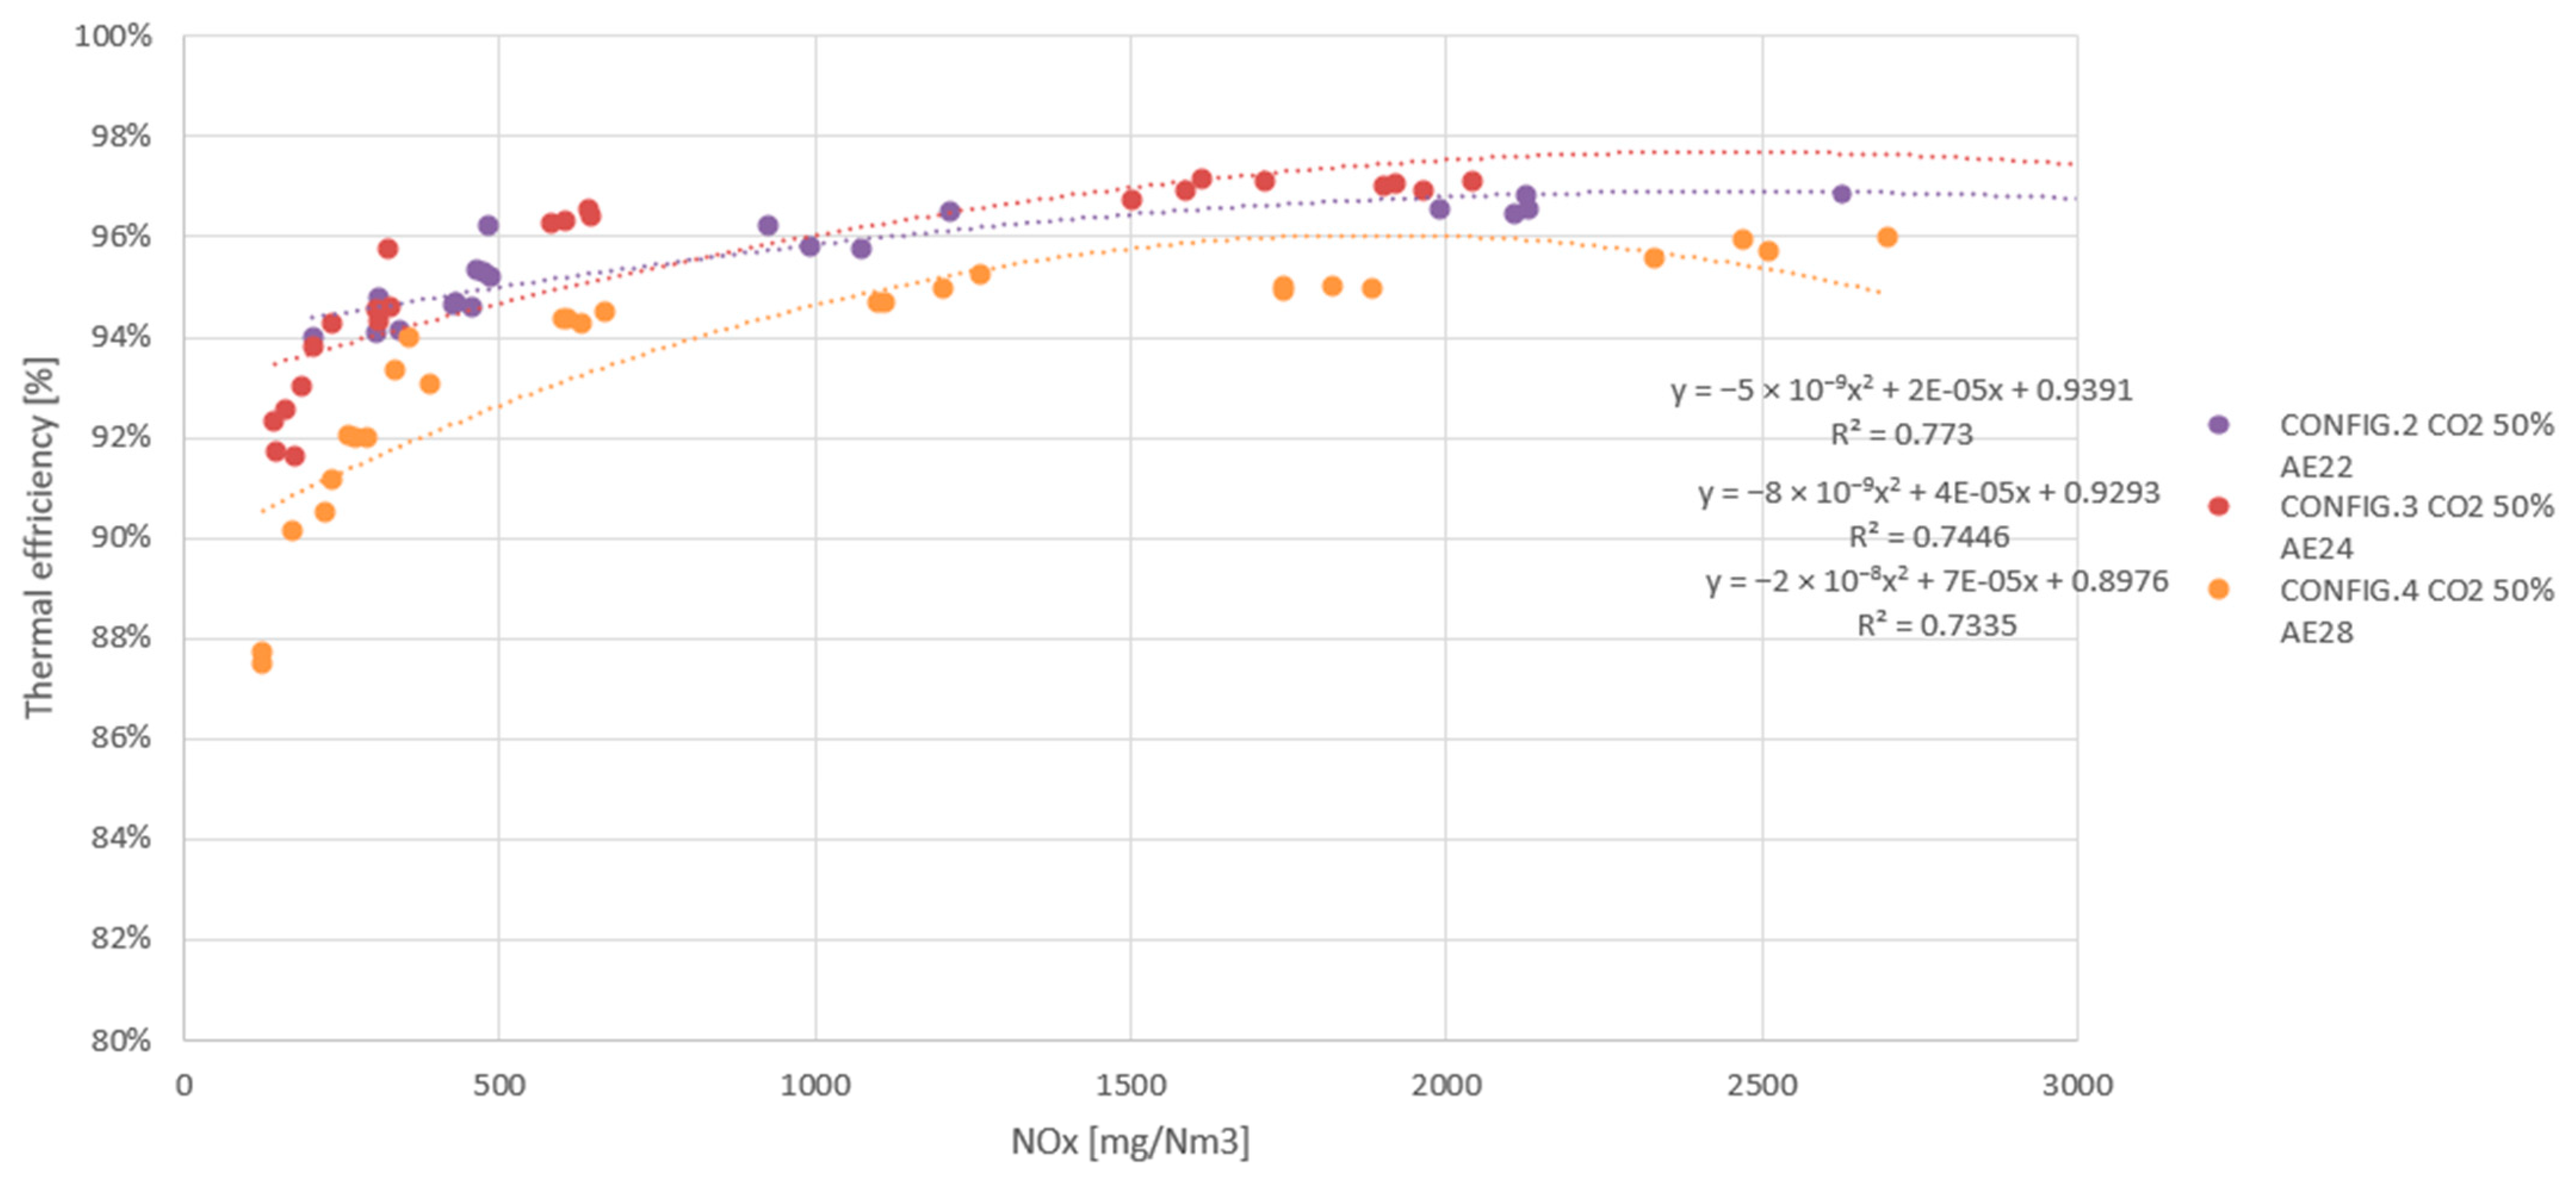
Figure 7 shows efficiency results. Efficiency was higher in configuration 3 than in configuration 2, probably as a consequence of the difference between the ignition timings. The presence of the central hole seems to help renew the prechamber volume, allowing shorter ignition timings that provide higher efficiency. Finally, configuration 4 offers the worst efficiency: this difference is almost two percentage points at 500 mg NOx/Nm3 and slightly less at exhaust NOx concentration levels of 250 mg/Nm3. It should also be mentioned that the dispersion of configuration 4 below 500 mg NOx/Nm3 seems to indicate that the combustion stability at that point was not as desired.
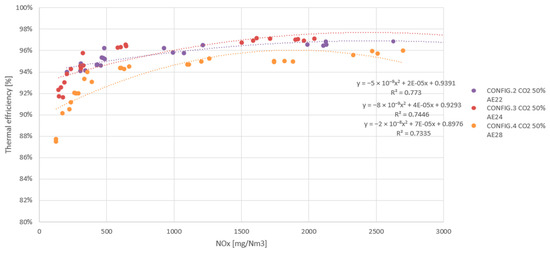
Figure 7.
Thermal efficiency as a function of exhaust NOx in configurations 2, 3 and 4.
Since the prechamber in configuration 4 has several design modifications compared to the previous ones (smaller dimensions, smaller hole, different hole orientation) it is difficult to determine which one is negatively affecting efficiency. However, according to research results published in specialised literature, two main factors must be mentioned. Working with smaller prechambers reduces the pressure difference between the two chambers, which hinders the insertion of the flames and with it the ignition of the main chamber [19,29]. A small hole, which in principle is designed to minimise mass losses through the holes, may also hinder optimal filling of the prechamber, decreasing the pressure difference between chambers, and may also prevent the emptying of combustion gases between cycles [18]. Thus, it seems that in this case, there are more negative effects than positive in terms of prechamber volume and hole diameter, and these negative effects could not be compensated by the orientation of the holes.
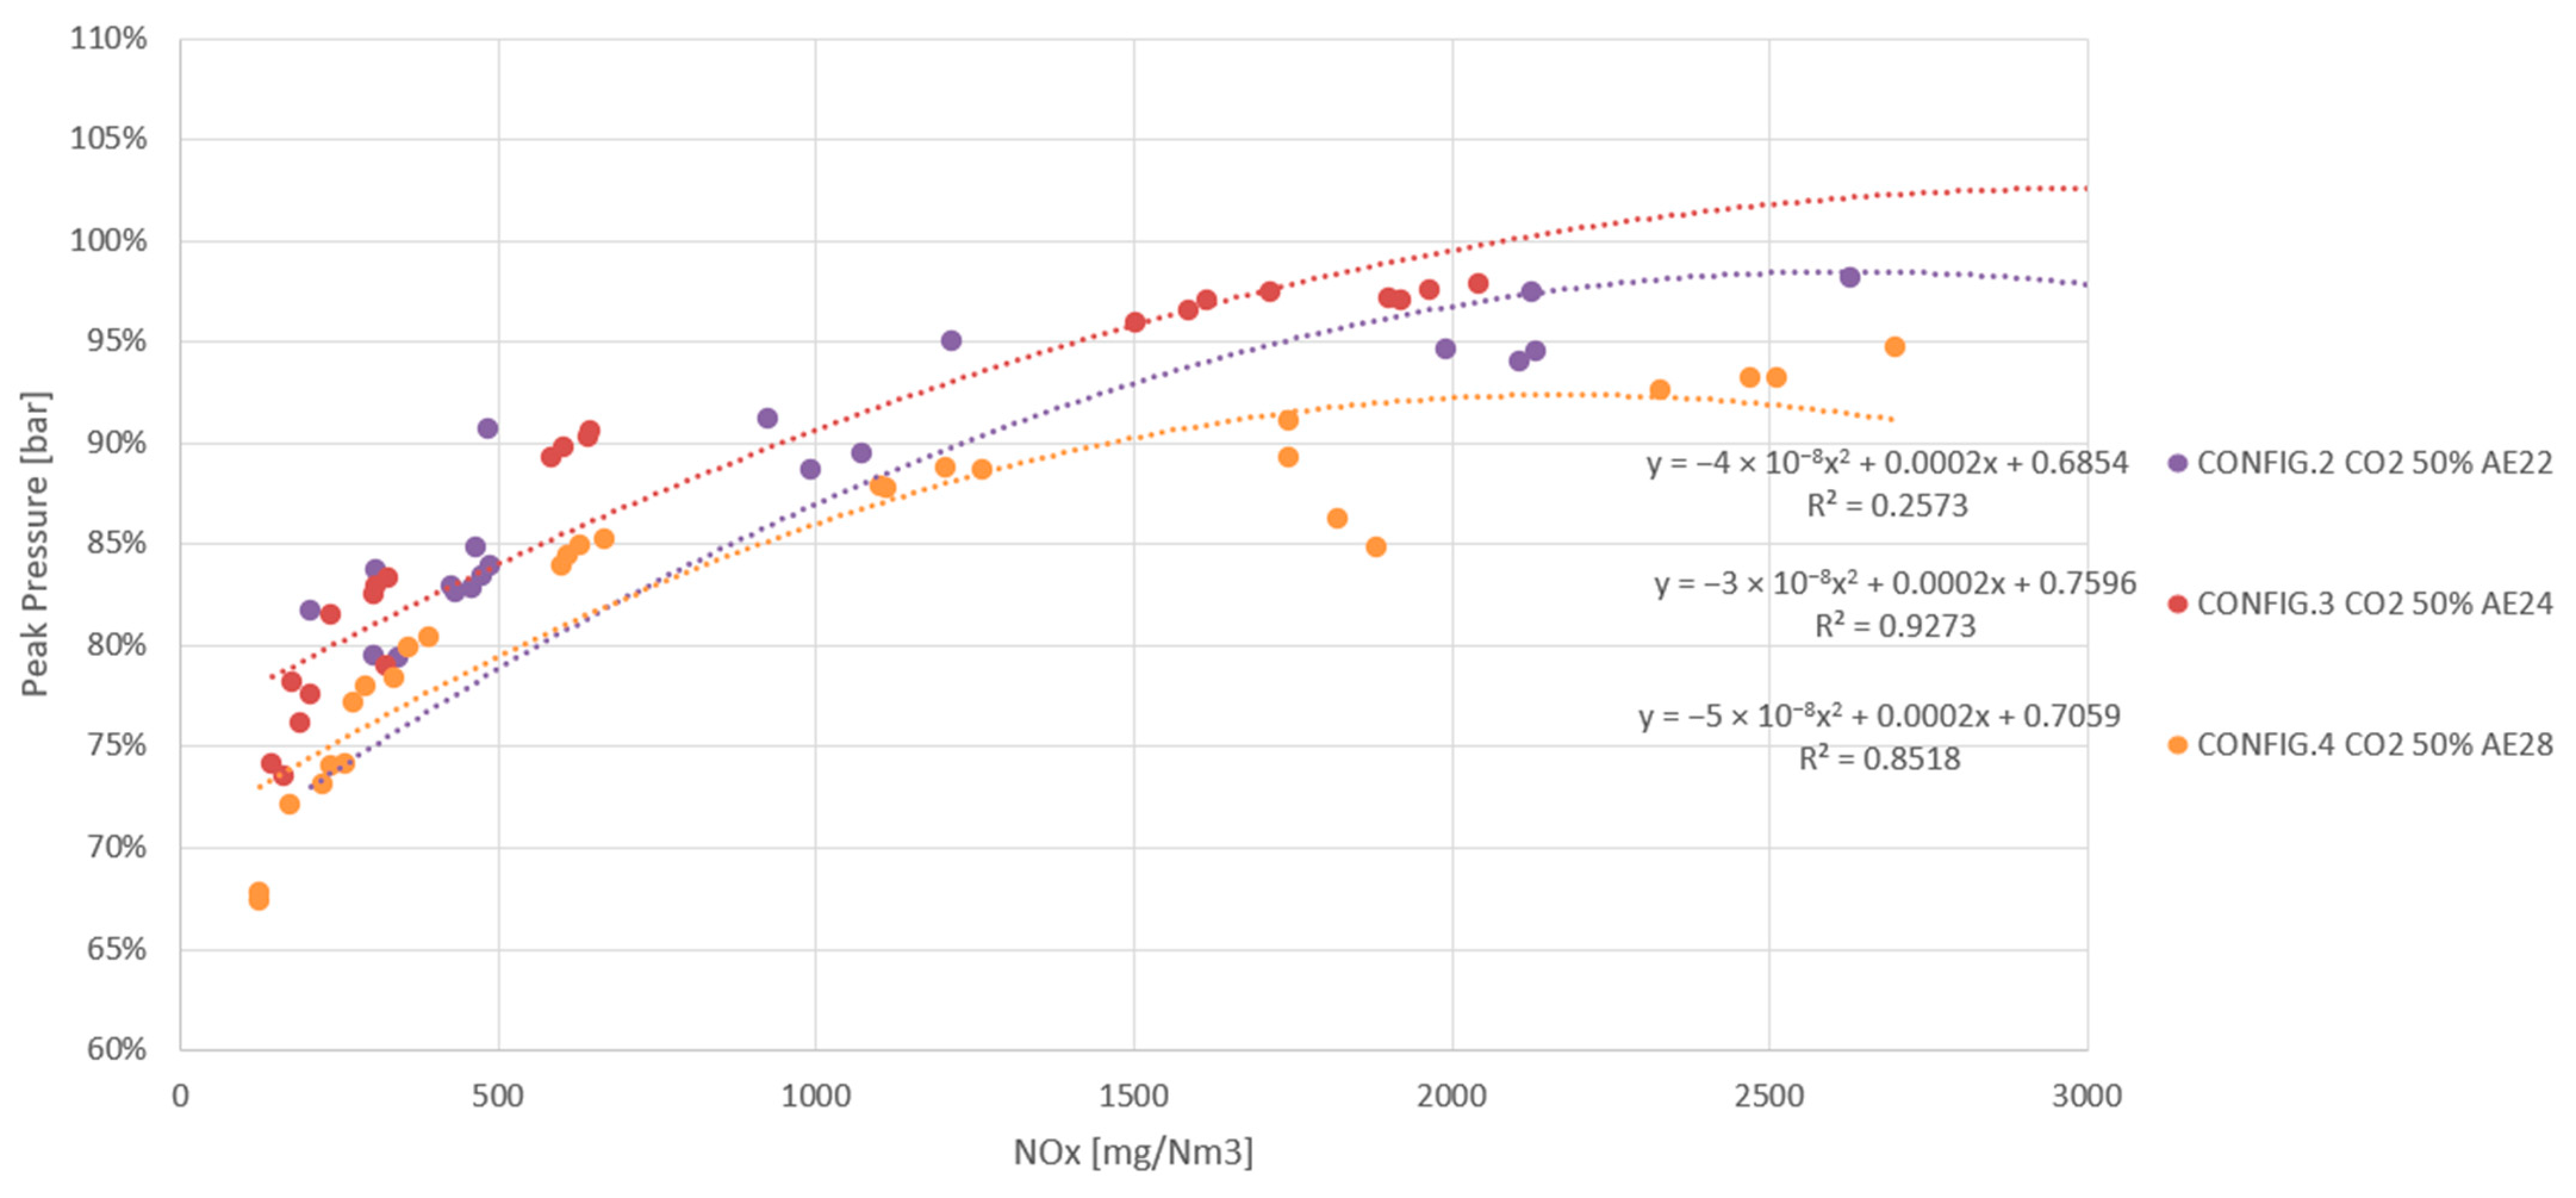
Figure 8 shows the results of the maximum pressure in the chamber. The same trends can be observed here as in thermal efficiency, i.e., configuration 4 produces a less energetic combustion, generating less pressure in the combustion chamber and resulting in less efficiency. For the other two configurations, the behaviour is very similar. Although the change in the orientation of the holes aims to create more uniform distribution of the flames in the main chamber, it seems clear that the problems mentioned above from the smaller prechamber and the shape and distribution of the holes negatively affect the generation of high pressure in the cylinder.
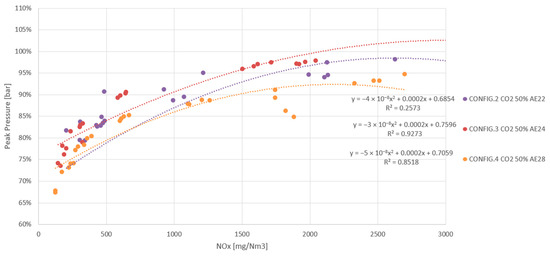
Figure 8.
Maximum pressure as a function of exhaust NOx in configurations 2, 3 and 4.
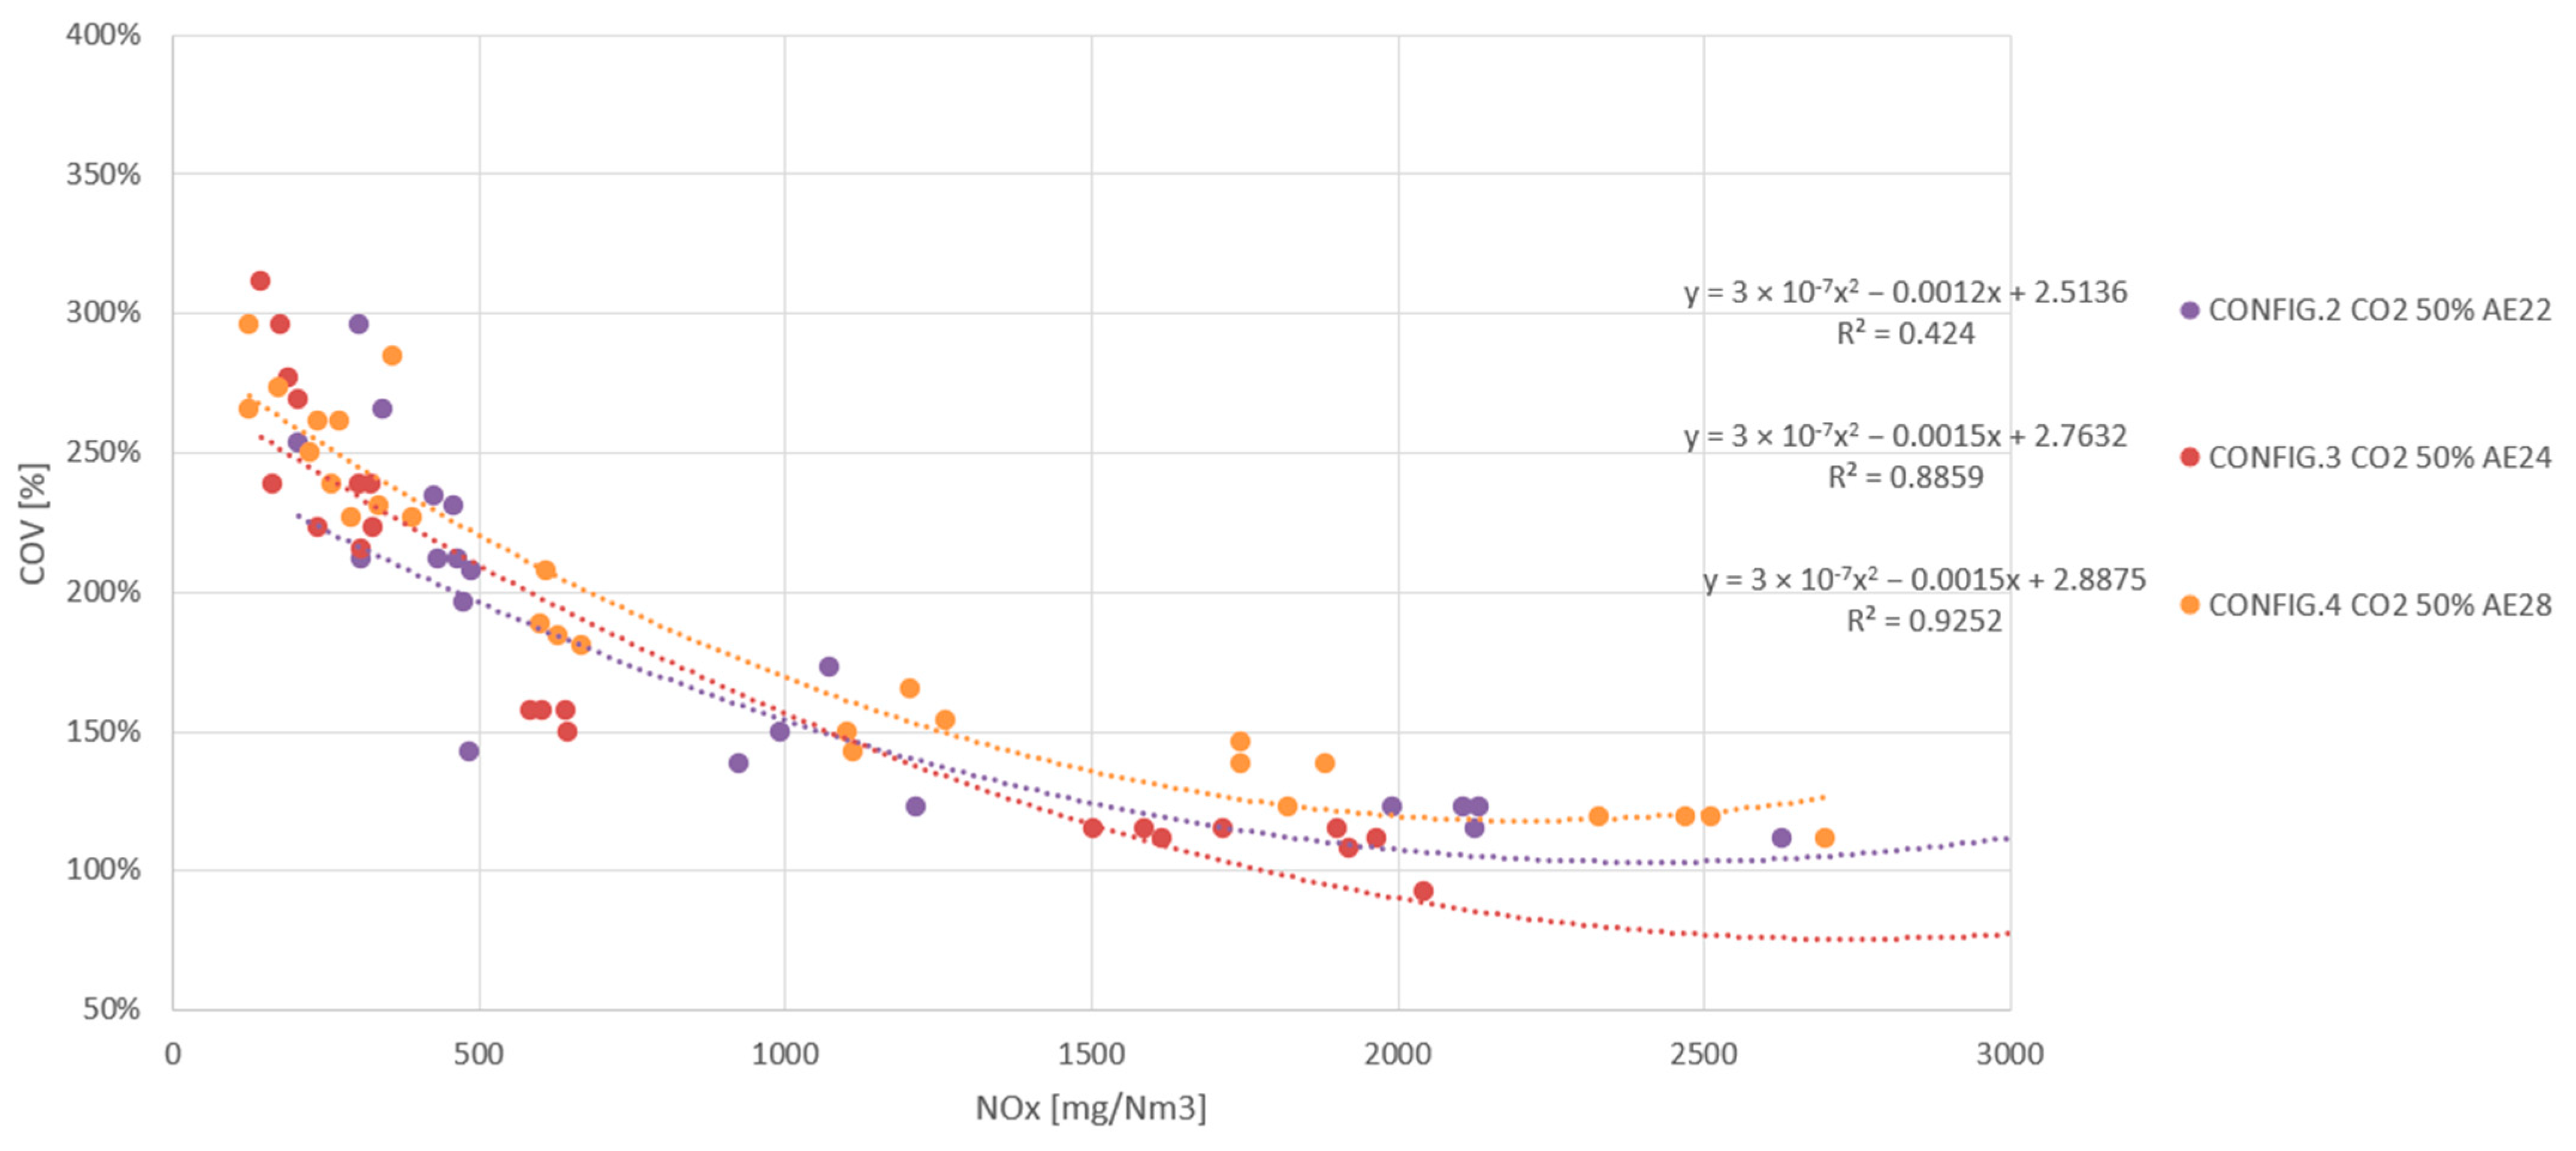
The combustion stability results reflected in the peak pressure covariance are presented in Figure 9. There did not appear to be major differences in combustion stability between the configurations. If anything, more instability could be observed for configuration 4, for the reasons explained above. What is clear, as in the previous test, is that there is increased instability in combustion as one works in the poorer combustion areas.
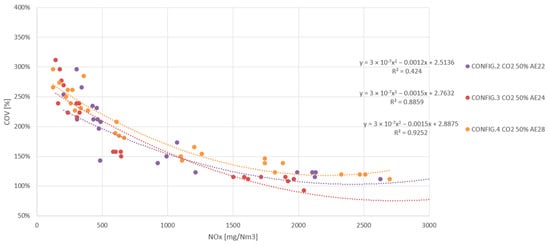
Figure 9.
Pressure covariance as a function of exhaust NOx in configurations 2, 3 and 4.
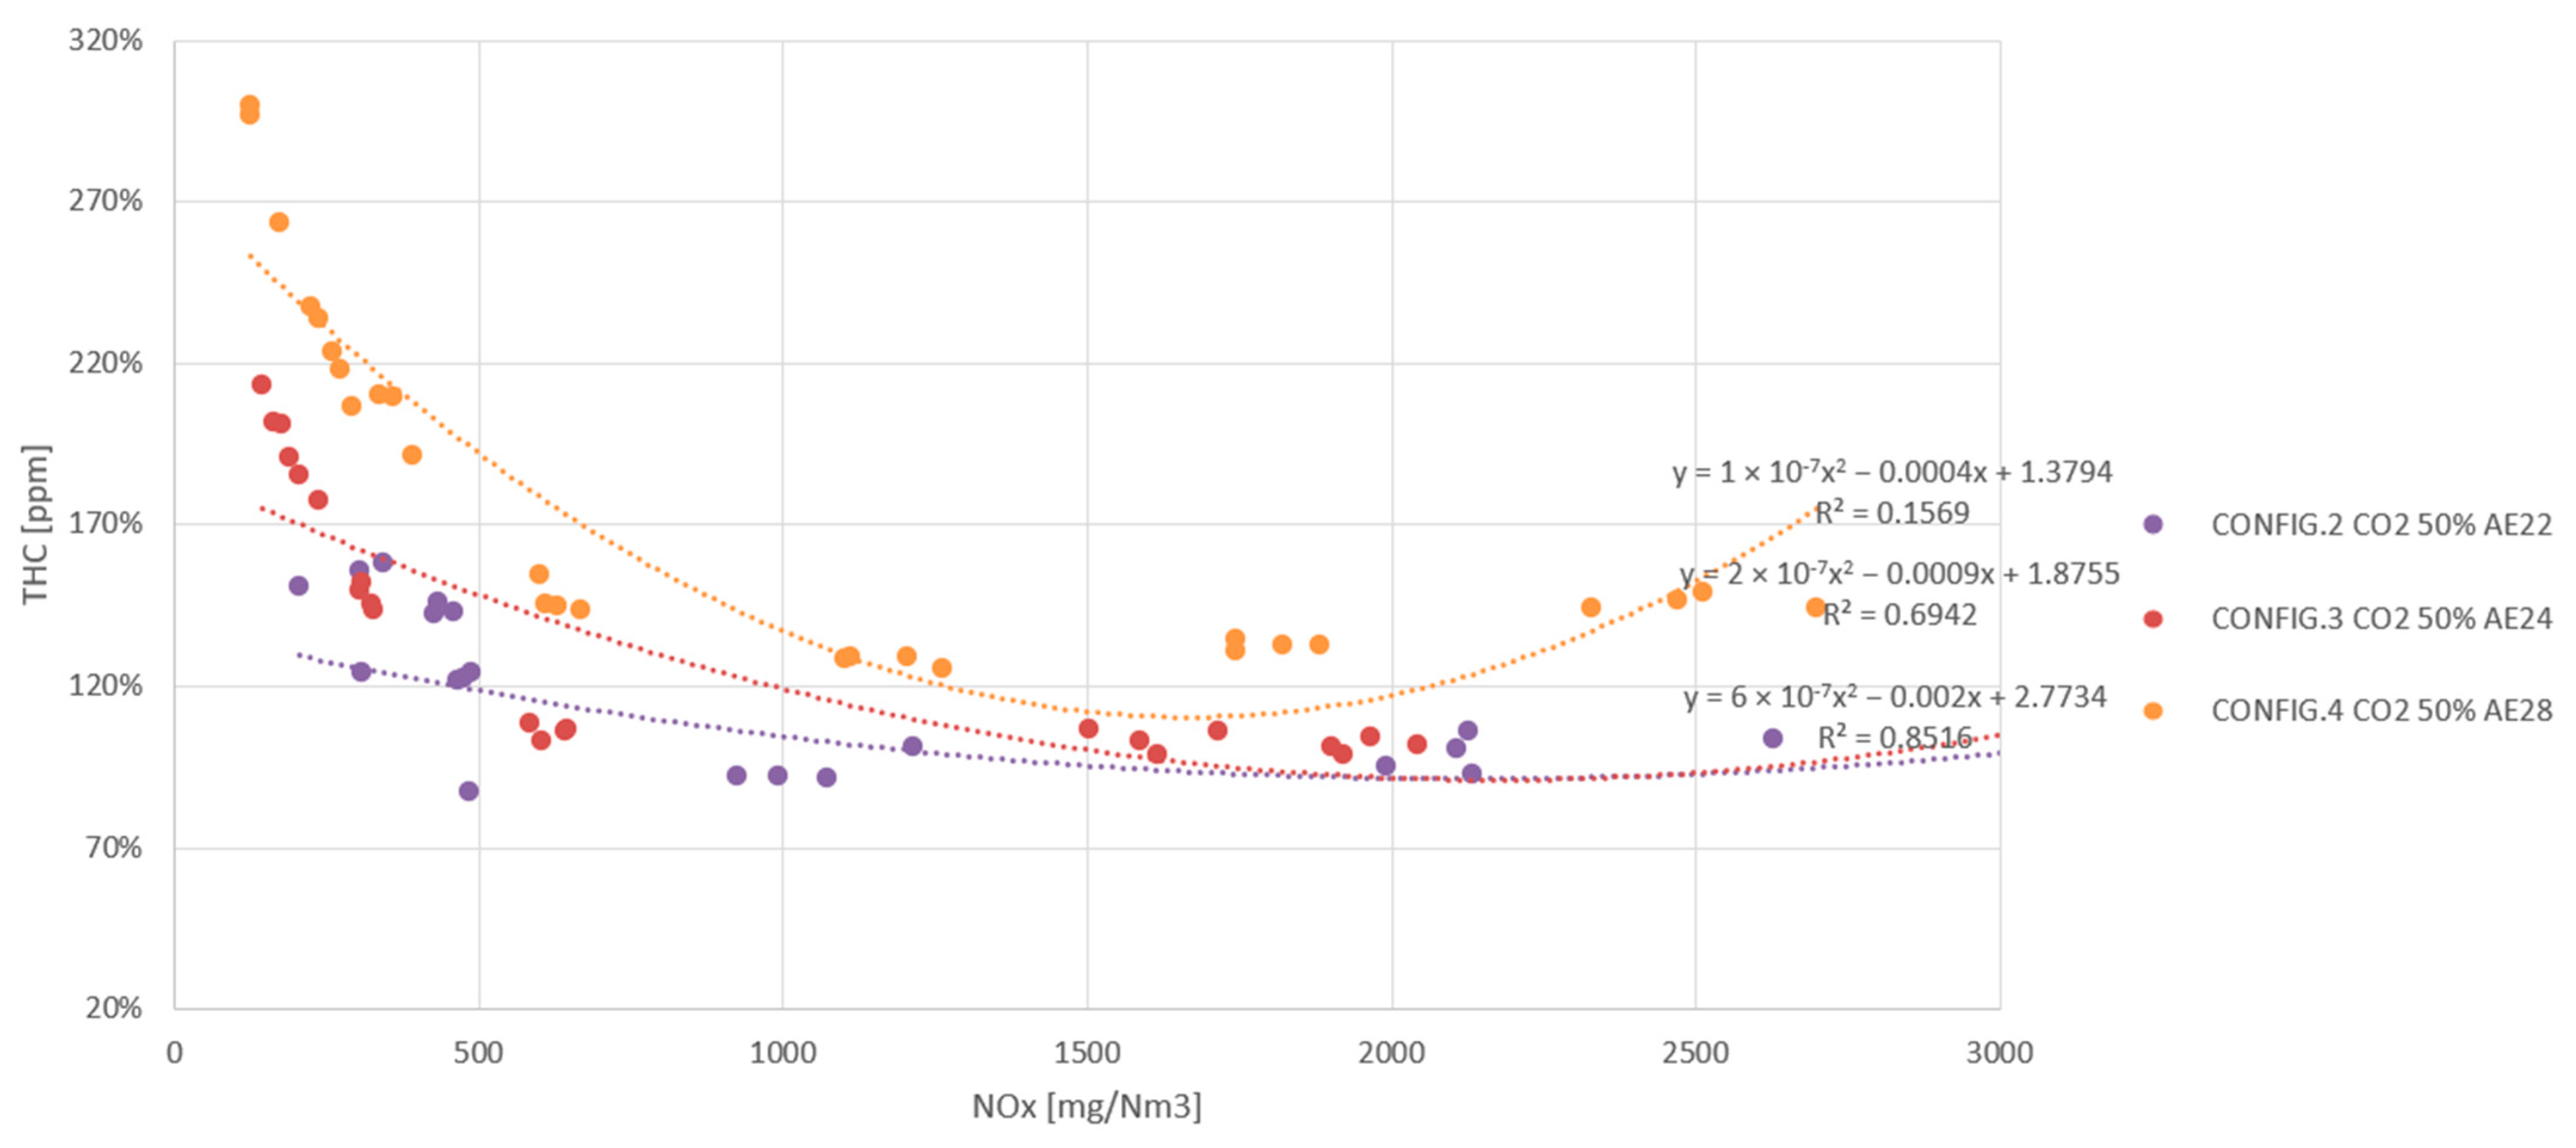
Finally, with regard to the total exhaust hydrocarbon concentration, depicted in Figure 10, once again, the results for the three configurations are very similar and again tend to decrease as the combustion becomes richer. A higher THC emission may be seen with configuration 4, which is in line with what was previously published by C.E. Castilla Alvarez et al. in a review of the state of the art in prechamber systems. In that paper, higher THC emissions were attributed to a reduction in prechamber volume and an increase in the number of holes in the prechamber [30]. Roethlisberger and Favrat also observed higher THC emission levels when the prechamber had more holes [19,29]. According to their research, the penetration of flames from the prechamber is greater with fewer holes, which results in more efficient combustion.
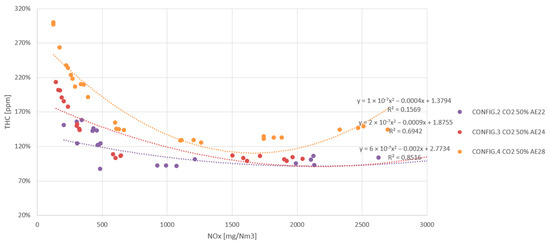
Figure 10.
Total hydrocarbons as a function of exhaust NOx in configurations 2, 3 and 4.
To summarise the results obtained in this test, the best prechamber option would be configuration 3, because it has higher efficiency and a better misfire limit. From the above two points, it can be seen that the central hole may be advantageous, because the central hole slightly improves firing inside the prechamber. This would allow the engine ignition timing to increase, improving efficiency without penalising the misfire margin. Configuration 4 would be ruled out due to low efficiency and high concentration of unburnt exhaust gases. However, it seems that the smaller volume and hole configuration of the prechamber could help to have a wider misfire margin, especially in terms of the prechamber firing capacity it offers.
3.1.2. Test 2. Optimisation of the Spark Plug Design
As with prechambers, the spark plug also offers possibilities to increase engine efficiency and stabilise combustion, even at low emissions. The goal, then, is to find a spark plug design that improves flame generation in the prechamber, promotes firing in the spark plug gap and reduces the occurrence of non-combustion cycles. This section presents the results obtained through different modifications to the fundamental spark plug design parameters.
The different spark plug designs tested are listed in Table 10. Since this test consists of comparing the behaviour of different spark plug designs and studying the effects associated with installing them in the engine, configurations 5, 6 and 7 (Table 9) will be compared, taking configuration 3 as the benchmark configuration (see Table 7), so that the only difference between them is the spark plug. To summarise, it can be said that the thin J spark plug (SPB, configuration 3) will be compared with a thick J spark plug (SP, configuration 5), with the same thickness and a more inserted J spark plug (SPA, configuration 6), and finally with a spark plug with another shape with the same amount of precious metal and in the same position as configuration 5 (SPC, configuration 7).
Engine mapping with minimum ignition timing was carried out and misfire and knocking limits were obtained in each of the configurations shown in Table 13. It can be seen that in all cases, the targets described in Table 4 for the detonation limits, which were >2000 mg NOx/Nm3, are largely met. With regard to the misfire limits, configuration 5 (SP) shows that the proposed targets are achieved (<250 mg NOx/Nm3), although it remains close to the target value. This may indicate that there are more ignition problems when the spark plug electrode is thicker. Configuration 6 (SPA) also meets the objectives, but in this case more comfortably than configuration 5. This shows that inserting the spark plug further into the prechamber can compensate the effect of the thicker electrode. In addition, there is no increased tendency for detonation due to the spark plug being inserted further into the prechamber. Finally, configuration 7 (SPC) is not able to reach the operating point of 250 mg NOx/Nm3, which leads to the conclusion that the round electrode has more ignition problems at low emissions than the J-shaped electrodes.
Table 13.
Ignition timings and misfire and detonation limits for different passive spark plugs.
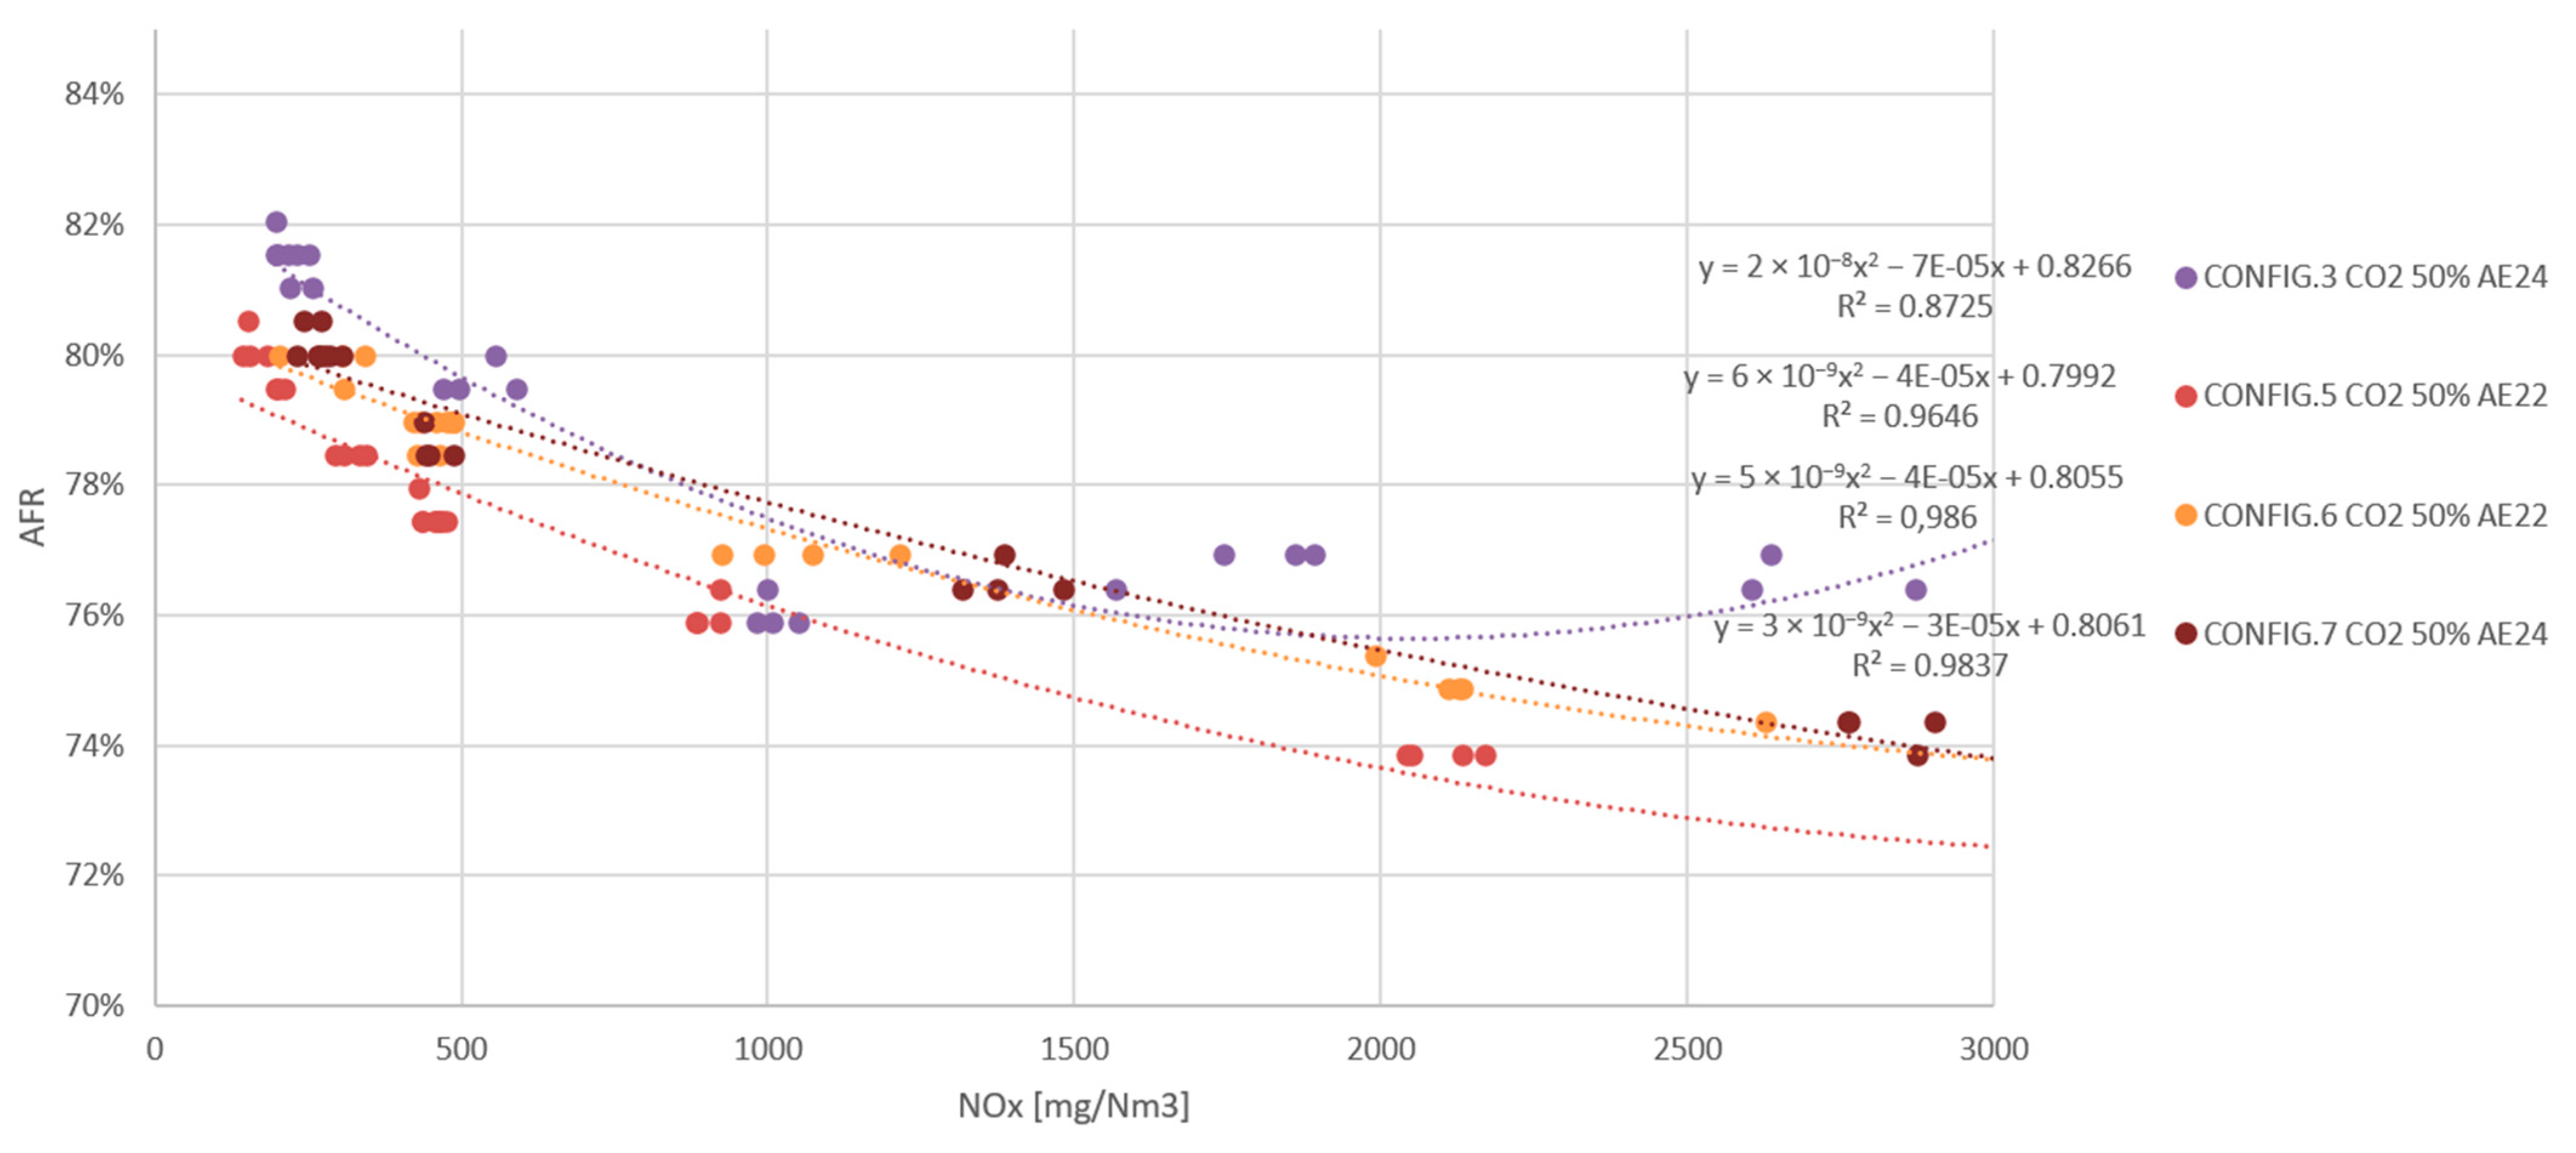
The results of the analysis of the air/fuel ratio used in the engine for the different spark plugs are presented in Figure 11. The graph shows that it is configuration 6 that requires a richer mixture to maintain the power of the torches. This is logical, because the prechamber volume is smaller in this configuration, while configurations 5 and 7 do not differ greatly from configuration 3. Therefore, it could be said that the use of a thicker electrode requires more ignition energy to increase the margin to misfire, but does not require a richer mixture inside the prechamber [31]. Again, this behaviour is corrected by inserting the spark plug further into the prechamber. Finally, comparing configurations 5 and 7, it seems that in this case, the shape of the electrode does not have a decisive influence on the AFR.
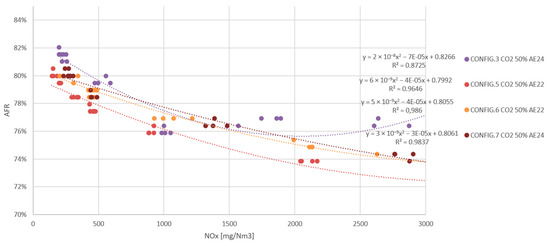
Figure 11.
AFR as a function of exhaust NOx in configurations 3, 5, 6 and 7.
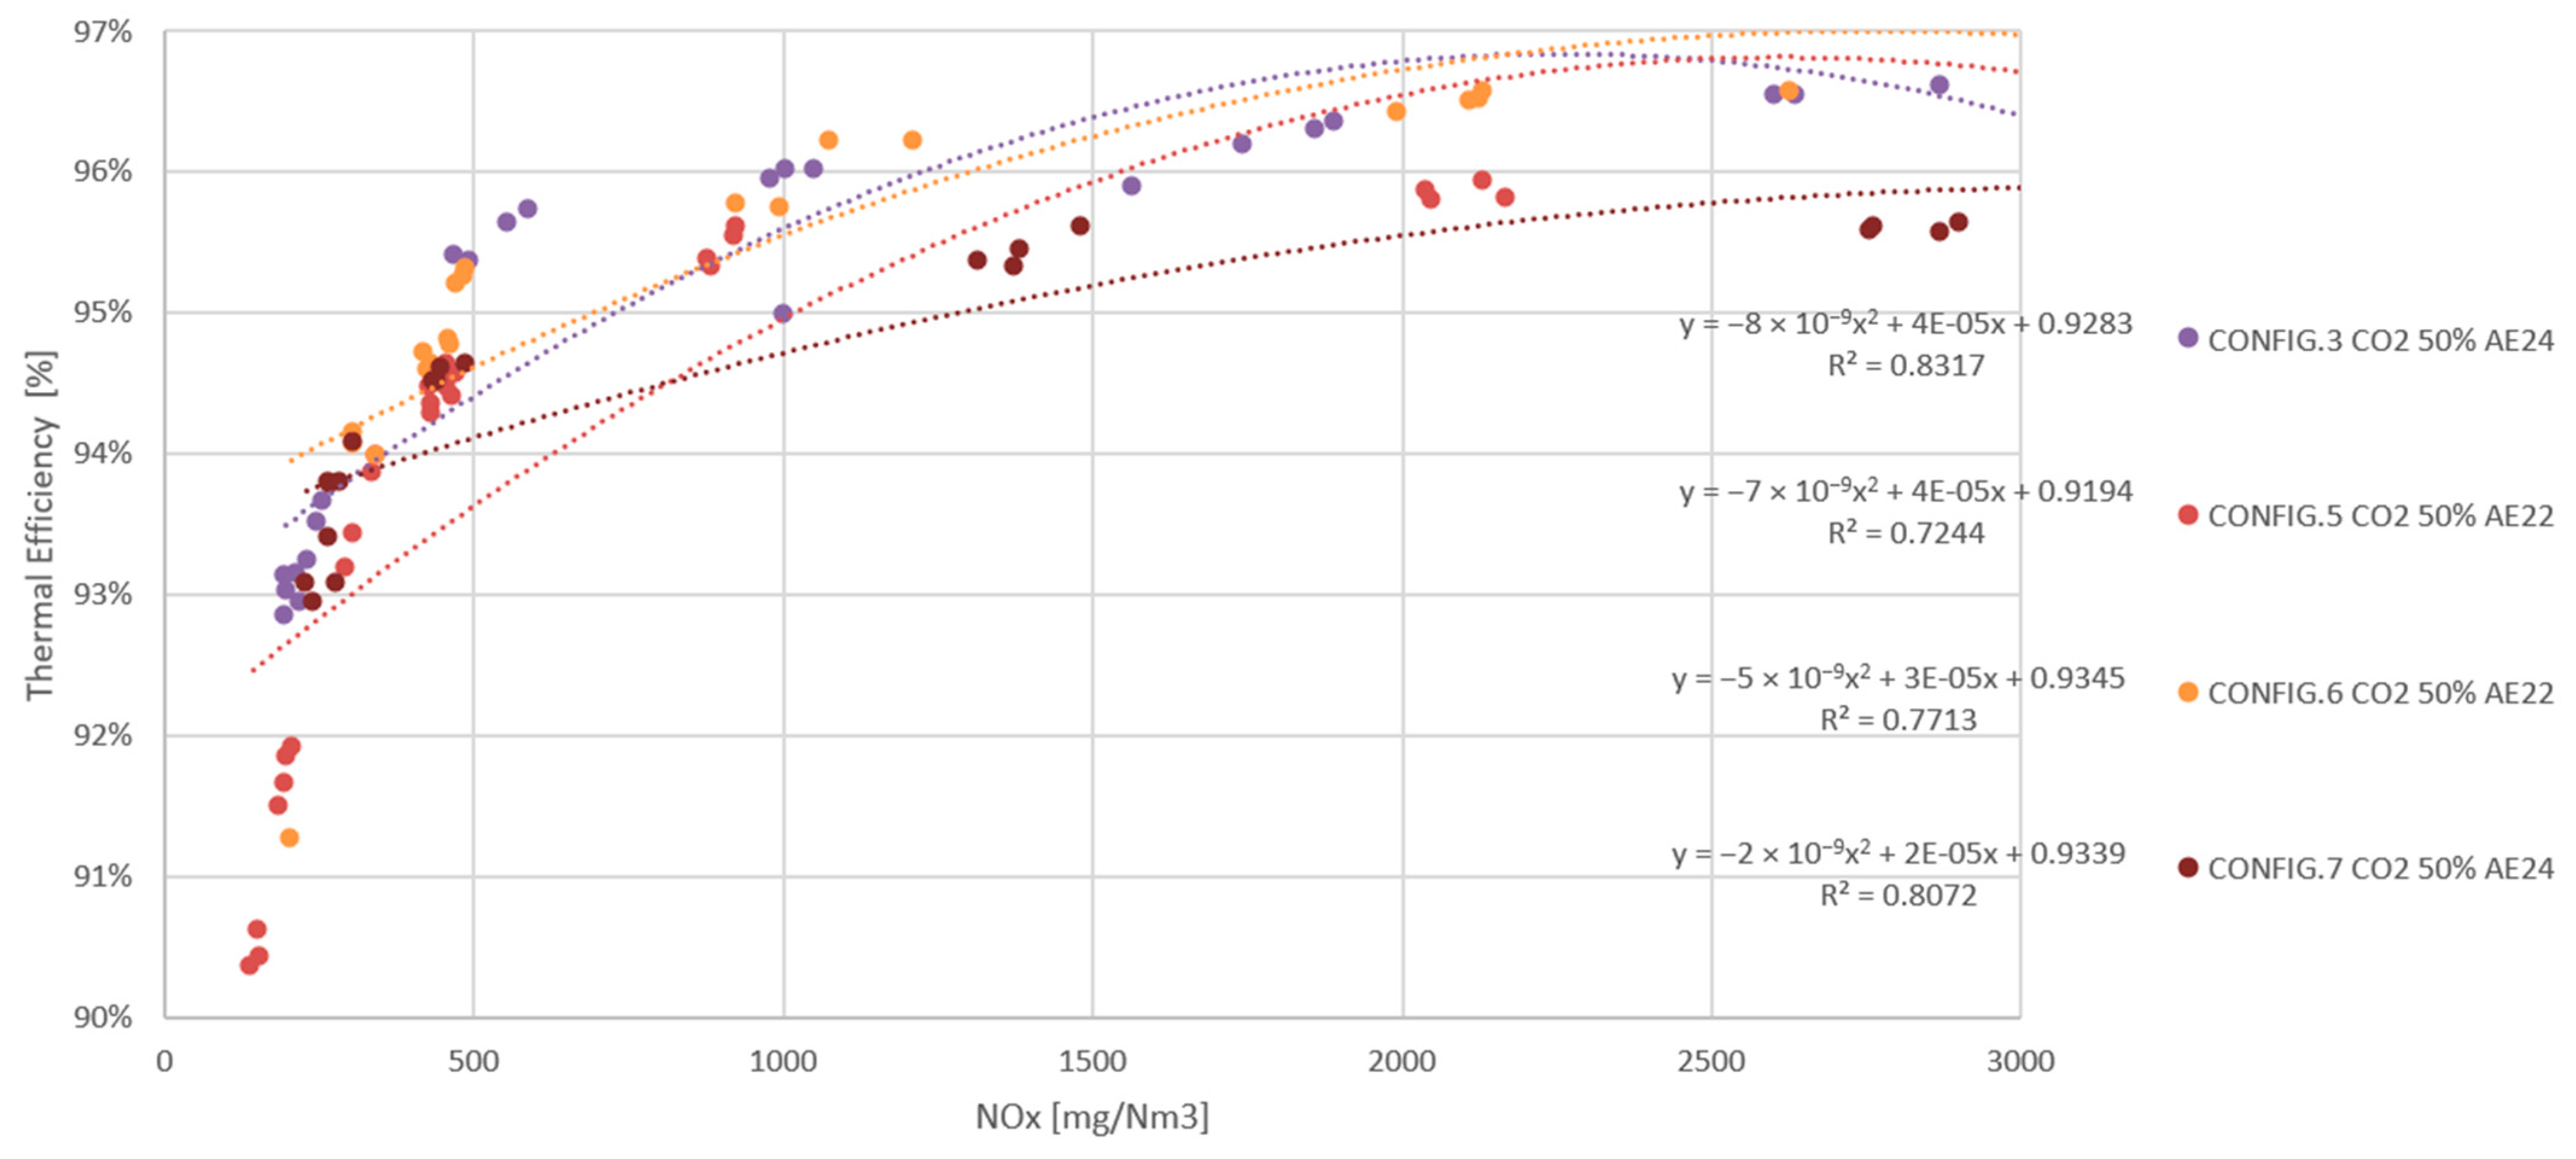
Figure 12 shows the efficiency results. Configurations 5, 6 and 7 have significantly lower performance than configuration 3, with a difference of almost 1 point at the operating point of 500 mg NOx/Nm3. The differences are not high due to the fact that once the spark plug ignites the mixture (although it needs more energy to do so), combustion and combustion efficiency depend on other factors such as lambda, prechamber volume, gas composition and turbulence.
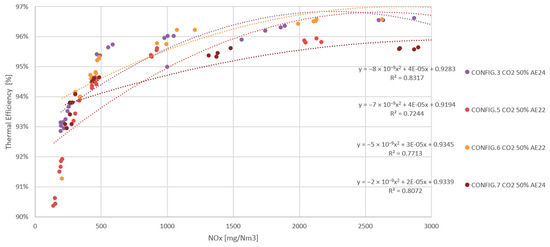
Figure 12.
Thermal efficiency as a function of exhaust NOx in configurations 3, 5, 6 and 7.
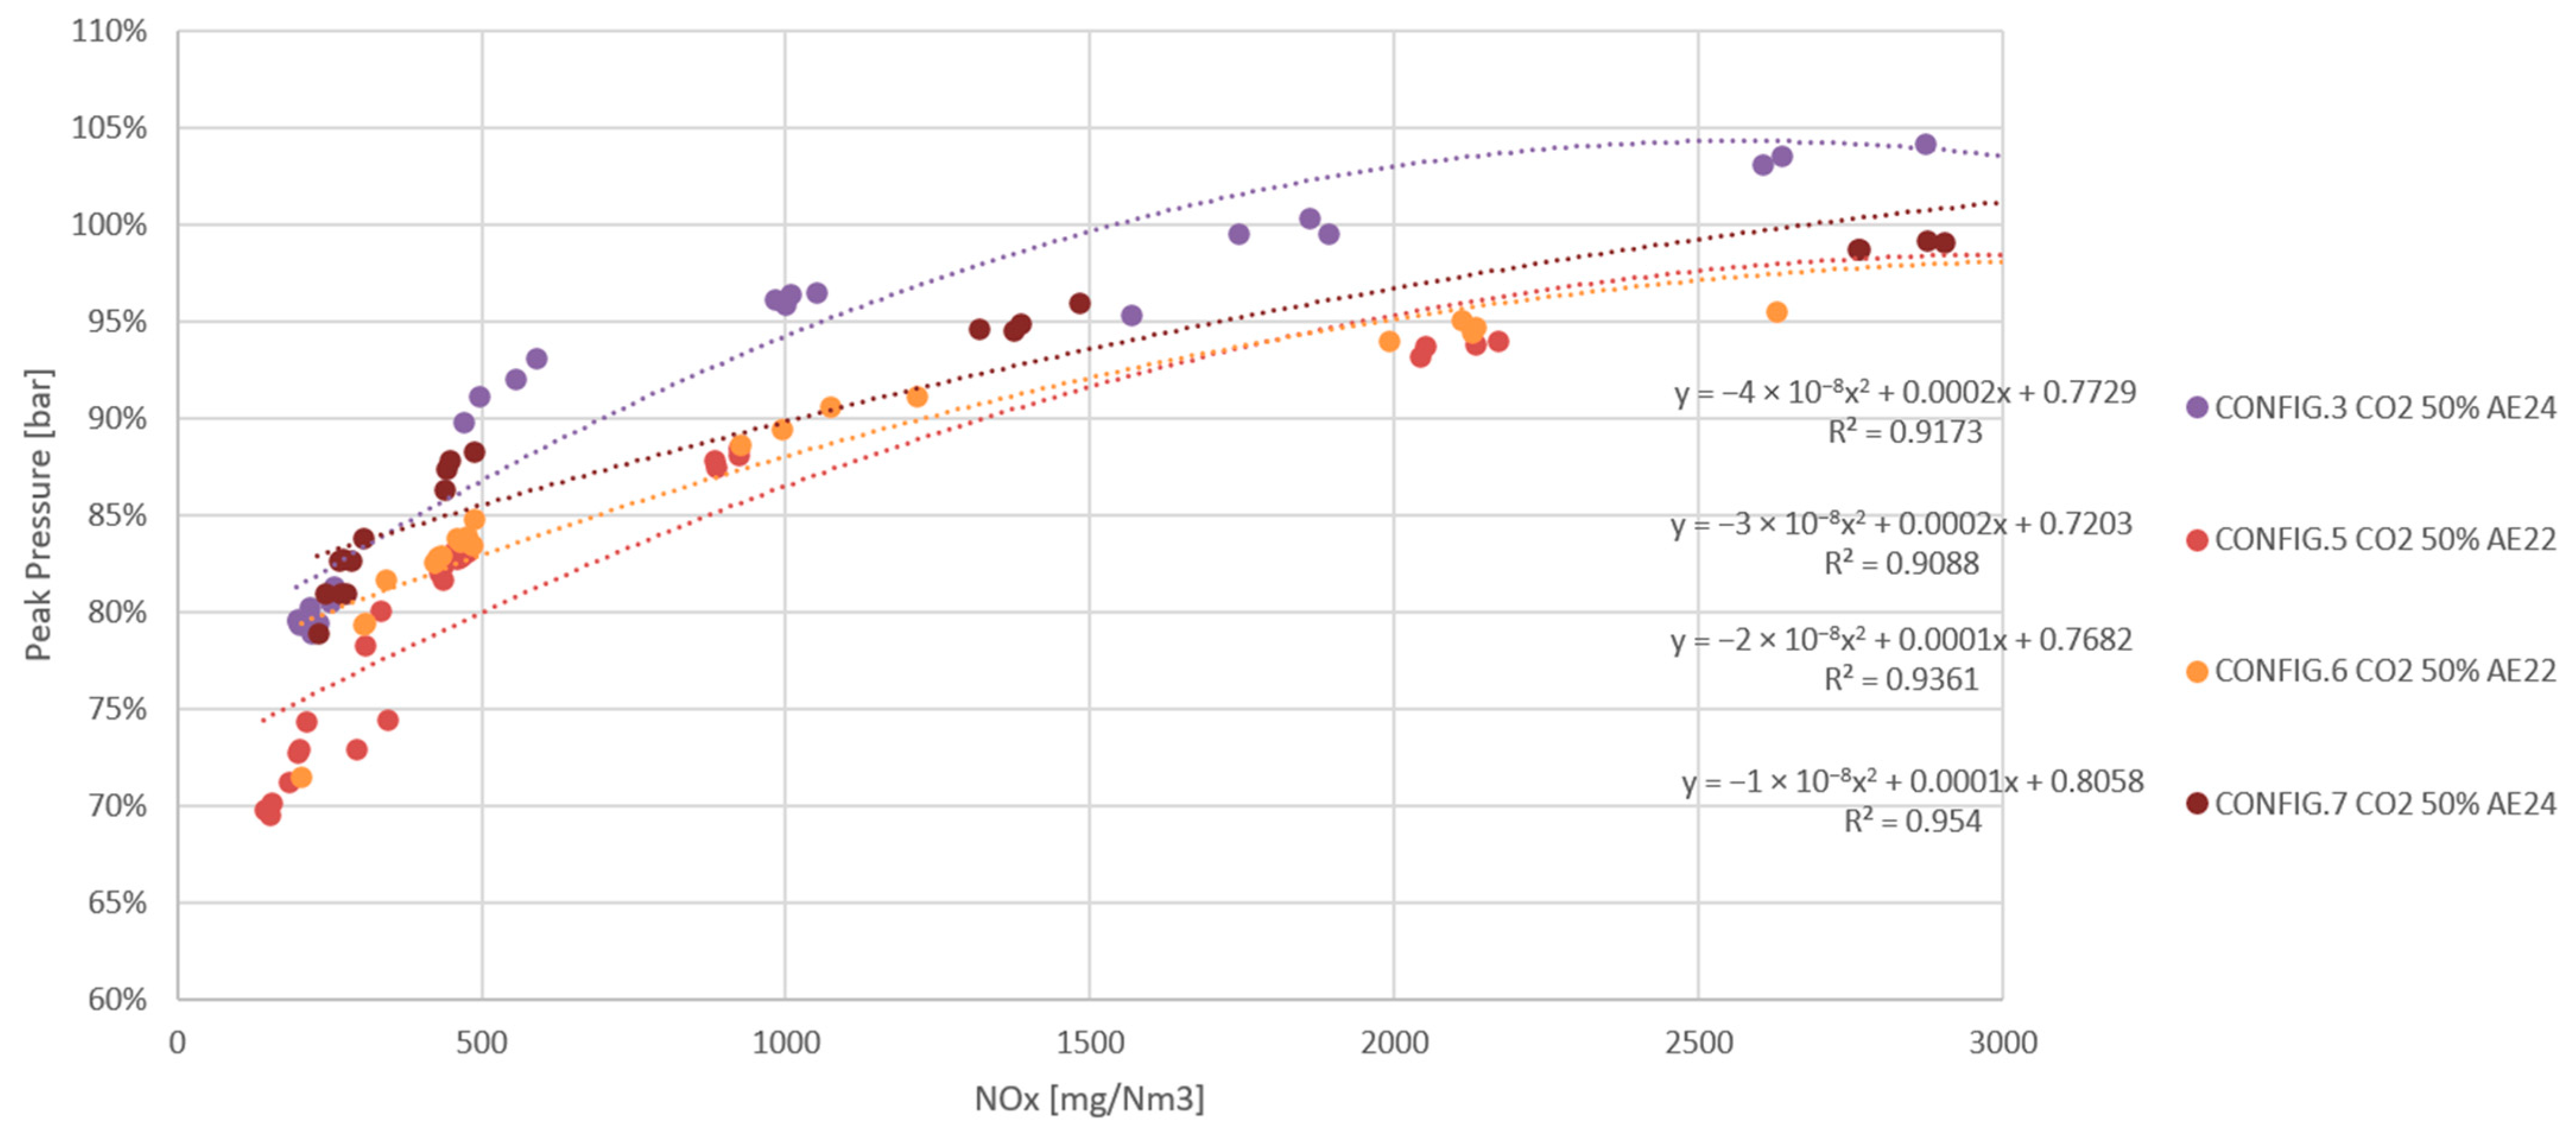
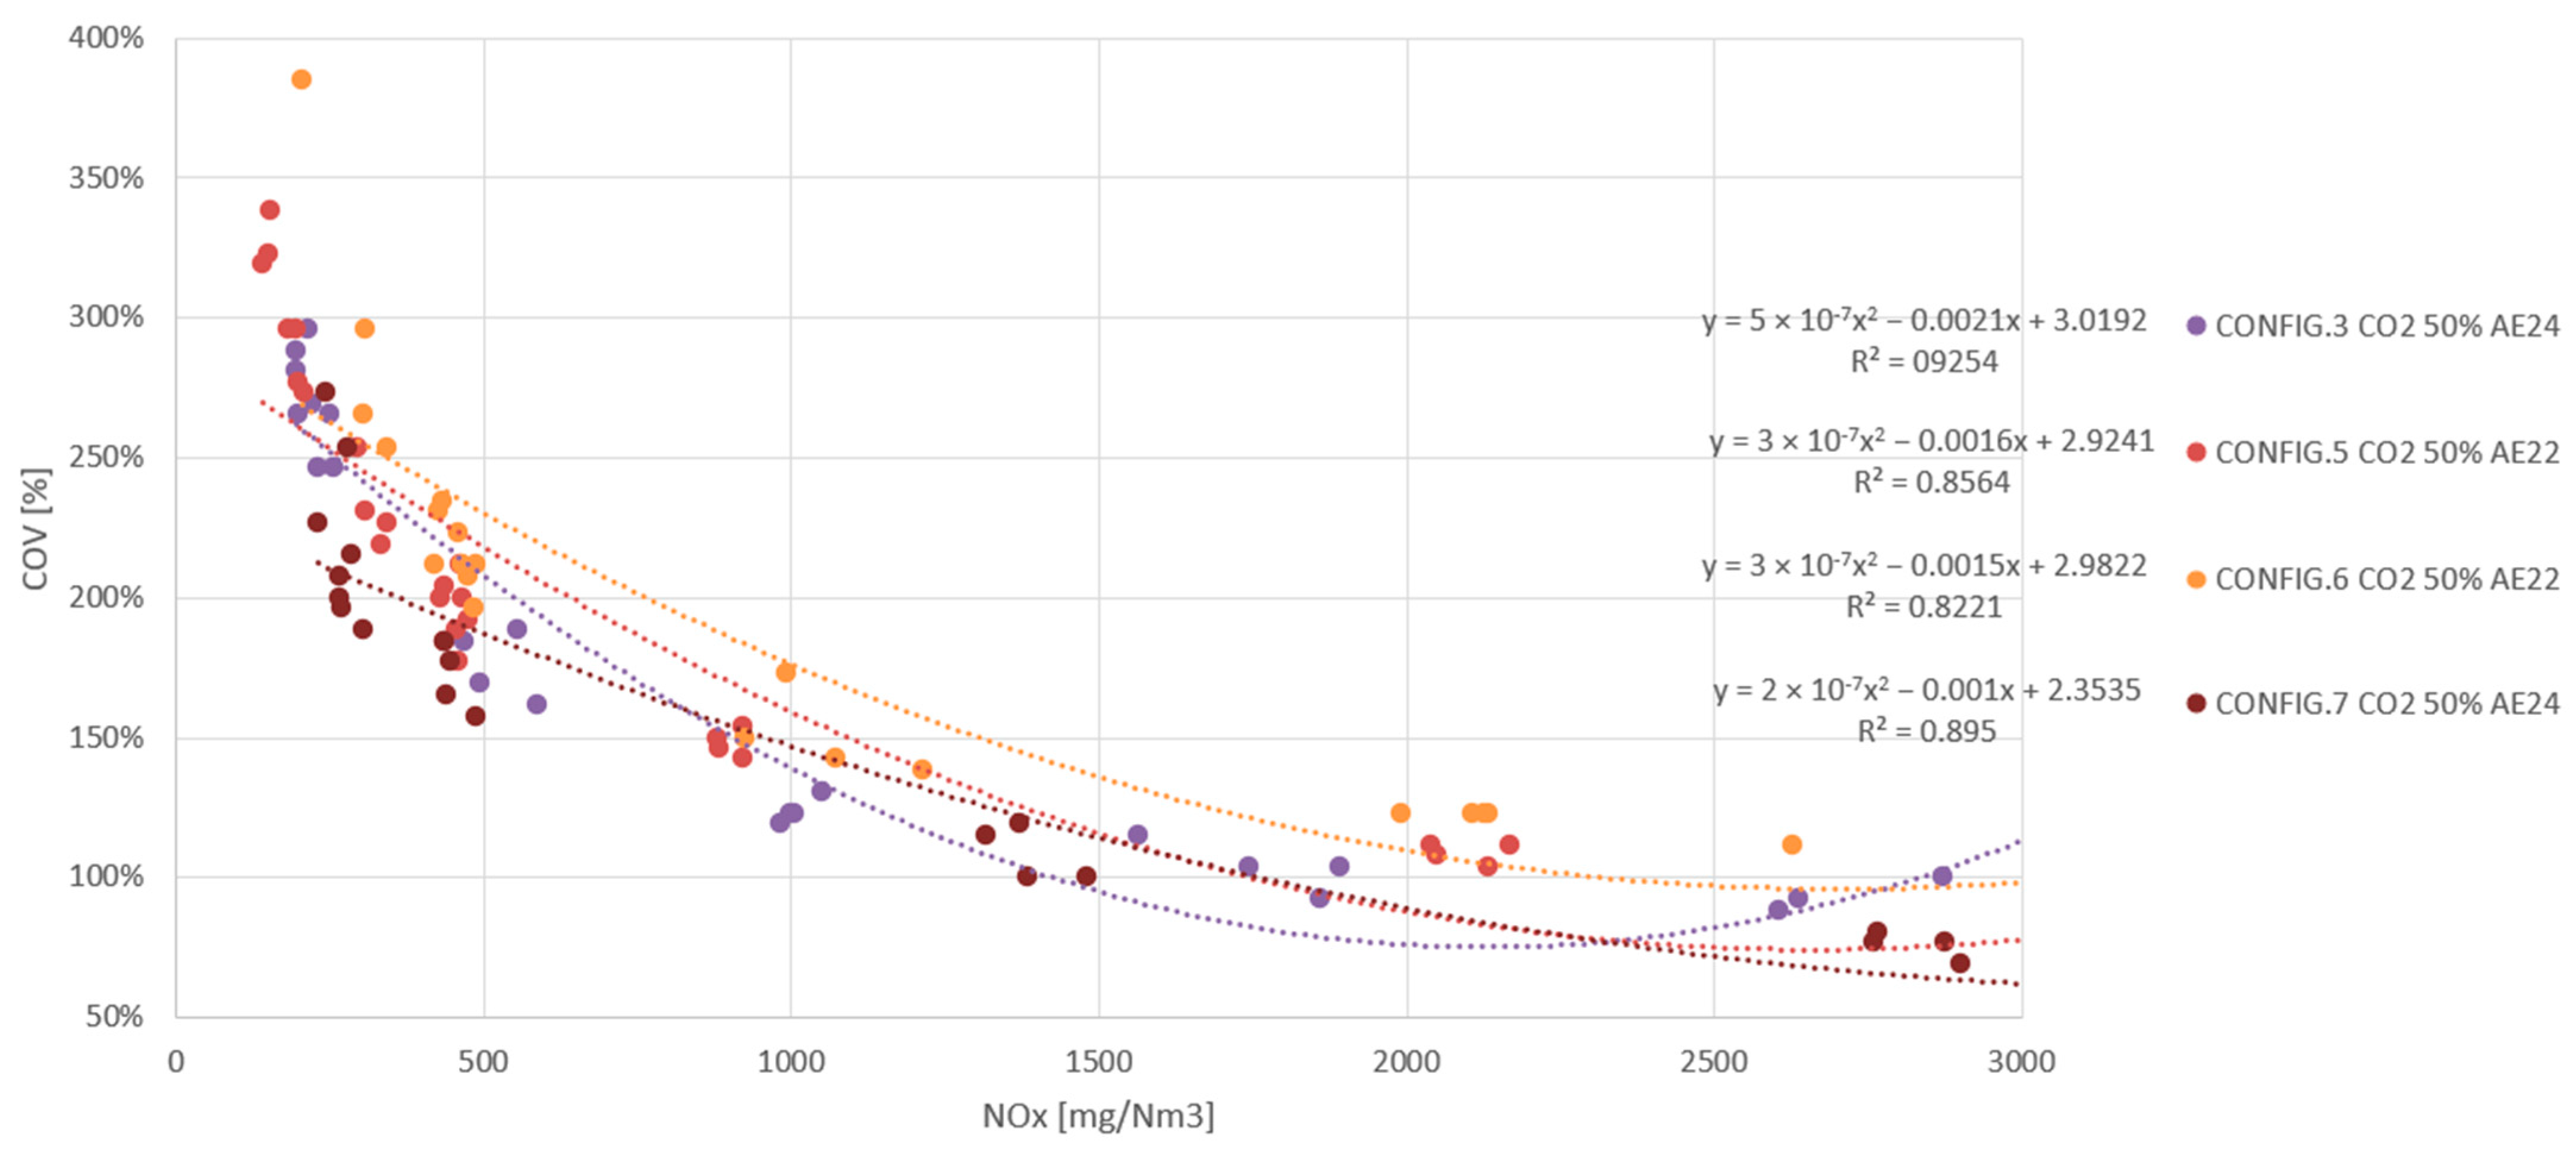
The maximum pressure in the combustion chamber is shown in Figure 13. In this case, no significant differences are observed between the different spark plugs tested. However, there is higher variability in the data for combustion at low emissions, namely, below 500 mg NOx/Nm3. This is something that was also observed in Figure 12 and is probably related to the inherent instability of combustion processes with such a low fuel ratio. This observation is corroborated by the results shown in Figure 14, where the covariance of the maximum pressure is higher in the poorer combustion tests.

Figure 13.
Maximum pressure as a function of exhaust NOx in configurations 3, 5, 6 and 7.
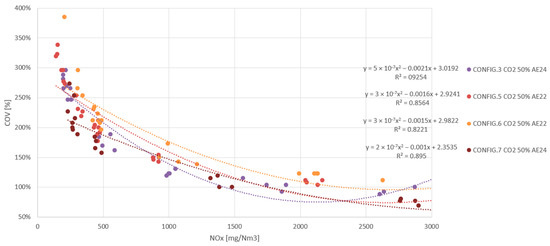
Figure 14.
Maximum pressure covariance as a function of exhaust NOx in configurations 3, 5, 6 and 7.
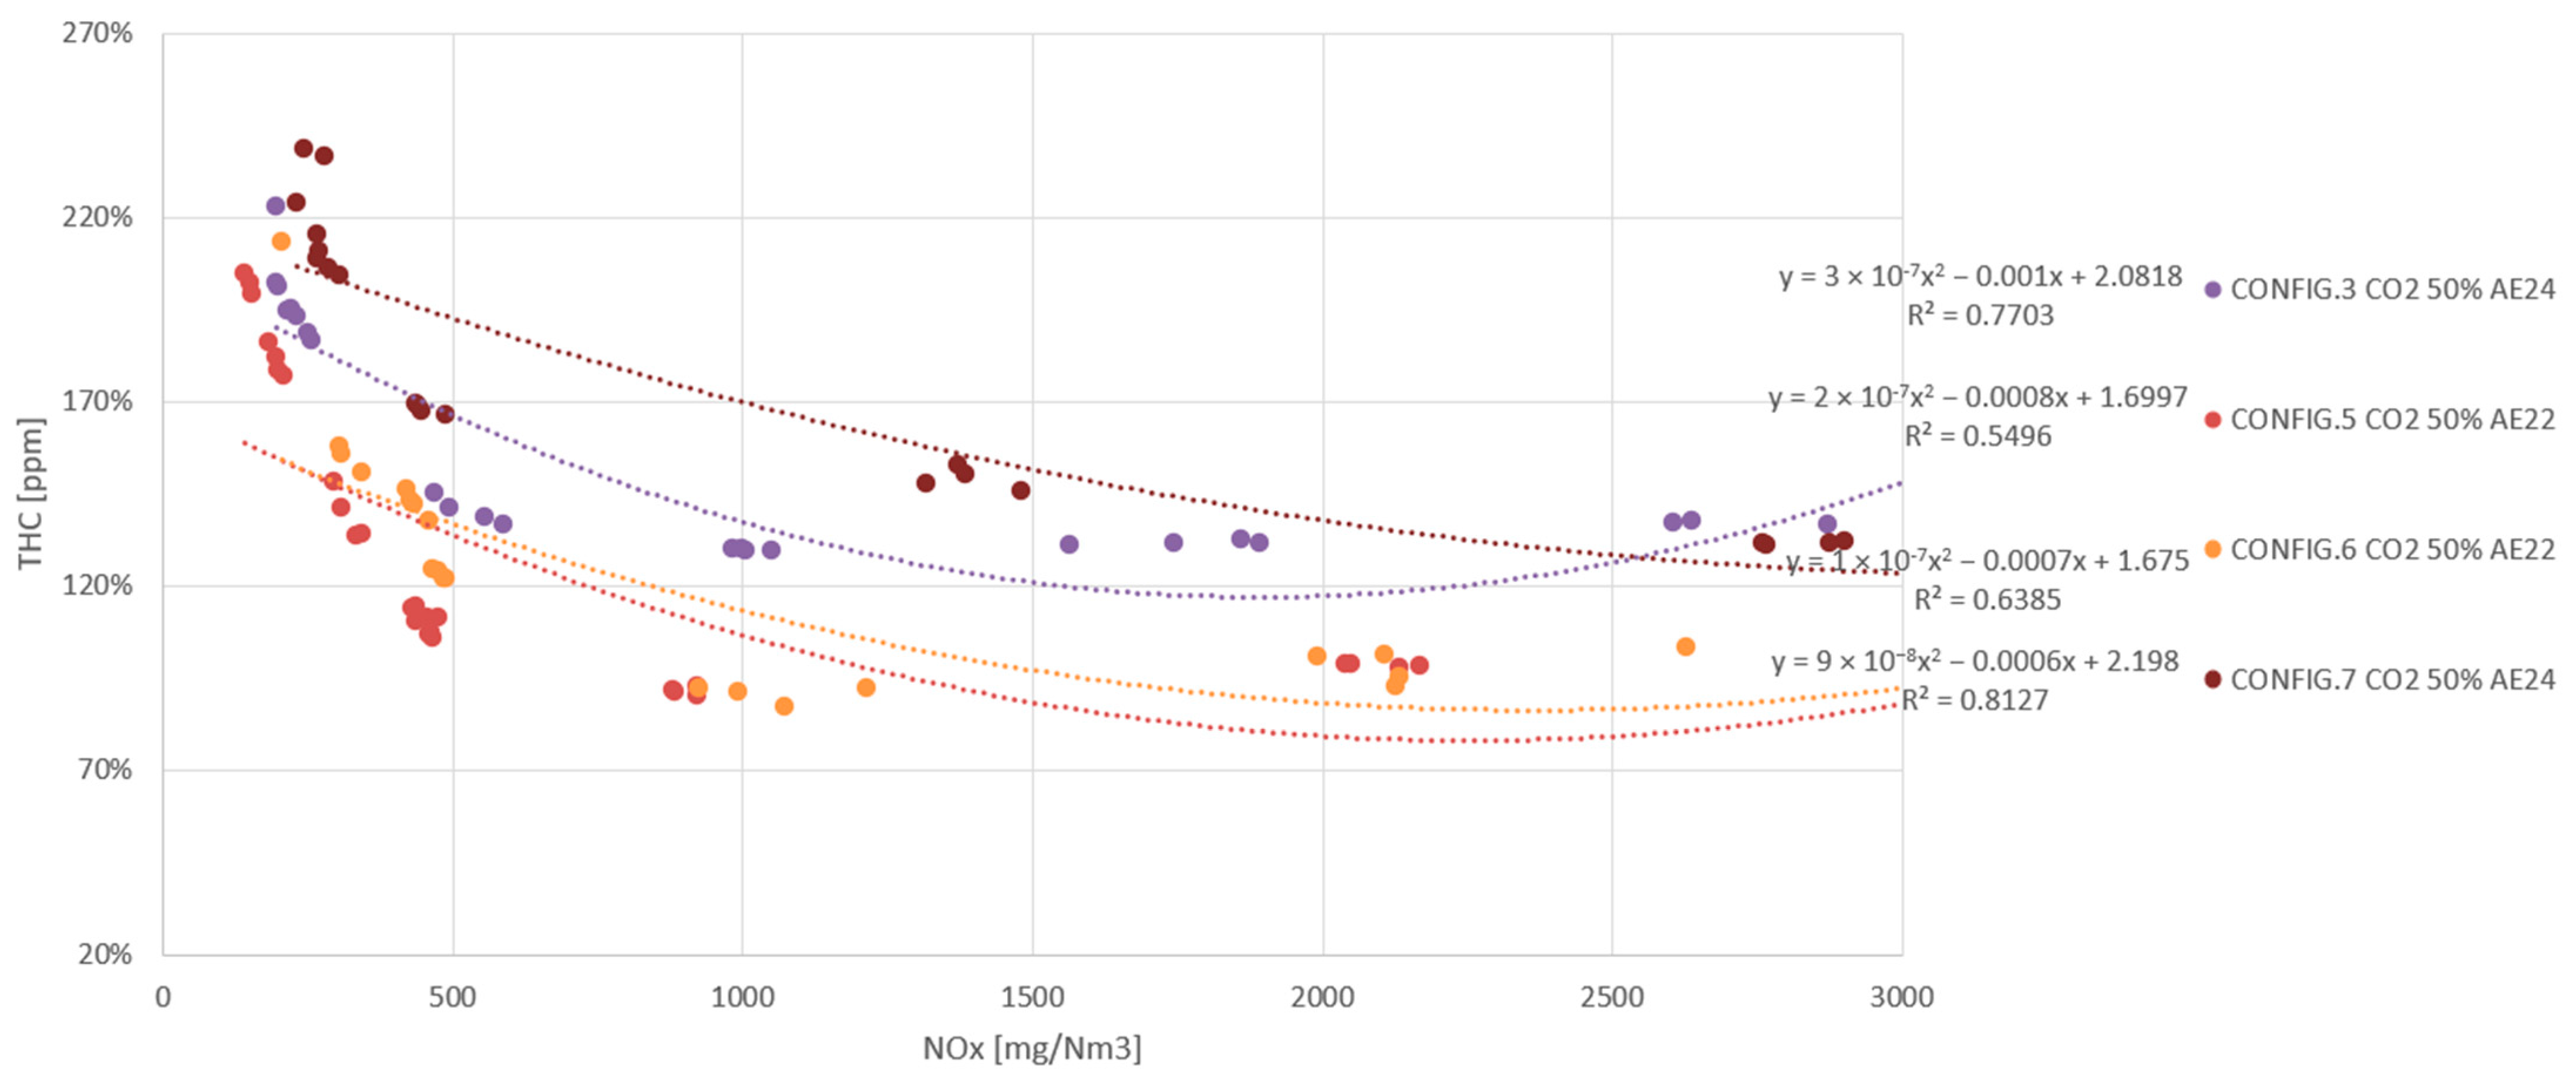
Finally, Figure 15 shows the results obtained for total hydrocarbon emissions in exhaust gases. In this case, taking the operating point of 500 mg NOx/Nm3 as an example, a clearly higher THC emission is observed for configuration 7, which emits about 35 percentage points above the emissions of configuration 3. This clearly indicates the poor quality of combustion obtained with the round electrode spark plug. With regard to the J spark plugs, configurations 5 and 6 emit practically the same volume of emissions as each other and slightly less than configuration 3, so it seems that a thick spark plug improves combustion quality in this respect, with no relevant differences observed with regard to prechamber insertion.
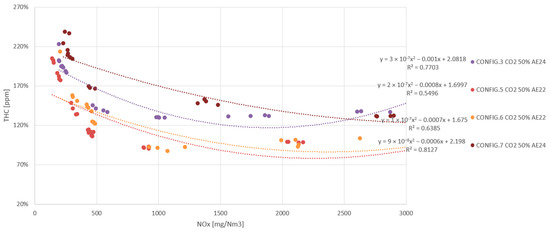
Figure 15.
Total hydrocarbons as a function of exhaust NOx in configurations 3, 5, 6 and 7.
As a general conclusion of this test, it can be said that the round spark plug (configuration 7) does not comply with the misfire limit and has very high THC emissions. This spark plug is therefore ruled out for further development. Among the J spark plugs, all of which comply with misfire limits, the thick spark plug (configuration 5) is closer to the misfire limit than the other two and also requires more energy to ignite. This negative aspect, which could be an argument to discard it in the selection, is partly neutralised when this spark plug is placed in a position further inside the prechamber (configuration 6). This is because the ignition margin is considerably increased, despite the efficiency reduction due to the loss of prechamber volume and the consequent weakening of the torches.
3.1.3. Summary of Results
To fully assess the results, they are summarised in Table 14. It should be recalled that these efficiency values have been obtained by generating 175 kW of power in the single-cylinder engine. This was the condition applied in all tests and is the equivalent of 2 MW in the multi-cylinder engine.
Table 14.
Efficiency at 500 mg NOx/Nm3 obtained in each of the configurations tested.
First of all, it should be mentioned that when comparing the configurations, maximum efficiency differences of around 1.9% are found.
The results show that configuration 3 would be the most optimal. Therefore, the prechamber selected would be one with a smaller volume than the G-86EM engine and with a central hole, which is the one with the best technical performance. In regard to the spark plug, the most technically competitive concept would be a J spark plug with a thin electrode, although it is not known whether that might have some duration constraints as opposed to its counterparts. It is also important to note that the minimum efficiency loss as compared to the natural gas engine is 4.3%. This is not only caused by the ignition technology conversion, but by the piston and cylinder head modifications.
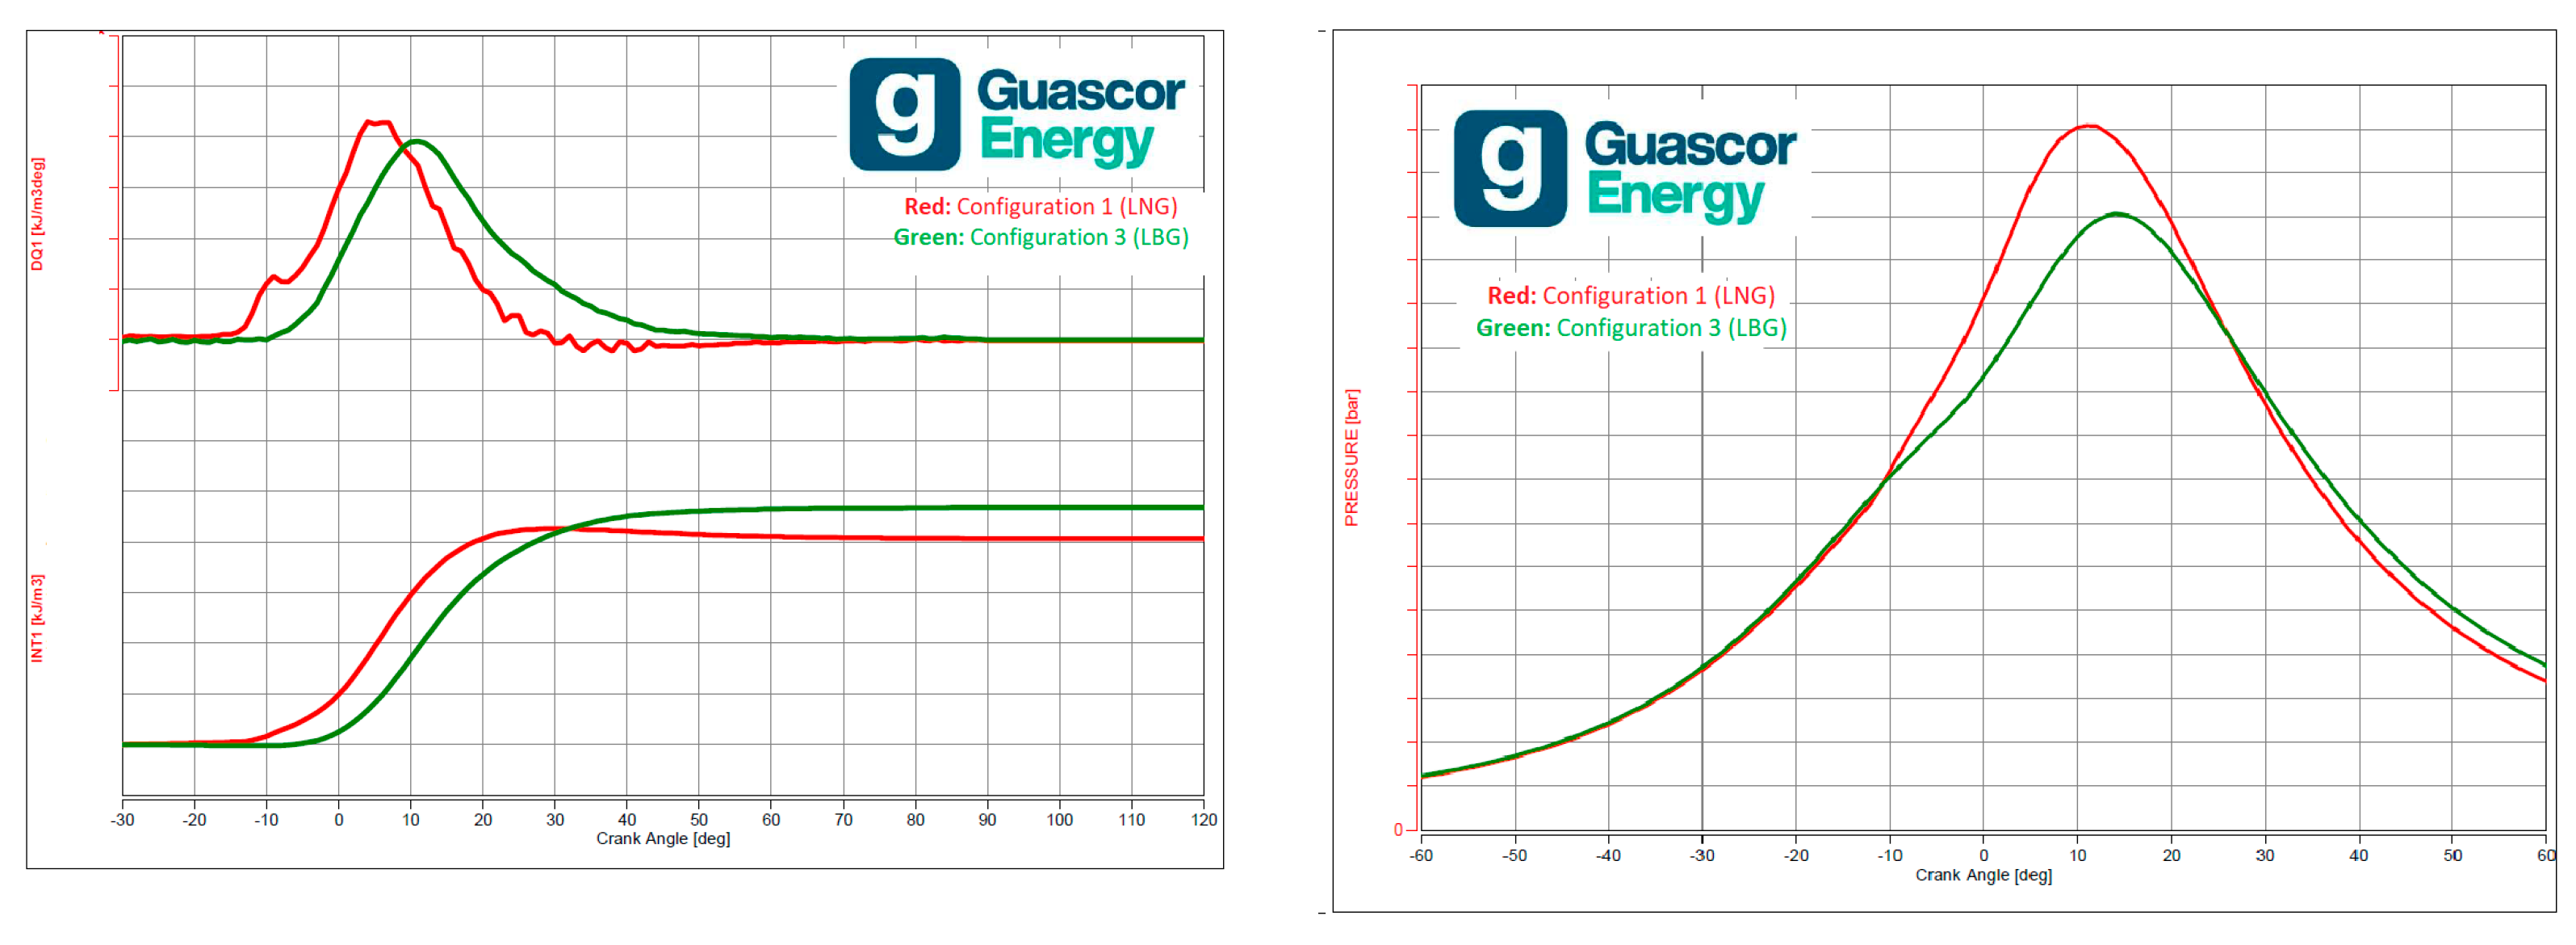
For better understanding of heat release, main chamber pressure curves for the highest LNG and LBG efficiency configuration (configuration 3) are plotted in Figure 16. These plots clearly evidence that the natural gas combustion is far quicker than that with LBG. Further to this, higher pressure is also achieved as previously explained. Thus, these two parameters explain the reasons that the LNG engine can achieve higher thermal efficiencies.
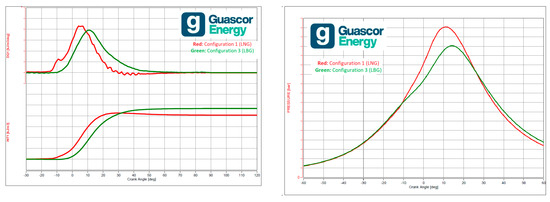
Figure 16.
Heat release (left) and main chamber pressure (right) curves in configurations 1 and 3.
Following studies would imply a prechamber development for every gas configuration available in the market; however, this paper allows us to determine a methodology to select the most versatile prechamber providing the highest efficiency under the most demanding boundary conditions.
4. Conclusions
The main conclusions drawn from this study are:
With regard to the different prechamber designs:
- ○
- For landfill biogas, the best prechamber is the one with less volume, but with a central hole (PPB), because it improves firing, which allows the combustion progress to advance and provides greater efficiency by improving the misfire limit, despite having greater THC emissions into the atmosphere.
- ○
- The smaller prechamber volume configuration, with different hole orientation and central hole (PPC), significantly penalises thermal efficiency and total hydrocarbon concentration in the exhaust. In other words, despite improving firing in the prechamber with the smaller volume and the central hole, it seems that the reduction in volume of the prechamber is excessive and not able to generate combustion in such an energetic and stable way as the previous two prechambers.
With regard to the optimisation of the spark plug design, the following conclusions can be drawn from experimental results:
- ○
- The J spark plug with a thin electrode (SPB) is the best performing spark plug because it provides higher efficiency with a sufficiently wide misfire limit.
- ○
- The thick electrode (SP) lengthens the spark plug’s life, but has a tight misfire limit. This forces the ignition timing of the engine to be retarded.
- ○
- Lowering the position of the thick-electrode spark plug (SPA) greatly improves firing in the electrode gap and extends the misfire margin, but the loss of volume in the prechamber reduces thermal efficiency.
- ○
- The circular electrode (SPC) cannot comply with the minimum misfire limits, so the balance at 250 mg NOx/Nm3 could not be released and this design is discarded.
In general, it must be concluded that by modifying both the prechamber and the spark plug, maximum improvements in thermal efficiency of 1.9% can be achieved, even if they will be always lower than LNG. Thus, by applying the proposed methodology, the thermal efficiency of any engine using alternative marine fuel could be improved.
Author Contributions
Conceptualization, A.R.Z., I.O.B., A.L.M., I.L.L. and J.A.O.; methodology, A.R.Z., I.O.B., A.L.M., I.L.L. and J.A.O.; software, A.R.Z., I.O.B., A.L.M., I.L.L. and J.A.O.; validation, A.R.Z., I.O.B., A.L.M., I.L.L. and J.A.O.; formal analysis, A.R.Z., I.O.B., A.L.M., I.L.L. and J.A.O.; investigation, A.R.Z., I.O.B., A.L.M., I.L.L. and J.A.O.; resources, A.R.Z., I.O.B., A.L.M., I.L.L. and J.A.O.; data curation, A.R.Z., I.O.B., A.L.M., I.L.L. and J.A.O.; writing—original draft preparation, A.R.Z., I.O.B., A.L.M., I.L.L. and J.A.O.; writing—review and editing, A.R.Z., I.O.B., A.L.M., I.L.L. and J.A.O.; visualization, A.R.Z., I.O.B., A.L.M., I.L.L. and J.A.O.; supervision, A.R.Z., I.O.B., A.L.M., I.L.L. and J.A.O.; project administration, A.R.Z., I.O.B., A.L.M., I.L.L. and J.A.O.; funding acquisition, A.R.Z., I.O.B., A.L.M., I.L.L. and J.A.O. All authors have read and agreed to the published version of the manuscript.
Funding
This research was funded by Guascor Energy Engines R&D in the Basque Country (Vitoria-Gasteiz).
Informed Consent Statement
Not applicable.
Data Availability Statement
The data presented in this study are available on request from the corresponding author. The data are not publicly available due to privacy.
Acknowledgments
Thanks are extended to the Department of Marine Engineering of the University of Coruña (UDC).
Conflicts of Interest
The authors declare no conflict of interest.
Abbreviations
| AFR | air/fuel ratio |
| APG | associated petroleum gas |
| BMEP | brake mean effective pressure |
| °C | degrees Celsius |
| cm3 | cubic centimetre |
| CAPEX | capital expenditure |
| CHA | cylinder head with swirl |
| CO | carbon monoxide |
| CO2 | carbon dioxide |
| CR | compression ratio |
| EIVC | early intake valve closing |
| EU | European Union |
| GE | Guascor Energy |
| GHG | greenhouse gases |
| H2S | sulphuric acid |
| HFO | heavy fuel oil |
| HHV | higher heating value |
| HVO | hydrotreated vegetable oil |
| Hz | Hertz |
| ICE | internal combustion engine |
| ISO | International Organization for Standardization |
| IMO | International Maritime Organisation |
| kW | kilowatt |
| L | litre |
| LBG | liquefied biogas |
| LFL | lower flammability limit |
| LHV | low heating value (lower calorific value (LCV)) |
| LNG | liquefied natural gas |
| LPG | liquefied petroleum gas |
| MCE | multi-cylinder engine |
| mg | milligram |
| MJ | megajoule |
| mm | millimetre |
| MN | methane number |
| MW | megawatt |
| N2 | nitrogen |
| NG | natural gas |
| NH3 | ammonia |
| Nm3 | normal cubic metre |
| NOx | nitrogen oxide |
| OCH | cylinder head without swirl |
| OM | Miller cycle camshaft |
| OP | flat piston |
| OPC | injected prechamber |
| OPEX | operational expenditures |
| PB | bowl-shaped piston |
| PLC | programmable logic controller |
| PM | particulate matter |
| PP | passive prechamber |
| TDC | top dead centre |
| r.p.m | revolutions per minute |
| R&D | research and development |
| SCE | single-cylinder engine |
| SOx | sulphur oxides |
| SP | J spark plug |
| THCs | total hydrocarbons |
| UDC | University of A Coruña |
| UFL | upper flammability limit |
| μm | micrometre |
| € | euros |
References
- Hansson, J.; Mansson, S.; Brynolf, S.; Grahn, M. Alternative marine fuels: Prospects based on multi-criteria decision analysis involving Swedish stakeholders. Biomass Bioenergy 2019, 126, 159–173. [Google Scholar] [CrossRef]
- Wang, Q.; Zhang, H.; Huang, J.; Zhang, P. The use of alternative fuels for maritime decarbonization: Special marine environmental risks and solutions from an international law perspective. Front. Mar. Sci. 2023, 9, 1082453. [Google Scholar] [CrossRef]
- Ryste, J.A.; Wold, M.; Sverud, T. Comparison of Alternative Marine Fuels; Report No. 2019-0567; DNV: Hovik, Norway, 2019. [Google Scholar]
- Brynolf, S.; Fridell, E.; Andersson, K. Environmental assessment of marine fuels: Liquefied natural gas, liquefied biogas, methanol and bio-methanol. Clean. Prod. 2014, 74, 86–95. [Google Scholar] [CrossRef]
- Bilgili, L. Comparative assessment of alternative marine fuels in life cycle perspective. Renew. Sustain. Energy Rev. 2021, 144, 110985. [Google Scholar] [CrossRef]
- Philipp, R. Blockchain for LBG Maritime Energy Contracting and Value Chain Management: A Green Shipping Business Model for Seaports. Environ. Clim. Technol. 2020, 24, 329–349. [Google Scholar] [CrossRef]
- Alonso, L.; Oregui, I.; Weinrotter, M.; Iruretagoiena, I. Pre-chamber spark plug development for highest efficiencies at Dresser-Rand’s Guascor® gas engines. In Heavy-Duty-, On- und Off-Highway-Motoren; Siebenpfeiffer, W., Ed.; Springer Fachmedien Wiesbaden: Wiesbaden, Germany, 2014; pp. 87–103. [Google Scholar]
- Yamanaka, K.; Shiraga, Y.; Nakai, S. Development of Pre-chamber Sparkplug for Gas Engine. In Proceedings of the SAE International Powertrains, Fuels and Lubricants Meeting, San Diego, CA, USA, 25–27 October 2010; SAE International: Warrendale, PA, USA, 2010; p. 7. [Google Scholar] [CrossRef]
- Oregui, I.; Garmedia, E.; Larralde, A. Achieving best-in-class OPEX and Emissions with Siemens E-Series Gas Engine. In Proceedings of the Electrify Europe 2018, Vienna, Austria, 19–21 June 2018. [Google Scholar]
- Santos, N.D.S.A.; Alvarez, C.E.C.; Roso, V.R.; Baeta, J.G.C.; Valle, R.M. Combustion analysis of a SI engine with stratified and homogeneous pre-chamber ignition system using ethanol and hydrogen. Appl. Therm. Eng. 2019, 160, 113985. [Google Scholar] [CrossRef]
- da Costa, R.B.R.; Rodrigues Filho, F.A.; Moreira, T.A.A.; Baêta, J.G.C.; Guzzo, M.E.; de Souza, J.L.F. Exploring the lean limit operation and fuel consumption improvement of a homogeneous charge pre-chamber torch ignition system in an SI engine fueled with a gasoline-bioethanol blend. Energy 2020, 197, 117300. [Google Scholar] [CrossRef]
- Stenersen, D.; Thonstad, O. GHG and NOx Emissions from Gas Fuelled Engines; SINTEF Ocean AS: Trondheim, Norway, 2017. [Google Scholar]
- Roethlisberger, R.P.; Favrat, D. Comparison between direct and indirect (prechamber) spark ignition in the case of a cogeneration natural gas engine, part II: Engine operating parameters and turbocharger characteristics. Appl. Therm. Eng. 2002, 22, 1231–1243. [Google Scholar] [CrossRef]
- Crane, M.E.; King, S.R. Emission Reductions Through Precombustion Chamber Design in a Natural Gas, Lean Burn Engine. J. Eng. Gas Turbines Power 1992, 114, 466–474. [Google Scholar] [CrossRef]
- Naber, J.D.; Johnson, J.E. Internal combustion engine cycles and concepts. In Alternative Fuels and Advanced Vehicle Technologies for Improved Environmental Performance; Elsevier: Amsterdam, The Netherlands, 2014; pp. 197–224. [Google Scholar] [CrossRef]
- Ruiz, A.; Loroño, I.; Oregui, I.; Orosa, J. Research on an internal combustion engine with an injected pre-chamber to operate with low methane number fuels for future gas flaring reduction. Energy 2022, 253, 124096. [Google Scholar]
- Tozzi, L.; Sotiropoulou, E.; Beshouri, G.; Lepley, D. Novel Pre-Combustion Chamber Technology for Large Bore Natural Gas Engines. In Proceedings of the CIMAC Congress, Helsinki, Finland, 6–10 June 2016. [Google Scholar]
- Benajes, J.; Novella, R.; Gomez-Soriano, J.; Martinez-Hernandiz, P.J.; Libert, C.; Dabiri, M. Evaluation of the passive pre-chamber ignition concept for future high compression ratio turbocharged spark-ignition engines. Appl. Energy 2019, 248, 576–588. [Google Scholar] [CrossRef]
- Roethlisberger, R. An Experimental Investigation of a Learn Burn Natural Gas Prechamber Spark Ignition Engine for Cogeneration; Federal Polytechnique School of Lausanne: Lausanne, Switzerland, 2001. [Google Scholar]
- Röthlisberger, R.; Favrat, D. Investigation of the pre-chamber geometrical configuration of a natural gas spark ignition engine for cogeneration: Part II. Experimentation. Int. J. Therm. Sci. 2003, 42, 239–253. [Google Scholar] [CrossRef]
- Qian, Y.; Sun, S.; Ju, D.; Shan, X.; Lu, X. Review of the state-of-the-art of biogas combustion mechanisms and applications in internal combustion engines. Renew. Sustain. Energy Rev. 2017, 69, 50–58. [Google Scholar] [CrossRef]
- Galhano dos Santos, R.; Moura Bordado, J. Design of simplified models for the estimation of higher heating value of refused derived fuels. Fuel 2018, 212, 431–436. [Google Scholar] [CrossRef]
- Benato, A.; Macor, A.; Rossetti, A. Biogas Engine Emissions: Standards and On-Site Measurements. Energy Procedia 2017, 126, 398–405. [Google Scholar] [CrossRef]
- Sarothi Roy, P.; Ryu, C.; Dong, S.K.; Park, C.S. Development of a natural gas Methane Number prediction model. Fuel 2019, 246, 204–211. [Google Scholar] [CrossRef]
- Pizzuti, L.; Martins, C.A.; Lacava, P.T. Laminar burning velocity and flammability limits in biogas: A literature review. Renew. Sustain. Energy Rev. 2016, 62, 856–865. [Google Scholar] [CrossRef]
- Mannan, S. Fire. In Lees’ Loss Prevention in the Process Industries; Butterworth-Heinemann: Oxford, UK, 2005; pp. 16/1–16/307. [Google Scholar] [CrossRef]
- Porpatham, E.; Ramesh, A.; Nagalingam, B. Investigation on the effect of concentration of methane in biogas when used as a fuel for a spark ignition engine. Fuel 2008, 87, 1651–1659. [Google Scholar] [CrossRef]
- Bade Shrestha, S.O.; Narayanan, G. Landfill gas with hydrogen addition—A fuel for SI engines. Fuel 2008, 87, 3616–3626. [Google Scholar] [CrossRef]
- Roethlisberger, R.P.; Favrat, D. Investigation of the prechamber geometrical configuration of a natural gas spark ignition engine for cogeneration: Part I. Numerical simulation. Int. J. Therm. Sci. 2003, 42, 223–237. [Google Scholar] [CrossRef]
- Alvarez, C.E.C.; Couto, G.E.; Roso, V.R.; Thiriet, A.B.; Valle, R.M. A review of prechamber ignition systems as lean combustion technology for SI engines. Appl. Therm. Eng. 2018, 128, 107–120. [Google Scholar] [CrossRef]
- Weinrotter, M.; Oregui, I.; Alonso, L.; Iruretagoiena, I.; Pérez de Larraya, D. Progress and development of next generation ignition systems for Guascor gas engines. In Proceedings of the CIMAC World Congress on Combustion Engine Technology, Shangai, China, 13–16 May 2013. [Google Scholar]


Disclaimer/Publisher’s Note: The statements, opinions and data contained in all publications are solely those of the individual author(s) and contributor(s) and not of MDPI and/or the editor(s). MDPI and/or the editor(s) disclaim responsibility for any injury to people or property resulting from any ideas, methods, instructions or products referred to in the content. |
© 2023 by the authors. Licensee MDPI, Basel, Switzerland. This article is an open access article distributed under the terms and conditions of the Creative Commons Attribution (CC BY) license (https://creativecommons.org/licenses/by/4.0/).