Article

Arctic Route Planning and Navigation Strategy: The Perspective of Ship Fuel Costs and Carbon Emissions

College of Transport and Communications, Shanghai Maritime University, Shanghai 201306, China
*
Author to whom correspondence should be addressed.
J. Mar. Sci. Eng. 2023, 11(7), 1308; https://doi.org/10.3390/jmse11071308
Submission received: 26 May 2023 / Revised: 19 June 2023 / Accepted: 23 June 2023 / Published: 27 June 2023
(This article belongs to the Section Ocean Engineering)

Abstract

:
Arctic navigation research will be more urgent as it is predicted that 4.7% of the shipping trade will be deployed in the Arctic region by 2030. This paper presents a multi-objective path optimization algorithm based on the field theory to investigate Arctic shipping route design and navigation strategies that take safety, economy and environmental protection as factors. The algorithm considers the ice conditions in Arctic waters throughout the year, the energy consumption of ships with different ice classes and carbon emissions. The sea environment is initially modeled using the potential field method, incorporating the ice condition field, fuel consumption, emission field and directional field. The navigable area is defined based on the ship navigability, and path optimization is conducted using the principle of gradient descent between the departure point and destination. The experimental results show that the cost of carbon emissions and fuel consumption varies for each class of ship on the planned path in different months. Therefore, by combining different classes of ships and months, we obtain an Arctic navigation strategy with a consideration of the best cost and environmental protection for each month. The path planning and navigation strategy decision method proposed in this paper can provide a reference for an Arctic route design, navigation month and vessel selection, which is beneficial to the sustainable development of Arctic shipping.

1. Introduction

In recent years, the continued effect of the greenhouse effect has accelerated glacier melting, making it easier for ships to access Arctic waters [1]. This has also made it possible to develop a shipping corridor in the Arctic that offers shorter transit times and lower fuel and overall costs than currently available routes [2]. A predictive analysis suggests that by 2030, 4.7% of the world’s future shipping trade could be redeployed to use Arctic shipping routes [3]. Among the existing Arctic shipping routes, the Arctic Ocean Route (NSR) along the Russian coast connects Asia and Europe, reducing the sailing distance by 40% compared to the traditional Asia–Europe Suez Canal route [4]. With the extensive economic analysis associated with it, the potential of Arctic navigation is gradually being exploited.
However, Arctic navigation still faces challenges in various aspects. The safety and cost of navigation and potential environmental hazards have been considered in this field. In Arctic voyages, the polar environment is very distinctive, with the average daily low temperature in Arctic waters below −38 °C in winter waters posing a significant challenge to the ship’s and crew’s adaptability. The freezing temperature may cause the ship’s machinery and electronic equipment to fail, increasing the risk during the voyage. In addition, Arctic navigation also faces terrible weather conditions such as ice and fog, and a low visibility, which increases the risk of ship collision and navigation safety accidents. At the same time, the economic cost of Arctic navigation is relatively high compared with ordinary ships, the cost for ice-class vessels usually increases by 0.5 to 1 time, and Arctic navigation generally requires special equipment and technical support, such as ice breakers and ice area navigation insurance, etc., all of which increase the total cost of transportation. The research on Arctic route planning and navigation strategy design has become a hot topic in the international maritime field. For different months, how to plan the ship’s Arctic route to make the ship’s navigation more energy-saving and with emission reduction is of great significance to the development of the shipping industry.
The research on Arctic route planning can be roughly divided into large-scale global planning and small-scale local planning. Global planning refers to global path planning to find a safe path from the initial state to the target state, considering known obstacles and assuming a complete environmental model. Choi et al. [5] considered the uncertainty of the ice navigation system. They introduced an uncertainty-based path planning model, which includes the variance of the navigation time and the success rate of the path, as a way to find the optimal route under time-varying stochastic conditions. Wang et al. [6] proposed a new ice navigation system using a modified A* path planning algorithm called HFS-A* algorithm. This HFS-A* algorithm comprehensively considered three critical elements of ship navigation: the navigation time, economic cost and risk. Hye-Won Lee et al. [7] proposed a ship route planning system consisting of a performance evaluation model and an optimization model, with total power consumption as the objective function, considering the arrival time constraint, land avoidance constraint, ice condition criteria constraint and design variables’ constraint, and used the A* algorithm to generate seeds to obtain a reasonable initial solution and reduce the computation time. According to the above literature, the global path planning model of the Arctic route mainly includes an uncertainty-based path planning model, performance evaluation model, optimization model, etc., and the algorithms include the HFS-A* algorithm, genetic algorithm, etc. Global planning mainly focuses on the totality of the Arctic route, macro-level economy and timeliness. As for local planning, its research perspective can narrow the scope of global planning or be explored at the micro-level in more specific directions, such as ship operations. Tsung et al. [1] used ocean radar images to generate a small-scale path planning scheme to avoid sea ice collisions during ice navigation, and the proposed path risk index can be used to evaluate and select a relatively optimal path planning scheme to reduce the risk. Ki Yin Chang et al. [8] implemented a higher geometric maze routing graph in an ice area region for planning the best unexplored route between Asia and Europe using GIS. He designed the best route considering safety and cost. However, the large dimensionality of global planning and the small perspective of local planning cannot be well planned and analyzed with sure accuracy for a particular region, so in this paper, a method between traditional global planning and local planning is used to study the multi-objective route optimization in a specific region.
The current optimization objectives of Arctic route planning are mainly the safe navigation in polar regions, energy consumption and economic cost. Based on the safety of ship navigation, Zhang et al. [9] established an ice area route planning algorithm based on the above POLARIS (The Polar Operational Limit Assessment Risk Indexing System), using the “risk index result” (RIO) as the navigable ice area navigation cost. The algorithm fully considered the impact of sea ice on ships of different ice classes to find the safest area with the lowest cost for each ice class. Zhang et al. [10] predicted the energy efficiency of ships in the Arctic based on a data-driven model with a neural network theory. They proposed an optimal energy efficiency route that is as friendly as possible to the environment while reducing costs. In addition, A.G. Topaj et al. [11] used ice breaker assistance as a component of the overall route optimization problem. They used economic criteria to optimize the shipping route and the ice breaker participation. This paper focuses on the economic and environmental aspects of Arctic navigation from the perspective of safety and fuel consumption costs of polar ship navigation.
Therefore, in response to the above problems, this paper proposes a multi-objective path optimization algorithm and navigation strategy research based on the field theory, which is mainly made in the following three aspects:
  • Application of route planning method based on superposition field environment
This paper proposes a multi-objective route planning algorithm based on the field environment. It intuitively quantifies the elemental indexes in the navigation process in the form of potential energy to reflect the navigation risk and fuel consumption cost of the ship in Arctic waters. It effectively realizes the multi-objective route planning for Arctic ships.
2.
No-navigation zone setting and route adjustment considering ship safety
According to the safety range of the ice condition index value of different classes of ships, the safe navigation area is delineated, and the unnavigable area of ships is visualized, which is conducive to the inspection and correction of the paths obtained from multi-objective planning.
3.
Arctic navigation strategy design considering navigation distance
In the actual navigation, the navigation conditions in different seasons in different parts of the Arctic are different, so the ship has to design the navigation strategy according to the voyage length and the route area instead of obtaining the navigation path with simple path planning. Unlike short voyages, according to the ship’s specific sea area and time, long routes can be analyzed section by section to choose a relatively safe and economical route, and the operating company can make a more personalized navigation strategy.
The rest of this paper is organized as follows: Section 2 constructs a superposition field environment based on ice conditions, fuel consumption and carbon emissions and introduces a path search algorithm based on the gradient descent principle for multi-objective path planning in the superposition field environment; Section 3 conducts simulation experiments to analyze the fuel consumption and carbon emissions of different classes of ships in different months with monthly data in 2022 as an example, and summarizes the navigation strategy to meet the safety, environmental protection and economy; and Section 4 concludes this paper.

2. Materials and Methods

2.1. Field of Ice Condition

From the requirements of the Arctic rules for the safe navigation of ships, it is clear that polar navigation requires extra attention to the safety hazards posed by sea ice to ships. The existing studies show that ice concentration and thickness are the leading ice condition indicators affecting polar navigation. According to SEA ICE NOMENCLATURE by the World Meteorological Organization, the relationship between sea ice density and navigability can be obtained, as shown in Table 1 below. Meanwhile, according to the classification of ice-class ships under the IACS standard, we can obtain the sea ice types required for different classes of ships to navigate. Since the ice thickness can be briefly divided into ice types, we can obtain the range of sea ice thickness values required for different ships to satisfy navigation. Details are shown in Table 2 and Table 3.
The sea ice condition field consists of two parts; one is the ice concentration field, and the other is the ice thickness field. The two are superimposed after normalization to obtain the ice risk level coefficient, which can effectively reflect the ice barrier level for ship navigation and is essential for the safety of polar ship navigation. I C stands for the ice condition factor, C ¯ means the normalized ice concentration values and T ¯ means the normalized ice thickness values.
I C = C ¯ + T ¯
The monthly data of sea ice concentration and sea ice thickness in Arctic waters can be obtained from the maritime data product “Arctic Ocean Sea Ice Analysis and Forecast” of the European Copernicus Maritime Service, as shown in Figure 1 and Figure 2, respectively. From this, the ice condition factor map could be calculated, as shown in Figure 3.
In addition, route planning needs to be conducted within a safe navigable zone. The type of ship and sea ice conditions determine the navigable area in the Arctic. In this paper, sea ice conditions are reflected by sea ice density and sea ice thickness, both of which have areas corresponding to their respective safe value ranges, i.e., safe zones, and the tandem of two safe zones is the navigable zone, and vice versa is the no-navigation zone.

2.2. Field of Energy Consumption and Emission

The energy consumption and emission field design ideas were mainly derived from [12,13]. We considered the ship energy depletion of ice resistance [14] apart from the power consumption in the general sea area, including wind, waves and still water. However, in the Arctic environment, to highlight the specific impact caused by the polar ones, i.e., sea ice resistance, we divided the ship energy consumption into two parts: still water resistance and sea ice resistance.
The main engine consumption of a ship in still water is expressed by the following equation:
P s t i l l = ρ × C t s × S × v 3 2 m × n D W T + 1 n
The ship energy consumed by the ice resistance is expressed by the following equations [4]:
R i c e = A × ρ i c e × T × D × v 2 × B / L P P × C 1.5 × F r 1.8
P i c e = v × R i c e
P = P s t i l l + P i c e
With a known energy consumption (ECT), the cost per unit of time and carbon emissions (EMS) can be determined with the following equations:
E C T = P × C f u e l × k f + C c 24 v s
E M S = P × k f × k e
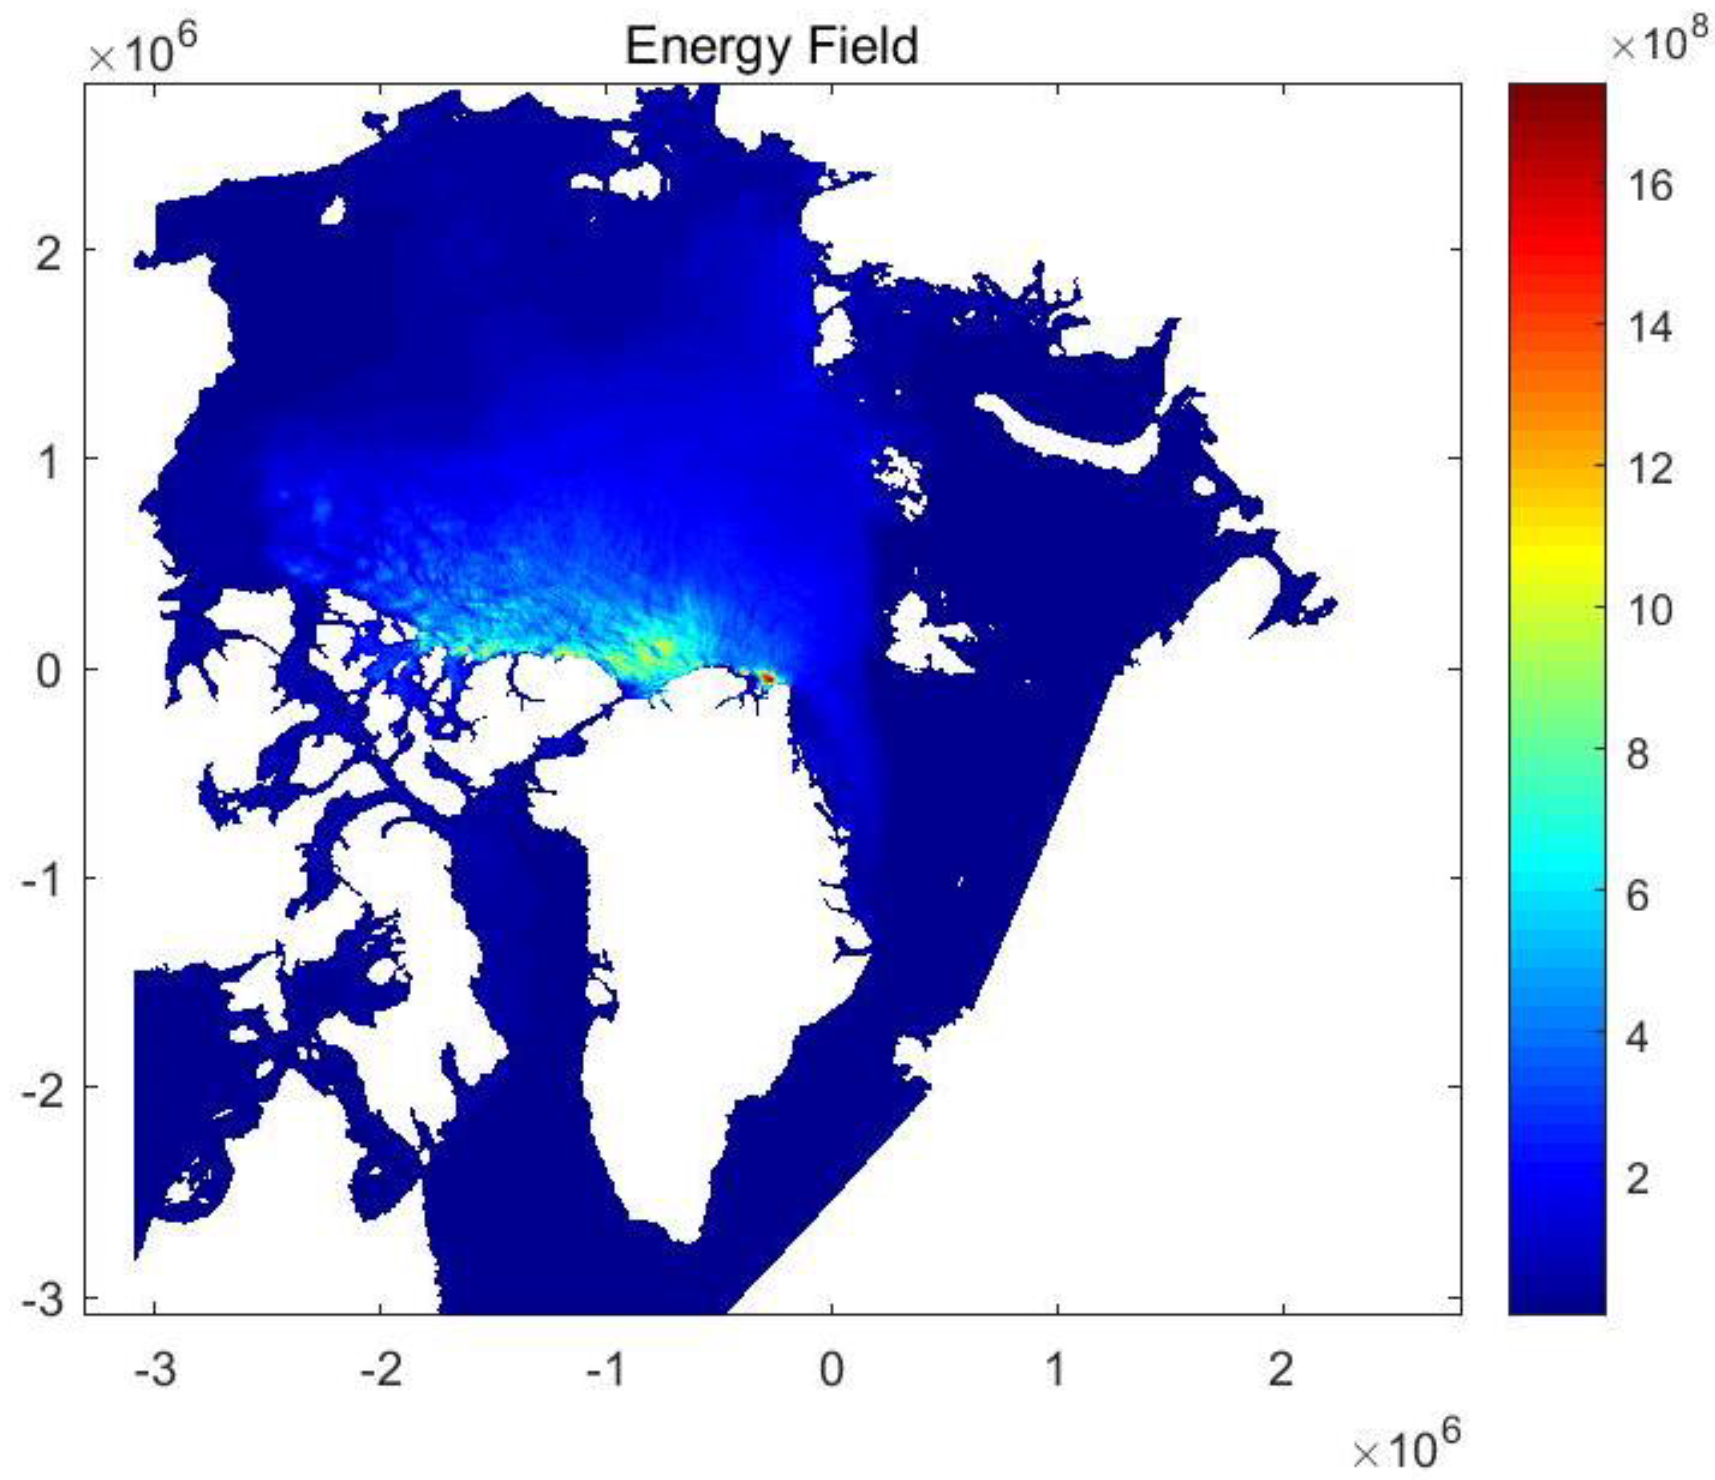
where k f is the fuel consumption per KW·h, and C f u e l is the fuel price. In addition to the fuel, the operating costs of a ship are expressed as C c . P is the main power of the vessel, and k e is the CO2 emission per unit of fuel consumed. From the above method, we could obtain the ship energy field map shown in Figure 4.
The parameters we can learn from Table 4, where relatively fixed parameters took a constant value, the water density ρ in this paper took the value of 1030 kg per cubic meter, the cargo weight constant took the value of 0.1, the ice density took the value of 900 kg per cubic meter and the ship length between perpendiculars took the value of 1. The Froude number can be converted to F r = v / g × L P P , where g is gravitational acceleration. The rest of the parameters were entered according to the actual data collected.

2.3. Directional Field

The directional field is derived from the concept of a gravitational field in the physical sense. The design idea of the directed field in this paper is based on the APF method (Artificial Potential Field) [15]. The potential energy value of the directional field is used to describe the cost of the distance to the endpoint and to plan a shorter route considering the cost of the ship’s heading during its motion so that the ship’s navigation does not produce significant turns.
D = r v × ε × e β 2 2 C 2
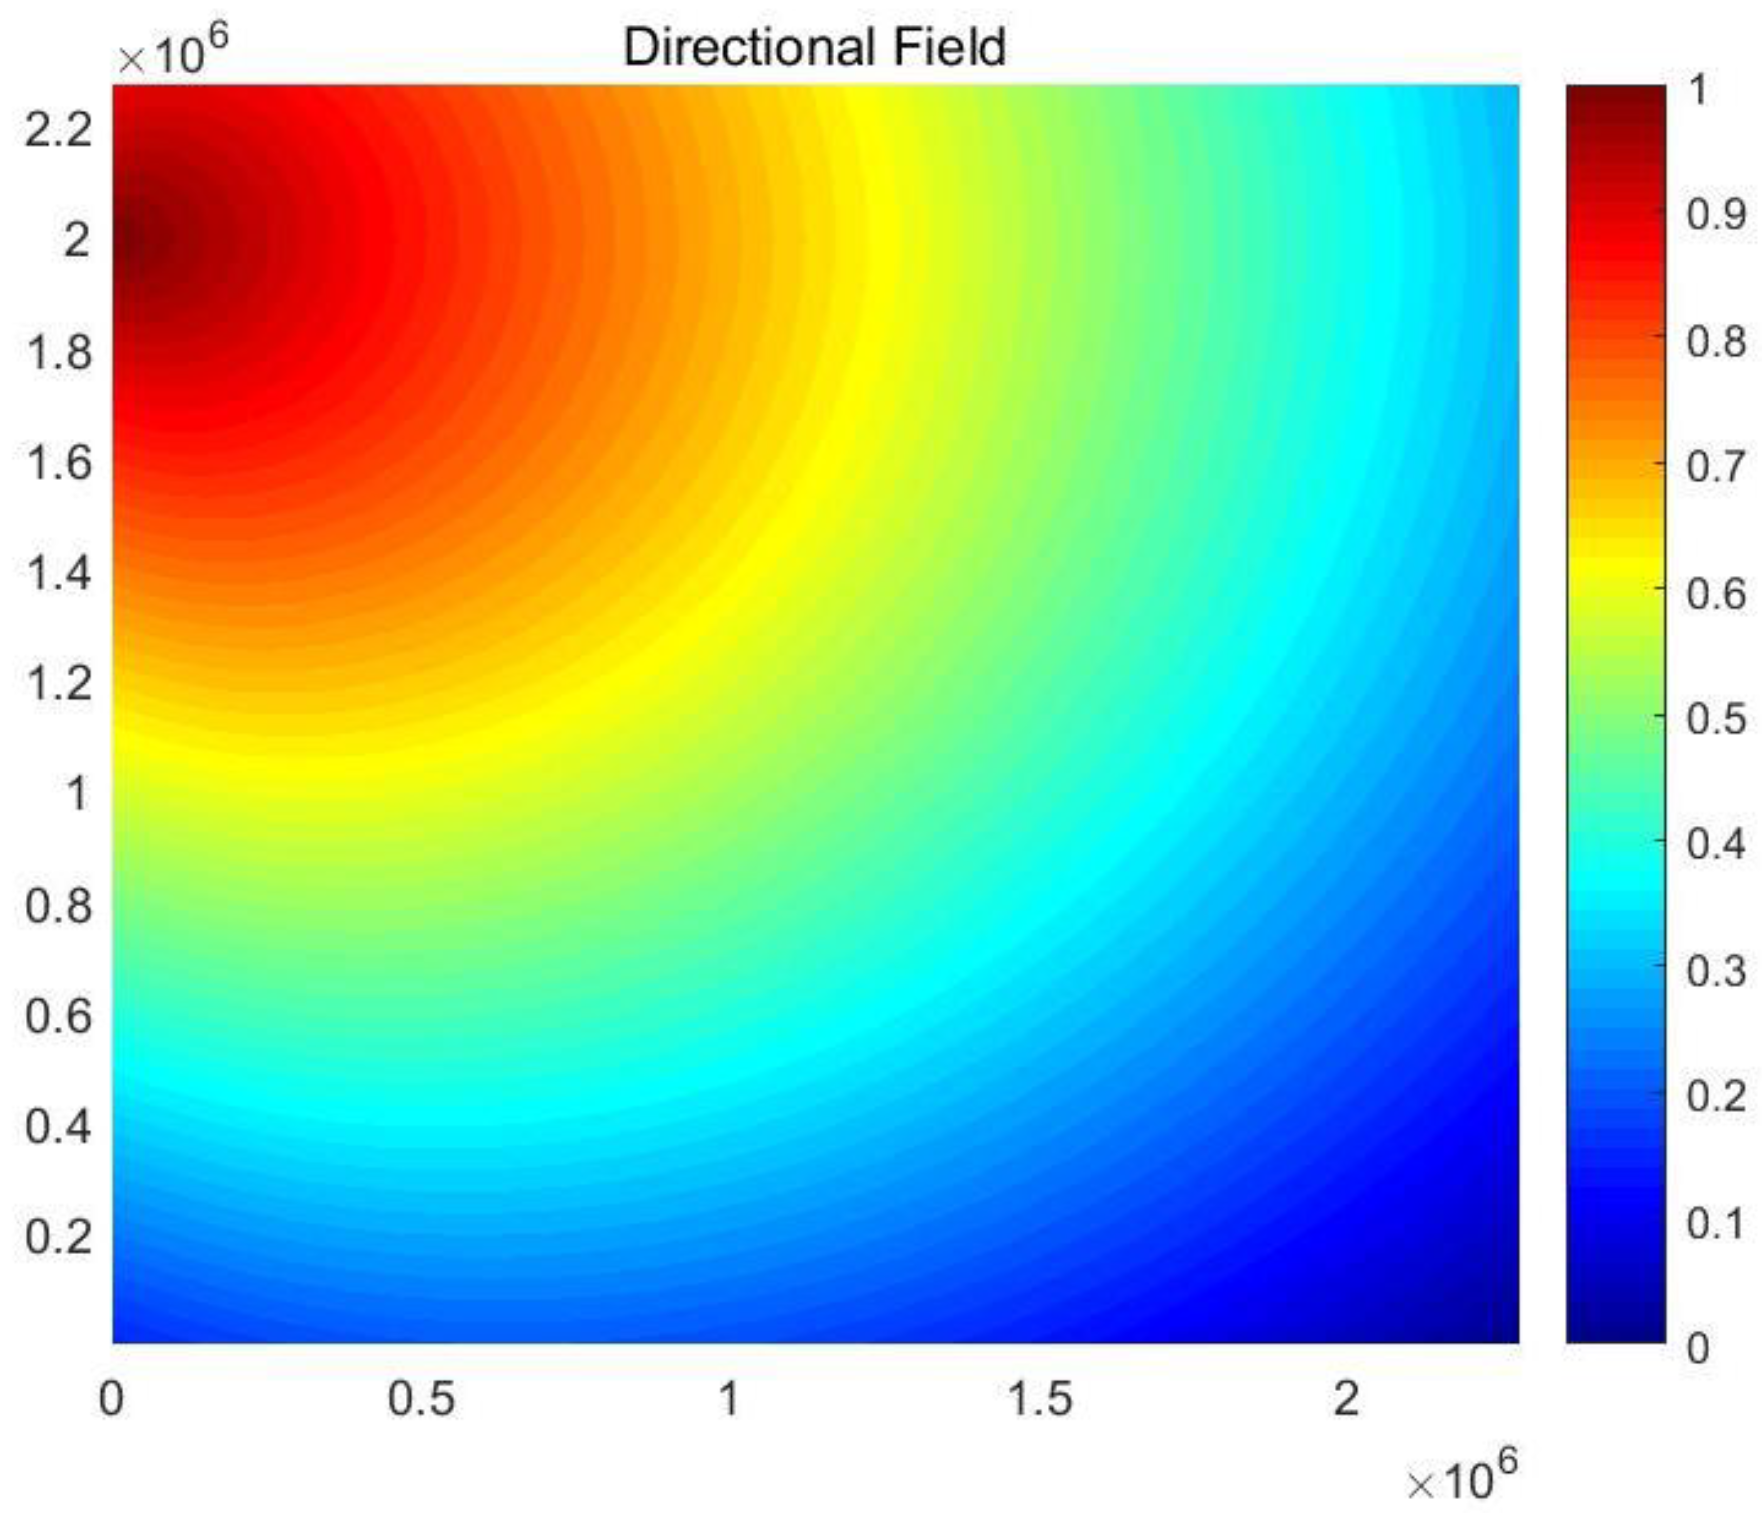
where r indicates the distance between the destination and other points on the map, and v indicates the ship’s speed. ε and c are constants. is the angle between the line connecting the center point of the ship and the target point and the north direction, and β is the north angle of the line between each point on the map and the end point. In Figure 5, a small value in the dark area of the color bar represents a low strength of the potential field.

2.4. Gradient Descent Path Search Algorithm Based on Superposition Field

2.4.1. The Superposition of Fields

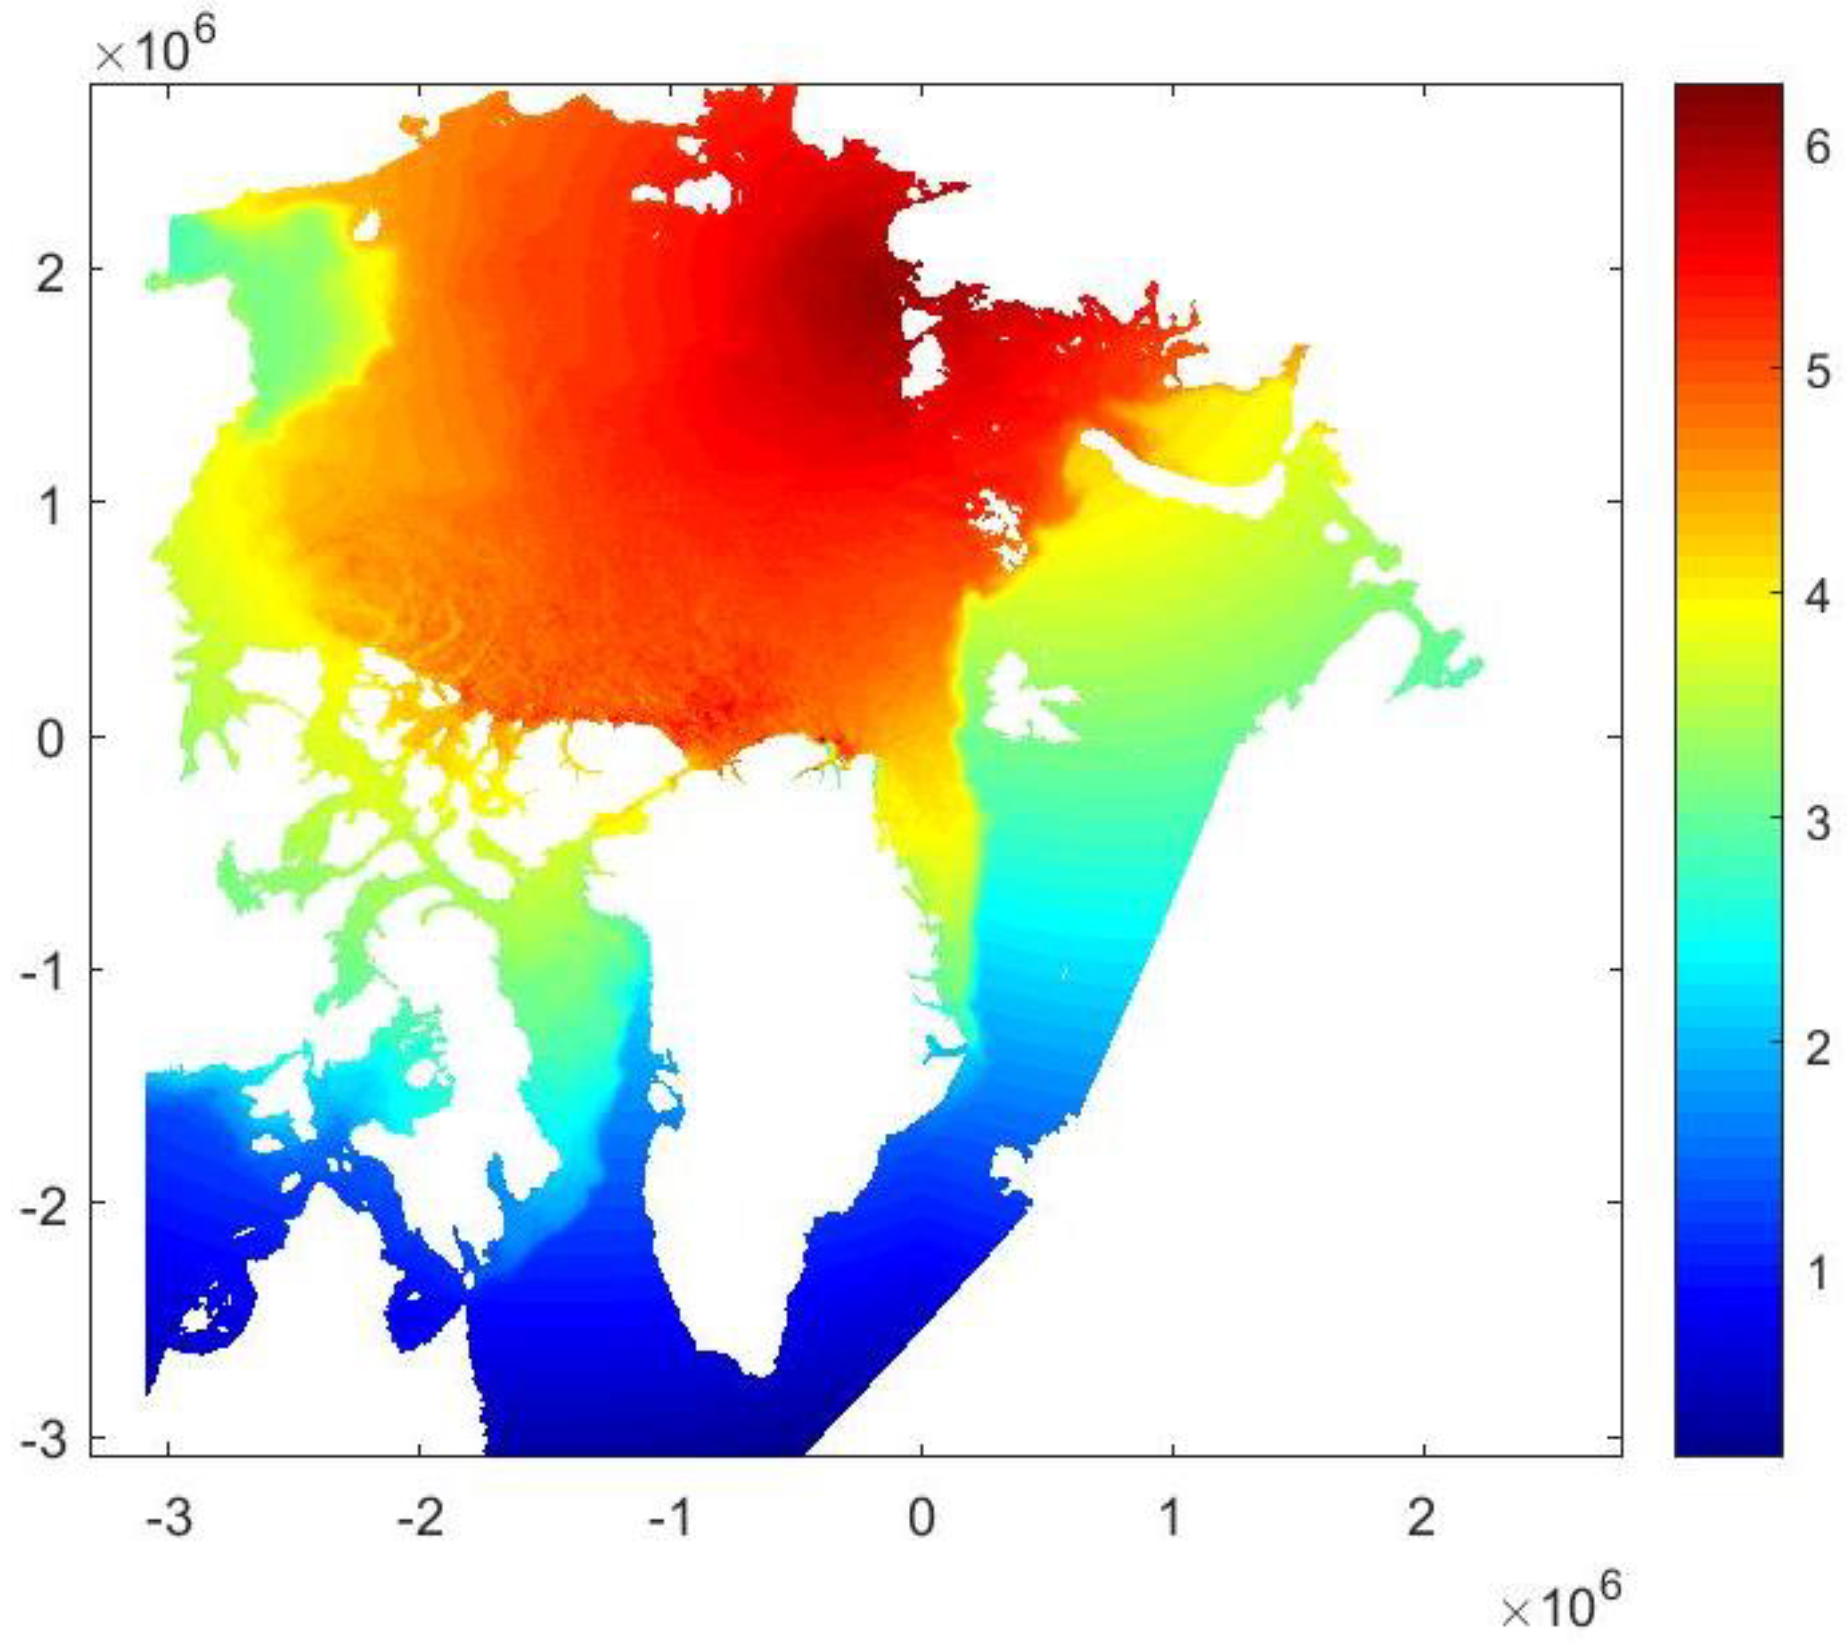
Due to the inconsistency of the magnitudes, the different fields established above need to be processed by their respective normalization and finally superimposed to solve the multi-objective path planning problem. The superimposed field obtained by the calculation is shown in Figure 6.
The normalized formula used:
x ¯ = x min x max x min x
Thus, the superimposed field strength U can be obtained:
U = k 1 · I C ¯ + k 2 · E C T ¯ + k 3 · E M S ¯ + k 4 · D ¯

2.4.2. Path Search Algorithm Based on Superposition Field

In the superposition field, the directional field constructs a descending gradient along the ship’s position to the destination, with the highest potential energy at the ship’s position and the lowest potential energy at the destination. Path planning aims to move step by step at the ship position, i.e., the starting point, along the direction of the fastest decreasing gradient, to finally reach the endpoint. The cost and emissions of the ship can be expressed as the repulsive potential P R   X ,   Y underway, while the directional field provides the guidance potential P G   X ,   Y .
The repulsive potential P R   X ,   Y consists of the ice condition factor (IC), fuel cost (ECT) and emissions (EMS).
P R   X ,   Y = I C ¯ + E C T ¯ + E M S ¯
The guiding potential P G   X ,   Y determined by the field energy of the directional field:
P G   X ,   Y = D ¯
The total potential function is just
P U   X ,   Y = P R   X ,   Y + P G   X ,   Y
The negative gradient of the superimposed potential field can be considered as a guiding force that guides the ship toward the direction of the destination. The energy cost is minimized by following the navigation angle of the guiding force. Ships are attracted to places with a low guidance potential and repelled by places with a high repulsive potential during navigation. In the physical sense, the total force F U   is the sum of the repulsive force F R   and the gravitational force F G .
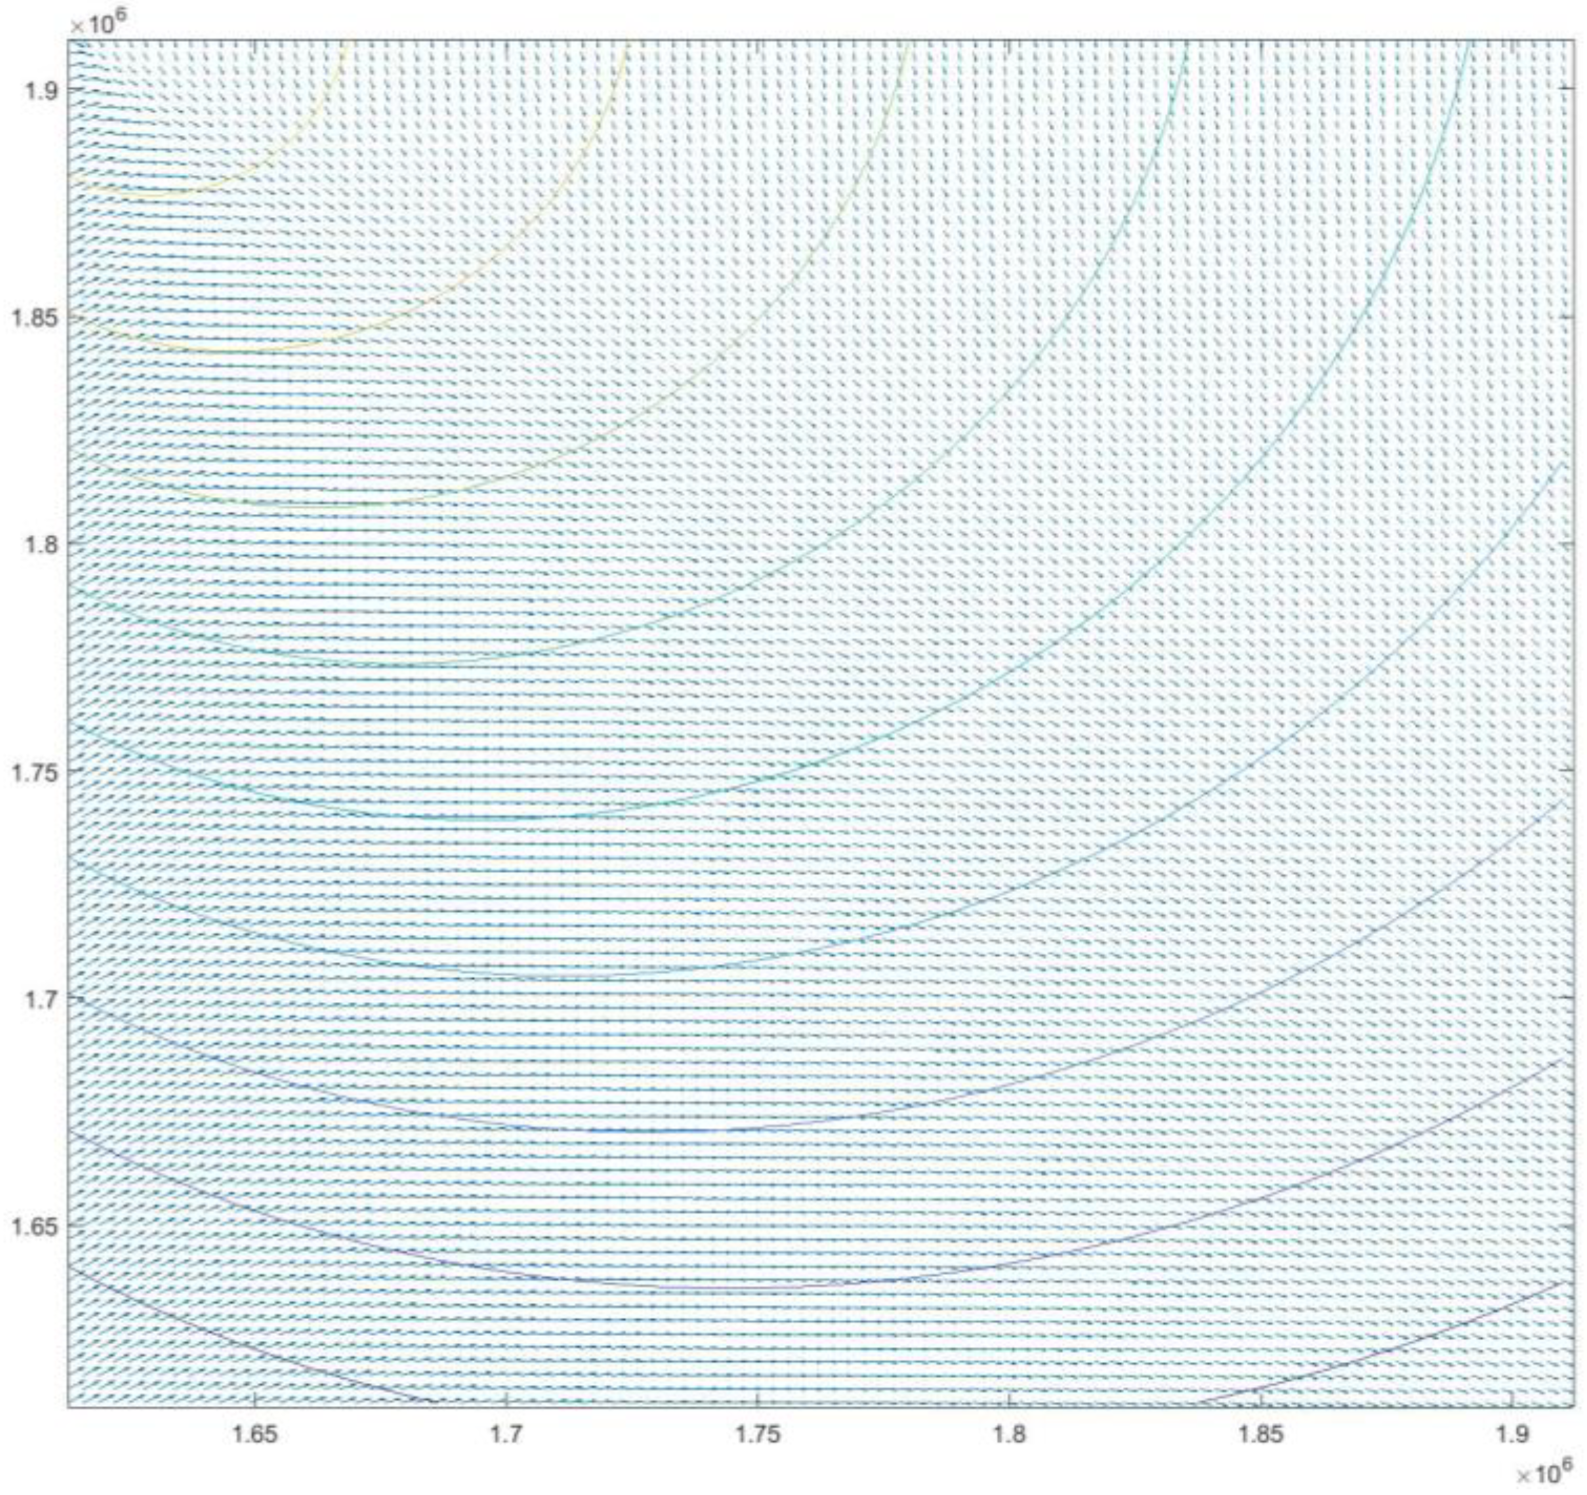
Figure 7 shows the gradient diagram calculated from the superimposed field diagram (Figure 5); we can observe in Figure 7 the gradient direction in different regions (blue arrows indicate the direction of the gradient). The curves on the map are contour lines, and the potential energy of each point on the same curve is the same; the darker the curve’s color, the lower its potential energy. The total force on the ship at a point (X, Y of the map is
F U   = P U   X ,   Y
Algorithm 1 is the pseudo-code for path planning with N steps at a time. In Algorithm 1, we used p k to denote the direction of the gradient at the current position and α(k) to denote the length of the previous step in the current cyclic sequence. In order to make the path obtained by the search conform to the law of ship navigation, we assumed that the value of the step length is equal to the speed of the ship and connected the path points obtained from the search to obtain the motion trajectory. The flow of the algorithm can be described as follows: according to Equations (1)–(10), calculate the directional field D and initial superposition field U 0 . Obtain the path point p(k + δ) = p(k) − α(k) × ∇ (p(k)). Repeat the above process until the path planning task is completed and N + 1 path points are obtained.
Algorithm 1. Path planning
Input: Gradient of field
Output: Trajectory of the ship p (x)
   1:   i = 0
   2:   p = p s t a r t
   3:  Calculate initial ice condition factor, fuel cost and emissions after normalization:
           I C 0 , E C T 0 and E M C 0
   4:  Calculate initial directional field energy after normalization: D 0
   5:  Calculate initial superimposition field energy:
         U 0 = k 1 · I C 0 + k 2 · E C T 0 + k 3   · E M C 0 + k 4 · D 0
   6:  Procedure:
   7:  for k < N + 1 do
   8:       Calculate initial ice condition factor, fuel cost and emissions after normalization:
        I C i , E C i and E M i
   9:         Calculate initial directional field energy after normalization: D 0
   10:      Calculate initial superimposition field energy:
     U i = k 1   ·   I C i + k 2   ·   E C T i + k 3   · E M C i + k 4   ·   D i
   11:          =  U;
   12:      while 0 do
   13:           p k + 1 = p k α k ·     p k
   14:      end while
   15:       k = k + 1
   16:       i = i + 1
   17: end for
   18: Repeat procedure

3. Results and Discussion

3.1. Experimental Design

The ice, energy and directional fields are based on the selected study area and the sea ice conditions within that area. The data for this study were obtained from the maritime data product “Arctic Ocean Sea Ice Analysis and Forecast” of the European Copernicus Maritime Service. Its statistical area is from 53° to 90° N and −180° to 180° S, with a spatial resolution of 3 × 3 km, and contains monthly data on sea ice density and sea ice thickness for 2019 to date. We intercepted a part of the Kara and Barents Seas as the study area and established an XY coordinate system with the horizontal and vertical axes as the geographical reference. The starting point of the simulation is (600,000, 1,500,000), the final destination point is (1,250,000, 1,200,000), the fuel cost is USD 800 per ton and the study period is all months of the year in 2022.
The experimental setup of this study:
This experiment considers the case of single-vessel sailing without considering the assistance of ice breakers (ice breakers are generally needed for formation sailing), and without considering sailing costs such as the transport volume and vessel rental costs; we used monthly data for a month-by-month analysis to develop a navigation strategy to reduce fuel consumption and emissions.
In the experiment, first, preset the class of the experimental ship and the month, set the starting point and the end point of navigation and then delineate the no-navigation zone according to the safety restrictions of that class of ships. The path is searched between these two points in the environment of the superposition field based on the principle of gradient descent. After that, check whether the path is within the no-navigation zone; if it is, the ship of that class is not navigable that month. If it is not, calculate the fuel consumption and emission of the ship on the path, and finally, obtain the ship type selection for each month of the planned path. The main steps are as follows:
(1)
Select the ice-resistant class of vessels and analyze their navigational environment in different months according to the research data;
(2)
Determine the navigational restrictions for the class of vessels and delineate their no-navigation zones;
(3)
Path planning based on the principle of decreasing gradient in the superposition field environment;
(4)
Statistics of the fuel consumption cost and emission of different routes.

3.2. Experimental Results and Analysis

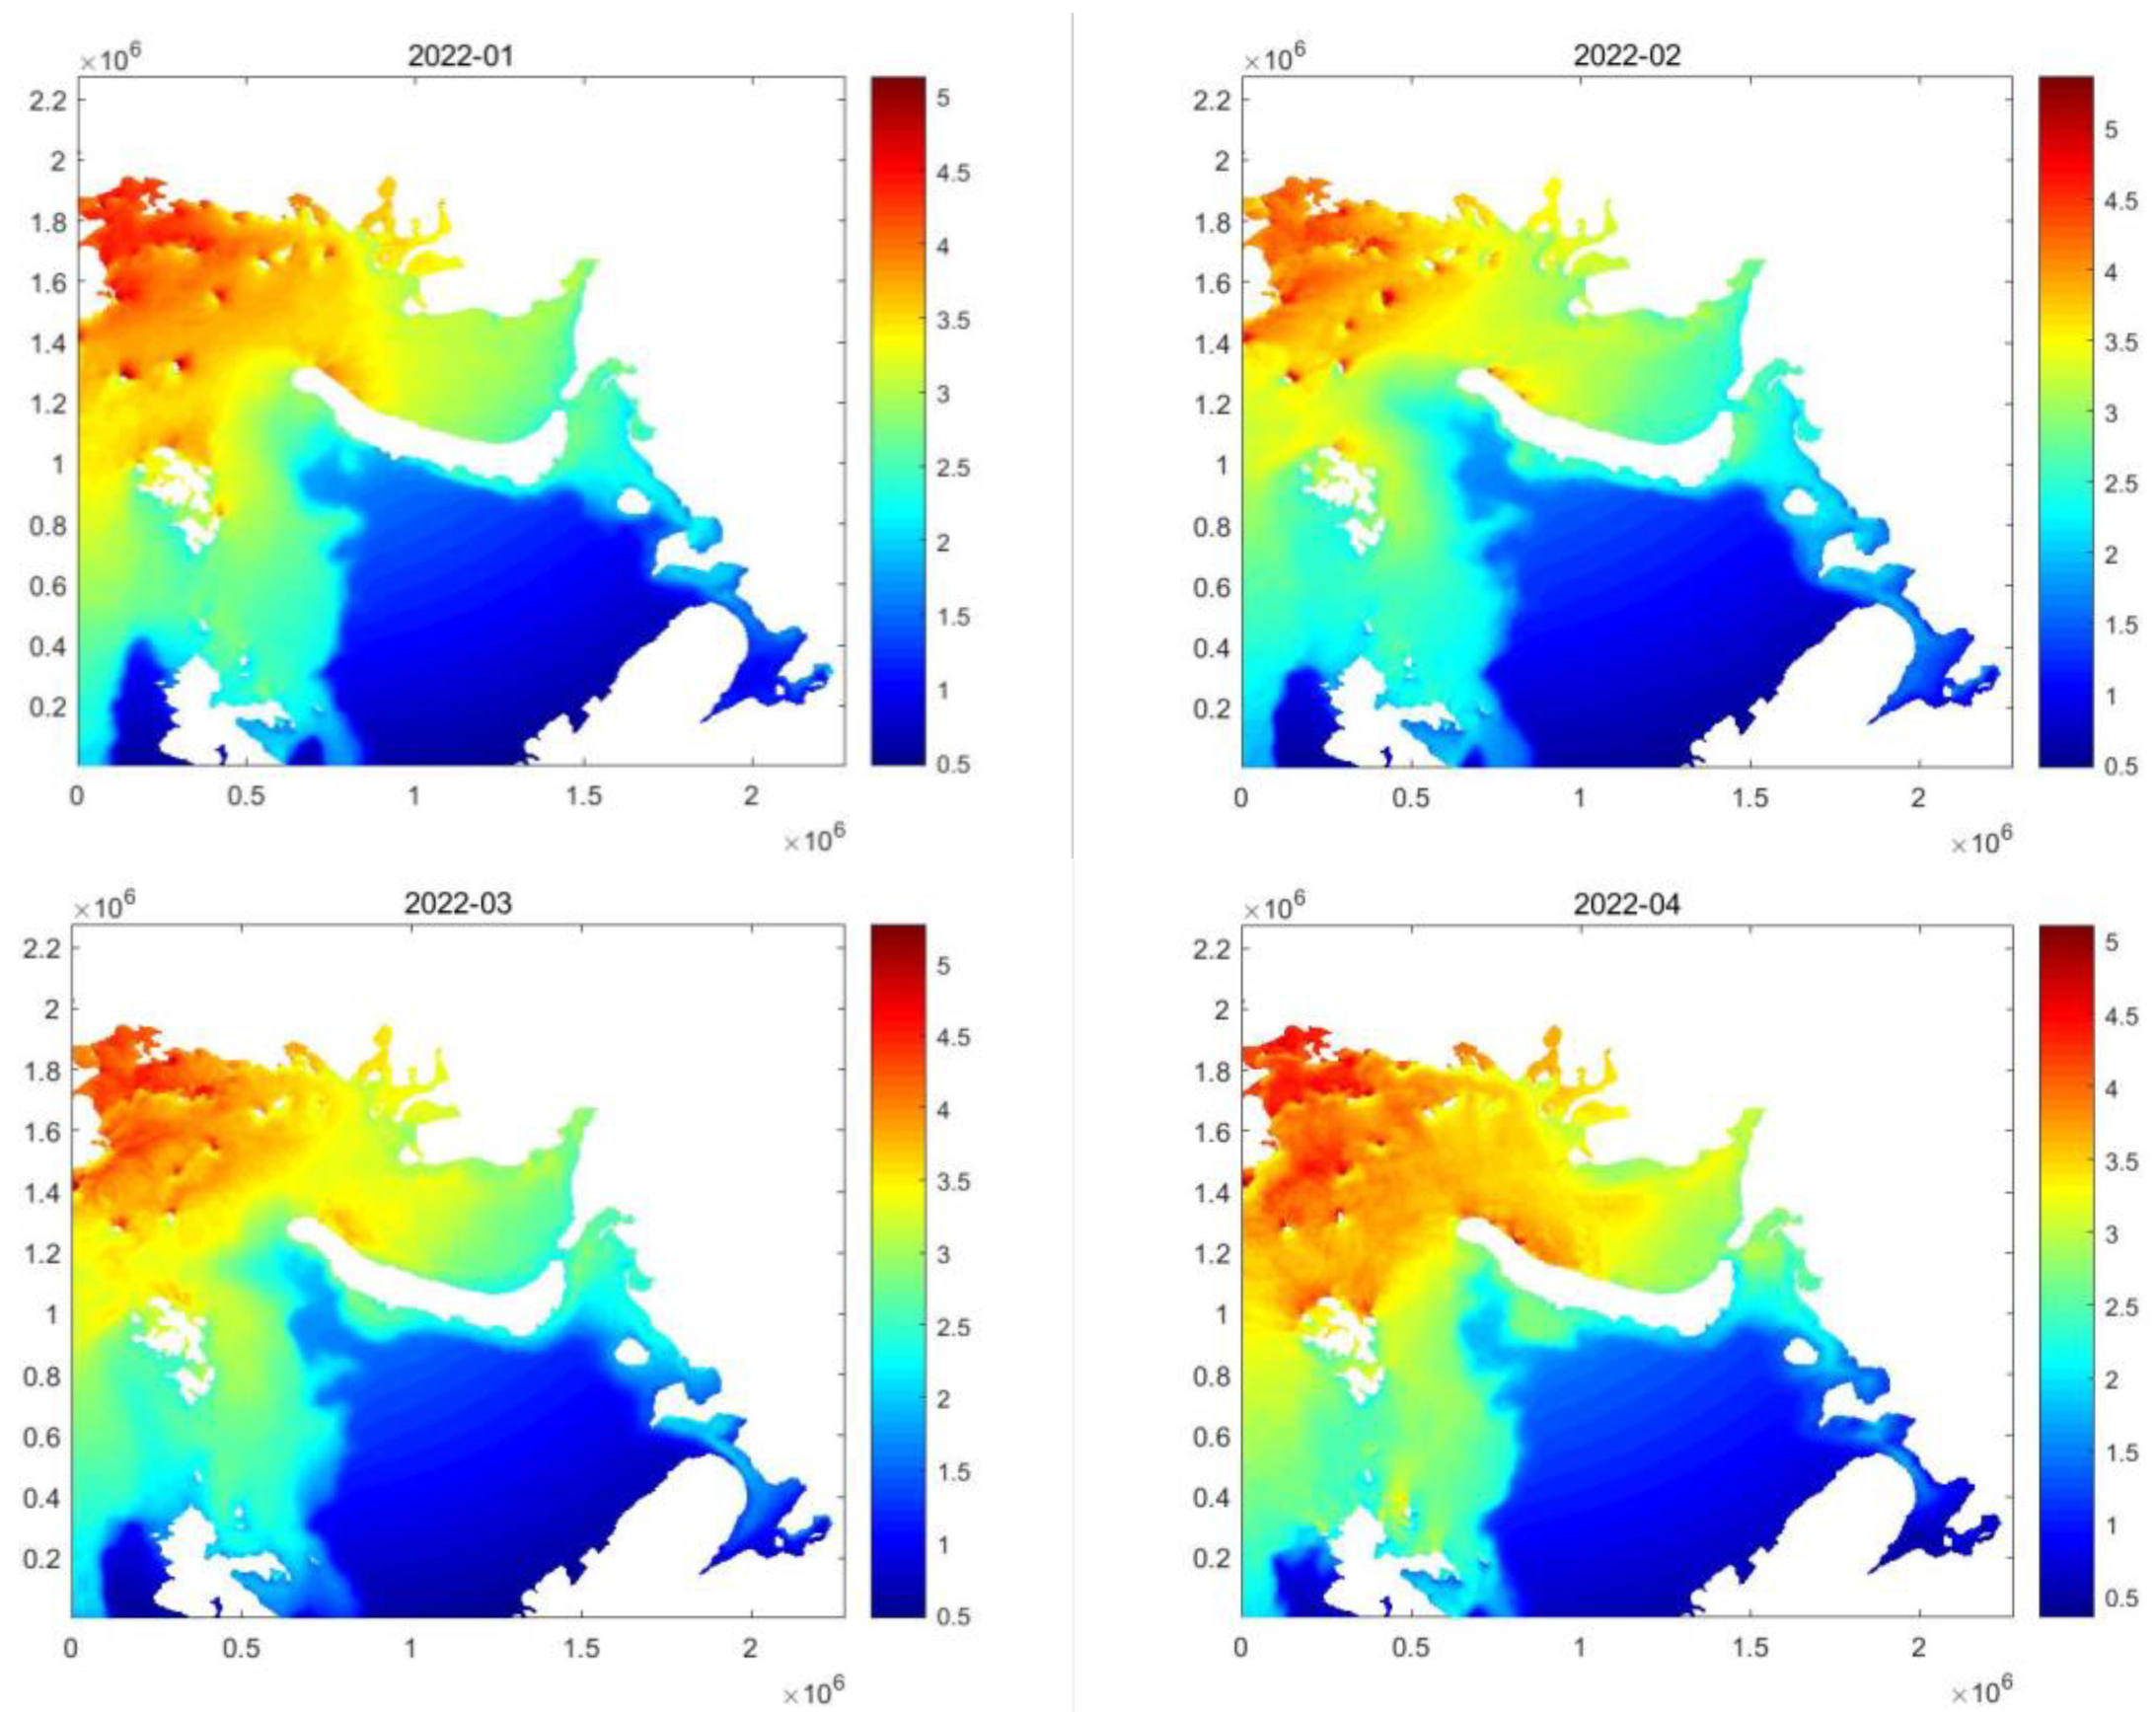
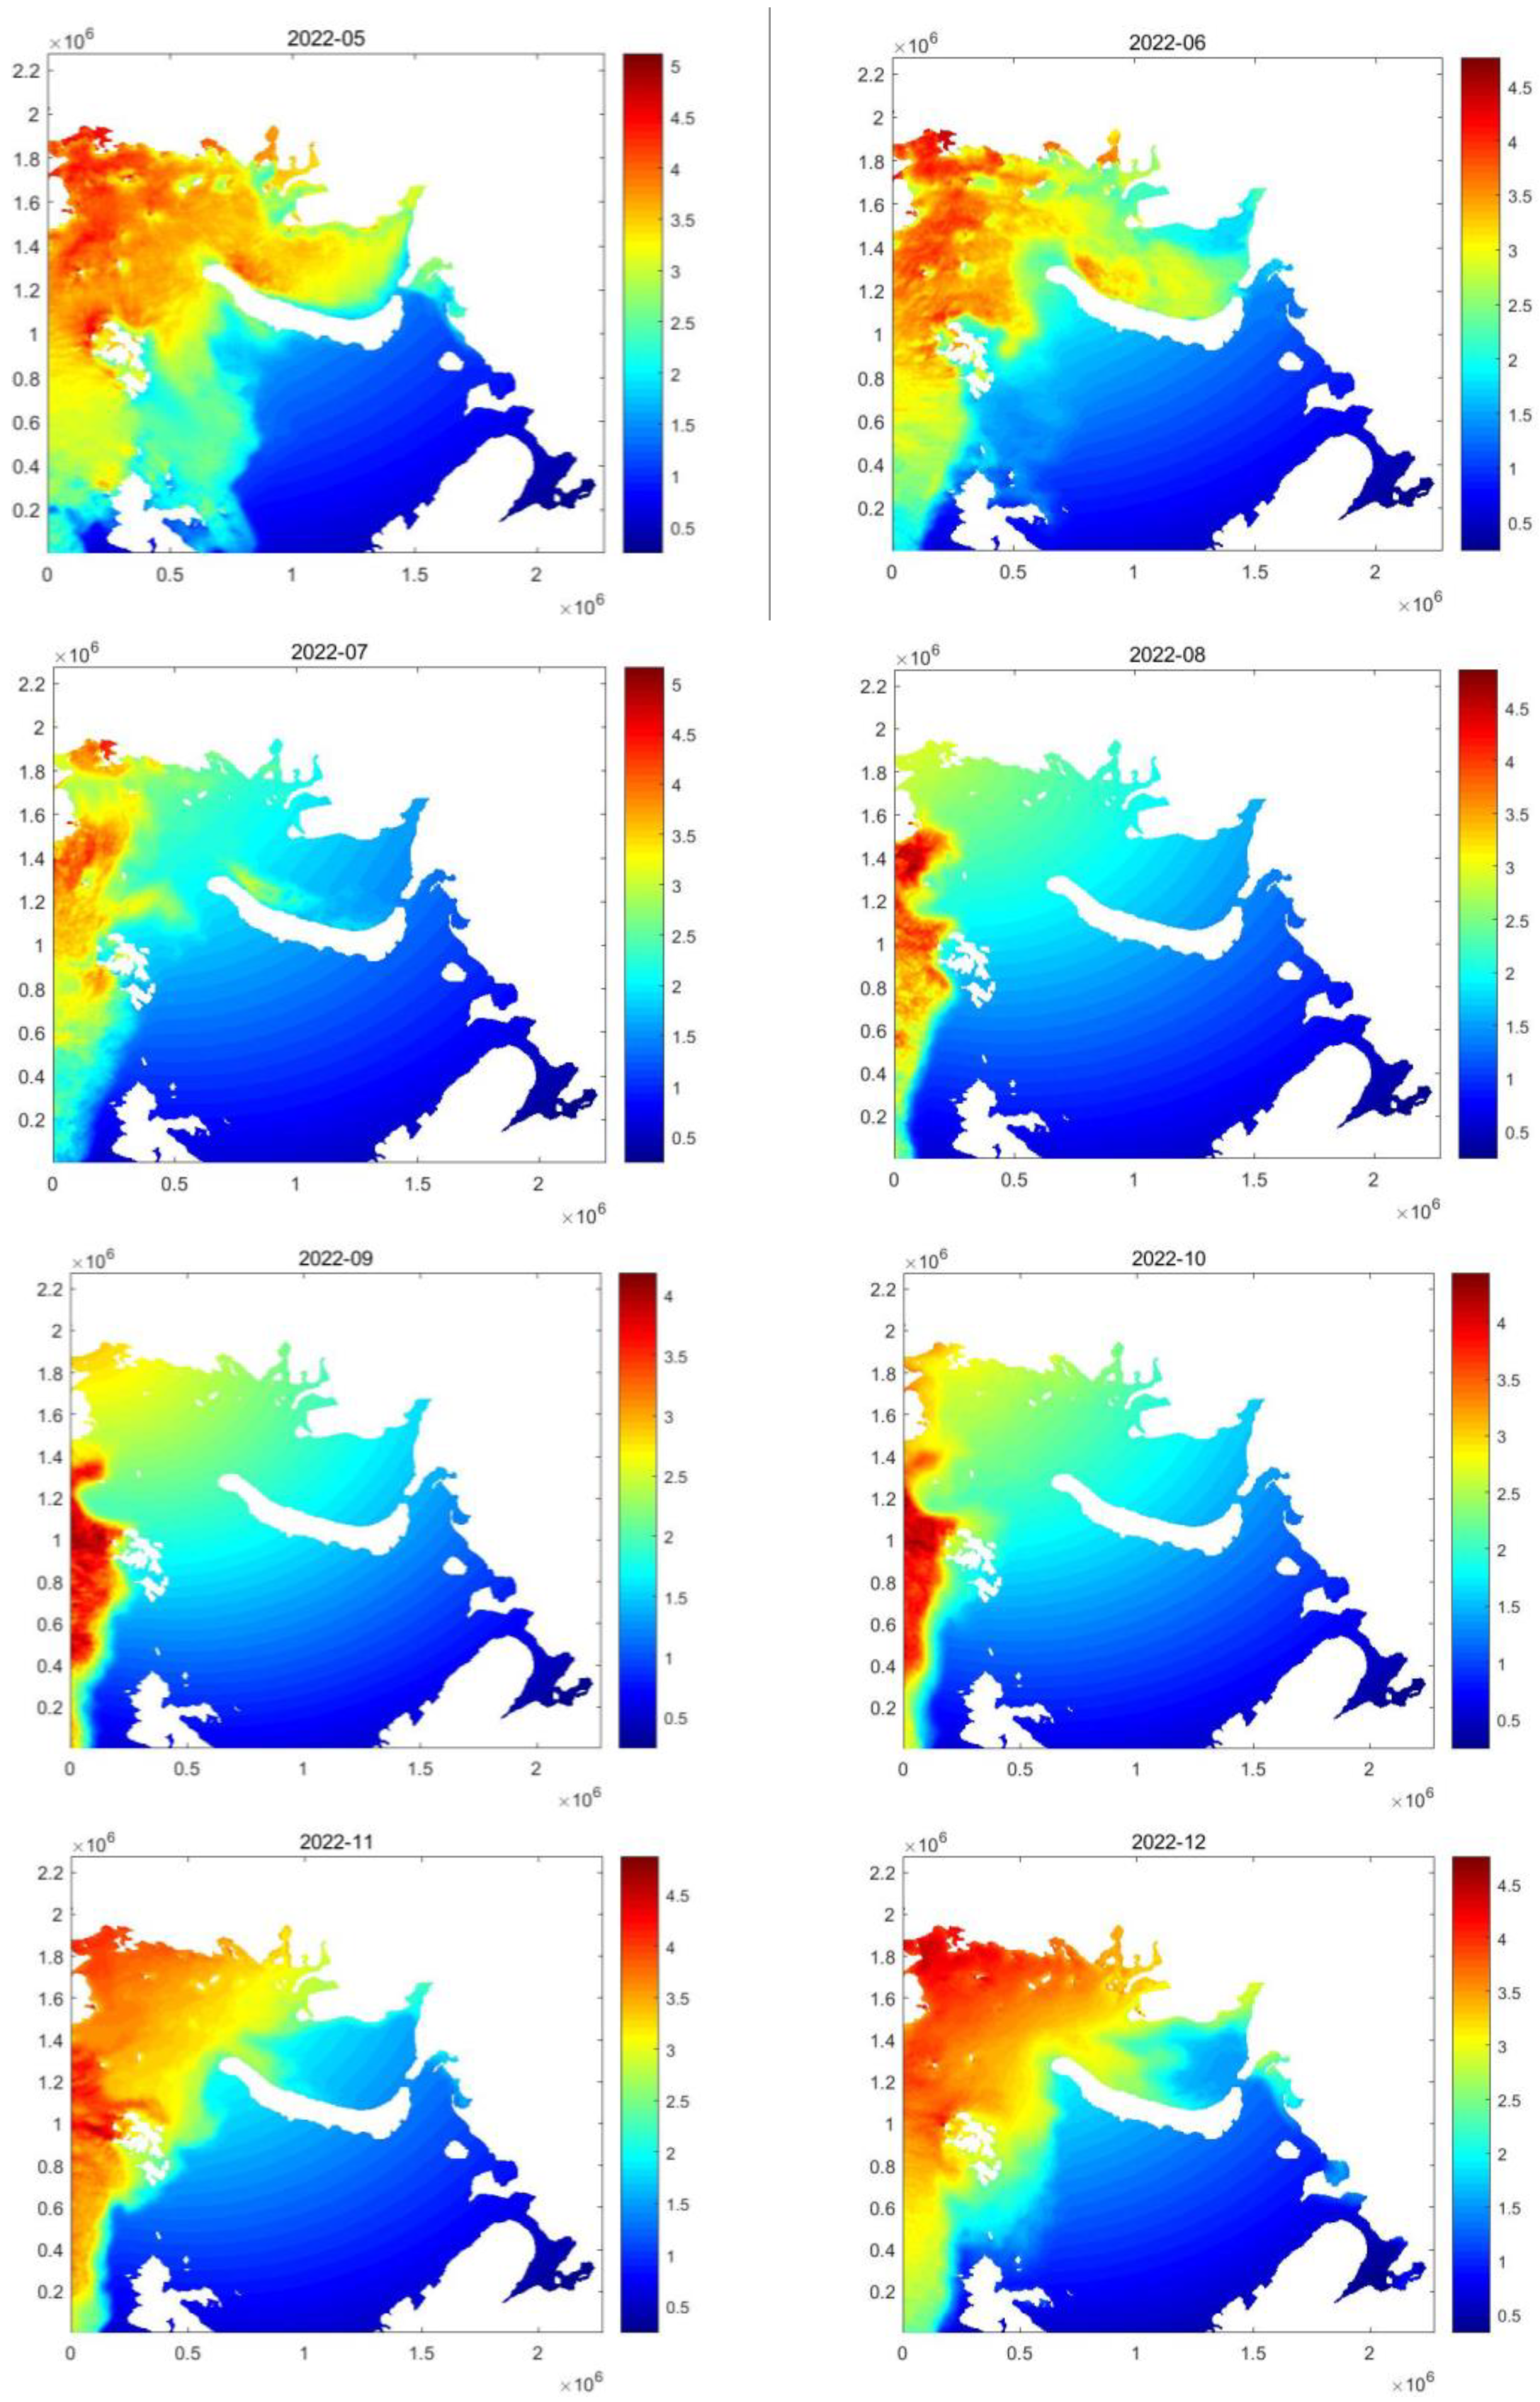
The purpose of constructing the superposition field is to achieve multi-objective path planning and decision making. Due to the unique characteristics of the Arctic region, in addition to the essential meteorological elements, the obstruction of navigation by ice conditions is mainly considered. This paper also adjusts the weights of different elements according to the focus of the study at the same time. The constructed superposition field visually shows the navigability condition of navigable waters. After processing the acquired Arctic sea ice data in 2022, we analyzed the superimposed fields in the study area for other months. From the figure below, we can see that the area of navigable waters changes continuously with the formation and melting of sea ice from season to season. Among them, the best navigable conditions are from August to October 2022, and the worst navigable conditions are in May, when the sea ice coverage is the largest, following the pattern of seasonal change in the northern hemisphere. Due to the influence of the warm Atlantic Ocean, the freezing period and the freezing extent of the Barents Sea are smaller than those of the Kara Sea, as can be seen in Figure 8.
Ships for Arctic navigation are also classified into different classes according to their ice resistance strength, and this paper uses the ice-class ship classification under the IACS standard. People use different classes of ships to meet the safety and efficiency of polar navigation. Different classes of ships are required to meet different conditions for navigation, and this paper ensures the safety of ship navigation by defining non-navigable zones. Firstly, in the environment of the superposition field, the starting point and the ending point are selected in the experimental sea area, and the path search is carried out between the two points according to the principle of decreasing gradient to obtain the planned route. Then, according to the safety restriction conditions of different classes of ships, the no-navigable zone is drawn to see whether the path is in the no-navigable zone. If it is, the ship class is not navigable that month. If it is not, the fuel consumption and emission of the ships on the path are calculated, and finally, the ship type selection for each month of the planned path is obtained. Since the ice conditions in the study area are significantly different in different months, the navigation strategy can be better planned according to the suitability of different classes of ships.
Three classes of ships were selected for the experiment, PC1, PC2 and PC5. PC1 can navigate in any Arctic waters all-year-round and is the highest class of ship, which can navigate in extremely severe ice conditions. PC2 can navigate in moderate multi-year ice conditions all-year-round, and PC5 can navigate in medium first-year ice conditions all-year-round. The significant performance differences between these three classes of vessels are used to select and compare strategies.
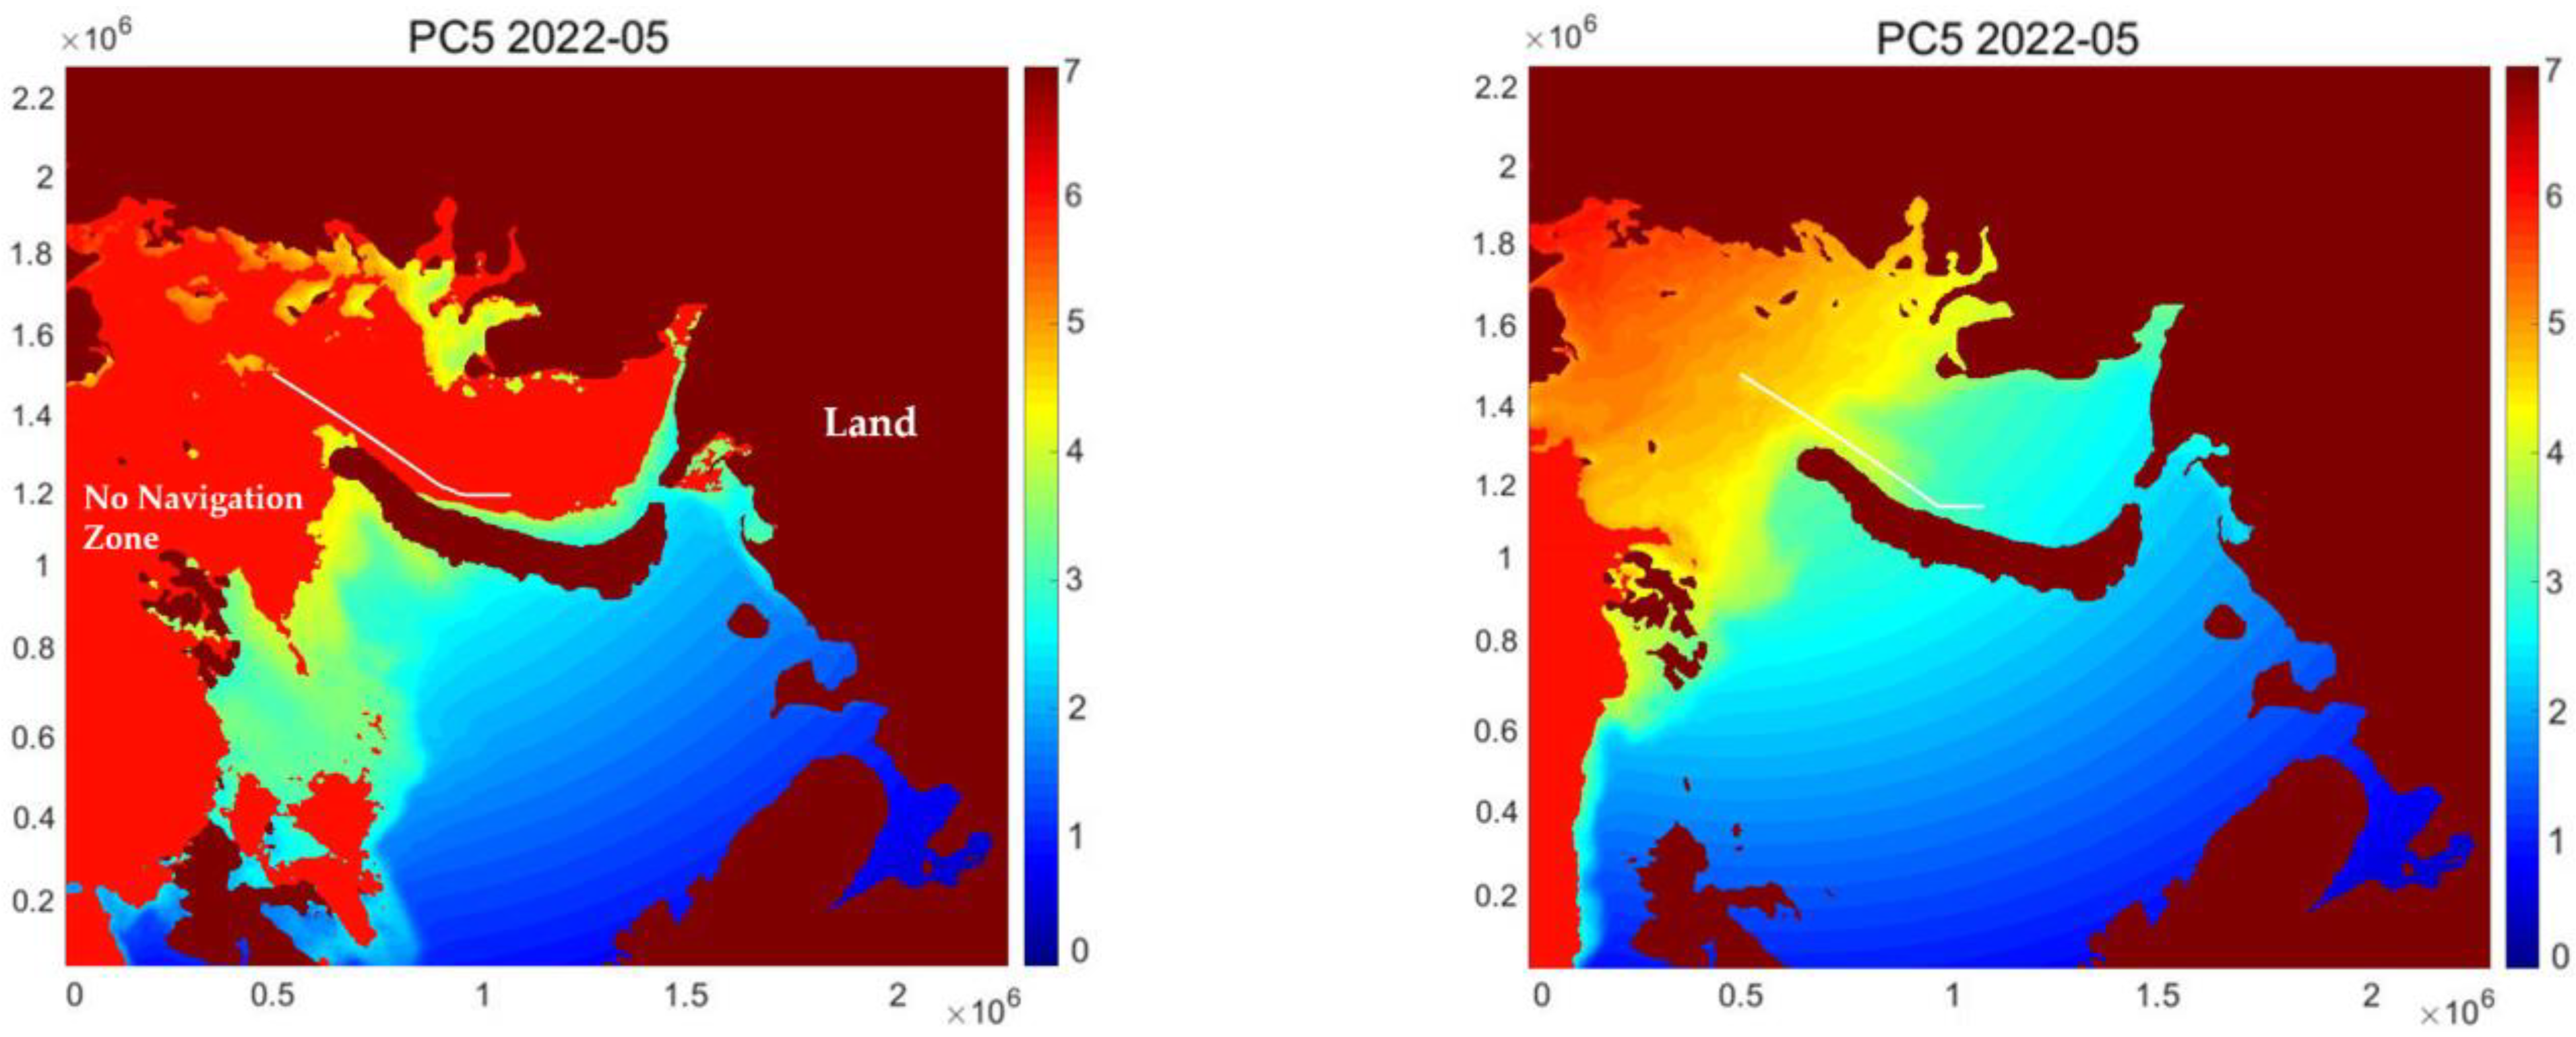
The paths obtained with the gradient descent principle search in the superposition field environment are shown in Figure 9. At the same time, the no-navigation zone is delineated as the bright red area and the dark red area as the land according to the navigation restrictions of different classes of ships. If the path obtained with the path search algorithm is within the no-navigation zone, it is decided that the class of ships is not navigable in that month, as shown in Figure 9.
In this paper, monthly data for 2022 are used for this study. At a realistic level, simulations can be performed using data from the current month or adjacent months to obtain relatively approximate sea ice area navigation conditions. The actual navigation course is larger than the experimental course planned in this paper, so a segmentation model can be adopted to explore the navigability of the area in which each segment of the course is located. At the same time, the actual navigation decision may not have a variety of ship types to choose from. The only way to ensure the safety of navigation in the Arctic is to change the starting point of the voyage or cancel the voyage. Different colors were utilized in this experiment to mark the land and prohibited waters. The delineation of the prohibited area has a high utilization value in the actual navigation decision, which helps to determine the dangerous area for bypassing. Also, it can be used to test the planned path and roughly judge whether it is feasible in that month, as in the experiment of this paper.
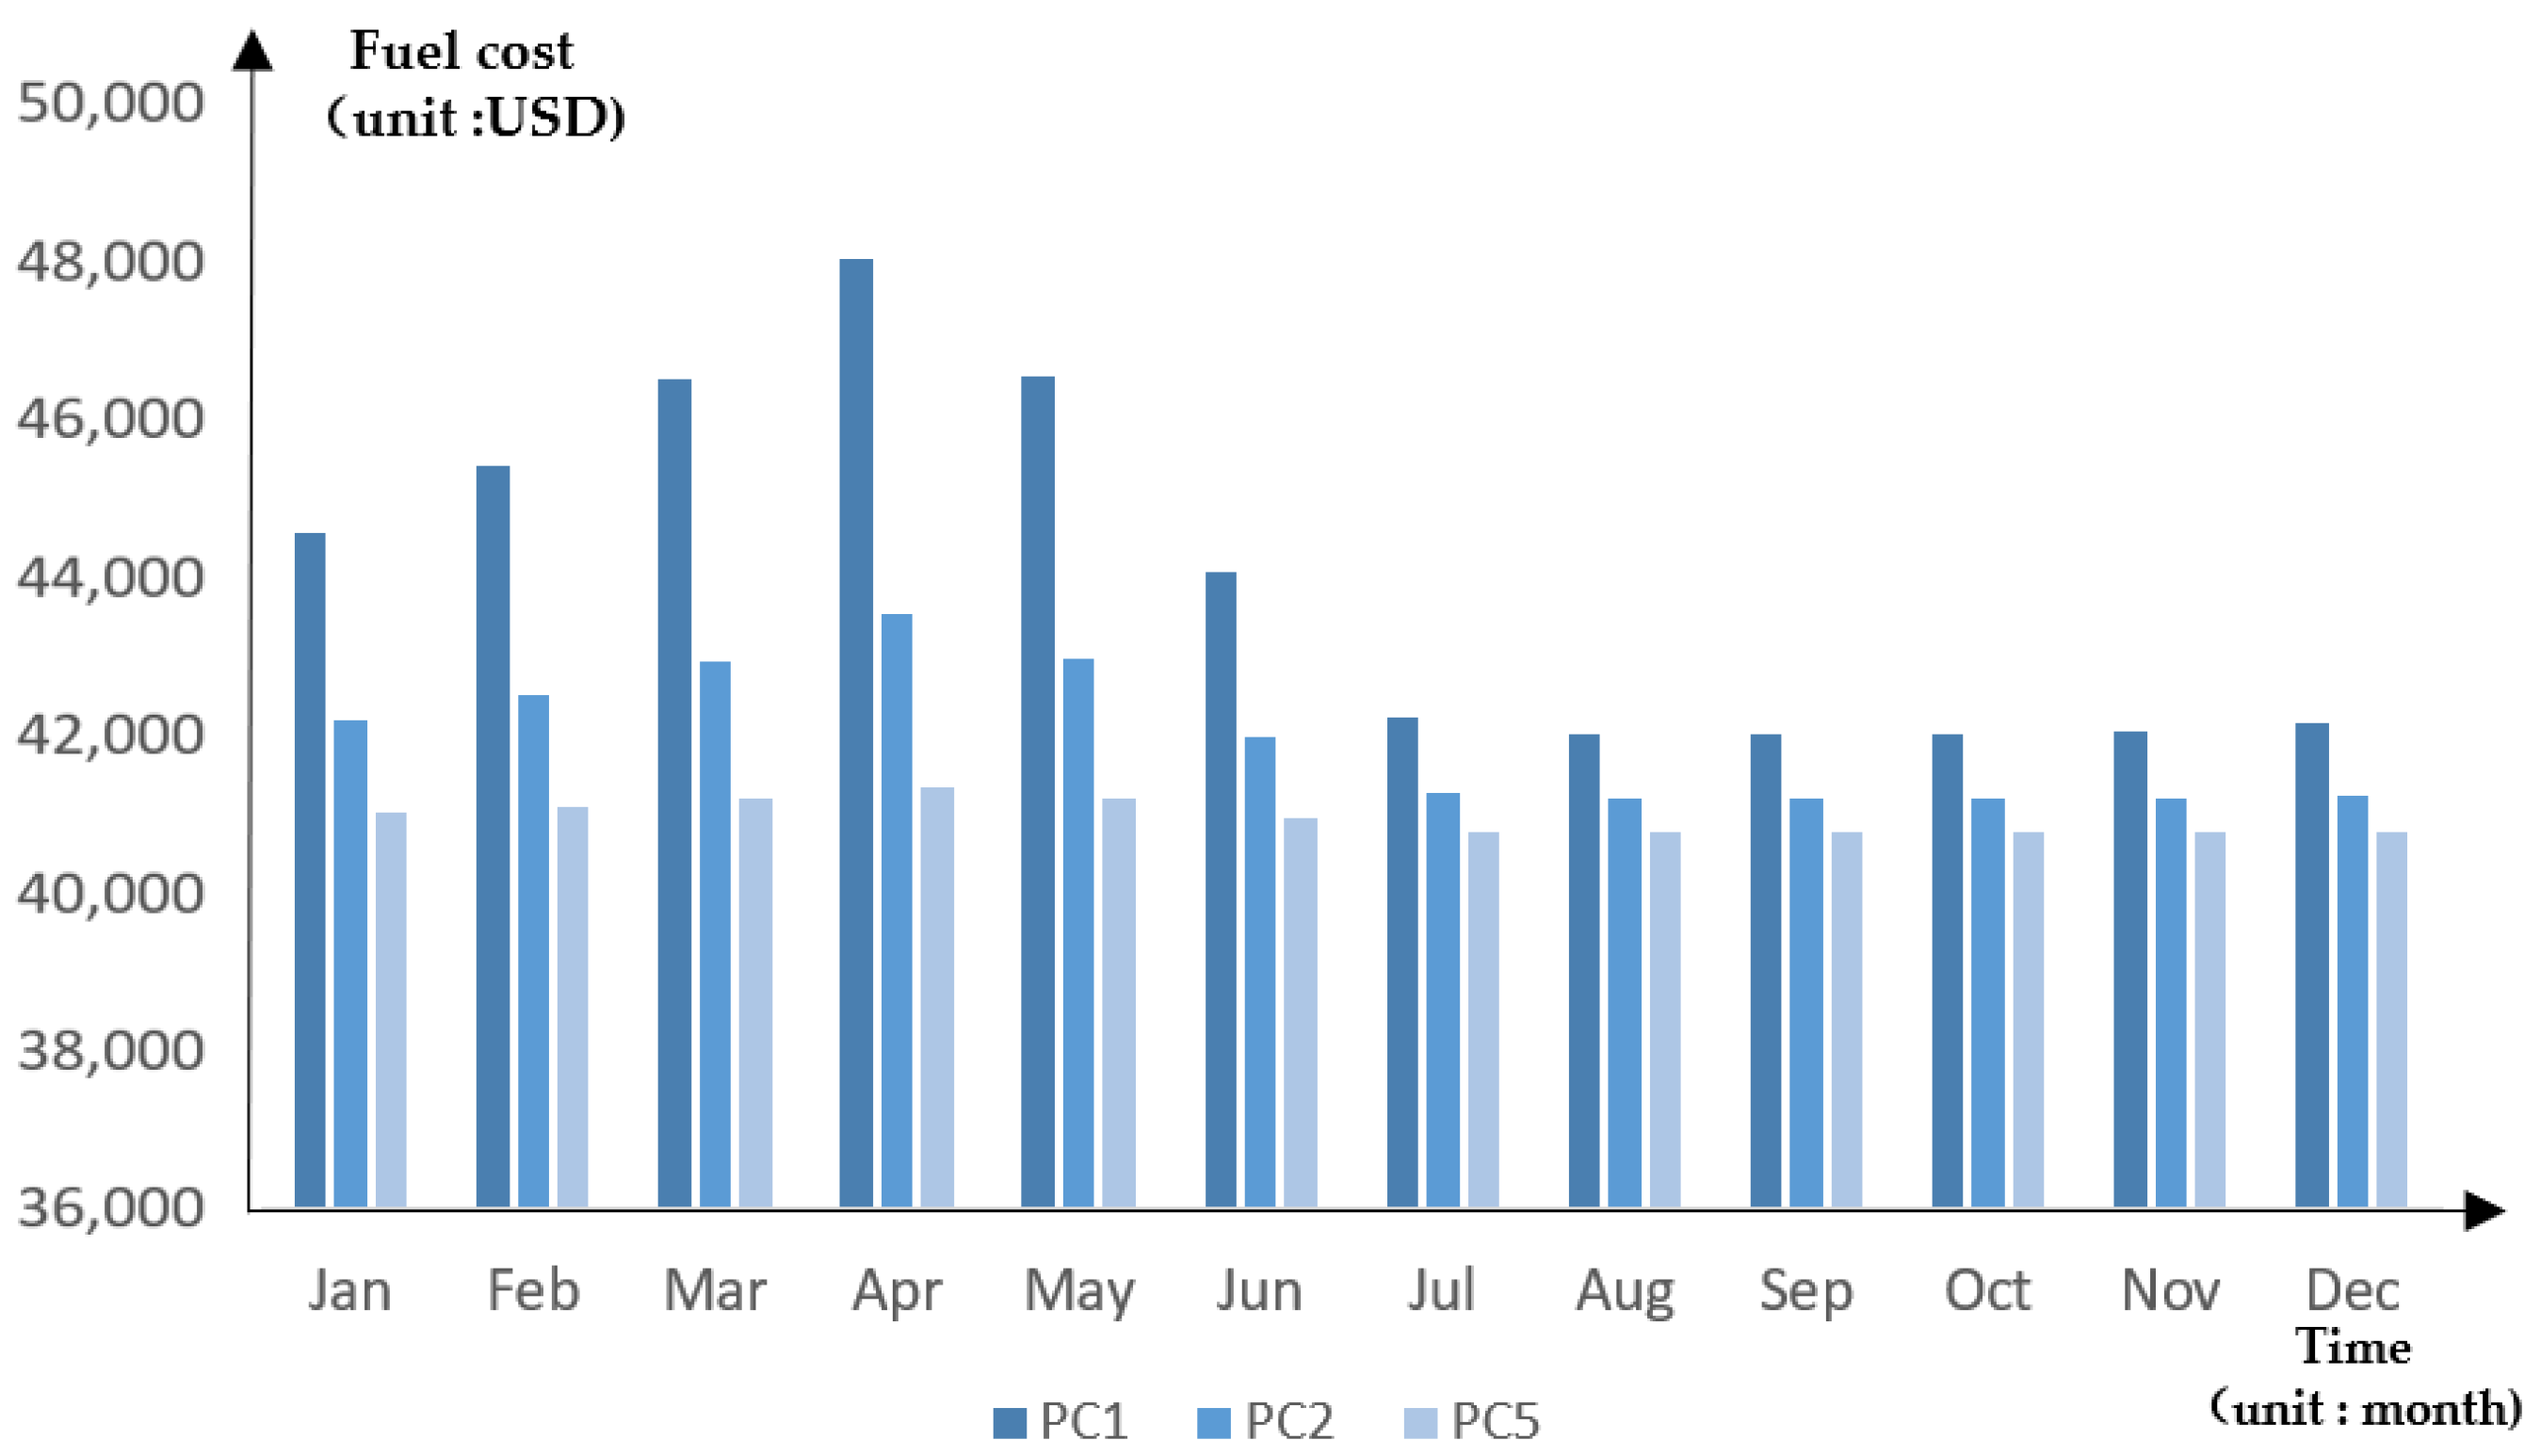
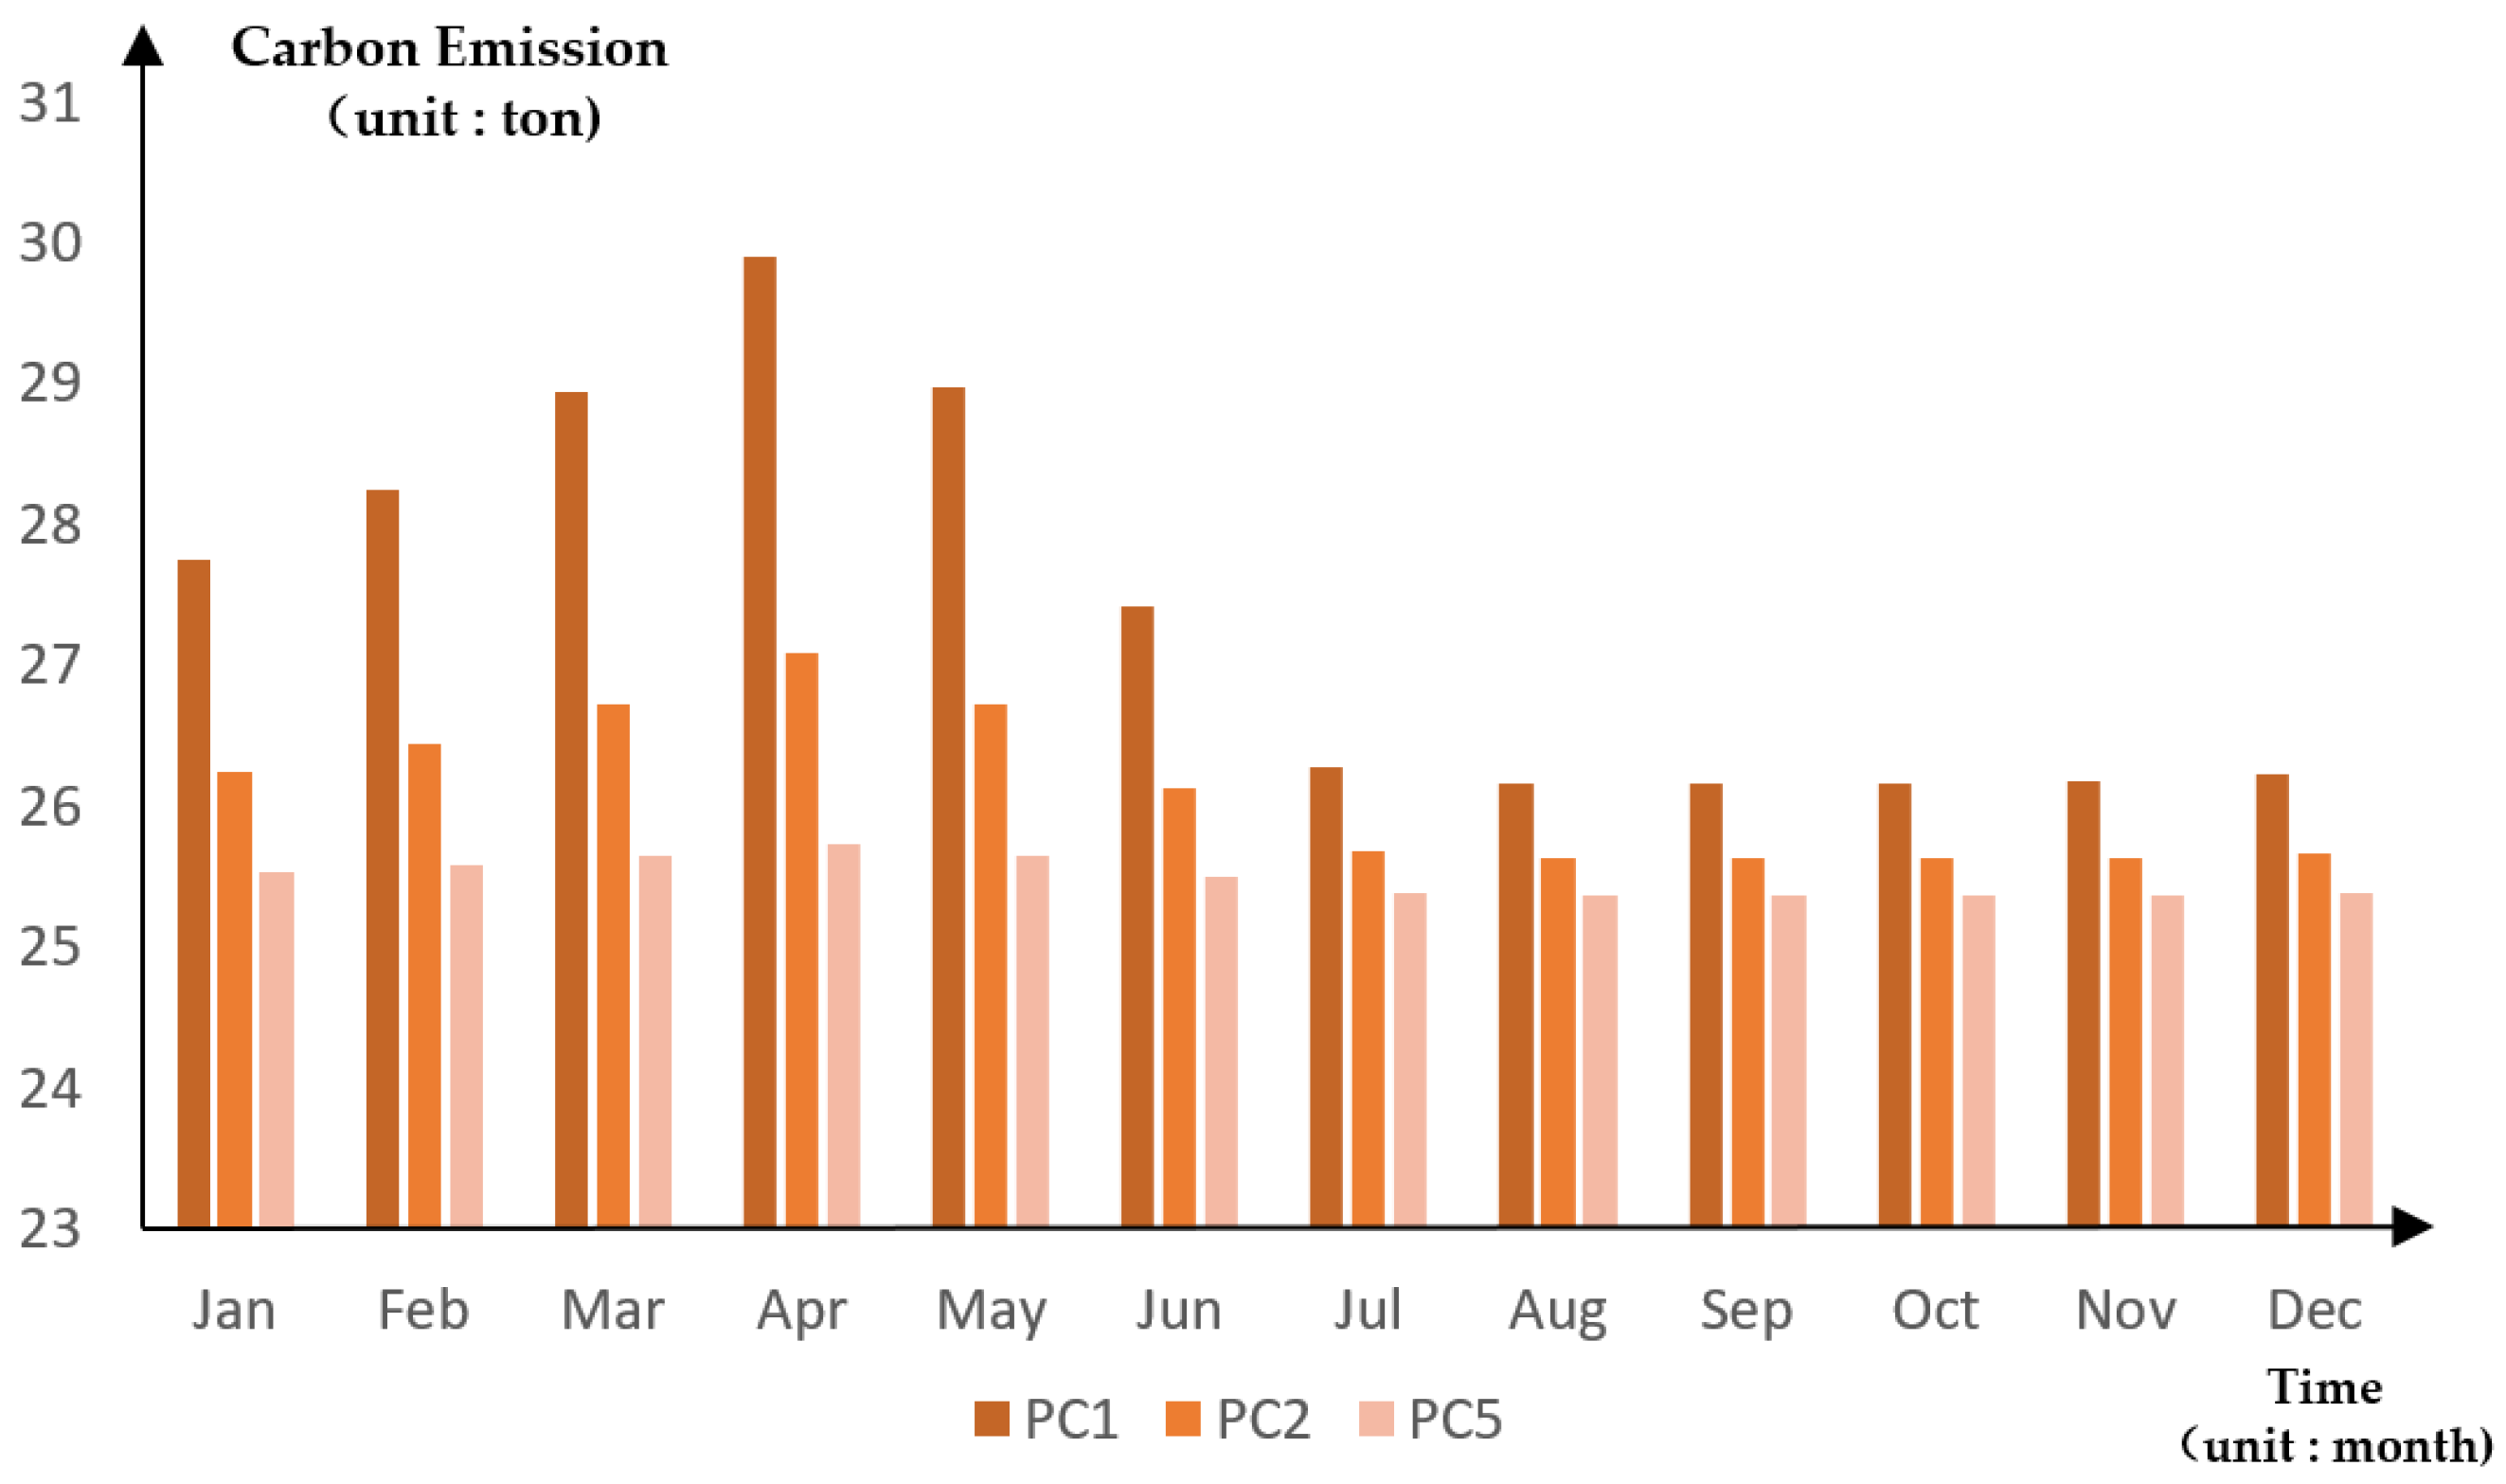
The data are substituted for the three types of ships in this experiment and for each month in 2022. Firstly, the path is searched using the gradient descent algorithm in the superposition field environment to obtain the path. Then, the fuel consumption and carbon emissions at the corresponding locations of the path points obtained in the path planning process are accumulated to obtain the total fuel consumption and total carbon emissions on the path. Table 5 shows the values of the parameters entered for the experimental ice-class vessels PC1, PC2 and PC5; Figure 10 shows the calculated fuel consumption costs in USD for each ice-class vessel on the planned path for each month in 2022; and Figure 11 shows the corresponding CO2 emissions in tons.
The experimental results demonstrate variations in the substituted speed parameters, which can be attributed to the distinct optimal sailing speeds associated with different ship classes. The speed has a direct influence on the carbon emission and fuel consumption, so there are significant differences in the carbon emission and fuel cost among PC1, PC2 and PC3; the suitable sailing speeds of PC1 to PC5 are decreasing in order, and the speed values are positively correlated with the power consumed by the ships. Therefore, the carbon emission value and fuel cost of the ship also decrease according to the order of PC1 to PC5. From the changing trend, PC1 has the most apparent change, PC5 has the most minor change, PC2 is in-between and the changing trend of all three is the same. Meanwhile, from the previous Equations (6) and (7), it can be seen that the carbon emissions have the same trend due to the positive correlation between the carbon emissions and fuel consumption, which increases from January to April, decreases from April to August, remains unchanged from August to October and increases from October to December; the most severe impact of the ice conditions on the path is in April, and both the carbon emissions and fuel costs of the path reach the maximum value in this month, respectively. The carbon emission value is 29.9 tons for PC1, 27.1 tons for PC2 and 25.7 tons for PC5; the fuel cost is USD 48,051.5 for PC1, USD 43,542.3 for PC2 and USD 41,365 for PC5. For the carbon emission and fuel ships, the values from August to October are the same because there is no influence of the sea ice in the area on the ships passing through in these 3 months, so the results are the same, and the lowest values are obtained. PC5 is USD 40,781.1. The fuel cost in Figure 12 and the CO2 emission in Figure 13 are obtained statistically.
For PC2, the planned path from March to May 2022 is not navigable; PC5 is not navigable from January to June. If a ship is not navigable in a particular month, the smaller value of the navigable ship should be selected with the carbon emission and fuel cost of different ship types. As shown in Figure 11, the PC2-class ship is selected for the experimental path from January to February and June, the PC1-class ship with the highest ice resistance class is selected for March to May when the ice conditions are relatively severe and the PC5-class ship is selected for July to December.
It is easy to see that the difference in the estimated navigation cost of each month of the year on the planned route is significant for each ship type. For PC1, the highest fuel cost in April is 114% of the lowest price in August; the cost difference between different ship types is substantial; for example, in April, the fuel cost of PC1-class ships is about 110% and 116% of the PC2 class and PC5 class, respectively; meanwhile, in this experiment, the fuel cost of PC1 varies significantly from month to month in 2022, with the highest value being 14% higher than the lowest value. Still, the highest value of PC2 is only 5% higher than the lowest value, and the variation of PC5 is even more minor from month to month.
For the choice of the sailing season, the bunker cost is higher from February to May due to the poor sea condition, and a lot of operating cost is needed to maintain the safety and timeliness of sailing in this period.
For the ship type selection, it is evident that the higher the class of ship, the higher the cost of expenditure. Although we only study the fuel cost of the vessels in this paper, we can still speculate on the operating price of the ship based on the available information and the actual situation. From the experimental results, the average monthly fuel costs of PC1, PC2 and PC5 on the planned route are USD 43,985.9, 41,957.7 and 40,969.7, respectively, with apparent differences, and the cost difference will be more evident if the sailing distance is further extended. During the ice-free or ice-less period in a summer, non-ice-class vessels can be used to operate some routes to reduce costs.

3.3. Model Validation and Analysis

For the validation of the path planning model in this paper, due to the limitation of experimental data and methods, we use a theoretical analysis to compare other existing Arctic path planning methods for the theoretical validation of this model.
The existing Arctic route planning model is mainly based on the macroscopic global perspective, which is not suitable for the navigation time and process. In contrast, the route planning model in this paper can plan longer routes in sections and use the sea ice conditions at different times to generate the best route for the corresponding time, taking into account the navigation cost and environmental factors; meanwhile, it combines the seaworthiness of different polar ship types and the navigation conditions at different times to help the Arctic shipping operators provide the navigation strategy. The shortcoming of this model is that the artificial potential field method may fall into the local optimal solution. The initial conditions and function design may limit the optimization process, resulting in the algorithm staying in the optimal local solution in the solution space instead of reaching the optimal global solution.
Since Arctic route planning needs to consider factors such as geopolitics and competition among shipping companies, the path planned by the model method in this paper may differ from the actual situation. However, it still has practical application value and provides decision makers a multi-objective planning idea and strategy.

4. Shipping Strategy Design

The ice conditions in the polar seas vary from place to place. However, from the data analysis, the ice conditions in the Arctic Ocean near the coast are relatively good. This is also well illustrated in the experimental section, where we analyzed the Kara Sea and parts of the Barents Sea. With the further melting of Arctic sea ice in the future, there will be fewer obstacles to navigation along the coast.
Figure 14 shows an example of ship selection by month. Based on the selected starting and ending points, we use the planning method described above to obtain an approximate path and then compare the carbon emissions and fuel costs of different classes of ships on the path to obtain a relatively economical and environmentally friendly choice of ship type. The choice of Arctic shipping strategy can be roughly divided into short-distance coastal navigation and long-distance navigation.
In the strategy design of coastal short-distance navigation, due to the short sailing distance and the enormous changes in ice conditions throughout the year, ships with different ice resistance classes can sail independently to cope with ice conditions in other months without considering extreme ice conditions or meteorological conditions. In the winter and spring, when the sea ice condition is most serious in the northern hemisphere, such as January to May, higher-level anti-ice-class ships can be used for navigation to meet the convenience and timeliness of inter-coastal navigation. In the northern hemisphere, in the summer and autumn, when there is less coastal sea ice or even an ice-free period in some areas, it is possible to use low-ice-class ships such as PC6 and PC7 or even ordinary ships for coastal transportation. However, it is necessary to reasonably control the ship speed and use clean fuel that meets relevant requirements to meet the environmental requirements of the Arctic and reduce fuel costs.
In the design of a long-distance voyage strategy, due to the long voyage time, the long-distance voyage needs a different route selection and voyage strategy in sections, and each section can be approximated to short voyage planning. According to the seasonal time and other conditions of each section of the voyage, the navigation strategy decision to follow the route, decided through a statistical analysis, for obtaining an appropriate standing to meet the economic and environmental requirements of the ship type relates to comparing the choice of each section. For the total rent and other costs, ice breakers can be selected for the section with severe ice conditions, and single vessels can be selected for the section with better ice conditions. The final ship type can be selected for each section to make it suitable for navigable water, balancing the safety, navigation cost and environmental protection.

5. Conclusions

This paper proposes an Arctic route planning and navigation strategy design based on the perspective of the carbon emission and fuel cost of ships. By constructing a superposition field environment, the method considers the cost, safety and environmental factors of navigation in Arctic waters under ice conditions. It selects the most economical and environmentally friendly ship type that can adapt to ice conditions in other months to conceive a year-round navigation strategy for the Arctic. In the superposition field environment, the multi-target route planning is completed using the principle of decreasing gradient, and the no-navigation zone is defined according to the navigability of different classes of ships, which is helpful to test the navigability of the planned route and has important practical significance for ships to bypass or re-choose the navigation time. Finally, the monthly data for each month in 2022 are selected for this experiment. The results can visually show the navigable months of different classes of ships, the carbon emissions and fuel costs of the planned paths in each month and the comparison of experimental values of different classes of ships in different months, which is beneficial to polar ship operators in planning suitable routes and sailing times as well as the selection of operating ships, and is beneficial to promote the development of an environmentally friendly and economic Arctic shipping industry. It is of great practical significance to promote the development of an environmentally friendly and economical Arctic shipping industry.

Author Contributions

Conceptualization, J.Z., A.C. and W.C.; methodology, J.Z., A.C. and W.C.; software, A.C. and W.C.; validation, J.Z., A.C. and W.C.; formal analysis, A.C. and W.C.; investigation, A.C. and W.C.; resources, A.C. and W.C.; data curation, A.C. and W.C.; writing—original draft preparation, A.C. and W.C.; writing—review and editing, J.Z., A.C. and W.C.; visualization, A.C. and W.C.; supervision, J.Z., A.C. and W.C.; project administration, J.Z., A.C. and W.C.; funding acquisition, J.Z., A.C. and W.C. All authors have read and agreed to the published version of the manuscript.

Funding

This research was funded by the Nation Nature Science Foundation of China, grant number: 51709166.

Institutional Review Board Statement

Not applicable.

Informed Consent Statement

Informed consent was obtained from all subjects involved in this study.

Data Availability Statement

The data set used in this article comes from the maritime data product “Arctic Ocean Sea Ice Analysis and Forecast” of the European Copernicus Maritime Service.

Conflicts of Interest

The authors declare no conflict of interest.

References

  1. Hsieh, T.-H.; Wang, S.; Gong, H.; Liu, W.; Xu, N. Sea Ice Warning Visualization and Path Planning for Ice Navigation Based on Radar Image Recognition. J. Mar. Sci. Technol. 2021, 29, 280–290. [Google Scholar] [CrossRef]
  2. Theocharis, D.; Pettit, S.; Rodrigues, V.S.; Haider, J. Arctic Shipping: A Systematic Literature Review of Comparative Studies. J. Transp. Geogr. 2018, 69, 112–128. [Google Scholar] [CrossRef]
  3. Zhang, Q.; Wan, Z.; Hemmings, B.; Abbasov, F. Reducing Black Carbon Emissions from Arctic Shipping: Solutions and Policy Implications. J. Clean. Prod. 2019, 241, 118261. [Google Scholar] [CrossRef]
  4. Furuichi, M.; Otsuka, N. Cost Analysis of the Northern Sea Route (NSR) and the Conventional Route Shipping. In Proceedings of the IAME 2013 Conference, Marseille, France, 4 July 2013. [Google Scholar]
  5. Choi, M.; Chung, H.; Yamaguchi, H.; Nagakawa, K. Arctic Sea Route Path Planning Based on an Uncertain Ice Prediction Model. Cold Reg. Sci. Technol. 2015, 109, 61–69. [Google Scholar] [CrossRef]
  6. Wang, Y.; Zhang, R.; Qian, L. An Improved A* Algorithm Based on Hesitant Fuzzy Set Theory for Multi-Criteria Arctic Route Planning. Symmetry 2018, 10, 765. [Google Scholar] [CrossRef] [Green Version]
  7. Lee, H.-W.; Roh, M.-I.; Kim, K.-S. Ship Route Planning in Arctic Ocean Based on POLARIS. Ocean Eng. 2021, 234, 109297. [Google Scholar] [CrossRef]
  8. Chang, K.Y.; He, S.S.; Chou, C.C.; Kao, S.L.; Chiou, A.S. Route Planning and Cost Analysis for Travelling through the Arctic Northeast Passage Using Public 3D GIS. Int. J. Geogr. Inf. Sci. 2015, 29, 1375–1393. [Google Scholar] [CrossRef]
  9. Zhang, M.; Zhang, D.; Fu, S.; Yan, X.; Zhang, C. A Method for Planning Arctic Sea Routes under Multi-Constraint Conditions. In Proceedings of the International Conference on Port and Ocean Engineering under Arctic Conditions, POAC, Busan, Republic of Korea, 1 January 2017. [Google Scholar]
  10. Zhang, C.; Zhang, D.; Zhang, M.; Mao, W. Data-Driven Ship Energy Efficiency Analysis and Optimization Model for Route Planning in Ice-Covered Arctic Waters. Ocean Eng. 2019, 186, 106071. [Google Scholar] [CrossRef]
  11. Topaj, A.G.; Tarovik, O.V.; Bakharev, A.A.; Kondratenko, A.A. Optimal Ice Routing of a Ship with Icebreaker Assistance. Appl. Ocean Res. 2019, 86, 177–187. [Google Scholar] [CrossRef]
  12. Hollenbach, U.; Friesch, J. Efficient Hull Forms—What Can Be Gained? In Proceedings of the 1st International Conference on Ship Efficiency, Hamburg, Germany, 23–24 September 2013. [Google Scholar]
  13. Prpić-Oršić, J.; Faltinsen, O.M. Estimation of Ship Speed Loss and Associated CO2 Emissions in a Seaway. Ocean Eng. 2012, 44, 1–10. [Google Scholar] [CrossRef]
  14. Huang, L.; Li, Z.; Ryan, C.; Ringsberg, J.W.; Pena, B.; Li, M.; Ding, L.; Thomas, G. Ship Resistance When Operating in Floating Ice Floes: Derivation, Validation, and Application of an Empirical Equation. Mar. Struct. 2021, 79, 103057. [Google Scholar] [CrossRef]
  15. Wu, P.; Xie, S.; Liu, H.; Li, M.; Li, H.; Peng, Y.; Li, X.; Luo, J. Autonomous Obstacle Avoidance of an Unmanned Surface Vehicle Based on Cooperative Manoeuvring. Ind. Robot Int. J. 2017, 44, 64–74. [Google Scholar] [CrossRef]
Figure 1. Arctic ice concentration map in November 2021.
Jmse 11 01308 g001
Figure 2. Arctic ice thickness map in November 2021 (data can be obtained from the maritime data product “Arctic Ocean Sea Ice Analysis and Forecast” of the European Copernicus Maritime Service).
Jmse 11 01308 g002
Figure 3. Ice condition index map in November 2022.
Jmse 11 01308 g003
Figure 4. Energy field map.
Jmse 11 01308 g004
Figure 5. Directional field map.
Jmse 11 01308 g005
Figure 6. Superposition field map.
Jmse 11 01308 g006
Figure 7. Map gradient and contour of directional field.
Jmse 11 01308 g007
Figure 8. Superimposed field maps for each month in the study area in 2022.
Jmse 11 01308 g008aJmse 11 01308 g008b
Figure 9. Routes and no-navigation zones.
Jmse 11 01308 g009
Figure 10. Cost of fuel consumption and the corresponding vessel type (units: USD).
Jmse 11 01308 g010
Figure 11. Carbon emission and the corresponding vessel type (units: tons).
Jmse 11 01308 g011
Figure 12. The total fuel consumption on the path each month.
Jmse 11 01308 g012
Figure 13. The total carbon emission on the path each month.
Jmse 11 01308 g013
Figure 14. An example of ship selection by month.
Jmse 11 01308 g014
Table 1. Relationship between polar navigability and ice concentration.
Ice ConcentrationDescriptionNavigability
0/10Ice-freeFreely Navigable
<1/10Open Water
1/10–3/10Very Open DriftCannot Navigate in the Scheduled Direction
4/10–6/10Open DriftObstacles to Navigation
7/10–8/10Close Pack
9/10Very Close PackHard to Navigate
Independently
without Ice Breaker Support
* 9/10Compact Ice
10/10Consolidated Ice
* 9/10: Floating ice in which the concentration is nearly 10/10 and no water is visible.
Table 2. Operating Capability of different ice-class ships.
Ice ClassOperating Capability
PC1Year-round Operation in all polar water
PC2Year-round Operation in moderate multi-year ice
PC3Year-round Operation in second-year ice
which may include multi-year inclusions
PC4Year-round Operation in thick first-year ice
which may include old ice inclusions
PC5Year-round Operation in medium first-year ice
which may include old ice inclusions
PC6Summer/Autumn Operation in medium first-year ice
which may include old ice inclusions
PC7Summer/Autumn Operation in thin first-year ice
which may include old ice inclusions
Table 3. Ice thickness at different Stages of development that are mentioned in this paper.
Stage of DevelopmentIce Thickness
Multi-Year Ice2~4 m
Second-Year Ice2 m or more
First-Year Ice30~120 cm
Thin First-Year Ice30~70 cm
Medium First-Year Ice70~120 cm
Thick First-Year Ice≥120 cm
Table 4. Descriptions of parameters in equations.
ParametersMeaning
P s t i l l Still water power
ρ Water density
C t s Still water drag coefficient
S Wetted surface
v Ship speed
m Cargo on board the vessel
n Cargo weight constant
D W T Dead weight tonnage
R i c e Ship resistance induced by ice
A Ice resistance coefficient
ρ i c e Ice density
D Equivalent ice diameter of upper surface
B Ship beam at waterline
L P P Ship length between perpendiculars
F r Froude number
Table 5. The parameter values of PC1, PC2 and PC5 are taken in this experiment.
ParameterPC1PC2PC5
v (kts)1185
DWT (t)100010001000
F r 101010
L P P 111
B303132
Disclaimer/Publisher’s Note: The statements, opinions and data contained in all publications are solely those of the individual author(s) and contributor(s) and not of MDPI and/or the editor(s). MDPI and/or the editor(s) disclaim responsibility for any injury to people or property resulting from any ideas, methods, instructions or products referred to in the content.