Article

Heat-Induced Pore Structure Evolution in the Triassic Chang 7 Shale, Ordos Basin, China: Experimental Simulation of In Situ Conversion Process

1
Research Institute of Petroleum Exploration & Development, PetroChina, Beijing 100083, China
2
Key Laboratory of Continental Shale Hydrocarbon Accumulation and Efficient Development, Ministry of Education, Northeast Petroleum University, Daqing 163318, China
*
Authors to whom correspondence should be addressed.
J. Mar. Sci. Eng. 2023, 11(7), 1363; https://doi.org/10.3390/jmse11071363
Submission received: 28 May 2023 / Revised: 29 June 2023 / Accepted: 30 June 2023 / Published: 4 July 2023
(This article belongs to the Section Geological Oceanography)

Abstract

:
The reservoir properties of low–medium-maturity shale undergo complex changes during the in situ conversion process (ICP). The experiments were performed at high temperature (up to 450 °C), high pressure (30 MPa), and a low heating rate (0.4 °C/h) on low–medium-maturity shale samples of the Chang 7 Member shale in the southern Ordos Basin. The changes in the shale composition, pore structure, and reservoir properties during the ICP were quantitatively characterized by X-ray diffraction (XRD), microscopic observation, vitrinite reflectance (Ro), scanning electron microscopy (SEM), and reservoir physical property measurements. The results showed that a sharp change occurred in mineral and maceral composition, pore structure, porosity, and permeability at a temperature threshold of 350 °C. In the case of a temperature > 350 °C, pyrite, K-feldspar, ankerite, and siderite were almost completely decomposed, and organic matter (OM) was cracked into large quantities of oil and gas. Furthermore, a three-scale millimeter–micrometer–nanometer pore–fracture network was formed along the shale bedding, between OM and mineral particles and within OM, respectively. During the ICP, porosity and permeability showed a substantial improvement, with porosity increasing by approximately 10-times and permeability by 2- to 4-orders of magnitude. Kerogen pyrolysis, clay–mineral transformation, unstable mineral dissolution, and thermal stress were the main mechanisms for the substantial improvement in the reservoir’s physical properties. This study is expected to provide a basis for formulating a heating procedure and constructing a numerical model of reservoir properties for the ICP field pilot in the Chang 7 shale of the Ordos Basin.

1. Introduction

The production of shale oil in the United States, which exceeded 3.5 × 10⁸ t in 2020, has altered the country’s energy supply patterns and reduced its dependence on overseas production. Influenced by the successful commercialization in the United States, China has also been paying increasing attention to shale oil research [1,2]. In China, shale oil refers to oil that has been generated in organic-rich shale, where it occurs in macro-fractures, matrix pores, and micro-fractures of shale and thin interlayers of non-shale materials in free, adsorbed, and/or miscible states [3]. According to the variable degree of vitrinite reflectance (Ro), shale can be divided into medium–high-maturity (Ro > 0.9%) and low–medium-maturity (Ro ≤ 0.9%) shale [4]. The recoverable resource of medium–high-maturity shale oil is 145 × 108 t in China, whereas the recoverable resource of low–medium-maturity shale oil is 700–900 × 108 t. Low–medium-maturity shale oil is, thus, the main component of continental shale oil in China and has great resource potential [1,5].
Although the resource potential of low–medium-maturity shale oil is huge, the reservoir’s physical properties are poor, and the oil has low mobility caused by large shale oil molecules, strong polarity, and high wax content [6]. The in situ conversion process (ICP) mining method proposed by Dutch Shell is regarded as one of the most-advanced technologies for the in situ exploitation of low–medium-maturity shale oil. A total of 38 well groups have been tested for oil shale ICP at shallow burial depths in various locations, including in Colorado (United States), Alberta (Canada), and Jordan, and the technique is now ready for commercial application [7,8,9,10,11,12,13]. The ICP technique involves heating the shale or oil shale underground at high temperatures (>400 °C) and low heating rates (<10 °C/day) to induce kerogen pyrolysis or bitumen cracking into light oil and gas and the recovery of the products through production wells.
Previous studies have focused mainly on the reservoir evolution of shale at depths shallower than 500 m during the ICP through thermal simulation experiments and numerical simulations. The results have shown that, during the in situ heating of oil shale, a complex pore–fracture network can be formed, which greatly enhances the connectivity of the pores and fractures and improves the permeability of the shale. For example, Wang et al. [14] found that thermal fracturing is the main control on permeability in the direction parallel to the bedding of oil shale in experiments involving a high-temperature and high-pressure triaxial permeability system and that the connectivity of the pores determines the permeability in the direction normal to the bedding. Zhao et al. [15] discovered that thermal cracking and pyrolysis of solid organic matter (OM) in oil shale control the evolution of permeability involving a triaxial permeability testing machine under in situ conditions.
Oil shale is buried at relatively shallow depths (<500 m) with relatively low reservoir pressure (<5 MPa) and overburden pressure (<15 MPa). Therefore, numerous pores and fractures can be easily generated during the ICP. In comparison, low–medium-maturity shale is buried at greater depths (>1000 m) with higher reservoir pressure and overburden pressure, which reduces the ease of generating pores and fractures in such reservoirs during the ICP [16,17,18,19,20,21,22,23]. The evolution of pores and fractures during the ICP of shale is complex, and its mechanisms are currently unclear.
Regarding this issue, some studies have conducted thermal simulation experiments involving shale in an attempt to characterize shale reservoir evolution during heating [24,25,26,27,28,29,30,31]. Wu et al. [32] evaluated the porosity evolution at the same position with varying temperature by using high T&P physical modeling, Nano-CT, and SEM. Li et al. [33] built an in situ high-temperature-environment rock fracture visualization test system that could dynamically capture crack-tip initiation and propagation. The results showed that, under the condition of no confining pressure, with increases in the temperature, the macroscopic material stiffness and fracture toughness of shale increase; this shows that high temperatures inhibit crack initiation and propagation. Ge et al. [34] found that there is a significant thermal Kaiser effect during the heating of shale. An increase in the heating rate is beneficial to the development of large-scale tensile cracks, while inorganic minerals begin to expand due to heat, and micro-cracks gradually expand and connect, thus improving the connectivity of the pore channels. Xu et al. [35] found that an increased temperature intensifies the evolution of dissolution pores in unstable brittle minerals, promotes clay mineral conversion, and accelerates the development of clay mineral pores and organic pores. Some scholars have analyzed the pore structure heterogeneity during thermal maturation [36,37,38,39].
Overall, there are still the following issues that need to be further addressed regarding the changes in the reservoir’s characteristics during the heating process of low–medium-maturity shale. Most thermal simulation experiments have been performed with a high heating rate (5–25 °C/h) and without a high in situ stress state, thus differing from the actual conditions of the ICP. In addition, previous studies have focused primarily on the changes in the pore structure or the reservoir’s physical properties of the shale during heating, and there have been few systematic studies of the evolution of the mineral and maceral composition, geochemical characteristics, pore structure, porosity, and permeability of the shale through ICP simulation experiments.
In view of this, this study used a sample of the Chang 7 shale for ICP physical simulation experiments at high temperature (up to 450 °C), high pressure (30 MPa), and a low heating rate (0.4 °C/h). This paper presents the results of the experiments, including changes in the shale composition, pore structure, and reservoir’s physical properties during heating and discusses the obtained improvement in the shale reservoir quality (as assessed by porosity and permeability), as well as the mechanisms of and controls on these changes and improvements. China National Petroleum Corporation (CNPC) has set up a field pilot for the ICP of the Chang 7 shale in the Ordos Basin. As one of the key components of the CNPC ICP field pilot investigation, this study provides a basis for formulating a heating procedure and building a numerical simulation model of the reservoir, as well as guiding the implementation of the ICP field pilot investigation of the Chang 7 shale in the Ordos Basin.

2. Samples and Experiments

2.1. Regional Geological Characteristics and Sampling Location

The Ordos Basin, which is located in the west of the North China platform, is a large inland depression sedimentary basin formed by the superposition of multiple tectonic events. The Late Triassic Indosinian orogeny caused collision and compression between the Yangtze and North China plates [40], forming a large inland depression lake basin (the Ordos Basin) surrounded by mountainous terrain. According to the morphology and structural characteristics, the basin can be divided into six secondary structural units (Figure 1): the Yimeng anticline, the Weibei anticline, the Western Shanxi fold belt, the Yishan slope, the Tianhuan syncline, and the western margin thrust-fault structural belt [40].
A complete set of lacustrine–fluvial–deltaic-facies depositional system clastic rocks is contained in the Yanchang Formation of the Ordos Basin and can be divided into 10 members from top to bottom. Of these, the sediments of the Chang 7 Member represent the depositional period of the maximum expansion of the lake basin. During the deposition of this Member, much of the lake was deep (water depth from 36 to 129 m), and this deep water covered an area of 6.5 × 10⁴ km2. A set of source rocks rich in OM and with a thickness of >100 m has been identified in the Chang 7 Member and is the main target of the current exploration and the ICP of shale oil [40].
The studied sample was selected from a black shale core of the Chang 7 Member of the Triassic Yanchang Formation in the southern Ordos Basin, with a burial depth of 1247 m (Figure 1). The TOC of the core at this depth is 18.68%, and the maximum vitrinite reflectance (Ro) value is 0.49%, classifying the sample as low-maturity organic-rich shale, meaning that it is suitable for the ICP simulation experiments conducted during this study.

2.2. ICP Simulation Experiments

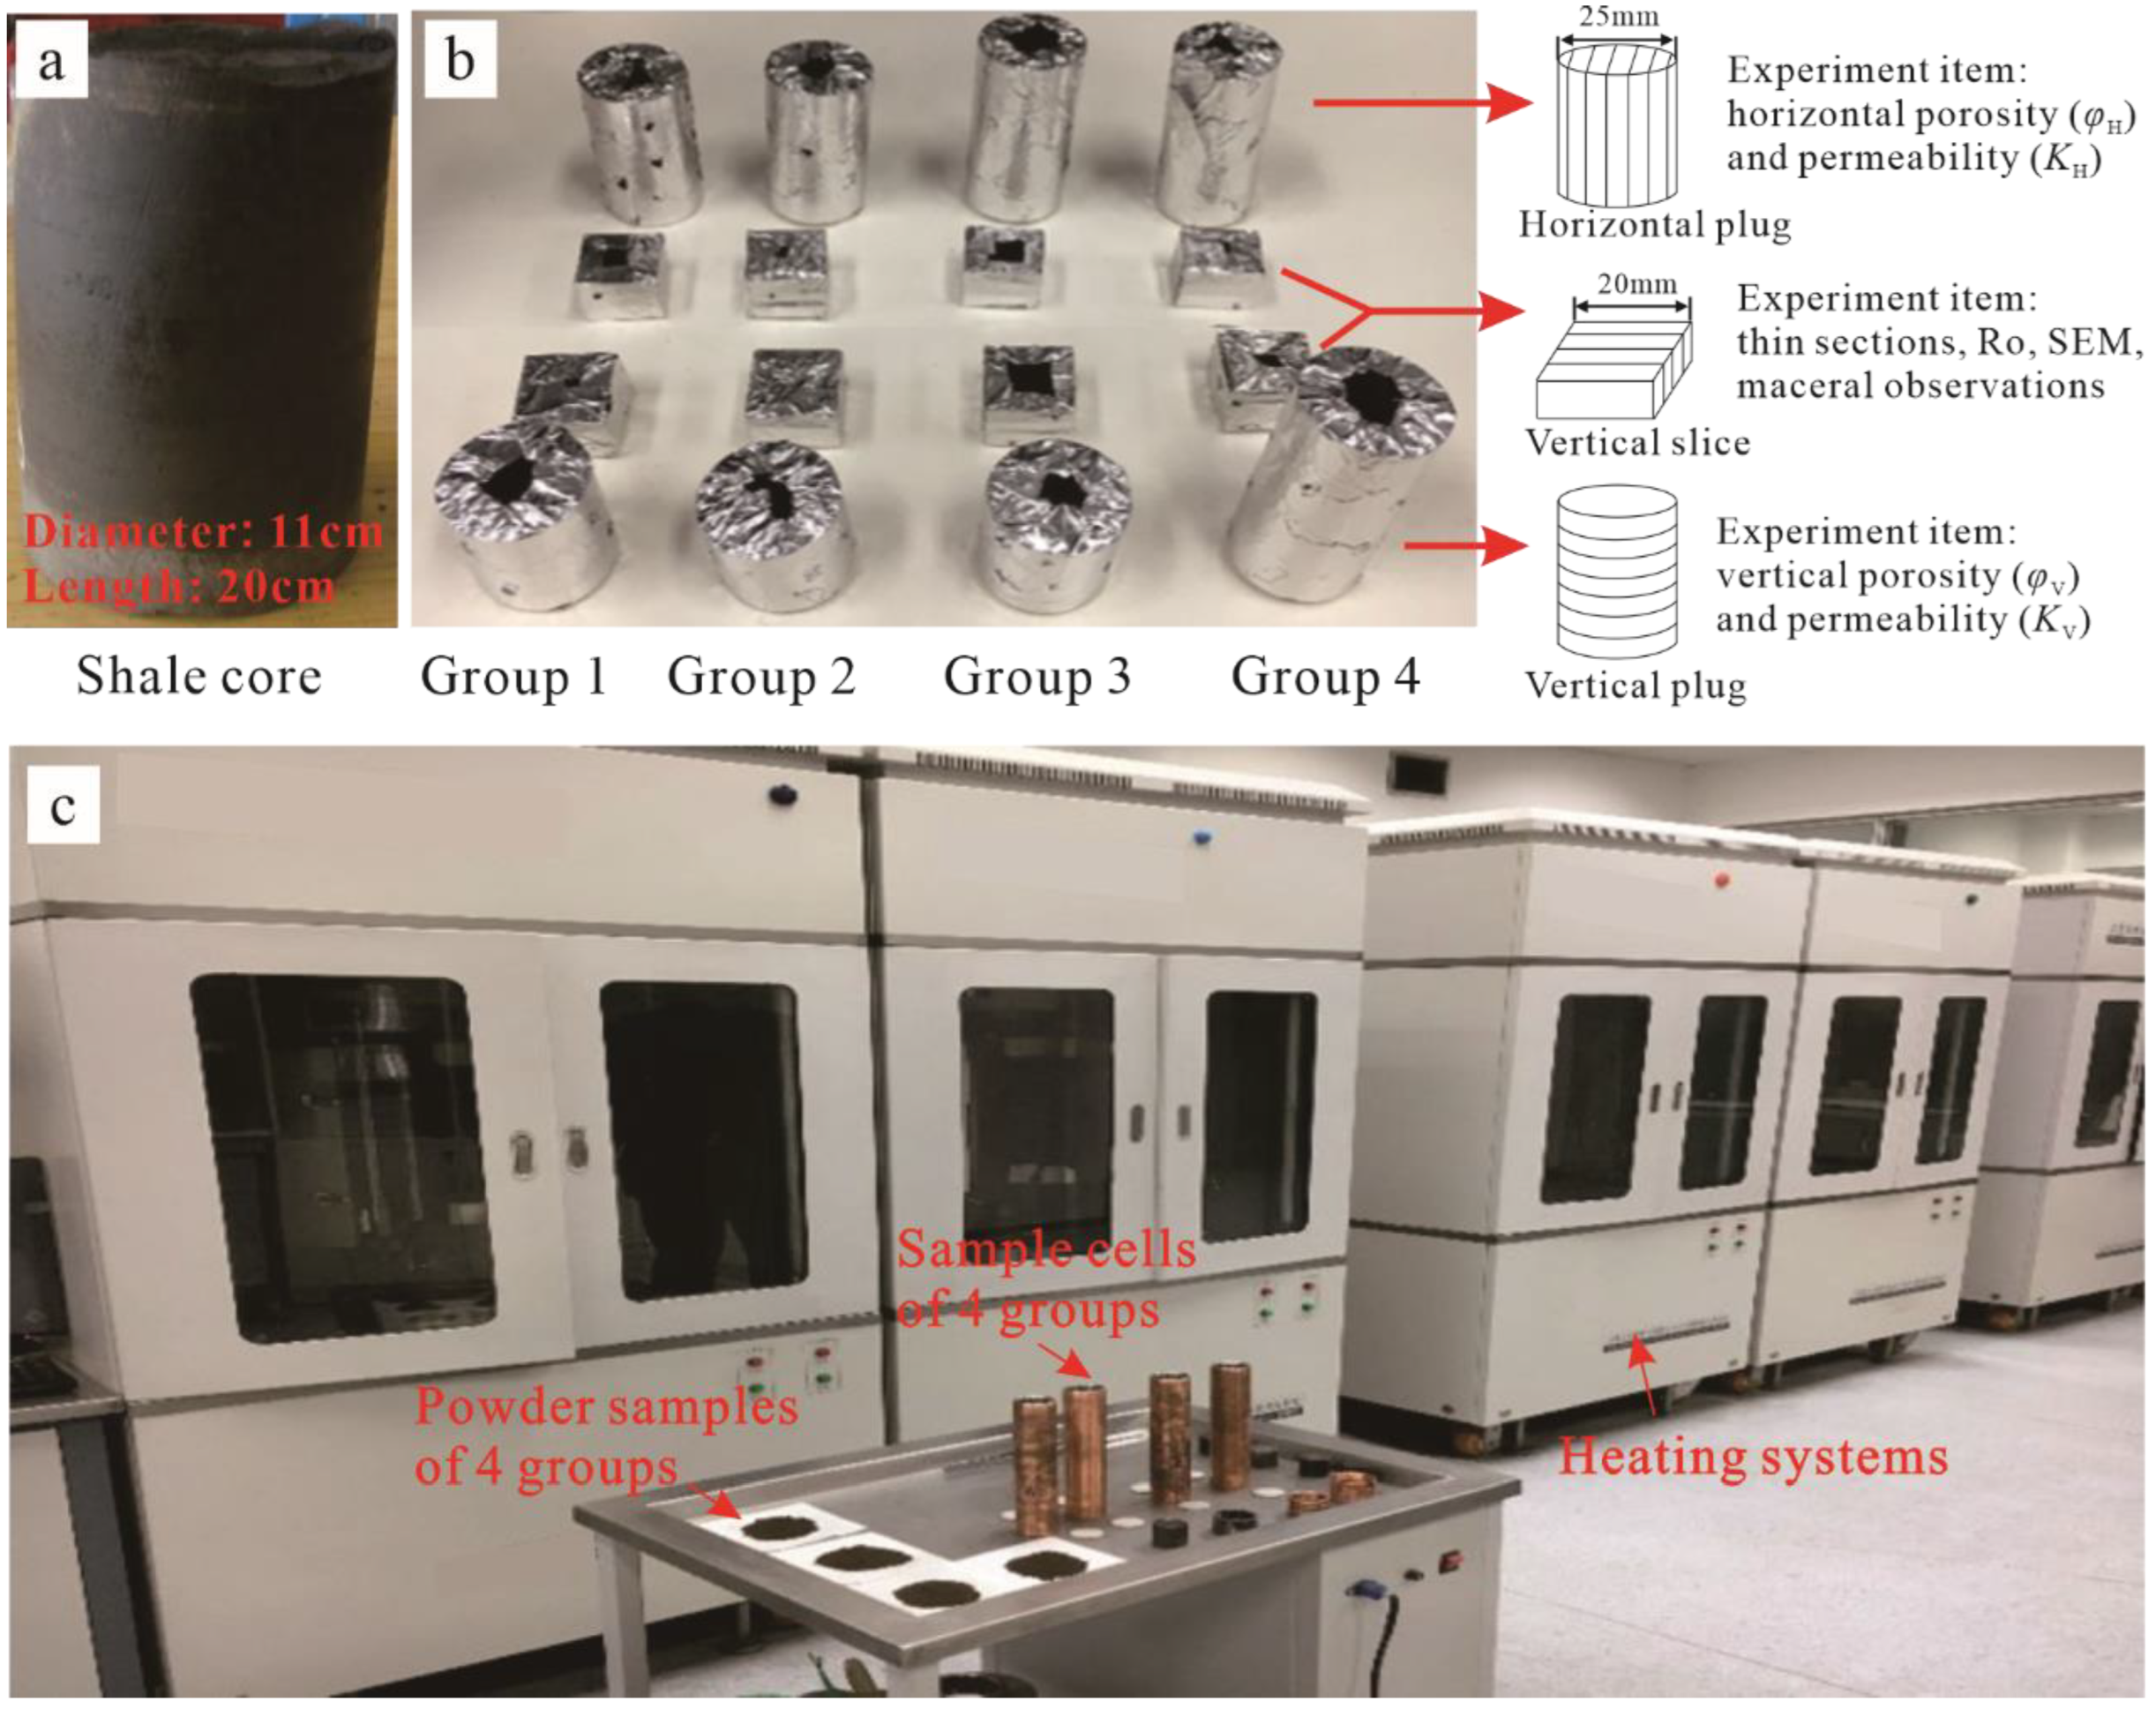
The sample was a full-diameter core with a diameter of 11 cm and a length of 20 cm (Figure 2a). To study changes in the shale composition, pore structure, porosity, and permeability during in situ heating, the core was cut into four groups, which were heated simultaneously (Figure 2b). Each group included one vertical and one horizontal plug (diameter: 25 mm, length: 30–50 mm), six vertical rock slices (area: 20 mm × 20 mm, thickness: 10 mm), and a 200-mesh powder subsample (weight: 300 g). A layer of tin foil was wrapped on the surface of each plug and slice to prevent damage during heating (Figure 2b). Holes in the tin foil allowed the fluid generated during heating to be discharged.
The ICP simulation experiments were conducted using a high-temperature and high-pressure simulation system designed by CNPC. The system is a semi-closed system with precise temperature and pressure control and can be heated slowly to meet the requirements of the ICP experimental simulation. The maximum heating temperature of the system is 500 °C; the maximum confining pressure is 270 MPa; the maximum flow pressure is 100 MPa. The system has six heating reactors, allowing six samples to be heated simultaneously (Figure 2c).
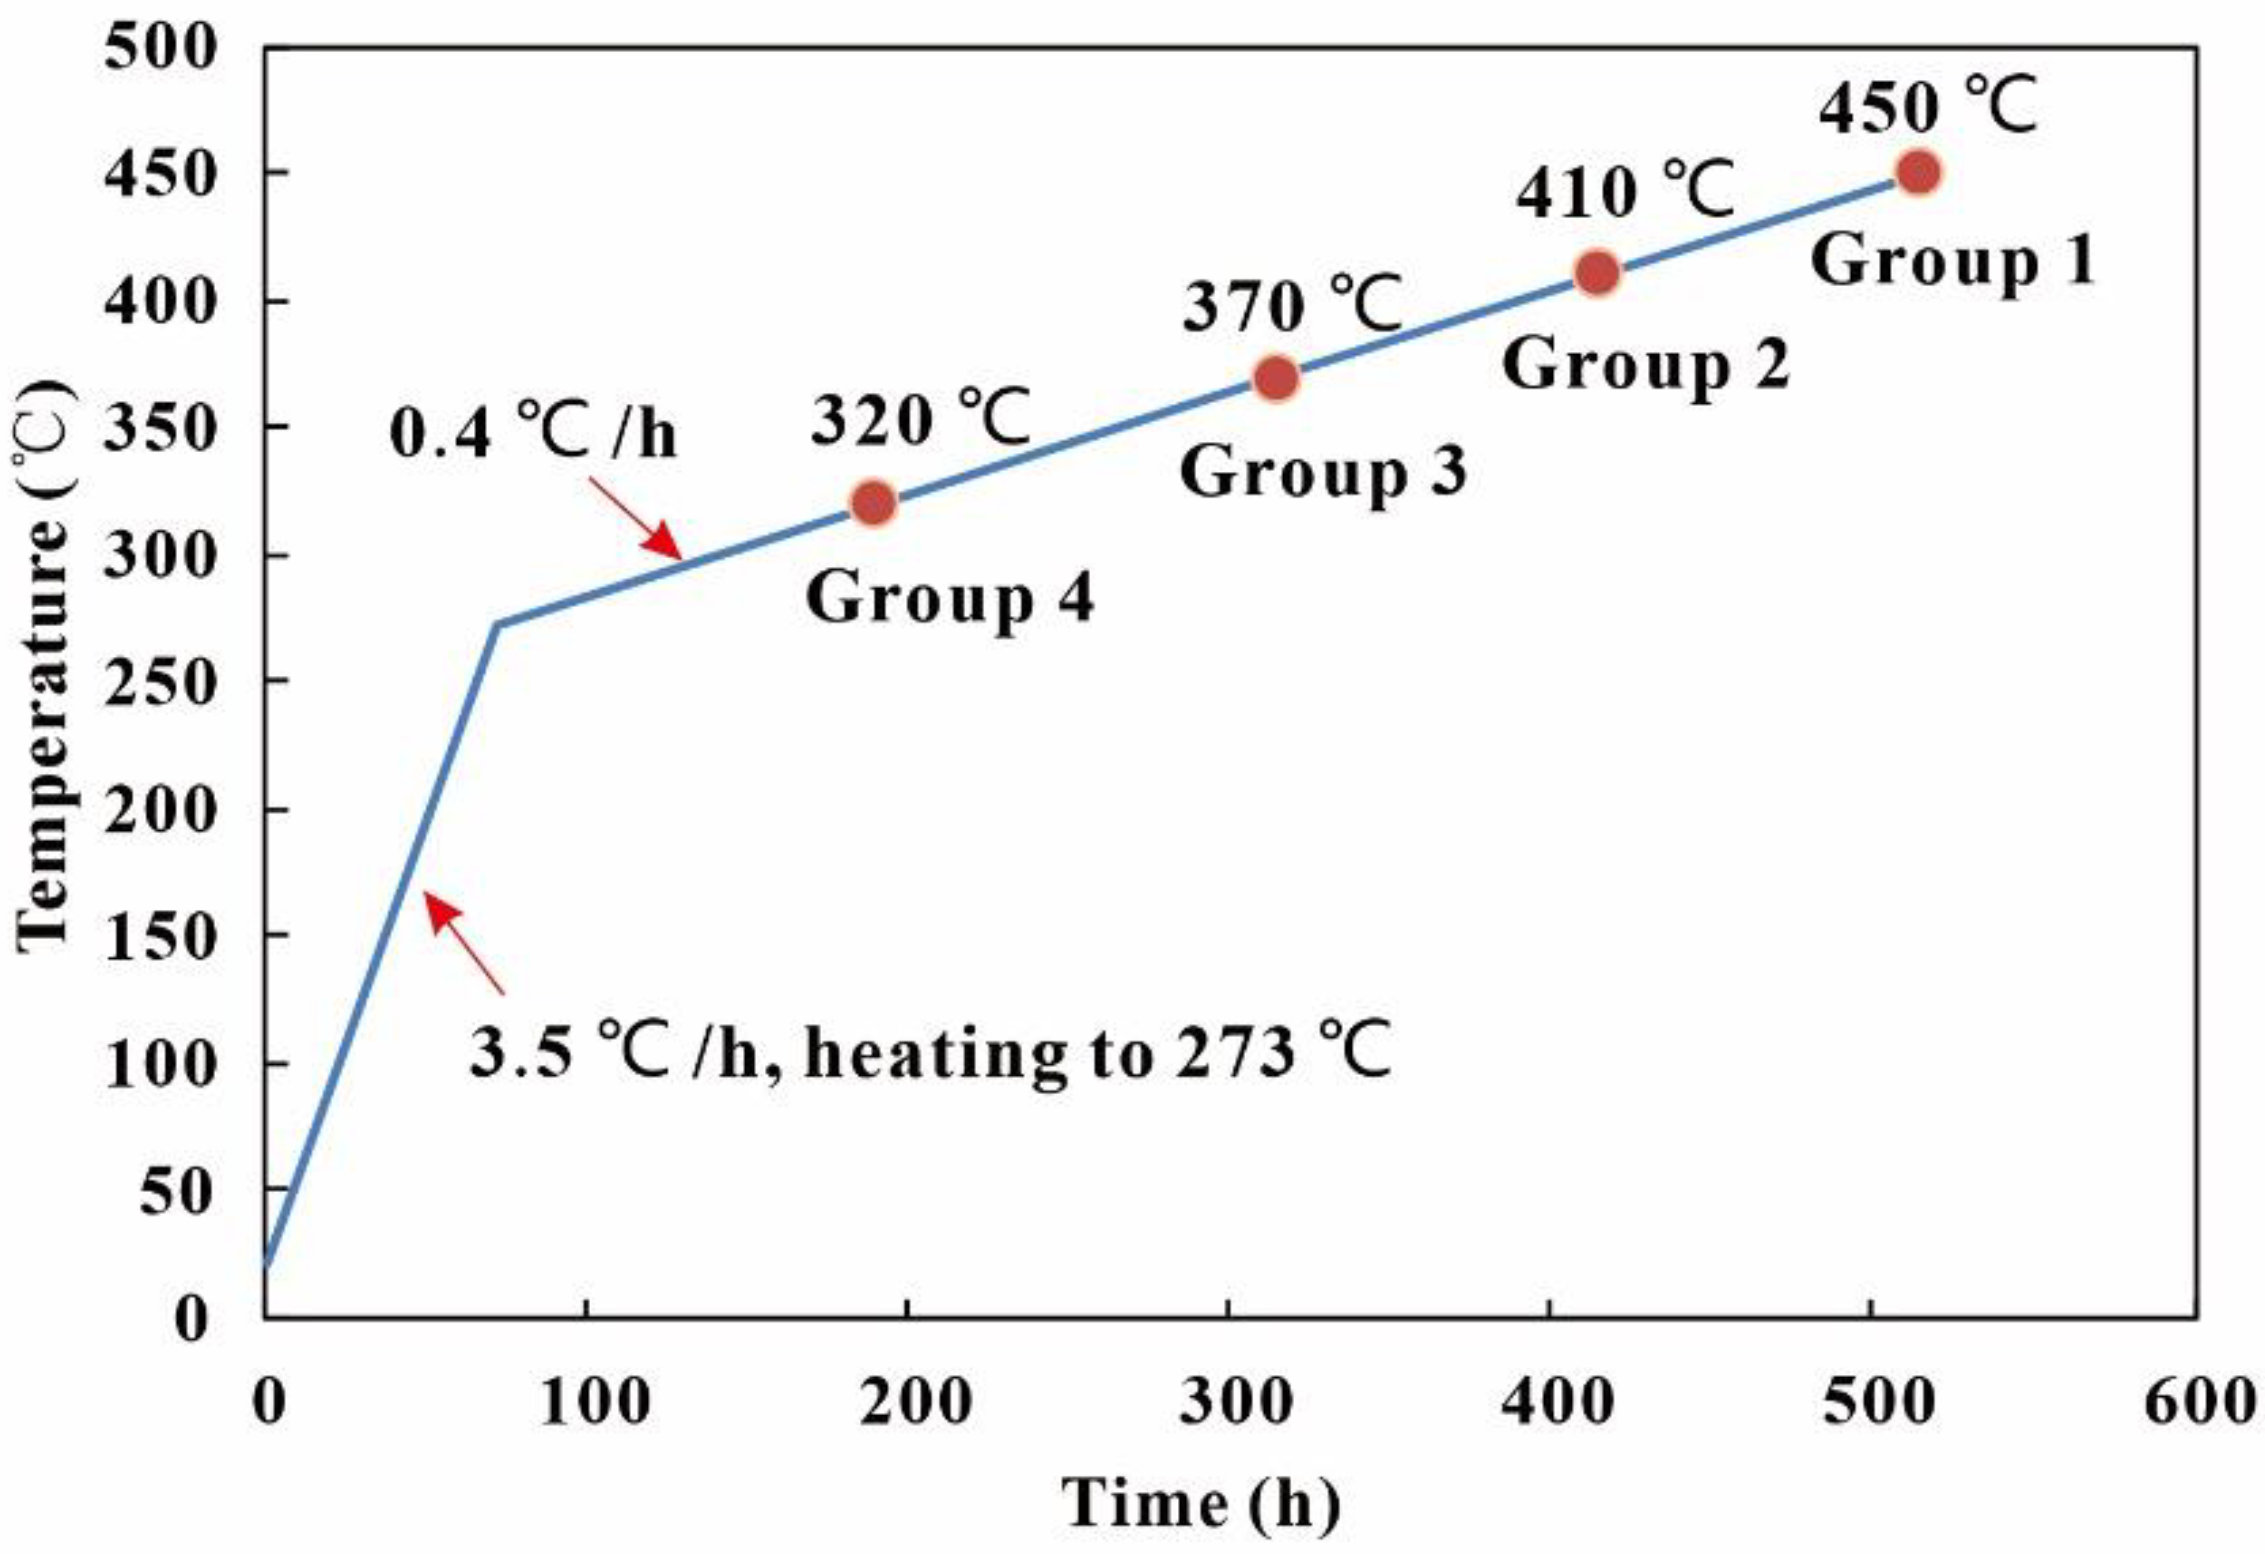
For the coring depth of the shale sample (1247 m) and with reference to logging data from the oilfield, the reservoir pressure of the Chang 7 shale is approximately 10 MPa, and the overburden pressure is approximately 30 MPa. These estimates of reservoir pressure and overburden pressure were used as the pore pressure and confining pressure of the ICP simulation experiments. The target temperatures for heating the four groups of shale subsamples were set according to the hydrocarbon-generation stage of kerogen during the ICP, as follows. Ma et al. [5] performed thermal simulation of the Chang 7 shale using a sample from a mining pit in the Hejiafang area of Tongchuan City, located 50 km east of the sampling location in this study, and found that the hydrocarbon-generation and -expulsion process can be divided into four stages: (1) slow hydrocarbon generation (300–320 °C); (2) rapid oil generation (320–380 °C); (3) secondary oil cracking and quick gas generation (380–420 °C); and (4) heavy hydrocarbon gas cracking (>420 °C). On the basis of these previous results, the target temperatures for heating the four groups of shale subsamples in the present study were set at 320, 370, 410, and 450 °C (Figure 3). To simulate the ICP conditions, the following heating scheme was applied (Figure 3): (1) the four groups of subsamples were heated from room temperature to 273 °C at a rate of 3.5 °C/h; (2) the four groups of subsamples were heated to 320 °C, 370 °C, 410 °C, and 450 °C, respectively, at a rate of 0.4 °C/h; and (3) having reached the target temperature, heating was stopped immediately, followed by cooling to room temperature for further analysis.

2.3. Analytical Techniques

Measurements of thin sections, XRD, Rock-Eval, maceral observations, Ro, scanning electron microscopy (SEM), porosity, and permeability were conducted on the before-heating subsamples and the four groups of subsamples after heating to 320, 370, 410, and 450 °C, respectively, at the National Energy Tight Oil and Gas R & D Center, Beijing, China.
Thin sections were studied using a petrographic microscope. XRD analysis was conducted on powered subsamples using a Rigaku X-ray diffractometer according to Standard No. SY/T 5163-2010 “X-ray Diffraction Analysis Method of Clay Minerals and Common Non-clay Minerals in Sedimentary Rocks”. Rock-Eval analysis was performed following the standard procedures described by Espitalie et al. [41]. A Rock-Eval-6 standard analyzer was used to determine TOC contents, the contents of free hydrocarbons (S1) and pyrolysis hydrocarbons (S2), and the hydrogen index (HI). Maceral observations were performed under plane-polarized reflected white light and incident blue light. Vitrinite reflectance (Ro) was measured following the standard procedure described by Taylor et al. [42]. More than 20 effective point-count measurements were performed on each subsample to produce robust frequency distributions of the values.
SEM was performed using an FEI Helios Nanolab 600i high-resolution field-emission SEM instrument. Before the experiments, a Leica EM TXP precision grinding machine was used to cut the sample and prepare a thin sheet with a side length of 5–7 mm and a height of <2 mm. A Leica RES 102 argon ion polisher was then used to polish the surface with an argon ion beam for 4 h to ensure the flatness of the polished surface of the sample. An EMITECH K950X coating apparatus was used to apply a coat of carbon to the polished samples to increase the conductivity of the sample surface. The sample was then placed in the SEM vacuum chamber, and analyses were conducted using high-vacuum mode during the experiments. Back-scattered SEM (BSEM) was used to distinguish differences between inorganic and organic components in the samples. During the analyses, the evolution of characteristics of the minerals, pores, and fractures associated with increasing temperature was observed from 1000 to 10,000 magnification.
An unsteady-state gas pressure decay probe permeability meter was used to measure the permeability of the vertical and horizontal plugs. The confining pressure was equal to the overburden pressure of 30 MPa. The permeability of each plug was measured three times, with the mean value being taken as the permeability of the plug. Porosity measurements of the plugs were conducted after permeability measurements using the Archimedes principle, with the pore volume being determined by the difference between the dry weight and the toluene-saturated weight. Measurements of porosity and permeability were conducted according to Standard No. SY/T 6385-2016 “Porosity and Permeability Measurement under Overburden Pressure”. All plugs were measured for permeability and porosity both before and after heating to allow the detection of the differences caused by heating.

3. Results and Discussion

3.1. Changes in Shale Composition before and during Heating

3.1.1. Changes in Mineral Composition

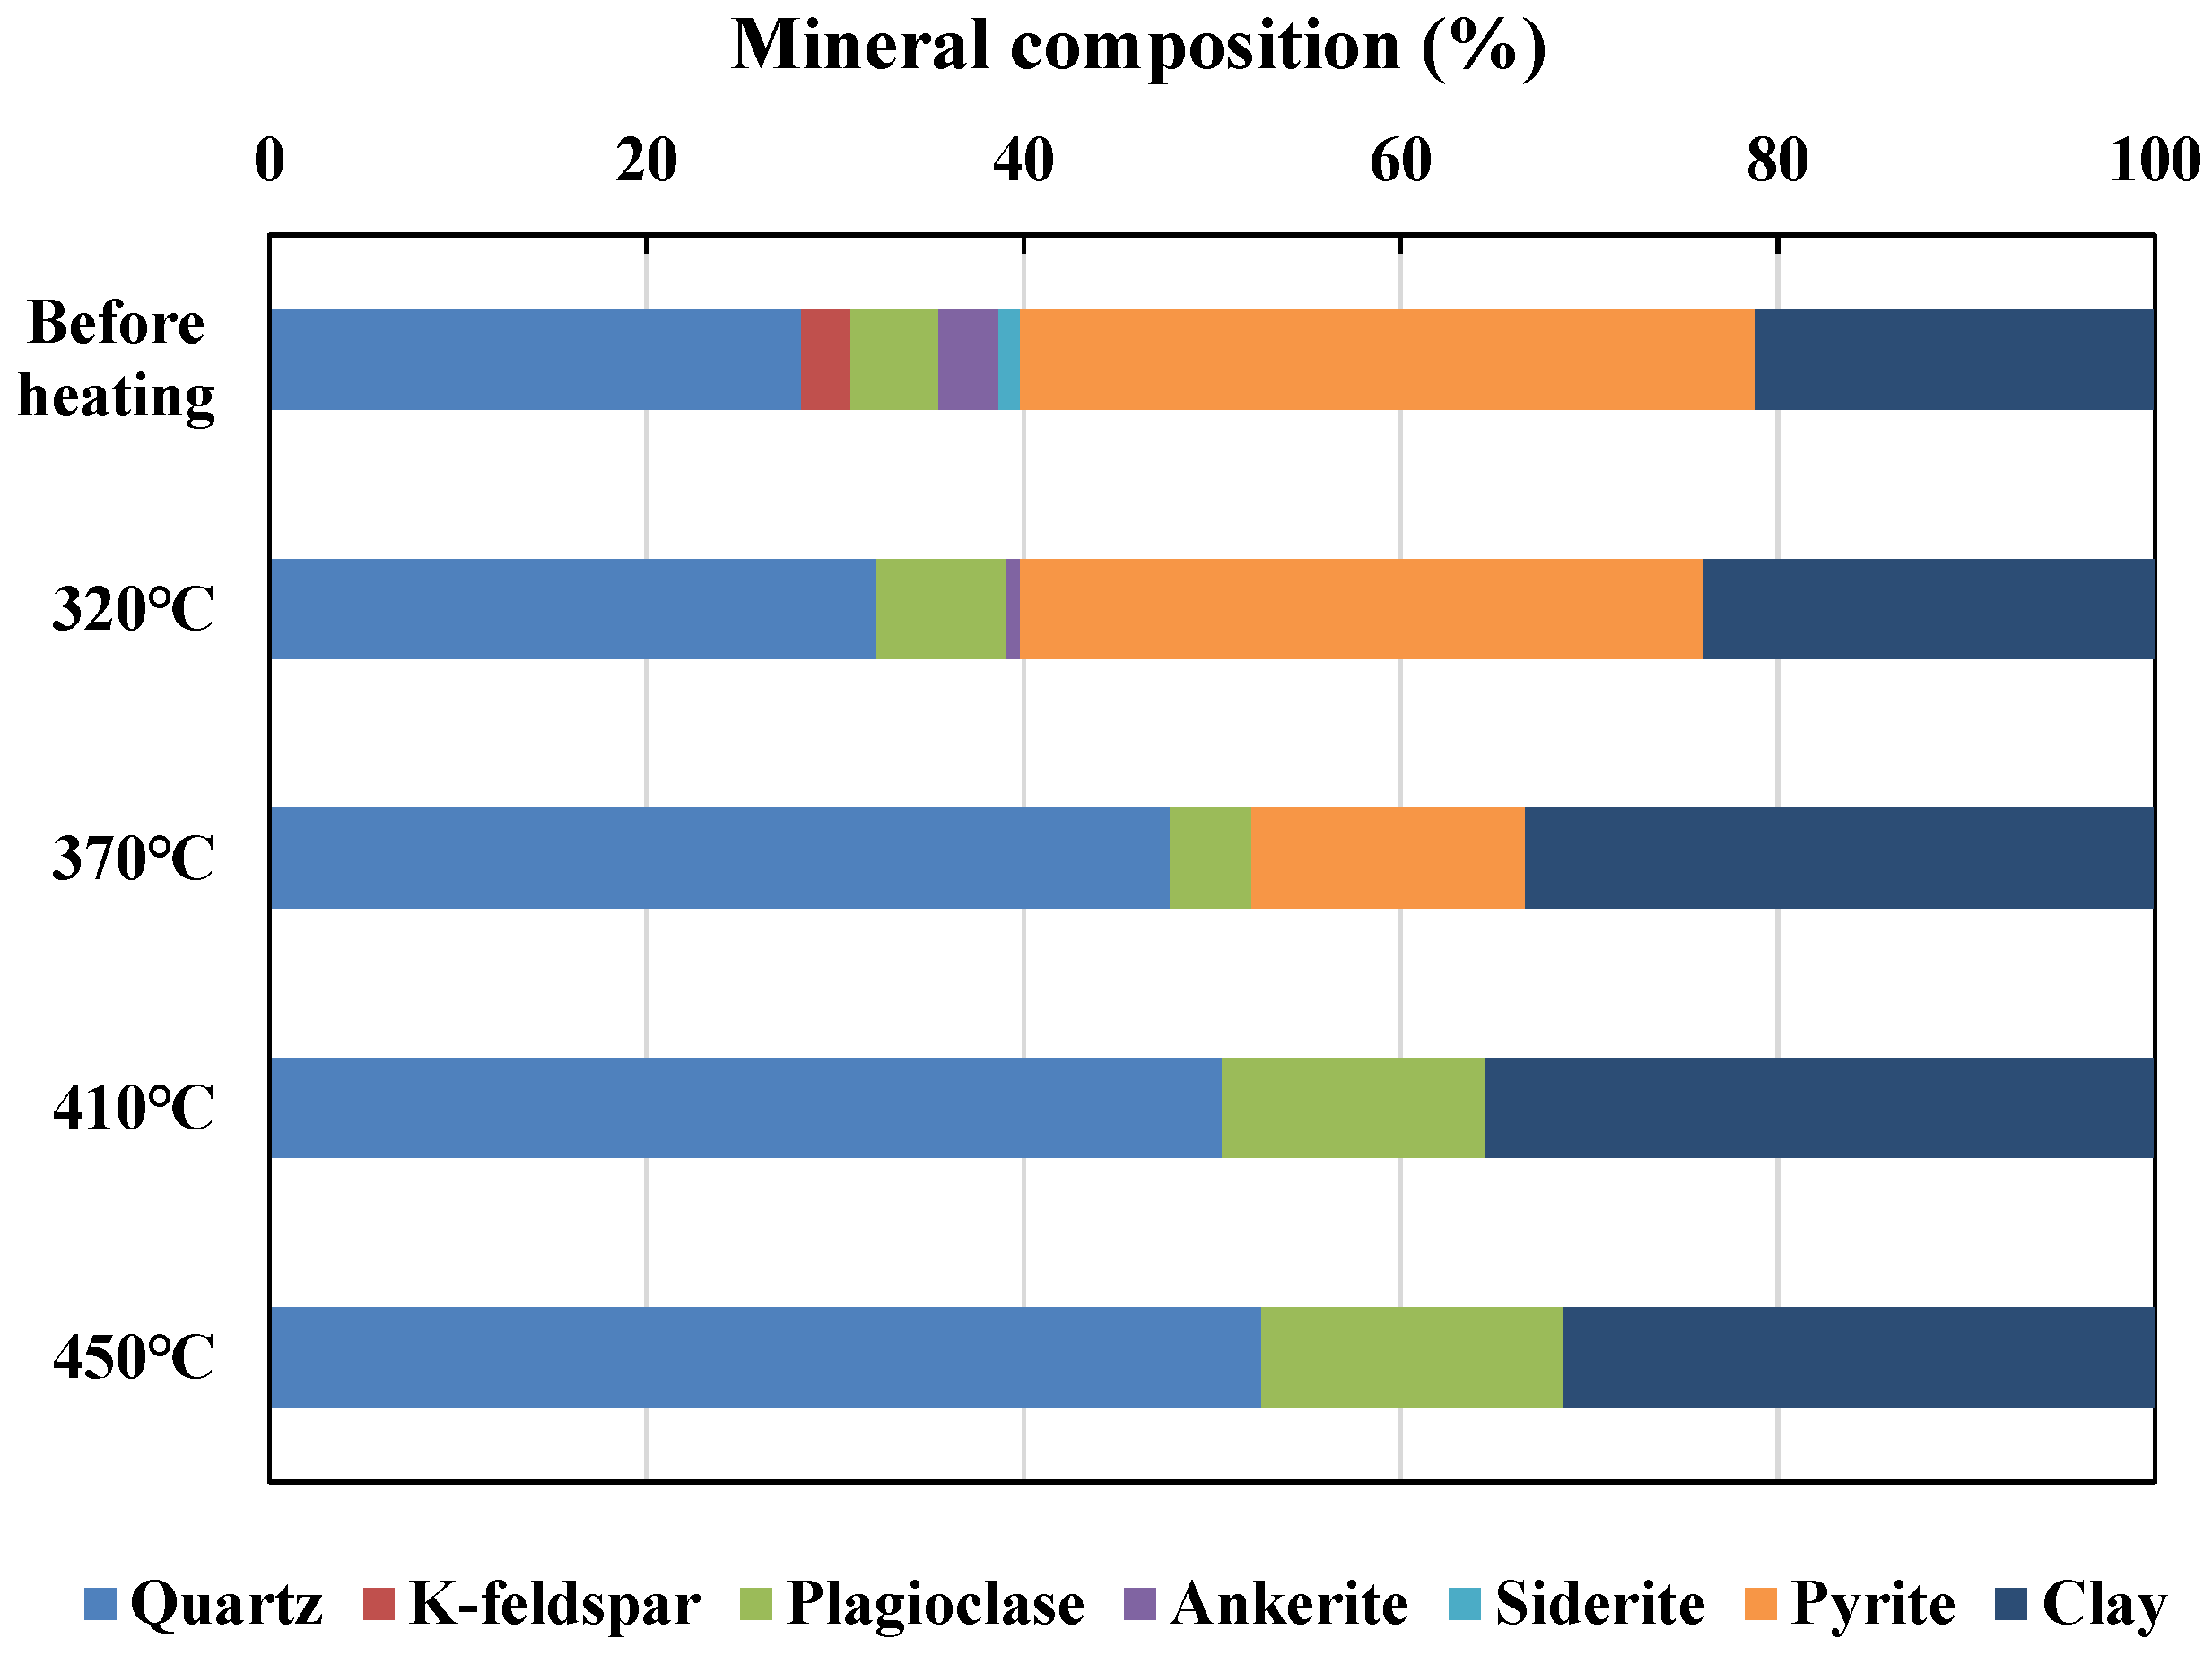
Before heating, the mineral composition was mainly pyrite (39.0%), quartz (28.2%), and clay (21.1%), with small amounts of plagioclase, K-feldspar, ankerite, and siderite accounting for 11.6% in total (Figure 4). Previous studies have shown that the high pyrite content of the Chang 7 shale from the Ordos Basin has promoted the generation, discharge, and accumulation of the medium–high-maturity shale oil [43,44].
After heating to 320 °C, K-feldspar, ankerite, and siderite were almost completely decomposed, clay minerals were dehydrated, and there was little change in the contents of quartz and plagioclase. During in situ heating, pyrite showed the greatest change in content and became completely decomposed after further heating to 410 °C (Figure 4). Hydrocarbons able to supply hydrogen can promote the thermal decomposition of pyrite, and the temperature required for decomposition will decrease [45].
After further heating to 450 °C, there was no further substantial change in mineral composition, and the shale at this temperature was composed of quartz (50.5%), clay (35.5%), and plagioclase (14%) (Figure 4).

3.1.2. Changes in Geochemical Characteristics

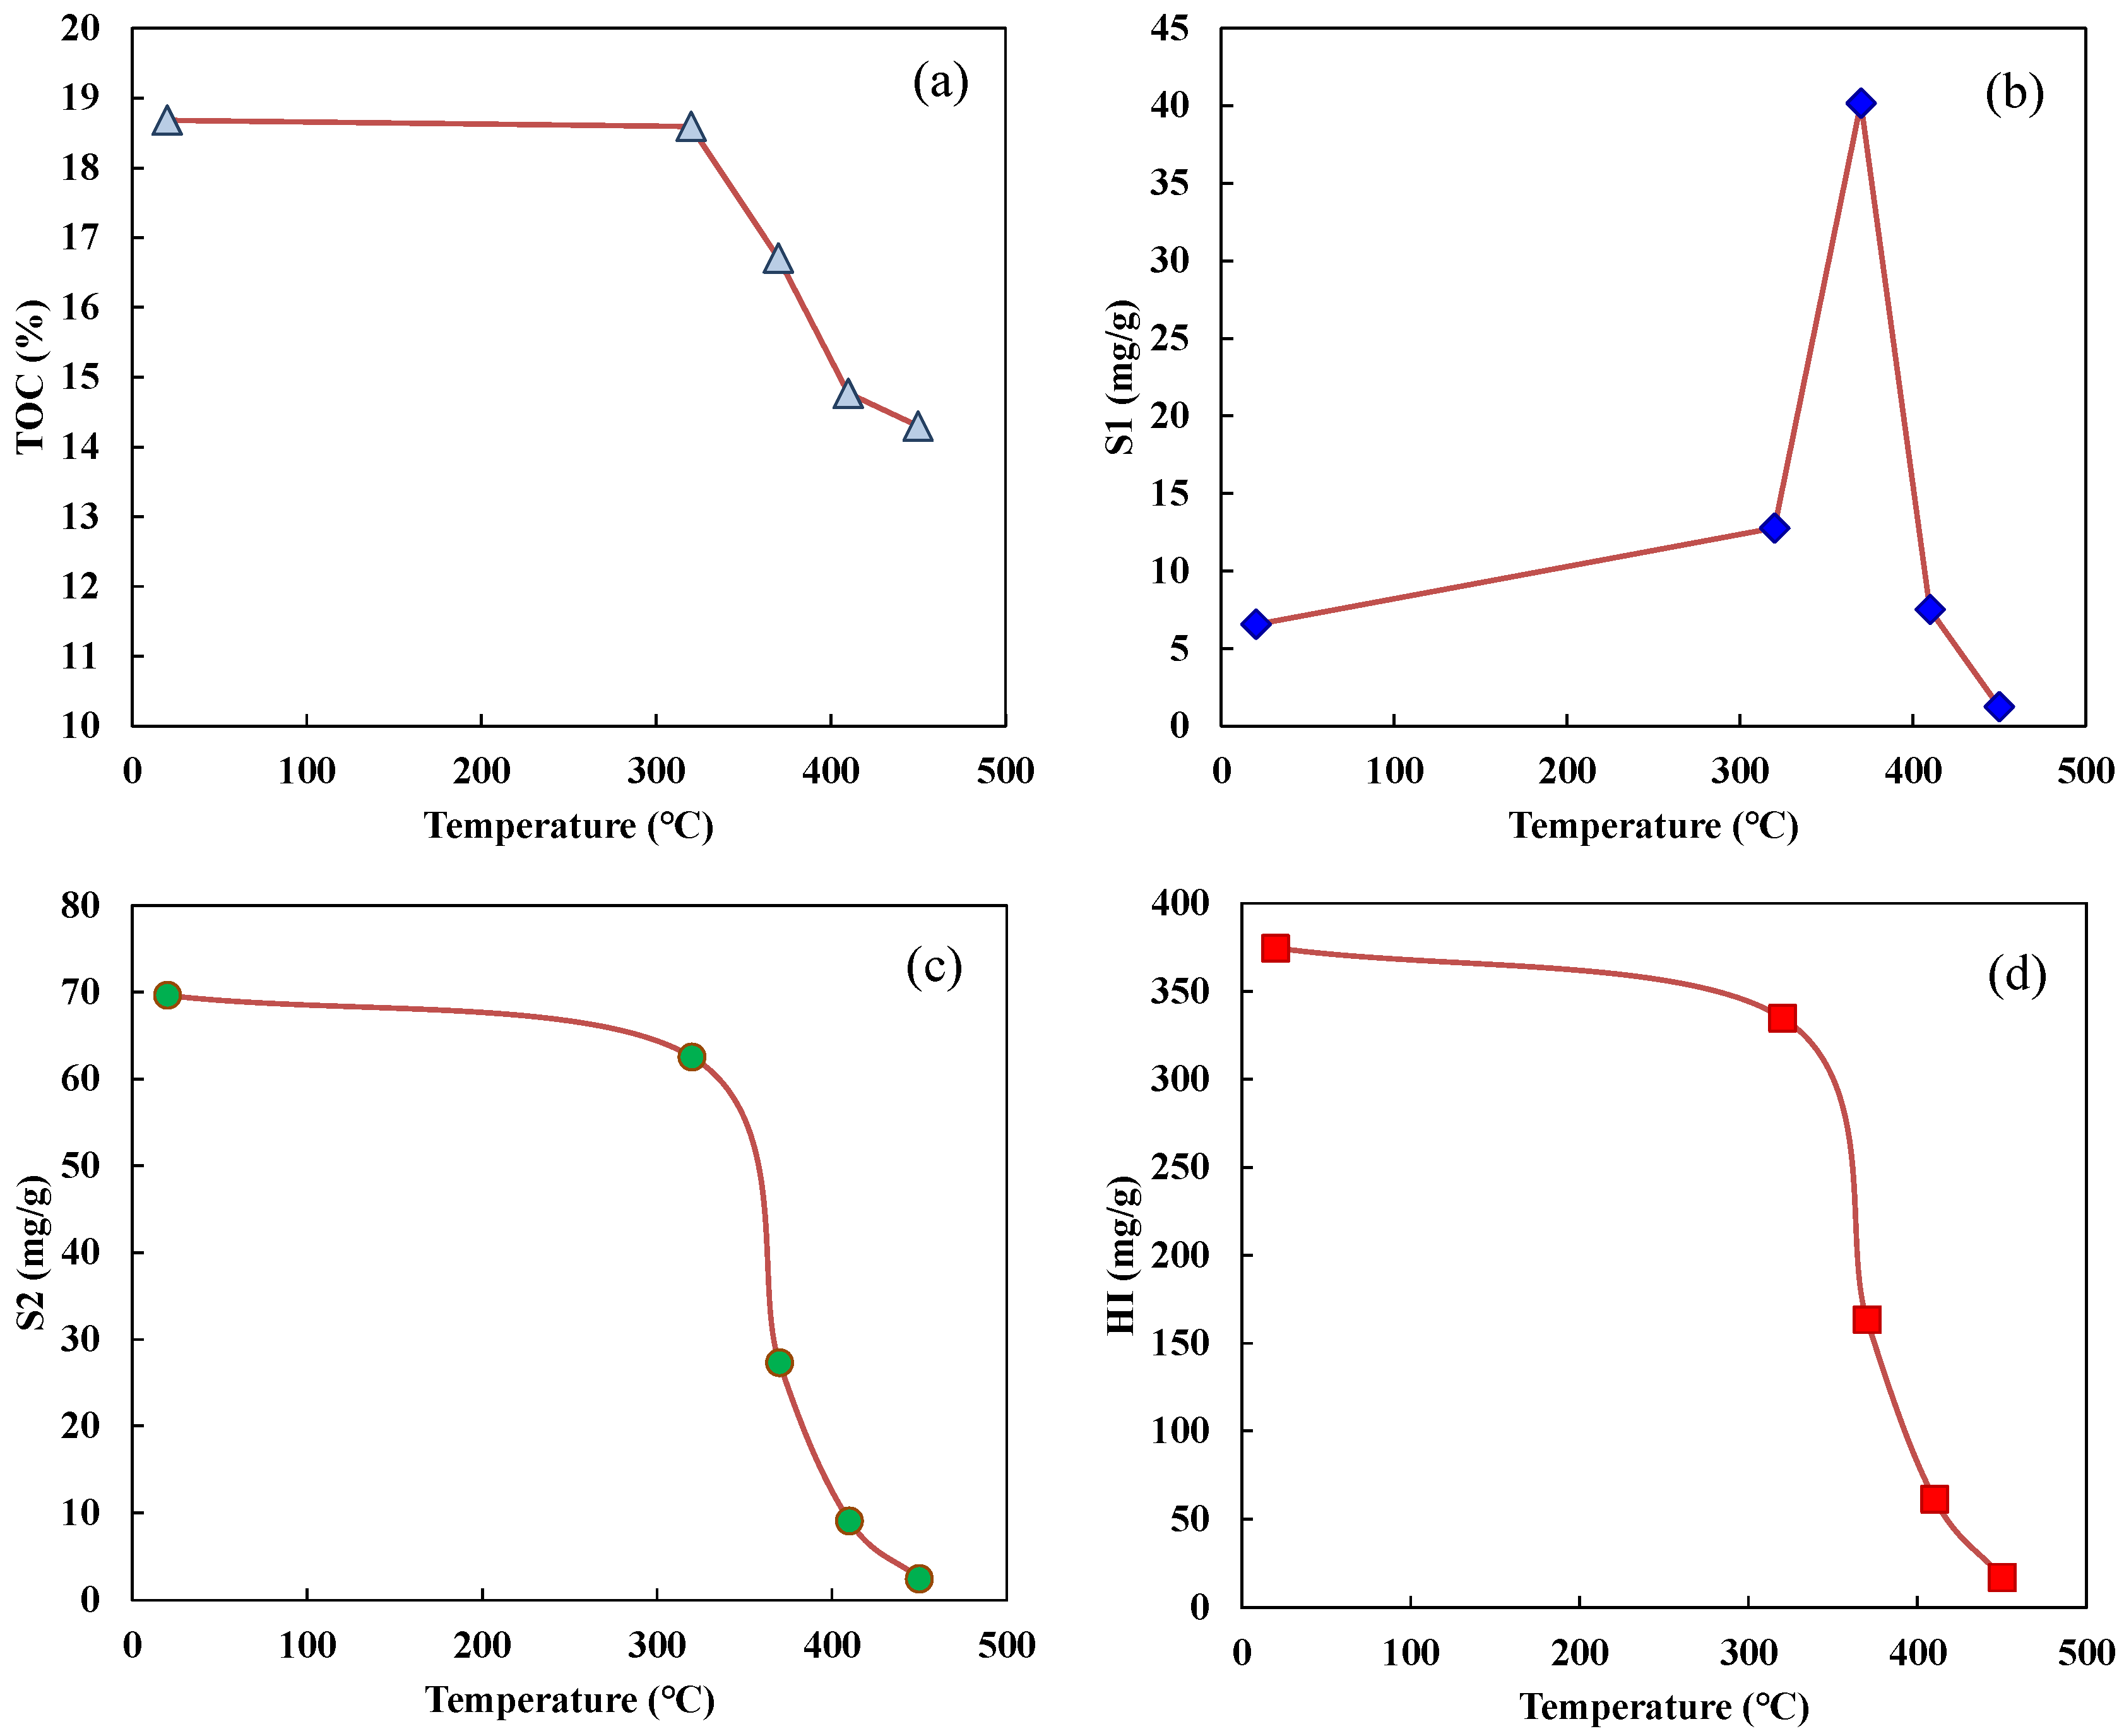
The results of the Rock-Eval analysis for Chang 7 shale before and after heating are shown in Figure 5, which reveal that the studied Chang 7 shale before heating occupied the Types I to II oil-generation area, showing high oil-generation potential. Up to a temperature of 320 °C, TOC, S2, HI, and S1 showed no marked changes with increasing temperature (Figure 5). At 320 °C, kerogen was just beginning to crack into asphalt and had high viscosity because of its high asphaltene and non-hydrocarbon contents, meaning that it remained in the matrix. Therefore, the geochemical characteristics did not change substantially up to 320 °C, confirming the results of previous research on the Lower Jurassic Posidonia shale of the Hils Syncline in northern Germany [46].
As the temperature rose to 370 °C, the peak of the oil-generation window was reached, characterized by asphalt continuing to be cracked into liquid hydrocarbons with high saturated hydrocarbon and aromatic hydrocarbon contents, and S1 reached its maximum value (Figure 5). Previous studies have demonstrated that, for organic-rich shales with high clay content, liquid hydrocarbons are stored mostly in pores, kerogen, and clay surfaces in an adsorbed state and are difficult to discharge, and compaction in thermal simulation experiments on source rock appeared to slow the conversion rate of asphalt to oil, resulting in a high content of residual oil at a temperature of 370 °C [47,48].
After further heating to 400–450 °C, the changes in the geochemical properties of the Chang 7 shale were typical of those signifying the end of the oil-generation window and the transition to the wet-gas-generation stage. In this temperature range, the contents of all liquid hydrocarbon components decreased, liquid hydrocarbons were cracked to gas, and the wet-gas-generation stage was initiated (Figure 5).

3.1.3. Changes in Maceral Composition

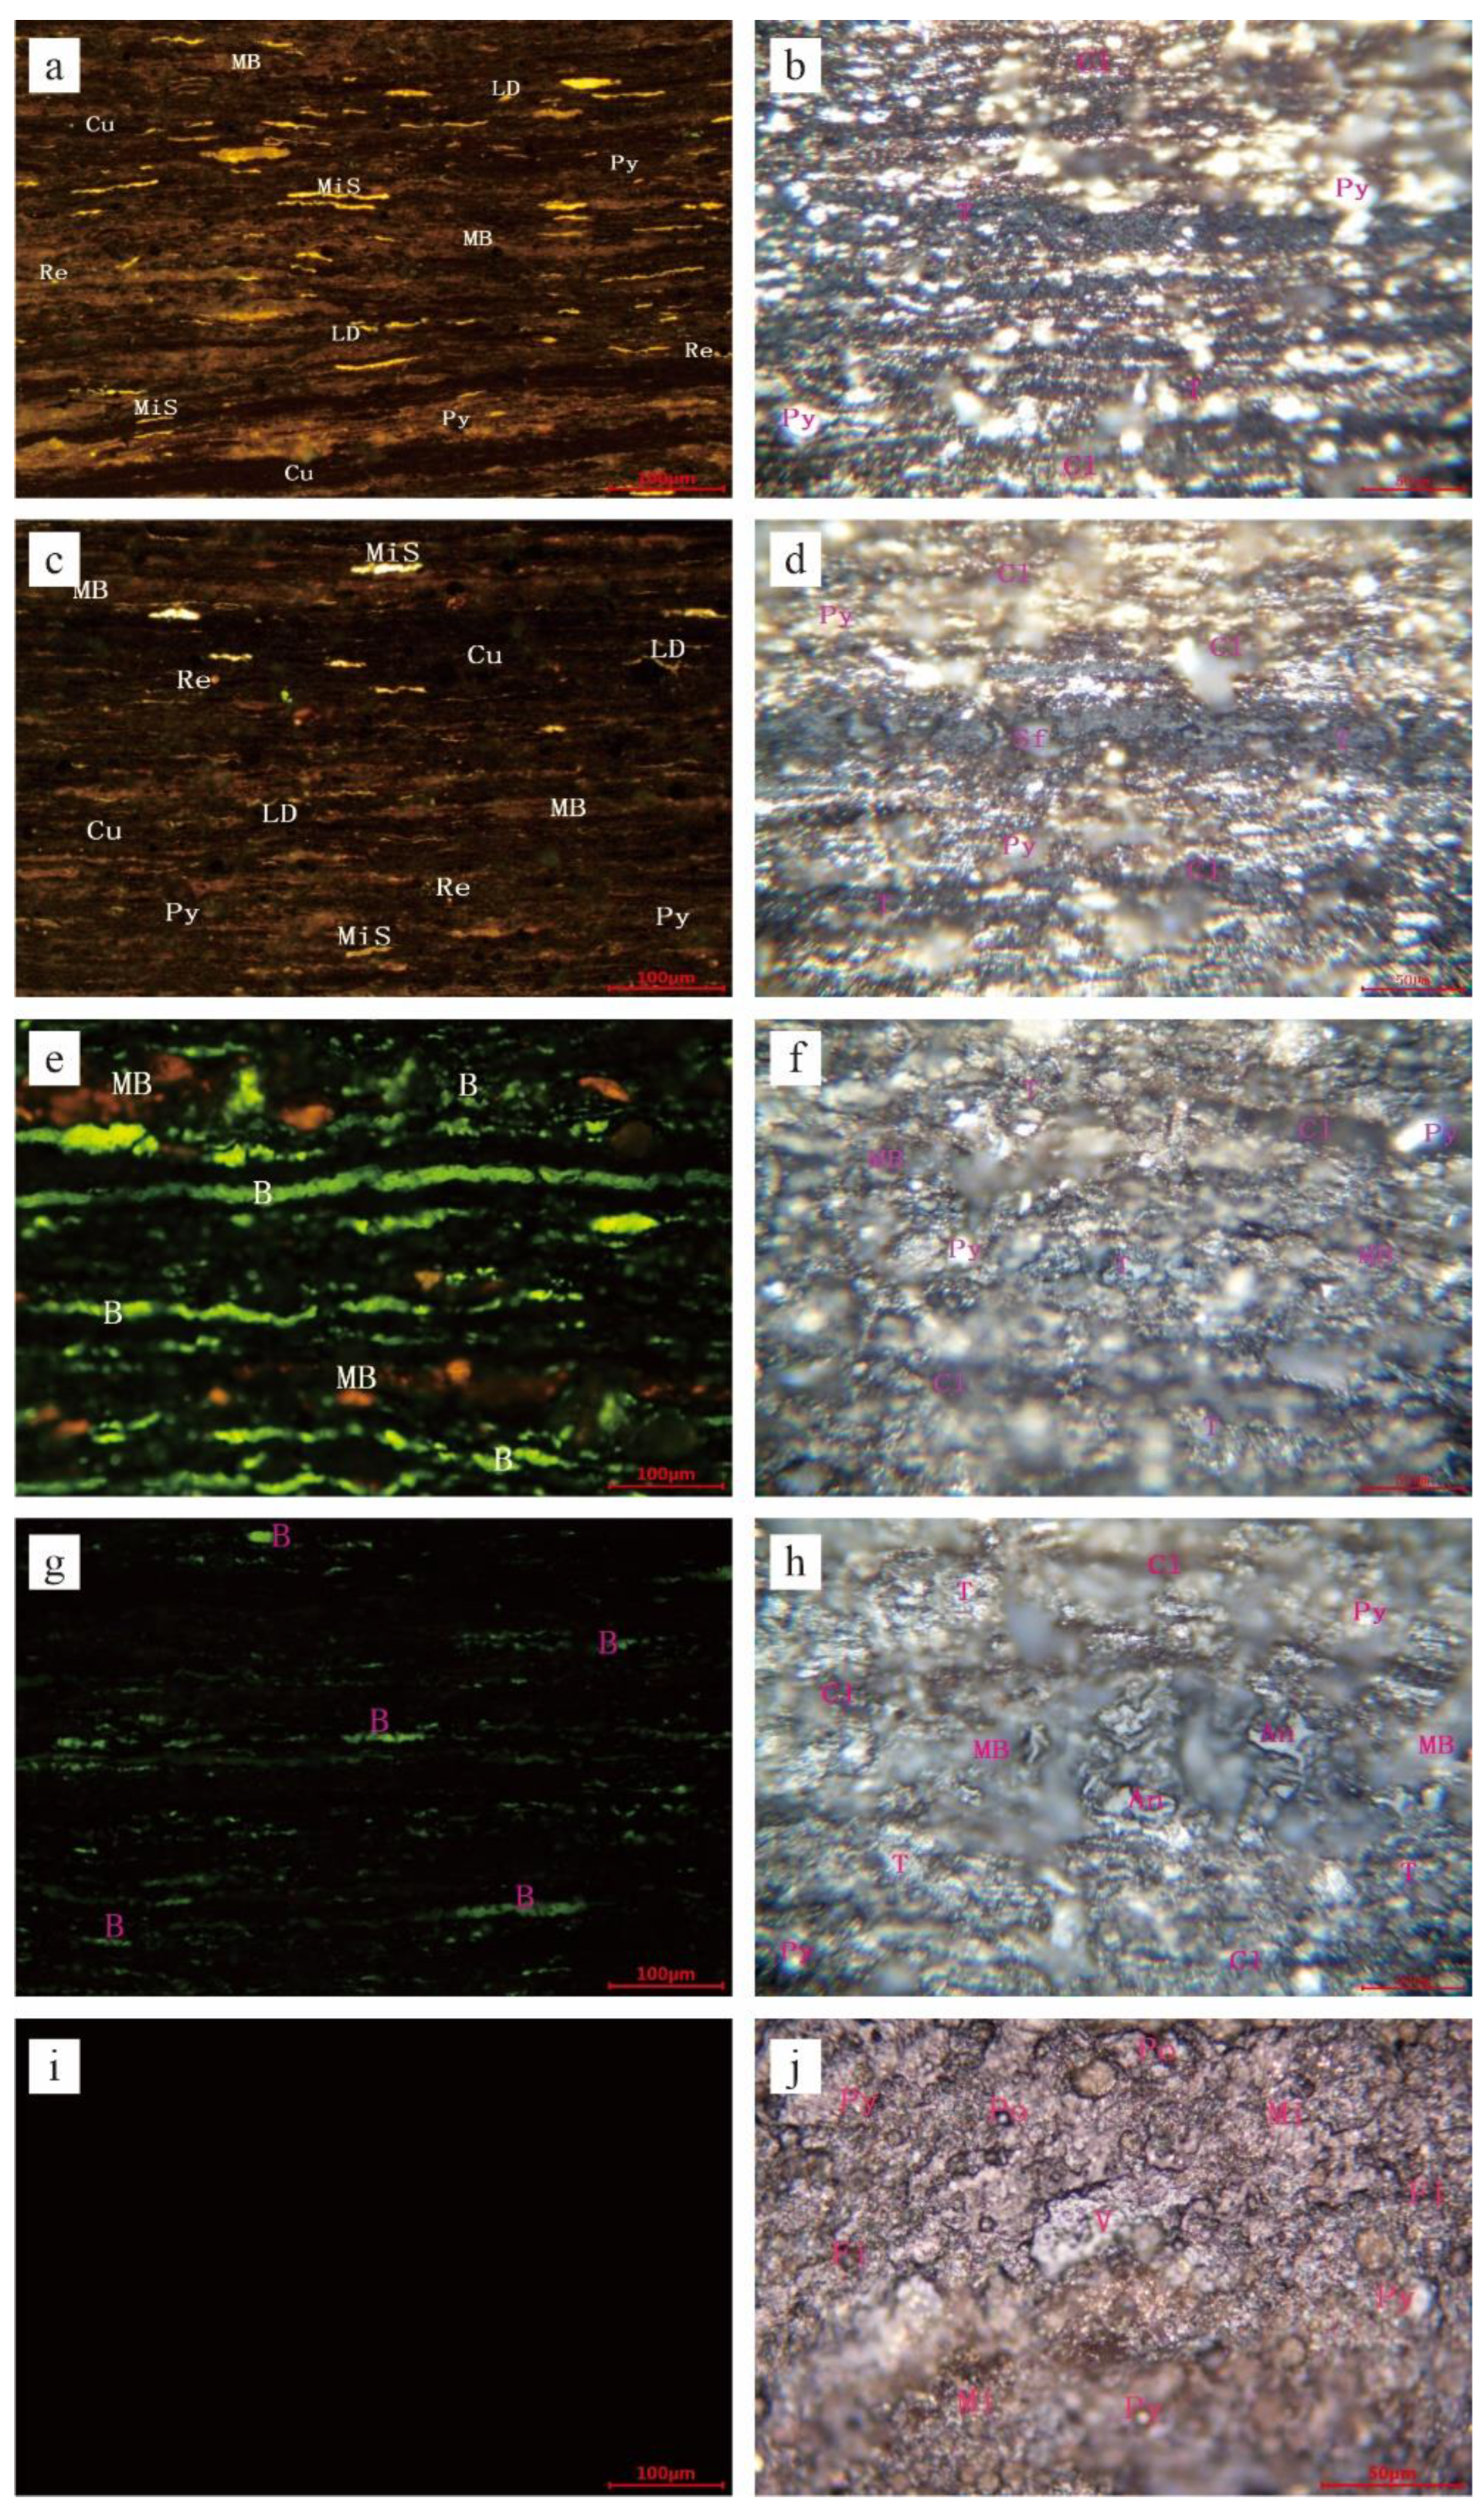
The maceral composition and microscopic characteristics of OM before and after heating are shown in Figure 6 and Figure 7. The measured values of the Ro of OM before and after heating are presented in Table 1. Before heating, the macerals of OM were mainly sapropelite (56.2%) and vitrinite (35.5%), with lesser contents of other components. The shale displayed strong fluorescence and showed immaturity to low maturity, with a Ro of 0.42–0.49%.
After heating to 320 °C, the content of sapropelite decreased to 42.5%, and the contents of other components showed little change. The shale also showed strong fluorescence and began to crack to a small amount of oil asphalt (1.3%), with a Ro of 0.47–0.58%.
After further heating to 370 °C, the content of sapropelite decreased markedly to 15.6%, and exinite essentially disappeared. A large amount of oil asphalt was generated (40.6%), which mostly filled parallel cracks into strips, with some filling horizontal cracks into bands and some filling micropores into microparticles. The shale showed weaker fluorescence compared with that at 320 °C, and most of the original mineral bitumen strips were reduced to thin clay–mineral layers. The original mineral bitumen matrix showed brownish-red fluorescence, and the shale reached the oil-generation window, with a Ro of 1.03–1.34%.
After further heating to 410 °C, the sapropelite content continued to decrease to 1.4%, and the asphaltene content decreased to 22.6%. Most of the oil asphalt infilling the pores and fractures was cracked into gaseous hydrocarbons, but a small proportion remained in its original form. The structure of vitrinite was further broken, but the banded shapes remained the same, as was the case for the clay–mineral micro-layers. The original mineral bitumen matrix had no fluorescence, and short-veined carbon asphalt was formed in the pores near it, indicating that its hydrocarbon generation potential had been essentially lost. The shale was high maturity and reached the oil cracking window, with a Ro of 1.32–1.79%.
After further heating to 450 °C, sapropelite disappeared, and the shale displayed no fluorescence, indicating that there were neither primary nor secondary fluorescence components. At this temperature, the generated asphalt was highly mature, the sample began to be mylonized, and the debris was formed of irregularly shaped particles. Secondary fractures and micropores developed; the primary structure before heating changed substantially; the Ro increased markedly to 1.84–2.21%.

3.2. Changes in Shale Pores and Fractures during Heating

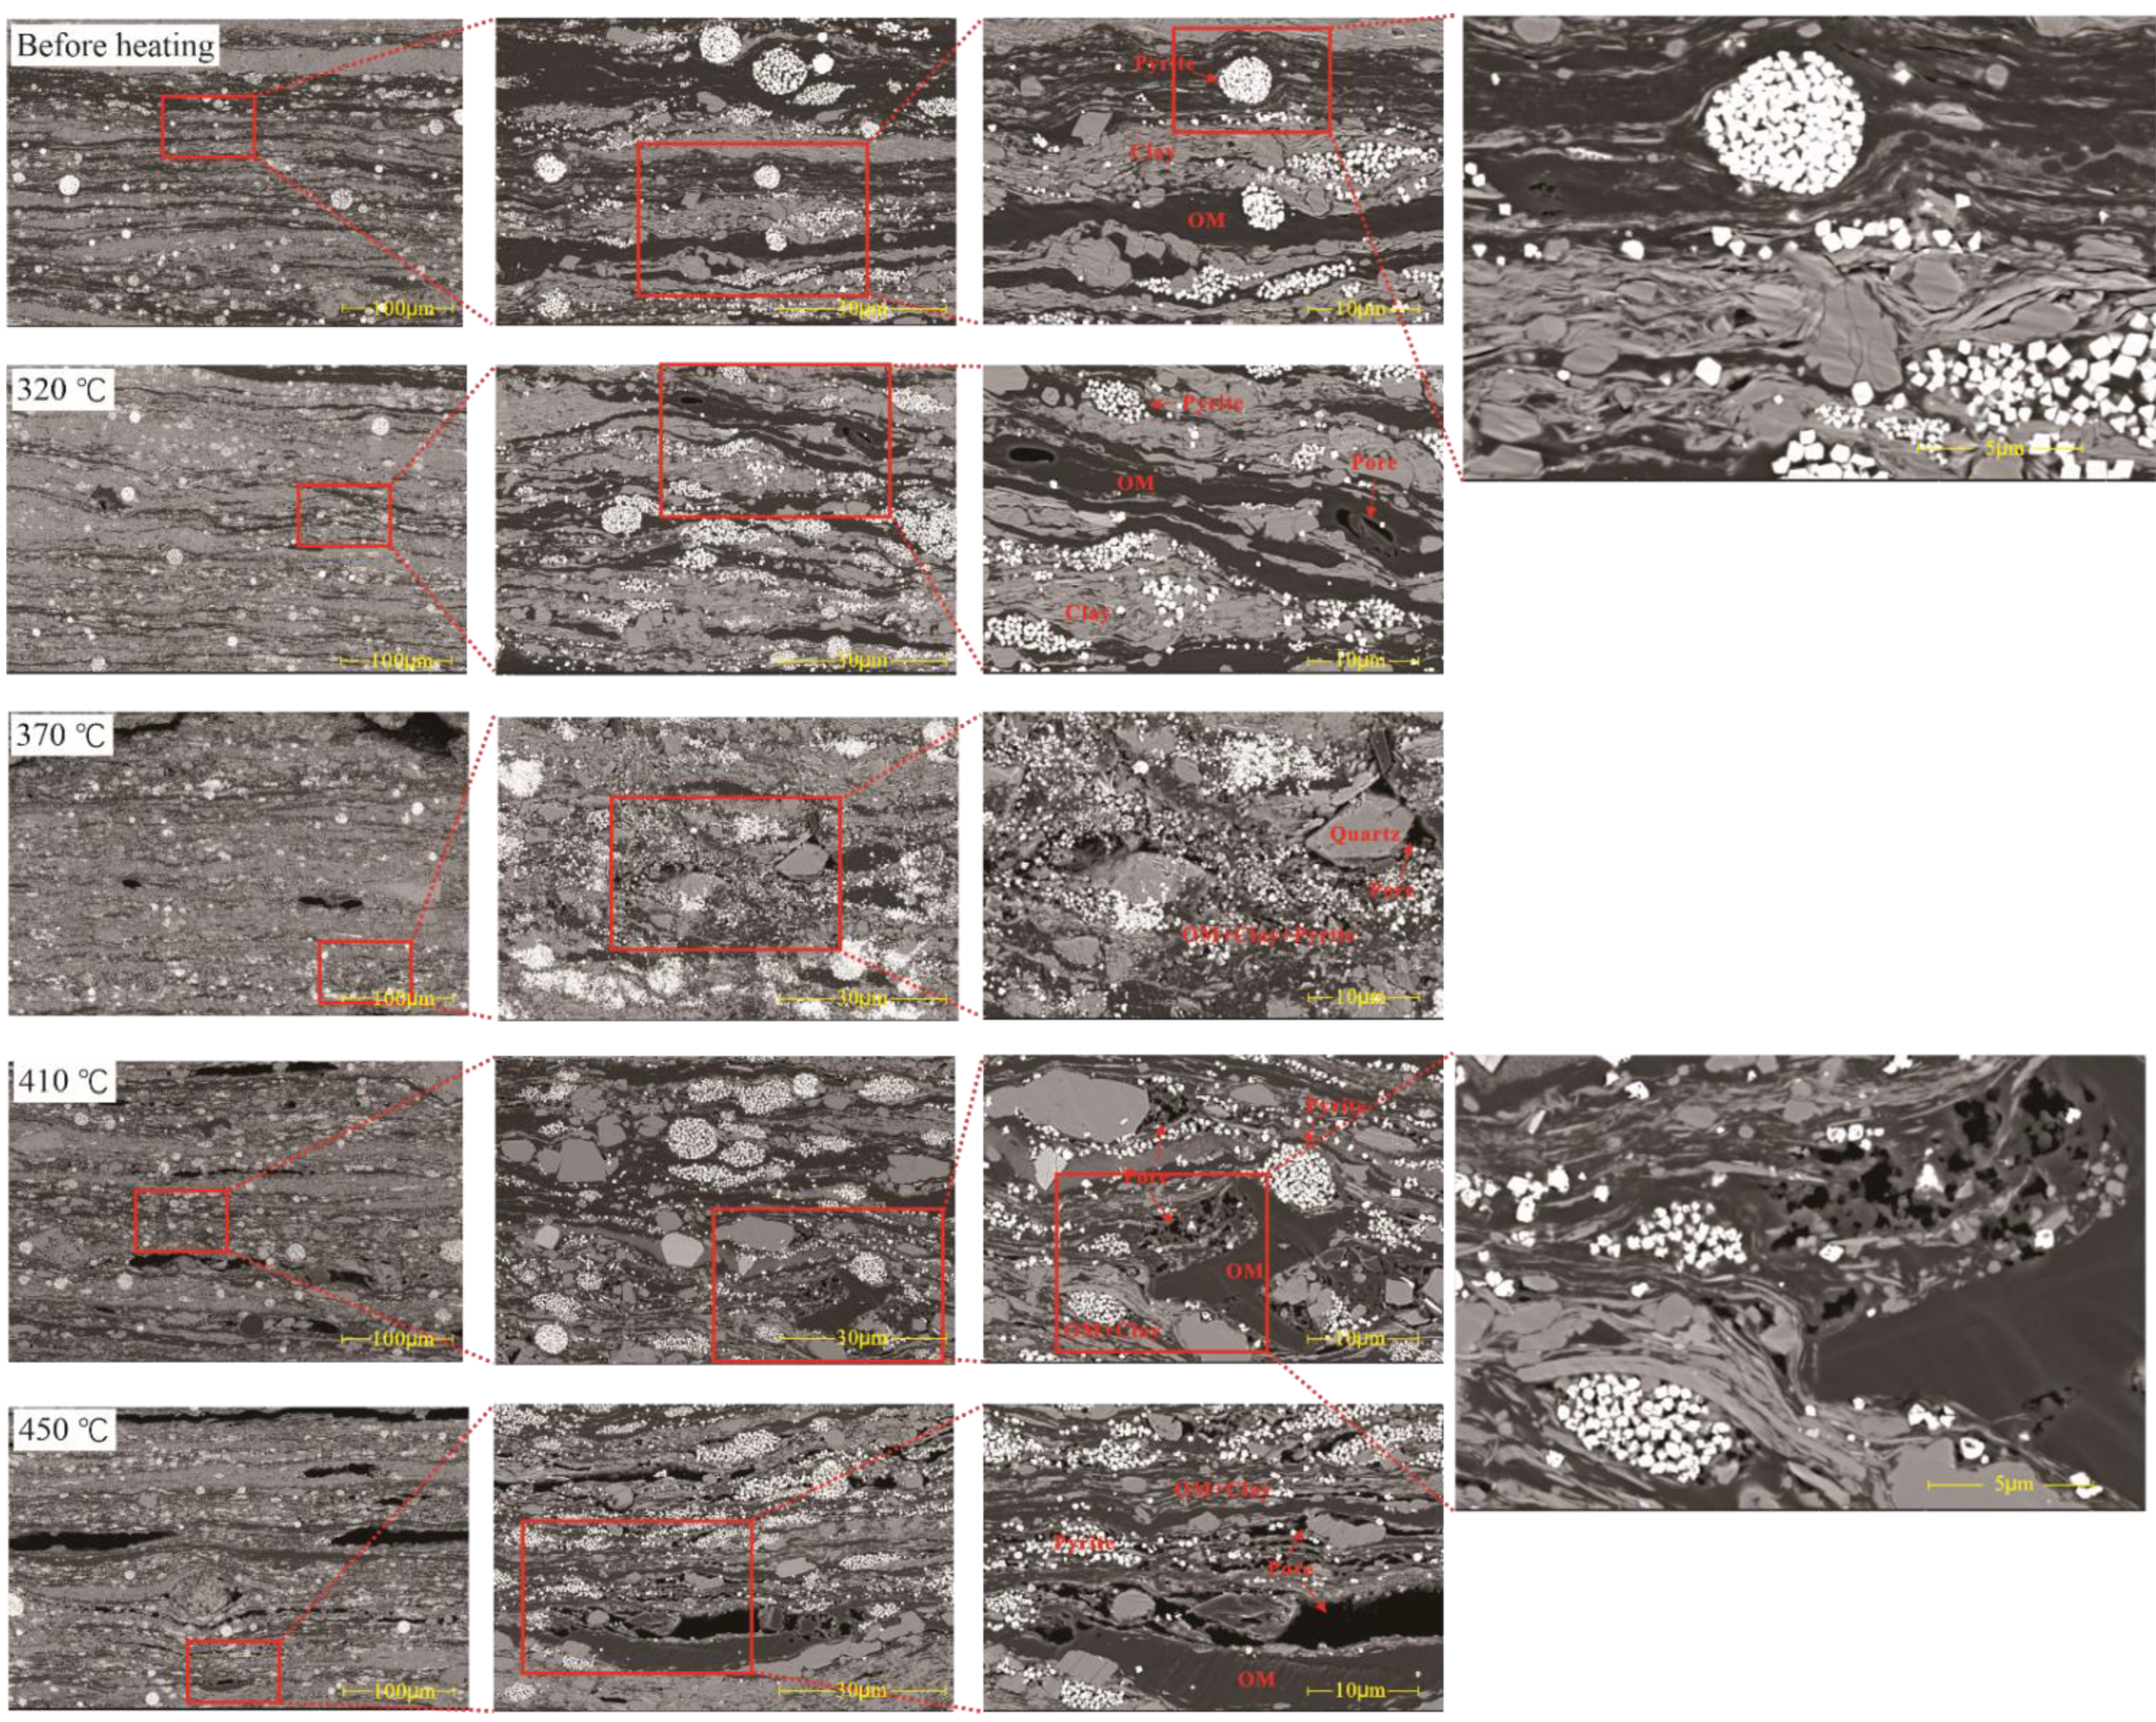
Visual observations of core plugs, petrographic microscopy, and SEM were conducted on the subsamples before and after heating to different temperatures, the results of which are presented in Figure 8, Figure 9 and Figure 10. These measurements at three different scales revealed a three-scale millimeter–micrometer–nanometer pore–fracture network that formed during shale heating. The pores and fractures became more numerous with increasing temperature. The observed changes in the shale pore structure after heating were similar to those of oil shale studied by previous investigations [14,15,17,19].
The milli-scale pore–fracture network comprised mainly horizontal fractures along shale bedding planes (Figure 8). After heating the shale to 320 °C, a small number of new pores and fractures were observed locally. After heating to 370 °C, a large number of pores and horizontal fractures were formed, and some subsamples showed horizontal and vertical fractures, forming a milli-scale mesh pore–fracture network. After heating to 450 °C, visual observation showed that the shale was completely cracked along the bedding planes, and a large number of pores and fractures developed, providing seepage channels for the shale oil during the ICP.
The micro-scale pore–fracture network was developed mainly along the shale bedding planes and consisted predominantly of horizontal fractures and locally of horizontal and vertical micro-scale fractures (Figure 9). During shale heating, the changes in the micro-scale pore–fracture network were consistent with those in the milli-scale pore–fracture network. With increasing temperature, the number and scale of micro-scale pores and fractures increased, gradually developing into milli-scale pores and fractures.
The nano-scale pore–fracture network was composed mostly of OM pores, intergranular pores in minerals, and fractures between OM and mineral particles (Figure 10). SEM images at different magnifications revealed that the pores of OM and intergranular pores in minerals increased gradually with increasing temperature. After heating to 320 °C, nano-scale pores and fractures did not develop, and only small numbers of OM pores and intergranular pores of minerals were observed locally. After further heating to 370 °C, OM was substantially pyrolyzed and OM pores developed; at 410 °C, fractures between OM and mineral particles developed. After further heating to 450 °C, OM pores, intergranular pores in minerals, and fractures between OM and mineral particles were more numerous and larger.
The evolution of the shale pores and fractures during the ICP is a complex process that is influenced by many factors, including the following: (1) Kerogen pyrolysis can form not only abundant oil and gas, but also a large number of OM pores. (2) Dehydration during the transformation of clay minerals led to an increase in intergranular pores and was conducive to the formation of shrinkage fractures. (3) The dissolution of some unstable minerals was conducive to the formation of secondary pores. (4) During the temperature increase, the thermal stress exceeded the strength limit of shale, and micro-cracks occurred at the boundaries of the mineral particles. When the micro-cracks generated by heating formed a fracture network, thermal fractures occurred in the shale, which plays an important role in improving the physical properties of shale reservoirs [27].

3.3. Changes in Shale Porosity and Permeability during Heating

The porosities and permeabilities of the plugs before and after heating to different temperatures are given in Table 2. Before heating, the difference between the horizontal (1.07–3.83%, mean of 2.51%) and vertical (1.59–3.05%, mean of 2.09%) porosity of the Chang 7 shale was negligible, but the difference between the horizontal permeability (0.0012–0.48 md, mean of 0.15 md) and vertical permeability (0.000003–0.000009 md, mean of 0.005 md) of the shale was substantial. The horizontal permeability was, thus, 3–5 orders of magnitude greater than that of the vertical permeability. The corrected porosity and permeability values were equal to the values after heating minus or plus the differences between the values before heating and the average values.
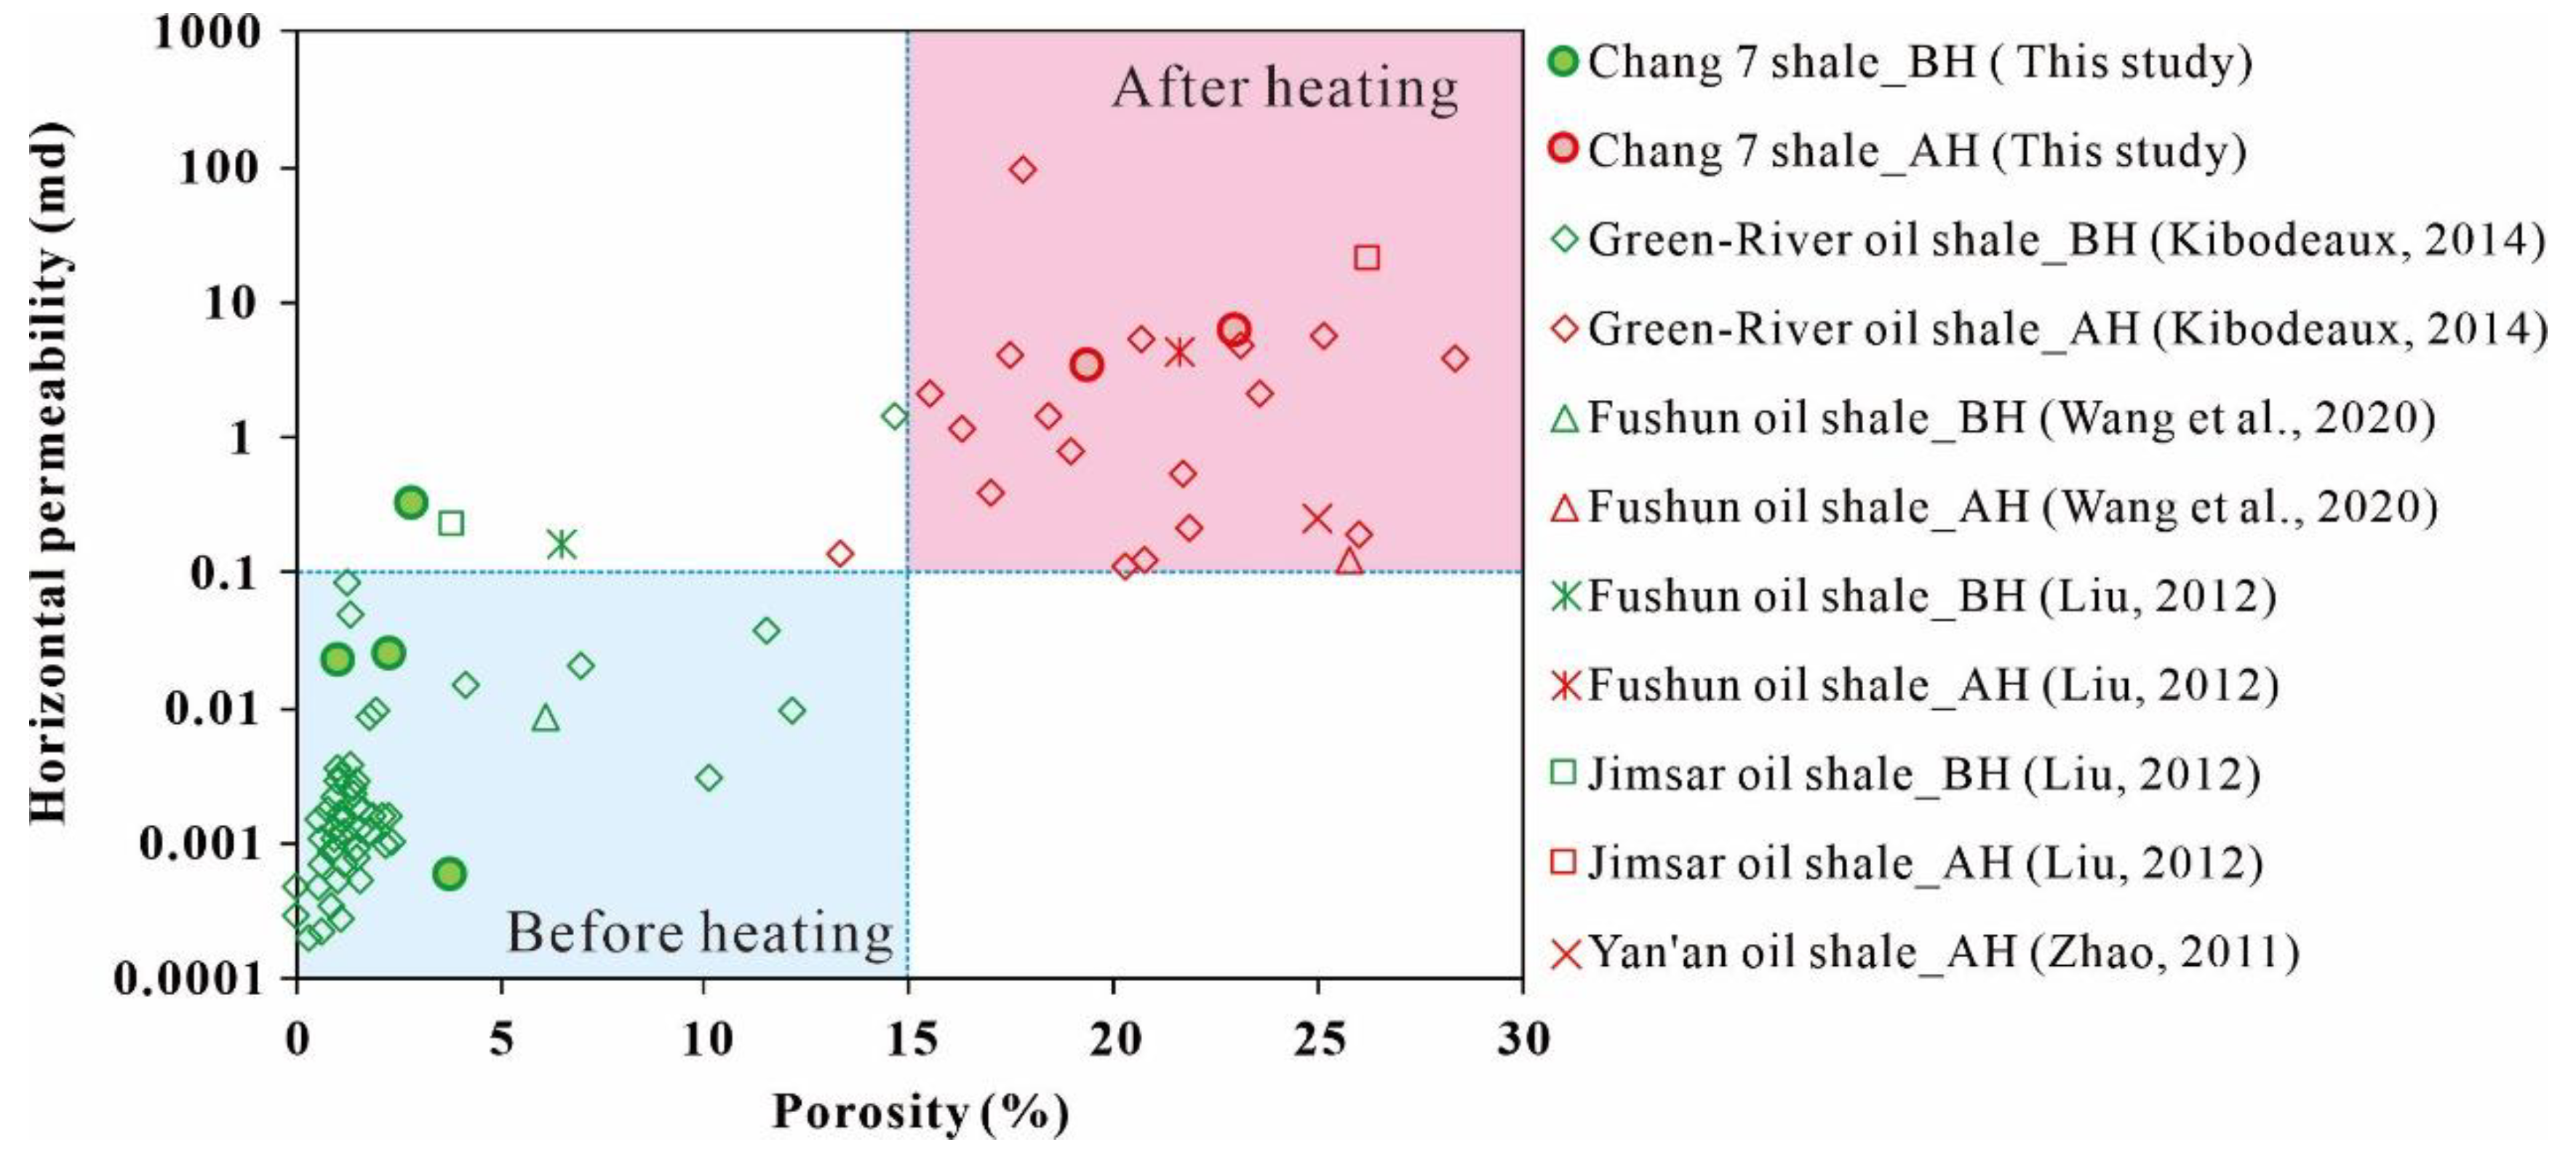
Figure 11 shows changes in the porosity and horizontal permeability of the Chang 7 shale and oil shale from other regions before and after heating to 400–450 °C. Heating clearly played an important role in improving the porosity and permeability of the Chang 7 shale and oil shale from other regions. After heating to a temperature of >400 °C, the porosity and permeability of the Chang 7 shale were substantially higher than those prior to heating (Figure 11). The porosity increased by 10-times, and the permeability increased by 2–4 orders of magnitude (Table 2). Previous studies have shown that, when oil shale is heated above 400 °C, the porosity and permeability increase substantially [49,50,51,52,53,54,55,56,57,58]. Our compilation of published data revealed that the porosity was generally <5% and the horizontal permeability was generally <0.1 md before heating, increasing to around 15–30% and 0.1–100 md after heating to 400–450 °C, respectively.
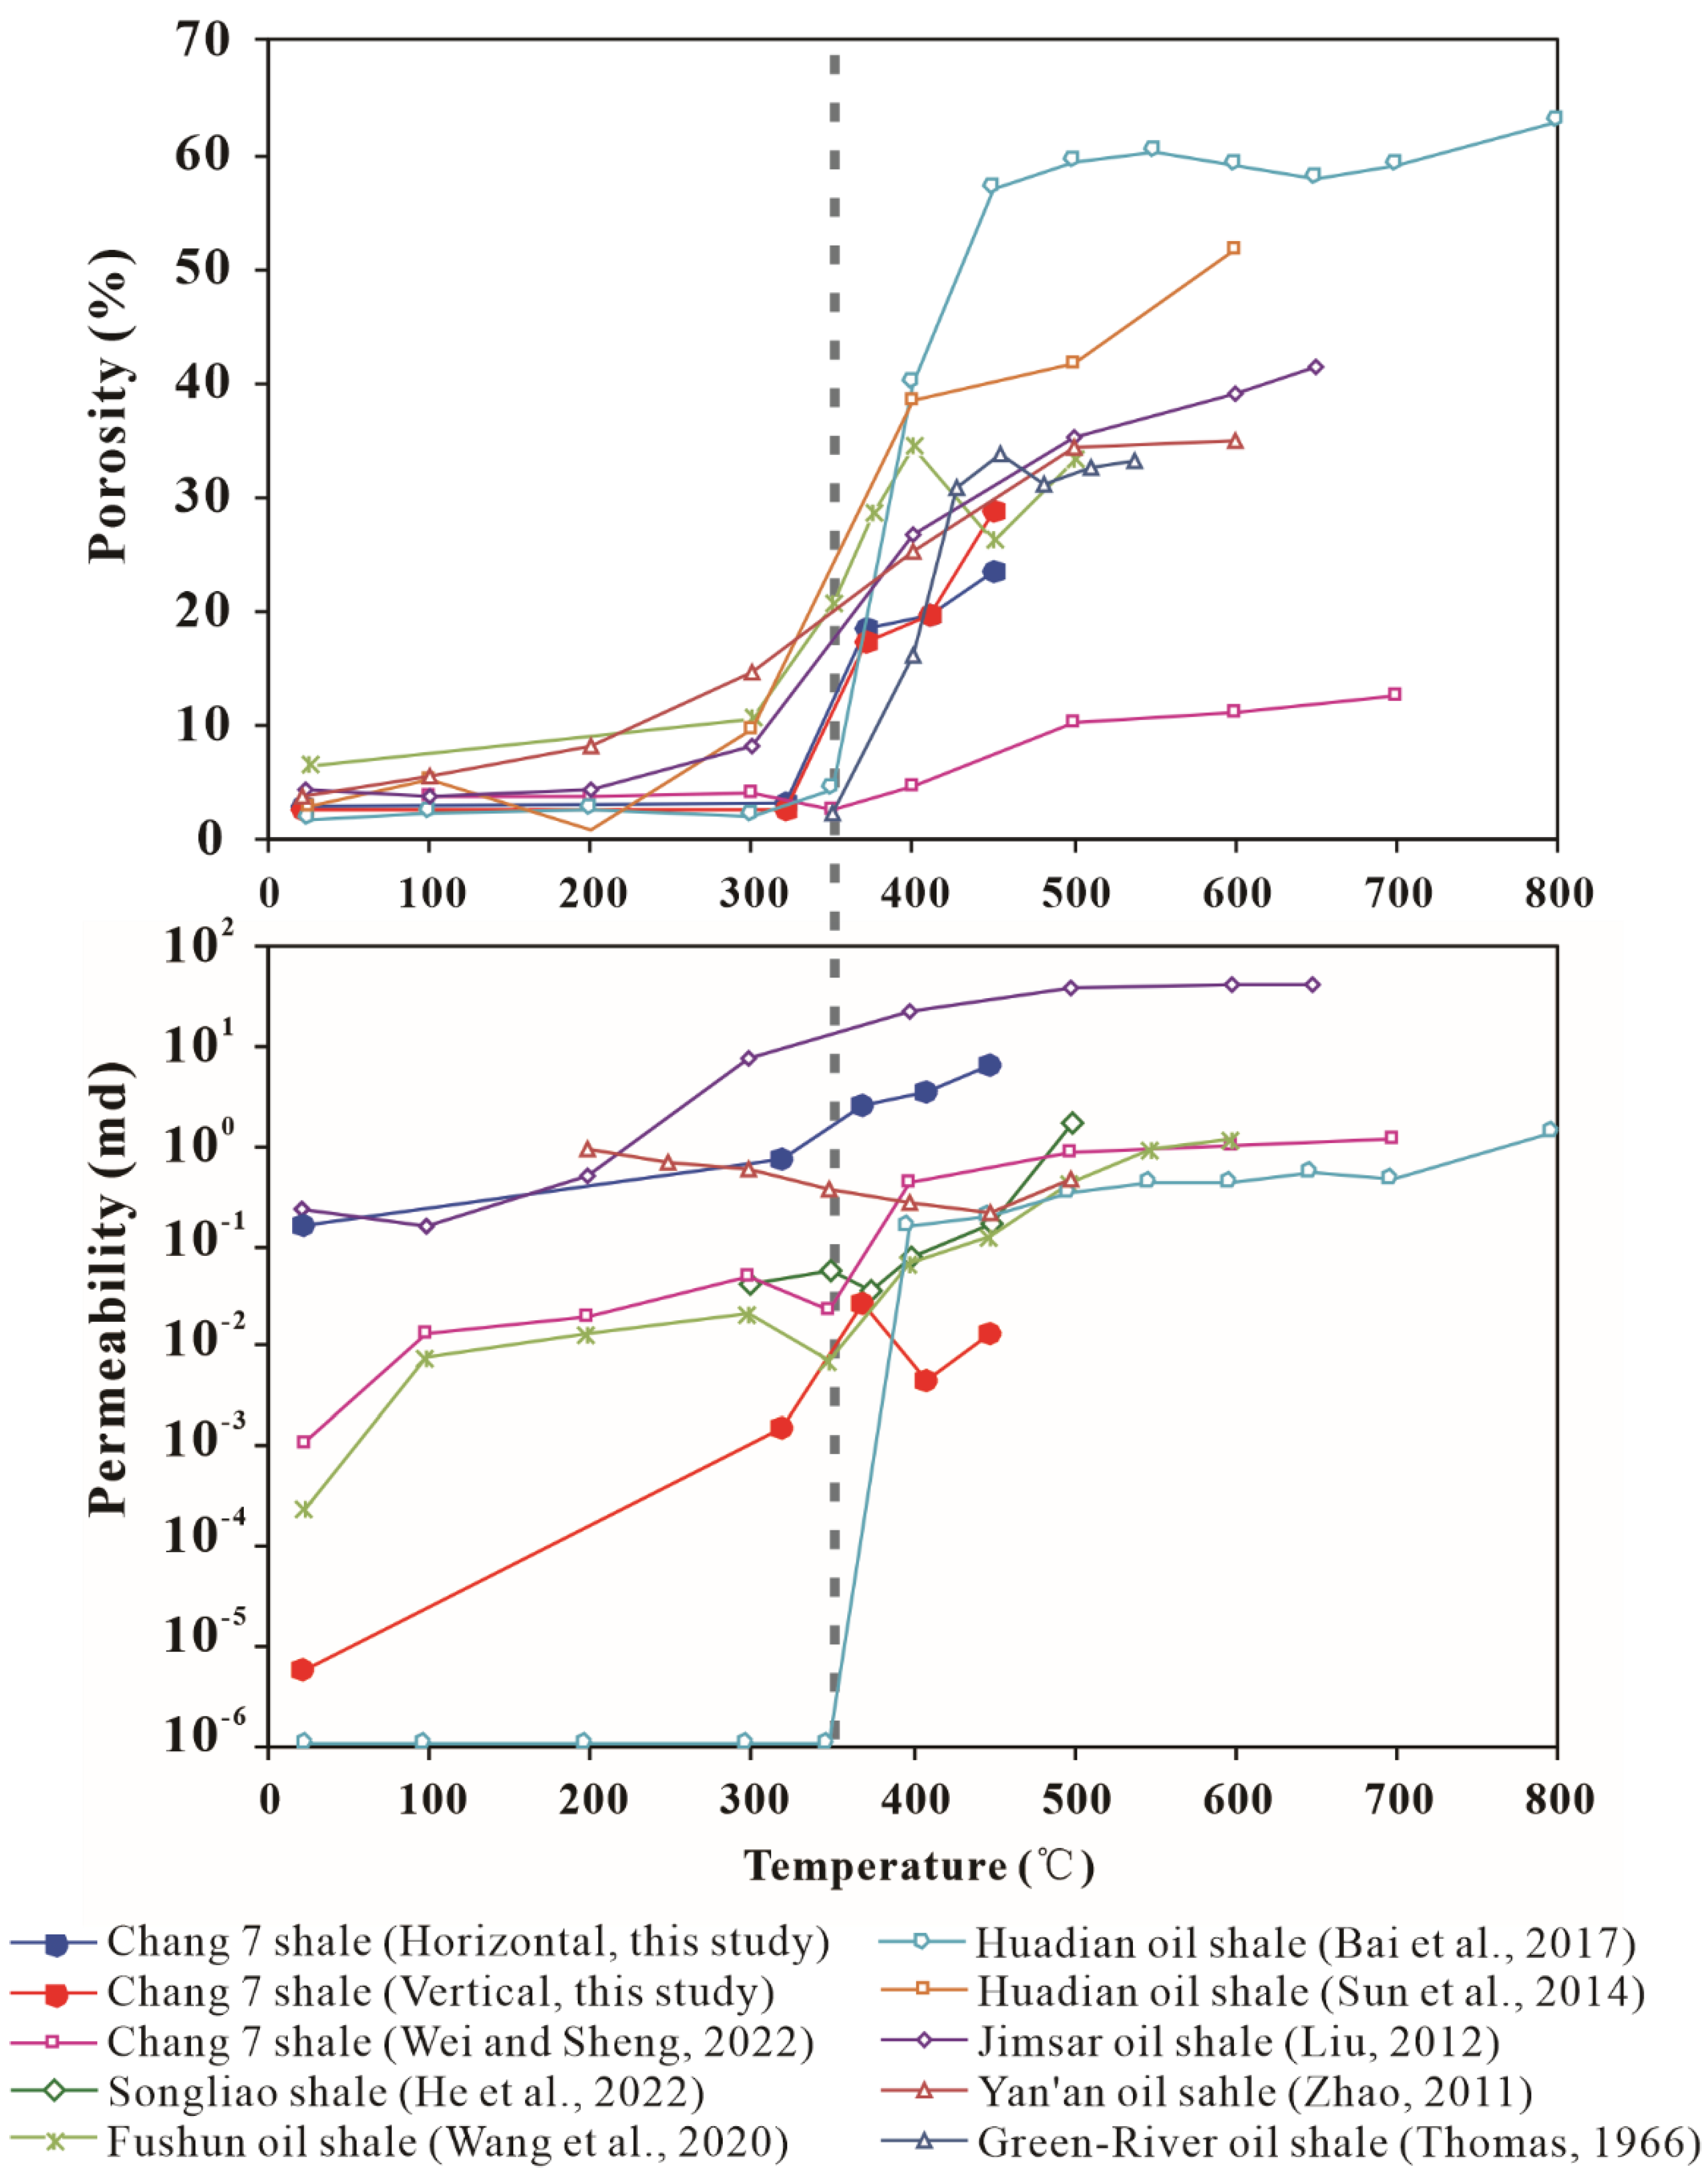
Figure 12 shows changes in the porosity and permeability of the Chang 7 shale and oil shale from other regions during heating to different temperatures. Within the experimental temperature range (20–450 °C), the changes in the porosity of the Chang 7 shale in the horizontal and vertical directions were highly similar at 2.51–23.05% (horizontal) and 2.06–28.39% (vertical). After heating to 320 °C, the horizontal and vertical porosities increased to 2.95% and 2.33%, respectively. After further heating to 370 °C, reaching the oil-generation window, the horizontal and vertical porosities increased to 18.10% and 16.81%, respectively. With the large amount of kerogen pyrolysis occurring during heating to 370 °C, abundant pores were formed in the shale during the ICP. For the permeability, the difference between horizontal and vertical permeabilities was at least two orders of magnitude—0.1525–6.1944 md (horizontal) and 0.000005–0.02634 md (vertical)—measured over the temperature range of 20–450 °C used in the experiment. The horizontal permeability was higher because of the existence of the horizontal bedding in shale. With increasing temperature, the pore–fracture network became more developed and connected, producing increases in the permeability in both the horizontal and vertical directions. During the in situ heating, the vertical permeability increased up to a temperature of 370 °C, but decreased from 370 to 410 °C. In general, as OM reached the oil-generation window, vertical permeability was controlled by the degree of connectivity of the matrix. A large amount of the oil and gas generated under oil-generation-window conditions was stored in matrix pores and could not be discharged, causing permeability in the vertical direction to gradually decrease. With a further temperature increase from 410 to 450 °C, micro-fractures were formed within the matrix, and oil and gas were discharged, leading to an increase in the vertical permeability (Figure 12).
Previous investigations into the dynamic evolution of the porosity and permeability of shale and oil shale under increasing temperature have observed similar trends to those identified in the present study [13,29,49,50,52,53,54,55,56,57,58]. The dynamic evolution of the porosity and permeability of oil shale with increasing temperature was generally consistent with that of shale, and the temperature threshold for the sharp increase in the porosity and permeability in both oil shale and shale was approximately 350 °C (Figure 12). This threshold temperature of 350 °C corresponds to the initiation of the transformation of OM into bitumen and hydrocarbons and was close to the temperature of the peak oil and bitumen generation (380 °C) [5].
Our results showed patterns of change in the porosity and permeability of the Chang 7 shale during heating that were generally consistent with those established by Wei and Sheng [29] for the same shale. However, the porosity and permeability values of Wei and Sheng [29] were lower than those of this study, which was probably attributable to differences in the sample properties and experimental methods. The samples investigated by Wei and Sheng [29] had a deeper burial depth (2040 m), lower TOC (14.37%), and higher clay content (43.6%), resulting in lower porosity and permeability compared with the present study. In addition, Wei and Sheng [29] measured porosity as the average porosity obtained using the nuclear magnetic resonance (NMR) method, which effectively detects pores within the range of 0.2–10,000 nm in diameter, thereby yielding lower porosity relative to this study.

4. Conclusions

(1)
The pore structure, porosity, and permeability of the Chang 7 shale improved substantially during the ICP, with a temperature threshold of approximately 350 °C being identified for a sharp change in mineral and maceral composition, pore structure, porosity, and permeability.
(2)
After heating to 320 °C, K-feldspar, ankerite, and siderite were completely decomposed, clay was dehydrated, and there was little change in the content of quartz and plagioclase. Pyrite became completely decomposed after further heating to 410 °C. Afterwards, the temperature continued to rise, and there was no significant change in mineral composition.
(3)
The geochemical characteristics did not change substantially up to 320 °C. As the temperature rose to 370 °C, the peak of the oil-generation window was reached, characterized by asphalt continuing to be cracked into liquid hydrocarbons with high saturated hydrocarbon and aromatic hydrocarbon contents, and S1 reached its maximum value. After further heating to 400–450 °C, it was the end of the oil-generation window and transition to the wet-gas-generation stage.
(4)
After further heating to 370 °C, the content of sapropelite decreased markedly to 15.6%, and exinite essentially disappeared. A large amount of oil asphalt was generated (40.6%). After further heating to 410 °C, the sapropelite content continued to decrease to 1.4%, and the asphaltene content decreased to 22.6%. As the temperature rose to 450 °C, sapropelite disappeared, and the shale displayed no fluorescence.
(5)
Small numbers of secondary pores and thermal fractures were locally generated in the shale at 320 °C, but the porosity and permeability showed negligible changes. A three-scale millimeter–micrometer–nanometer pore–fracture network was formed along the shale bedding planes, between OM and mineral particles and within OM, respectively, as a result of kerogen pyrolysis, the transformation of clay minerals, the dissolution of unstable minerals, and thermal stress. Both the porosity and permeability improved substantially, with the porosity increasing by a factor of 10 and the permeability increasing by 2–4 orders of magnitude through the range of heating from 20 to 450 °C.

Author Contributions

Conceptualization, Z.Z. and L.H.; methodology, B.L.; validation, L.H.; formal analysis, Z.Z.; investigation, X.L., Y.C. and Z.P.; data curation, S.L. and L.Z.; writing—original draft preparation, Z.Z.; writing—review and editing, L.H. and B.L.; visualization, Y.C.; supervision, L.H.; project administration, L.H.; funding acquisition, L.H. All authors have read and agreed to the published version of the manuscript.

Funding

This research was funded by the Scientific Research and Technological Development Project of CNPC (2021DJ5206).

Institutional Review Board Statement

Not applicable.

Informed Consent Statement

Not applicable.

Data Availability Statement

Not applicable.

Acknowledgments

We thank Hua Tian, Jingang Cui, Lihua Ding, Jiaqing Hao, and Yiwen Wu for their assistance in the experiments.

Conflicts of Interest

The authors declare no conflict of interest.

References

  1. Zhao, W.; Hu, S.; Hou, L. Connotation and strategic role of in-situ conversion processing of shale oil underground in the onshore China. Pet. Explor. Dev. 2018, 45, 563–572. [Google Scholar] [CrossRef]
  2. Hou, L.; Cui, J.; Zhang, Y. Evolution mechanism of dynamic thermal parameters of shale. Mar. Pet. Geol. 2021, 138, 105423. [Google Scholar] [CrossRef]
  3. Liu, B.; Jiang, X.-W.; Bai, L.-H.; Lu, R.-S. Investigation of oil and water migrations in lacustrine oil shales using 20 MHz 2D NMR relaxometry techniques. Pet. Sci. 2021, 19, 1007–1018. [Google Scholar] [CrossRef]
  4. Hou, L.; Yu, Z.; Luo, X.; Lin, S.; Zhao, Z.; Yang, Z.; Wu, S.; Cui, J.; Zhang, L. Key geological factors controlling the estimated ultimate recovery of shale oil and gas: A case study of the Eagle Ford shale, Gulf Coast Basin, USA. Pet. Explor. Dev. 2021, 48, 762–774. [Google Scholar] [CrossRef]
  5. Ma, W.; Hou, L.; Luo, X.; Liu, J.; Tao, S.; Guan, P.; Cai, Y. Generation and expulsion process of the Chang 7 oil shale in the Ordos Basin based on temperature-based semi-open pyrolysis: Implications for in-situ conversion process. J. Pet. Sci. Eng. 2020, 190, 107035. [Google Scholar] [CrossRef]
  6. Hou, L.; Luo, X.; Mi, J.; Zhang, Y.; Lin, S.; Liao, F.; Pang, Z.; Yu, Z. Characteristics of Oil and Gas Produced by In Situ Heating of Shale: A Case Study of the Chang 7 Member, Ordos Basin, China. Energy Fuels 2022, 19, 441–458. [Google Scholar] [CrossRef]
  7. Burnham, A.K.; Mcconaghy, J.R. Comparison of the acceptability of various oil shale processes. In Proceedings of the 26th Oil Shale Symposium, Golden, CO, USA, 16–18 October 2006. [Google Scholar]
  8. Fowler, T.D.; Vinegar, H.J. Oil shale ICP-Colorado Field Pilots. In Proceedings of the SPE Western Regional Meeting, San Jose, CA, USA, 24–26 March 2009; pp. 1–15. [Google Scholar]
  9. Tanaka, P.L.; Yeakel, J.D.; Symington, W.A.; Meurer, W.; Spiecker, P.M.; Pico, M.D.; Thomas, M.; Sullivan, K.; Stone, M. Plan to test ExxonMobil′s in situ oil shale technology on a proposed RD & Dlease. In Proceedings of the Oil Shale Symposium, Golden, CO, USA, 17–21 October 2011. [Google Scholar]
  10. Alpak, F.O.; Vink, J.C.; Gao, G.; Mo, W. Techniques for Effective Simulation, Optimization, and Uncertainty Quantification of the In-situ Upgrading Process. J. Unconv. Oil Gas Resour. 2013, 3–4, 1–14. [Google Scholar] [CrossRef]
  11. Hou, L.; Ma, W.; Luo, X.; Liu, J. Characteristics and quantitative models for hydrocarbon generation-retention-production of shale under ICP conditions: Example from the Chang 7 member in the Ordos Basin. Fuel 2020, 279, 118497. [Google Scholar] [CrossRef]
  12. Kang, Z.; Zhao, Y.; Yang, D. Review of oil shale in-situ conversion technology. Appl. Energy 2020, 269, 115121. [Google Scholar] [CrossRef]
  13. He, W.; Meng, Q.; Lin, T.; Wang, R.; Liu, X.; Ma, S.; Li, X.; Yang, F.; Sun, G. Evolution of in-situ permeability of low-maturity shale with the increasing temperature, Creta-ceous Nenjiang Formation, northern Songliao Basin, NE China. Pet. Explor. Dev. 2022, 49, 516–529. [Google Scholar] [CrossRef]
  14. Tiwari, P.; Deo, M.; Lin, C.; Miller, J. Characterization of oil shale pore structure before and after pyrolysis by using X-ray micro CT. Fuel 2013, 107, 547–554. [Google Scholar] [CrossRef]
  15. Glatz, G.; Castanier, L.M.; Kovscek, A.R. Visualization and Quantification of Thermally Induced Porosity Alteration of Immature Source Rock Using X-ray Computed Tomography. Energy Fuels 2016, 30, 8141–8149. [Google Scholar] [CrossRef]
  16. Burnham, A.K. Porosity and permeability of Green River oil shale and their changes during retorting. Fuel 2017, 203, 208–213. [Google Scholar] [CrossRef]
  17. Saif, T.; Lin, Q.; Bijeljic, B.; Blunt, M.J. Microstructural imaging and characterization of oil shale before and after pyrolysis. Fuel 2017, 197, 562–574. [Google Scholar] [CrossRef]
  18. Liu, J.; Liang, W.; Kang, Z.; Lian, H.; Geng, Y. Study on the quantitative model of oil shale porosity in the pyrolysis process based on pyrolysis kinetics. Oil Shale 2018, 35, 128. [Google Scholar] [CrossRef] [Green Version]
  19. Han, J.; Sun, Y.H.; Guo, W. Characterization of pyrolysis of Nong’An oil shale at different temperatures and analysis of pyrol-ysate. Oil Shale 2019, 36, 151–170. [Google Scholar] [CrossRef]
  20. Kim, T.W.; Ross, C.M.; Guan, K.M.; Burnham, A.K.; Kovscek, A.R. Permeability and Porosity Evolution of Organic-Rich Shales from the Green River Formation as a Result of Maturation. SPE J. 2020, 25, 1377–1405. [Google Scholar] [CrossRef]
  21. Zafar, A.; Su, Y.; Wendong, W.; Kashif, M.; Mehmood, A.; Alam, S.G. Evaluation of the porosity and permeability of oil shale during in-situ conversion process through numerical simulation and mathematical modeling. Oil Shale 2020, 37, 319. [Google Scholar] [CrossRef]
  22. Wang, G.; Yang, D.; Zhao, Y.; Kang, Z.; Zhao, J.; Huang, X. Experimental investigation on anisotropic permeability and its relationship with anisotropic thermal cracking of oil shale under high temperature and triaxial stress. Appl. Therm. Eng. 2018, 146, 718–725. [Google Scholar] [CrossRef]
  23. Zhao, J.; Kang, Z. Permeability of Oil Shale Under In Situ Conditions: Fushun Oil Shale (China) Experimental Case Study. Nat. Resour. Res. 2020, 30, 753–763. [Google Scholar] [CrossRef]
  24. Cui, J.; Zou, C.; Zhu, R. New Advances in Shale Porosity Research. Adv. Earth Sci. 2012, 27, 1319–1325, (In Chinese with English Abstract). [Google Scholar]
  25. Wu, S.; Yang, Z.; Zhai, X.; Cui, J.; Bai, L.; Pan, S.; Cui, J. An experimental study of organic matter, minerals and porosity evolution in shales within high-temperature and high-pressure constraints. Mar. Pet. Geol. 2018, 102, 377–390. [Google Scholar] [CrossRef]
  26. Jiang, X.; Wu, S.; Hou, L.; Zhang, J.; Guan, M.; Zhai, F.; Guo, J.; Su, L.; Liao, F.; Ding, L. Porosity Evolution in Lacustrine Organic-Matter-Rich Shales With High Claly Minerals Content. Front. Earth Sci. 2021, 9, 766093. [Google Scholar] [CrossRef]
  27. Chen, G.H.; Jiang, N.; Li, C.; Li, S.S.; Peng, P.; Mo, L.; Zhang, Y.Y.; Zhang, L.C.; Zhang, T.Y. Progress in shale reservoir upgrading through in-situ heating. OIL GAS Geol. 2022, 43, 286–296, (In Chinese with English Abstract). [Google Scholar]
  28. Liu, B.; Nakhaei-Kohani, R.; Bai, L.; Wen, Z.; Gao, Y.; Tian, W.; Yang, L.; Liu, K.; Hemmati-Sarapardeh, A.; Ostadhassan, M. Integrating advanced soft computing techniques with experimental studies for pore structure analysis of Qingshankou shale in Southern Songliao Basin, NE China. Int. J. Coal Geol. 2022, 257, 103998. [Google Scholar] [CrossRef]
  29. Wei, Z.; Sheng, J. Changes of pore structures and permeability of the Chang 73 medium-to-low maturity shale during in-situ heating treatment. Energy 2022, 248, 123609. [Google Scholar] [CrossRef]
  30. Liu, D.; Li, H.; Zhang, C.; Wang, Q.; Peng, P. Experimental investigation of pore development of the Chang 7 member shale in the Ordos basin under semi-closed high-pressure pyrolysis. Mar. Pet. Geol. 2018, 99, 17–26. [Google Scholar] [CrossRef]
  31. Li, G.; Li, G.; Luo, C.; Zhou, R.; Zhou, J.; Yang, J. Dynamic evolution of shale permeability under coupled temperature and effective stress conditions. Energy 2023, 266, 126320. [Google Scholar] [CrossRef]
  32. Wu, S.; Zhu, R.; Cui, J.; Cui, J.; Bai, B.; Zhang, X.; Jin, X.; Zhu, D.; You, J.; Li, X. Characteristics of lacustrine shale porosity evolution, Triassic Chang 7 Member, Ordos Basin, NW China. Pet. Explor. Dev. 2015, 42, 185–195. [Google Scholar] [CrossRef]
  33. Li, J.; Wang, S.; Dong, K.; Meng, S.; Lu, Q.; Li, Z. Effects of in-situ temperature in deep reservoirs on shale fracture properties. Energy Rep. 2023, 9, 73–83. [Google Scholar] [CrossRef]
  34. Ge, Z.; Sun, Q.; Gao, Q.; Li, D.; Zhang, Y.; Huang, H. Thermoacoustic emission characteristics and real-time damage evolution in shales of the Lower Palaeozoic Niutitang Formation. Int. J. Rock Mech. Min. Sci. 2022, 157, 105175. [Google Scholar] [CrossRef]
  35. Xu, L.; Yang, K.; Wei, H.; Liu, L.; Li, X.; Chen, L.; Xu, T.; Wang, X. Diagenetic evolution sequence and pore evolution model of Mesoproterozoic Xiamaling organic-rich shale in Zhangjiakou, Hebei, based on pyrolysis simulation experiments. Mar. Pet. Geol. 2021, 132, 105233. [Google Scholar] [CrossRef]
  36. Guan, M.; Liu, X.; Jin, Z.; Lai, J.; Sun, B.; Zhang, P.; Chen, K. The evolution of pore structure heterogeneity during thermal maturation in lacustrine shale pyrolysis. J. Anal. Appl. Pyrolysis 2022, 163, 105501. [Google Scholar] [CrossRef]
  37. Guo, H.; Jia, W.; He, R.; Yu, C.; Song, J.; Peng, P. Distinct evolution trends of nanometer-scale pores displayed by the pyrolysis of organic matter-rich lacustrine shales: Implications for the pore development mechanisms. Mar. Pet. Geol. 2020, 121, 104622. [Google Scholar] [CrossRef]
  38. Cao, T.; Deng, M.; Cao, Q.; Huang, Y.; Yu, Y.; Cao, X. Pore formation and evolution of organic-rich shale during the entire hydrocarbon generation process: Examination of artificially and naturally matured samples. J. Nat. Gas Sci. Eng. 2021, 93, 104020. [Google Scholar] [CrossRef]
  39. Guo, H.; Jia, W.; Peng, P.; Zeng, J.; He, R. Evolution of organic matter and nanometer-scale pores in an artificially matured shale undergoing two distinct types of pyrolysis: A study of the Yanchang Shale with Type II kerogen. Org. Geochem. 2017, 105, 56–66. [Google Scholar] [CrossRef]
  40. Hou, L.; Lin, S.; Zhang, L. New insights from geostatistics on the genetic relationship between shales, mudstones, and sandstones within a parasequence in the lower Chang7 Member of the Upper Triassic Yanchang Formation, Ordos Basin, Northern China. J. Asian Earth Sci. 2021, 213, 104767. [Google Scholar] [CrossRef]
  41. Espitalié, J.; Marquis, F.; Barsony, I. Geochemical logging. In Analytical Pyrolysis; Voorhess, K.J., Ed.; Butterworths: Boston, MA, USA, 1984; pp. 53–79. [Google Scholar]
  42. Taylor, G.H.; Teichmüller, M.; Davis, A.C.F.K.; Diessel, C.F.K.; Littke, R.; Robert, P. Organic Petrology; Borntraeger: Berlin/Stuttgart, Germany, 1998. [Google Scholar]
  43. Yuan, W. Formation Mechanism of the Organic-Rich Shales in the 7th Member of Yanchang Formation, Ordos Basin; China University of Petroleum: Beijing, China, 2018. [Google Scholar]
  44. Er, C.; Luo, A.; Zhao, J.; Zhang, Z.; Bai, Y.; Bai, Y.; Chen, D.-X.; Tun, W.-C.; Wei, Z.-K.; Zhang, J. Lithofacies features of organic-rich shale of the Triassic Yanchang Formation in Huachi Aera, Ordos Basin. Earth Sci. Front. 2016, 23, 108–117. [Google Scholar]
  45. Chen, H.; Li, B.; Zhang, B. Decomposition of Pyrite and the Interaction of Pyrite with Coal Organic Matrix in Pyrolysis and Hy-dropyrolysis. Fuel 2000, 79, 1627–1631. [Google Scholar] [CrossRef]
  46. Mohnhoff, D.; Littke, R.; Krooss, B.M.; Weniger, P. Flow-through extraction of oil and gas shales under controlled stress using organic solvents: Implications for organic matter-related porosity and permeability changes with thermal maturity. Int. J. Coal Geol. 2016, 157, 84–99. [Google Scholar] [CrossRef]
  47. Schwark, L.; Stoddart, D.; Keuser, C.; Spitthoff, B.; Leythaeuser, D. A novel sequential extraction system for whole core plug ex-traction in a solvent flow-through cell: Application to extraction of residual petroleum from an intact pore-system in secondary migration studies. Org. Geochem. 1997, 26, 19–31. [Google Scholar] [CrossRef]
  48. Ma, Z.; Zheng, L.; Li, Z. The Thermocompression simulation experiment of source rock hydrocarbon generation and expulsion in formation porosity. Acta Sedimentol. Sin. 2012, 30, 955–963. [Google Scholar]
  49. Liu, B.; Wang, Y.; Tian, S.; Guo, Y.; Wang, L.; Yasin, Q.; Yang, J. Impact of thermal maturity on the diagenesis and po-rosity of lacustrine oil-prone shales: Insights from natural shale samples with thermal maturation in the oil generation window. Int. J. Coal Geol. 2022, 261, 104079. [Google Scholar] [CrossRef]
  50. Liu, B.; Mohammadi, M.-R.; Ma, Z.; Bai, L.; Wang, L.; Xu, Y.; Ostadhassan, M.; Hemmati-Sarapardeh, A. Evolution of porosity in kerogen type I during hydrous and anhydrous pyrolysis: Experimental study, mechanistic understanding, and model development. Fuel 2023, 338, 127149. [Google Scholar] [CrossRef]
  51. Kibodeaux, K.R. Evolution of porosity, permeability, and fluid saturations during thermal conversion of oil shale. In Proceedings of the SPE Annual Technical Conference and Exhibition, Amsterdam, The Netherlands, 27–29 October 2014. [Google Scholar]
  52. Wang, G.; Yang, D.; Kang, Z. Experimental study on anisotropic permeability of oil shale under high temperature and triaxial stress. Chin. J. Rock Mech. Eng. 2020, 39, 1129–1141. [Google Scholar]
  53. Thomas, G.W. Some effects of overburden pressure on oil shale during underground retorting. In Proceedings of the SPE Annual Fall Meeting, Denver, CO, USA, 3–6 October 1966. [Google Scholar]
  54. Sun, Y.; Bai, F.; Liu, B.; Liu, Y.; Guo, M.; Guo, W.; Wang, Q.; Lü, X.; Yang, F.; Yang, Y. Characterization of the oil shale products derived via topochemical reaction method. Fuel 2014, 115, 338–346. [Google Scholar] [CrossRef]
  55. Bai, F.; Sun, Y.; Liu, Y.; Guo, M. Evaluation of the porous structure of Huadian oil shale during pyrolysis using multiple approaches. Fuel 2017, 187, 1–8. [Google Scholar] [CrossRef]
  56. Bai, L.-H.; Liu, B.; Du, Y.-J.; Wang, B.-Y.; Tian, S.-S.; Wang, L.; Xue, Z.-Q. Distribution characteristics and oil mobility thresholds in lacustrine shale reservoir: Insights from N2 adsorption experiments on samples prior to and following hydro-carbon extraction. Pet. Sci. 2022, 19, 486–497. [Google Scholar] [CrossRef]
  57. Zhao, J. Experimental Study on the Relevant Laws of Oil Shale Pyrolysis-Permeability and Internal Structure Variation. Master’s Thesis, Taiyuan University of Technology, Taiyuan, China, 2011. [Google Scholar]
  58. Liu, Z. Temperature Dependence of Evolution of Pore Structure and Permeability Characteristics of Oil Shale. Ph.D. Thesis, Taiyuan University of Technology, Taiyuan, China, 2012. [Google Scholar]
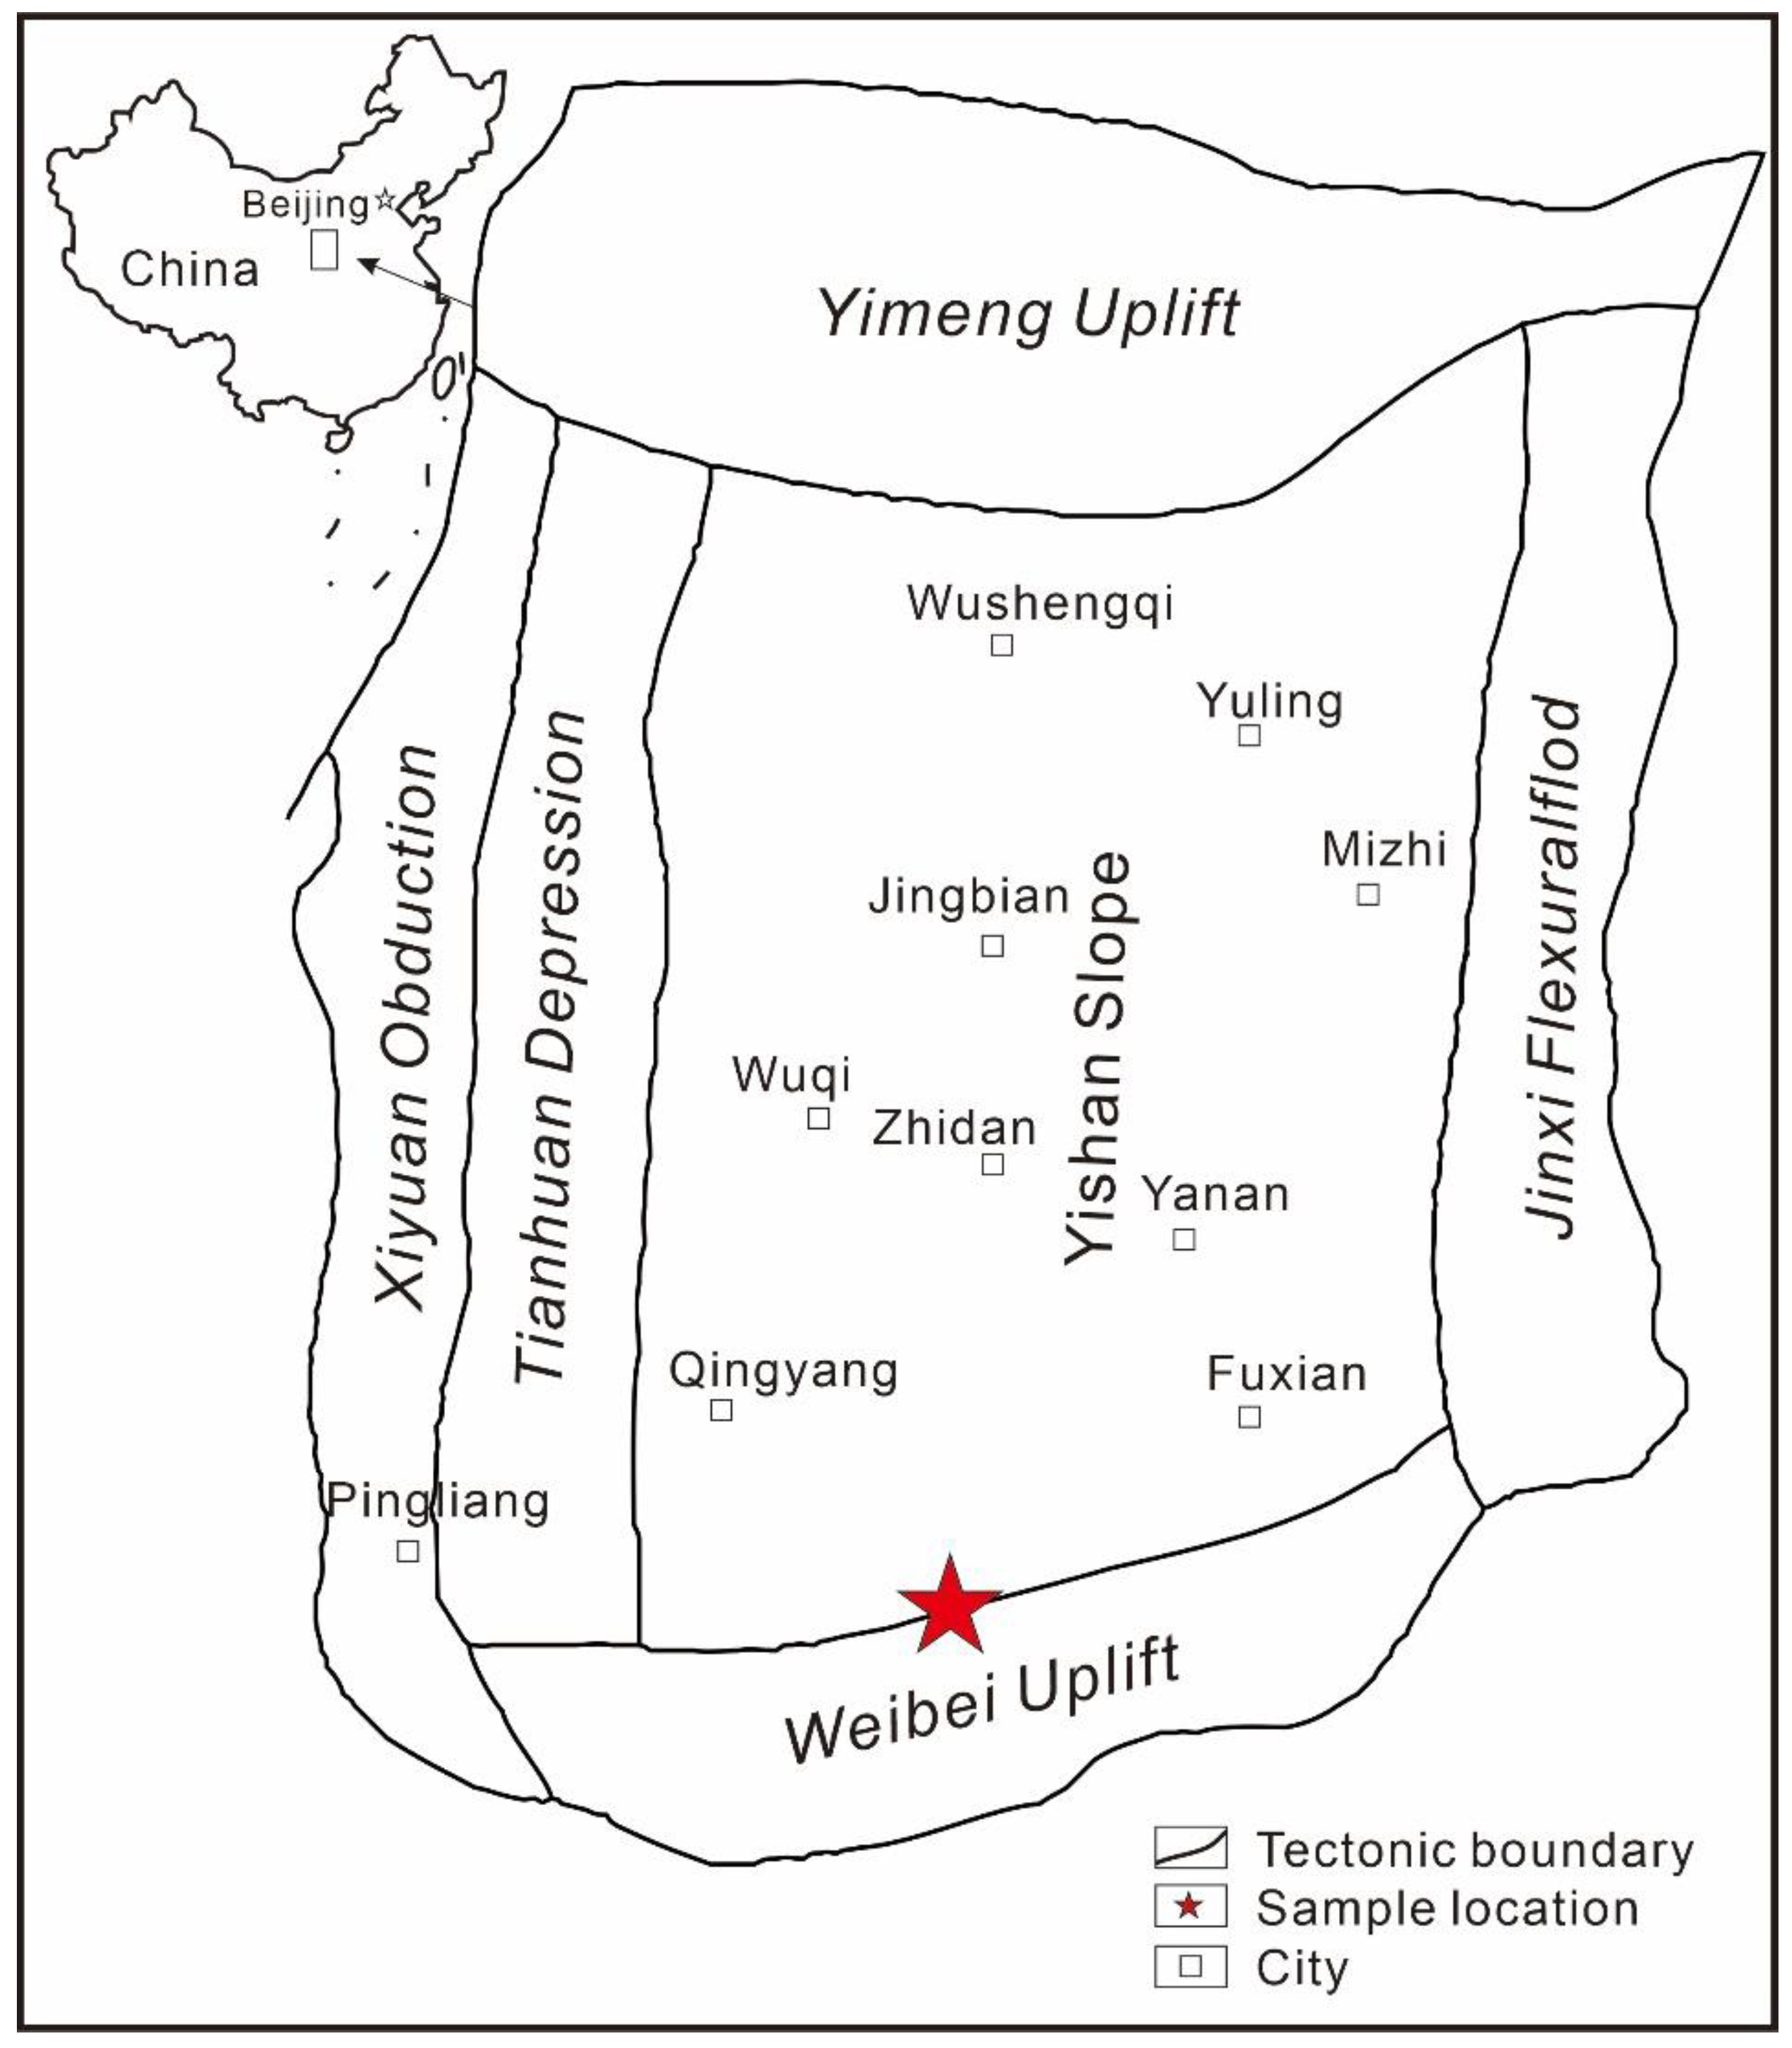
Figure 1. Tectonic division of the Ordos Basin, with the sample location shown in the southern part of the basin.
Jmse 11 01363 g001
Figure 2. Experimental samples and apparatus for the ICP simulation experiments. (a) The studied Chang 7 Member shale core from the Yanchang Formation in the southern Ordos Basin; (b) photographs and schematics of plug and slice subsamples obtained from the core; (c) photographs of powder subsamples, sample cells, and heating systems.
Jmse 11 01363 g002
Figure 3. Heating temperatures and rates for the ICP simulation experiments.
Jmse 11 01363 g003
Figure 4. Mineral composition of samples before and after heating, as determined using XRD analysis.
Jmse 11 01363 g004
Figure 5. Results of Rock-Eval analysis for Chang 7 shale samples before and during heating. (a) TOC: total organic carbon (%); (b) S1: free hydrocarbons (mg/g); (c) S2: pyrolysis hydrocarbons (mg/g); (d) HI: hydrogen index (mg/g TOC).
Jmse 11 01363 g005
Figure 6. Maceral composition of samples before and after heating.
Jmse 11 01363 g006
Figure 7. Photomicrographs of organic matter in samples before and after heating. (a) Before heating, under blue light; (b) before heating, under white light; (c) 320 °C, under blue light; (d) 320 °C, under white light; (e) 370 °C, under blue light; (f) 370 °C, under white light; (g) 410 °C, under blue light; (h) 410 °C, under white light; (i) 450 °C, under blue light; (j) 450 °C, under white light. Abbreviations: Cu—carbonaceous shale; MB—mineral bitumen; Mis—microsporidium; LD—liptodetrinite; Re—resinite; Py—pyrite; T—telinite; Cl—clay; Sf—semi-fusinite debris; B—oil bitumen; An—anthraxolite; Fi—fissure; Po—pore; V—Vitrinite; Mi—microsome.
Jmse 11 01363 g007
Figure 8. Photographs of plug samples before and after heating.
Jmse 11 01363 g008
Figure 9. Optical photomicrographs of thin-section samples before and after heating.
Jmse 11 01363 g009
Figure 10. SEM images of samples before and after heating at different magnifications. Red box shows the zoomed area.
Jmse 11 01363 g010
Figure 11. Relationship between porosity and horizontal permeability for shale and oil shale from different regions before and after heating. Abbreviations: BH—before heating; AH—after heating at 400–450 °C (Comparison data sets are from Zhao, 2011; Liu, 2012; Kibodeaux, 2014; Wang et al., 2020) [51,52,57,58].
Jmse 11 01363 g011
Figure 12. Variation in porosity and permeability of shale and oil shale with changing temperature for samples from different regions (Comparison data sets are from Zhao, 2011; Liu, 2012; Kibodeaux, 2014; Wang et al., 2020) [51,52,57,58].
Jmse 11 01363 g012
Table 1. Vitrinite reflectance of samples before and after heating.
Sample
Number
Heating
Temperature (°C)
Ro (%)Effective Measuring PointsStandard Deviation (δn)
Min.Max.Ave.
0Before heating0.420.490.45280.025
13200.470.580.52240.033
23701.031.341.16210.088
34101.321.791.62500.111
44501.842.212.04600.130
Table 2. Porosity and permeability of samples before and after heating.
Sample
Direction
Sample
Number
Length (mm)Bulk Density (g/cm3)Before HeatingAfter Heating
Porosity (%)Permeability (md)Temperature (°C)Porosity * (%)Permeability * (md)
HorizontalH151.412.202.840.48003202.950.4412
H252.012.113.830.001237018.102.5441
H343.802.192.320.058841019.423.3925
H443.602.171.070.070045023.056.1944
Average2.510.1525-15.883.1431
VerticalV151.582.093.050.0000053202.330.0015
V426.312.031.590.00000437016.810.0263
V325.042.171.850.00000341019.270.0043
V230.771.971.860.00000945028.390.0133
Average2.090.000005-16.700.0114
* Corrected porosity and permeability values are equal to the values after heating minus or plus the differences between the values before heating and the average values before heating.
Disclaimer/Publisher’s Note: The statements, opinions and data contained in all publications are solely those of the individual author(s) and contributor(s) and not of MDPI and/or the editor(s). MDPI and/or the editor(s) disclaim responsibility for any injury to people or property resulting from any ideas, methods, instructions or products referred to in the content.