

A Probabilistic Assessment Framework for Submarine Landslide Susceptibility in Continental Slopes with Rich Gas Hydrates

Abstract
:1. Introduction
2. Methodology
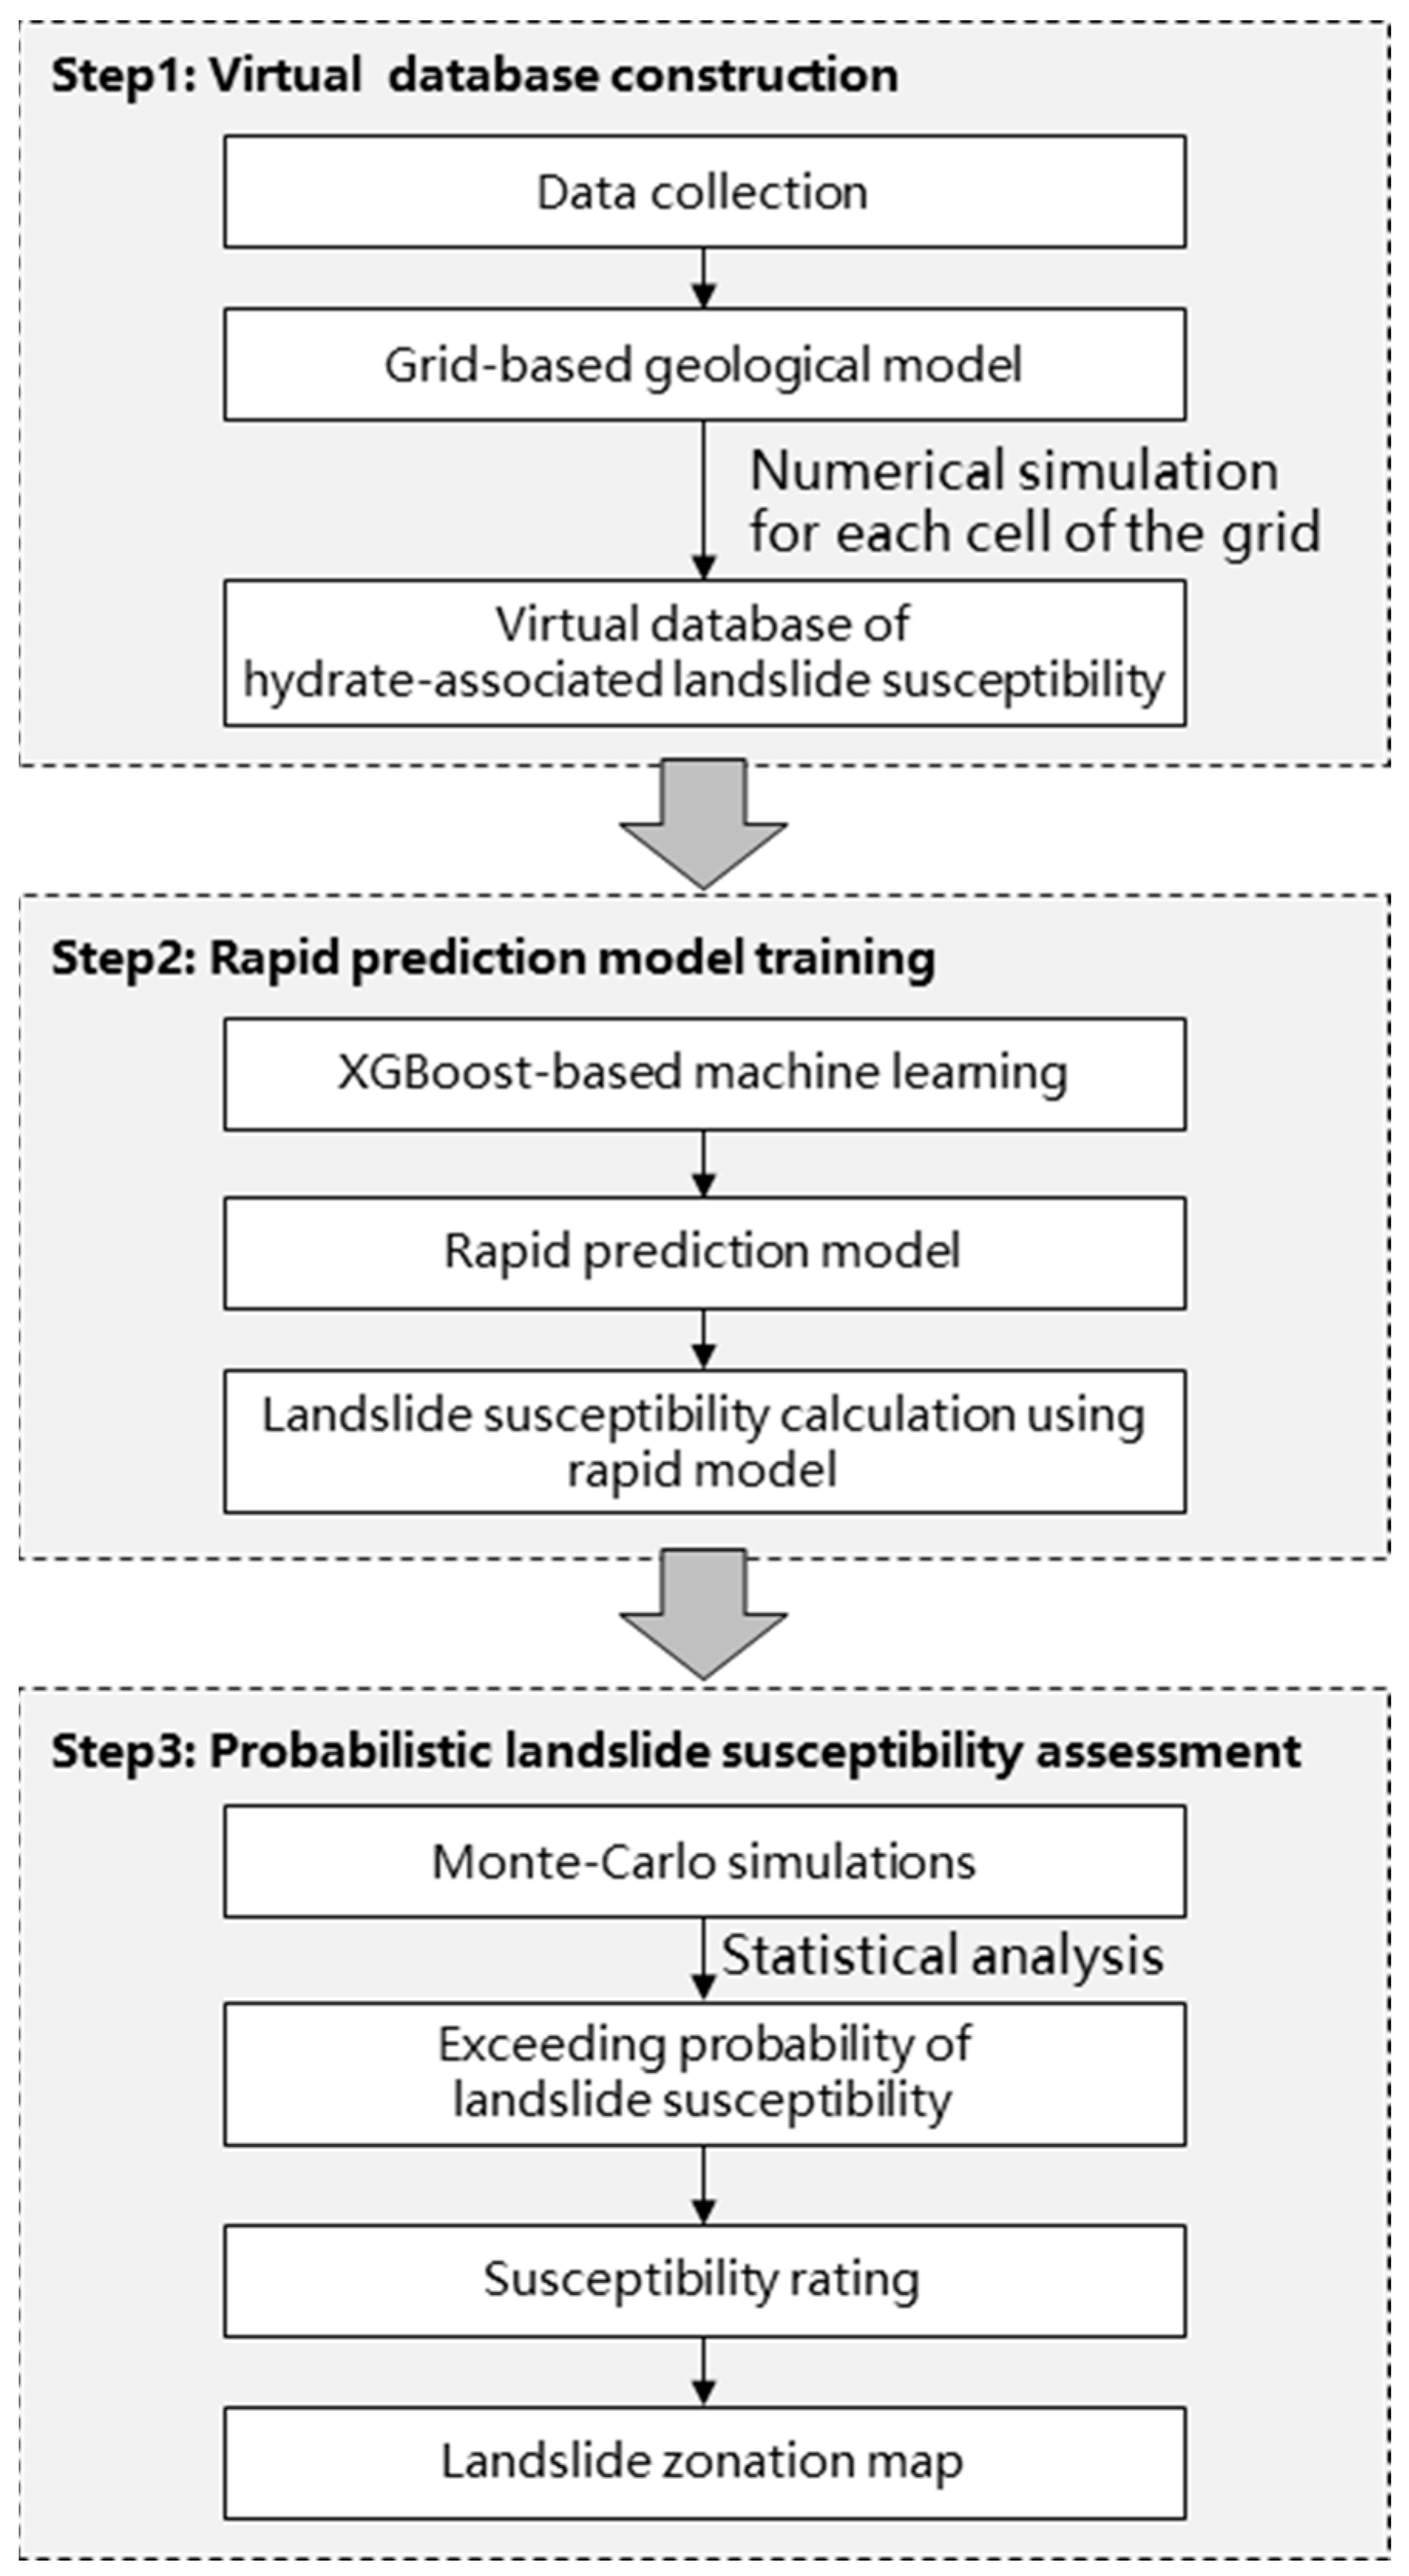
2.1. Workflow
2.2. Susceptibility Analysis Based on the Physical Model
2.3. XGBoost-Based Machine Learning Description
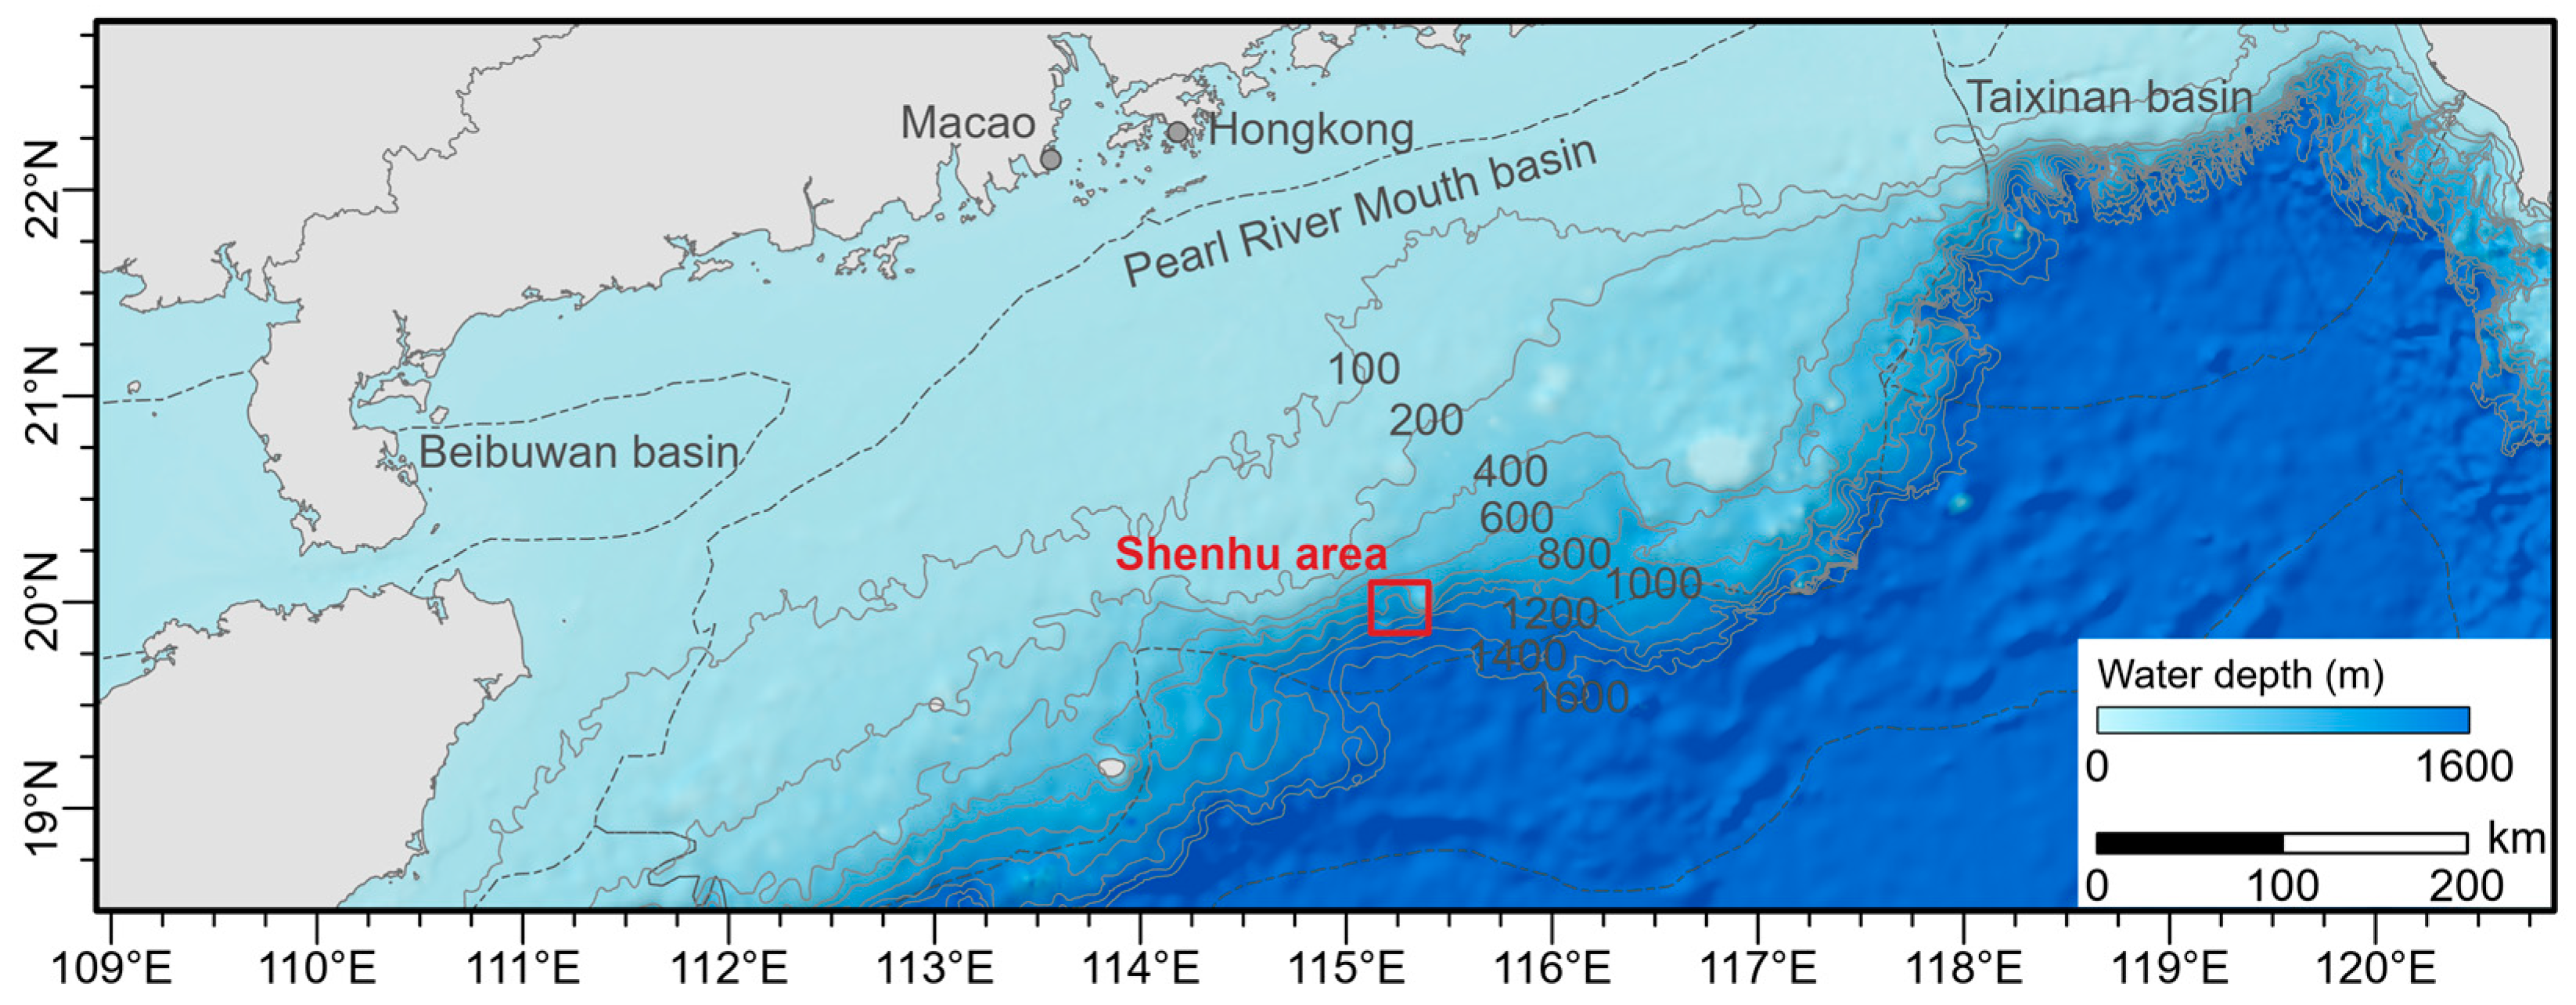
3. Study Area
4. Construction of Virtual Database
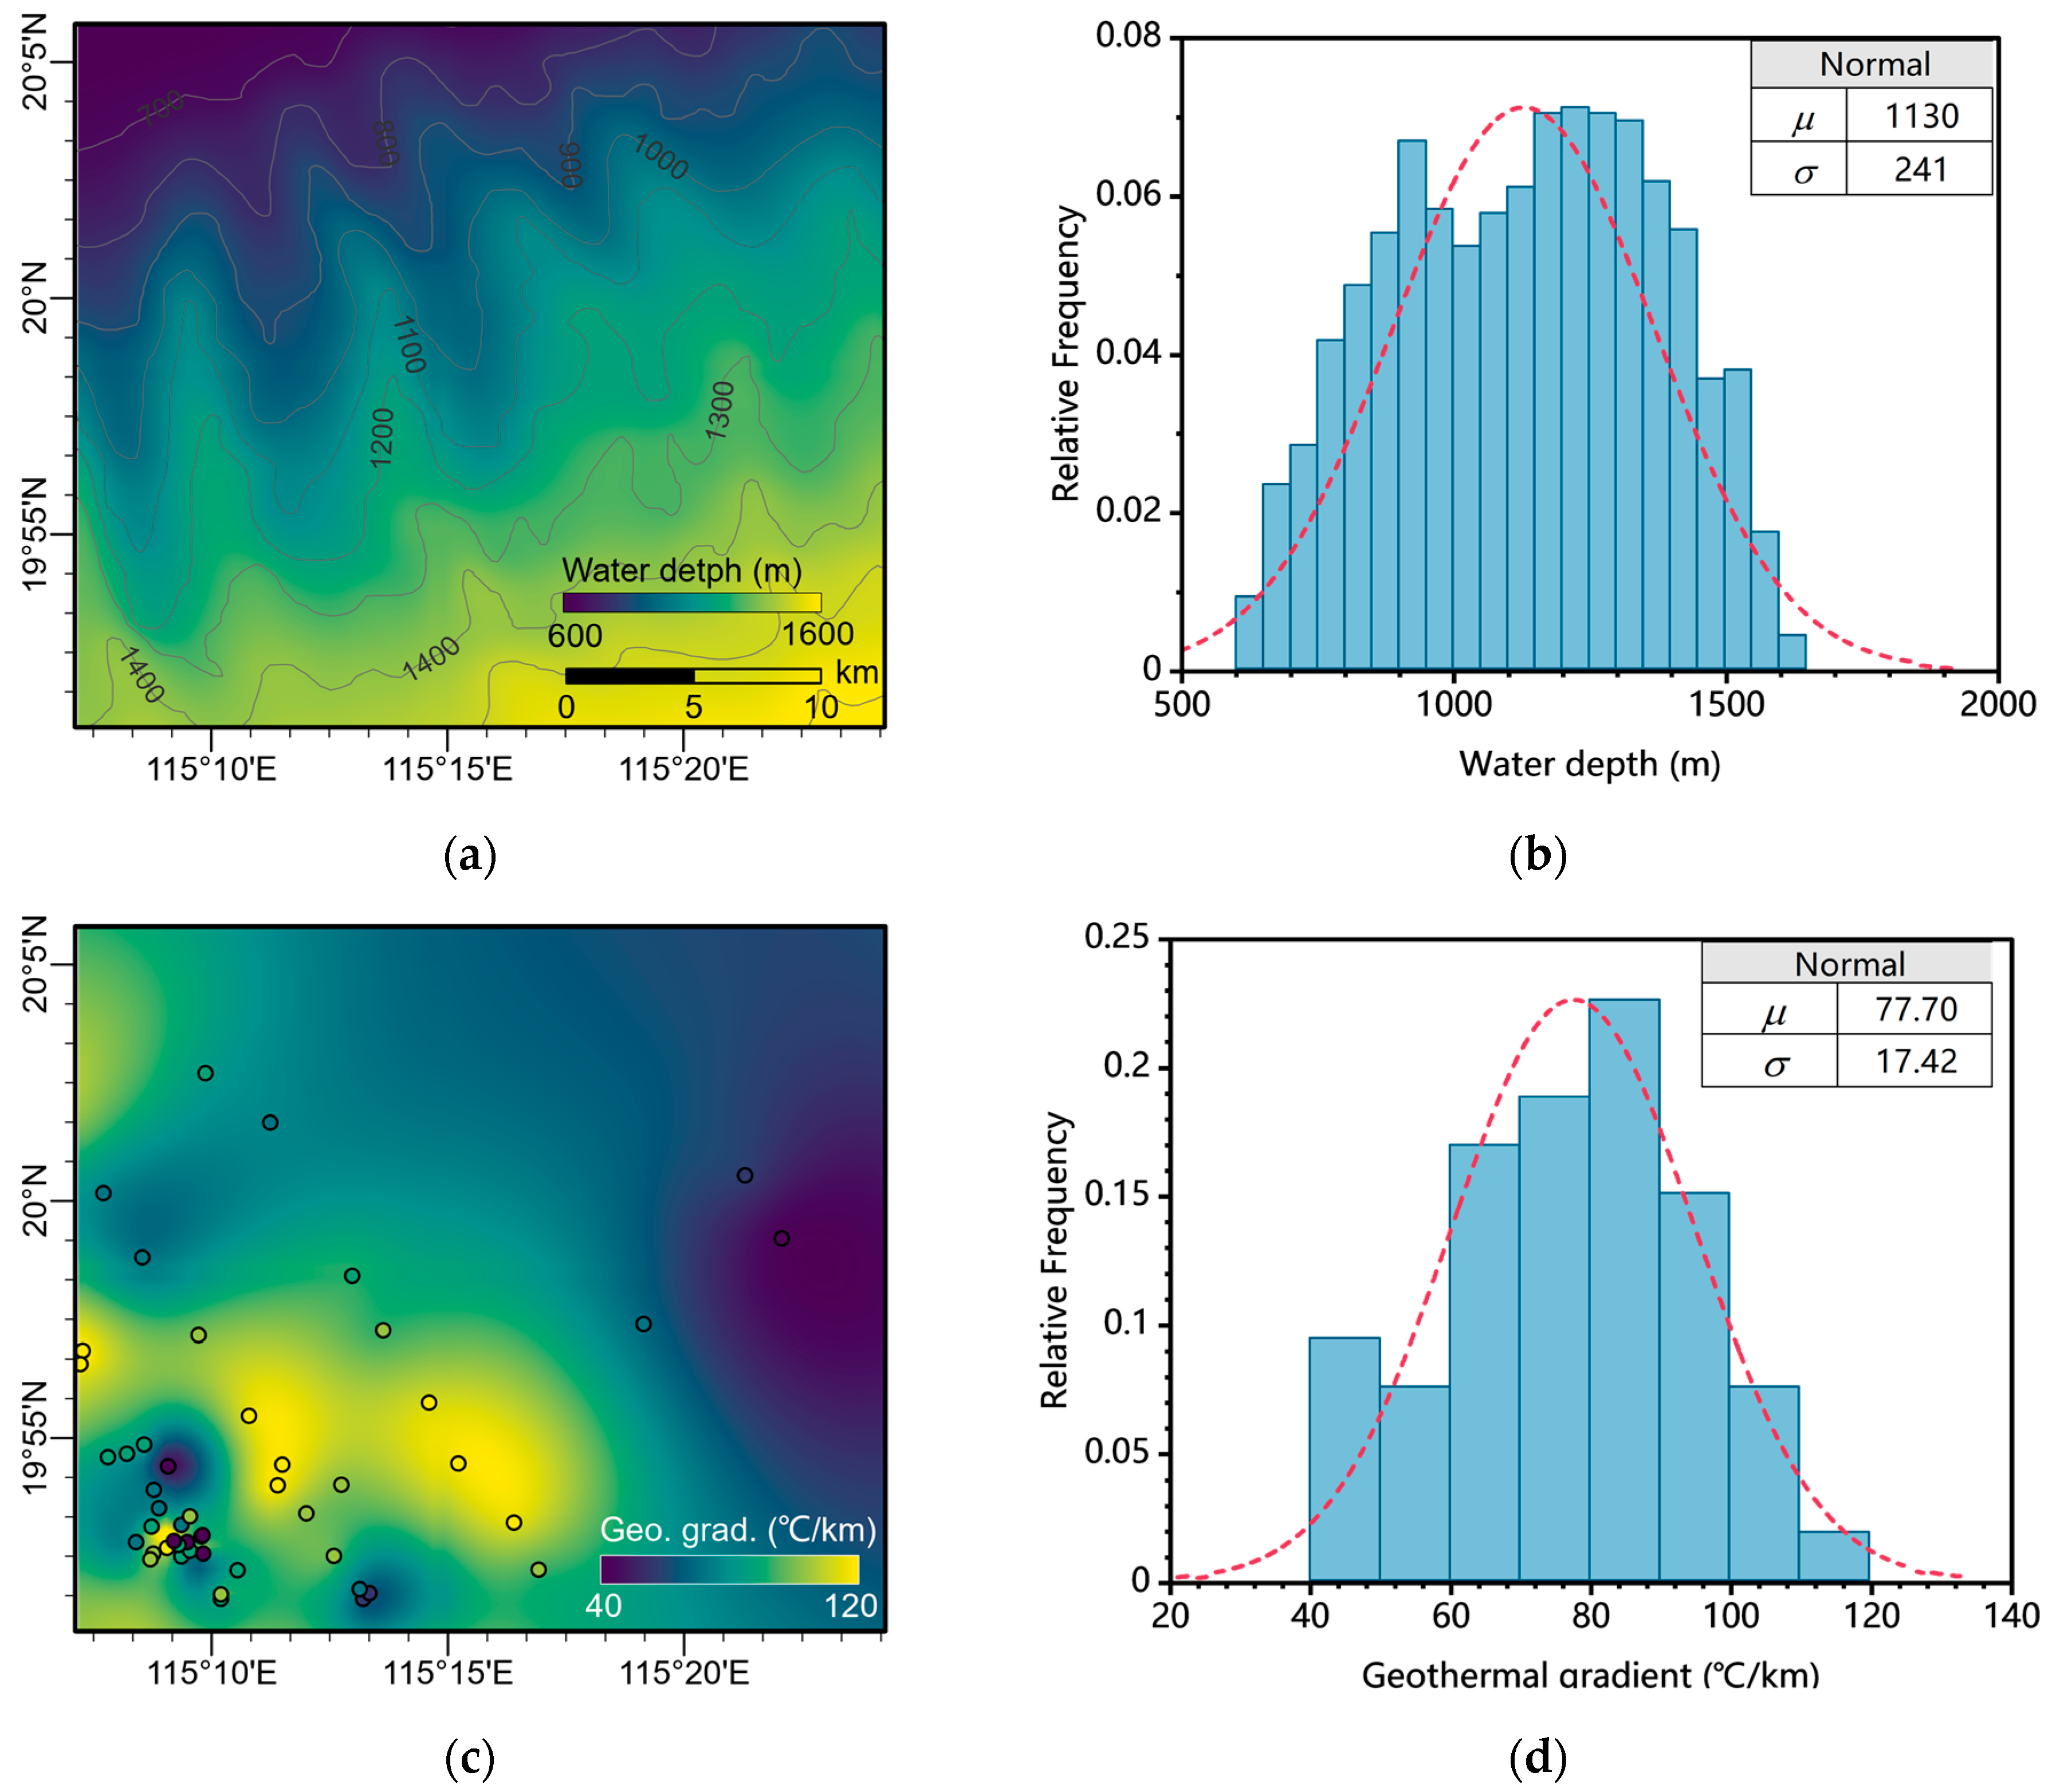
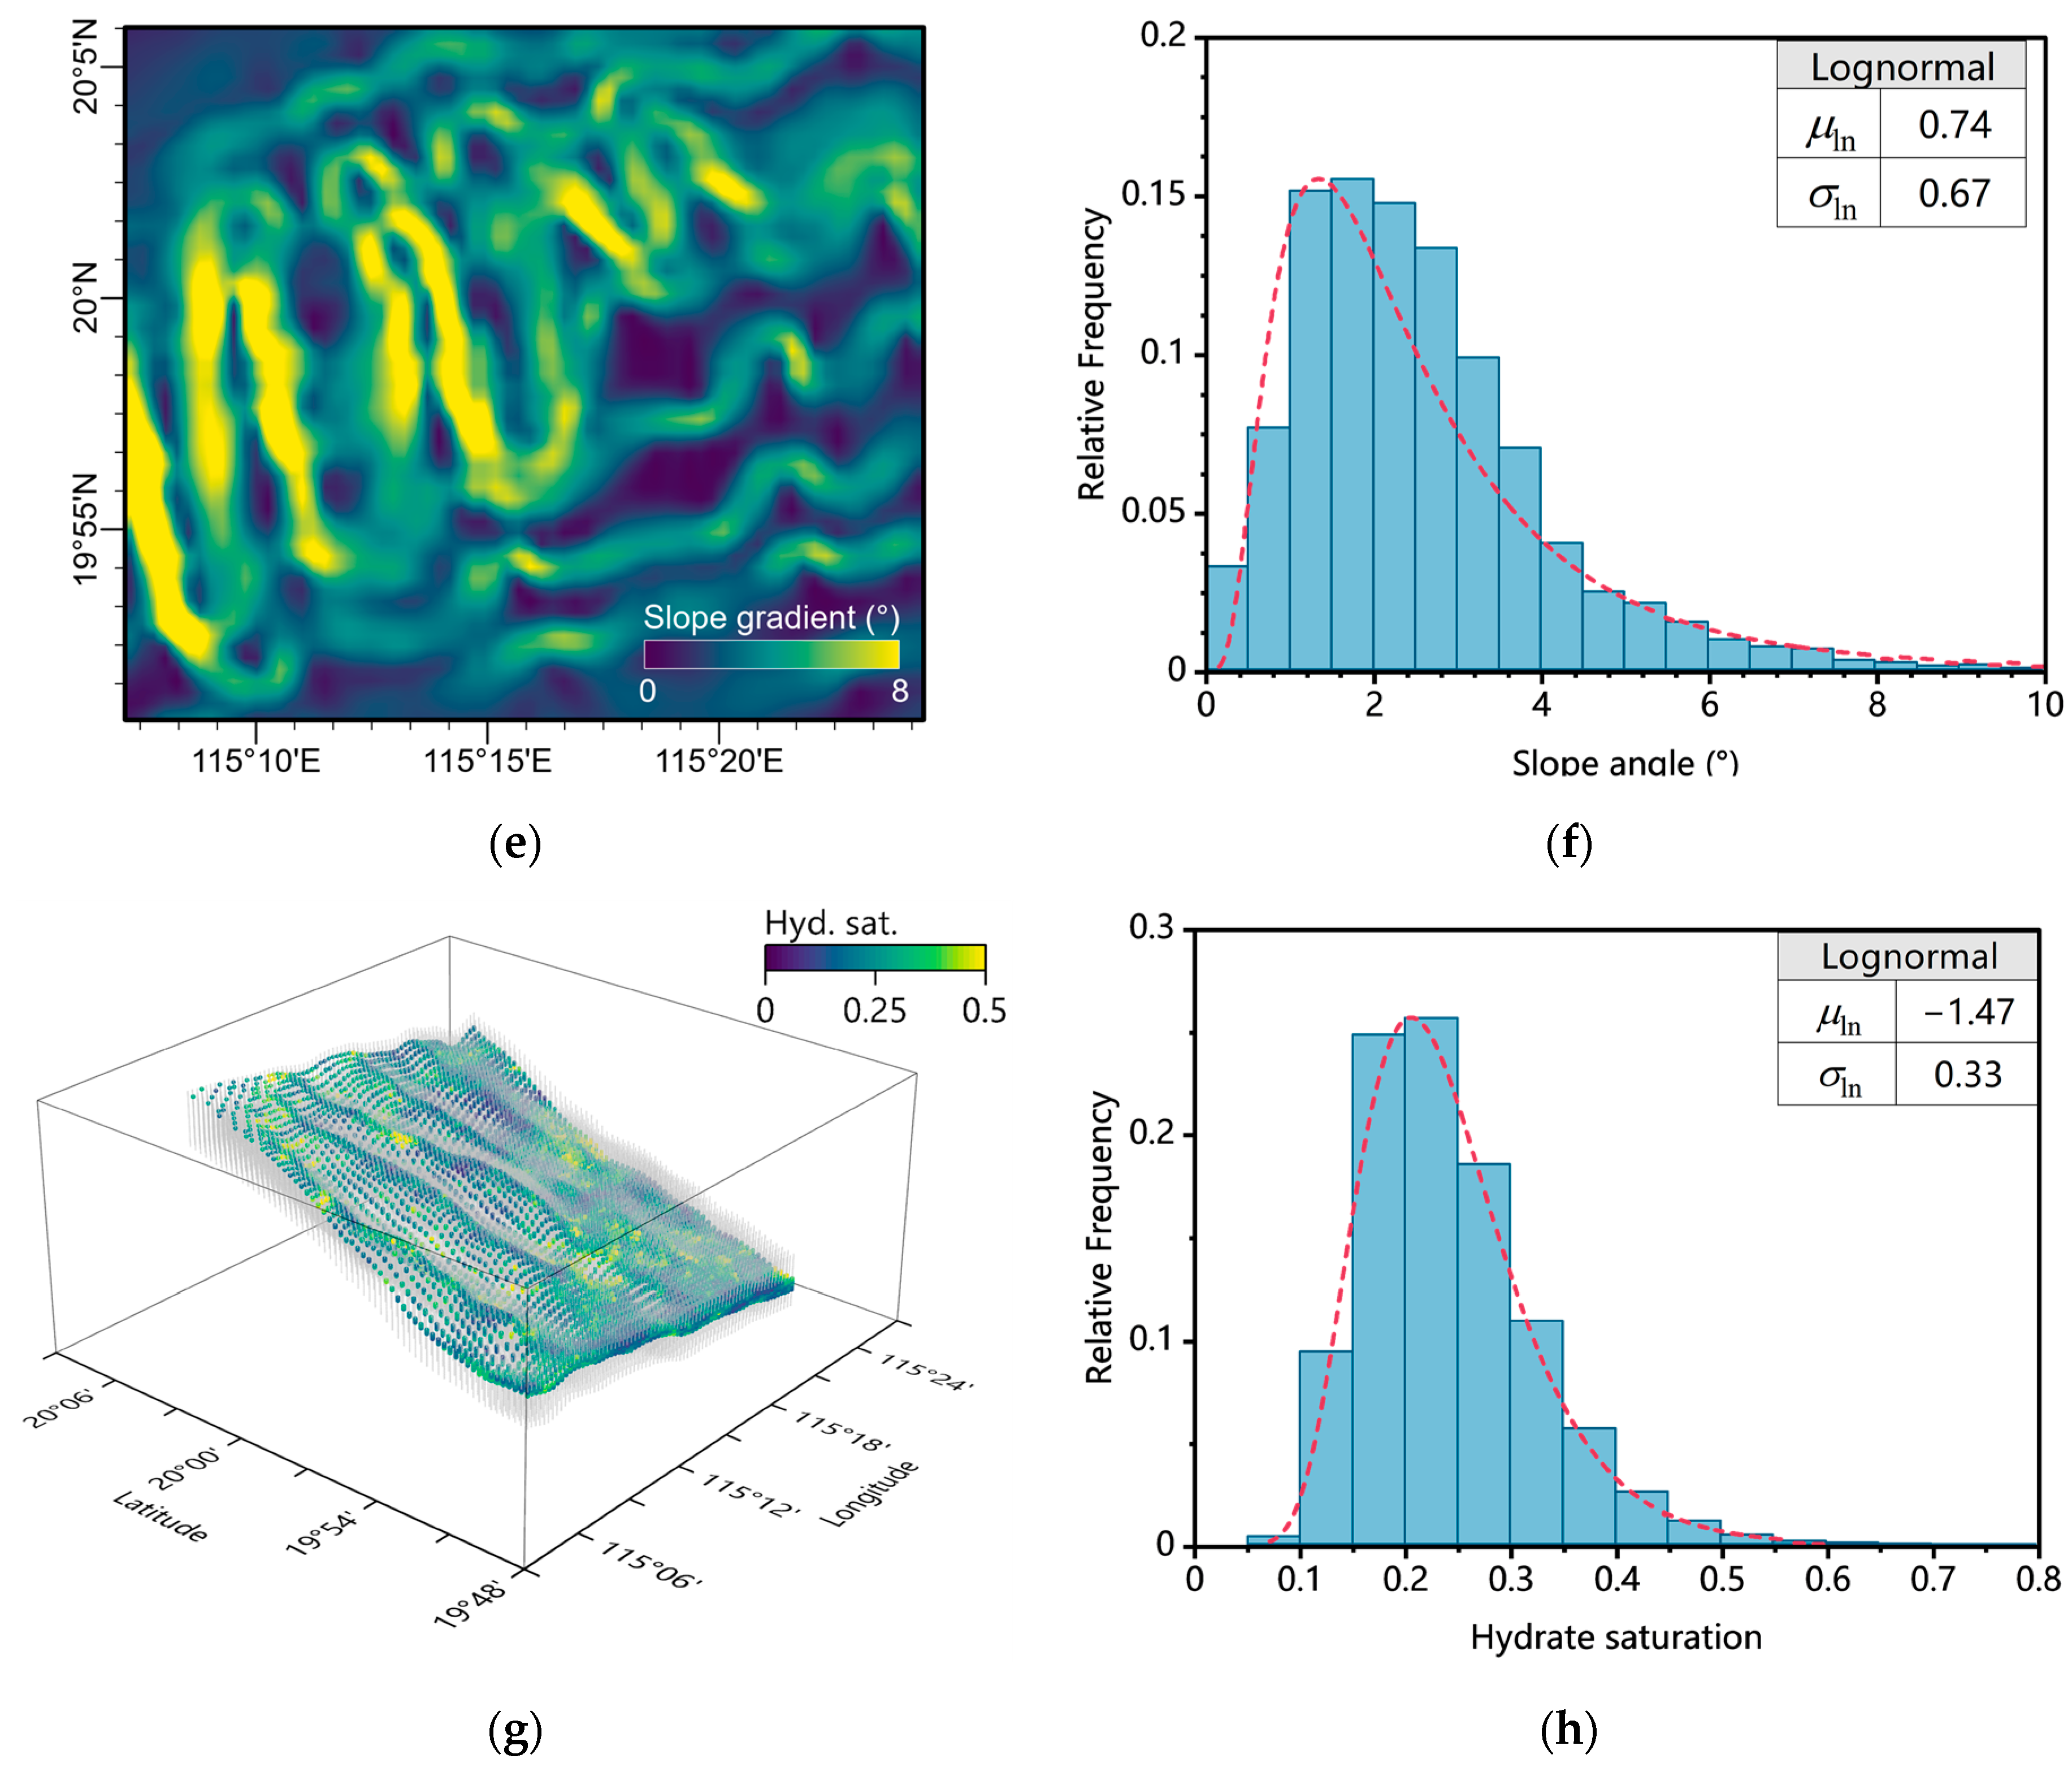
4.1. Geological Parameters
4.2. Geotechnical Properties
4.3. Landslide Susceptibility Calculation
5. Training of the Rapid Prediction Model
5.1. Accuracy of the Predicted Landslide Susceptibility
5.2. Enhanced Efficiency
5.3. Importance Analysis
6. Probabilistic Susceptibility Assessment
6.1. Monte Carlo Simulation
6.2. Statistical Analysis
6.3. Landslide Susceptibility Zonation
7. Conclusions and Discussion
Author Contributions
Funding
Institutional Review Board Statement
Informed Consent Statement
Data Availability Statement
Conflicts of Interest
References
- He, Y.; Zhong, G.; Wang, L.; Kuang, Z. Characteristics and Occurrence of Submarine Canyon-Associated Landslides in the Middle of the Northern Continental Slope, South China Sea. Mar. Petrol. Geol. 2014, 57, 546–560. [Google Scholar] [CrossRef]
- Beget, J.E.; Addison, J.A. Methane Gas Release from the Storegga Submarine Landslide Linked to EarlyHolocene Climate Change: A Speculative Hypothesis. Holocene 2007, 17, 291–295. [Google Scholar] [CrossRef]
- Hillman, J.I.T.; Klaucke, I.; Bialas, J.; Feldman, H.; Drexler, T.; Awwiller, D.; Atgin, O.; Çifçi, G.; Badhani, S. Gas Migration Pathways and Slope Failures in the Danube Fan, Black Sea. Mar. Petrol. Geol. 2018, 92, 1069–1084. [Google Scholar] [CrossRef] [Green Version]
- Hornbach, M.J.; Lavier, L.L.; Ruppel, C.D. Triggering Mechanism and Tsunamogenic Potential of the Cape Fear Slide Complex, U.S. Atlantic Margin. Geochem. Geophys. Geosystems 2007, 8, 1–16. [Google Scholar] [CrossRef] [Green Version]
- Elger, J.; Berndt, C.; Rüpke, L.; Krastel, S.; Gross, F.; Geissler, W.H. Submarine Slope Failures Due to Pipe Structure Formation. Nat. Commun. 2018, 9, 715. [Google Scholar] [CrossRef] [Green Version]
- Yang, S.; Lei, Y.; Liang, J.; Holland, M.; Schultheiss, P.; Lu, J.; Wei, J. Concentrated Gas Hydrate in the Shenhu Area, South China Sea: Results From Drilling Expeditions GMGS3 & GMGS4. In Proceedings of the 9th International Conference on Gas Hydrates, Denver, CO, USA, 25–30 June 2017. [Google Scholar]
- Swanson, R.C.; Jones, W.T. Mudslide Effects on Offshore Pipelines. Transp. Eng. J. ASCE 1982, 108, 6. [Google Scholar] [CrossRef]
- Sweeney, M.; Gasca, A.H.; Garcia-Lopez, M.; Palmer, A.C. Pipelines and Landslides in Rugged Terrain: A Database, Historic Risks and Pipeline Vulnerability. In Proceedings of the Terrain and Geohazard Challenges Facing Onshore Oil and Gas Pipelines, London, UK, 2–4 June 2004. [Google Scholar]
- Piper, D.J.W.; Cochonat, P.; Morrison, M.L. The Sequence of Events around the Epicentre of the 1929 Grand Banks Earthquake: Initiation of Debris Flows and Turbidity Current Inferred from Sidescan Sonar. Sedimentology 1999, 46, 79–97. [Google Scholar] [CrossRef]
- Piper, D.J.W.; Shor, A.N.; Farre, J.A.; O’Connell, S. Sediment Slides and Turbidity Currents on the Laurentian Fan: Sidescan Sonar Investigations near the Epicenter of Tlhe 1929 Grand Banks Earthquake. Geology 1985, 13, 538–541. [Google Scholar] [CrossRef]
- Wu, S.; Wang, D.; Völker, D. Deep-Sea Geohazards in the South China Sea. J. Ocean Univ. China 2018, 17, 1–7. [Google Scholar] [CrossRef]
- Dan, G.; Sultan, N.; Savoye, B. The 1979 Nice Harbour Catastrophe Revisited: Trigger Mechanism Inferred from Geotechnical Measurements and Numerical Modelling. Mar. Geol. 2007, 245, 40–64. [Google Scholar] [CrossRef] [Green Version]
- Melikoglu, M. Current Status and Future of Ocean Energy Sources: A Global Review. Ocean Eng. 2018, 148, 563–573. [Google Scholar] [CrossRef]
- Hance, J.J. Submarine Slope Stability; University of Texas at Austin: Austin, TX, USA, 2003. [Google Scholar]
- Xu, W.; Ruppel, C. Predicting the Occurrence, Distribution, and Evolution of Methane Gas Hydrate in Porous Marine Sediments. J. Geophys. Res. Solid Earth 1999, 104, 5081–5095. [Google Scholar] [CrossRef]
- Ketzer, M.; Praeg, D.; Rodrigues, L.F.; Augustin, A.; Pivel, M.A.G.; Rahmati-Abkenar, M.; Miller, D.J.; Viana, A.R.; Cupertino, J.A. Gas Hydrate Dissociation Linked to Contemporary Ocean Warming in the Southern Hemisphere. Nat. Commun. 2020, 11, 3788. [Google Scholar] [CrossRef] [PubMed]
- Liu, X.; Flemings, P. Dynamic Response of Oceanic Hydrates to Sea Level Drop. Geophys. Res. Lett. 2009, 36, L17308. [Google Scholar] [CrossRef] [Green Version]
- Rutqvist, J.; Moridis, G. Evaluation of Geohazards of In Situ Gas Hydrates Related to Oil and Gas Operations. Fire Ice 2010, 10, 1–4. [Google Scholar]
- Zhang, J.; Lin, H.; Wang, K. Centrifuge Modeling and Analysis of Submarine Landslides Triggered by Elevated Pore Pressure. Ocean Eng. 2015, 109, 419–429. [Google Scholar] [CrossRef]
- Zhang, X.; Lu, X. Initiation and Expansion of Layered Fracture in Sediments Due to Thermal-Induced Hydrate Dissociation. J. Pet. Sci. Eng. 2015, 133, 881–888. [Google Scholar] [CrossRef] [Green Version]
- Zhang, X.; Lu, X.; Chen, X.; Zhang, L.; Shi, Y. Mechanism of Soil Stratum Instability Induced by Hydrate Dissociation. Ocean Eng. 2016, 122, 74–83. [Google Scholar] [CrossRef] [Green Version]
- Liu, T.; Lu, Y.; Zhou, L.; Yang, X.; Guo, L. Experiment and Analysis of Submarine Landslide Model Caused by Elevated Pore Pressure. J. Mar. Sci. Eng. 2019, 7, 146. [Google Scholar] [CrossRef] [Green Version]
- Yang, L.; Wang, J.; Jiang, Y. Experimental Study and Numerical Simulation of Overlying Layer Soil Failure Caused by Hydrate Decomposition. ACS Omega 2020, 5, 31244–31253. [Google Scholar] [CrossRef]
- Liu, F.; Tan, L.; Crosta, G.; Huang, Y. Spatiotemporal Destabilization Modes of Upper Continental Slopes Undergoing Hydrate Dissociation. Eng. Geol. 2020, 264, 105286. [Google Scholar] [CrossRef]
- Li, Q.; Zhao, D.; Yin, J.; Zhou, X.; Li, Y.; Chi, P.; Han, Y.; Ansari, U.; Cheng, Y. Sediment Instability Caused by Gas Production from Hydrate-Bearing Sediment in Northern South China Sea by Horizontal Wellbore: Evolution and Mechanism. Nat. Resour. Res. 2023, 32, 1595–1620. [Google Scholar] [CrossRef]
- Jiang, M.; Sun, C.; Crosta, G.B.; Zhang, W. A Study of Submarine Steep Slope Failures Triggered by Thermal Dissociation of Methane Hydrates Using a Coupled CFD-DEM Approach. Eng. Geol. 2015, 190, 1–16. [Google Scholar] [CrossRef]
- Sun, Q.; Xie, X.; Wu, S. Submarine landslides in the northern South China Sea: Characteristics, geohazard evaluation and perspectives. Earth Sci. Front. 2021, 28, 258–270, (In Chinese with English Abstract). [Google Scholar] [CrossRef]
- Brabb, E.E. Innovative Approaches to Landslide Hazard and Risk Mapping. In Proceedings of the 4th International Symposium on Landslides, Toronto, ON, Canada, 16–21 September 1984; Volume 1, pp. 307–324. [Google Scholar]
- Frattini, P.; Crosta, G.; Carrara, A.; Agliardi, F. Assessment of Rockfall Susceptibility by Integrating Statistical and Physically-Based Approaches. Geomorphology 2008, 94, 419–437. [Google Scholar] [CrossRef]
- Carrara, A.; Cardinali, M.; Detti, R.; Guzzetti, F.; Pasqui, V.; Reichenbach, P. GIS Techniques and Statistical Models in Evaluating Landslide Hazard. Earth Surf. Process. Landf. 1991, 16, 427–445. [Google Scholar] [CrossRef]
- Remondo, J.; Bonachea, J.; Cendrero, A. A Statistical Approach to Landslide Risk Modelling at Basin Scale: From Landslide Susceptibility to Quantitative Risk Assessment. Landslides 2005, 2, 321–328. [Google Scholar] [CrossRef]
- Crosta, G.B.; Frattini, P. Distributed Modelling of Shallow Landslides Triggered by Intense Rainfall. Nat. Hazards Earth Syst. Sci. 2003, 3, 81–93. [Google Scholar] [CrossRef] [Green Version]
- Park, H.J.; Lee, J.H.; Woo, I. Assessment of Rainfall-Induced Shallow Landslide Susceptibility Using a GIS-Based Probabilistic Approach. Eng. Geol. 2013, 161, 1–15. [Google Scholar] [CrossRef]
- Chen, H.; Zhang, L. A Physically-Based Distributed Cell Model for Predicting Regional Rainfall-Induced Shallow Slope Failures. Eng. Geol. 2014, 176, 79–92. [Google Scholar] [CrossRef]
- Nian, T.; Guo, X.; Zheng, D.; Xiu, Z.; Jiang, Z. Susceptibility Assessment of Regional Submarine Landslides Triggered by Seismic Actions. Appl. Ocean Res. 2019, 93, 101964. [Google Scholar] [CrossRef]
- Guo, X.; Zheng, D.; Nian, T.; Lv, L. Large-Scale Seafloor Stability Evaluation of the Northern Continental Slope of South China Sea. Mar. Georesour. Geotechnol. 2020, 37, 804–817. [Google Scholar] [CrossRef]
- Wang, Y.; Wang, R.; Zhang, J. Large-Scale Seismic Seafloor Stability Analysis in the South China Sea. Ocean Eng. 2021, 235, 109334. [Google Scholar] [CrossRef]
- Jin, J.; Wang, X.; Guo, Y.; Li, J.; Li, Y.; Zhang, X.; Qian, J.; Sun, L. Geological Controls on the Occurrence of Recently Formed Highly Concentrated Gas Hydrate Accumulations in the Shenhu Area, South China Sea. Mar. Pet. Geol. 2020, 116, 104294. [Google Scholar] [CrossRef]
- Zhang, W.; Liang, J.; Wei, J.; Lu, J.; Su, P.; Lin, L.; Huang, W.; Guo, Y.; Deng, W.; Yang, X.; et al. Geological and Geophysical Features of and Controls on Occurrence and Accumulation of Gas Hydrates in the First Offshore Gas-Hydrate Production Test Region in the Shenhu Area, Northern South China Sea. Mar. Pet. Geol. 2020, 114, 104191. [Google Scholar] [CrossRef]
- Zhou, G.; Esaki, T.; Mitani, Y.; Xie, M.; Mori, J. Spatial Probabilistic Modeling of Slope Failure Using an Integrated GIS Monte Carlo Simulation Approach. Eng. Geol. 2003, 68, 373–386. [Google Scholar] [CrossRef]
- Carol, J.; Rodney, H.; Prellwitz, W.; Miller, S.M. Landslide Hazard Assessment Using Monte Carlo Simulation. In Proceedings of the Sixth International Symposium, Christchurch, New Zealand, 10–14 February 1992. [Google Scholar]
- Jibson, R.W.; Harp, E.L.; Michael, J.A. A Method for Producing Digital Probabilistic Seismic Landslide Hazard Maps: An Example from the Los Angeles, California, Area; US Department of the Interior, US Geological Survey: Washington, DC, USA, 1998. [Google Scholar] [CrossRef] [Green Version]
- Kimoto, S.; Oka, F.; Fushita, T. A Chemo-Thermo-Mechanically Coupled Analysis of Ground Deformation Induced by Gas Hydrate Dissociation. Int. J. Mech. Sci. 2010, 52, 365–376. [Google Scholar] [CrossRef]
- De La Fuente, M.; Vaunat, J.; Marín-Moreno, H. Thermo-Hydro-Mechanical Coupled Modeling of Methane Hydrate-Bearing Sediments: Formulation and Application. Energies 2019, 12, 2178. [Google Scholar] [CrossRef] [Green Version]
- Liu, X.; Qu, Z.; Guo, T.; Sun, Y.; Rabiei, M.; Liao, H. A Coupled Thermo-Hydrologic-Mechanical (THM) Model to Study the Impact of Hydrate Phase Transition on Reservoir Damage. Energy 2021, 216, 119222. [Google Scholar] [CrossRef]
- Song, Y.; Zhu, Y.; Liu, W.; Zhao, J.; Li, Y.; Chen, Y.; Shen, Z.; Lu, Y.; Ji, C. Experimental Research on the Mechanical Properties of Methane Hydrate-Bearing Sediments during Hydrate Dissociation. Mar. Pet. Geol. 2014, 51, 70–78. [Google Scholar] [CrossRef]
- Gao, Y.; Chen, Y.; Chen, L.; Ji, G.; Wang, K.; Sun, B. Experimental Investigation on the Permeability of a Hydrate-Bearing Reservoir Considering Overburden Pressure. Fuel 2019, 246, 308–318. [Google Scholar] [CrossRef]
- Hou, J.; Ji, Y.; Zhou, K.; Liu, Y.; Wei, B. Effect of Hydrate on Permeability in Porous Media: Pore-Scale Micro-Simulation. Int. J. Heat Mass. Trans. 2018, 126, 416–424. [Google Scholar] [CrossRef]
- Wang, Y.; Feng, J.-C.; Li, X.-S. Experimental Investigation into Methane Hydrate Dissociation by Thermal Stimulation with Dual Vertical Well. Energy Procedia 2017, 105, 4738–4744. [Google Scholar] [CrossRef]
- Lei, G.; Liao, Q.; Zhang, D.; Patil, S. A Mechanistic Model for Permeability in Deformable Gas Hydrate-Bearing Sediments. J. Nat. Gas. Sci. Eng. 2020, 83, 103554. [Google Scholar] [CrossRef]
- Zhou, M.; Shadabfar, M.; Huang, H.; Leung, Y.F.; Uchida, S. Meta-Modelling of Coupled Thermo-Hydro-Mechanical Behaviour of Hydrate Reservoir. Comput. Geotech. 2020, 128, 103848. [Google Scholar] [CrossRef]
- Vikara, D.; Remson, D.; Khanna, V. Machine Learning-Informed Ensemble Framework for Evaluating Shale Gas Production Potential: Case Study in the Marcellus Shale. J. Nat. Gas Sci. Eng. 2020, 84, 103679. [Google Scholar] [CrossRef]
- Sinha, S.; de Lima, R.P.; Lin, Y.; Sun, A.Y.; Symons, N.; Pawar, R.; Guthrie, G. Normal or Abnormal? Machine Learning for the Leakage Detection in Carbon Sequestration Projects Using Pressure Field Data. Int. J. Greenh. Gas Control 2020, 103, 103189. [Google Scholar] [CrossRef]
- Liang, Y.; Zhao, P. A Machine Learning Analysis Based on Big Data for Eagle Ford Shale Formation. In Proceedings of the SPE Annual Technical Conference and Exhibition, Calgary, AB, Canada, 23 September 2019; p. D021S020R001. [Google Scholar]
- Dhini, A.; Faqih, A.; Kusumoputro, B.; Surjandari, I.; Kusiak, A. Data-Driven Fault Diagnosis of Power Transformers Using Dissolved Gas Analysis (DGA). Int. J. Technol. 2020, 11, 388. [Google Scholar] [CrossRef] [Green Version]
- Tan, L.; Liu, F.; Crosta, G.; Frattini, P.; Jiang, M. A Simple THC Coupled Model for Assessing Stability of a Submarine Infinite Slope with Methane Hydrates. In Proceedings of the GeoShanghai 2018 International Conference: Geoenvironment and Geohazard; Farid, A., Chen, H., Eds.; Springer: Singapore, 2018; pp. 28–36. ISBN 9789811301278. [Google Scholar]
- Kwon, T.-H.; Cho, G.-C. Submarine Slope Failure Primed and Triggered by Bottom Water Warming in Oceanic Hydrate-Bearing Deposits. Energies 2012, 5, 2849–2873. [Google Scholar] [CrossRef] [Green Version]
- Lizárraga, J.J.; Buscarnera, G.; Frattini, P.; Crosta, G.B. Spatially Distributed Modeling of Landslide Triggering: An Approach Based on Principles of Unsaturated Soil Plasticity. In Landslides and Engineered Slopes. Experience, Theory and Practice; Aversa, S., Cascini, L., Picarelli, L., Scavia, C., Eds.; CRC Press: Boca Raton, FL, USA, 2018; pp. 1287–1294. ISBN 978-1-315-37500-7. [Google Scholar]
- Moridis, G.J. User’s Manual for the HYDRATE v1.5 Option of TOUGH+ v1.5: A Code for the Simulation of System Behavior in Hydrate-Bearing Geologic Media; Lawrence Berkeley National Lab.: Berkeley, CA, USA, 2014. [Google Scholar]
- Zhang, P.; Zhang, Y.; Zhang, W.; Tian, S. Numerical Simulation of Gas Production from Natural Gas Hydrate Deposits with Multi-Branch Wells: Influence of Reservoir Properties. Energy 2022, 238, 121738. [Google Scholar] [CrossRef]
- Ning, F.; Chen, Q.; Sun, J.; Wu, X.; Cui, G.; Mao, P.; Li, Y.; Liu, T.; Jiang, G.; Wu, N. Enhanced Gas Production of Silty Clay Hydrate Reservoirs Using Multilateral Wells and Reservoir Reformation Techniques: Numerical Simulations. Energy 2022, 254, 124220. [Google Scholar] [CrossRef]
- Mao, P.; Wu, N.; Wan, Y.; Ning, F.; Sun, J.; Wang, X.; Hu, G. Gas Recovery Enhancement from Fine-Grained Hydrate Reservoirs through Positive Inter-Branch Interference and Optimized Spiral Multilateral Well Network. J. Nat. Gas Sci. Eng. 2022, 107, 104771. [Google Scholar] [CrossRef]
- Masui, A.; Haneda, H.; Ogata, Y.; Aoki, K. Institute Effects of Methane Hydrate Formation on Shear Strength of Synthetic Methane Hydrate Sediments. In Proceedings of the Fifteenth International Offshore and Polar Engineering Conference, Seoul, Republic of Korea, 19–24 June 2005; pp. 364–369. [Google Scholar]
- Chen, T.; Guestrin, C. XGBoost: A Scalable Tree Boosting System. In Proceedings of the 22nd ACM SIGKDD International Conference on Knowledge Discovery and Data Mining, San Francisco, CA, USA, 13 August 2016; pp. 785–794. [Google Scholar]
- Friedman, J.H. Greedy Function Approximation: A Gradient Boosting Machine. Ann. Stat. 2001, 29, 1189–1232. [Google Scholar] [CrossRef]
- Gumus, M.; Kiran, M.S. Crude Oil Price Forecasting Using XGBoost. In Proceedings of the 2017 International Conference on Computer Science and Engineering (UBMK), Antalya, Turkey, 5–8 October 2017; pp. 1100–1103. [Google Scholar]
- Wang, L.; Li, Y.; Wu, P.; Shen, S.; Liu, T.; Leng, S.; Chang, Y.; Zhao, J. Physical and Mechanical Properties of the Overburden Layer on Gas Hydrate-Bearing Sediments of the South China Sea. J. Pet. Sci. Eng. 2020, 189, 107020. [Google Scholar] [CrossRef]
- Kuang, Y.; Yang, L.; Li, Q.; Lv, X.; Li, Y.; Yu, B.; Leng, S.; Song, Y.; Zhao, J. Physical Characteristic Analysis of Unconsolidated Sediments Containing Gas Hydrate Recovered from the Shenhu Area of the South China Sea. J. Pet. Sci. Eng. 2019, 181, 106173. [Google Scholar] [CrossRef]
- Wan, Z.-F.; Zhang, W.; Ma, C.; Liang, J.-Q.; Li, A.; Meng, D.-J.; Huang, W.; Yang, C.-Z.; Zhang, J.-F.; Sun, Y.-F. Dissociation of Gas Hydrates by Hydrocarbon Migration and Accumulation-Derived Slope Failures: An Example from the South China Sea. Geosci. Front. 2022, 13, 101345. [Google Scholar] [CrossRef]
- Sun, Q.; Wu, S.; Cartwright, J.; Dong, D. Shallow Gas and Focused Fluid Flow Systems in the Pearl River Mouth Basin, Northern South China Sea. Mar. Geol. 2012, 315, 1–14. [Google Scholar] [CrossRef]
- Su, M.; Alves, T.M.; Li, W.; Sha, Z.; Hsiung, K.H.; Liang, J.; Kuang, Z.; Wu, N.; Zhang, B.; Chiang, C.S. Reassessing Two Contrasting Late Miocene-Holocene Stratigraphic Frameworks for the Pearl River Mouth Basin, Northern South China Sea. Mar. Pet. Geol. 2019, 102, 899–913. [Google Scholar] [CrossRef]
- Nissen, S.S.; Hayes, D.E.; Bochu, Y.; Weijun, Z.; Yongqin, C. Nu Xiaupin Gravity, Heat Flow, and Seismic Constraints on the Processes of Crustal Extension: Northern Margin of the South China Sea. J. Geophys. Res. 1995, 100, 22447–22483. [Google Scholar] [CrossRef]
- Shyu, C.T.; Chen, Y.; Chiang, S.T.; Liu, C. Heat Flow Measurements over Bottom Simulating Reflectors, Offshore Southwestern Taiwan. TAO Terr. Atmos. Ocean. Sci. 2006, 17, 845–869. [Google Scholar] [CrossRef] [Green Version]
- Shyu, C.; Hsu, S.; Liu, C. Heat Flows off Southwest Taiwan: Measurements over Mud Diapirs and Estimated from Bottom Simulating Reflectors. TAO Terr. Atmos. Ocean. Sci. 1998, 9, 795–812. [Google Scholar] [CrossRef]
- Xu, X.; Shi, X.; Luo, X.; Liu, F.; Guo, X.; Sha, Z.; Yang, X. Heat Flow Measurements in the Xisha Trough of the South China Sea. Mar. Geol. Quat. Geol. 2006, 26, 51–58. [Google Scholar]
- Xu, X.; Wan, Z.; Wang, X.; Sun, Y.; Xia, B. The Characteristics of Heat Flow in the Shenhu Gas Hydrate Drilling Area, Northern South China Sea. Mar. Geophys. Res. 2016, 37, 325–335. [Google Scholar] [CrossRef]
- Mi, L.; Yuan, Y.; Zhang, G.; Hu, S.; He, L.; Yang, S. Characteristics and Genesis of Geothermal Field in Deep-Water Area of the Northern South China Sea. Acta Pet. Sin. 2009, 30, 27–32. [Google Scholar] [CrossRef]
- Dong, M.; Zhang, J.; Xu, X.; Wu, S. The Differences between the Measured Heat Flow and BSR Heat Flow in the Shenhu Gas Hydrate Drilling Area, Northern South China Sea. Energy Explor. Exploit. 2019, 37, 756–769. [Google Scholar] [CrossRef]
- Li, L.; Lei, X.; Zhang, X.; Zhang, G. Heat Flow Derived from BSR and Its Implications for Gas Hydrate Stability Zone in Shenhu Area of Northern South China Sea. Mar. Geophys. Res. 2012, 33, 77–87. [Google Scholar] [CrossRef]
- Zhang, H.; Yang, S.; Wu, N.; Su, X.; Holland, M.; Schultheiss, P.; Rose, K.; Butler, H.; Humphrey, G. Successful and Surprising Results for China’s First Gas Hydrate Drilling Expedition. Fire Ice 2007, 7, 6–9. [Google Scholar]
- Shengxiong, Y.; Ming, Z.; Jinqiang, L.; Jingan, L.; Zijian, Z.; Holland, M.; Schultheiss, P.; Shaoying, F.; Zhibin, S. Preliminary Results of China’s Third Gas Hydrate Drilling Expedition: A Critical Step From Discovery to Development in the South China Sea. J. Oceanol. Limnol. 2023, 41, 694–709. [Google Scholar]
- Ye, J.; Qin, X.; Xie, W.; Lu, H.; Ma, B.; Qiu, H.; Liang, J.; Lu, J.; Kuang, Z.; Lu, C.; et al. The Second Natural Gas Hydrate Production Test in the South China Sea. China Geol. 2020, 3, 197–209. [Google Scholar] [CrossRef]
- Yang, S.; Liang, J.; Lei, Y.; Gong, Y.; Xu, H.; Wang, H.; Lu, J.; Holland, M.; Schultheiss, P.; Wei, J. GMGS4 Gas Hydrate Drilling Expedition in the South China Sea. Fire Ice 2017, 17, 7–11. [Google Scholar]
- Wang, L.; Li, Y.; Shen, S.; Liu, W.; Sun, X.; Liu, Y.; Zhao, J. Mechanical Behaviours of Gas-Hydrate-Bearing Clayey Sediments of the South China Sea. Environ. Geotech. 2021, 9, 210–222. [Google Scholar] [CrossRef]
- Tan, L.; Liu, F.; Huang, Y.; Crosta, G.; Frattini, P.; Cen, X. Production-Induced Instability of a Gentle Submarine Slope: Potential Impact of Gas Hydrate Exploitation with the Huff-Puff Method. Eng. Geol. 2021, 289, 106174. [Google Scholar] [CrossRef]
- Zhang, W.; Wang, D.; Randolph, M.; Puzrin, A.M. Catastrophic Failure in Planar Landslides with a Fully Softened Weak Zone. Geotechnique 2015, 65, 755–769. [Google Scholar] [CrossRef] [Green Version]


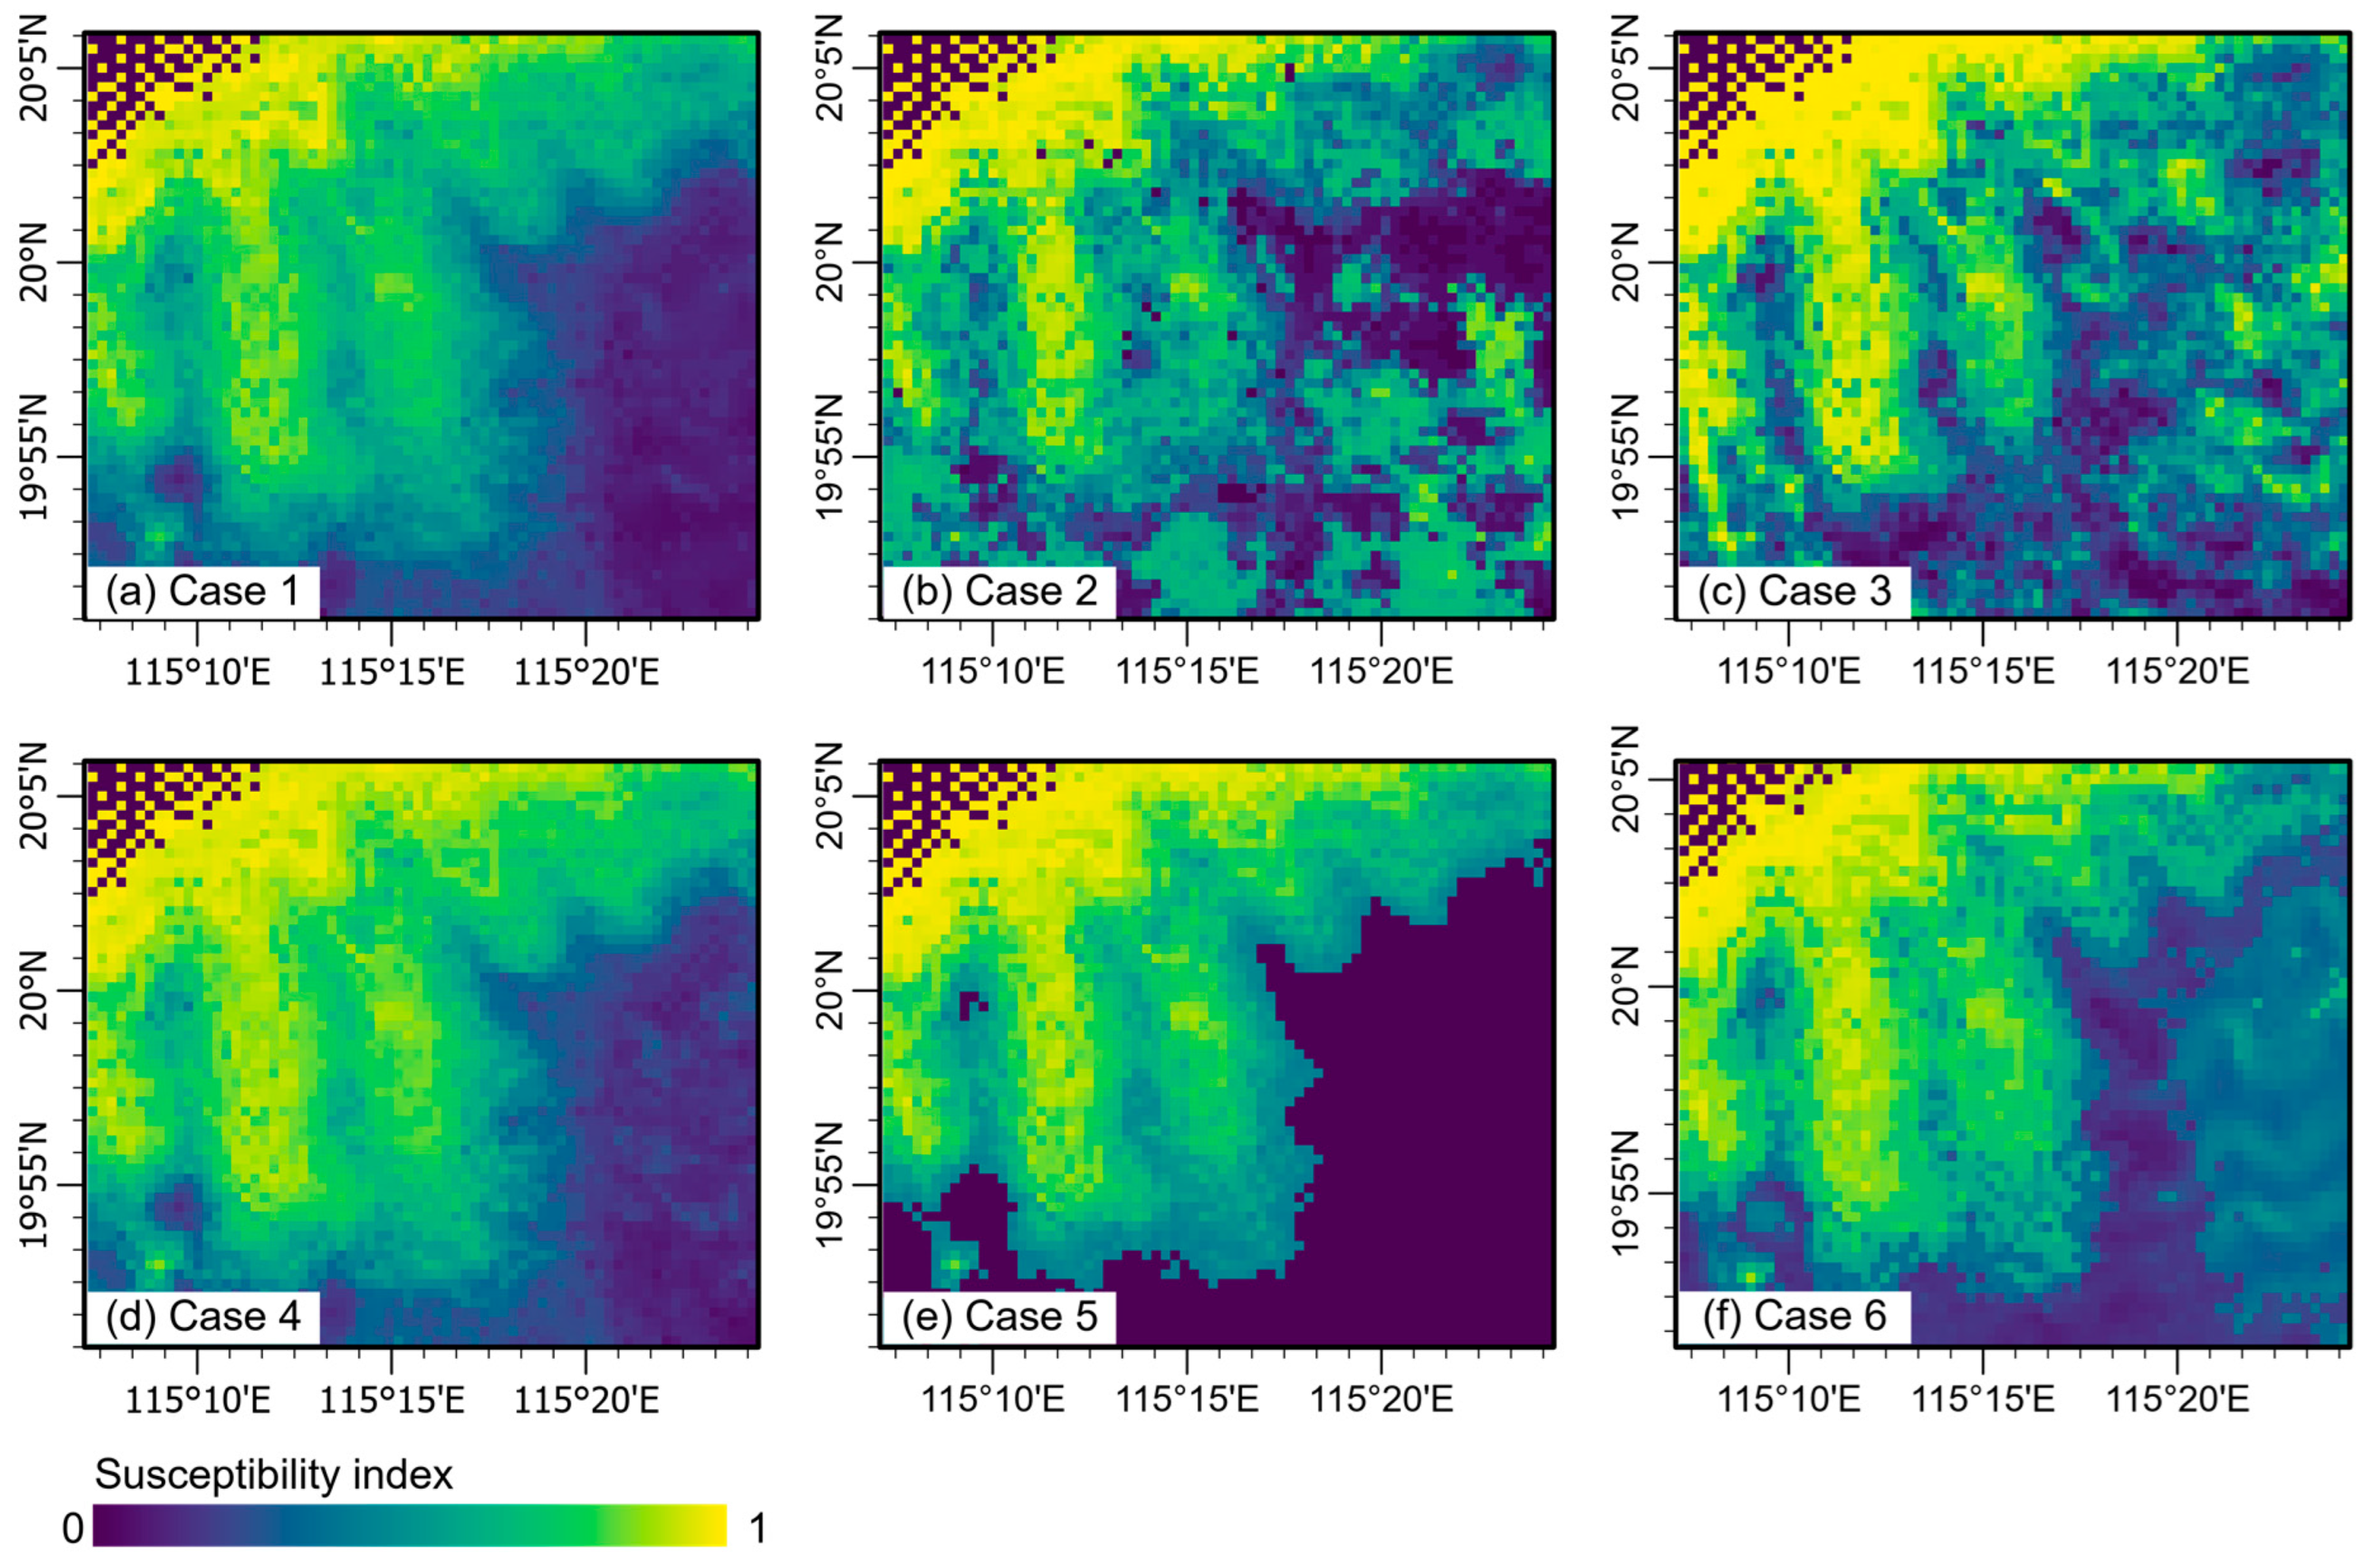
| Cases | Water Depth | Geothermal Gradient | Slope Gradient | Hydrate Saturation | Permeability | Cohesion | Temperature Increase Rate |
|---|---|---|---|---|---|---|---|
| Case1 | Figure 3a | Figure 3c | Figure 3e | Figure 3g | 1 × 10⁻¹⁹ m2 | 35 kPa | 3 °C/century |
| Case2 | Figure 5a | 35 kPa | 3 °C/century | ||||
| Case3 | 1 × 10⁻¹⁹ m2 | Figure 5c | 3 °C/century | ||||
| Case4 | 1 × 10⁻¹⁹ m2 | Figure 5e | 3 °C/century | ||||
| Case5 | 1 × 10⁻¹⁹ m2 | 35 kPa | 1 °C/century | ||||
| Case6 | 1 × 10⁻¹⁹ m2 | 35 kPa | 5 °C/century |
| Parameters | Error Range |
|---|---|
| Water depth (m) | [−50, 50] |
| Slope angle (°) | [−0.1, 0.1] |
| Geothermal gradient (°C/km) | [−1, 1] |
| Hydrate saturation | [−0.05, 0.05] |
| Logarithmic permeability | [−0.5, 0.5] |
| Cohesion (kPa) | [−2, 2] |
| Temperature increase rate (°C/century) | [−0.1, 0.1] |
Disclaimer/Publisher’s Note: The statements, opinions and data contained in all publications are solely those of the individual author(s) and contributor(s) and not of MDPI and/or the editor(s). MDPI and/or the editor(s) disclaim responsibility for any injury to people or property resulting from any ideas, methods, instructions or products referred to in the content. |
© 2023 by the authors. Licensee MDPI, Basel, Switzerland. This article is an open access article distributed under the terms and conditions of the Creative Commons Attribution (CC BY) license (https://creativecommons.org/licenses/by/4.0/).
Share and Cite
Tan, L.; Zhou, M.; Wang, F. A Probabilistic Assessment Framework for Submarine Landslide Susceptibility in Continental Slopes with Rich Gas Hydrates. J. Mar. Sci. Eng. 2023, 11, 1366. https://doi.org/10.3390/jmse11071366
Tan L, Zhou M, Wang F. A Probabilistic Assessment Framework for Submarine Landslide Susceptibility in Continental Slopes with Rich Gas Hydrates. Journal of Marine Science and Engineering. 2023; 11(7):1366. https://doi.org/10.3390/jmse11071366
Chicago/Turabian StyleTan, Lin, Mingliang Zhou, and Feiyang Wang. 2023. "A Probabilistic Assessment Framework for Submarine Landslide Susceptibility in Continental Slopes with Rich Gas Hydrates" Journal of Marine Science and Engineering 11, no. 7: 1366. https://doi.org/10.3390/jmse11071366