Abstract
Floating offshore wind platform (FOWP) has become the economically favored option for supporting wind turbines in deep waters. It is urgent to propose new concept designs for FOWPs that can be effectively deployed. Additionally, the extensive use of steel in such platforms significantly escalates costs, necessitating the optimization of steel utilization. Motivated by these challenges, a V-shaped floating semi-submersible platform equipped with NREL 5 MW wind turbine is designed and analyzed based on the potential flow theory and the blade element momentum theory. Fully coupled time-domain simulations are conducted using the F2A program, which couples NREL FAST and ANSYS AQWA via a Dynamic Link Library (DLL), to compare the hydrodynamic performance and stability of the V-shaped floating platform with the original triangle-shaped model of “Fuyao”. Various sea conditions have been considered, including combined wind-wave action and wind-wave-current action at different incidence angles. The results show that the V-shaped floating platform has better economic and hydrodynamic performance (e.g., a reduction of 40.4% and 12.9%, respectively, in pitch and yaw motions, and a 17.4% reduction in maximum mooring tension), but lower stability than its triangle-shaped counterpart.
1. Introduction
Currently, there is a significant global energy shortage and a pertinent issue of severe environmental pollution. While traditional fossil fuels could offer significant economic benefits, the resulting environmental damage is also immeasurable. In order to relieve the tension between the supply and demand for traditional fossil fuels and to deal with the energy crisis and serious environmental problems, researchers have proposed the concept of floating wind turbines to capture the abundant wind resources offshore. Floating offshore wind turbines (FOWTs) have been laid out in the late last century and flourish at the beginning of this century. In 2003, a group of researchers from the Dutch University of Delft came up with various forms of FOWT concept, such as a round platform “pill-box,” a triangular platform “triple float” and a quadrilateral platform “Quadruple float”. After feasibility demonstration, the triangular form is considered to be the best solution for floating offshore wind platform (FOWP) [1]. Later, researchers from various countries, including the United States, Japan, and Norway, propose various designs for FOWPs, such as Spar, TLP (Tension-Leg Platform), and semi-submersible platforms [2,3,4,5]. It is found that the natural period of these forms lies beyond the typical range of wave energy (4–16 s in wave period), which enables good motion performance. So far, China has installed two large-scale floating wind turbines namely “Three Gorges Pioneer” and “Fuyao”. They are known for their considerably large capacity of 5–6 MW and strong resistance to typhoons.
Recently, researchers have put forward a variety of novel concept designs for FOWPs. Uzunoglu et al. [6] developed a free-float TLP floating wind turbine, known as the CENTEC-TLP (Figure 1a), which incorporates a barge-TLP hybrid structure to optimize transportation and installation costs. The platform’s dynamic behavior under extreme sea conditions with a return period of 50 years was thoroughly investigated, which satisfies the requisite criteria and performance standards. Zhang et al. [7] developed a fully submersible FOWP with inclined side columns (Figure 1b), which combines the structural characteristics of semi-submersible and Spar platforms. A comprehensive numerical model, considering the fully coupled aerodynamic–hydrodynamic-mooring effects, was established using OpenFAST and AQWA. Comparative analysis with traditional semi-submersible and Spar platforms revealed that the proposed floating platform could greatly optimize hydrodynamic performance and exhibit enhanced recovery capability subjected to external loads. Cutler et al. [8] presented a preliminary design of a catamaran FOWP (Figure 1c). The numerical assessment of its dynamic characteristics showed that the catamaran concept had significantly reduced responses (22% and 7% reduction in F-A tower-base bending moment and rotor thrust, respectively) and improved stability (50% reduction in pitch response) compared to the barge. Aboutalebi et al. [9] incorporated four oscillating water columns (OWC) into an existing barge-type FOWP (Figure 1d). To address the oscillations induced by wind and waves, as well as the power fluctuations, a switching control technique was devised. This technique optimally regulates the airflow control valves to mitigate system oscillations and stabilize power output.
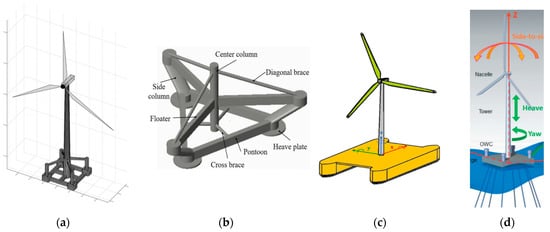
Figure 1.
Conceptual designs of FOWP: (a) CENTEC-TLP; (b) FOWP with inclined side columns; (c) Catamaran FOWP; (d) Barge-type FOWP with OWCs.
With regard to floating wind turbine dynamic response under combined wind–wave–current action, researchers have made extensive efforts in the field of numerical computations and model experiments. Koo et al. [10] tested and compared a scaled model 5 MW wind turbine supported by three different floating platforms: a spar, an OC4-DeepCwind, and a TLP. Wan et al. [11] conducted model tests of the spar–torus combination concept under two survival modes. Ha et al. [12] developed an experimental technique called ‘Real-Time Hybrid Method’ for performance evaluation of a 10 MW class FOWP. To verify the new technique, the repeatability was first tested, and then the test results were compared with the results of fully coupled analysis. From the experimental results, it could be seen that the model test technique had good performance and repeatability. The primary purpose of the model tests is to generate data on coupled motions and loads of the FOWT. The test data are to be used for the calibration and improvement of the existing design analysis and the validation of numerical codes. Kosasih et al. [13] analyzed a full-scale barge type FOWT under extreme condition using OrcaFlex coupled with FAST. FAST is an open-source software developed by the National Renewable Energy Laboratory (NREL). Guo et al. [14] studied the dynamic response of a spar FOWP mounting an IEA (International Energy Agency) 10 MW wind turbine using FAST. Kim et al. [15] conducted numerical investigations and experimental comparisons for a downscaled TLP floating platform mounting a DTU (Denmark Technical University) 10 MW wind turbine. Two state-of-the-art aero-servo-hydro-elastic models, HAWC2 and FAST, were used and compared with experimental results. Due to the limitations of linear wave theory and the Morison’s equation, the low-frequency surge motion was found to be under-predicted in both models. Yang et al. [16] developed and verified an aero-hydro-servo-elastic coupling framework F2A (FAST2AQWA) for analysis of floating wind turbines. The results showed that F2A is a useful tool to predict nonlinear dynamics of a FOWT subjected to wind, wave and current. Yang et al. [17] employed the F2A to estimate the fatigue damage to the tendon of a TLP floating wind turbine. F2A demonstrated lower error rates compared to FAST.
The use of numerical simulation and experimental testing has significantly contributed to the development of floating wind turbines under different sea conditions. To delve deeper into the FOWP concept design, the present study has taken inspiration from previous research and designed a V-shaped semi-submersible platform equipped with the 5 MW wind turbine developed by NREL. In order to test its stability, the present study conducted a fully coupled time-domain simulation using the F2A to analyze the dynamic response of the V-shaped floating wind turbine (V-FWT) under extreme sea conditions. To ensure the reliability of the design, the hydrodynamic data from the V-FWT were compared to that of the triangle-shaped floating wind turbine (Tri-FWT), which had served as the original model for “Fuyao”. Through comprehensive comparison and analysis, this study aims to investigate the feasibility and effectiveness of the V-Shaped design. The remaining sections are organized as follows: Section 2 describes the methodology used for fully coupled analysis and data validation. Section 3 introduces the proposed V-shaped FOWP and compares its stability with the Tri-FWT. Section 4 provides a detailed comparison and analysis of the dynamic responses of both the V-FWT and Tri-FWT. Finally, the conclusions are drawn in Section 5.
2. Solution Method and Verification
The program F2A, developed by Yang et al. [16], is a dynamically linked software that utilizes AQWA’s platform response data as a replacement for corresponding values in FAST. With this approach, F2A calculates the dynamic response and load of each structural component, which is then transmitted back to AQWA to determine the platform’s 6 degrees of freedom (DOFs) response. This section will introduce the principles of F2A briefly and verify it through comparison with published results.
2.1. Introduction to the Coupling Framework F2A
NREL develops FAST to facilitate the design of horizontal axis wind turbines. FAST is a fully coupled simulation tool that encompasses aero-hydro-servo-elastic aspects. Its basic version [18] encompasses AeroDyn, ElastDyn, HydroDyn, and ServoDyn modules, which are coupled for time-domain analysis. The HydroDyn module is not engaged in the development of F2A since AQWA is used to calculate the hydrodynamic loads. To facilitate a more comprehensive fully coupled analysis, Yang et al. [16] created a coupling framework, which integrates certain capabilities of FAST into AQWA. The coupling between AQWA and FAST is accomplished by modifying the source codes of the user_force.dll and FAST subroutines. FAST’s relevant capabilities are integrated entirely within the DLL, which can be accessed by AQWA during time-domain analysis.
Figure 2 demonstrates that the position, velocity, and acceleration calculated in AQWA are employed to determine the dynamic responses of the wind turbine’s upper structures. FAST subroutines calculate tower-base loads that are used as external forces in AQWA to solve the ensuing platform equation of motion [19]:
where is the mass matrix assembled by the inertial and added masses; is the unknown acceleration vector at the time t; is the total external force vector including the hydrodynamic and aerodynamic loads; and are, respectively, the assembled damping and stiffness matrices. is the acceleration impulse function matrix used to examine the radiation memory effects as defined by:
where is the radiation damping corresponding to the wave frequency of .
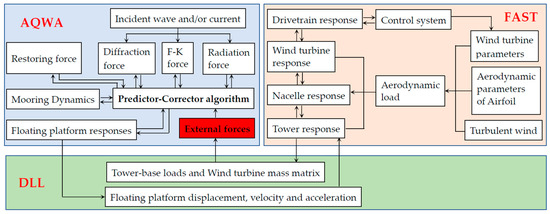
Figure 2.
Coupling framework between FAST and AQWA.
In DLL and AQWA program, the equation of motion for the floating platform and the wind turbine are solved individually. The solutions for these equations are interlinked. AQWA employs a predictor-corrector algorithm in the time-marching solution process. The DLL is called twice within each time-step. At time , AQWA calculates hydrodynamic loads and mooring restoring forces based on initialized platform responses. The DLL containing FAST’s simulation capabilities is then invoked to obtain tower-base loads based on the current platform responses at time . These results are used to predict the platform’s responses at the next time step , after applying an appropriate coordinate transformation [20] to standardize the coordinate system. Thereafter, the hydrodynamic loads and mooring restoring forces acting on the platform will be re-calculated. Simultaneously, the DLL will be utilized to calculate tower-base loads. AQWA then determines the platform responses at the next time-step . These processes are iterated until the simulation is successfully completed.
2.2. Verification of F2A
To verify the accuracy of the F2A module, typical working conditions are selected based on the OC4 DeepCwind [21] platform. The numerical results calculated by the F2A module are then compared with the test results presented in Kim and Kim [22]. Figure 3 shows the model and scale parameters of the OC4-DeepCwind platform.
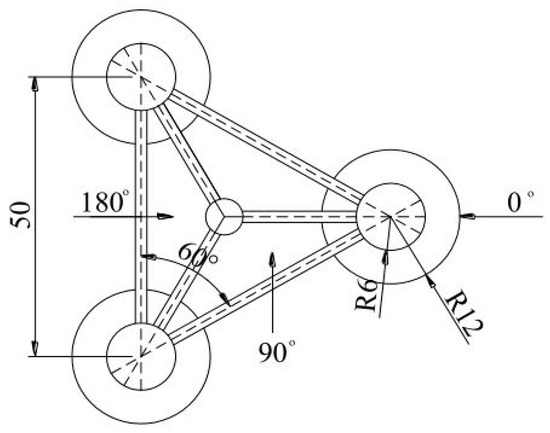
Figure 3.
Top view of the OC4-DeepCwind floating wind platform (dimensions in m).
Both experimental and numerical calculations utilize Jonswap spectra and steady wind for analysis, as listed in Table 1. Table 2 presents the obtained numerical and experimental results, with the amplitude of each DOF motion exhibiting a relative error of 1.06%, 9.8%, and 4.1% for surge, pitch, and heave, respectively. These results indicate that the equilibrium position of the platform’s motion is not significantly different between the numerical simulation and experimental test. Further analysis reveals that the numerical prediction slightly underestimates the amplitude of motion response as compared to the experimental result due to nonlinear wave-overturning. In general, the numerical results agree well with the experimental data, and the fully coupled numerical simulation based on F2A is demonstrated to be accurate.

Table 1.
List of test conditions.
Table 2.
Comparison of test results and numerical results.
3. Model Design of the V-Shaped Floating Wind Turbine Platform
3.1. Model Design of V-FWT
The design of the floating semi-submersible platform with a V-shaped base is based on the NREL 5 MW wind turbine, and its overall structure and main parameters are depicted in Figure 4. The V-FWT platform is a three-column semi-submersible structure consisting of the main column (MC), biased column (BC), heave plate (HP), connecting chamber (CC), and transverse braces. The design of V-shaped base effectively reduces the amount of steel and welding required, simplifying the construction and installation process. The steel tube frame is expected to enhance the overall strength of the structure and improve its resistance to waves. The coordinate system, with the point of origin at the center of the model and incident wave angles of 0°, 90°, and 180° are illustrated in Figure 4c. The static hydrostatic parameters of the platform are presented in Table 3.
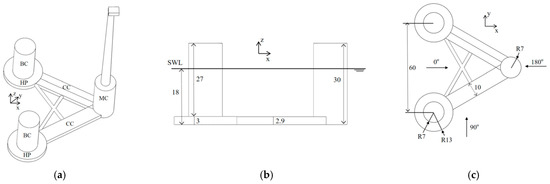
Figure 4.
Diagram of the V-shaped FOWP: (a) Isometric view; (b) Front view; (c) Top view.
Table 3.
Hydrostatic parameters of the V-shaped FOWP at draft of 18 m after mass distribution.
3.2. Ballast Subdivision and Opening Design of V-FWT
To achieve the desired draft, it is necessary to establish appropriate subdivision and ballast. Additionally, due to the tower placement on one of the offset columns of the V-FWT, the center of gravity (CoG) does not align with the center position. Consequently, it becomes necessary to adjust the CoG by using ballast to achieve a balanced configuration. Figure 5 illustrates the ballast compartment, where fixed ballast using concrete is represented in yellow and variable ballast water, subject to change depending on operational conditions, is represented in blue. The MC is equipped with a concrete ballast tank at a height of 3.72 m at the bottom and three water ballast tanks above it. Similarly, the BC has three water ballast tanks with a total ballast water height of 11.5 m (excluding wall thickness). Situated beneath the BC is a heave plate, which incorporates a cylindrical tank of 14 m in diameter and 3 m in height at the center, as portrayed by the mesh lines in Figure 5. The tank is augmented with concrete to increase its weight. Outside the cylindrical tank, ballast water is arranged to reduce the overall CoG. Above the waterline of the three columns, there are two tanks. The top tank is the equipment compartment that requires a hatch cover, air vents, ventilation holes, and other weathertight openings. These openings are of extreme importance for subsequent stability calculations, and their coordinates are shown in Table 4. It should be pointed out that the proposed water ballast may not be rapid enough to compensate for the trim due to quick changes in the wind force or direction, for which an efficient control system is required. This issue is beyond the scope of the present study and will be considered in the future.
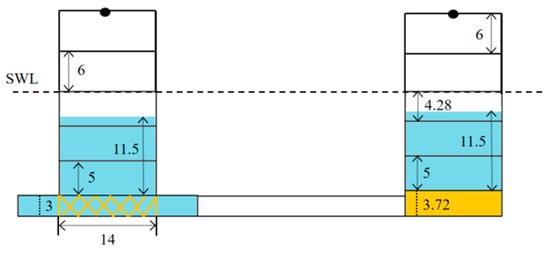
Figure 5.
Diagram of ballast, subdivision, and openings.
Table 4.
Coordinate of openings.
3.3. Design of Mooring System of V-FWT
The mooring system is essential for providing the necessary slow drift recovery force and ensuring the structural stability of the V-FWT. The schematic diagram of the mooring system is presented in Figure 6, with its main parameters summarized in Table 5. The system comprises 6 mooring lines, each inclined at an angle of 20° with respect to its neighboring lines. The mooring lines consist exclusively of chains throughout its entire length. The fairlead is located at 11.5 m above the waterline, while the anchorage is situated on the seafloor at a depth of 50 m below the waterline. The mooring lines have a broken strength of 9.4 × 10⁶ N, and a safety factor of 1.67 is required according to API standard, which is calculated as:
where is the broken strength, and the maximum mooring tension.
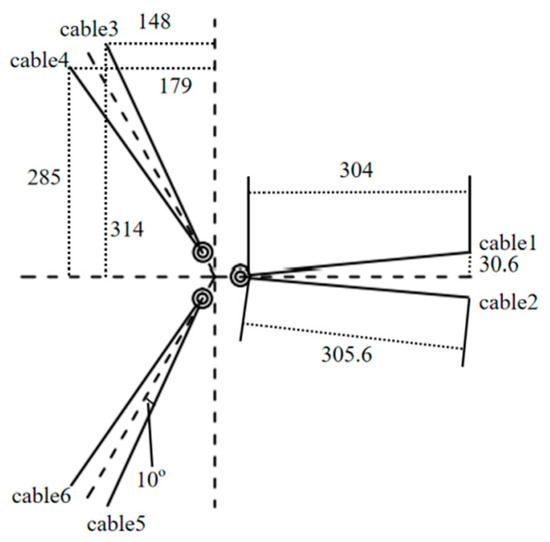
Figure 6.
Diagram of the mooring system.
Table 5.
Parameters of the mooring system.
3.4. Free Decay Test of V-FWT
The natural period of a floating platform on each DOF is determined through free decay test, which enables the prediction of the platform’s seakeeping behavior. By imparting an initial displacement to the platform and disabling all other DOFs, the platform attenuates freely until it reaches an equilibrium position. In order to avoid wave energy concentration within the period range of 4 to 16 s, the natural period of the floating platform for heave, roll, and pitch motions needs to be at least about 20 s. The amplitude spectra of free decay are presented in Figure 7, wherein the natural period corresponding to resonance is T = 20.53 s, 22.83 s, and 21.93 s for heave, roll, and pitch, respectively. The results demonstrate that the V-FWT has sufficiently large natural periods to effectively avoid the wave energy concentration range, and thus exhibits good seakeeping performance.
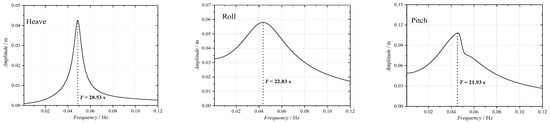
Figure 7.
Amplitude spectra obtained by free decay test for heave, roll, and pitch motions.
3.5. Comparison with Control Models
On the basis of the V-shaped model, a connecting chamber was added to transform the V-shaped foundation structure into a triangular one (called Tri-FWT), as shown in Figure 8, where Tri-FWT is the original model of the “Fuyao” project. It can be observed that as compared to V-FWT, Tri- FWT does not have the two transverse braces, but has an additional connecting chamber, resulting in an increase of 330 t in displacement and steel consumption. Table 6 presents the hydrostatic parameters of Tri-FWT, with slight variations in draft, CoG, and moment of inertia due to the changes in displacement. Table 7 presents a comparison of the natural periods between Tri-FWT and V-FWT. The comparison indicates that Tri- FWT has relatively shorter natural periods. Specifically, the natural periods of heave, roll, and pitch for Tri-FWT model are around 20 s, which is considered acceptable.
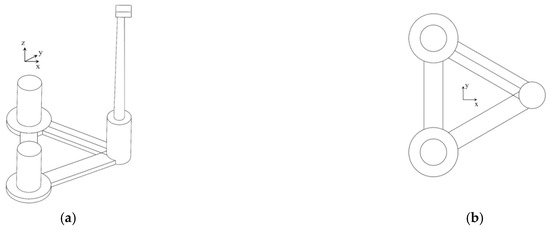
Figure 8.
Diagram of Tri-FWT: (a) Overall model; (b) Top view.
Table 6.
Hydrostatic parameters of Tri-FWT at draft of 18.1 m after mass distribution.
Table 7.
Comparison of natural periods between V-FWT and Tri- FWT.
3.6. Comparison of Intact Stability
Offshore floating platforms must satisfy specific stability criteria, as shown in the intact stability check curve in Figure 9, where is the first intersection angle between the wind heeling moment and the righting moment; is the down-flooding angle; is the second intersection angle between the wind heeling moment and the righting moment; and is the stability intercept angle [23]. Table 8 presents the criteria outlined by the International Maritime Organization (IMO) 2009 MODU CODE for column-stabilized platforms. Firstly, for column-stabilized platforms, the area under the righting moment curve to the down-flooding angle should be at least 30% greater than the area under the overturning moment curve to the down-flooding angle. This is expressed as the area ratio = (A + B)/(B + C) ≥ 1.3. Secondly, the righting moment should be positive at all angles. These requirements ensure that column-stabilized platforms meet the necessary stability criteria under different environmental conditions.
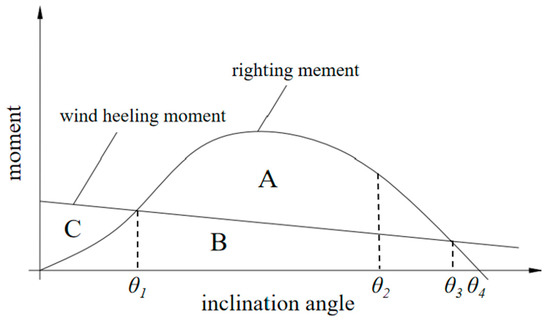
Figure 9.
Intact stability curve of offshore platform.
Table 8.
IMO intact stability curve requirements.
For the purpose of calculating the overturning moment in the stability analysis, the overturning moment due to quasi-static wind load on rotor-nacelle-assembly (RNA) may be calculated using the thrust coefficient, , determined by the rotor properties, control algorithm and turbine operating conditions. The thrust force generated by wind perpendicular to the swept area of the blades may be estimated by the following equation:
where denotes the wind drag load; denotes the density of air; denotes the thrust coefficient; denotes swept area of the blades; and denotes the 10-min mean wind speed at hub height. When the wind thrust force curve is available (e.g., Figure 10), the thrust force at any specific wind speed can be directly obtained.
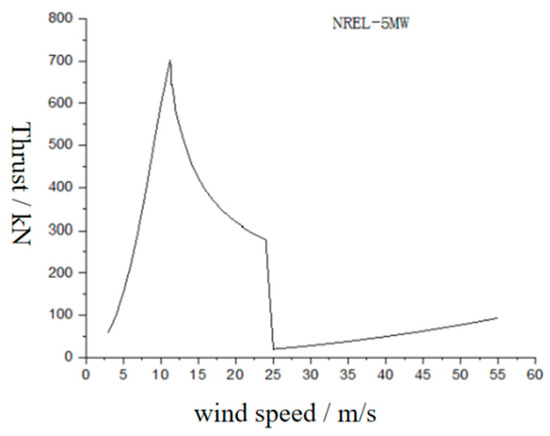
Figure 10.
Thrust force curve of the NREL 5 MW FOWT.
For wind pressure normal to flat surfaces, such as nacelle and exposed above-water components of the floating platform, or normal to the axis of members not having flat surfaces, such as the tower, the wind loading can be considered as a steady wind force, which can be calculated by:
where denotes the steady wind force; denotes shape coefficient [24]; denotes height coefficient [24]; denotes projected area; denotes 1-minute mean wind speed at a given elevation above the SWL.
The overturning moment can be expressed as the product of the overturning force ( and ) and the lever arm [24]. As two different methods are used to calculate the overturning force, the overturning moment is consequently divided into two terms:
where denotes the distance from the hub center to the center of buoyancy (CoB); denotes the distance from the point of wind pressure to the CoB.
Intact stability analysis is conducted for both platforms under different conditions, that is, operation condition (wind speed of 11.4 m/s) and survival condition (wind speed of 51.4 m/s). According to Figure 10, the thrust force of the RNA is approximately 740 kN at 11.4 m/s and 100 kN at 51.4 m/s. Figure 11 shows the curves for the righting moment and overturning moment at the 30° critical axis. The solid black curve represents the righting moment of V-FWT, the solid red curve represents the righting moment of Tri-FWT, and the dashed blue curve represents the overturning moment. The results indicate that Tri-FWT exhibits a higher righting moment than V-FWT at the 30° critical axis. This trend can be generalized to other axis, suggesting that the stability performance of Tri-FWT is superior to that of V-FWT. This improvement can be attributed to the increased displacement and stiffness of Tri-FWT in the static water.
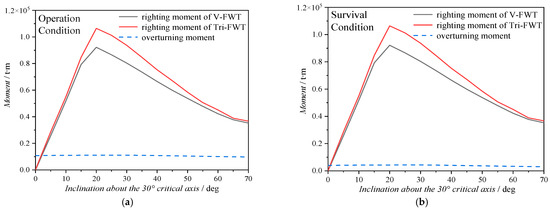
Figure 11.
Intact stability curve for the RNA under: (a) operation condition; (b) survival condition.
The computed overturning moments, calculated using Equations (4)–(6), are shown in Figure 11. Under both operation and survival conditions, the overturning moments are always smaller than the righting moments, indicating that they meet the stability rules.
4. Comparative Analysis of Dynamic Responses
4.1. Dynamic Responses under Combined Wind–Wave Action
The designated target site of the floating turbines is the South China Sea. It is worth noting that the sea conditions in the South China Sea are known to be extremely harsh and adverse. Considering the extreme sea conditions in numerical simulations is meaningful, as it allows for the assessment of which model demonstrates greater reliability and superiority under such challenging circumstances.
For the hydrodynamic modeling, a potential flow based solution is used, combined with a strip-theory solution through Morison’s equation. The potential flow models use radiation/diffraction matrices computed from a panel code such as WAMIT, which does not account for viscous effects. To consider the viscous effects, the drag force part of the Morison’s equation can be calculated as follows:
where is the non-dimensional drag coefficient, is the density of fluid, is the projected area, denotes the fluid particle velocity, and denotes the structural velocity.
It should be mentioned that in AQWA, only small components (e.g., braces) are treated as Morison elements based on Morison’s equation (and typically = 0.63). Large components (e.g., columns and pontoons), on the other hand, are modeled based on diffracting panel method [19]. In these cases, the adjustment for viscous drag is achieved by artificially introducing an additional damping, following an empirical correction. The ANSYS AQWA Theory Manual [19] suggests applying an additional damping of 8% of the critical damping for the purpose of drag correction. The critical damping is calculated as follows:
where M denotes the sum of the mass and the added mass of the model, and K is the static stiffness of heave response.
For the aerodynamic calculation, a model based on blade-element momentum theory is used. The influence of dynamic wake is considered within FAST. For the moorings, the quasi-static method implemented in AQWA is used for calculations. For more information about the analysis codes, the readers are referred to Robertson et al. [25].
The Jonswap spectrum, characterized by significant wave height Hs = 10.1 m, spectral peak period Tp = 17 s, and spectral peak factor = 2, is selected as the irregular wave input. Meanwhile, the NPD wind spectrum is used to simulate turbulent wind load, with an average wind speed of 55 m/s at the center of the hub. Both wind and waves are assumed to enter simultaneously at an azimuth of 0°, and the operating conditions are specified in Table 9. The dynamic responses of the floating wind turbines under the combined wind–wave action are then computed using the full coupling scheme implemented in the F2A calculation program.
Table 9.
List of input parameters based on South China Sea region.
Figure 12 illustrates the time history and power spectral density (PSD) of platform response motions, i.e., surge, pitch, and yaw. Regarding the surge motion, the positive side of the two models appears to be similar while V-FWT exhibits relatively small values on the negative side, as depicted in Figure 12a. In general, the PSD curve of surge motion is characterized by two spectral peaks—that is, a low-frequency one caused by the wave difference frequency effect and a high-frequency one caused by the first-order wave effect. Tri-FWT has a higher low-frequency peak (at T = 86.5 s) compared to V-FWT, which corresponds to the more significant surge motion response observed in Tri-FWT. However, there is not much difference between them in terms of wave-frequency response (at T = 17 s). By contrast, the pitch motion of the two models is significantly different, as illustrated in Figure 12b. V-FWT has a smaller mean pitch near 2° (vs. 5° for Tri-FWT). Similar to the surge motion, the pitch motion spectrum also has two peaks: the low-frequency one caused by the second-order difference frequency effects, and the high-frequency one corresponding to the natural frequency of coupled motion. The PSD curve of Tri-FWT shows a slightly lower peak at second-order difference frequency (T = 86.5 s) compared to V-FWT, but has a significantly higher peak at natural frequency (T = 21.9 s), indicating a more pronounced pitch response for Tri-FWT. Regarding the yaw motion, Figure 12c shows that V-FWT has relatively smaller yaw response with the equilibrium position closer to zero (1° vs. 5° for Tri-FWT), indicating its better seakeeping performance. The yaw motion spectrum is dominated by the low (second-order) frequency response. As can be seen, the spectral peak at T = 100 s of V-FWT is slightly more significant than that of Tri-FWT, indicating a higher oscillating amplitude.
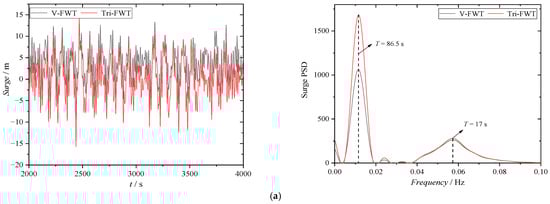
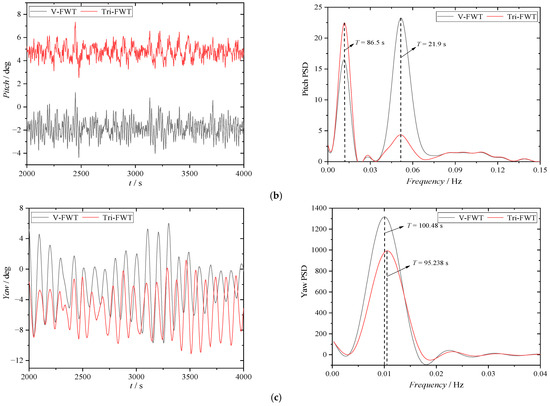
Figure 12.
Time history and PSD of motion response: (a) Surge; (b) Pitch; (c) Yaw.
Figure 13 presents the statistical results of maximum motion responses and corresponding standard deviation (STD) values in terms of 6-DOF motion responses (absolute values). The results show that the maximum responses of sway, heave, and roll are similar for V-FWT and Tri-FWT. However, the STD value of surge for both models is relatively large, indicating a significant deviation from the equilibrium position. In summary, the results under extreme sea condition with 0° incidence angle show that V-FWT is better than Tri-FWT in terms of motion response, especially pitch and yaw. Specifically, the pitch and yaw motions are reduced by 40.4% and 12.9%, respectively, indicating better seakeeping performance of V-FWT.
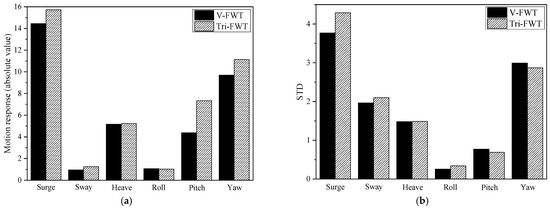
Figure 13.
Statistical diagrams of 6-DOF motion responses: (a) Maximum motion response (absolute values); (b) Standard deviation (STD).
In this study, both V-FWT and Tri-FWT use the same mooring scheme, and the mooring forces are obtained by fully coupled calculation through F2A program. Figure 14 and Table 10 illustrate the results of the mooring system. The time history of mooring tension and its corresponding spectral analysis are shown in Figure 14, which indicates that the mooring tension forces of Tri-FWT is generally greater than those of V-FWT in the positive motion. According to the spectra of mooring line forces (Cable 1, Cable 2, and Cable 6), the force response consists of both the low-frequency component caused by the second-order frequency effect and the high-frequency component caused by the first-order wave effect. The influence of the high-frequency response is relatively smaller compared to that of the low-frequency response. Additionally, the PSD curve clearly shows that Tri-FWT exhibits a significantly higher magnitude of low-frequency response than V-FWT. This agrees with the observation that, with the same mooring configuration, Tri-FWT experiences higher tension in the mooring lines.
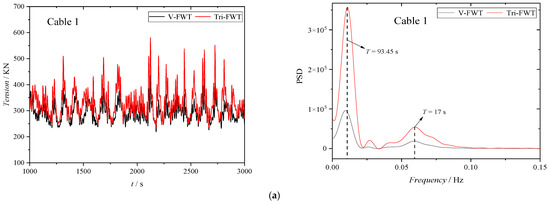
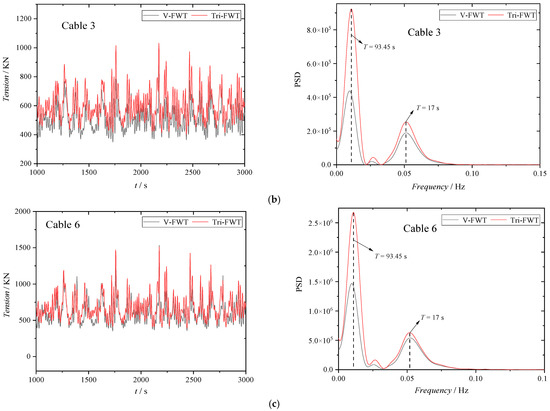
Figure 14.
Time history and PSD of mooring tension: (a) Cable 1; (b) Cable 3; (c) Cable 6.
Table 10.
Statistics of the maximum mooring tension of V-FWT and Tri-FWT.
Table 10 presents the maximum tension and safety factor of different mooring lines (Cable 1, Cable 3, and Cable 6) for both models under combined wind–wave condition. It can be observed that the maximum mooring tension occurs in Cable 6 of Tri-FWT, with a maximum tension force of 2105 kN, which corresponds to a safety factor of 4.47 and satisfies the safe criterion (API-RP-2SK). Comparing the data of the two models, it can be concluded that the mooring system of V-FWT is safer than that of Tri-FWT, as the maximum mooring tension is reduced by 17.4%. Overall, the results indicate that V-FWT has better seakeeping performance and a safer mooring system than Tri-FWT under extreme sea conditions.
4.2. Dynamic Responses under Combined Wind–Wave–Current Action
To further investigate the performance of the two FOWPs, the load of 3 m/s constant current is added through the equivalent coefficient method in AQWA. Table 11 presents the statistical data on the structural motion response of both models, taking into account the combined effects of wind, wave, and current. By comparing with the data presented in Figure 10, it is revealed that the current has resulted in a positive offset of the equilibrium position of the surge motion in both models. Additionally, there is a significant reduction in the heave response, with the maximum heave motion of V-FWT and Tri-FWT reduced by 45.3% and 39.5%, respectively, and the amplitude reduced by 41.3% and 38.9%, respectively.
Table 11.
Statistical data of motion response of V-FWT and Tri-FWT under combined wind–wave– current action.
Regarding the pitch motion, it is notable that the negative torque generated by the current causes the equilibrium position of pitch to shift towards the negative direction. Under the combined wind–wave–current action, the pitch motion response of Tri-FWT is about 10% smaller than that of V-FWT. After incorporating the effect of the current, it is found that the yaw motion response decreases, and the yaw of V-FWT is still 27.3% better than that of Tri-FWT.
Table 12 shows the statistics of mooring tension forces of both V-FWT and Tri-FWT models under combined wind–wave–current condition. At the incidence angle of 0°, Cables 1 and 2 are in relaxed state, whereas the other cables are tightened due to the increasing positive surge motion of the models. Furthermore, it can be observed from Table 13 that Cables 1 and 2 exhibit minimal tension, whereas Cables 4 to 6 experience the highest tension levels. It is worth noting that the safety factors remain greater than the limit of 1.67 specified by API-RP-2SK. By comparing the data of both models, it is evident that the maximum mooring tension of V-FWT is smaller, and its safety factor is approximately 5% higher than that of Tri-FWT.
Table 12.
Tension statistics of mooring lines (Cable 1, Cable 3, and Cable 6) of V-FWT and Tri-FWT under combined wind–wave–current action.
Table 13.
Mooring safety factors of V-FWT and Tri-FWT at different incidence angles.
4.3. Dynamic Responses under Different Incidence Angles
The present study further investigates the impact of varying incidence angle of wind, wave and current on the motion responses of floating wind turbines. The incidence angle is varied from 0° to 180° with an incremental step of 30°, during which the wind, wave and current are always kept at the same angle. Figure 15 shows a comparison of the maximum and minimum values of the 6-DOF motions for V-FWT and Tri-FWT at different incidence angles. It is observed that the surge motion gradually shifts in the negative direction with the increase in incidence angle. At 90° incidence angle, there is still a significant negative response for surge motion, due to the negative interaction between the wind–wave–current and the model. With the increase in incidence angle, both sway and roll motions increase first and then decrease, whereas the sway motion of V-FWT and Tri-FWT is very close. The heave motion increases with incidence angle: as compared to the case of 0° incidence angle, the heave motion at 180° incidence angle increases by 34.8% and 14.5% for V-FWT and Tri-FWT, respectively. In terms of pitch motion, the equilibrium position for V-FWT is negative, and with the increase in incidence angle, the absolute value of negative maximum response reduces; for Tri-FWT, on the contrary, the equilibrium position of pitch is positive, and the positive maximum value increases with the increase in incidence angle. At incidence angle of 180°, the maximum pitch of Tri-FWT reaches 9.72°. In terms of yaw motion, the equilibrium position of V-FWT is more forward than that of Tri-FWT, but the maximum negative position of Tri-FWT is greater, which reaches −7.79°.
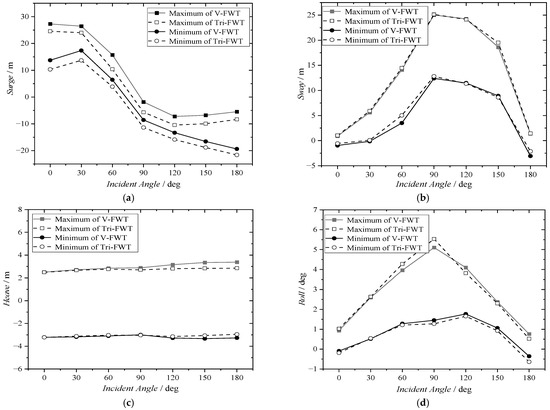
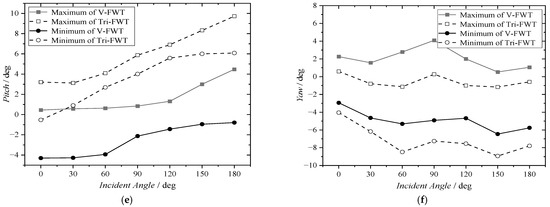
Figure 15.
Comparison of maximum and minimum values of 6-DOF motions of V-FWT and Tri-FWT at different incidence angles: (a) Surge; (b) Sway; (c) Heave; (d) Roll; (e) Pitch; (f) Yaw.
Based on the above results, it can be concluded that the seakeeping performance of V-FWT is better than that of Tri-FWT, especially in terms of pitch and yaw motions. The pitch motion of Tri-FWT is 1.17 times that of V-FWT at incidence angle of 180°, and the yaw motion is 1.38 times that of V-FWT at incidence angle of 150°.
Table 13 shows the safety factors of mooring system for V-FWT and Tri-FWT at different incidence angles. It can be seen that as the incidence angle increases, the tension in Cables 1 and 2 gradually increases, leading to their gradual tightening. At an incidence angle of 180°, Cable 2 of Tri-FWT exhibits a safety factor of only 1.682, which is perilously close to the API-RP-2SK limit of 1.67. Conversely, the safety factors of the remaining cables decrease with the increase in incidence angle. Notably, Cable 5 of Tri-FWT poses the most precarious condition at an incidence angle of 90°, with the maximum mooring tension reaching 5618 kN and a safety factor of only 1.673, leaving little room for safety margin. The comparison between the two models reveals that V-FWT exhibits better mooring safety than Tri-FWT under the same mooring scheme.
5. Conclusions
Based on the potential flow theory and blade element momentum theory, a V-shaped semi-submersible platform equipped with NREL 5 MW wind turbine (V-FWT) has been proposed and compared to the original triangle-shaped model, “Fuyao” (Tri-FWT), in terms of their hydrodynamic and mooring performance. The coupled hydrodynamic, aerodynamic, and mooring systems of the two FOWPs are simulated in the time domain using the F2A program. Based on the obtained results, the conclusions are as follows:
- (1)
- Both V-FWT and Tri-FWT exhibit satisfactory stability performance at the 30° critical axis. The results indicate that Tri-FWT exhibits a higher righting moment compared to V-FWT, highlighting its superior stability performance.
- (2)
- Fully coupled dynamic response calculations are conducted for the two floating wind turbines under combined wind–wave action and wind–wave–current action. It is shown that the amplitude of surge and heave motions of both models decrease significantly after the current load is added. In general, V-FWT has better performance in terms of motion response and mooring tension than Tri-FWT. Compared to Tri-FWT, V-FWT shows a reduction of 40.4% and 12.9%, respectively, in pitch and yaw motions, and a 17.4% reduction in maximum mooring tension. Under the combined wind–wave–current action, however, the pitch response of V-FWT is about 10% higher than that of Tri-FWT. On the contrary, the yaw response of V-FWT is reduced by 27.3%, and the mooring safety factor is improved by 5%.
- (3)
- The dynamic response of the two floating wind turbines under different incidence angles shows that the seakeeping performance of Tri-FWT is relatively poor. Specifically, at 180° incidence angle, the pitch motion of Tri-FWT is 1.17 times higher than that of V-FWT, while the yaw motion at 150° incidence angle is 1.38 times higher. Moreover, the mooring tension analysis highlights that the most critical scenario arises for Cable 5 of Tri-FWT at 90° incidence angle, where the maximum mooring tension amounts to 5618 kN and the safety factor is only 1.673, leaving a very limited safety margin.
Author Contributions
Conceptualization, Y.S.; methodology, Y.S.; software, Y.S.; validation, C.L. and W.P.; formal analysis, X.W.; investigation, C.L.; resources, W.P.; data curation, Y.S.; writing—original draft preparation, Y.S.; writing—review and editing, Y.L. and X.W.; visualization, Y.S.; supervision, Y.L.; project administration, X.W.; funding acquisition, X.W. All authors have read and agreed to the published version of the manuscript.
Funding
This research was funded by Yang Zhou Science and Technology Bureau (Grant No. YZLYJFJH2021CX021) and Zhen Jiang Science and Technology Bureau (Grant No. CQ2022008).
Institutional Review Board Statement
Not applicable.
Informed Consent Statement
Not applicable.
Data Availability Statement
The data presented in this study are available on request from the corresponding author.
Conflicts of Interest
The authors declare no conflict of interest.
References
- Henderson, A.R.; Bulder, B.; Huijsmans, R.; Peeringa, J.; Pierek, J.; Snijders, E.; van Hees, M.; Wijnants, G.H.; Wolf, M.J. Feasibility study of floating windfarms in shallow offshore sites. Wind Eng. 2003, 27, 405–418. [Google Scholar] [CrossRef]
- Butterfield, S.; Musial, W.; Jonkman, J.M.; Sclavounos, P.; Wayman, L. Engineering Challenges for Floating Offshore Wind Turbines. In Proceedings of the Copenhagen Offshore Wind 2005 Conference, Copenhagen, Denmark, 26–28 October 2005. [Google Scholar]
- Roddier, D.; Cermelli, C.; Aubault, A.; Weinstein, A. WindFloat: A floating foundation for offshore wind turbines. J. Renew. Sustain. Energy 2010, 2, 033104. [Google Scholar] [CrossRef]
- Lefebvre, S.; Collu, M. Preliminary design of a floating support structure for a 5 MW offshore wind turbine. Ocean Eng. 2012, 40, 15–26. [Google Scholar] [CrossRef]
- Huijs, F.; De Bruijn, R.; Savenije, F. Concept design verification of a semi-submersible floating wind turbine using coupled simulations. Energy Procedia 2014, 53, 2–12. [Google Scholar] [CrossRef]
- Uzunoglu, E.; Soares, C.G. Hydrodynamic design of a free-float capable tension leg platform for a 10 MW wind turbine. Ocean Eng. 2020, 197, 106888. [Google Scholar] [CrossRef]
- Zhang, H.; Wang, H.; Cai, X.; Xie, J.; Wang, Y.; Zhang, N. Research on the Dynamic Performance of a Novel Floating Offshore Wind Turbine Considering the Fully-Coupled-Effect of the System. J. Mar. Sci. Eng. 2022, 10, 341. [Google Scholar] [CrossRef]
- Cutler, J.; Bashir, M.; Yang, Y.; Wang, J.; Loughney, S. Preliminary development of a novel catamaran floating offshore wind turbine platform and assessment of dynamic behaviours for intermediate water depth application. Ocean Eng. 2022, 258, 111769. [Google Scholar] [CrossRef]
- Aboutalebi, P.; M’zoughi, F.; Garrido, I.; Garrido, A.J. A control technique for hybrid floating offshore wind turbines using oscillating water columns for generated power fluctuation reduction. J. Comp. Des. Eng. 2023, 10, 250–265. [Google Scholar] [CrossRef]
- Koo, B.J.; Goupee, A.J.; Kimball, R.W.; Lambrakos, K.F. Model tests for a floating wind turbine on three different floaters. J. Offshore Mech. Arct. Eng. 2014, 136, 020907. [Google Scholar] [CrossRef]
- Wan, L.; Gao, Z.; Moan, T. Model Test of the STC Concept in Survival Modes. In Proceedings of the 33rd International Conference on Ocean, Offshore and Arctic Engineering, San Francisco, CA, USA, 8–13 June 2014. [Google Scholar]
- Ha, Y.J.; Ahn, H.; Park, S.; Park, J.Y.; Kim, K.H. Development of hybrid model test technique for performance evaluation of a 10 MW class floating offshore wind turbine considering asymmetrical thrust. Ocean Eng. 2023, 272, 113783. [Google Scholar] [CrossRef]
- Kosasih, K.M.A.; Suzuki, H.; Niizato, H.; Okubo, S. Demonstration experiment and numerical simulation analysis of full-scale barge-type floating offshore wind turbine. J. Mar. Sci. Eng. 2020, 8, 880. [Google Scholar] [CrossRef]
- Guo, X.; Zhang, Y.; Yan, J.; Zhou, Y.; Yan, S.; Shi, W.; Li, X. Integrated Dynamics Response Analysis for IEA 10-MW Spar Floating Offshore Wind Turbine. J. Mar. Sci. Eng. 2022, 10, 542. [Google Scholar] [CrossRef]
- Kim, T.; Madsen, F.J.; Bredmose, H.; Pegalajar-Jurado, A. Numerical analysis and comparison study of the 1:60 scaled DTU 10 MW TLP floating wind turbine. Renew. Energy 2023, 202, 210–221. [Google Scholar] [CrossRef]
- Yang, Y.; Bashir, M.; Michailides, C.; Li, C.; Wang, J. Development and application of an aero-hydro-servo-elastic coupling framework for analysis of floating offshore wind turbines. Renew. Energy 2020, 161, 606–625. [Google Scholar] [CrossRef]
- Yang, Y.; Bashir, M.; Wang, J.; Michailides, C.; Loughney, S.; Armin, M.; Hernández, S.; Urbano, J.; Li, C. Wind-wave coupling effects on the fatigue damage of tendons for a 10 MW multi-body floating wind turbine. Ocean Eng. 2020, 217, 107909. [Google Scholar] [CrossRef]
- Jonkman, J.M.; Buhl, M.L., Jr. FAST User’s Guide (No. TP-500-38230); National Renewable Energy Laboratory: Golden, CO, USA, 2005.
- ANSYS AQWA. AQWA Theory Manual 15317; AQWA: Canonsburg, PA, USA, 2013. [Google Scholar]
- Yang, Y.; Bashir, M.; Wang, J.; Yu, J.; Li, C. Performance evaluation of an integrated floating energy system based on coupled analysis. Energy Convers. Manag. 2020, 223, 113308. [Google Scholar] [CrossRef]
- Robertson, A.; Jonkman, J.; Masciola, M.; Song, H.; Goupee, A.; Coulling, A.; Luan, C. Definition of the Semi-Submersible Floating System for Phase II of OC4; National Renewable Energy Lab. (NREL): Golden, CO, USA, 2014.
- Kim, H.C.; Kim, M.H. Comparison of simulated platform dynamics in steady/dynamic winds and irregular waves for OC4 semi-submersible 5 MW wind-turbine against DeepCwind model-test results. Ocean Syst. Eng. 2016, 6, 1–21. [Google Scholar] [CrossRef]
- Collu, M.; Maggi, A.; Gualeni, P.; Rizzo, C.M.; Brennan, F. Stability requirements for floating offshore wind turbine (FOWT) during assembly and temporary phases: Overview and application. Ocean Eng. 2014, 84, 164–175. [Google Scholar] [CrossRef]
- China Classification Society. Rules for Classification of Mobile Offshore Units; China Communications Press: Beijing, China, 2022. [Google Scholar]
- Robertson, A.N.; Wendt, F.; Jonkman, J.M.; Popko, W.; Dagher, H.; Gueydon, S.; Qvist, J.; Vittori, F.; Azcona, J.; Debruyne, Y.; et al. OC5 project phase II: Validation of global loads of the DeepCwind floating semisubmersible wind turbine. Energy Procedia 2017, 137, 38–57. [Google Scholar] [CrossRef]


Disclaimer/Publisher’s Note: The statements, opinions and data contained in all publications are solely those of the individual author(s) and contributor(s) and not of MDPI and/or the editor(s). MDPI and/or the editor(s) disclaim responsibility for any injury to people or property resulting from any ideas, methods, instructions or products referred to in the content. |
© 2023 by the authors. Licensee MDPI, Basel, Switzerland. This article is an open access article distributed under the terms and conditions of the Creative Commons Attribution (CC BY) license (https://creativecommons.org/licenses/by/4.0/).