Abstract
Wind turbines operating in cold regions are more likely to sustain extreme icing, causing the degradation of aerodynamic performance and the loss of wind energy output. This paper proposed a pneumatic impulse deicing method based on the conventional pneumatic deicing boot. This method’s simplified numerical simulation model was built using the commercial software ABAQUS to explore whether this method can deice. After that, experimental investigations were carried out in an artificial climate chamber to verify the deicing performance of specimens using this proposed method. Numerical and experimental results show that the pneumatic impulse deicing method could eliminate the ice layer with a smaller displacement and shorter time than the conventional pneumatic deicing boot. The ice layer’s thickening and inflation pressure enhancement benefit the deicing performance. Experiment results proved that the pneumatic impulse deicing method performs better under inflation pressures of 1.5 MPa and 2.5 MPa with an ice thickness of 6 mm or 8 mm.
1. Introduction
Wind energy in cold climate areas is becoming popular throughout the world due to its high air density and wind potential [1,2]. However, wind turbines built here frequently expose extreme icing during the cold seasons. Even small amounts of ice accretion on the leading edge will seriously influence the aerodynamic performance of wind turbine blades [3,4,5]. Therefore, developing deicing technology is necessary to improve the stability and efficiency of wind turbines operating in cold regions.
Much inspiration for the IPS (ice protection system) used on wind turbines originates from aircraft IPSs because the aviation industry has been affected by icing events for decades [6]. The ice protection techniques for wind turbines can be classified into two types: passive techniques and active techniques [3,7]. The depressant fluid is one of the passive techniques, but the application is limited because of its non-biodegradable property. Another common passive technique is super-hydrophobic coating. In theory, because of their repulsive property, these coatings prevent the water drop from remaining on the protected surfaces [8,9]. However, it has been demonstrated that hydrophobicity is insufficient to prevent ice accumulation, and the coatings could only delay the freezing time under severe icing cases [10]. Compared with the passive techniques, the active techniques are more diverse and mainly include thermal and mechanical methods. Thermal methods prevent ice accumulation on wind turbine blades by maintaining the surface temperature above freezing [11,12,13,14,15]. Thermal protection systems that use hot air or heating resistance have been marketed, but they consume a lot of power at low temperatures and high wind speeds [3,7,10]. Mechanical methods refer to ice protection systems that apply a mechanical force to break the accumulated ice and accelerate its separation from the protected surface [16,17,18]. The ultrasonic deicing method is one of the mechanical methods. This method generates Lamb waves and horizontal shear waves in the structure. When the shear stress caused by these waves exceeds the ice adhesion strength, the ice layer will be detached from the plate [19]. Although this method has been successfully applied to aircraft wings, the application on wind turbine blades is still in the laboratory development stage due to the different materials of the structure. The pneumatic and electromagnetic impulse deicing methods are the two most typical mechanical methods, with characteristics of high deicing efficiency and low energy consumption [3,10]. The two mechanical methods have been implemented in aircraft wings successfully for decades, while the application on wind turbine blades is rarely reported.
The conventional pneumatic deicing method attaches a sheet of the rubber-made pneumatic deicing boot to the protected surface (shown in Figure 1) [20]. When there is a certain amount of ice on the protected surface, the pneumatic deicing boot expands under pressurized air, and the ice layer will separate from the protected surface under the combined influences of bending and shear stresses (shown in Figure 2) [21,22]. Displacement caused by the deformation of the pneumatic boot could reach 6~10 mm, and the duration of one operation period is about 1~2 s [22]. The research found that the aerodynamic performance degradation caused by the deformation is lower than due to ice accretion. However, the large deformation could lead to unwanted vibration and noise [23].
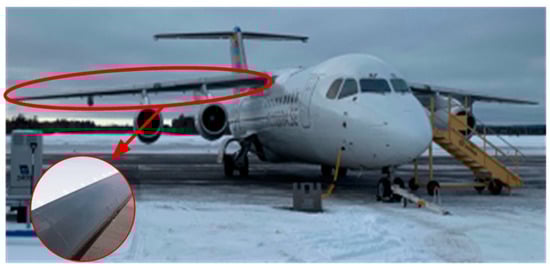
Figure 1.
An example of the pneumatic deicing boot.
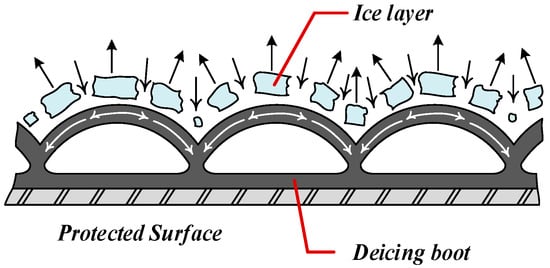
Figure 2.
The pneumatic deicing boot under expansion state.
This work proposed a revised structure of the pneumatic deicing method, named the pneumatic impulse deicing method, to shrink the deformation and operation duration. A simplified numerical simulation model based on the revised structure was built using the commercial software ABAQUS to explore whether this method can deice. After that, experimental investigations were carried out in an artificial climate chamber to verify the deicing performance of specimens using this proposed method. Meanwhile, the deicing performances under different ice thicknesses and inflation pressures were recorded and discussed.
2. Structure of the Pneumatic Impulse Deicing Method
The revised structure buries the inflatable tube within the protected object, and the specimen with a pneumatic impulse deicing structure is shown in Figure 3. First, a groove is dug in the surface of the base board, and an expandable flat tube is pasted in the center of the groove. The modified epoxy resin is then used to pour the tube into the groove, and the epoxy resin is cured to form a deformable elastomer. The function of the elastomer is to help the structure’s surface return to the initial flat state after the pressure in the tube is released. Finally, a layer of metal skin is bonded on the surface of the elastomer to protect it, and both sides of the metal skin are fixed on the baseboard with rivets.
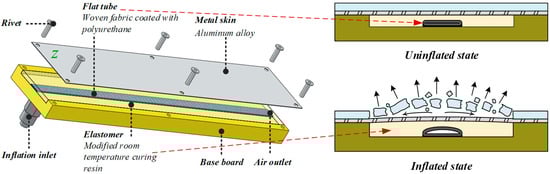
Figure 3.
The specimen with pneumatic impulse deicing structure.
Under the inflated state, the pressurized air is applied rapidly into the inflation inlet. The flat tube deforms the metal skin outward through the elastomer, introducing bending stresses to break up the ice layer and shear stresses adequately at the ice/metal interface to promote the separation of the broken ice layer. Due to metal skin and the elastomer, the structure can withstand immense impulse pressure with minor deformation, usually less than 2 mm. Furthermore, the duration of the impulse pressure is less than 4 ms. After the pressurized air escapes from the air outlet, the metal skin and elastomer will return to their original form.
3. Numerical Simulation Methods
3.1. Dynamical Equation
The process of the pneumatic impulse deicing method involves structural dynamics. The dynamical equation of the finite element method is [16]:
where [M] is the mass matrix, [D] is the damping matrix, [K] is the stiffness matrix, is the acceleration vector of the element node, is the velocity vector of the element node, is the displacement vector of the element node, and is the resultant force vector of the node.
The explicit integral method is used to solve the above equation, and the results with better convergence can be obtained quickly. So, the acceleration vector of the element node could be expressed as:
where Fint is the internal force vector of the element node and P is the external force of the element node.
Therefore, the velocity and displacement vectors of the corresponding node are, respectively:
3.2. The Constitutive Equations
The equation of strain rate is:
where dεel is the elastic strain rate and dεck is the cracking strain rate.
The equation of stress rate is:
where [Del] is the linear elastic stiffness matrix and [T] is the local crack coordinate transformation matrix.
3.3. The Brittle Cracking Model of the Ice Layer
In this work, the Rankine criterion was used for ice cracking detection, and the energy cracking criterion was used to define the crack zone’s subsequent failure characteristics. The equation of the Rankine criterion is:
where t is time, σI,II is stress (I and II represent the direct stress and shear stress, respectively), C = [Cnn Ctt Css Cnt Cns Cts]T, Cnn, Ctt, and Css represent the direct stresses in three directions of the material and Cnt, Cns, and Cts represent the shear stresses in the three directions of the material, and C is the maximal principal stress. When C exceeds the material tensile strength, the crack shows up.
The equation of the energy cracking criterion is:
where is the material fracture energy and is the tensile stress of the element node.
3.4. Geometric Model and Parameters Settings
The dynamic/explicit module could achieve the abovementioned functions in the commercial software ABAQUS. The pneumatic impulse deicing structure is simplified to improve simulation convergence and efficiency as a three-ply bending model under impulse pressure. Because the pressure distribution in the length direction is the same, the length of the simulation model is only half of the actual length of the specimen to save calculation time (shown in Figure 4). The surfaces marked by red lines in Figure 4 are set as fixed. References [24,25] show that the shear stress at the ice/aluminum interface is less than 1.5 MPa. Therefore, the tangential behavior at ice/aluminum of the simulation chose 1.5 MPa. According to references [26,27,28], the fracture characteristic of the ice layer is given in Table 1. Because the power loss of wind turbines can reach up to 36% under light icing conditions [29], the chosen ice thicknesses in this work include 2 mm, 4 mm, 6 mm, and 8 mm. Meanwhile, the applied inflation pressures include 0.5 MPa, 1.5 MPa, and 2.5 MPa with a duration of 4 ms. The other material parameters are given in Table 2.
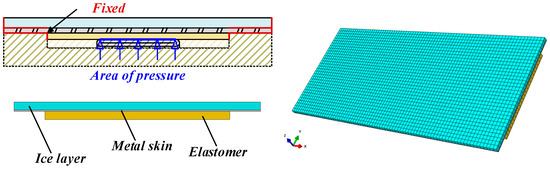
Figure 4.
The simplified simulation model of pneumatic impulse deicing structure.

Table 1.
The fracture characteristic of the ice layer.
Table 2.
The material’s parameters.
The mesh independence study was conducted first to explore the influence of mesh size on the simulation result. The mesh size includes 1 mm, 0.5 mm, and 0.25 mm. Three reference points on the metal skin are selected (shown in Figure 5), and the maximum tangential shear stress of the three points under different mesh sizes is given in Figure 6 (ice thickness is 2 mm, inflation pressure is 1.7 MPa).

Figure 5.
The position of three selected reference points on the model.
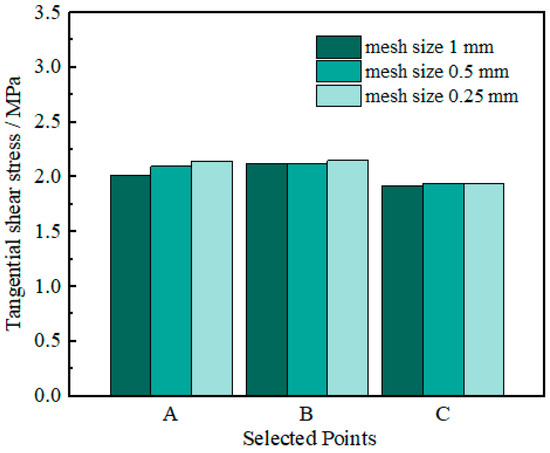
Figure 6.
The max tangential shear stress of the three selected points under different mesh sizes.
According to Figure 6, the max error caused by the mesh size is 5.3%, which indicates that the influence of mesh size (using 1 mm, 0.5 mm, and 0.25 mm) on the simulation results could be ignored. To balance the prediction accuracy and computational time, after the mesh size convergence examination, the mesh size of all structures is set to 1 mm in both length and width directions. The mesh size in the ice thickness direction is 2 mm. The mesh type in this simulation is the eight-node linear hexahedron element. The model has 22,000~46,000 elements in total with different ice thicknesses.
4. Numerical Simulation Results
Based on the finite element method, the simplified pneumatic impulse deicing structure simulation model is built and computed via the commercial software ABAQUS. The deicing performances of different ice thicknesses under diverse inflation pressures are given in Figure 7. The deicing ratio (the ratio of deicing area to metal skin area) is introduced to compare the deicing performance more intuitively. Based on the structural dynamics, the initial acceleration of the ice layer can be used to reflect the impulse force working on itself, and the initial acceleration is positively correlated with the impulse force. The initial accelerations of the ice layer under different cases are given in Figure 8.
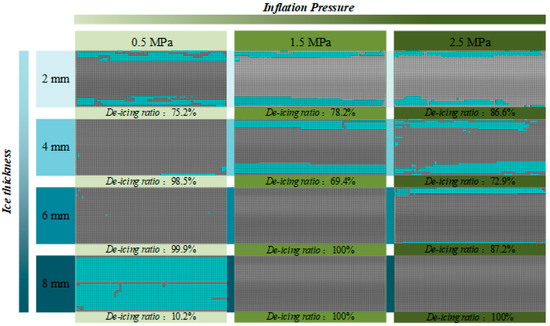
Figure 7.
The simulation results of deicing performances.
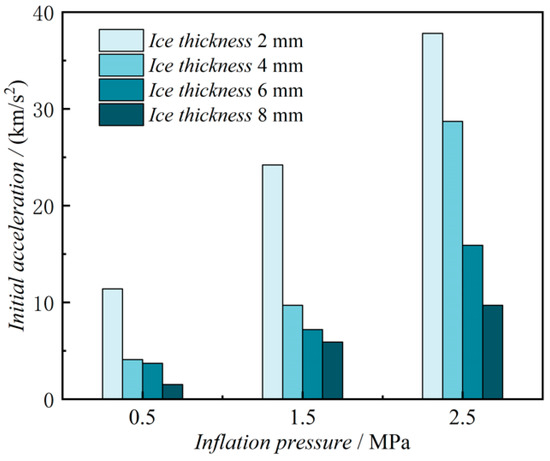
Figure 8.
The initial acceleration of the ice layer under different cases.
As shown in Figure 7, with the inflation pressure increasing, the deicing ratio of 2 mm ice shows an increasing trend. Enhancing the inflation pressure could improve the impulse force working on the ice layer (refer to Figure 8) and shear stress at the ice/aluminum interface (shown in Figure 9). Consequently, more ice layers will be peeled off. Because the shear stress at the ice/aluminum interface is less than 0.5 MP, part of the ice layer still sticks on the edges.
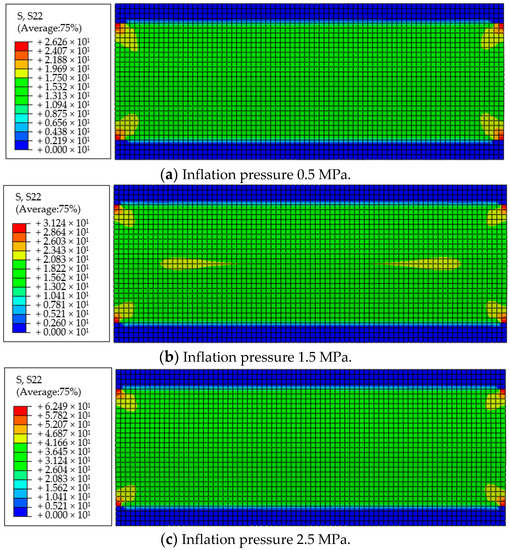
Figure 9.
The shear stress distribution at the ice/aluminum interface with a 2 mm ice layer.
An interesting result is that the deicing ratio of the 4 mm ice layer under 0.5 MPa is much larger than under 1.5 MPa and 2.5 MPa. The explanation for the result is that the 4 mm ice layer is difficult to break off under 0.5 MPa due to the increased stiffness caused by the ice layer thickening, and although the shear stress on the edges could be ignored, the middle ice layer will drag off the ice layer on the edges by inertia (shown in Figure 10a). Conversely, the 4 mm ice layer cracks more easily under larger inflation pressure, and the ice layer on the edges cannot be dragged off by the middle ice layer (shown in Figure 10b).
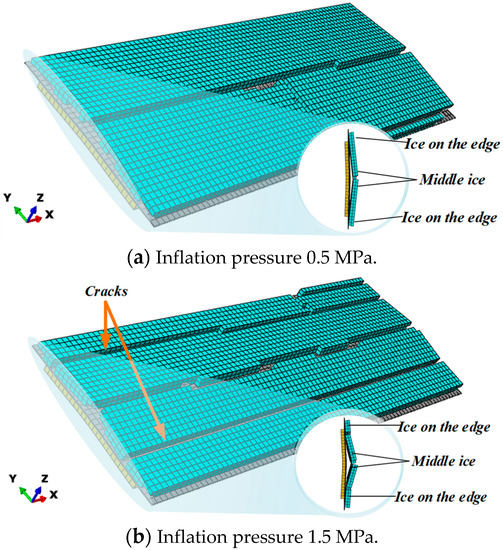
Figure 10.
The fractured state of the 4 mm ice layer.
When the ice thickness reaches 6 mm, the simulation shows better deicing performances under 0.5 MPa and 1.5 MPa, with deicing ratios of 99.9% and 100%, respectively. The stiffness of the ice layer increases further, which makes the ice layer harder to break up on the edges. Therefore, the 6 mm ice layer under 0.5 MPa or 1.5 MPa is peeled off as the 4 mm ice layer under 0.5 MPa inflation pressure. However, with the inflation pressure reaching 2.5 MPa, cracks show up on the edges of the ice layer, leading to a small part of the ice layer leaving on the aluminum surface.
For the 8 mm ice layer, only cracks appear when the inflation pressure is 0.5 MPa, and this is because the shear stresses at the ice/aluminum interface are less than 0.5 MPa (shown in Figure 11). However, the deicing ratios are both 100% when the inflation pressure is 1.5 MPa and 2.5 MPa. This result suggests that the thicker the ice, the easier it is to be peeled off as a whole.
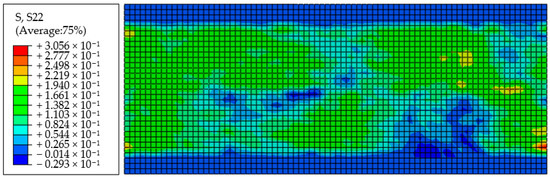
Figure 11.
The shear stress distribution at the ice/aluminum interface with 8 mm ice under 0.5 MPa.
The result of the maximum displacement of the aluminum skin is given in Figure 12. As we can see, with the inflation pressure increasing, the maximum displacement increases obviously. As a whole, the most significant displacement is less than 2 mm, which indicates that this revised pneumatic impulse deicing structure can shrink the deformation of the protected surface.
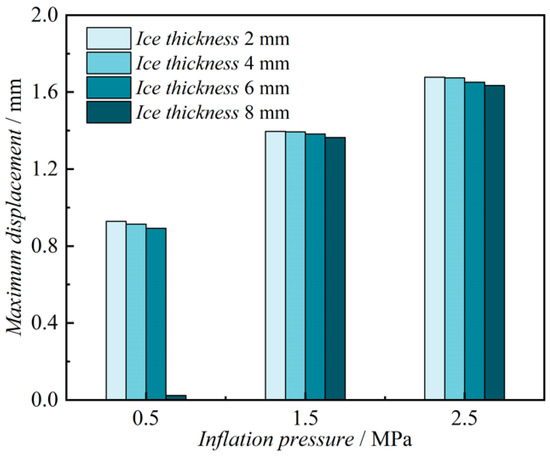
Figure 12.
The maximum displacement of the aluminum skin.
5. Icing and Deicing Experiments
5.1. Experiment Facility and Specimen
The experimental investigations were carried out in an artificial climate chamber (shown in Figure 13a). The chamber has a length of 4 m and an inner diameter of 2 m. The temperature in the chamber can be adjusted from −1.1 to −36 °C. Six icing nozzles operated by aerosolizing pressurized air and water are used to provide super-cooled water droplets. The bottom of the chamber is equipped with a high-power fan, which can realize multi-speed wind speed regulation. The icing parameters settings in the climate chamber are based on the environmental parameters recorded at Xuefeng Mountain Energy Equipment Safety National Observation and Research Station (shown in Figure 13b), which is located in Hunan Province, South Central China [30]. The climate belongs to the subtropical monsoon humid type, with an average annual rainfall of 1810 mm and an average annual temperature of 12.7 °C.
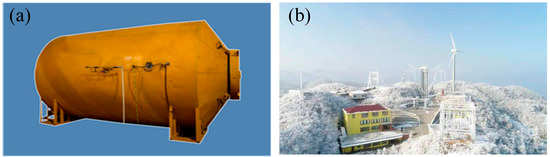
Figure 13.
(a) The artificial climate chamber; (b) the Xuefeng Mountain outdoor experimental station.
The facilities used in deicing experiments are shown in Figure 14. Firstly, a collecting cylinder is used to store pressurized air generated by an air compressor, and the pressurized air in the collecting cylinder is used to inflate the tube in the specimen. Then, a solenoid valve is used to control the inflation of the specimen. The solenoid valve is powered by a DC source. When energized, the valve opens, and the pressurized air rushes into the specimen. When powered off, the valve is closed, and the pressurized air escapes from the outlet of the specimen. A point switch is used to control the solenoid valve’s power-on and power-off, and the power-on duration is usually 3~4 ms. The specimens were manufactured according to Figure 3 and Table 2, with the length increasing to 400 mm.
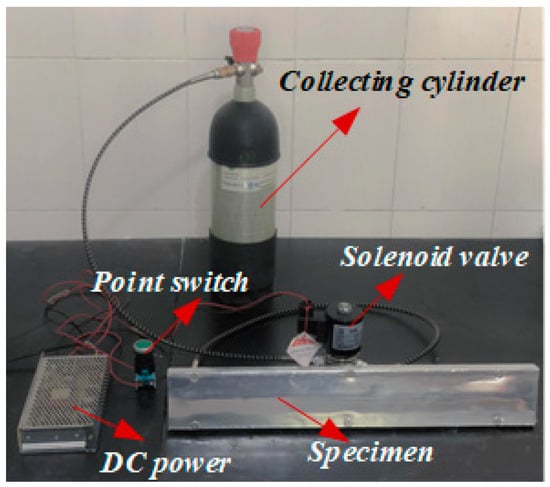
Figure 14.
The facilities used in deicing experiments.
5.2. Experiment Procedure
Based on the long-term monitoring of the icing phenomenon on Xuefeng Mountain, when the severe icing phenomenon (the ice type is mixed ice) occurs on wind turbine blades, the range of the main meteorological parameters is shown in Table 3 [15]. Therefore, during the icing test, the climate chamber’s temperature, wind velocity, and liquid water content were set as −6 °C, 6.5 m/s and 0.28 g/m3, respectively. The test arrangement in the climate chamber is shown in Figure 15a. During the icing test, a vernier caliper was used to measure the ice thickness on the specimen every five minutes (Figure 15b). Under the icing condition, the ice type on the specimen’s surface was mixed ice. The thickness of the ice-covered specimen was measured at six random places. According to Formula (9), the average icing thickness is obtained. When the average ice thickness reaches the required value, stop spraying water and begin to carry out the deicing test.
where have is the average ice thickness, hi is the icing thickness measured at i time, and hb is the thickness of the baseboard.
Table 3.
Meteorological parameters of severe icing phenomenon on Xuefeng Mountain.

Figure 15.
(a) The test arrangement in the climate chamber; (b) measuring the ice thickness.
5.3. Deicing Test Results
The deicing experiment results are given in Figure 16. By drawing the residual ice layer’s shape, the deicing ratio could be calculated. The relative error of the deicing ratio between the simulation result and the experimental result is displayed in Figure 17.
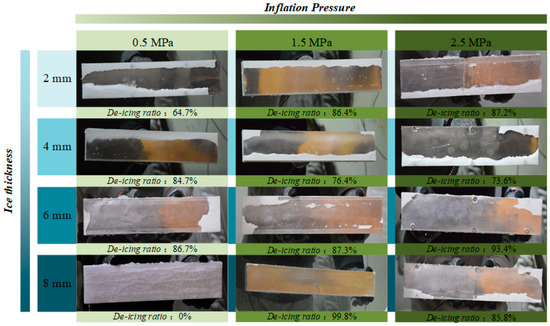
Figure 16.
The test results of deicing performances.
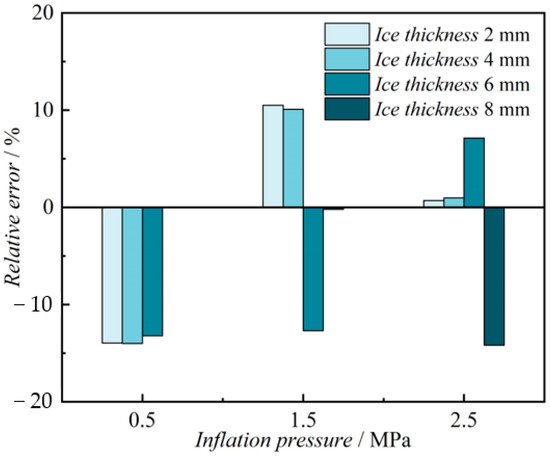
Figure 17.
The relative error of the deicing ratio.
As shown in Figure 16 and Figure 17, the experimental deicing areas are similar to the corresponding simulation results. The absolute relative error of the deicing ratio is less than 14.1%, which suggests that the numerical simulation method can accurately reflect the actual deicing performance.
The actual deicing performances using 0.5 MPa inflation pressure are worse than the corresponding simulation results. However, the deicing ratios of the experiments using 1.5 MPa or 2.5 MPa are usually larger than the simulation with a high probability. A possible explanation is that the actual inflation pressure, mainly referring to 0.5 MPa, dissipates faster than the simulation, which suggests that using higher inflation pressure, mainly referring to 1.5 MPa or 2.5 MPa, could bring better deicing performances.
When using 1.5 MPa or 2 MPa inflation pressure, the deicing ratios of 6 mm and 8 mm ice layer are larger than 2 mm and 4 mm, which suggests that the thickening of the ice layer could improve the deicing performance, and this proves the point that the thicker the ice, the easier it is to be peeled off as a whole.
The maximum displacement of the specimen under different inflation pressures by an oscilloscope and an infrared displacement meter is shown in Figure 18. Due to the ice layer having slight effects on the maximum displacement (refer to Figure 8), the results in Figure 18 are measured without icing conditions. As we can see, the maximum displacement under 0.5 MPa, 1.5 MPa, and 2.5 MPa is 1.06 mm, 1.58 mm, and 1.83 mm, respectively, and the relative errors with the corresponding simulation results are 14.1%, 13.1%, and 9.1% respectively. On the one hand, this indicates that the simulation results are consistent with the experiment results and proves that this revised pneumatic deicing structure can shrink the displacement of the protected surface. On the other hand, the displacement difference between 0.5 MPa and 1.5 MPa is larger than between 1.5 MPa and 2.5 MPa, which proves that the 0.5 MPa inflation pressure dissipates faster than 1.5 MPa and 2.5 MPa.
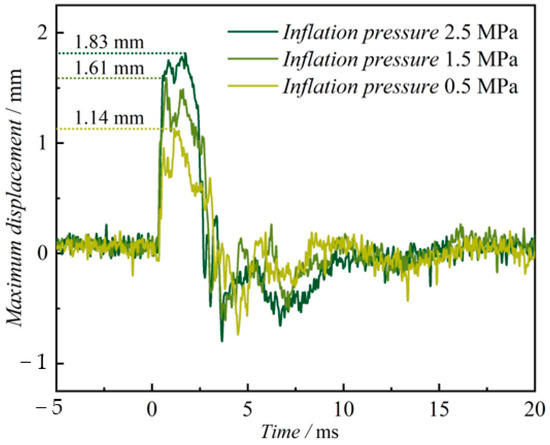
Figure 18.
The maximum displacement of the specimen under different inflation pressures.
6. Conclusions
A simplified numerical simulation model based on the revised pneumatic deicing structure has been proposed in this paper to estimate the deicing performance of the ice layer. Corresponding experiments have been conducted on specimens to provide subsequent validation for the numerical model. According to the above investigations, deductions and suggestions of this article are as follows:
- (1)
- The experimental results are consistent with the numerical simulation results, and the maximum absolute relative error of the deicing ratio is 14.1%. Comparative analyses of the numerical and experimental results verify that the pneumatic impulse deicing structure can eliminate the ice layer with smaller displacement and shorter time than the conventional pneumatic deicing boot.
- (2)
- Simulation and experimental results indicate that the pneumatic deicing structure performs better under an ice thickness of 6 mm or 8 mm and an inflation pressure of 1.5 MPa or 2.5 MPa. The main reason for this phenomenon is that the ice layer is difficult to break off near the edges, and the middle ice layer will drag the ice layer on the edges off as a whole. In practical application, the deicing operation could be launched when the ice thickness reached a certain value, usually 6 mm, and the pneumatic impulse deicing method would perform better.
- (3)
- Although using 0.5 MPa inflation pressure could reduce the pressure charge time and save energy, according to the experiment results, the deicing performances are worse than the simulation results due to the fast dissipation. Therefore, a higher inflation pressure, such as 1.5 MPa or 2.5 MPa, is recommended in practical application.
Author Contributions
Conceptualization, L.S. and X.J.; methodology, Z.Y.; software, Z.Y.; investigation, Z.Y. and X.J.; writing—original draft preparation, Z.Y.; writing—review and editing, L.S. and X.J.; supervision, L.S., Q.H. and X.J.; funding acquisition, L.S. and Q.H. All authors have read and agreed to the published version of the manuscript.
Funding
This research was funded by the National Natural Science Foundation of China, grant numbers 52077020 and 51977016.
Institutional Review Board Statement
Not applicable.
Informed Consent Statement
Not applicable.
Data Availability Statement
The original data contributions presented in the study are included in the article; further inquiries can be directed to the corresponding authors.
Conflicts of Interest
The authors declare no conflict of interest.
References
- Shu, L.; Qiu, G.; Hu, Q.; Jiang, X.; McClure, G.; Yang, H. Numerical and field experimental investigation of wind turbine dynamic de-icing process. J. Wind Eng. Ind. Aerodyn. 2018, 175, 90–99. [Google Scholar] [CrossRef]
- Han, Y.; Palacios, J.; Schmitz, S. Scaled ice accretion experiments on a rotating wind turbine blade. J. Wind. Eng. Ind. Aerodyn. 2012, 109, 55–67. [Google Scholar] [CrossRef]
- Fakorede, O.; Feger, Z.; Ibrahim, H.; Ilinca, A.; Perron, J.; Masson, C. Ice protection systems for wind turbines in cold climate: Characteristics, comparisons and analysis. Renew. Sustain. Energy Rev. 2016, 65, 662–675. [Google Scholar] [CrossRef]
- Hu, L.; Zhu, X.; Hu, C.; Chen, J.; Du, Z. Wind turbines ice distribution and load response under icing conditions. Renew. Energy 2017, 113, 608–619. [Google Scholar] [CrossRef]
- Lamraoui, F.; Fortin, G.; Benoit, R.; Perron, J.; Masson, C. Atmospheric icing impact on wind turbine production. Cold Reg. Sci. Technol. 2014, 100, 36–49. [Google Scholar] [CrossRef]
- Wang, Y.; Xu, Y.; Su, F. Damage accumulation model of ice detach behavior in ultrasonic de-icing technology. Renew. Energy 2020, 153, 1396–1405. [Google Scholar] [CrossRef]
- Wei, K.; Yang, Y.; Zuo, H.; Zhong, D. A review on ice detection technology and ice elimination technology for wind turbine. Wind Energy 2020, 3, 433–457. [Google Scholar] [CrossRef]
- Qin, C.; Mulroney, A.T.; Gupta, M.C. Anti-icing epoxy resin surface modified by spray coating of PTFE Teflon particles for wind turbine blades. Mater. Today Commun. 2020, 22, 100770. [Google Scholar] [CrossRef]
- Bhushan, B.; Multanen, V. Designing liquid repellent, icephobic and self-cleaning surfaces with high mechanical and chemical durability. Philos. Trans. R. Soc. A-Math. Phys. Eng. Sci. 2019, 377, 20180270. [Google Scholar] [CrossRef]
- Parent, O.; Ilinca, A. Anti-icing and de-icing techniques for wind turbines: Critical review. Cold Reg. Sci. Technol. 2011, 65, 88–96. [Google Scholar] [CrossRef]
- Roberge, P.; Lemay, J.; Ruel, J.; Bégin-Drolet, A. Field analysis, modeling and characterization of wind turbine hot air ice protection systems. Cold Reg. Sci. Technol. 2019, 163, 19–26. [Google Scholar] [CrossRef]
- Liu, X.; Zhao, Y.; Liu, W.; Yan, D. Microwave heating and deicing efficiency for asphalt concrete with SiC–Fe3O4 microwave enhanced functional layer. J. Clean. Prod. 2021, 332, 130111. [Google Scholar] [CrossRef]
- Ha, J.-H.; Hong, S.-K.; Ryu, J.-K.; Bae, J.; Park, S.-H. Development of Multi-Functional Graphene Polymer Composites Having Electromagnetic Interference Shielding and De-Icing Properties. Polymers 2020, 11, 2101. [Google Scholar] [CrossRef]
- Shu, L.; Qiu, G.; Hu, Q.; Jiang, X.; McClure, G.; Liu, Y. Numerical and experimental investigation of threshold de-icing heat flux of wind turbine. J. Wind. Eng. Ind. Aerodyn. 2018, 174, 296–302. [Google Scholar] [CrossRef]
- Zhao, Z.; Chen, H.; Liu, X.; Wang, Z.; Zhu, Y.; Zhou, Y. The development of electric heating coating with temperature controlling capability for anti-icing/deicing. Cold Reg. Sci. Technol. 2021, 184, 103234. [Google Scholar] [CrossRef]
- Wang, Y.; Jiang, X. Design Research and Experimental Verification of the Electro-Impulse De-Icing System for Wind Turbine Blades in the Xuefeng Mountain Natural Icing Station. IEEE Access 2020, 8, 28915–28924. [Google Scholar] [CrossRef]
- Wang, Y.; Xu, Y.; Lei, Y. An effect assessment and prediction method of ultrasonic de-icing for composite wind turbine blades. Renew. Energy 2018, 118, 1015–1023. [Google Scholar] [CrossRef]
- Daniliuk, V.; Xu, Y.; Liu, R.; He, T.; Wang, X. Ultrasonic de-icing of wind turbine blades: Performance comparison of perspective transducers. Renew. Energy 2020, 145, 2005–2018. [Google Scholar] [CrossRef]
- Shi, Z.; Zhao, Y.; Ma, C.; Zhang, J. Parametric Study of Ultrasonic De-Icing Method on a Plate with Coating. Coatings 2020, 10, 631. [Google Scholar] [CrossRef]
- Yamazaki, M.; Jemcov, A.; Sakaue, H. A Review on the Current Status of Icing Physics and Mitigation in Aviation. Aerospace 2021, 8, 188. [Google Scholar] [CrossRef]
- Thomas, S.K.; Cassoni, R.P.; MacArthur, C.D. Aircraft anti-icing and de-icing techniques and modeling. J. Aircr. 1996, 33, 841–854. [Google Scholar] [CrossRef]
- Weisend, N.A. Design of an advanced pneumatic deicer for the composite rotor blade. J. Aircr. 1989, 26, 947–950. [Google Scholar] [CrossRef]
- Palacios, J.; Wolfe, D.; Bailey, M.; Szefi, J. Ice Testing of a Centrifugally Power Pneumatic deicing system for helicopter rotor blades. J. Am. Helicopter Soc. 2016, 60, 1–12. [Google Scholar] [CrossRef]
- Laforte, C.; Laforte, J.-L. Deicing Strains and Stresses of Iced Substrates. J. Adhes. Sci. Technol. 2012, 26, 603–620. [Google Scholar] [CrossRef]
- Dong, W.; Ding, J.; Zhou, Z. Experimental Study on the Ice Freezing Adhesive Characteristics of Metal Surfaces. J. Aircr. 2014, 51, 719–726. [Google Scholar] [CrossRef]
- Schulson, E. The brittle compressive fracture of ice. Acta Metall. Mater. 1990, 38, 1963–1976. [Google Scholar] [CrossRef]
- Schulson, E.M.; Iliescu, D.; Renshaw, C.E. On the initiation of shear faults during brittle compressive failure: A new mechanism. J. Geophys. Res. Solid Earth 1999, 104, 695–705. [Google Scholar] [CrossRef]
- Petrovic, J.J. Review Mechanical properties of ice and snow. J. Mater. Sci. 2003, 38, 1–6. [Google Scholar] [CrossRef]
- Georges, D.; Saletti, D.; Montagnat, M.; Forquin, P.; Hagenmuller, P. Infuence of Porosity on Ice Dynamic Tensile Behavior as Assessed by Spalling Test. J. Dyn. Behav. Mater. 2021, 7, 575–590. [Google Scholar] [CrossRef]
- Shu, L.; Li, H.; Hu, Q.; Jiang, X.; Qiu, G.; McClure, G.; Yang, H. Study of ice accretion feature and power characteristics of wind turbines at natural icing environment. Cold Reg. Sci. Technol. 2018, 147, 45–54. [Google Scholar] [CrossRef]


Disclaimer/Publisher’s Note: The statements, opinions and data contained in all publications are solely those of the individual author(s) and contributor(s) and not of MDPI and/or the editor(s). MDPI and/or the editor(s) disclaim responsibility for any injury to people or property resulting from any ideas, methods, instructions or products referred to in the content. |
© 2023 by the authors. Licensee MDPI, Basel, Switzerland. This article is an open access article distributed under the terms and conditions of the Creative Commons Attribution (CC BY) license (https://creativecommons.org/licenses/by/4.0/).