Article

Hydrodynamic Response Analysis of a Fixed Aquaculture Platform with a Horizontal Cylindrical Cage in Combined Waves and Currents

1
Key Laboratory of Far-Shore Wind Power Technology of Zhejiang Province, Hangzhou 311122, China
2
Power China Huadong Engineering Corporation Limited, Hangzhou 311122, China
3
Key Laboratory of Mariculture, Ministry of Education, Ocean University of China, Qingdao 266003, China
4
College of Engineering, Ocean University of China, Qingdao 266100, China
5
State Key Laboratory of Coastal and Offshore Engineering, Dalian University of Technology, Dalian 116024, China
*
Author to whom correspondence should be addressed.
J. Mar. Sci. Eng. 2023, 11(7), 1413; https://doi.org/10.3390/jmse11071413
Submission received: 13 June 2023 / Revised: 12 July 2023 / Accepted: 12 July 2023 / Published: 14 July 2023
(This article belongs to the Special Issue New Techniques and Equipment in Large Offshore Aquaculture Platform)

Abstract

:
Biofouling on net cages adversely affects structural safety and the growth of aquacultural fish. Therefore, a novel fixed aquaculture platform with a rotatable horizontal cylindrical cage is proposed in this study, which is convenient for the cleaning of biofouling. Based on ANSYS, the numerical model of the fixed aquaculture platform was established. The response results of the strain, acceleration, and displacement of the structure under the combined action of waves and currents at three typical attack angles were calculated. The effects of water depth and cage rotation on the hydrodynamic response of the structure are discussed. The results show that the strain, acceleration, and displacement of the cage increase with the increase in wave height; however, the change with the wave period is not obvious. The direction perpendicular to the long axis of the cage is the most unfavorable load direction. The acceleration of each position increases with the increase in water depth; however, the strain response has the opposite trend. When the rotation constraint of the horizontal cylindrical cage is released, the acceleration of the cage is larger than that when the cage is fixed. The rotation of the cage has a tiny effect on the structural strain and load acting on the structure.

1. Introduction

The development of offshore mariculture cannot be separated from the support of large-scale aquaculture facilities and equipment. The seabed of China’s Bohai Sea, Yellow Sea, and East China Sea is basically located on the continental shelf, and the water depth of most of the sea areas that can be developed and utilized is within 50 m. Considering the particularity of the sea environment, the applicable water depth for offshore aquaculture facilities in China should not be too deep. Therefore, a fixed aquaculture platform is very suitable for China’s industrial needs. Fixed aquaculture platforms have strong resistance to wind and waves, large aquaculture water volume, and are easy to integrate with automatic and intelligent equipment. These platforms have been rapidly developed and applied in China in recent years. In addition, biofouling is a major industrial problem facing aquaculture [1]. When fouling organisms attach to the net, this leads to a low exchange rate for water inside aquaculture facilities and a sharp increase in external environmental loads [2,3,4,5], which will directly affect the quality of cultured fish and the structural safety of facilities. However, the main structure of the aquaculture platform is located underwater, and the biofouling attached to the structure is difficult to remove. Biofouling, such as the accumulation of shellfish, hydroids, and marine mollusks, leads to unwanted organisms attaching themselves to aquaculture nets and can multiply quickly, causing a universal problem for aquaculture nets. Biofouling can impair water exchange and increase the risk of disease in farmed fish. In addition, biofouling can significantly increase the hydrodynamic load on the net. Anti-biofouling technology mainly adopts ultrasonic cleaning and high-pressure water cleaning methods. Ultrasonic cleaning, which has low labor costs and high efficiency, requires the use of professional equipment. However, the professional equipment is generally expensive, and some technical problems have not been solved. High-pressure water jet cleaning is a mainly manual operation, and the cost is relatively low. However, it is inefficient and has limited performance when operating underwater. If shore-based cleaning operations are desired, the biofouled net needs to be replaced and moved onshore, which will increase the cost of the cleaning process and incur additional labor costs. In view of this, this study proposes a fixed aquaculture platform with a cylindrical cage that can rotate around the horizontal axis. The structure can rotate the nets above the water surface and then clean with high-pressure water jets, which greatly improves cleaning efficiency and reduces costs (Figure 1).
There are many studies about the dynamic characteristics of different forms of fixed offshore engineering structures under marine environmental loads [6,7,8,9,10]. Different from the traditional marine engineering structure, the emerging aquaculture cage platform structure is more complex. In particular, the existence of the net system further aggravates the interaction between the wave current and the cage structure. At present, many scholars have used various means to research net cages from the aspect of flow fields [11,12,13,14,15], wave field distribution [16,17,18], and dynamic response [19,20,21,22,23,24,25,26]. However, most of the above studies are aimed at the hydrodynamic characteristics of floating cages. In terms of recent studies, Kim et al. [22] studied the hydrodynamic response of a submersible abalone aquaculture cage under environmental load. Zhao et al. [27] conducted an experimental study of the hydrodynamic characteristics of a column-stabilized fish cage combined with the finite element method and the least squares method. Zhao et al. [28] then numerically investigated nonlinear wave loads on a trestle-netting enclosure aquaculture facility using a finite element model based on stream function wave theory.
In summary, the existing research on fixed aquaculture facilities is still limited. Therefore, in this study, the hydrodynamic characteristics of the proposed fixed aquaculture platform were investigated. The effects of parameters such as attack angle and draft state on the hydrodynamic response were explored. On this basis, the influence of cage rotation was also calculated. The main purpose of the numerical simulations conducted for cages without rotation constraints was to find out the influence of cage rotation on the hydrodynamic response of the structure. The simulation results can provide technical support for the selection of materials and the design of structures. It is expected to provide a reference for engineering applications.

2. Numerical Method

The main components of the fixed aquaculture platform are the frame and the nets. They can be treated as cylinders of different diameters. The ratio of the diameter of the cylinder (D) to wave length (L) satisfies D/L < 0.2. Therefore, the load on the structure can be calculated using a Morison equation in combined waves and currents [29].

2.1. Governing Equation

The governing equation is as follows [30]:
[ M ] { u ¨ } + [ C ] { u ¨ } + [ K ] { u ¨ } = { f } ,
where M represents the mass matrix; u ¨ represents the acceleration vector; C represents the damping matrix; u ˙ represents the velocity vector; K represents the stiffness matrix; u represents the displacement vector; and f represents the load vector.
f is given by [31]:
f = ρ A v ¨ + ρ C a A v ¨ u ¨ + 1 2 ρ C D D e v ˙ u ˙ v ˙ u ˙ ,
where ρ is the density of water, A   represents the cross-sectional area of the component, C a   represents the added mass coefficient, v ¨   represents the acceleration of water particles, C D   represents the drag coefficient, v ˙ represents the velocity of water particles, and D e is the diameter of the component. In ANSYS, when waves and currents act together, the parameter KCRC can be used to determine the calculation method of a water particle’s velocity.
The inertia coefficient is C M = C a + 1 ; thus, Equation (2) is equivalent to the following equation:
f = ρ C a A u ¨ + ρ C M A   v ¨ + 1 2 ρ C D D e v ˙ u ˙ v ˙ u ˙ .
Thus, the governing equation is as follows:
M u ¨ + C u ˙ + K u = ρ C a A u ¨ + ρ C M A   v ¨ + 1 2 ρ C D D e v ˙ u ˙ v ˙ u ˙ .
Moving the first term from the right to the left in the above equation, the final expression is
M + M a u ¨ + C u ˙ + K u = ρ C M A   v ¨ + 1 2 ρ C D D e v ˙ u ˙ v ˙ u ˙ ,
where M a = ρ C a A .
The fifth-order Stokes wave theory [32] is adopted in the numerical simulation. The η , v ˙ X , and v ˙ Z values are given by
η = 1 k n = 1 5 λ n cos n k x ω t ,
v ˙ X = c n = 1 5 n λ n cosh n k z + d cos n k x ω t ,
v ˙ Z = c n = 1 5 n λ n sinh n k z + d sin n k x ω t ,
where η represents the free surface, v ˙ X represents the velocity component along the X direction, and v ˙ Z represents the velocity component along the Z direction.
According to the above equations, the force of the structure can be calculated, and the displacement, acceleration, and strain can thus be solved.

2.2. Finite Element Model

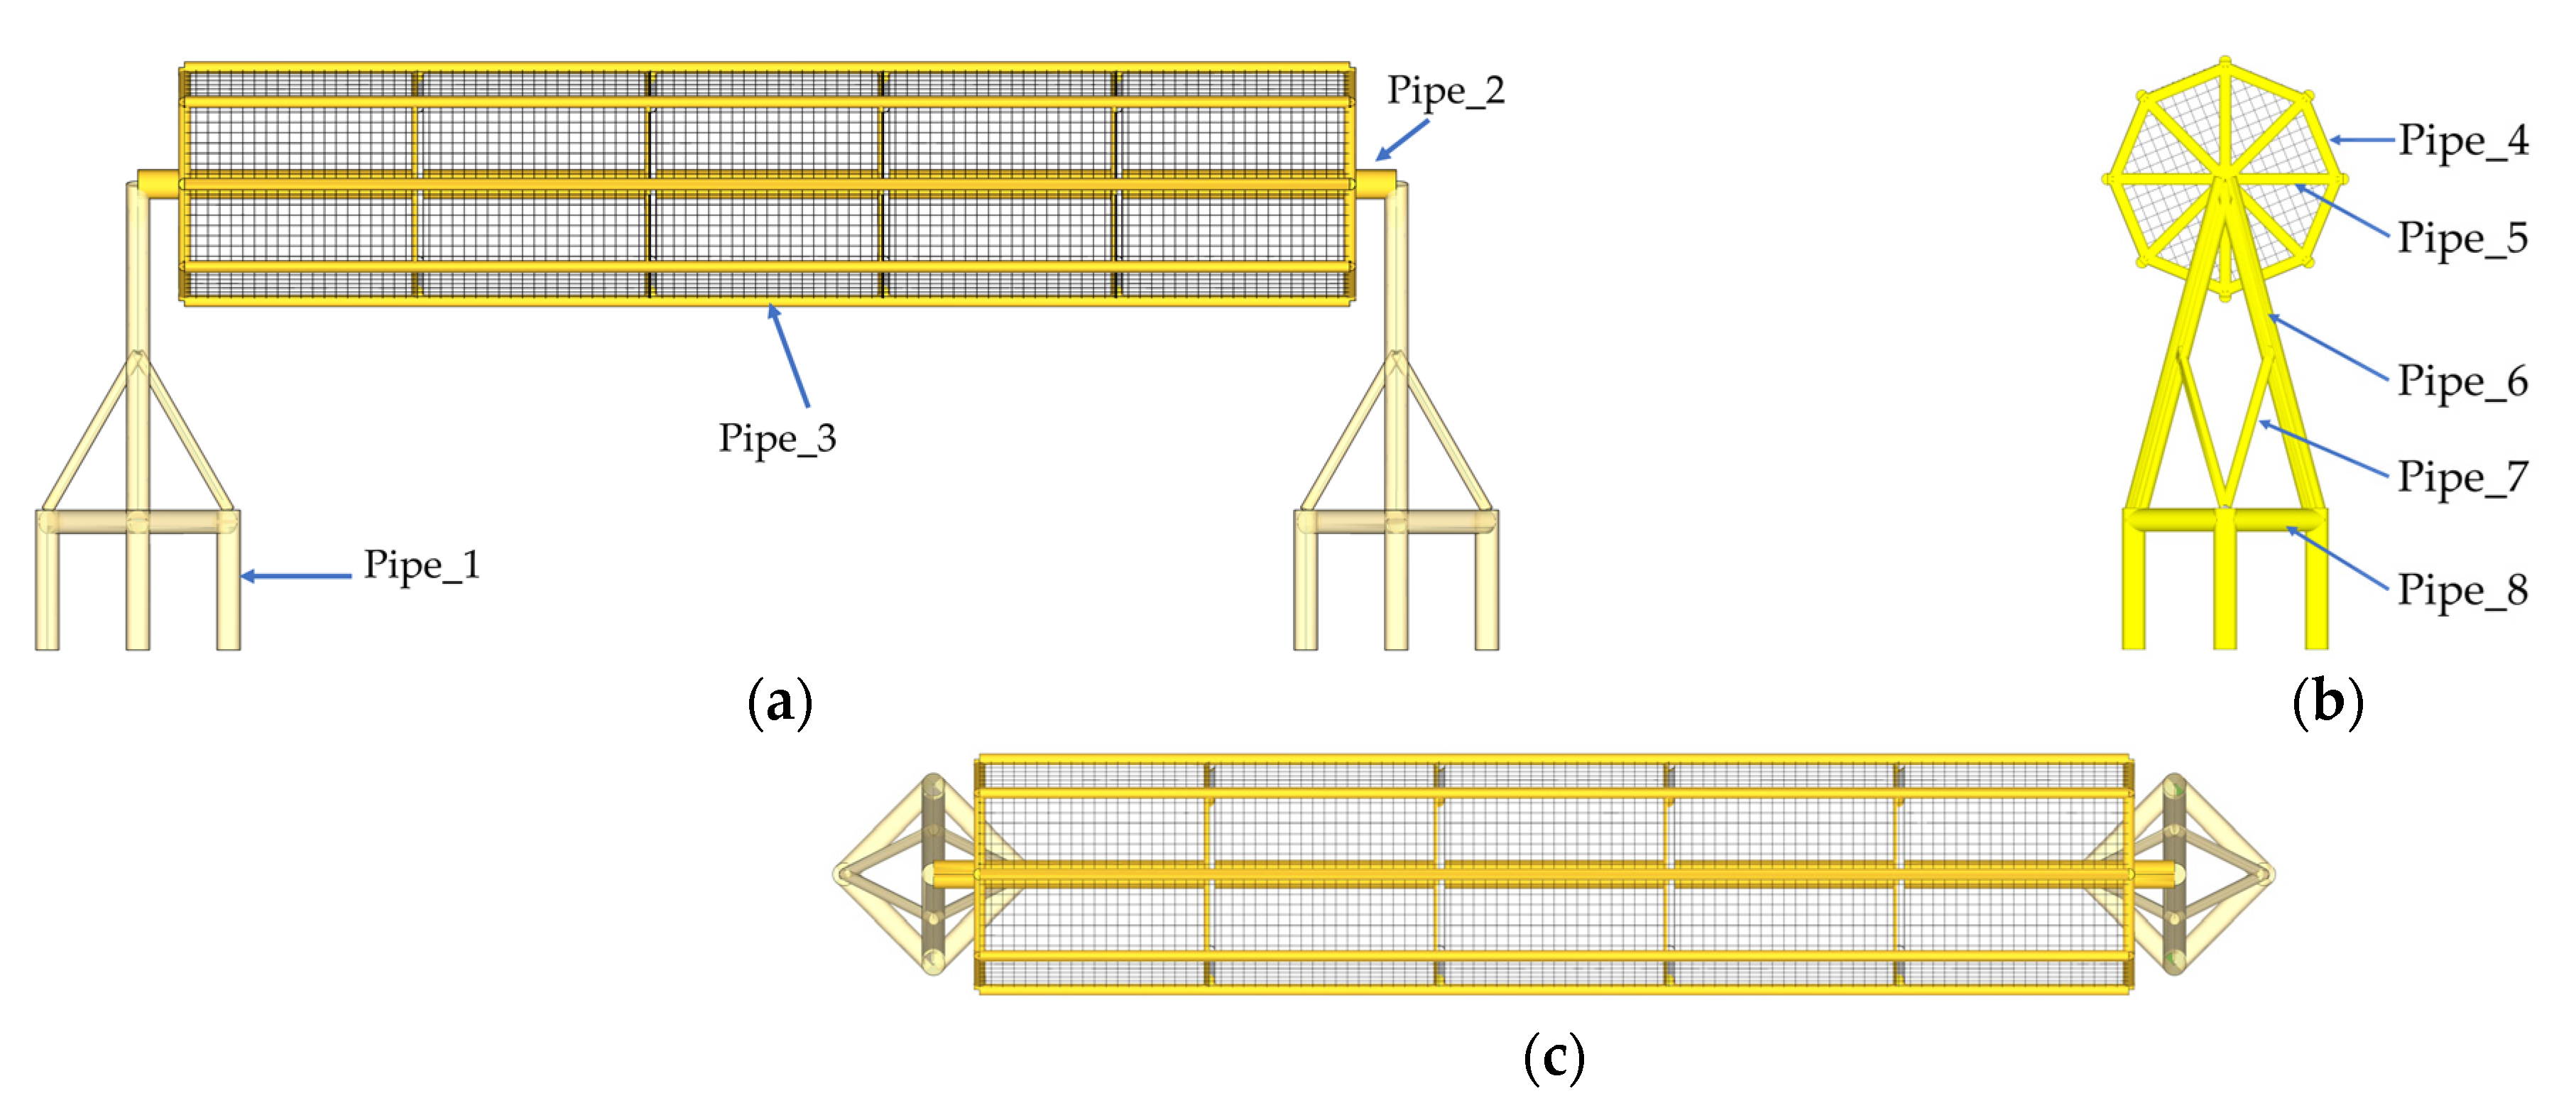
The numerical model of the structure is simulated by pipe element members with PIPE20 and PIPE59. The PIPE59 element can be used to simulate members with wave and current loads. The element can consider axial torsion, bending, tension, and compression deformation, which is suitable for nonlinear large strain problems. Therefore, the structure above the mud surface is simulated by PIPE59. The PIPE20 element has the functions of tension, compression, torsion, and bending and can be used to simulate the pile–soil interaction [33]. Thus, PIPE20 is used to simulate the structure below the mud surface. The component dimensions of the fixed aquaculture platform model are shown in Table 1. The three views of the fixed aquaculture platform are shown in Figure 2. Pipe_1 is the pile foundation, Pipe_2 is the central rotating shaft, Pipe_3 is the transverse support of the net cage, Pipe_4 is the longitudinal support of the net cage, Pipe_5 is the radial support of the net cage, Pipe_6 is the oblique brace of the tower, Pipe_7 is the supporting rod of the tower, and Pipe_8 is the bearing column.
The material of the net was polyamide, and PIPE59 was used for simulations. Polyamide has the advantage of high wear resistance. Compared with steel nets, polyamide nets have the advantages of low cost and light weight. In the simulation, the gravity similarity criterion and the model calculation method of variable scale were used. Additionally, the mesh grouping method was adopted to improve calculation speed. The twine diameter was 2 mm, the length of mesh bars was 20 mm, and the net solidity ratio was Sn = 0.2.
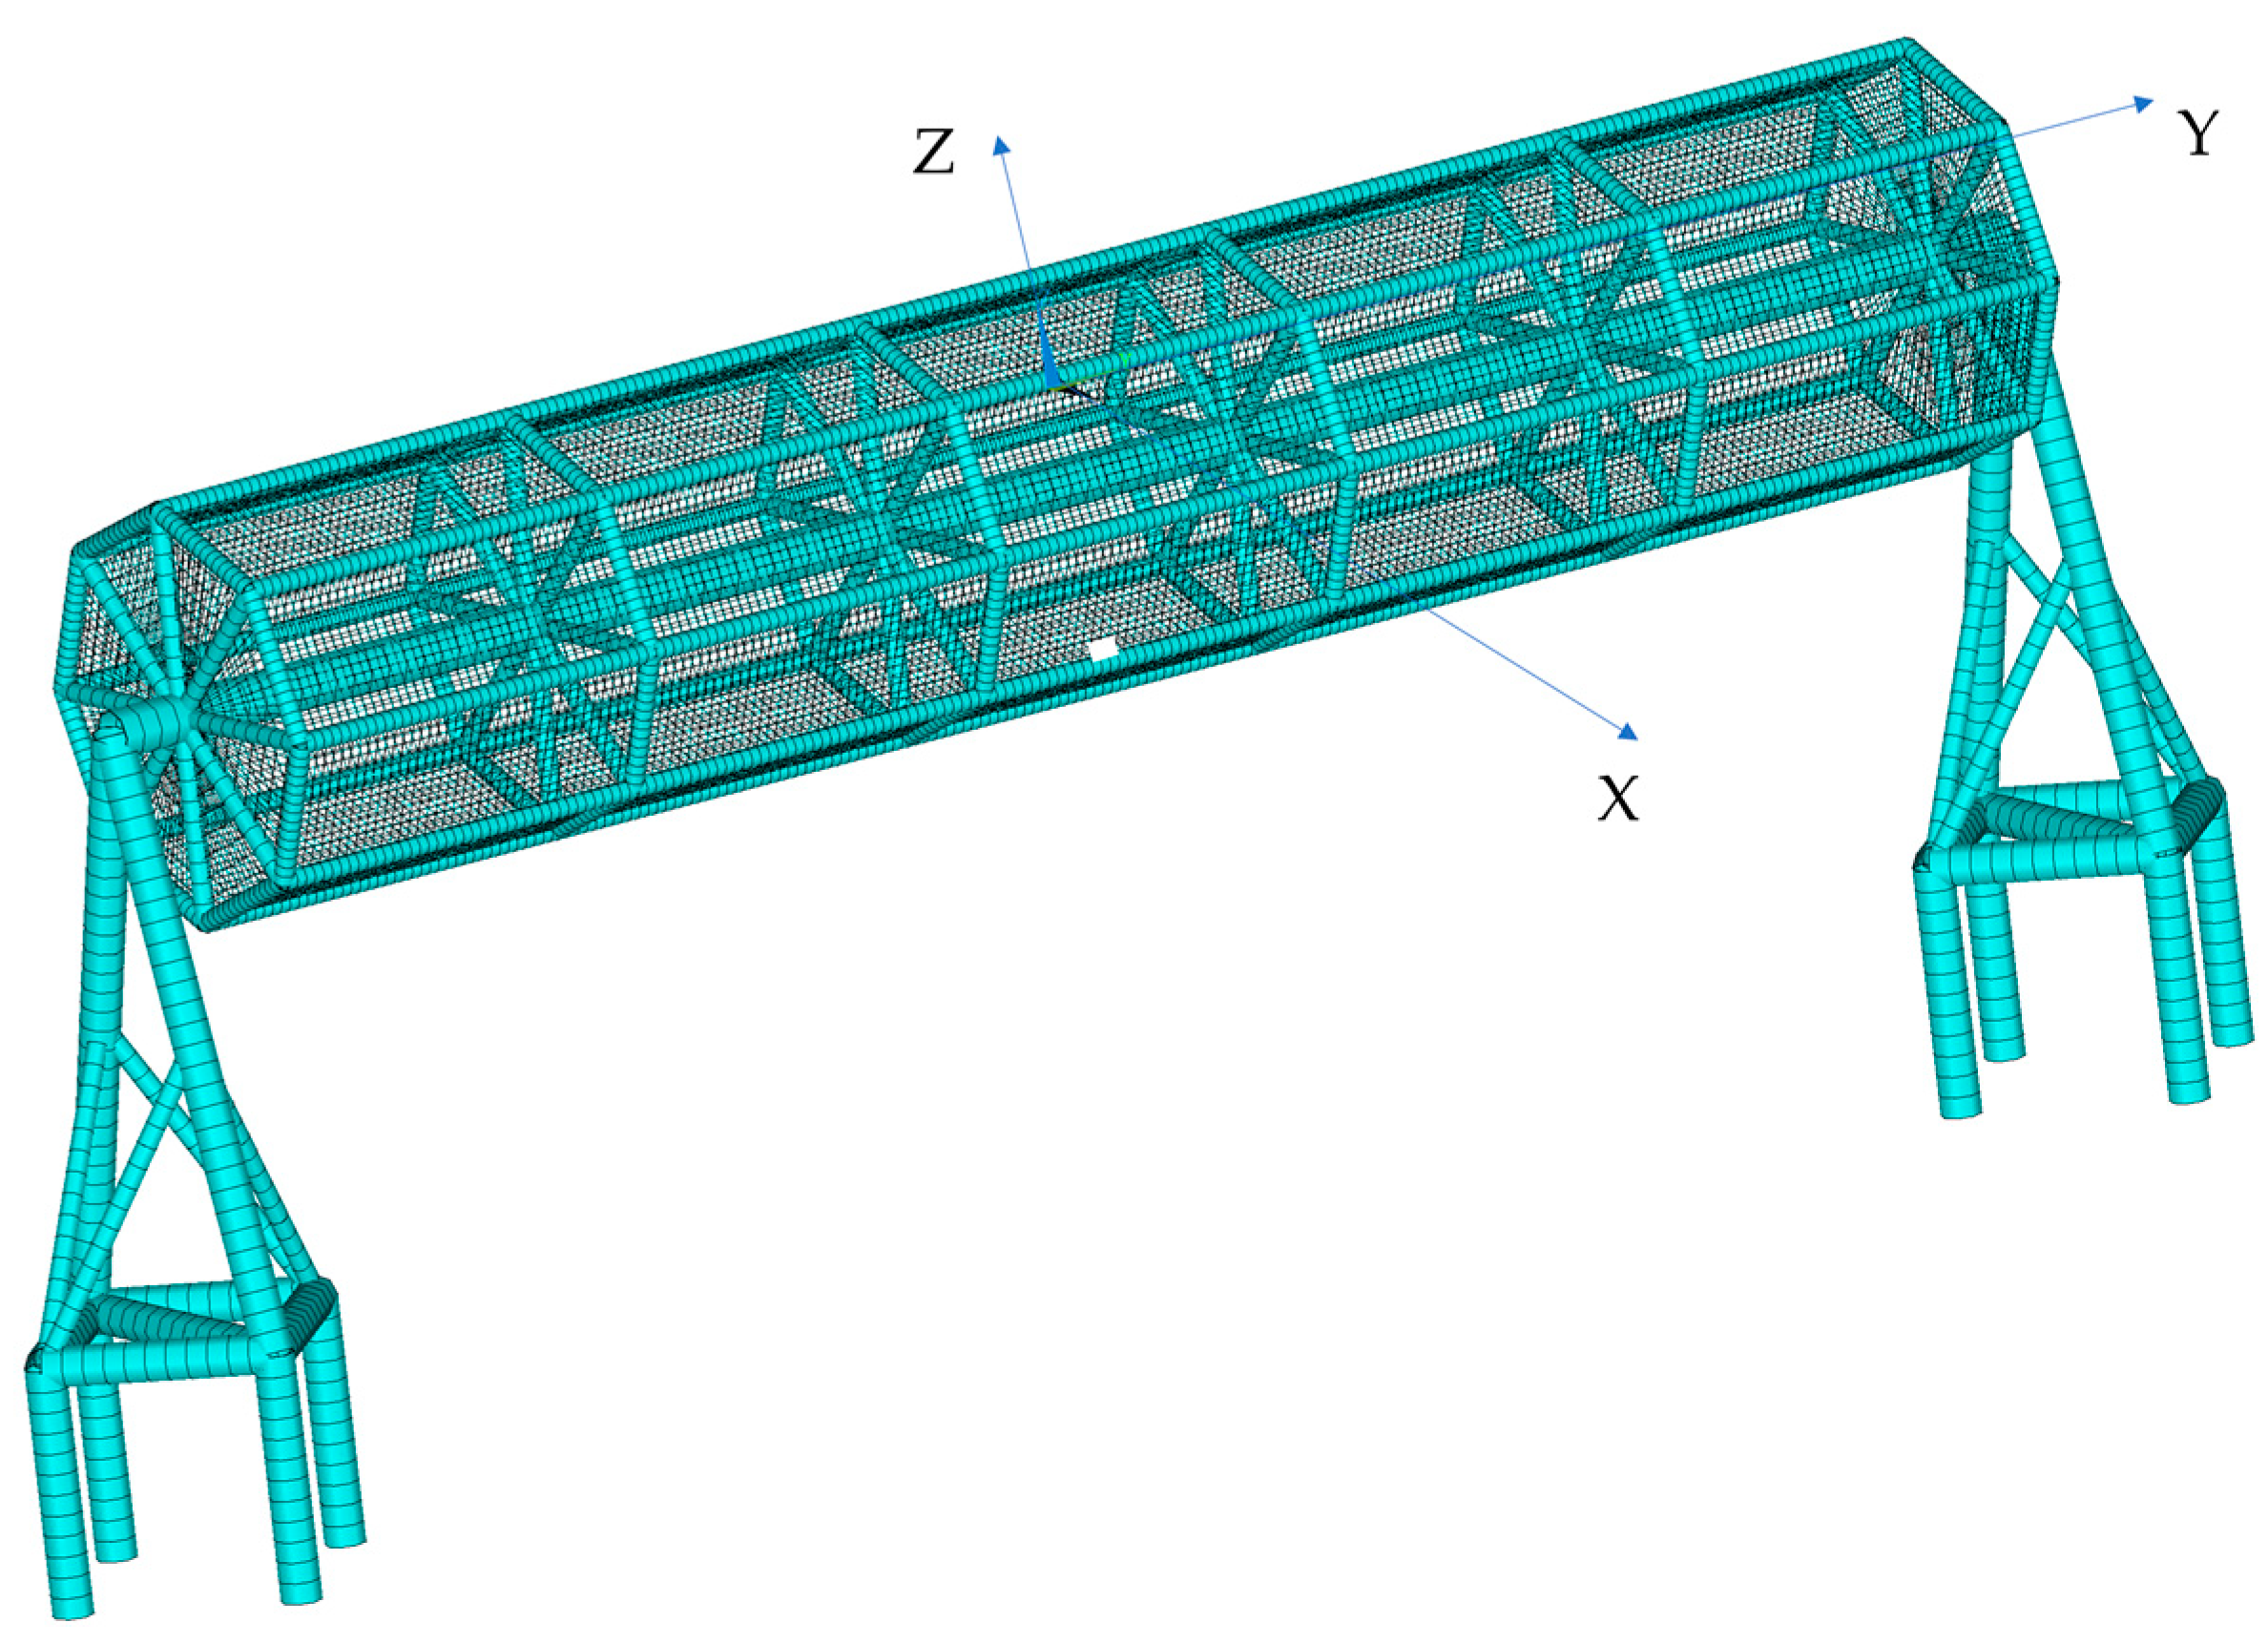
The numerical model of the fixed aquaculture platform was established using ANSYS. Grid convergence was studied to improve calculation efficiency and ensure calculation accuracy. The grid of the structure is given in Figure 3. The origin of the coordinate system is on the water surface. The direction of the X axis is perpendicular to the axis of the cylindrical cage on the horizontal plane. The direction of the Y axis is parallel to the axis of the cylindrical cage on the horizontal plane. The Z axis is perpendicular to the water surface.

2.3. Load Conditions

The water depth of the fixed aquaculture platform was 33 m, and the load was set to the combined action of waves and currents. The prevailing part of the fixed aquaculture platform was located below the water surface. Thus, the wind load had a tiny effect on the hydrodynamic response of the structure and was not considered. The upper velocity was set to 1.93 m/s, the middle velocity was 1.47 m/s, and the bottom velocity was 0.96 m/s. Wave height ranged from 3 to 9 m, the wave period ranged from 9.3 to 12.4 s, and the wave was defined as a Stokes fifth-order wave (see Table 2). The hydrodynamic responses of the fixed aquaculture platform at attack angles of 0°, 45°, and 90° were studied. As shown in Figure 3, the attack angle refers to the angle with the X axis.

3. Experimental Verification

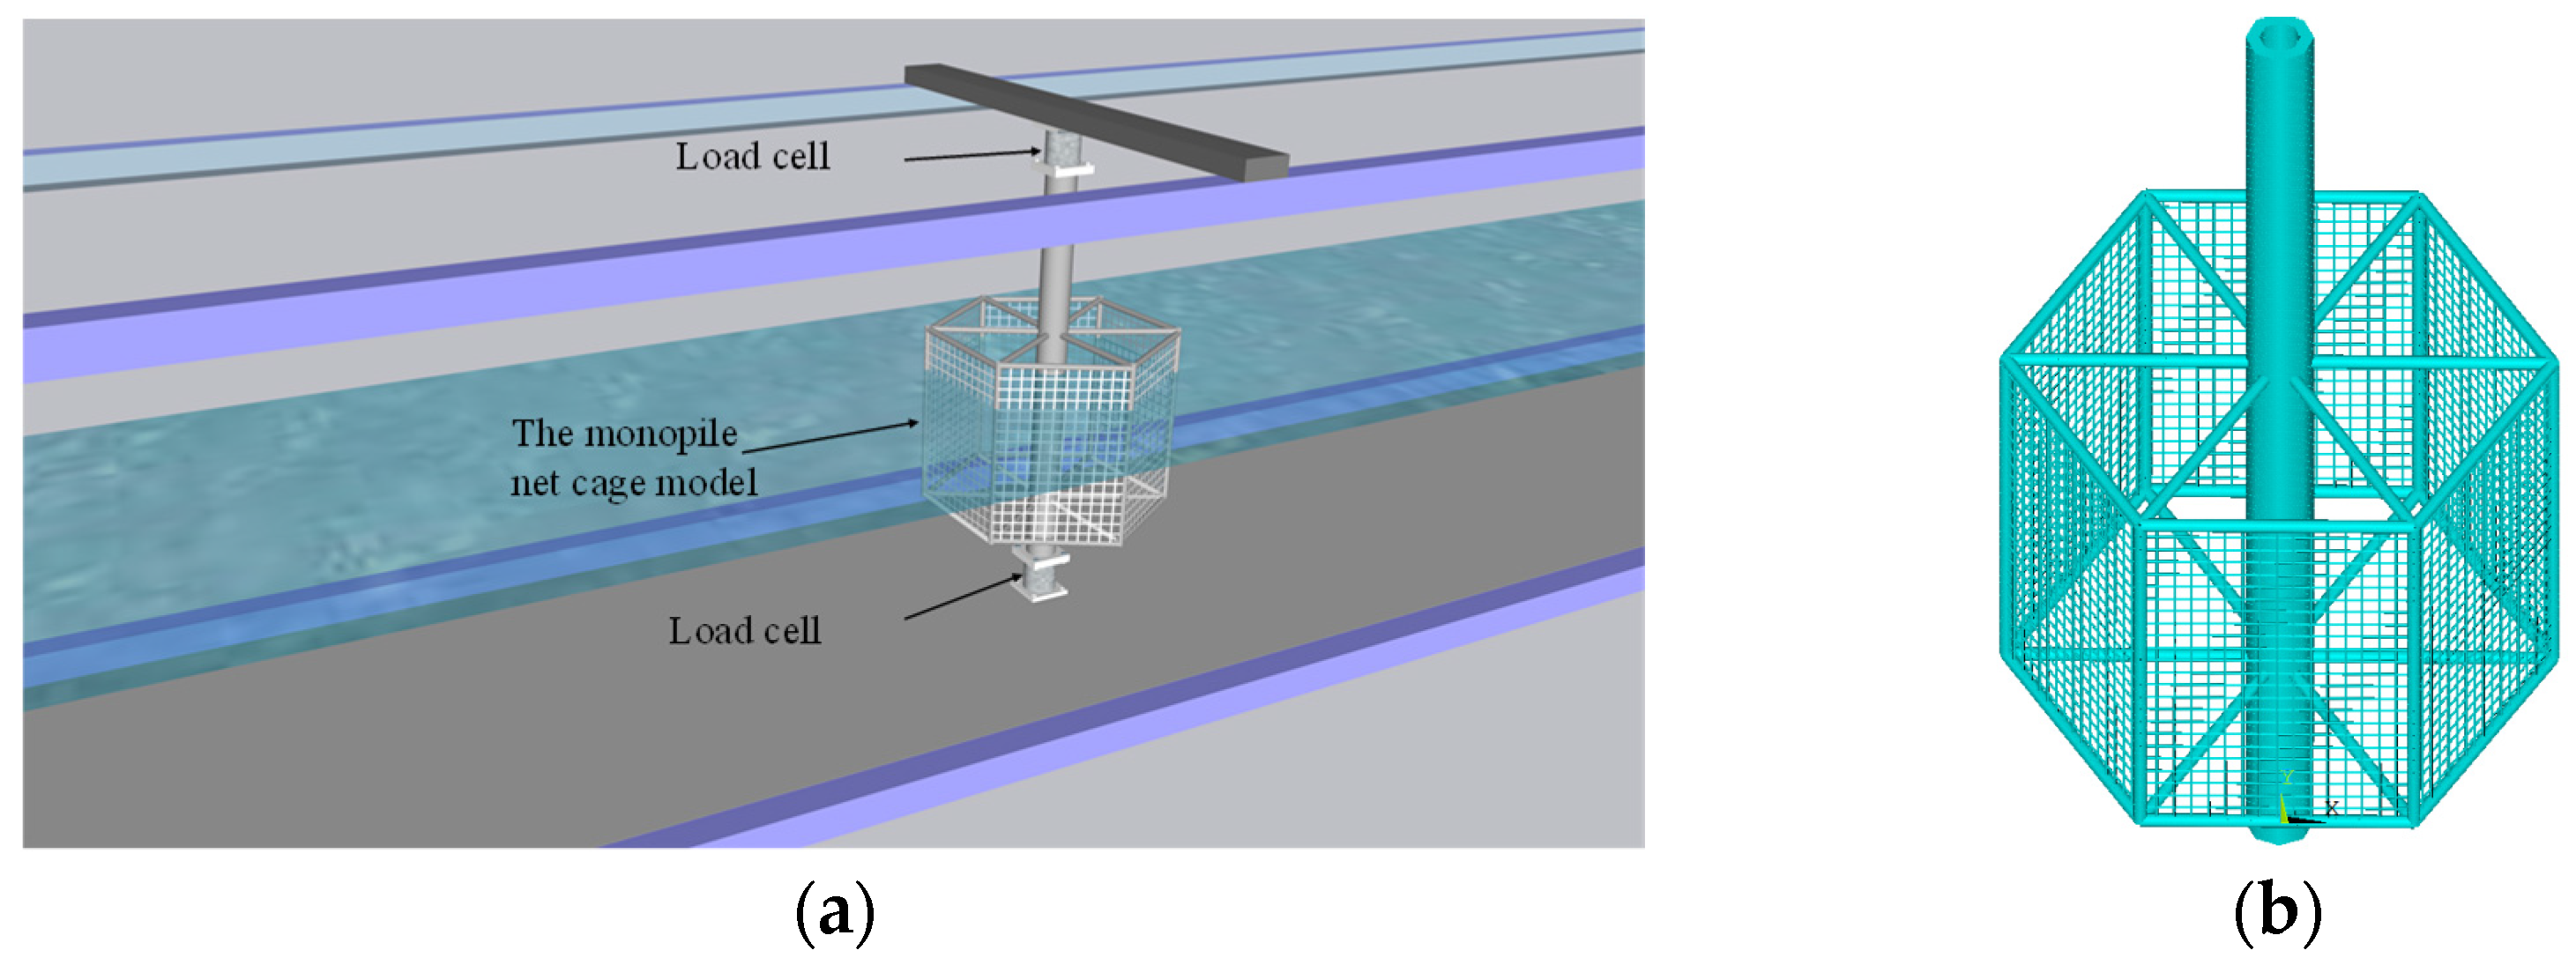
The accuracy of the numerical method was verified through an experiment. The experiment was carried out in the flume of the State Key Laboratory of Coastal and Offshore Engineering at Dalian University of Technology. The flume is 22 m long, 0.8 m wide, and 0.8 m high. The water depth was 0.4 m. The experimental diagram is shown in Figure 4a. The net cage was 0.4 m in diameter and 0.3 m in height, and the frame member was 0.01 m in diameter. The top of the cage was 0.07 m above the water surface. The length of the mesh bar was 12.5 mm, the twine diameter was 2 mm, and net solidity was 0.32. The diameter of the monopile was 0.05 m and the height was 0.64 m, with both ends connected to load cells. The force acting on the structure under wave conditions or current conditions was measured. The force acting on the structure is the sum of results measured by load cells.

3.1. Verification of Current Load

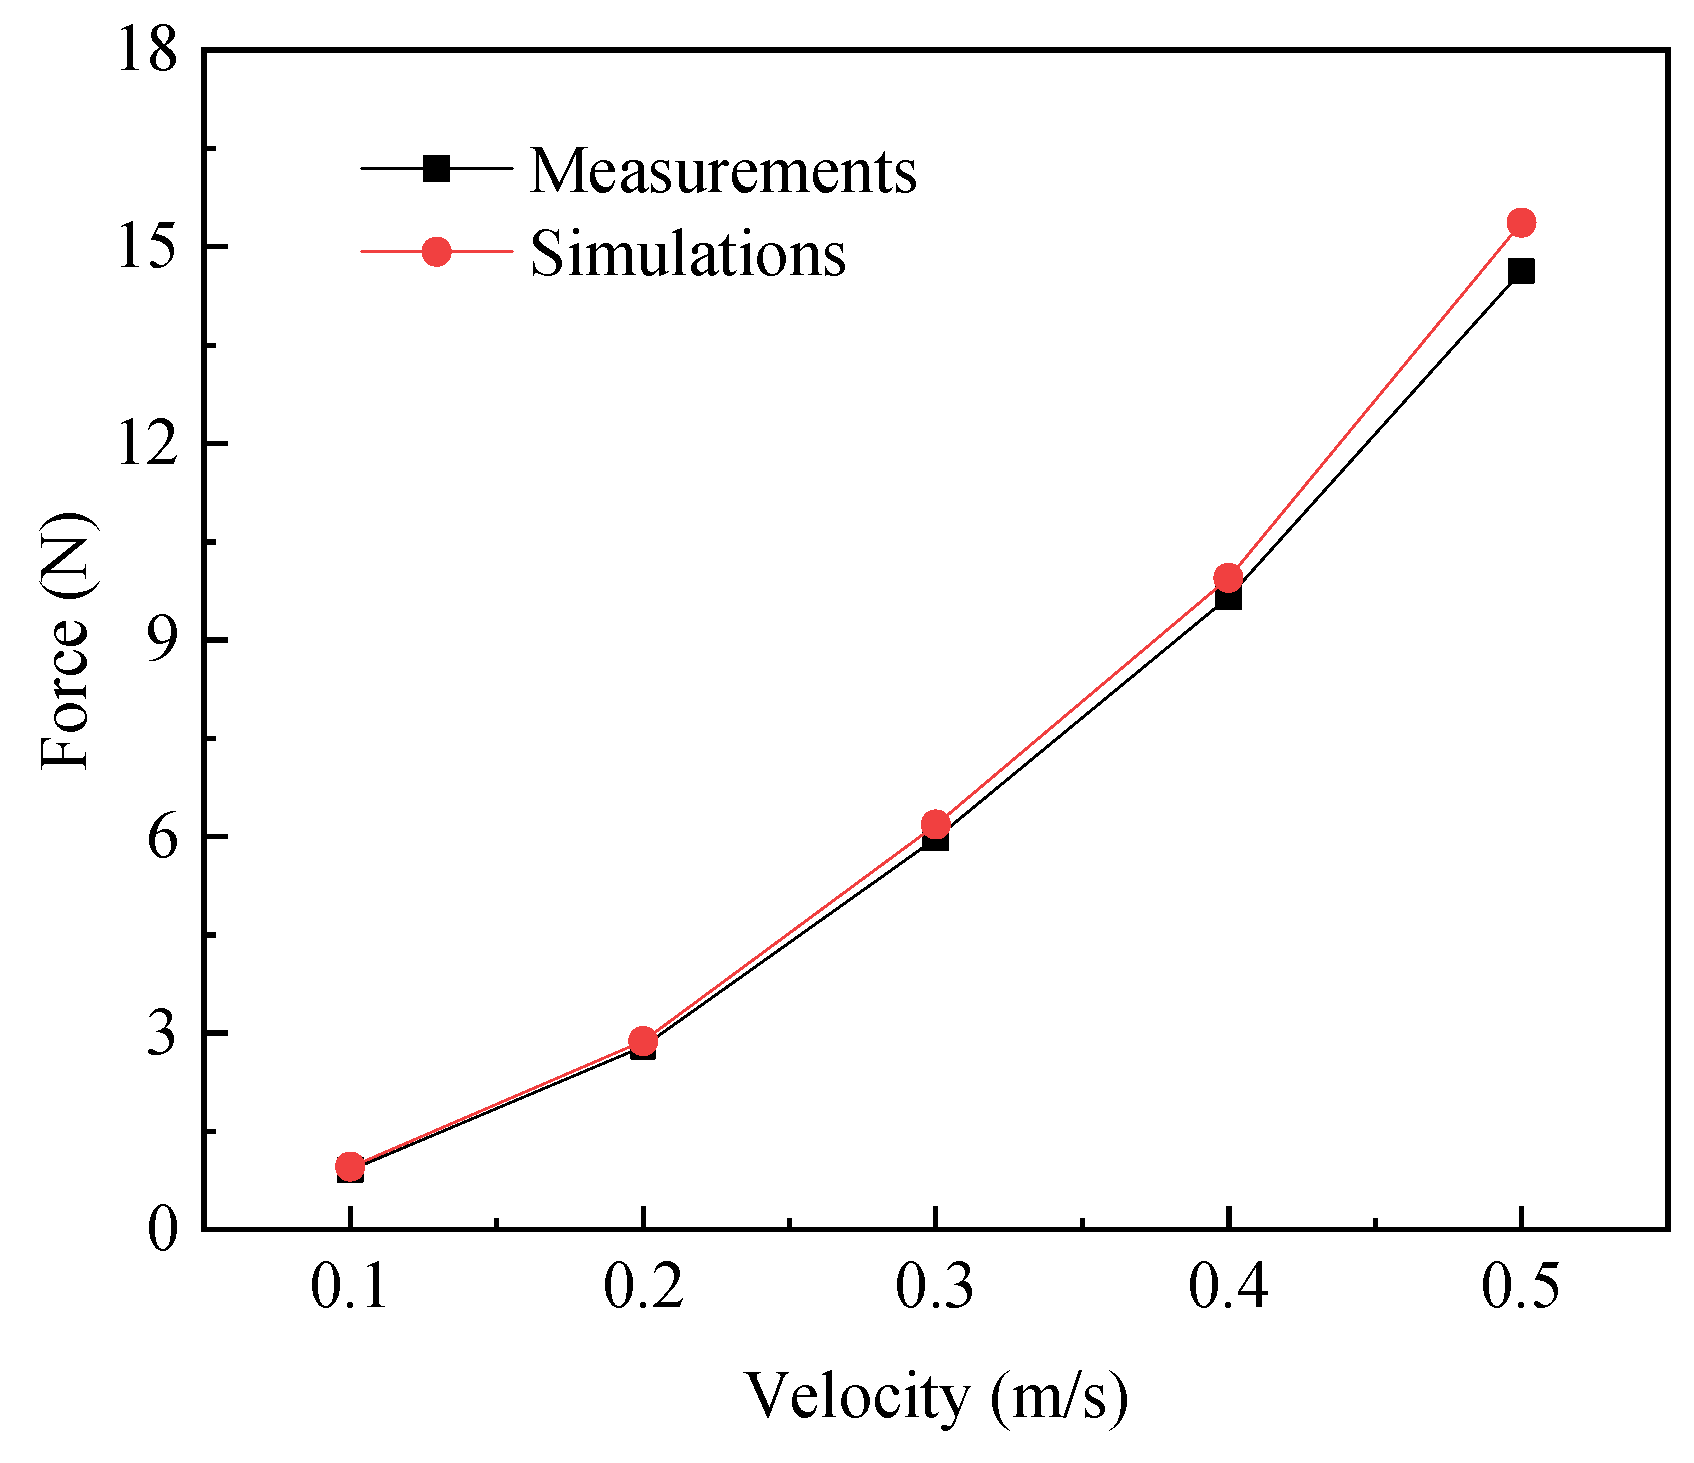
Figure 5 compares the force acting on the model in terms of values obtained from experimental and numerical methods under current load, and the velocity ranges from 0.1 m/s to 0.5 m/s. With the increase in flow velocity, the force on the structure increases significantly. The force on the structure at 0.5 m/s can reach about 15 times that at 0.1 m/s. The results of the experiment and numerical simulation are basically consistent. The results show that the accuracy of the numerical method meets the requirements.

3.2. Verification of Wave Load

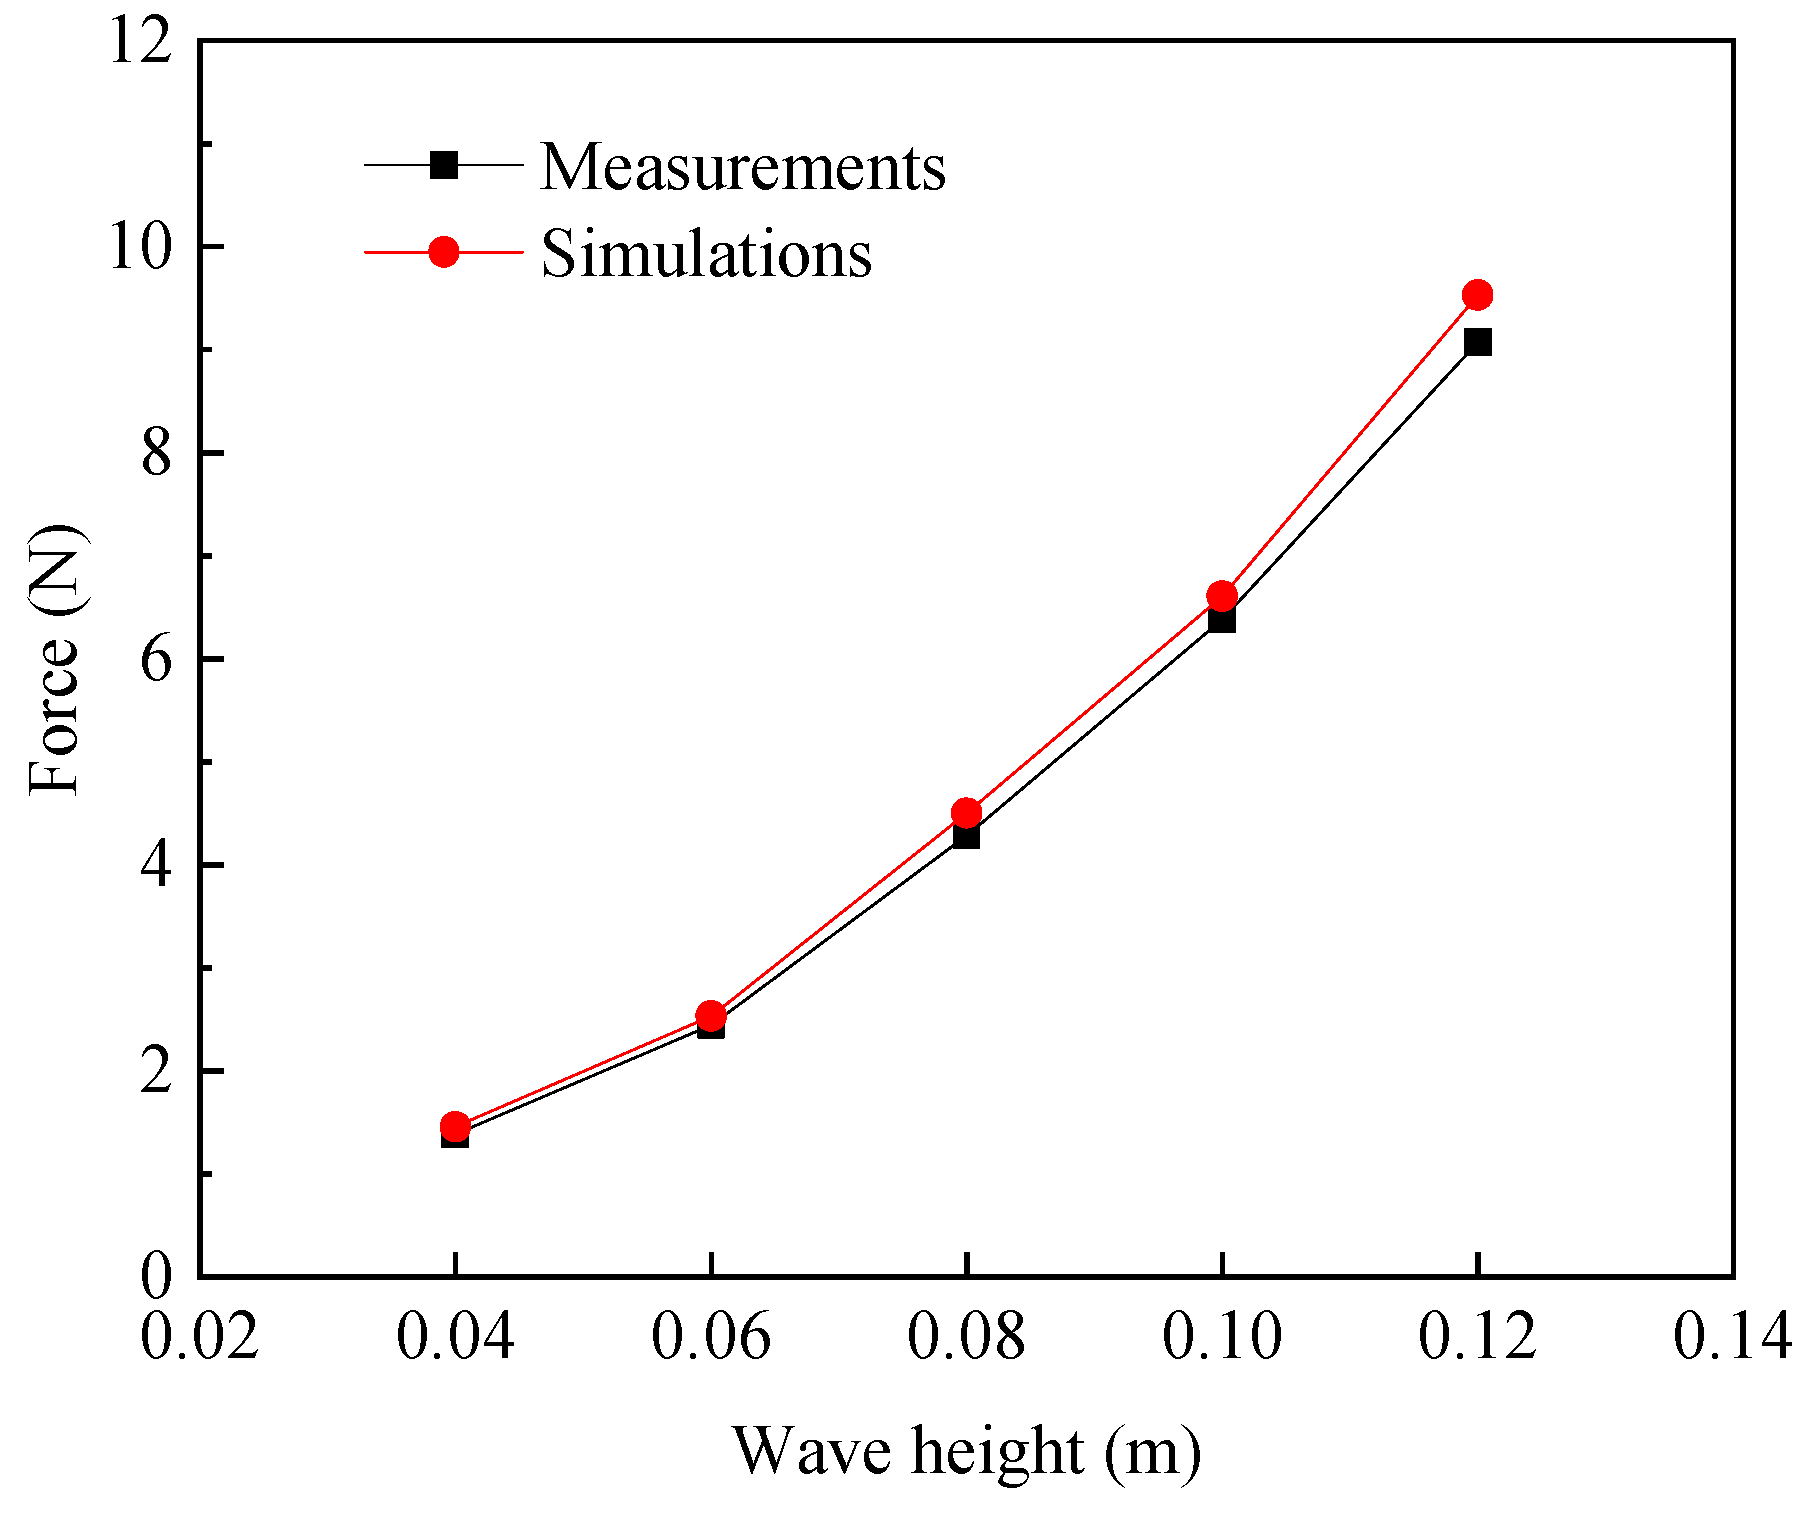
Figure 6 compares the experimental and numerical results under wave load. The range of wave height was 0.04 m~0.12 m and the period was 1.3 s. The force acting on the structure increased nonlinearly with the increase in wave height. The trend of the numerical simulation results is consistent with the experimental results, and the maximum error is 5%. It shows that the numerical method used in this paper has high reliability and accuracy and can thus accurately simulate the net cage.

4. Numerical Results

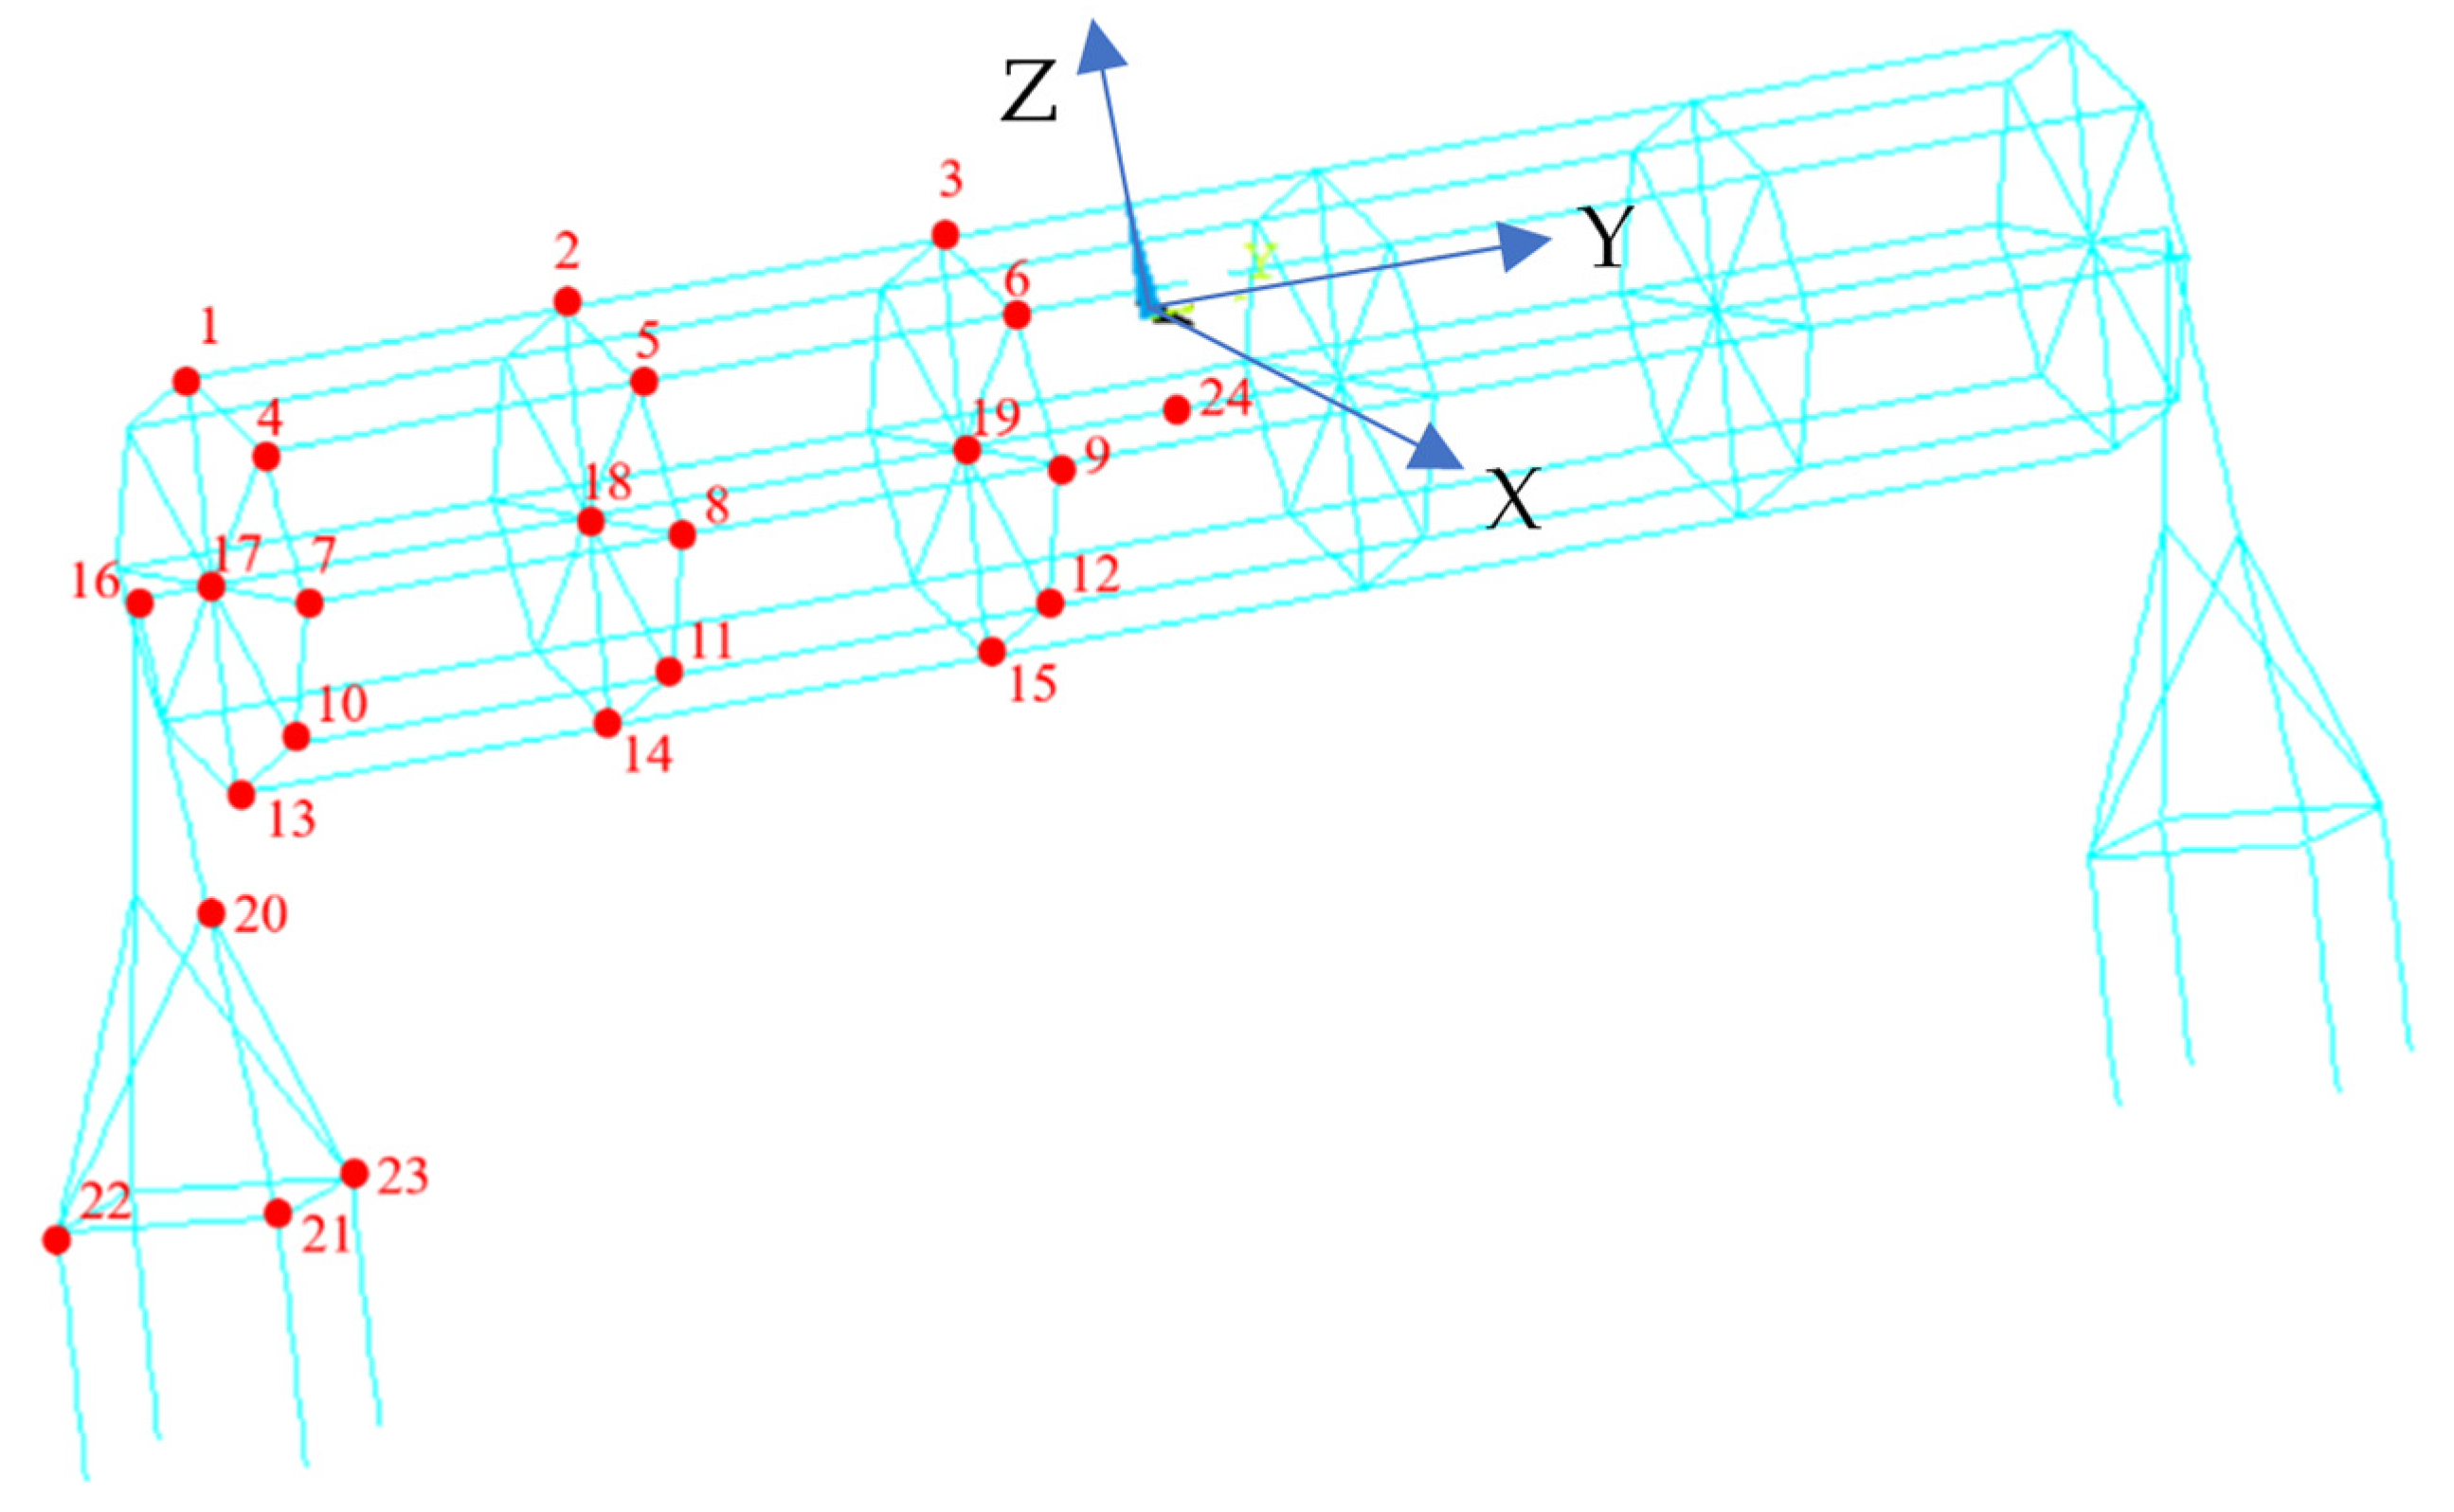
This section provides the simulation results of the fixed aquaculture platform. The measuring points of strain, acceleration, and displacement are given in Figure 7.

4.1. Strain Responses

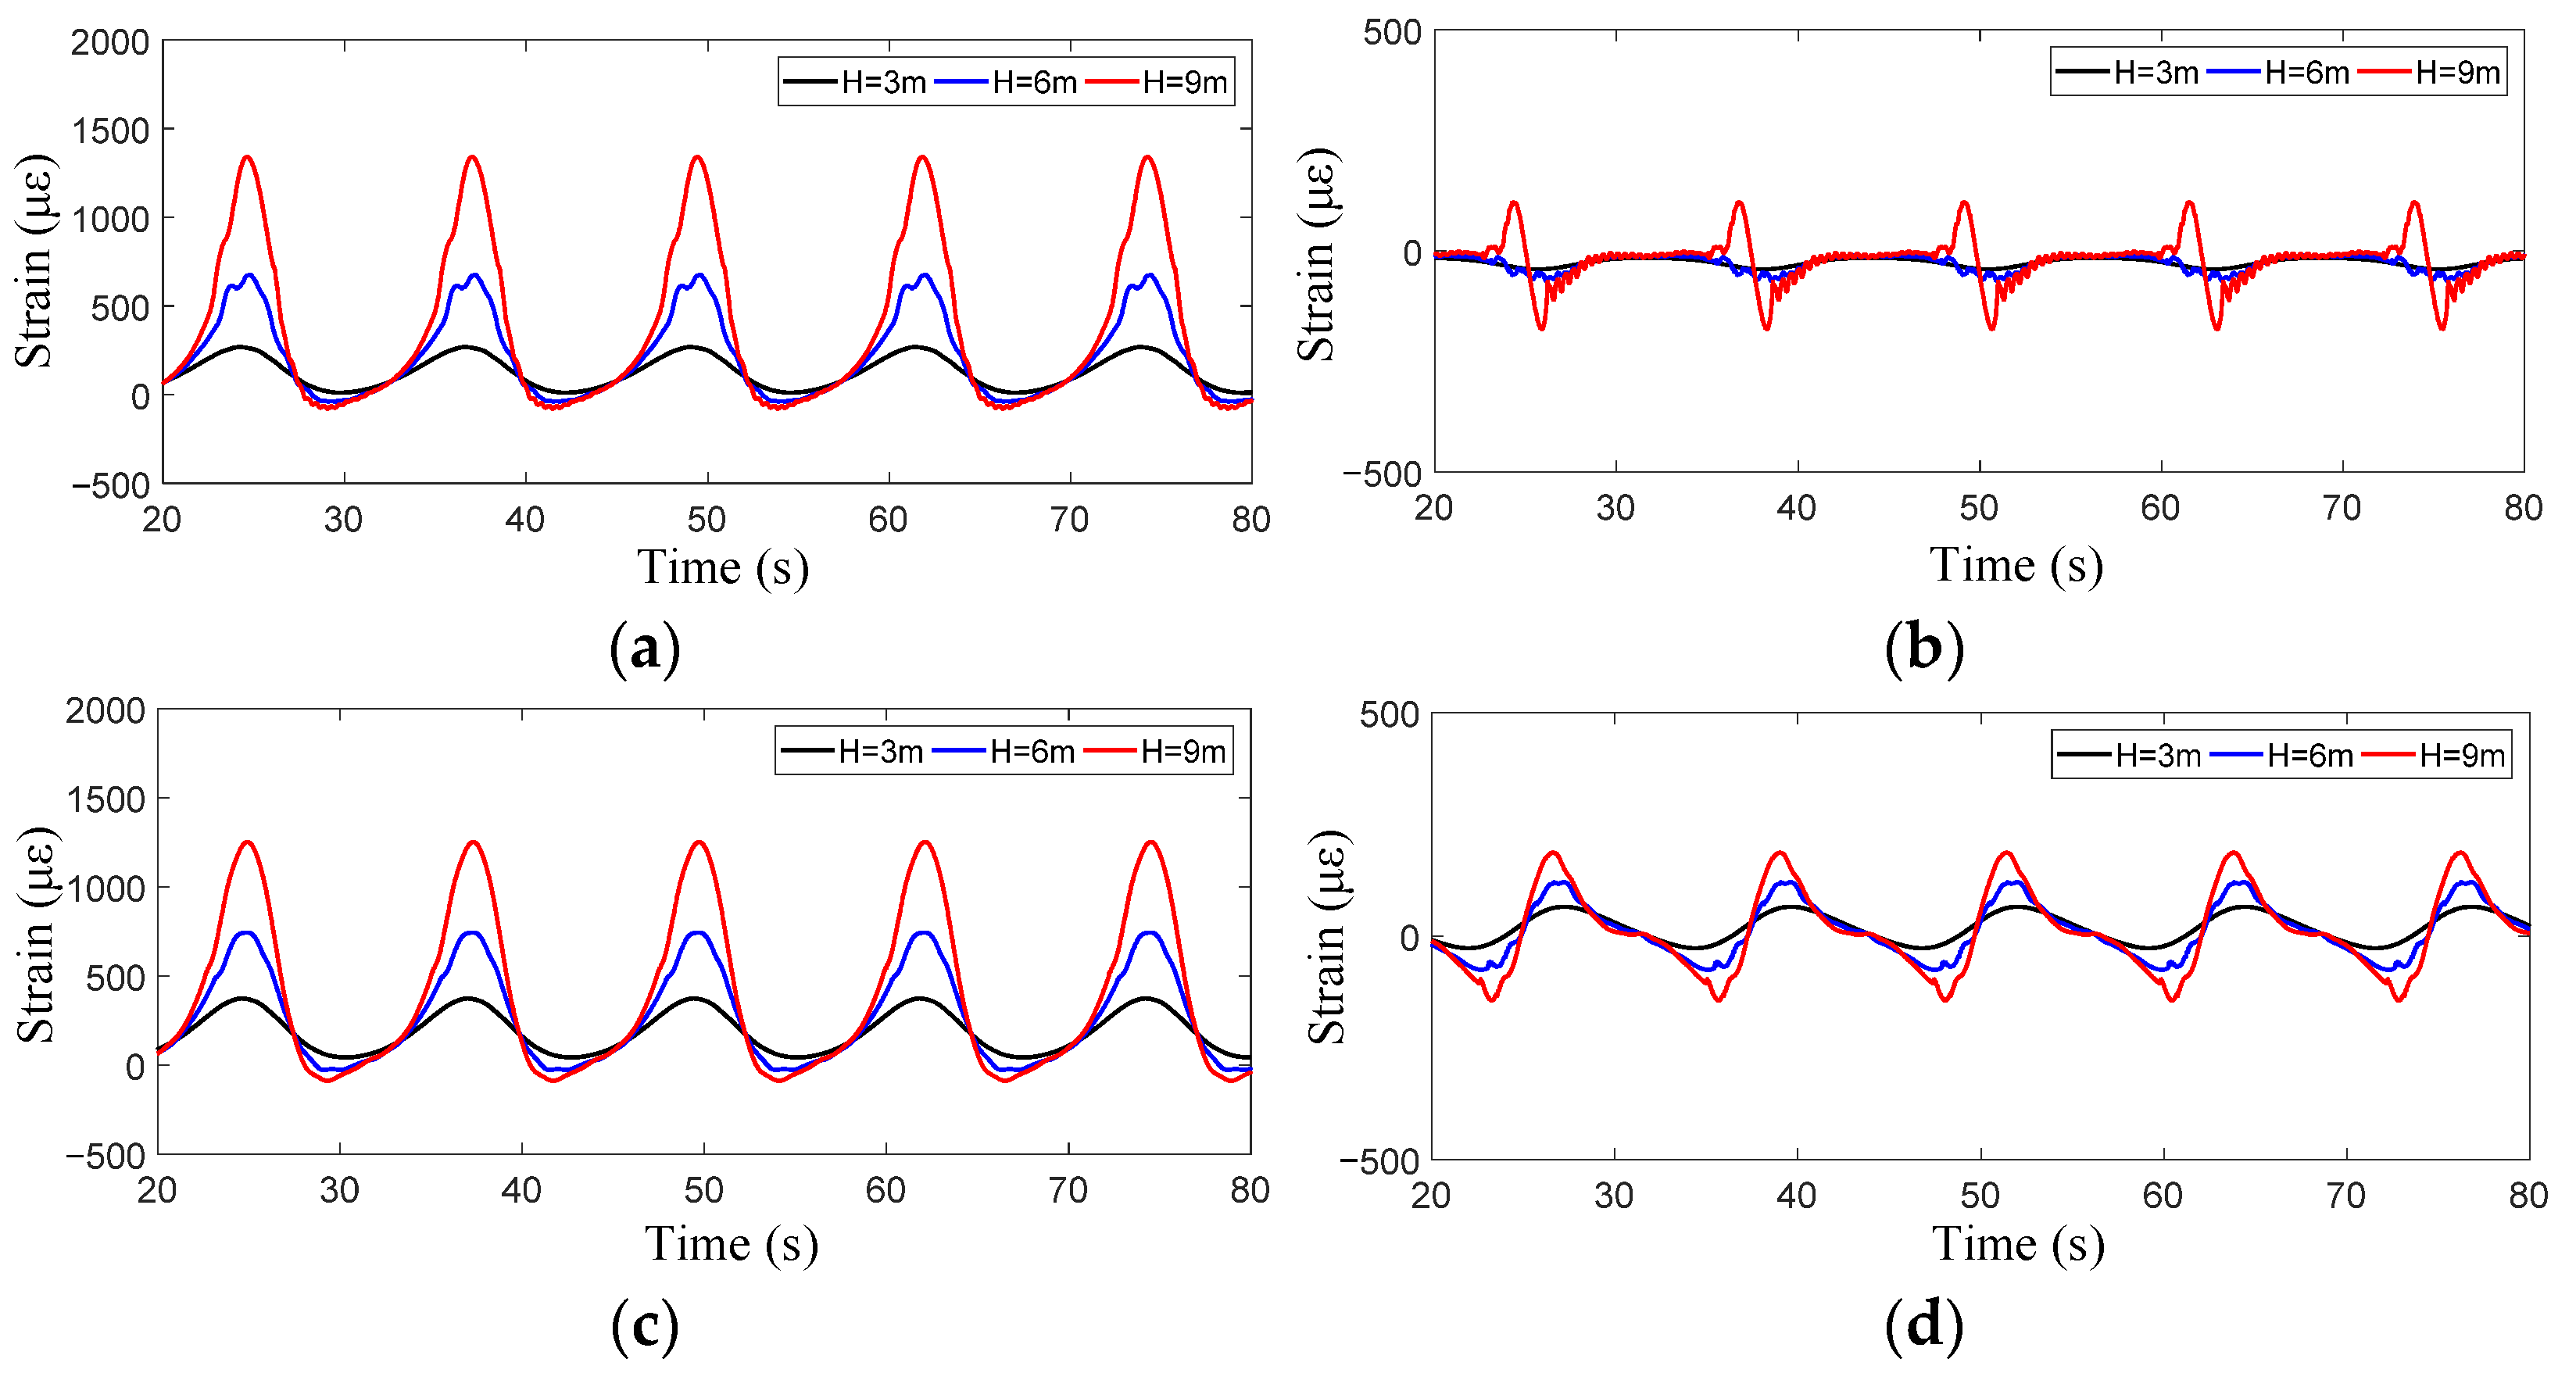
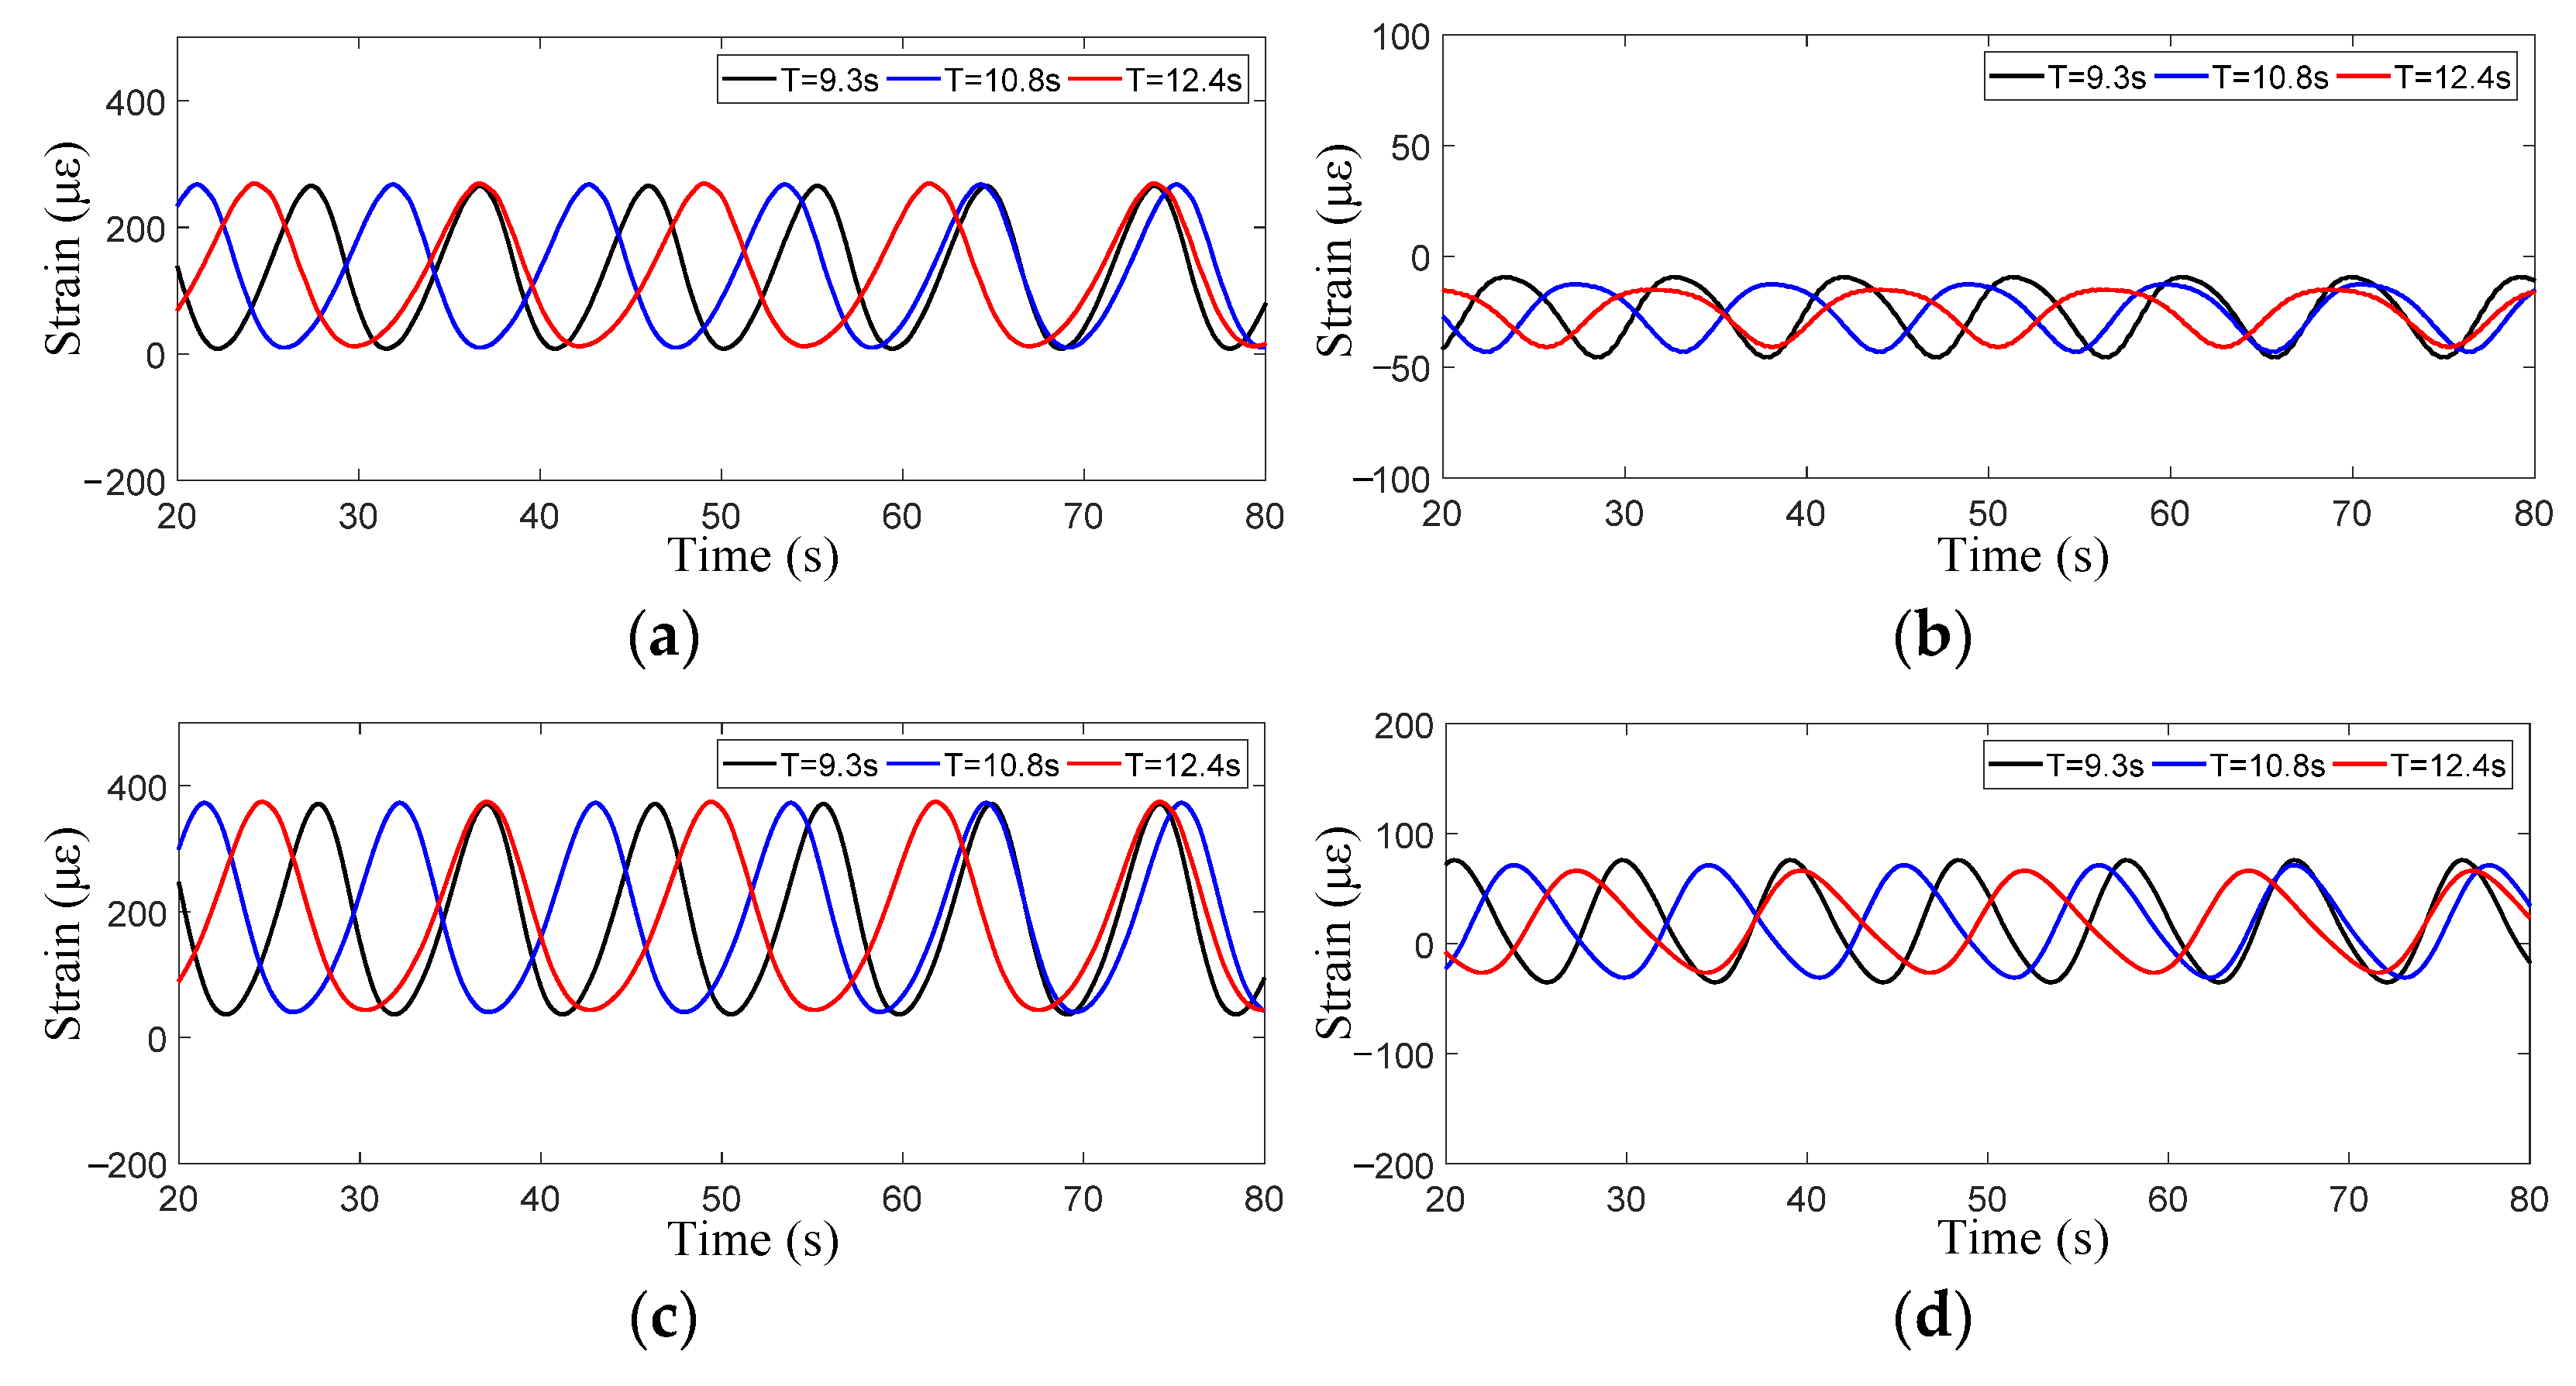
When the attack angle was 0°, the strain results of the four representative positions (S1, S3, S13, S15) were as shown in Figure 8 and Figure 9.
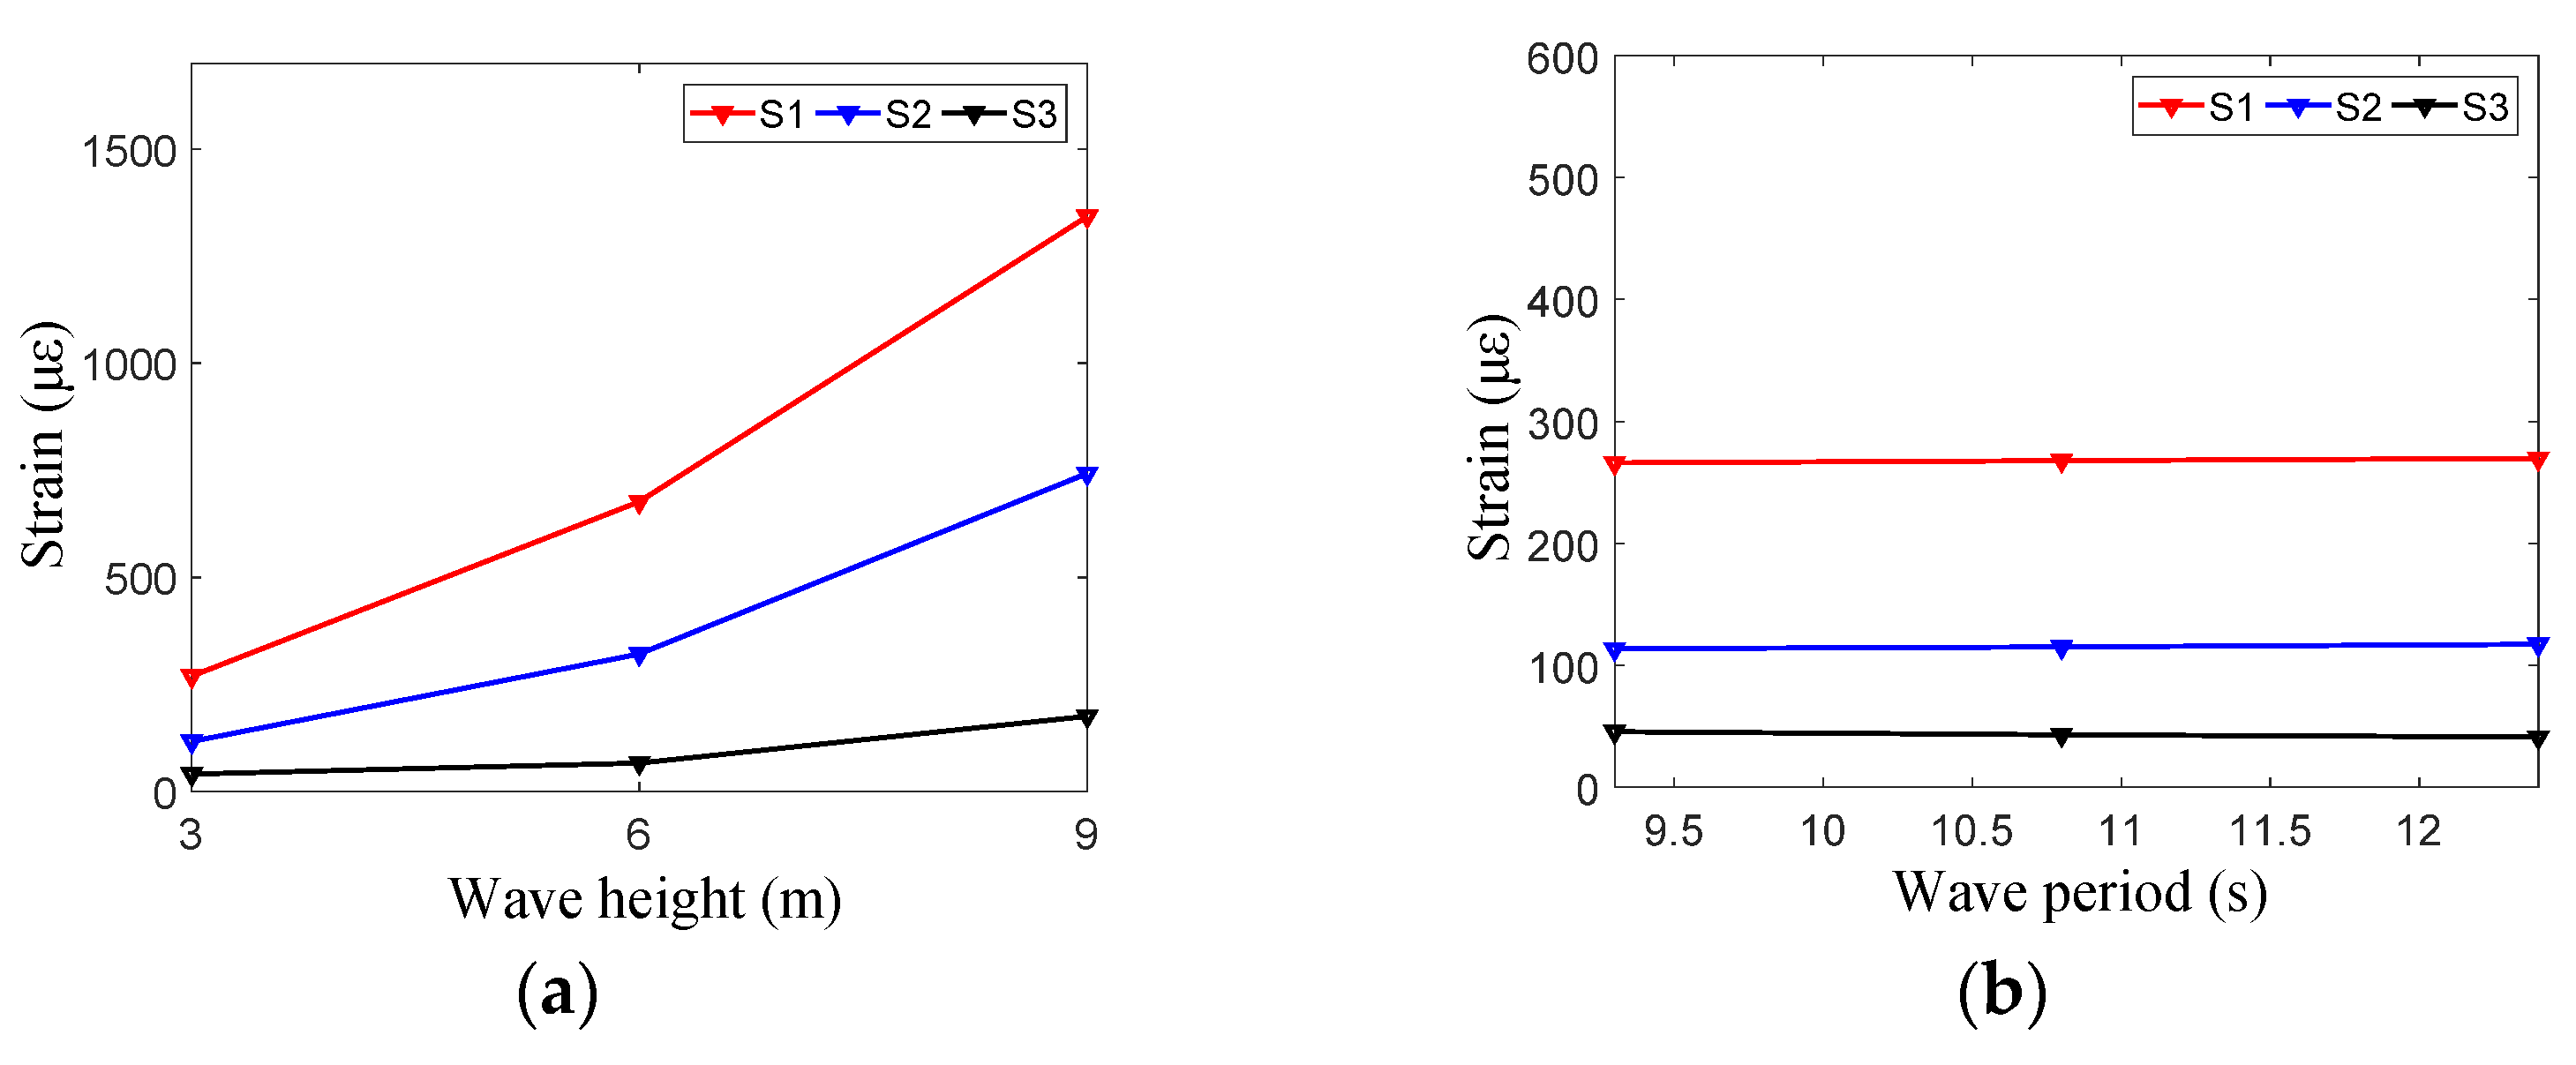
When T = 12.4 s, the strain peaks of the three representative positions (S1, S2, S3) increase significantly with the increase in wave height (see Figure 10a). When H = 3 m and the period increases from 9.3 s to 12.4 s, the strain peaks at the three representative positions are almost unchanged (Figure 10b).
The phase difference of strain at the top of the net cage is obvious (Figure 11a). However, the phase difference of strain at the bottom of the net cage is not significant (Figure 11b). As the measuring point approaches the middle of the cage, the strain response peak decreases gradually.
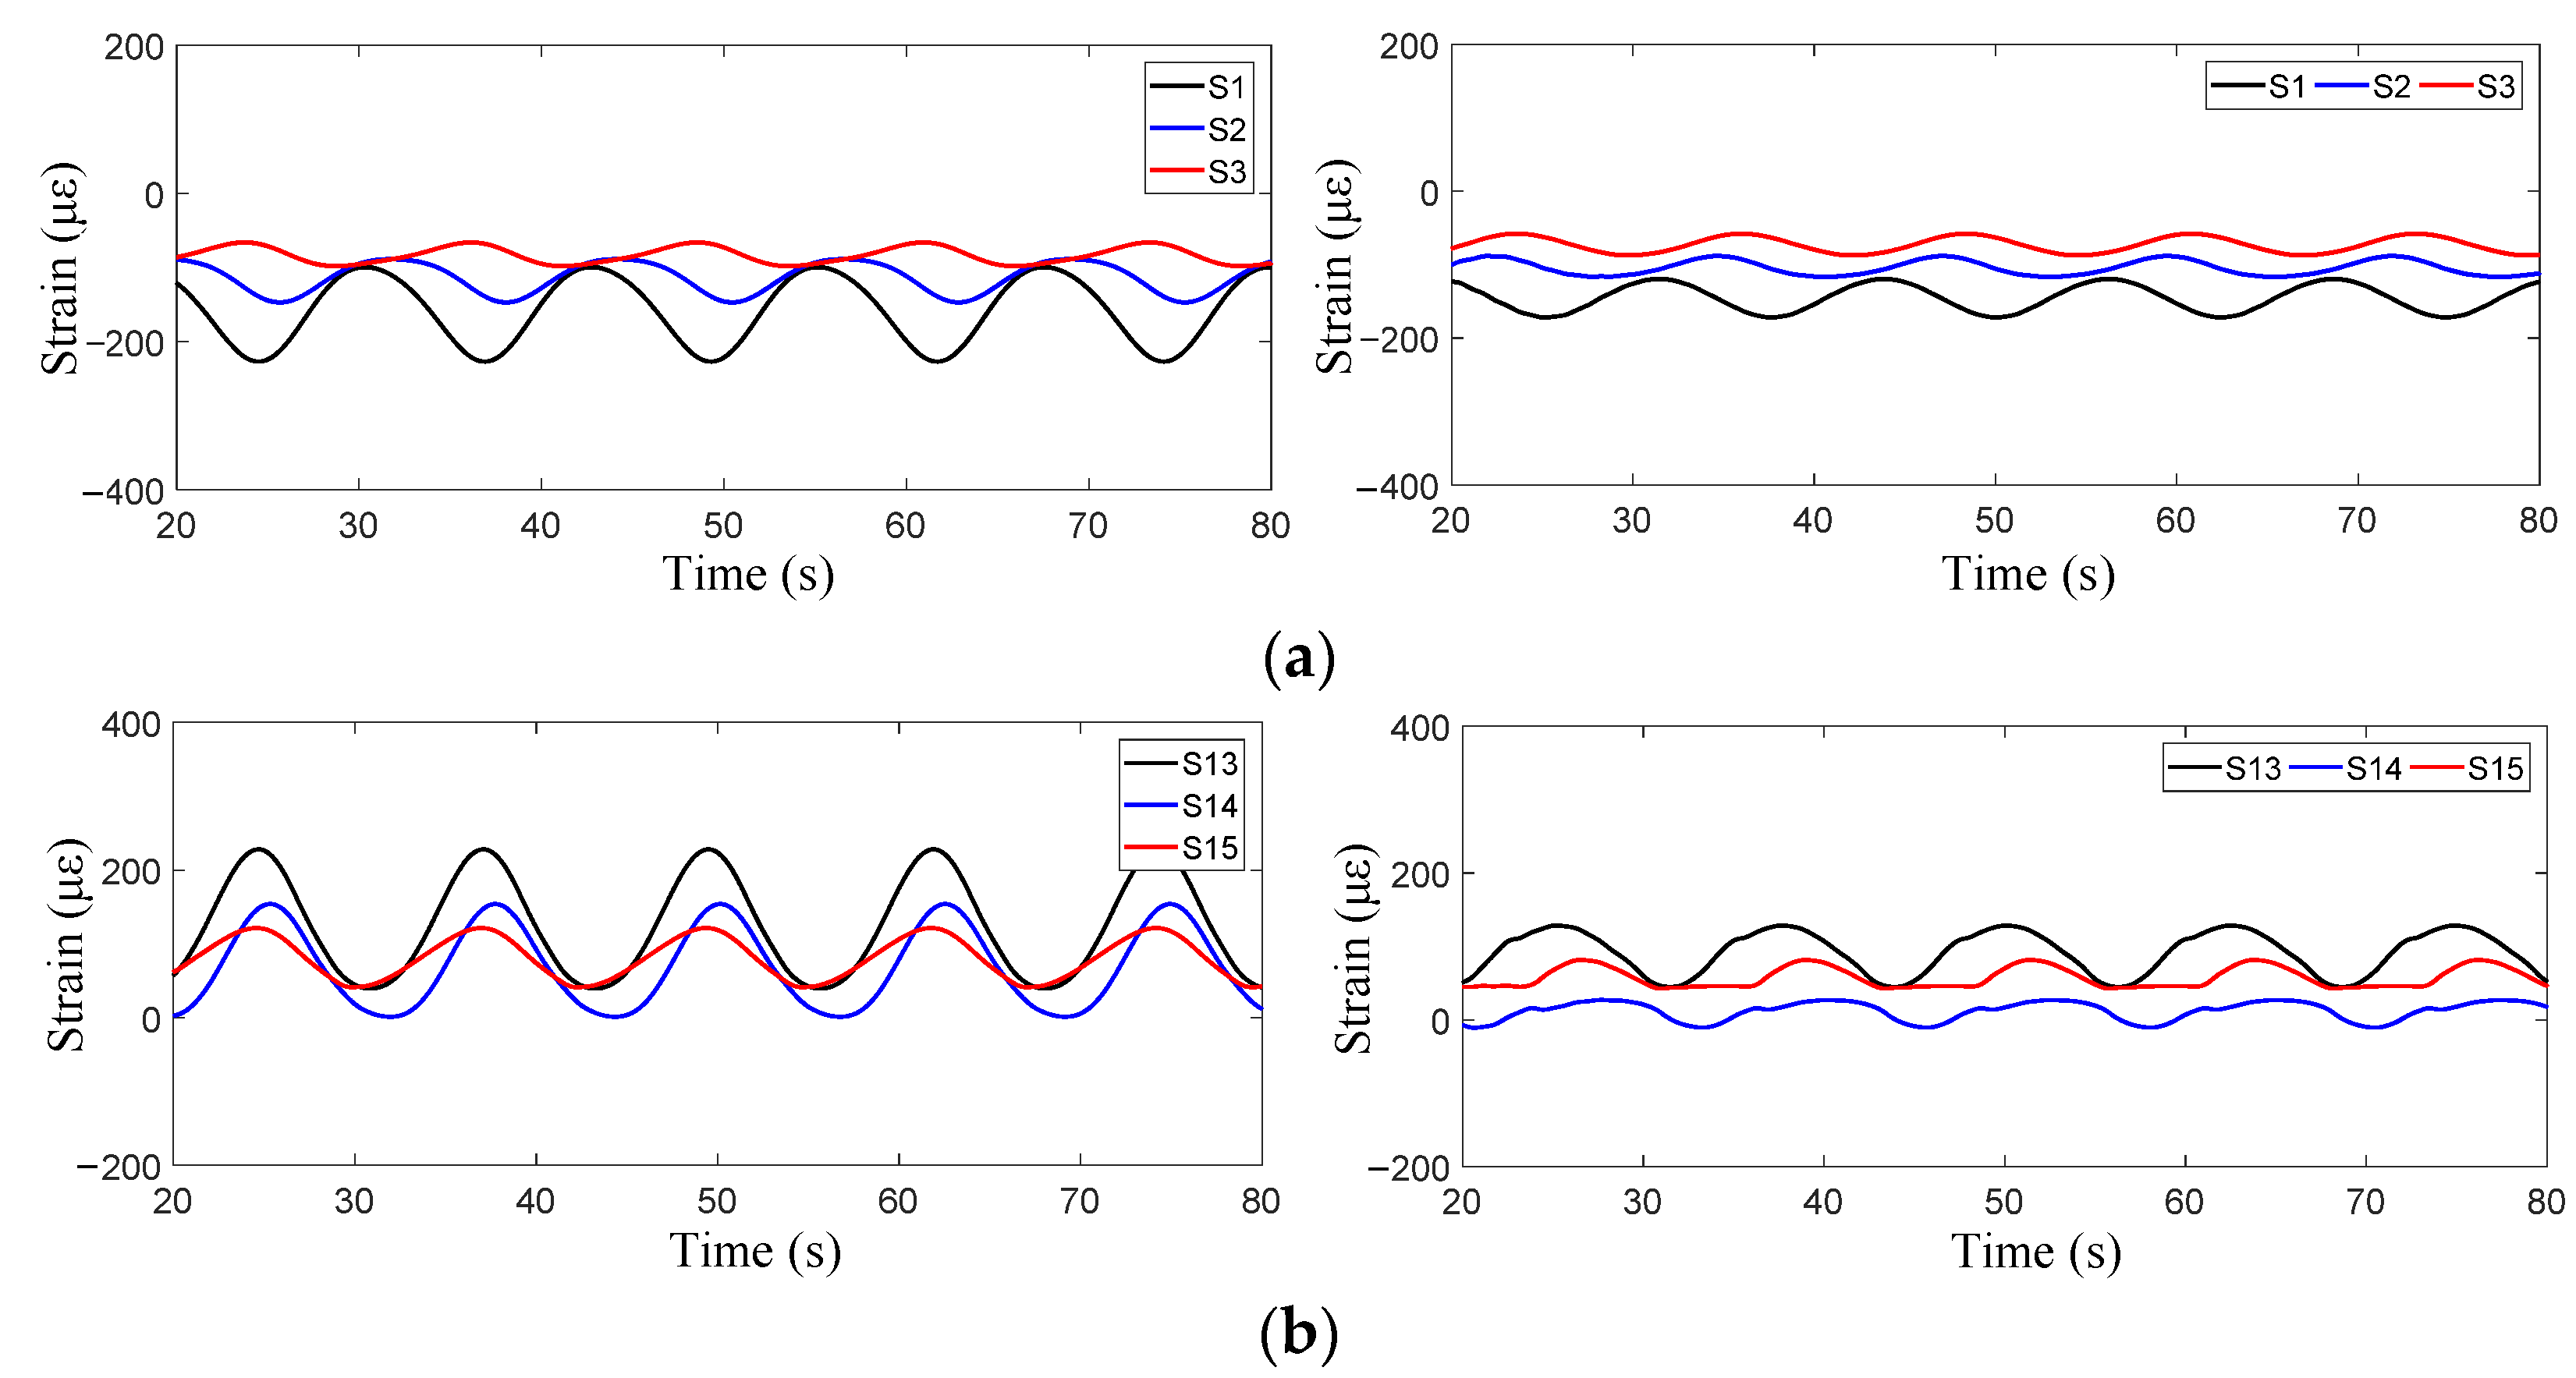
The strain curves of measuring points S1, S2, and S3 at the top of the cage and measuring points S13, S14, and S15 at the bottom with different attack angles are shown in Figure 12. When the angle of attack is 45°, the peak strain values of measuring points S1 and S2 at the top of the cage and the corresponding measuring points S13 and S14 at the bottom differ little, while the peak strain values of measuring point S3 at the top of the cage are smaller than the corresponding measuring point S15 at the bottom. When the angle of attack is 90°, the strain peak values of S1 and S2 at the top of the cage are significantly larger than those of S13 and S14 at the bottom, while the strain peak values of S3 at the top of the cage are similar to those of S15 at the bottom.

4.2. Acceleration Responses

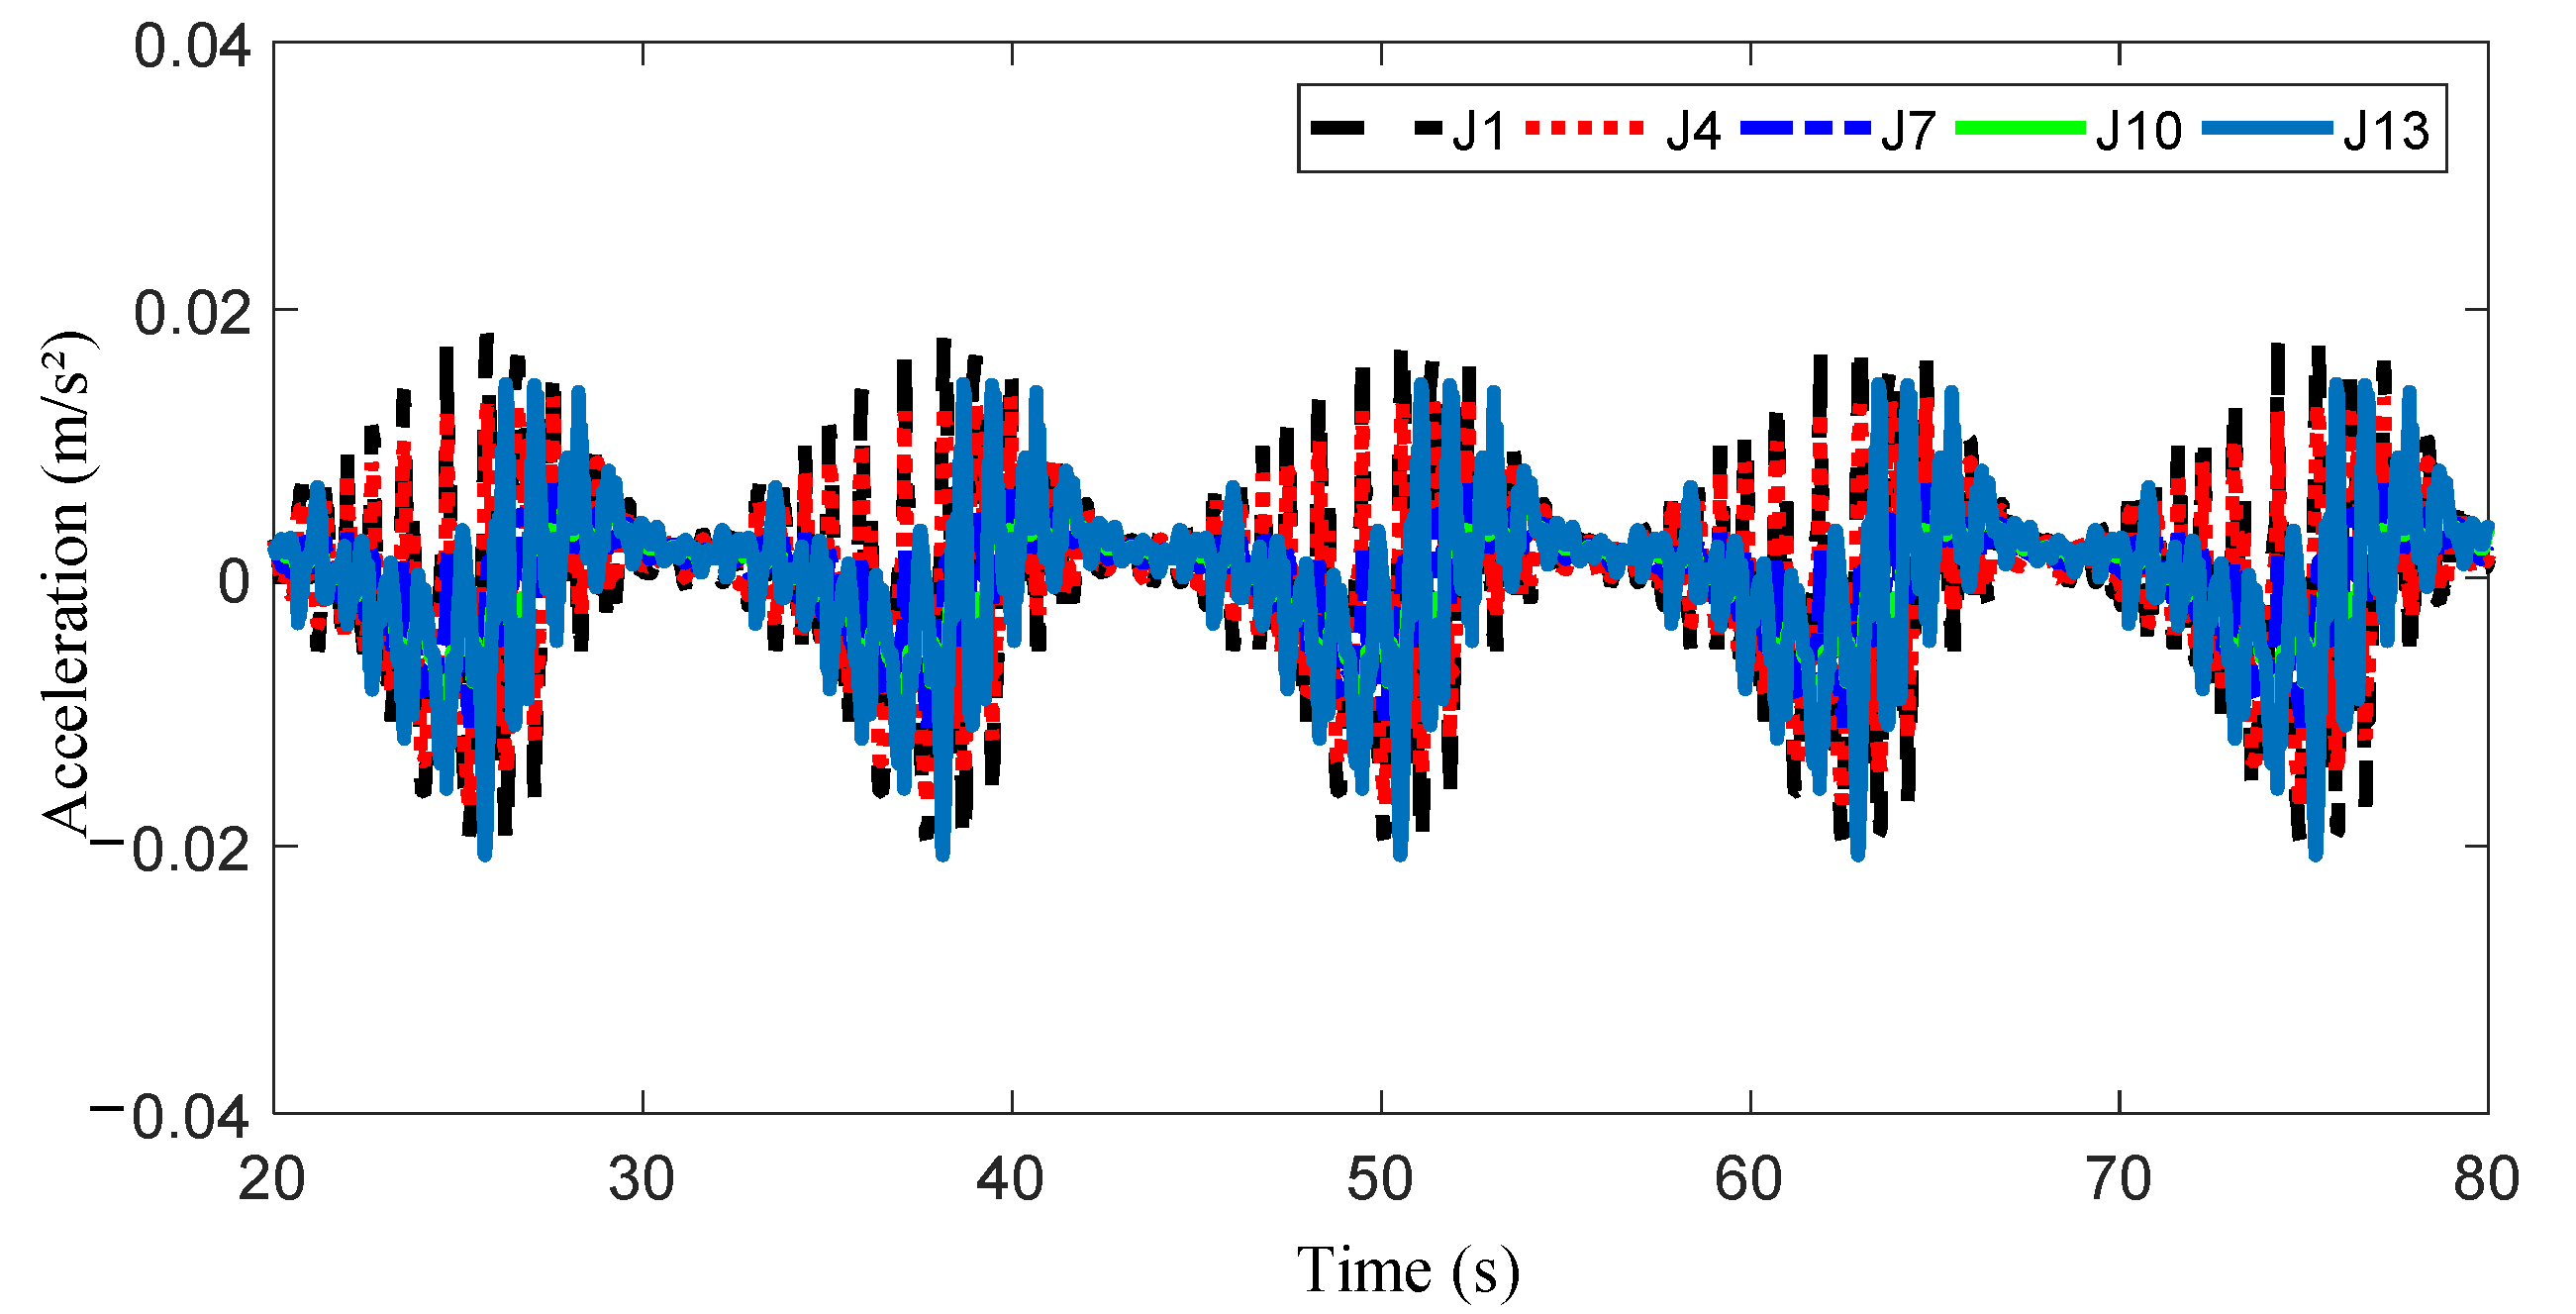
Acceleration monitoring of the fixed aquaculture platform is very important for structural safety evaluation. The acceleration curves of measuring points J1, J4, J7, J10, and J13 distributed from the highest position of the cage to the lowest position of the cage were compared (see Figure 13). Under this condition, the acceleration response of the cage initially decreases and then increases from top to bottom.
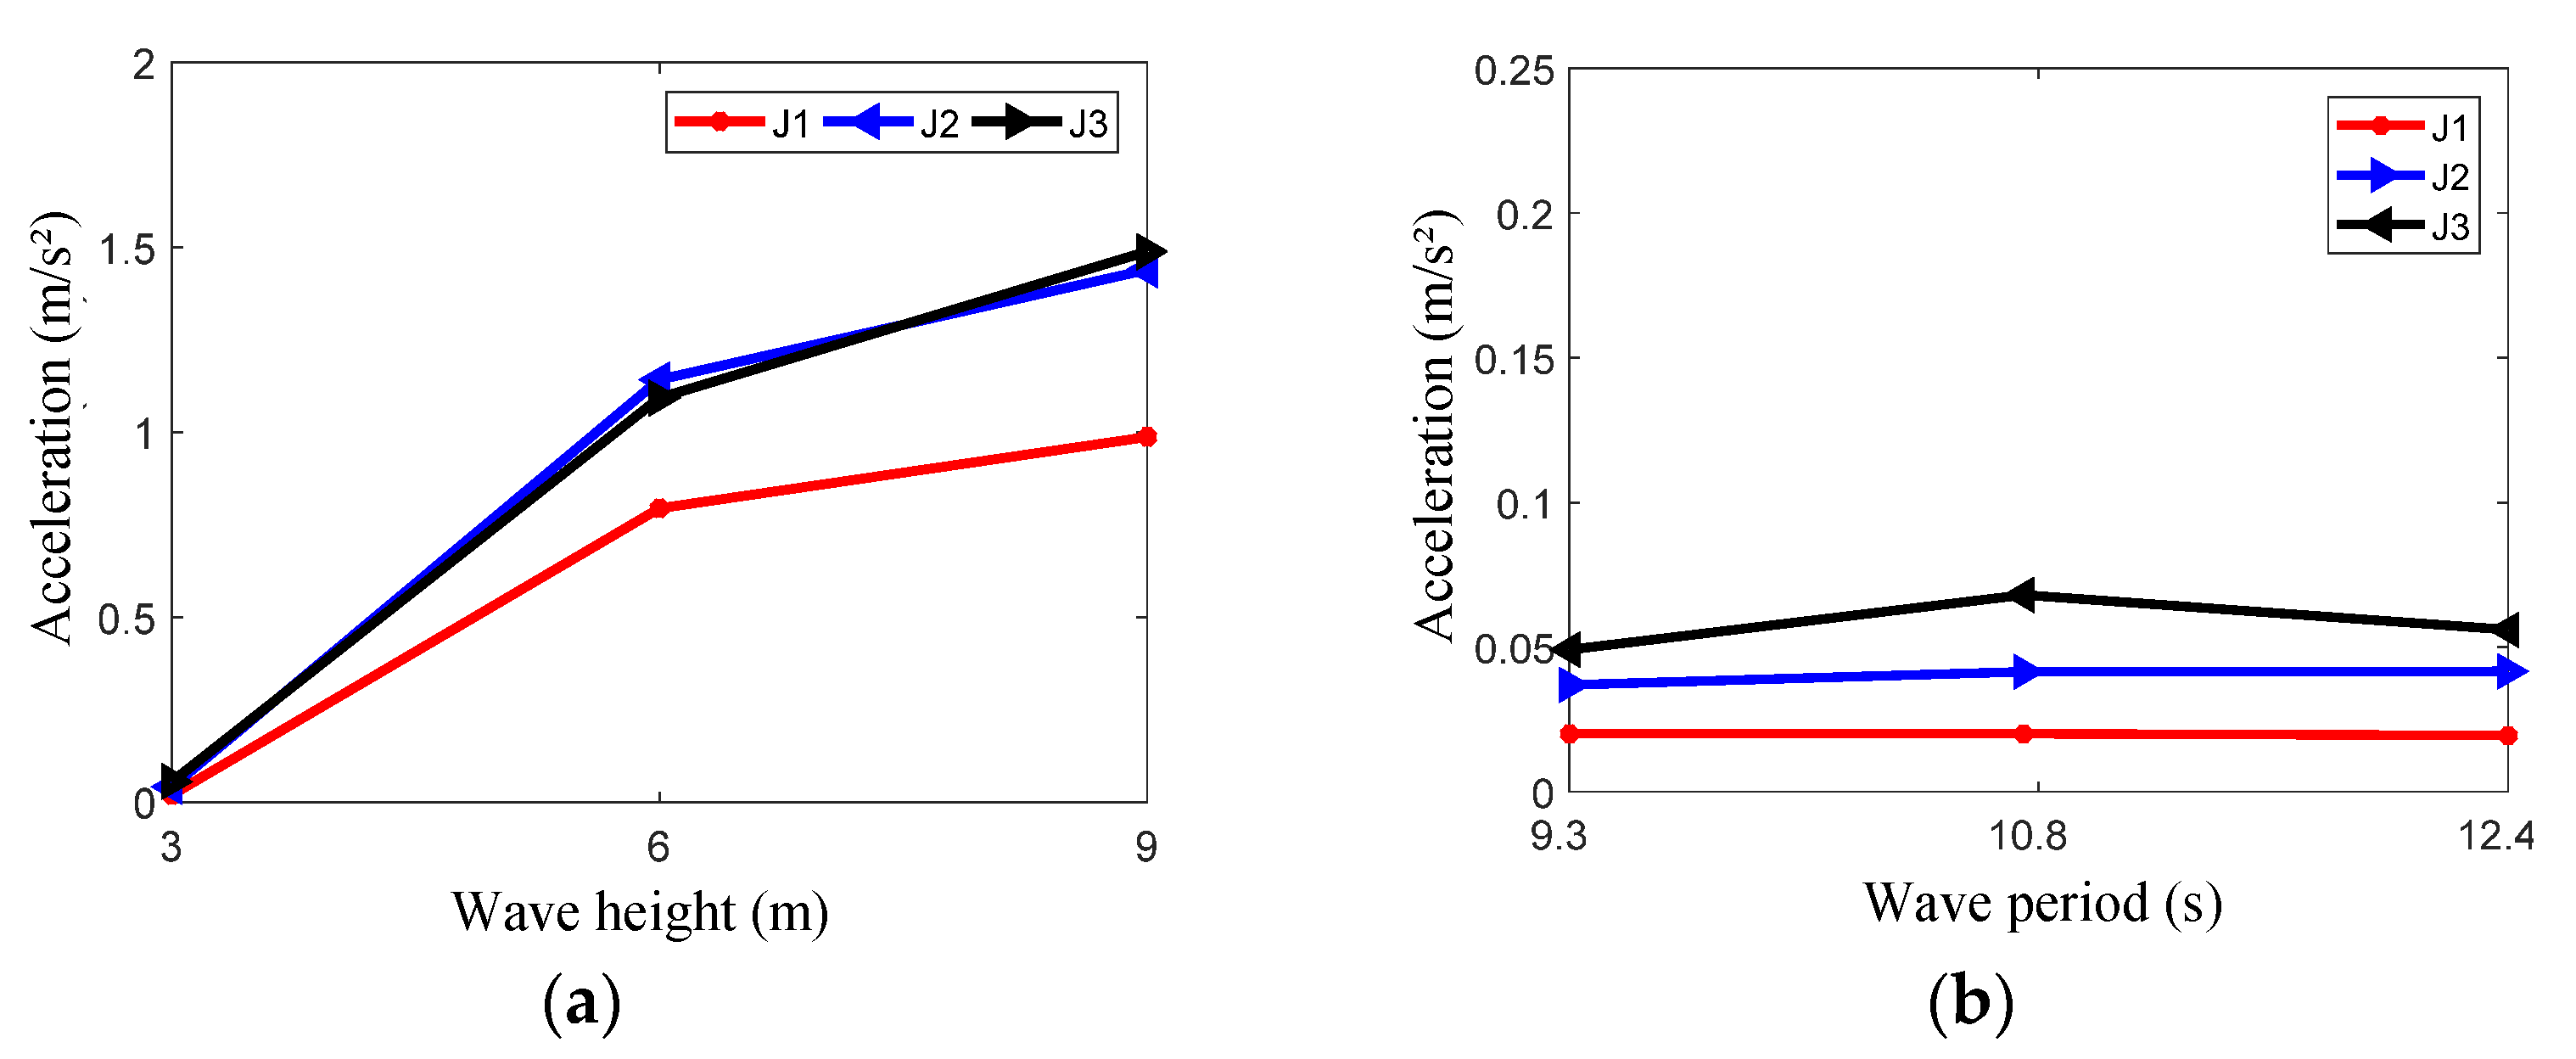
Representative measuring points J1, J2, and J3 at the upper part of the cage were selected to draw the curves for peak values of acceleration response (see Figure 14). When the period is constant, the wave height has an obvious effect on the peak acceleration. However, the peak acceleration of the measuring points has no obvious change with increases in the period.
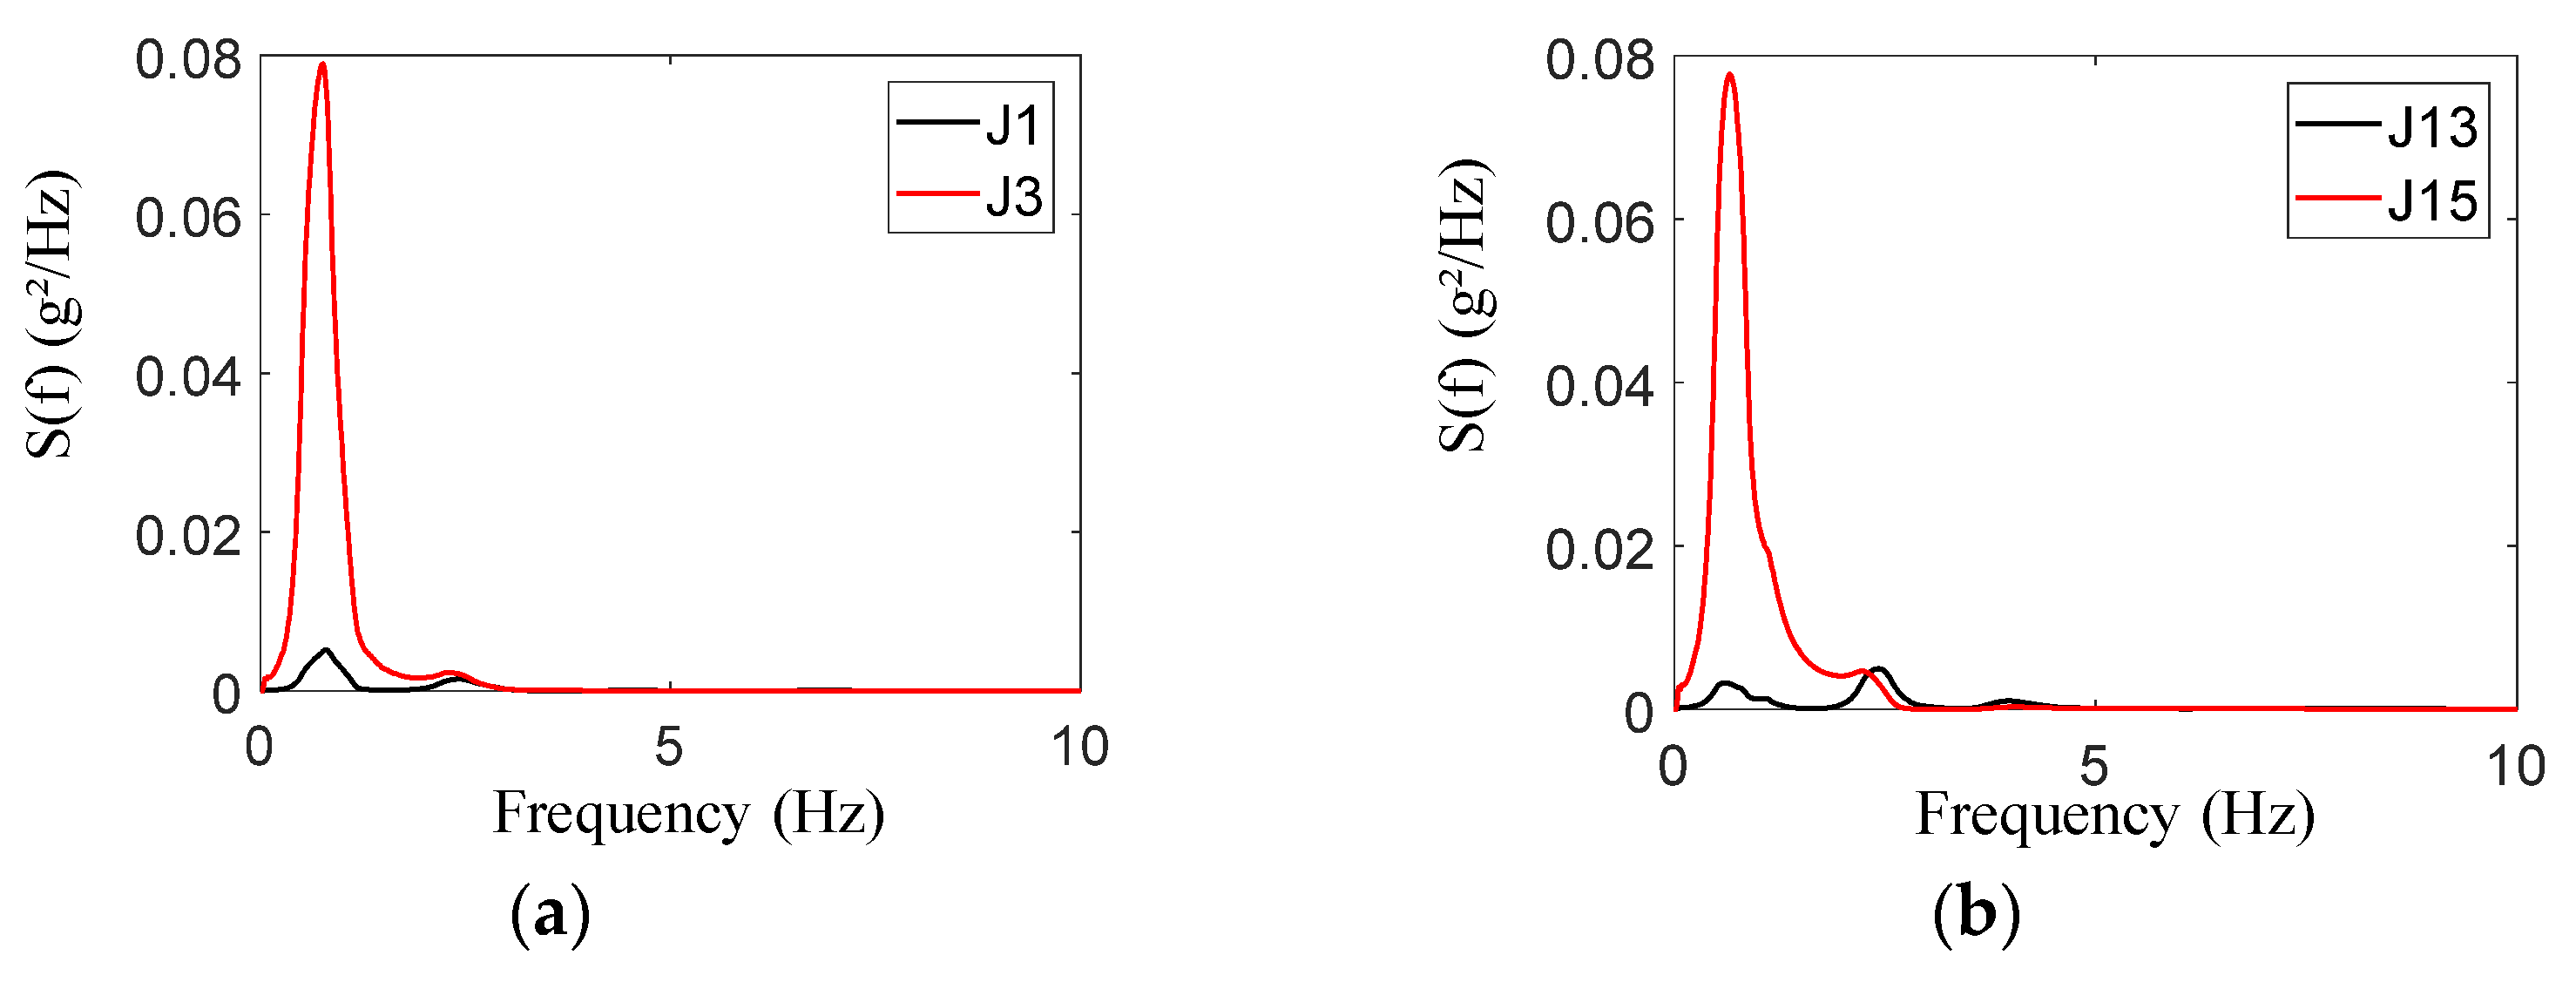
The frequency spectrum curves at measuring points J1, J3, J13, and J15 were also compared (see Figure 15). The spectral peak frequency of structural acceleration response is about 0.7 Hz. The frequency domain curves of J1 and J13 are basically consistent.
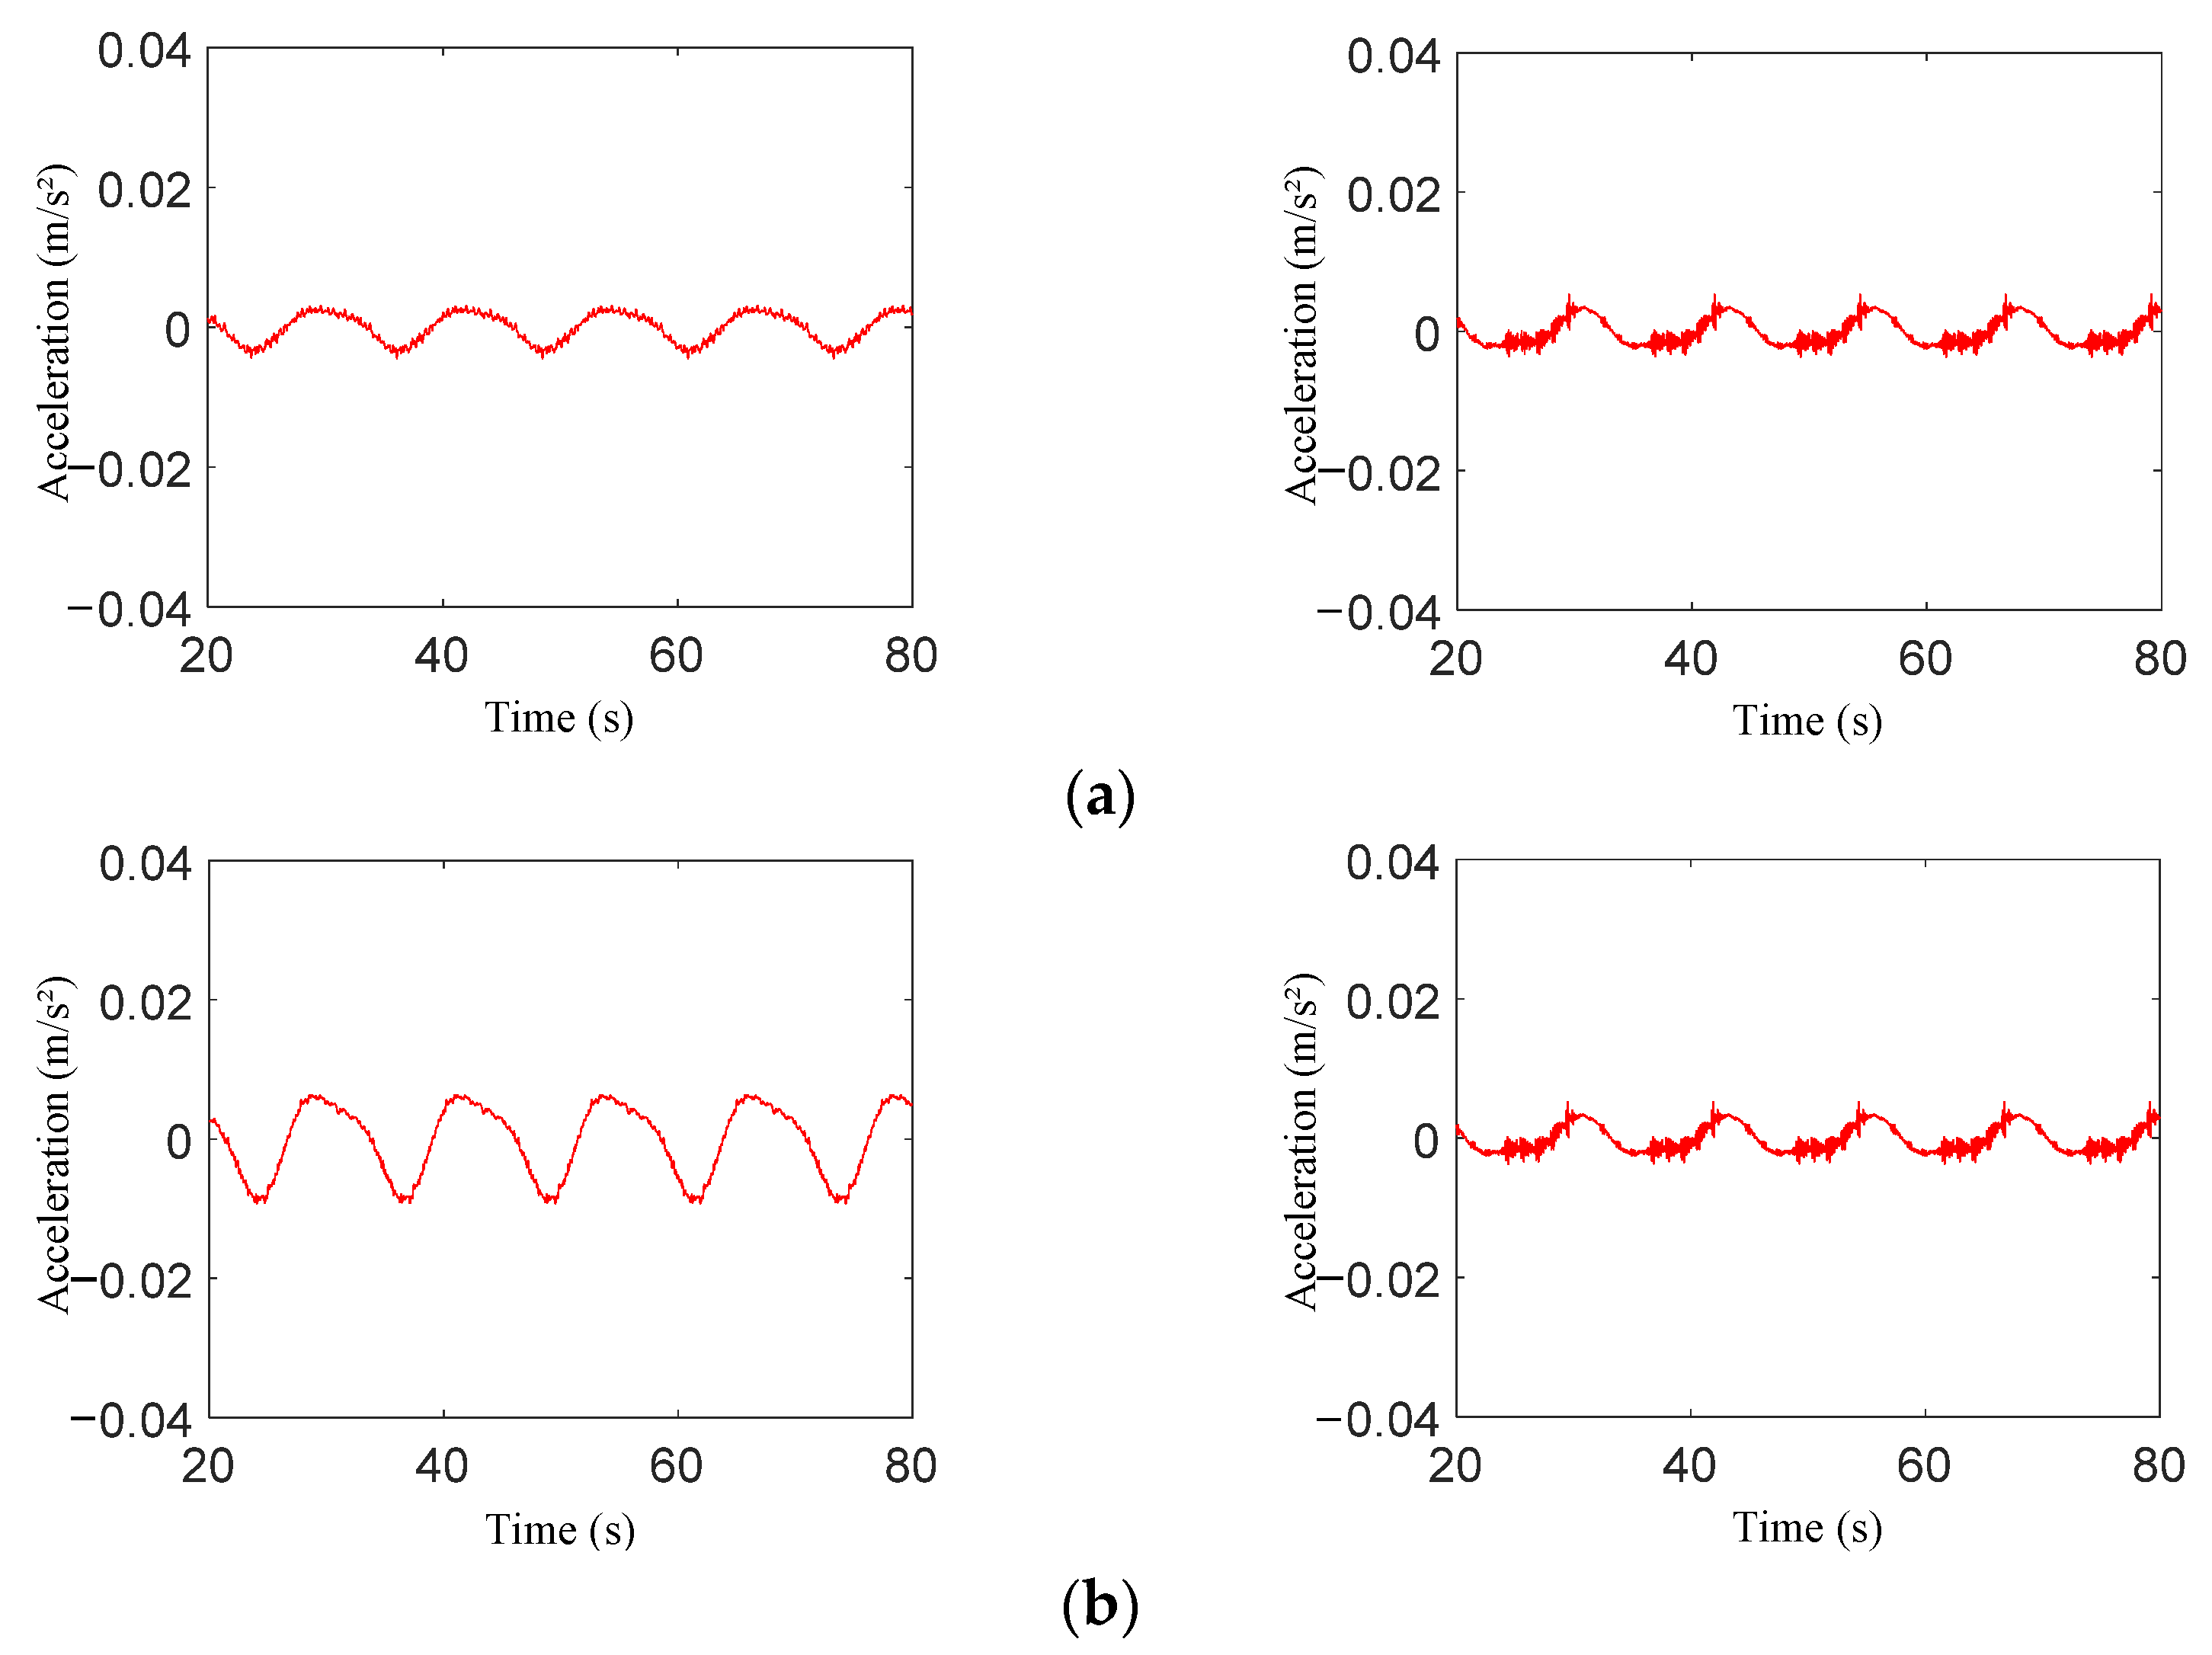
The acceleration curves of J1 and J3 at other attack angles were then compared (see Figure 16). When the attack angle is 45°, the peak acceleration of J1 is less than J3. When the attack angle is 90°, there is little difference between the peak values of the two measuring points.

4.3. Displacement Responses

Taking H = 3 m, T = 12.4 s as an example, the change in displacement response along the height was compared, and measuring points U1, U13, and U17 on the cage and measuring points U16, U20, and U21 on the oblique brace were selected. On the net cage, displacement decreases with the increase in height (Figure 17). However, the peak displacement of the measuring point located in the middle of the oblique brace is the largest.
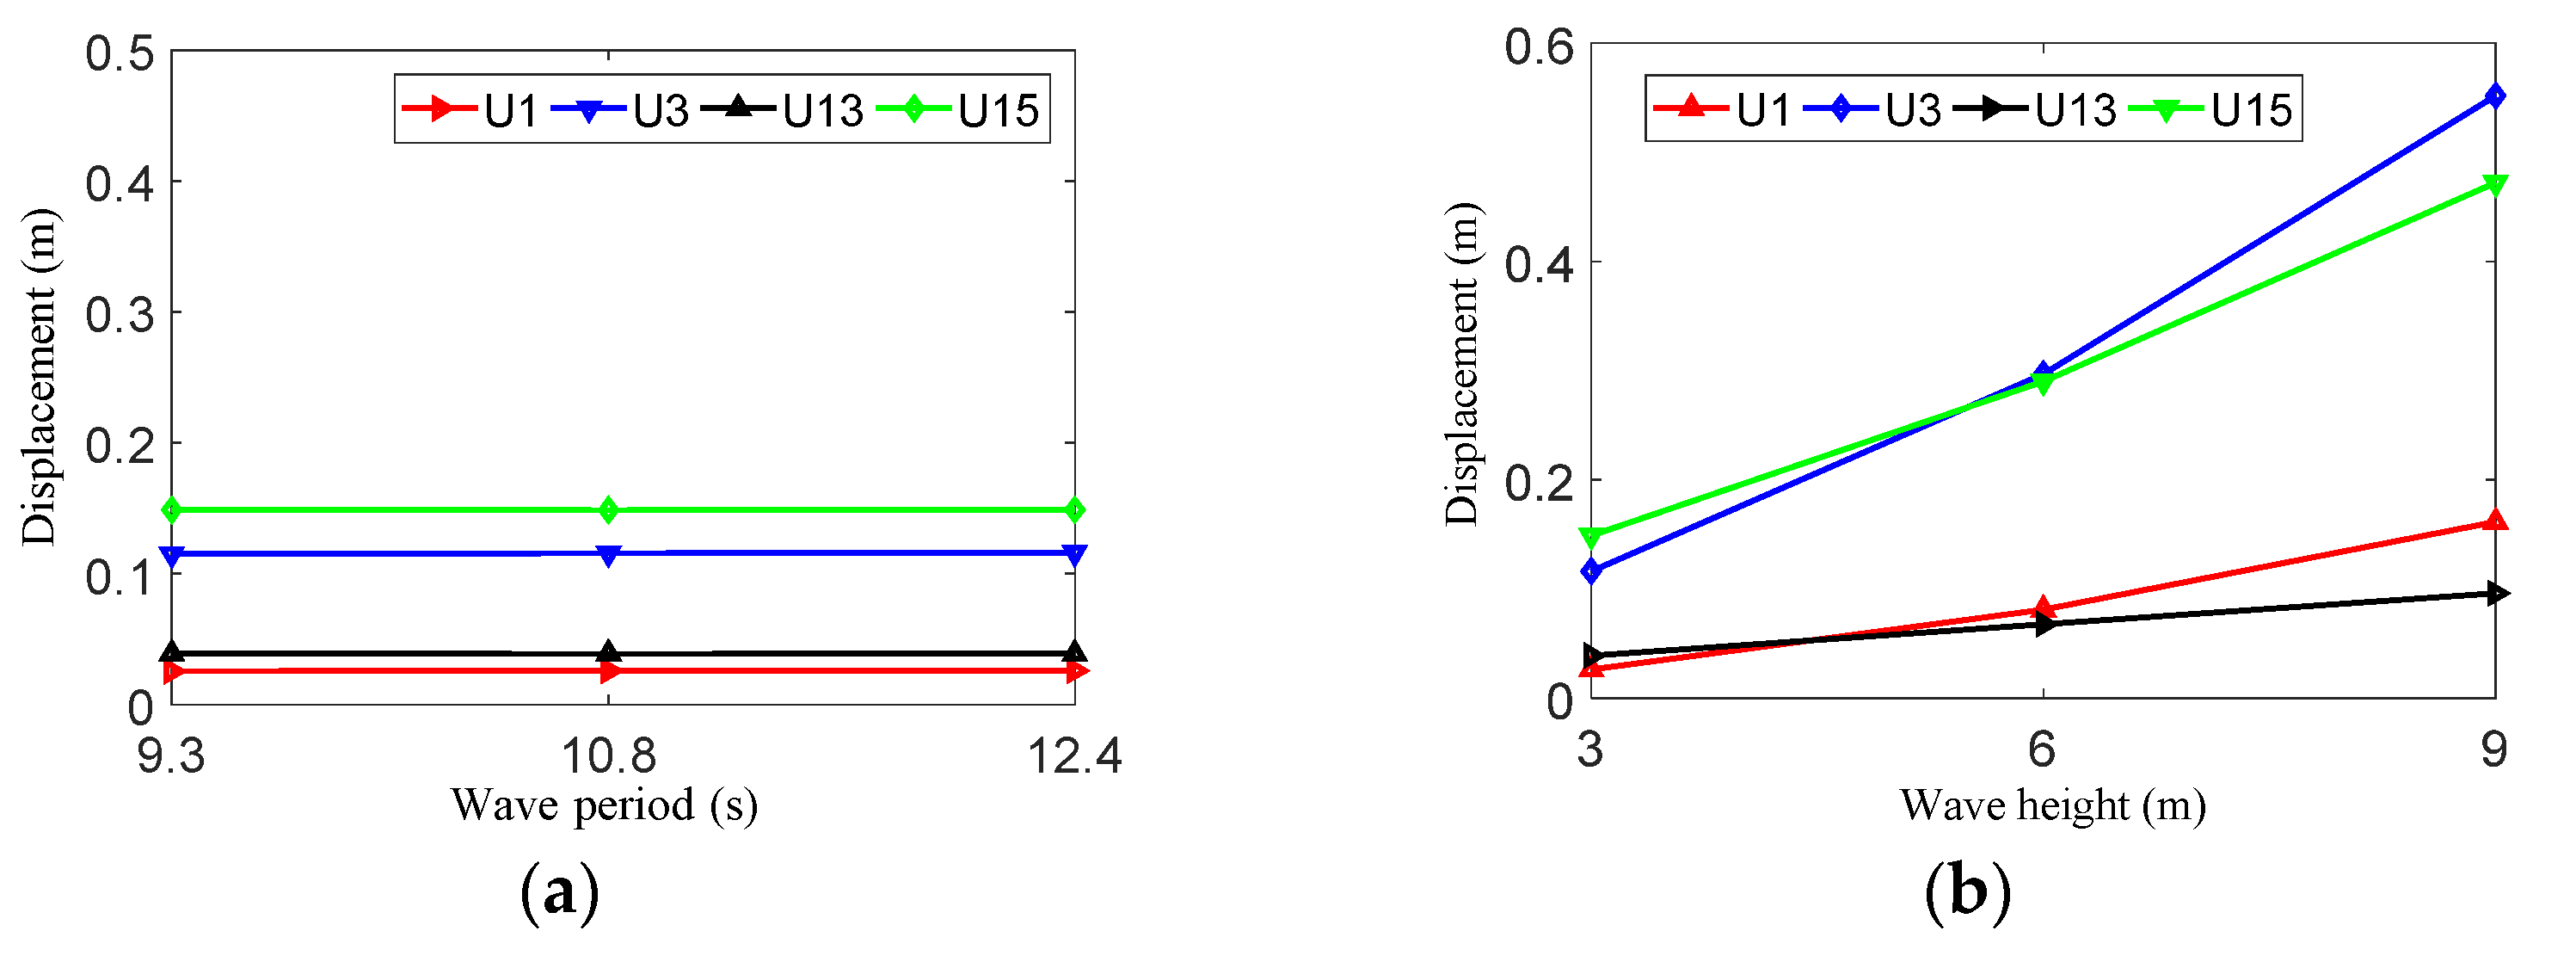
The peak displacement response is less affected by wave period (see Figure 18a). When the period is 12.4 s, it increases linearly with the change in wave height (see Figure 18b). With the change in wave height, the displacement of U1 and U13 increases slightly, while that of measuring points U3 and U15 increases significantly.
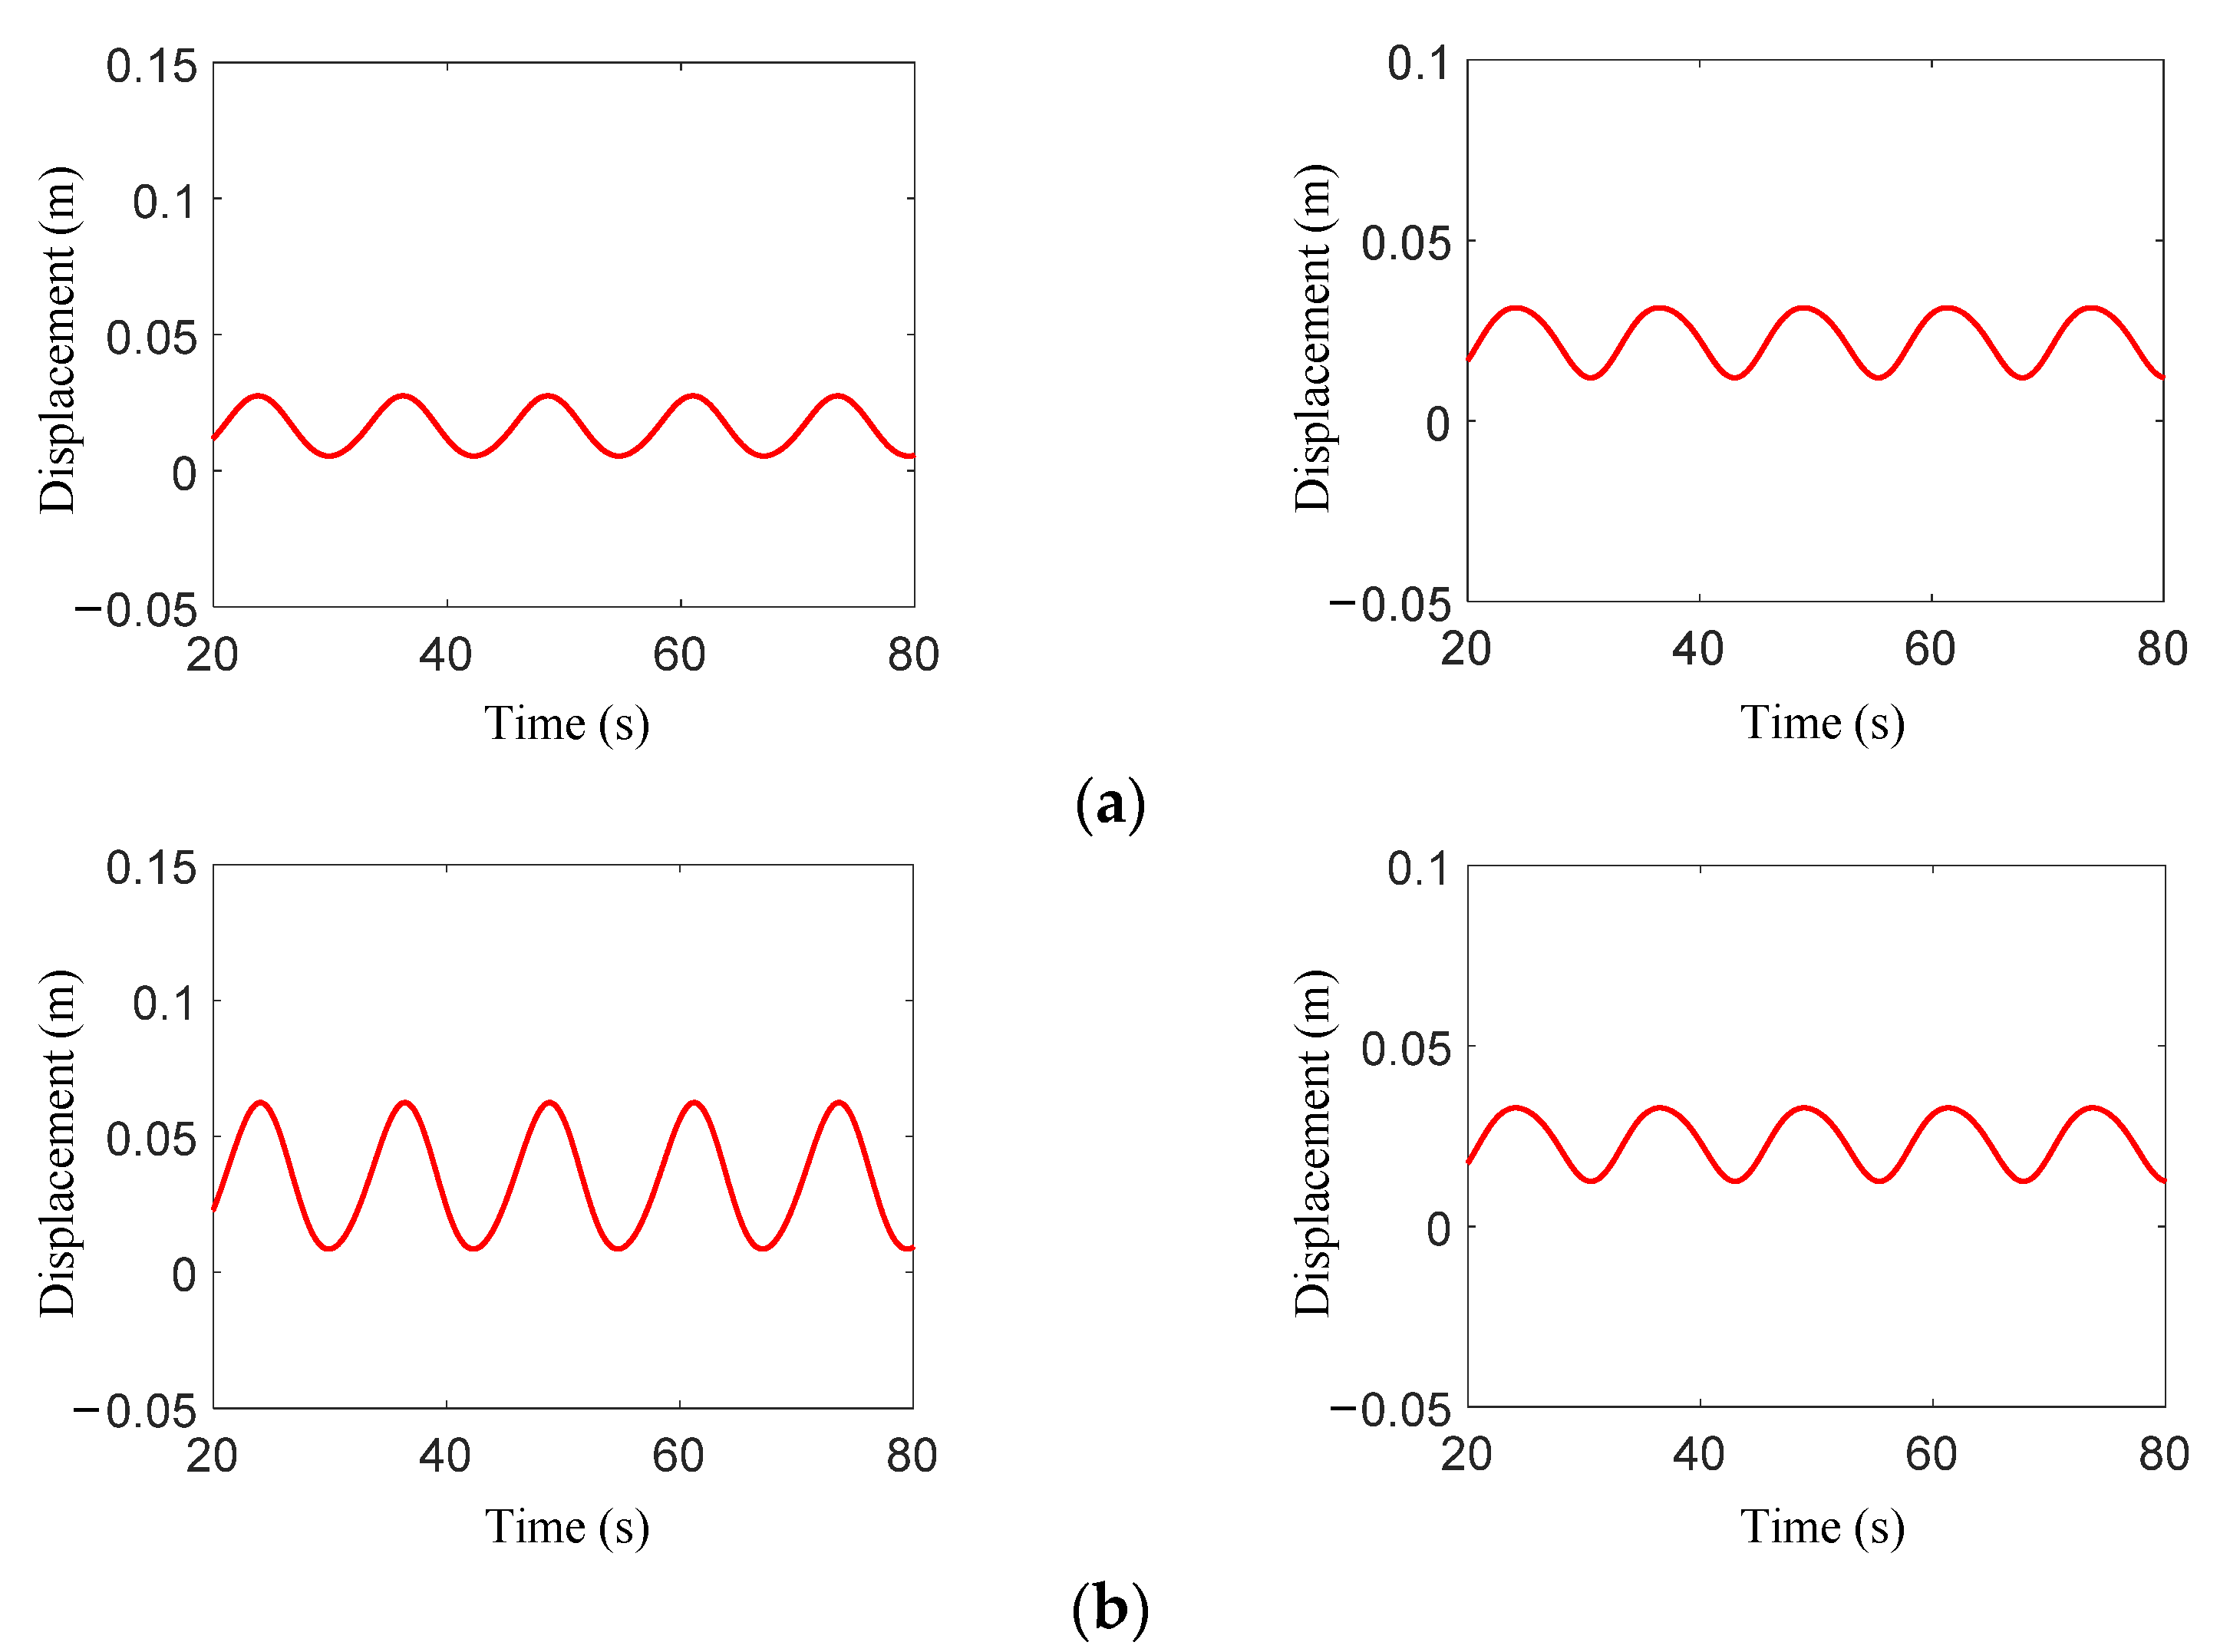
The structural displacement curves at different attack angles were compared (Figure 19). The displacement responses of the fixed aquaculture platform are quite different at different attack angles.

5. Discussion

5.1. The Influence of Attack Angle on the Dynamic Response of the Structure

The attack angle has a significant influence on the displacement of each position (Figure 20). The displacement of each measuring point of the fixed culture platform is the largest under load in the direction of 0°. The displacement values are smaller under 90° and 45° attack angles and are similar. Most of the members of the fixed aquaculture platform are perpendicular to the load direction at 0°, and the projection area of the net on the plane perpendicular to the load direction is larger than other attack angles, resulting in larger displacement of the structure. At other attack angles, the acting area of the structure is reduced and the displacement is smaller.
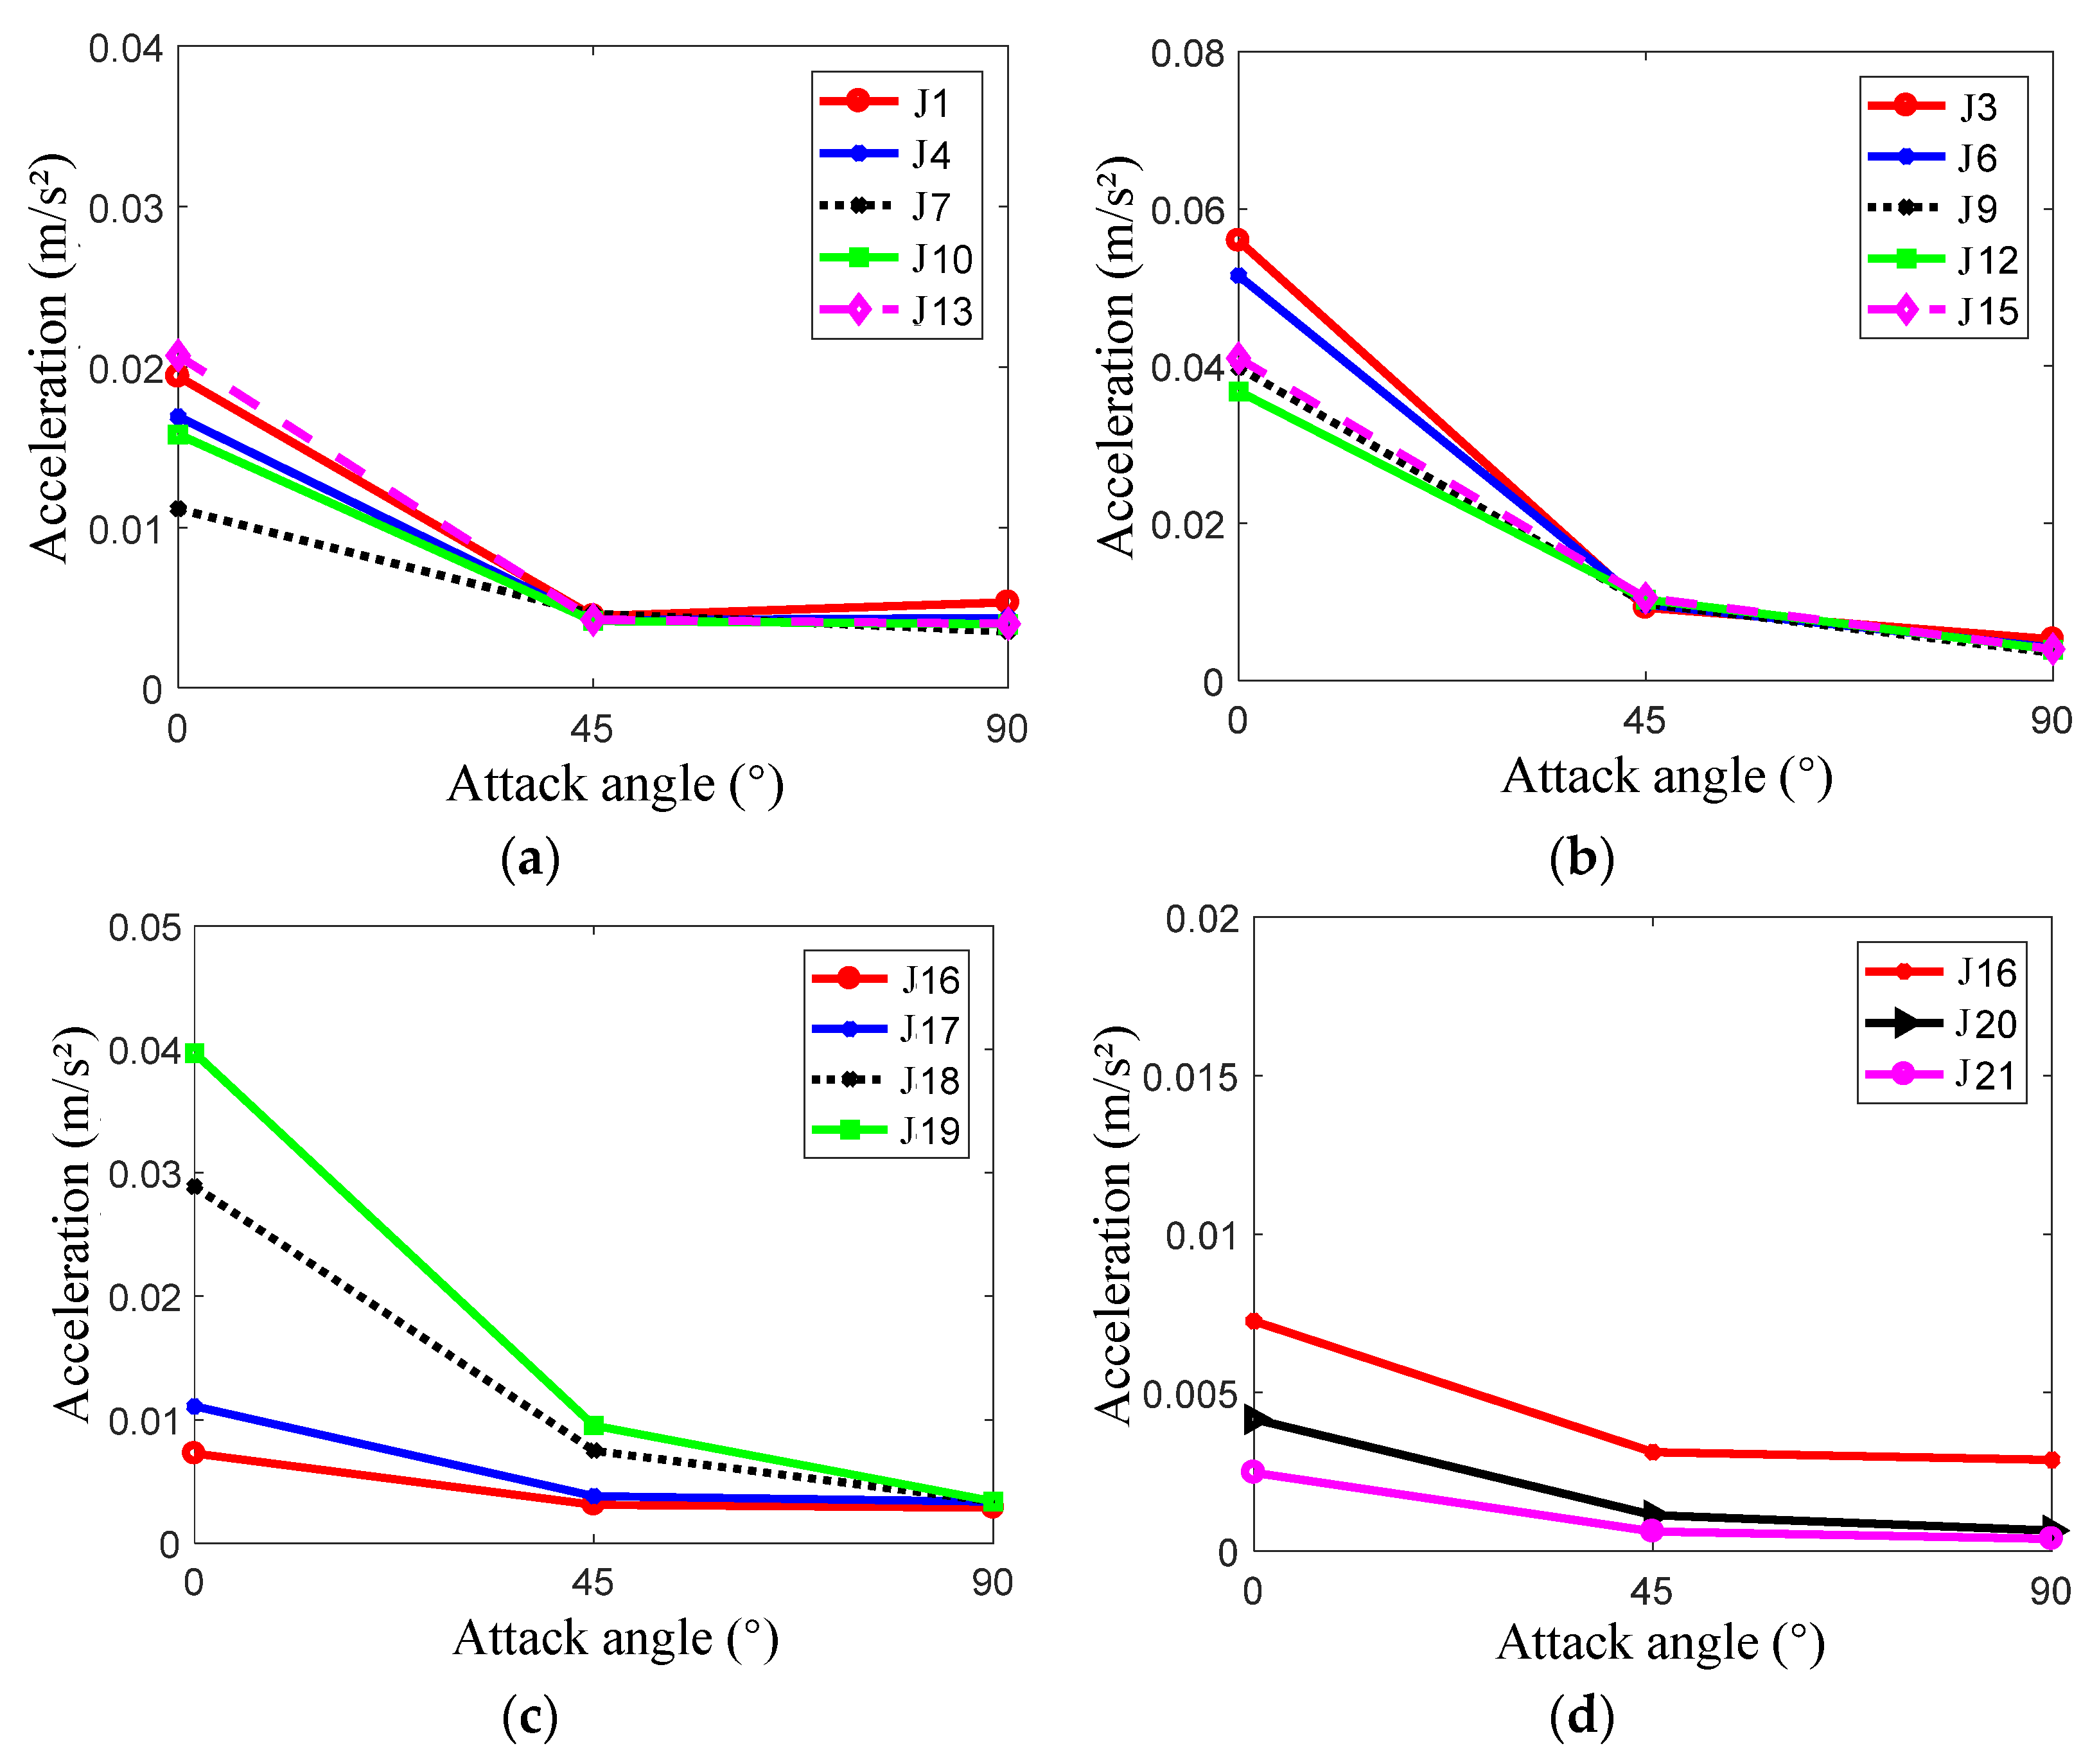
The peak acceleration of the measuring points on the cage is of an order of magnitude equal to the negative quadratic power of 10. The acceleration values reach the maximum at 0° (Figure 21). This is because the major axis of the cage is along the Y axis, and the force area is the largest when the attack angle is 0°. The acceleration responses of most points are very small and almost equal at 90°. Because the force area of the cage is the smallest at 90°, the peak acceleration is the smallest. On the other hand, the acceleration responses at measuring points J1 and J13, which are located at the end of the cage, first decrease and then increase with the increase in attack angle and reach the minimum value when the attack angle is 45°. Therefore, it can be considered that the attack angle of 0° is the most unfavorable direction of load for acceleration.
The variation curves of the peak strain at each position at different attack angles are shown in Figure 22. The maximum strain response measuring point is S10 at the attack angle of 0°, S4 at the attack angle of 45°, and S1 at the attack angle of 90°. These measuring points are all at the end of the net cage. Because the force is transferred to both ends, the bending moments at the end are greater and the stress and strain values are also larger. The strain response peak value at each point generally decreases with the increase in attack angle. This is because, when the attack angle is 0°, most of the members of the fixed aquaculture platform are perpendicular to the load direction, and the force area is larger than other attack angles, resulting in larger strain.

5.2. The Influence of Water Depth on the Dynamic Response of the Structure

The water level is also an important factor affecting the hydrodynamic response. The extreme water level does great damage to the structure and can cause serious economic losses. Various water levels are designed according to the hydrological data, as shown in Table 3.
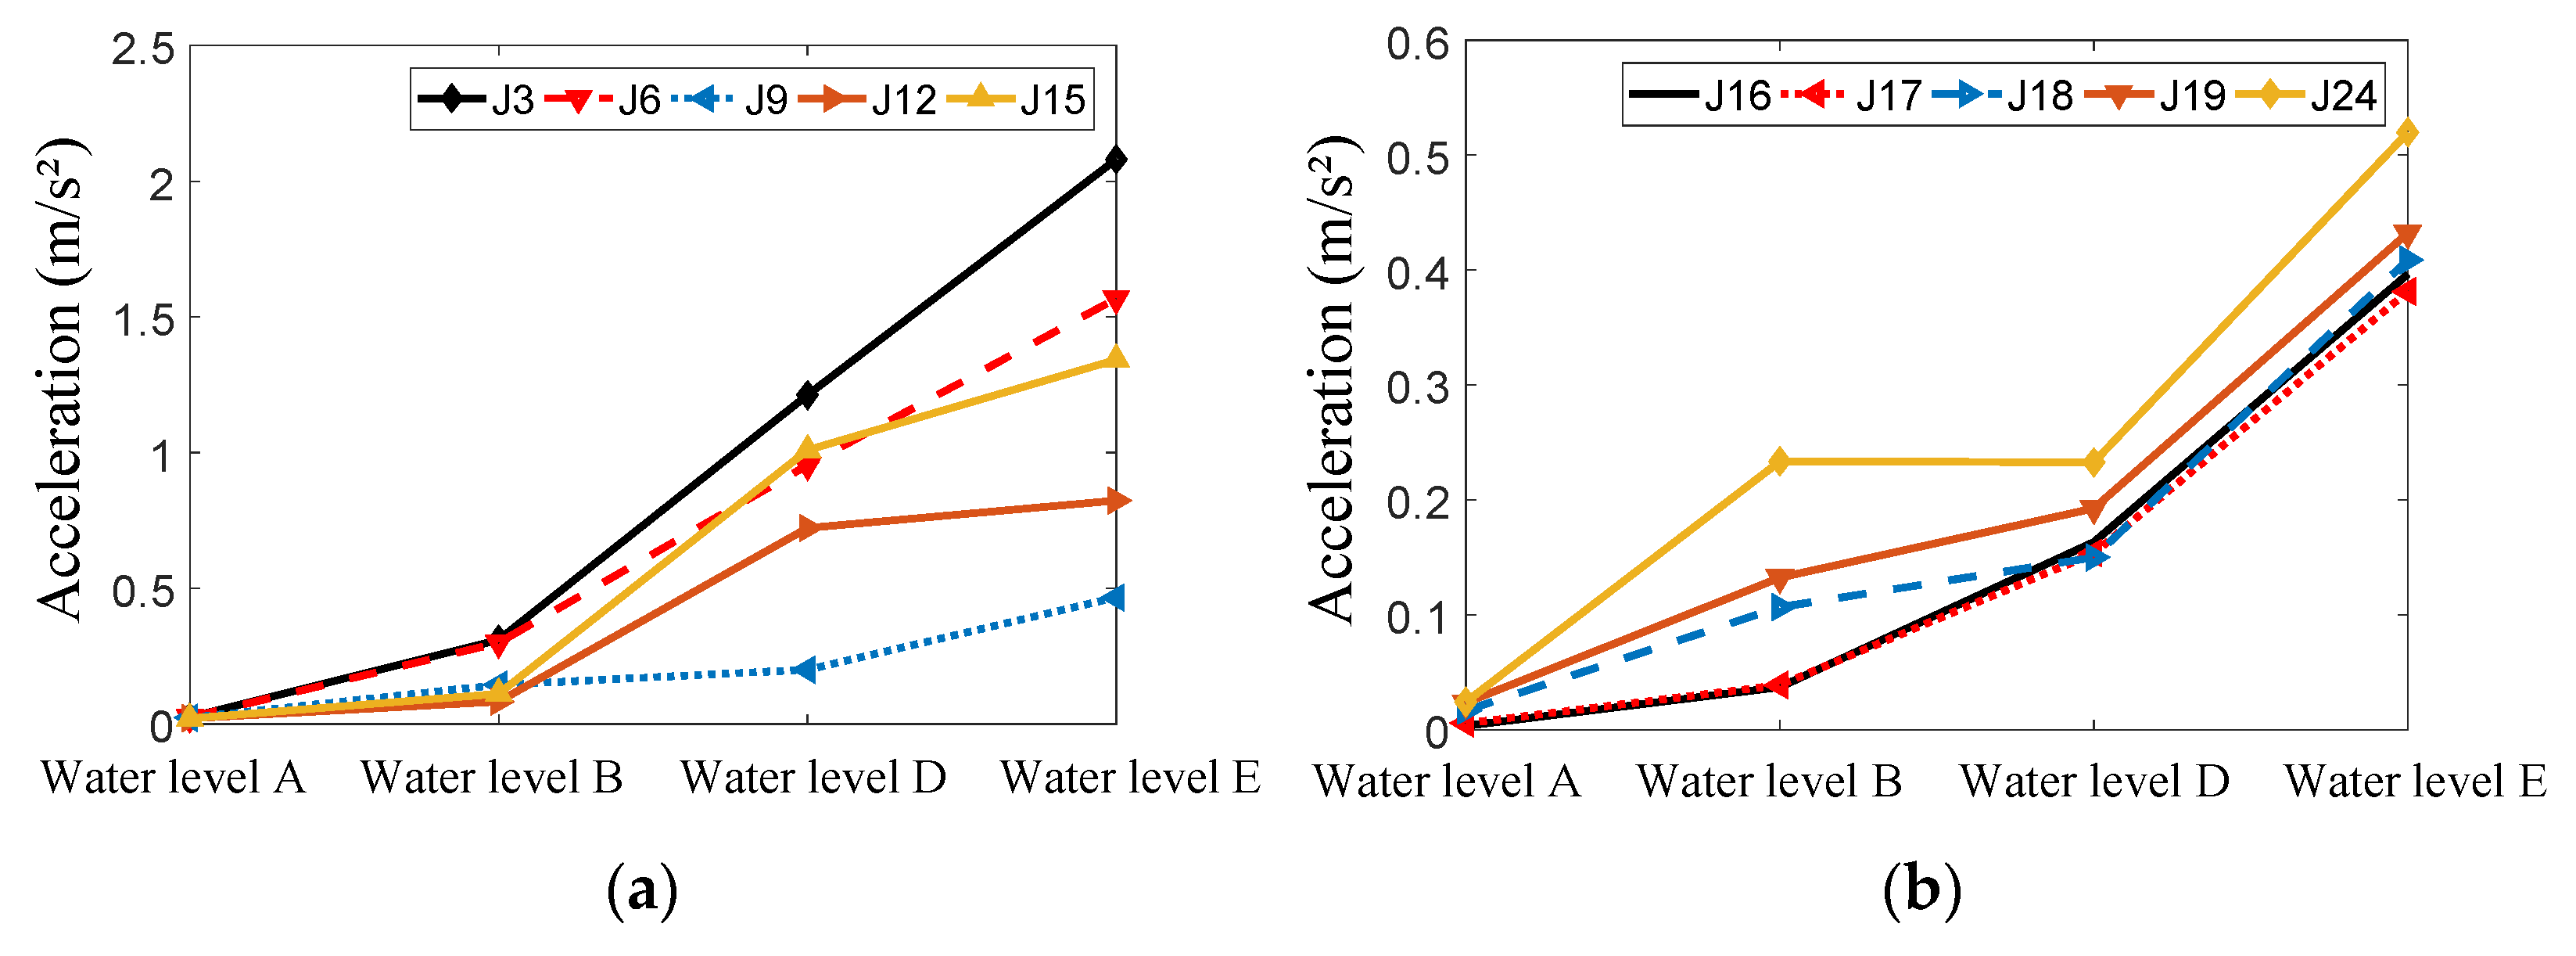
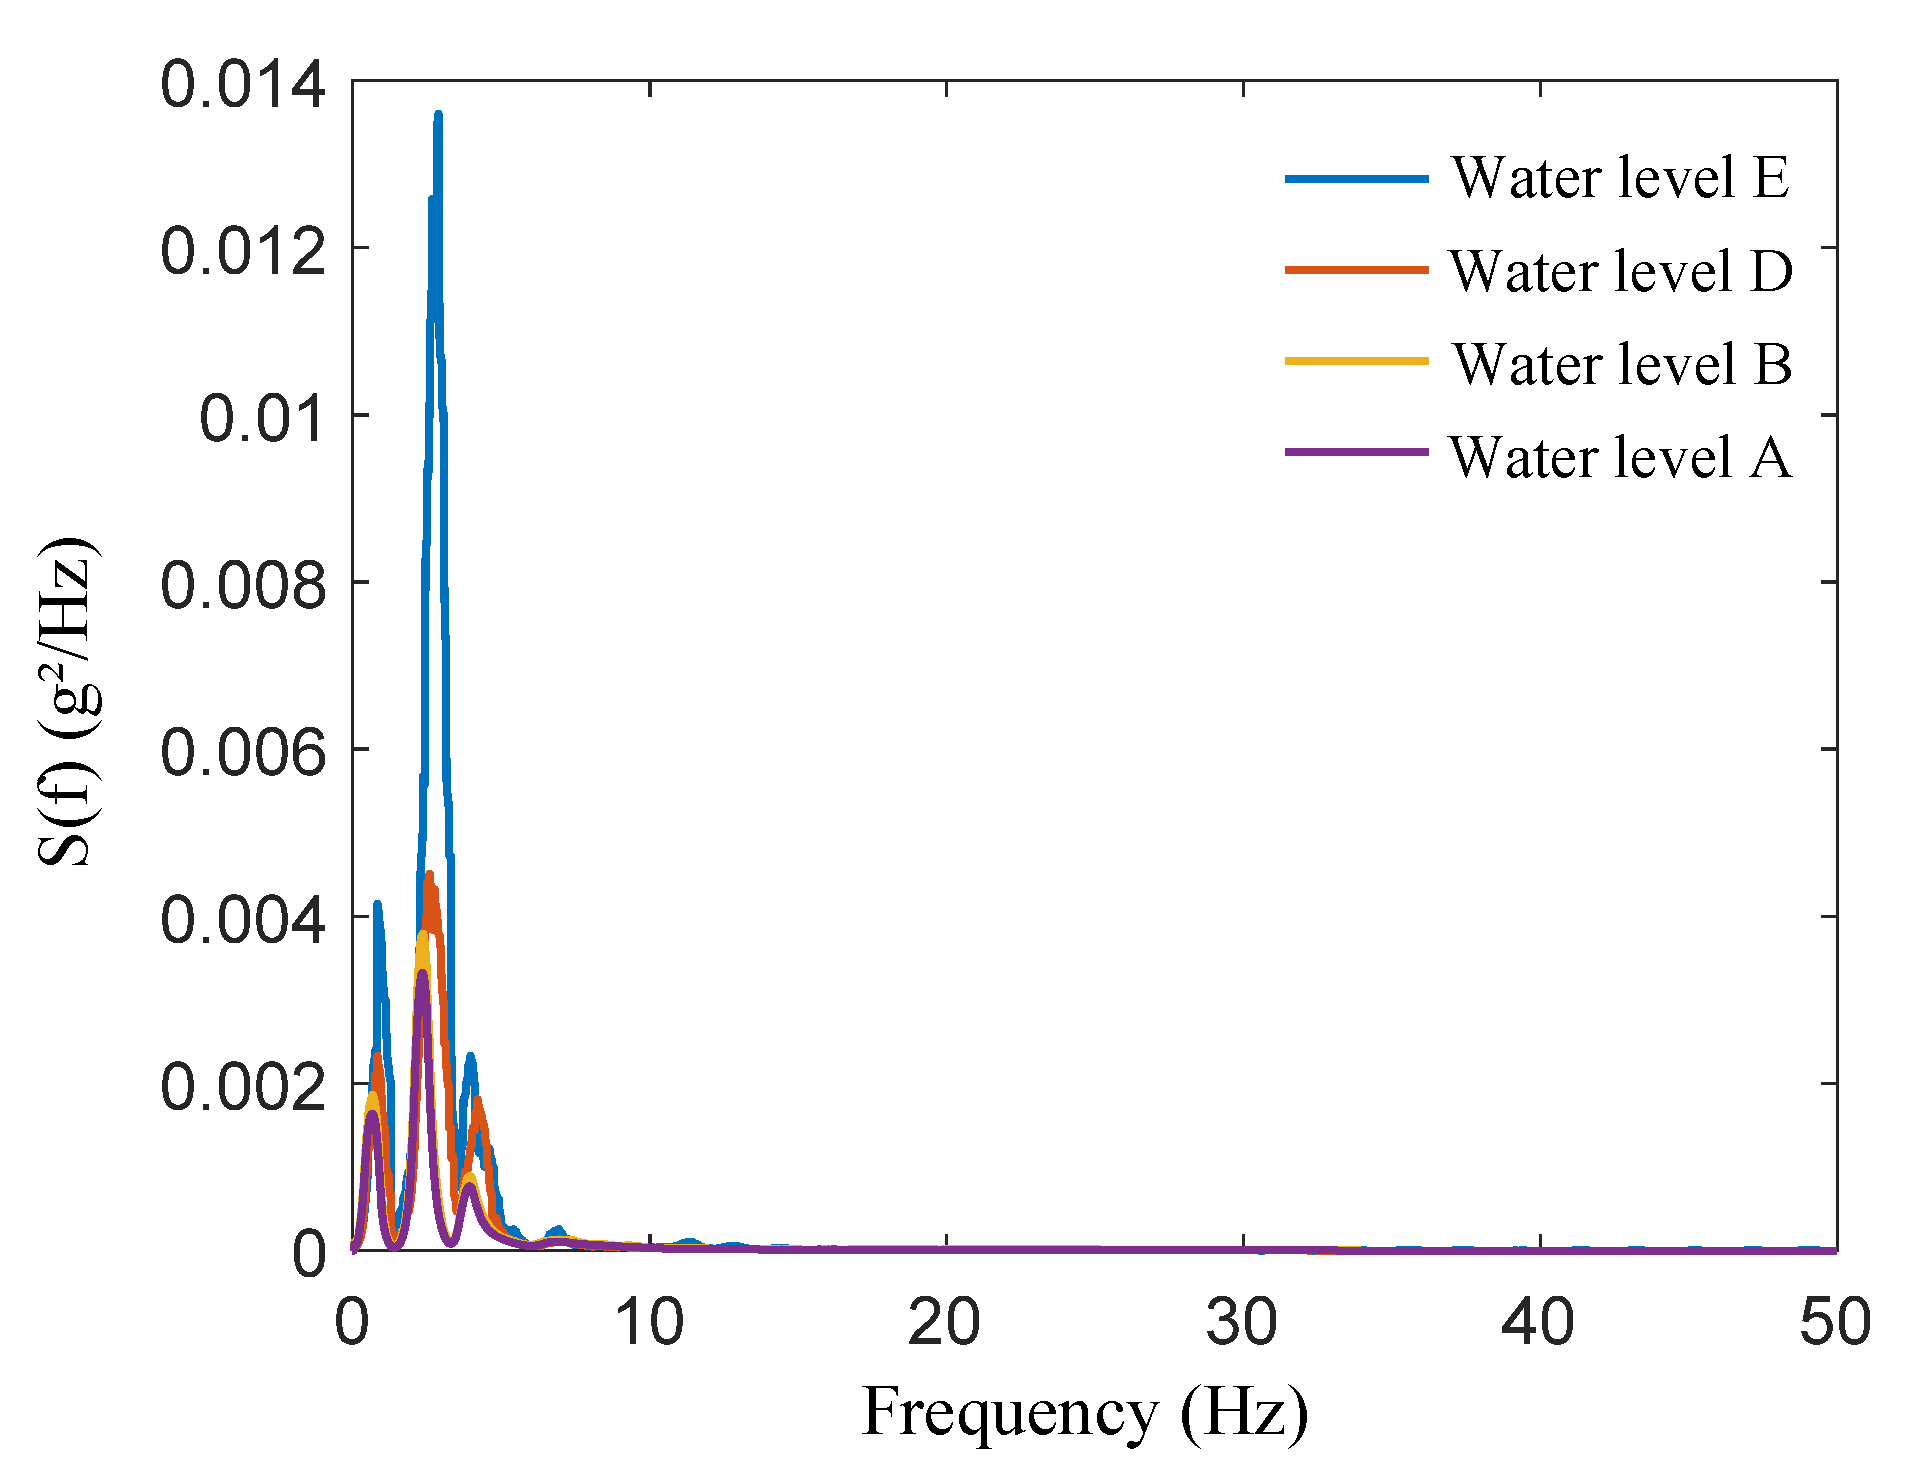
Under the extremely high water level, the acceleration values are very small. The acceleration values of measuring points J16 and J17 show little difference at each water level. The acceleration values decrease with the increase in water level (Figure 23). This is because more parts of the structure are submerged into the water, and the influence of water damping thus becomes greater, leading to reduced acceleration values. The acceleration of measuring point J24 is obviously larger than other positions at the central axis of the cage because measuring point 24 is located in the middle of the cage where there is no diagonal bar around it to provide support; thus, its peak acceleration is larger. Along the circumferential direction of the net cage, the peak acceleration of J3 is largest and that of J9 is smallest. Variation in the peak acceleration of J9 with water level is the smallest. At different water levels, the shape of the acceleration frequency spectrum curves is basically the same, and they all have multiple peaks (Figure 24). The frequency corresponding to the maximum peak is about 3 Hz.
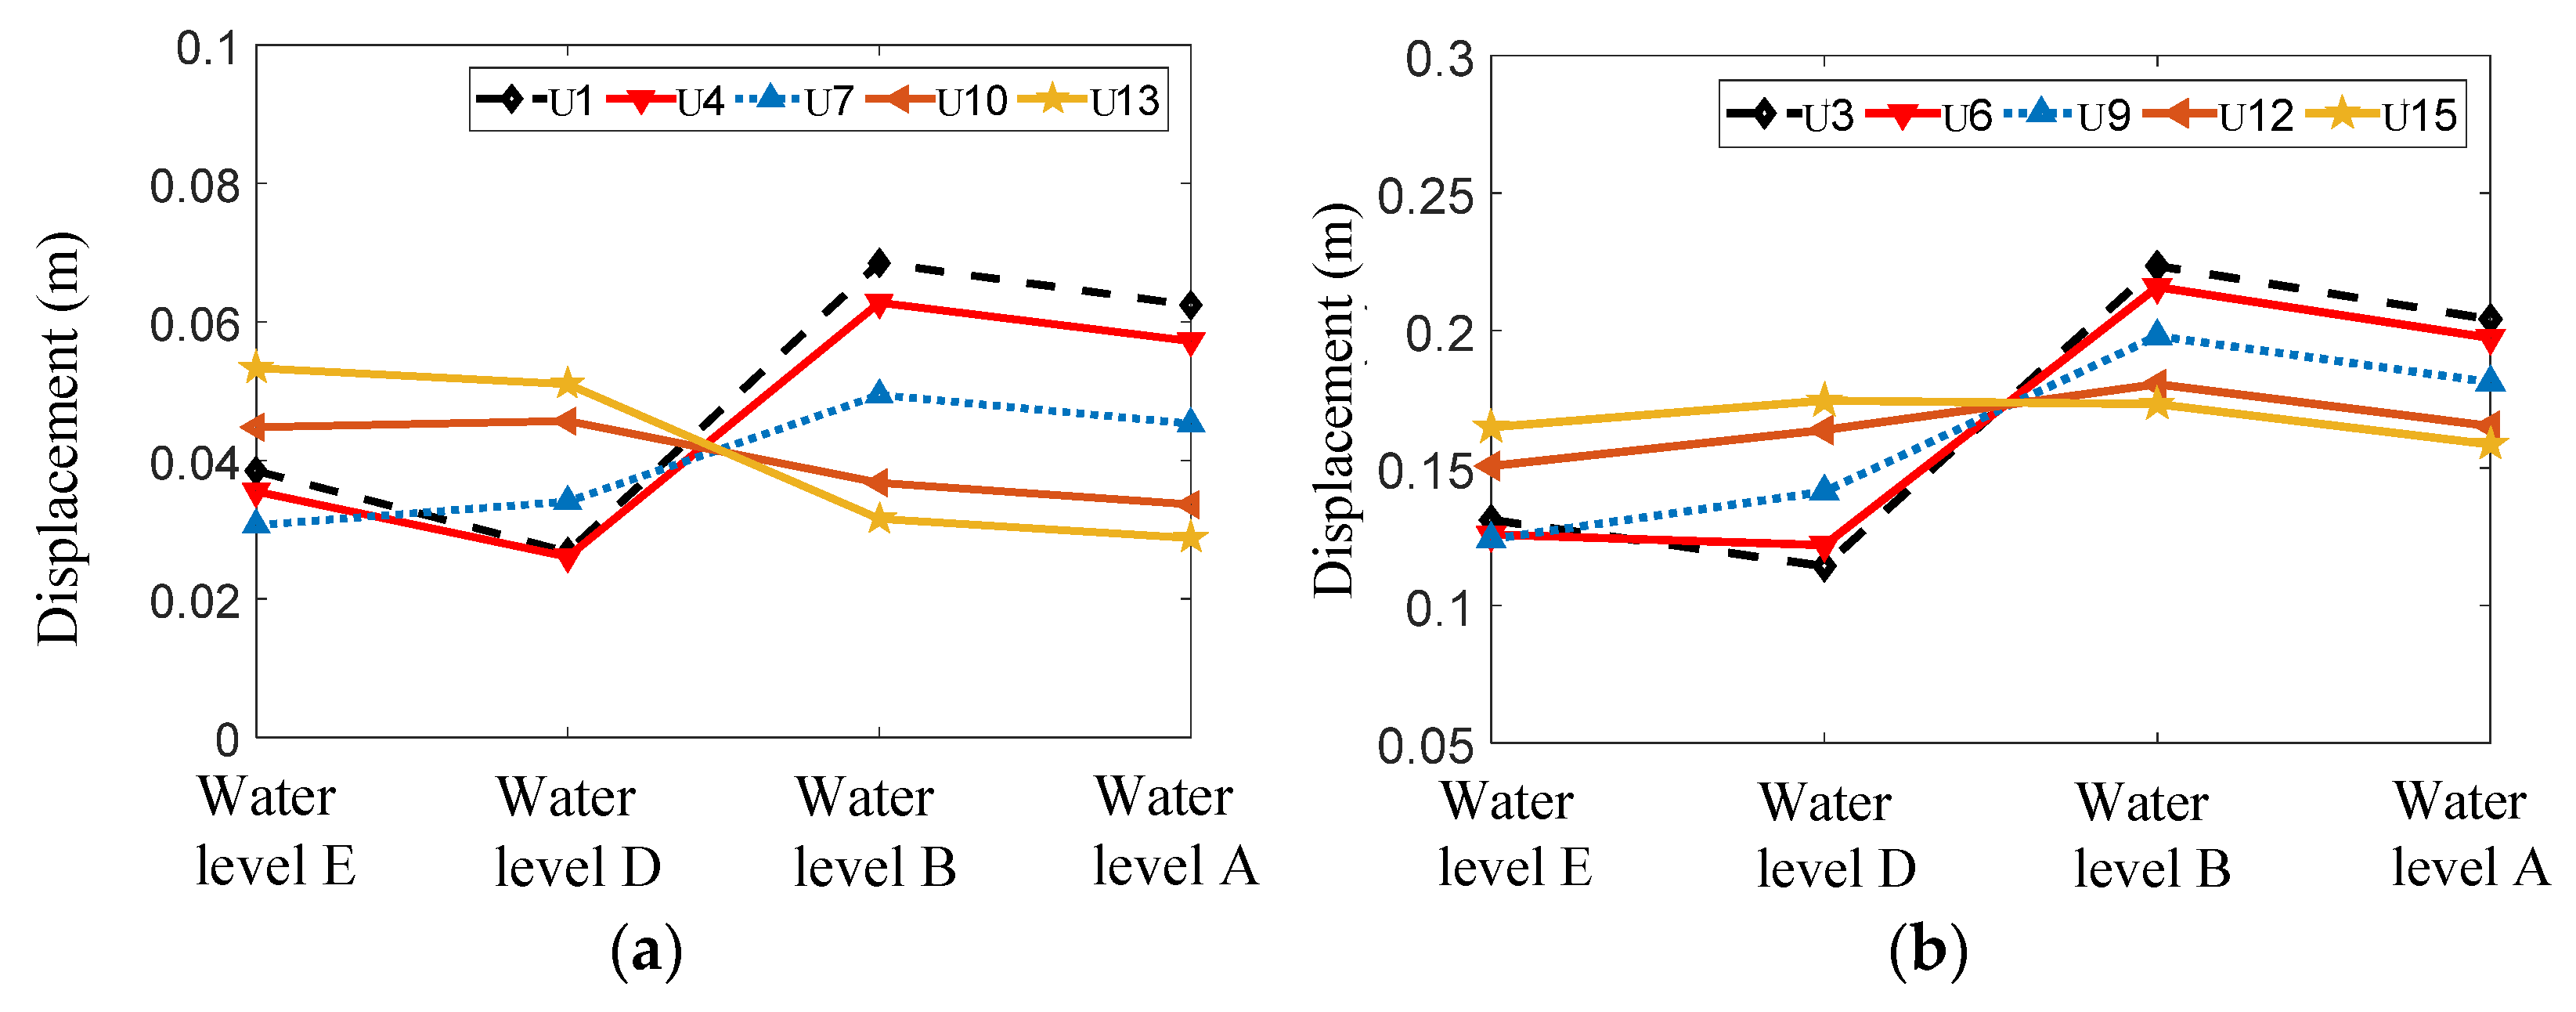
According to Figure 25, the displacement peak values of measuring points U1, U3, U4, and U6 located in the upper part of the cage decrease at first, increase, and then decrease with the increase in water depth. This is because the load only acts on the lower part of the structure at an extremely low water level, and the peak displacement decreases due to the action of water damping when the water level rises. When the water level reaches the designed high water level, the wave load mainly acts on the upper part of the cage and the flow velocity at the water surface is the largest, with the displacement of the measuring point thus reaching the maximum value. When the water level reaches the extremely high water level, the structure is completely submerged in water and the effect of damping is significant, and displacement thus becomes smaller. The displacement peak values of measuring points U10 and U13 at the end of the cage decrease with the increase in water depth. The displacement peak values of measuring points U7, U9, U12, and U15 increase at first and then decrease with the increase in water level.
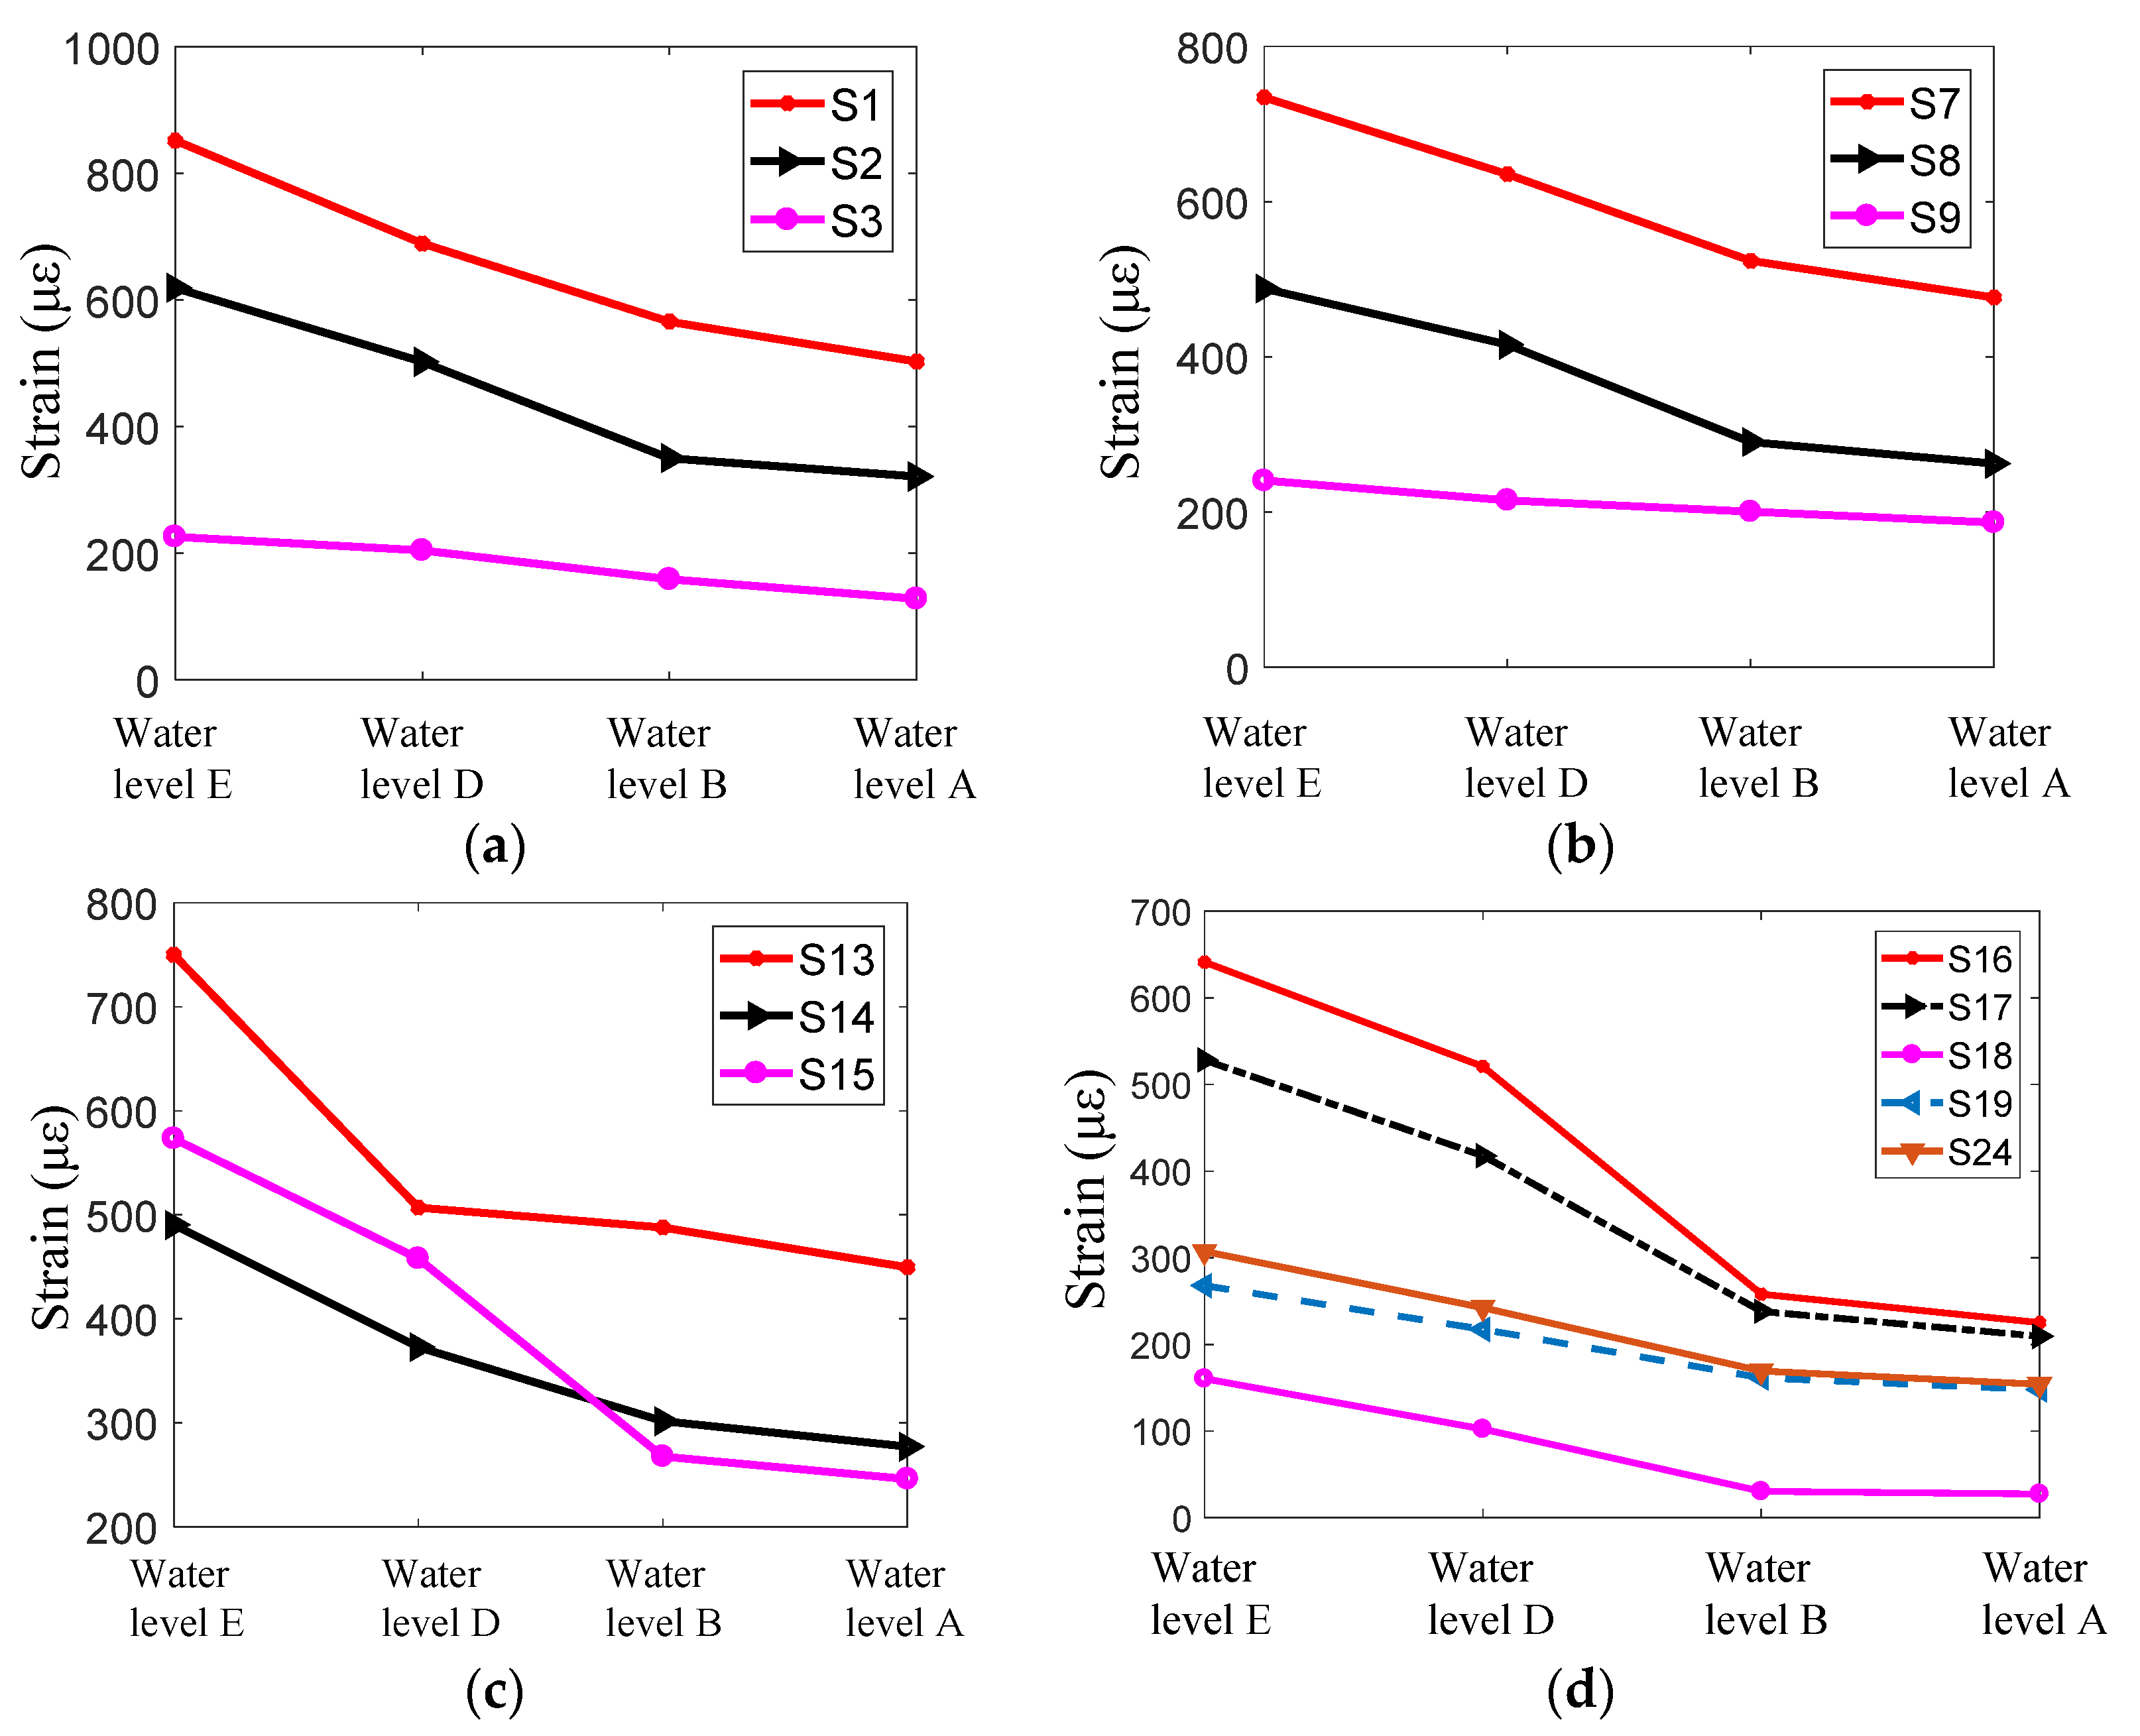
For the outer frame of the net cage, the strain values decrease with the increase in water level (Figure 26a–c). For the central axis of the net cage, the strain response values also decrease with the increase in water depth (Figure 26d).
In addition, the strain response peak values at measuring points S1, S7, and S13 are much larger than those in the middle of the outer frame of the cage. On the central axis of the cage, the strain response peak value decreases and then increases from the end to the middle position, and the strain response peak value at S18 is the smallest. This is because S16 is the junction of the cage’s central axis and the oblique brace of the tower, while S17 is the junction of the cage’s central axis and the radial support of the net cage, both of which are places of stress concentration; thus, the strain is larger.

5.3. The Influence of Cage Rotation on the Dynamic Response of the Structure

When cleaning nets in traditional cages, it is necessary to clean manually or after the net has been dismantled, which is time-consuming and laborious. For the fixed aquaculture platform proposed in this paper, the cage can be rotated around the horizontal axis. With rotation of the cage, underwater nets and frames leak out of the water surface to remove biofouling. When the cage rotates, its hydrodynamic response is more complex.
In this part of the numerical simulation, the side support of the structure was removed and only the net cage was calculated. The cage rotates under the action of the environmental load after releasing the rotation constraint around the Y axis.
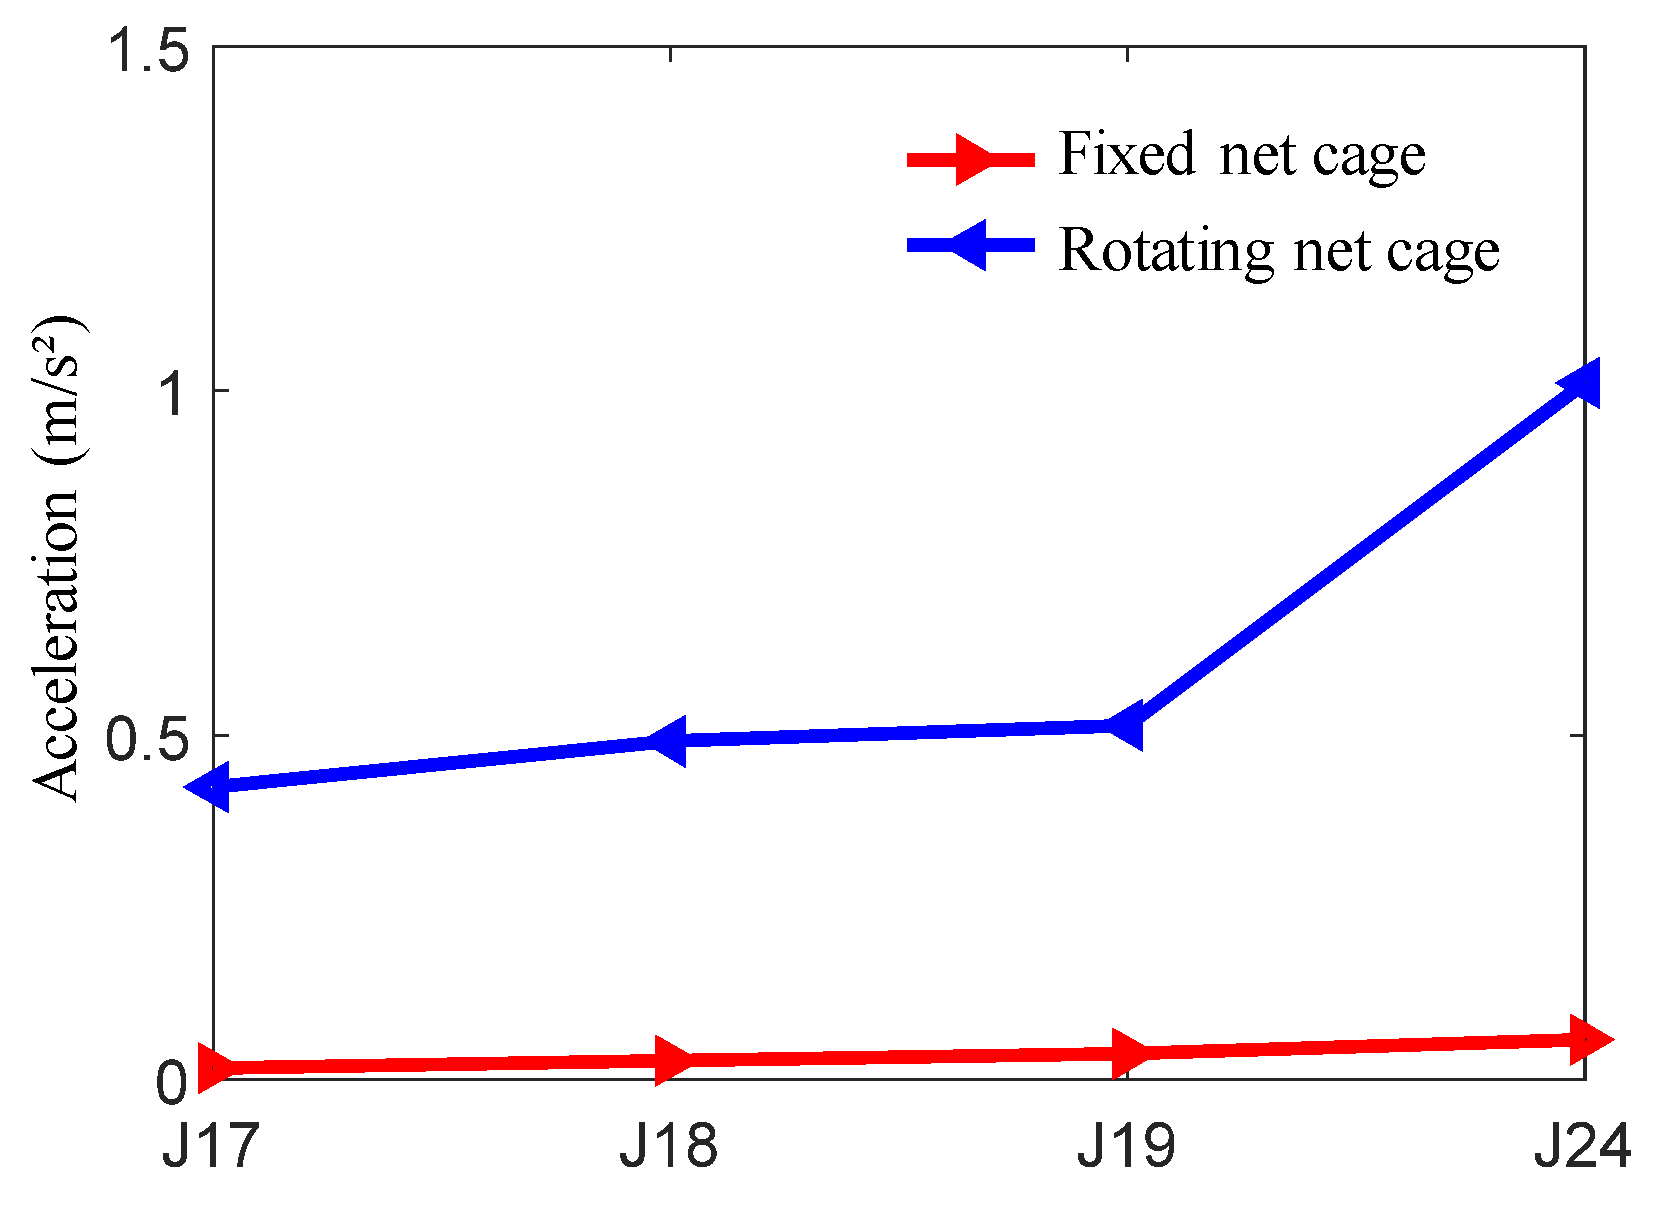
Whether the cage is fixed or the cage is rotated, the peak acceleration response increases gradually from the end of the cage to the middle of the cage. When the cage is fixed, the peak acceleration changes indistinctly. When the cage rotates, the peak acceleration response of J17, J18, and J19 also changes indistinctly; however, the acceleration of J24 increases greatly (Figure 27). The peak acceleration response of measuring points J17, J18, and J19 is more than 40% higher when the cage is rotated than when the cage is fixed. At J24, the peak acceleration response is 93% higher when the cage is rotated than when the cage is fixed.
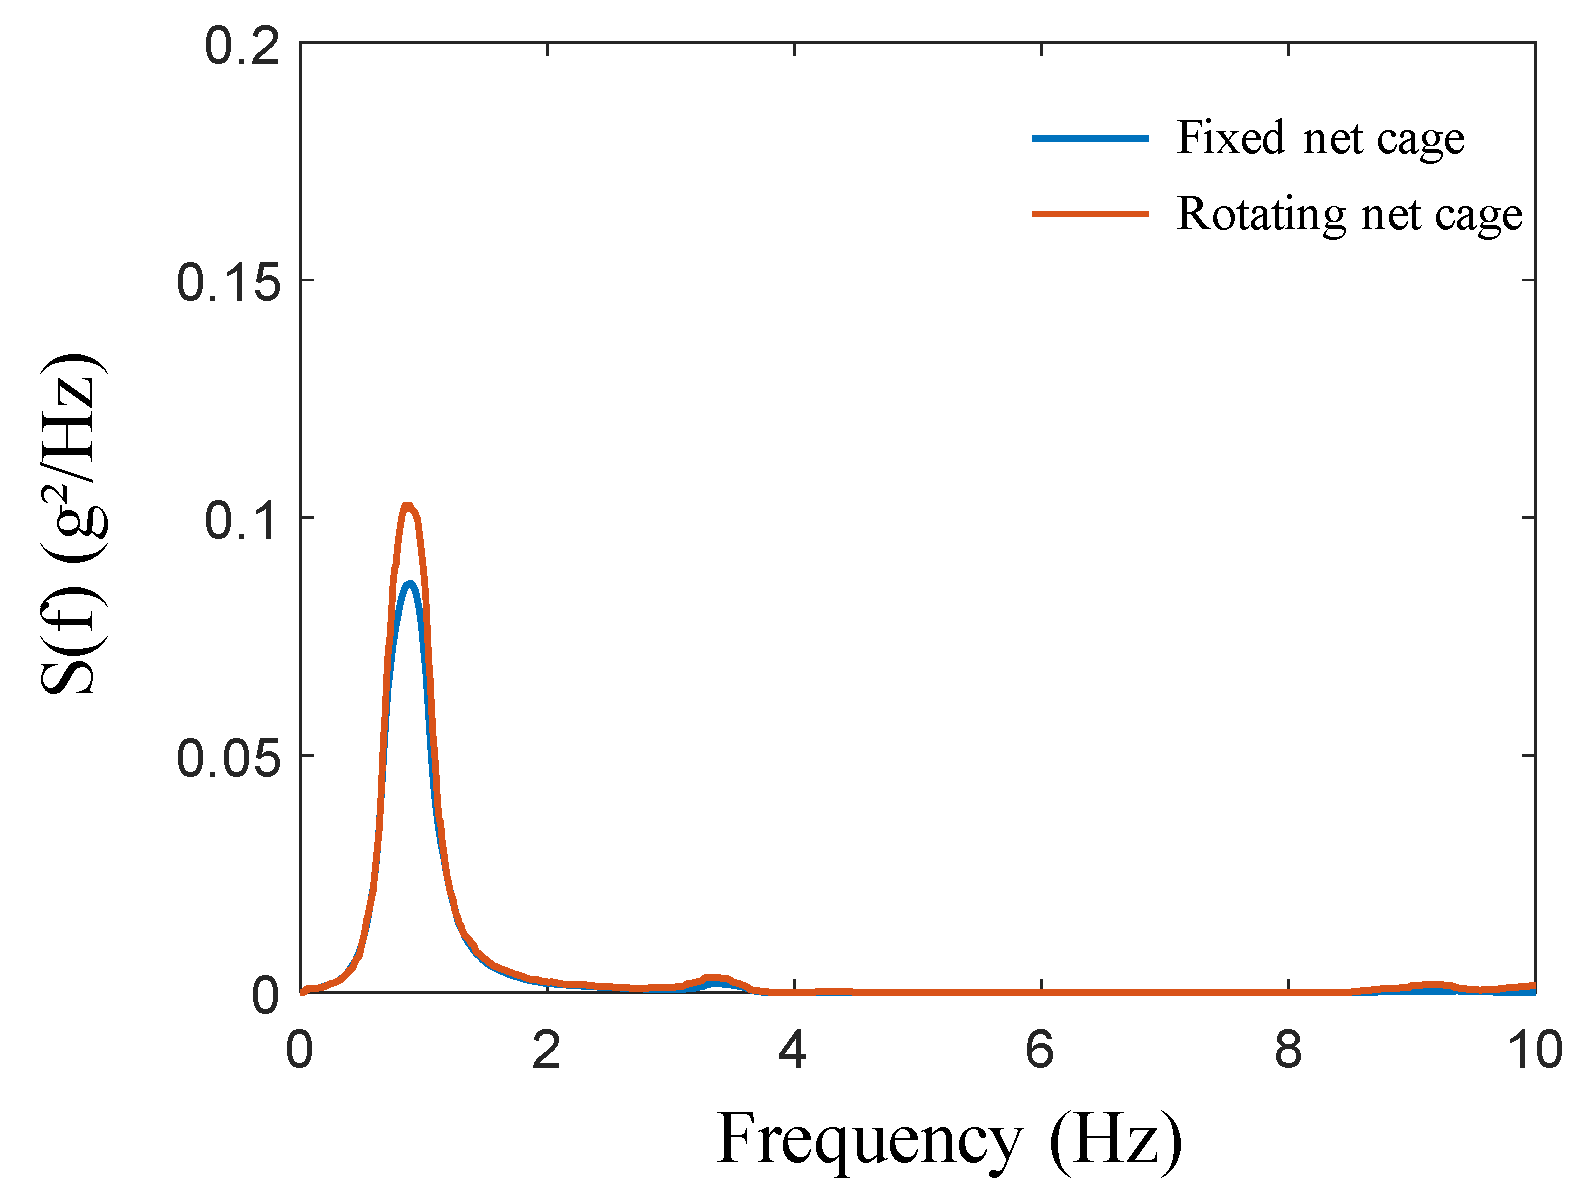
Under the two conditions, the acceleration of J24 is transformed using a Fourier transform, and the shape of the curve is basically the same. The frequency corresponding to the peak value is about 0.7 Hz. However, when the cage is rotated, the peak value of the acceleration spectrum curve increases by 25% compared to when the cage is fixed (Figure 28).
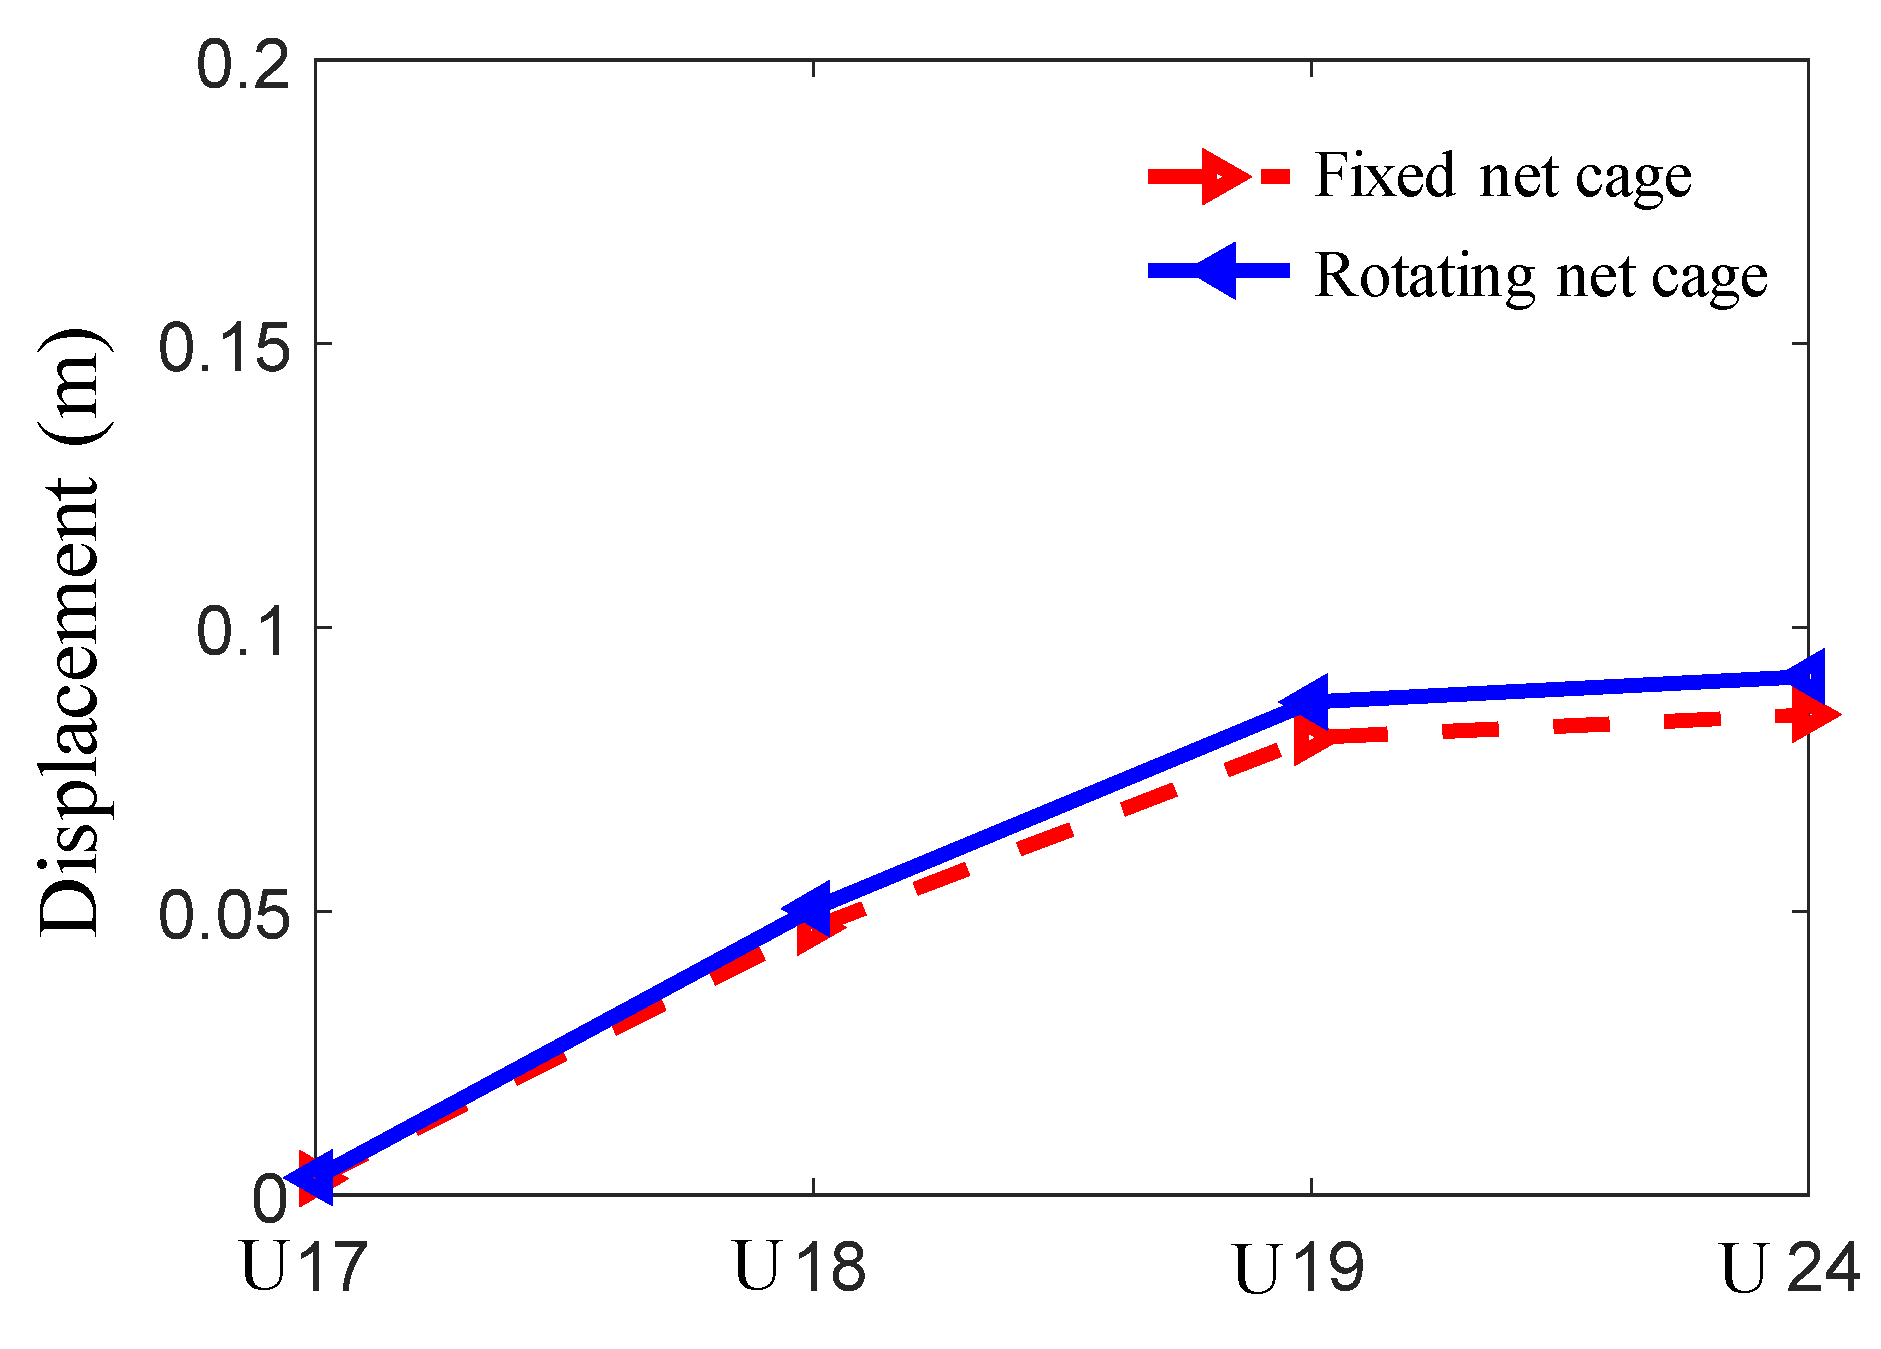
Whether the cage is fixed or the cage is rotated, the displacement increases gradually from the end to the middle of the cage. The difference in displacement response is small between the two conditions (Figure 29). The structural frame is made of steel, and the weight of nets cannot be ignored. Therefore, the weight of the structure is very large. In addition, when the cage rotates in water, the water resistance is also significant. Thus, values of displacement at measuring points change indistinctively compared with those without rotation.
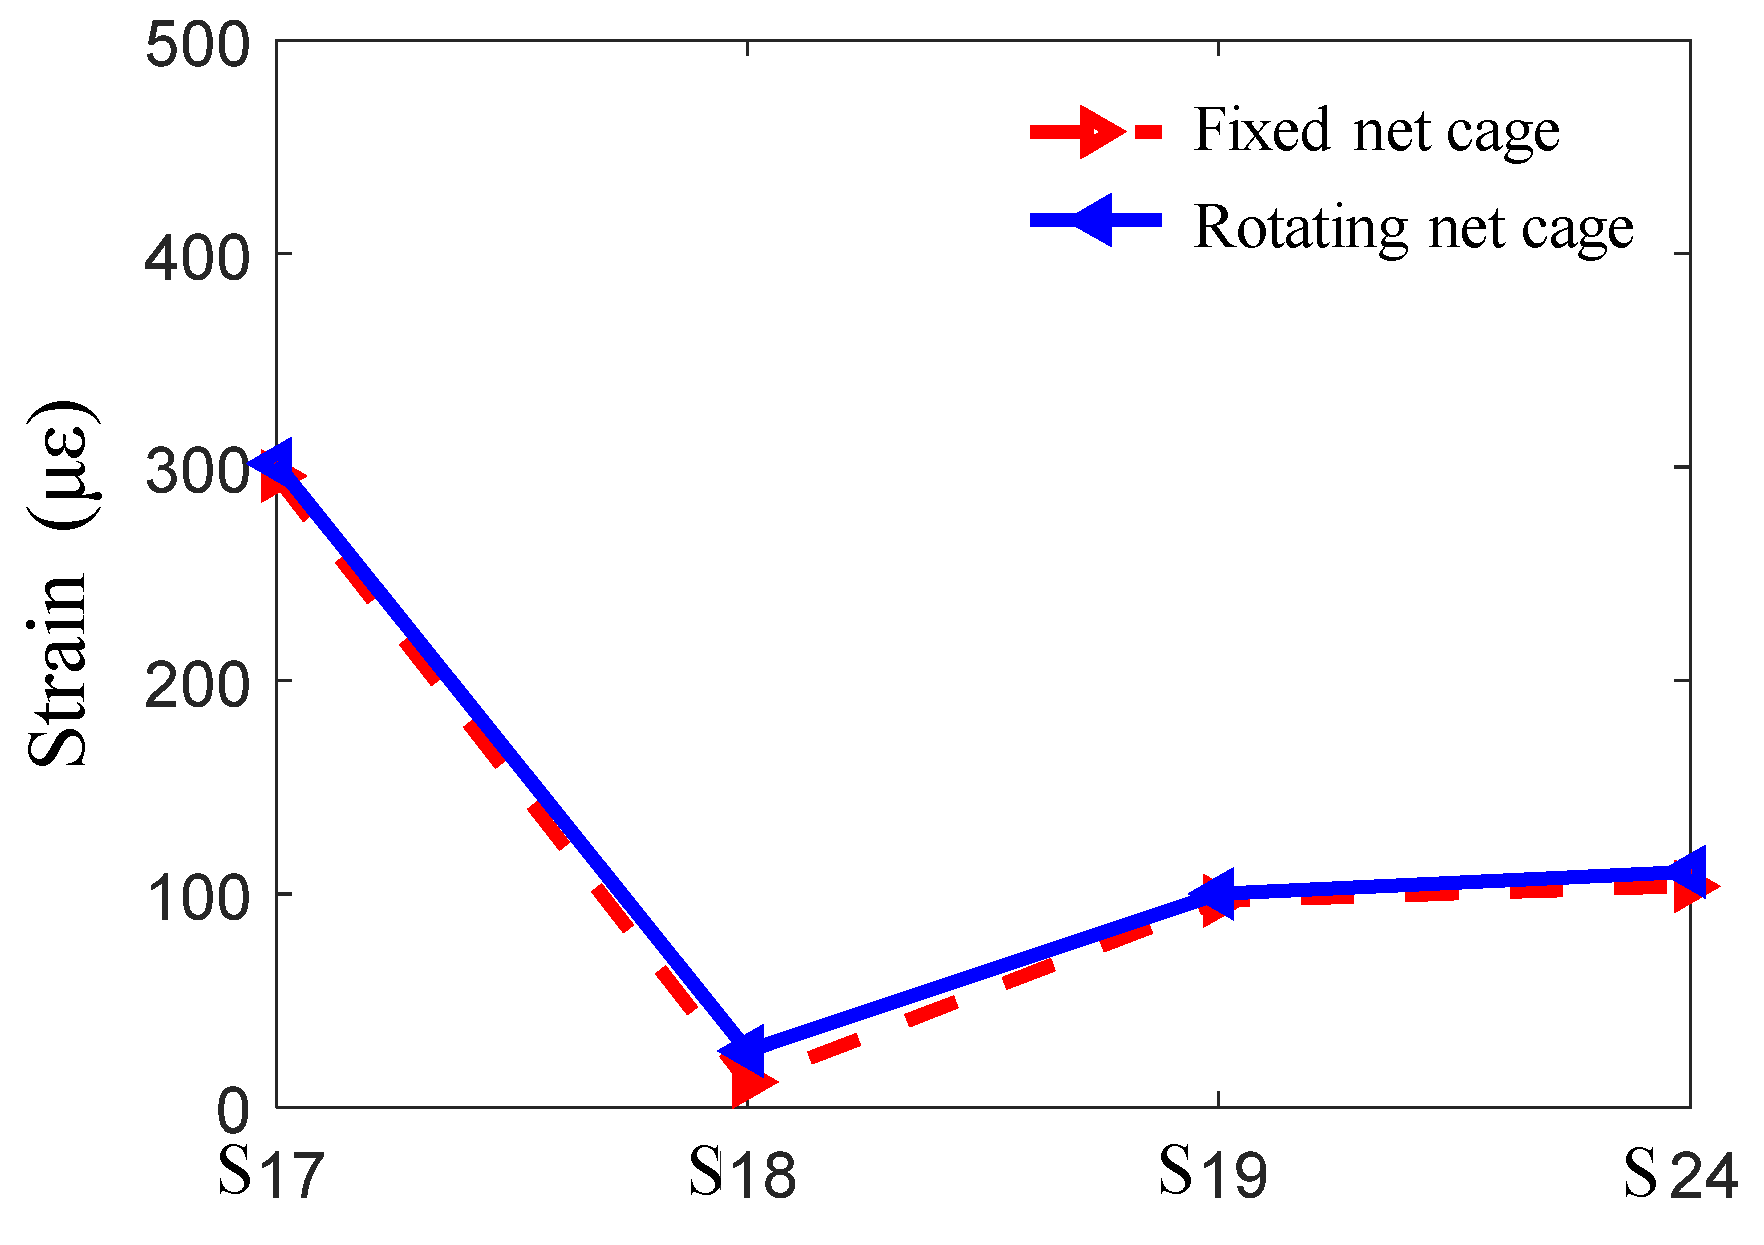
Whether the cage is rotated or fixed, the strain response peak value at the measuring point from the end of the cage to the middle decreases at first and then increases, and the strain response peak value is the minimum at measurement point S18. The strain response peak value of each position when the cage is rotating is slightly larger than that when the cage is fixed (Figure 30).
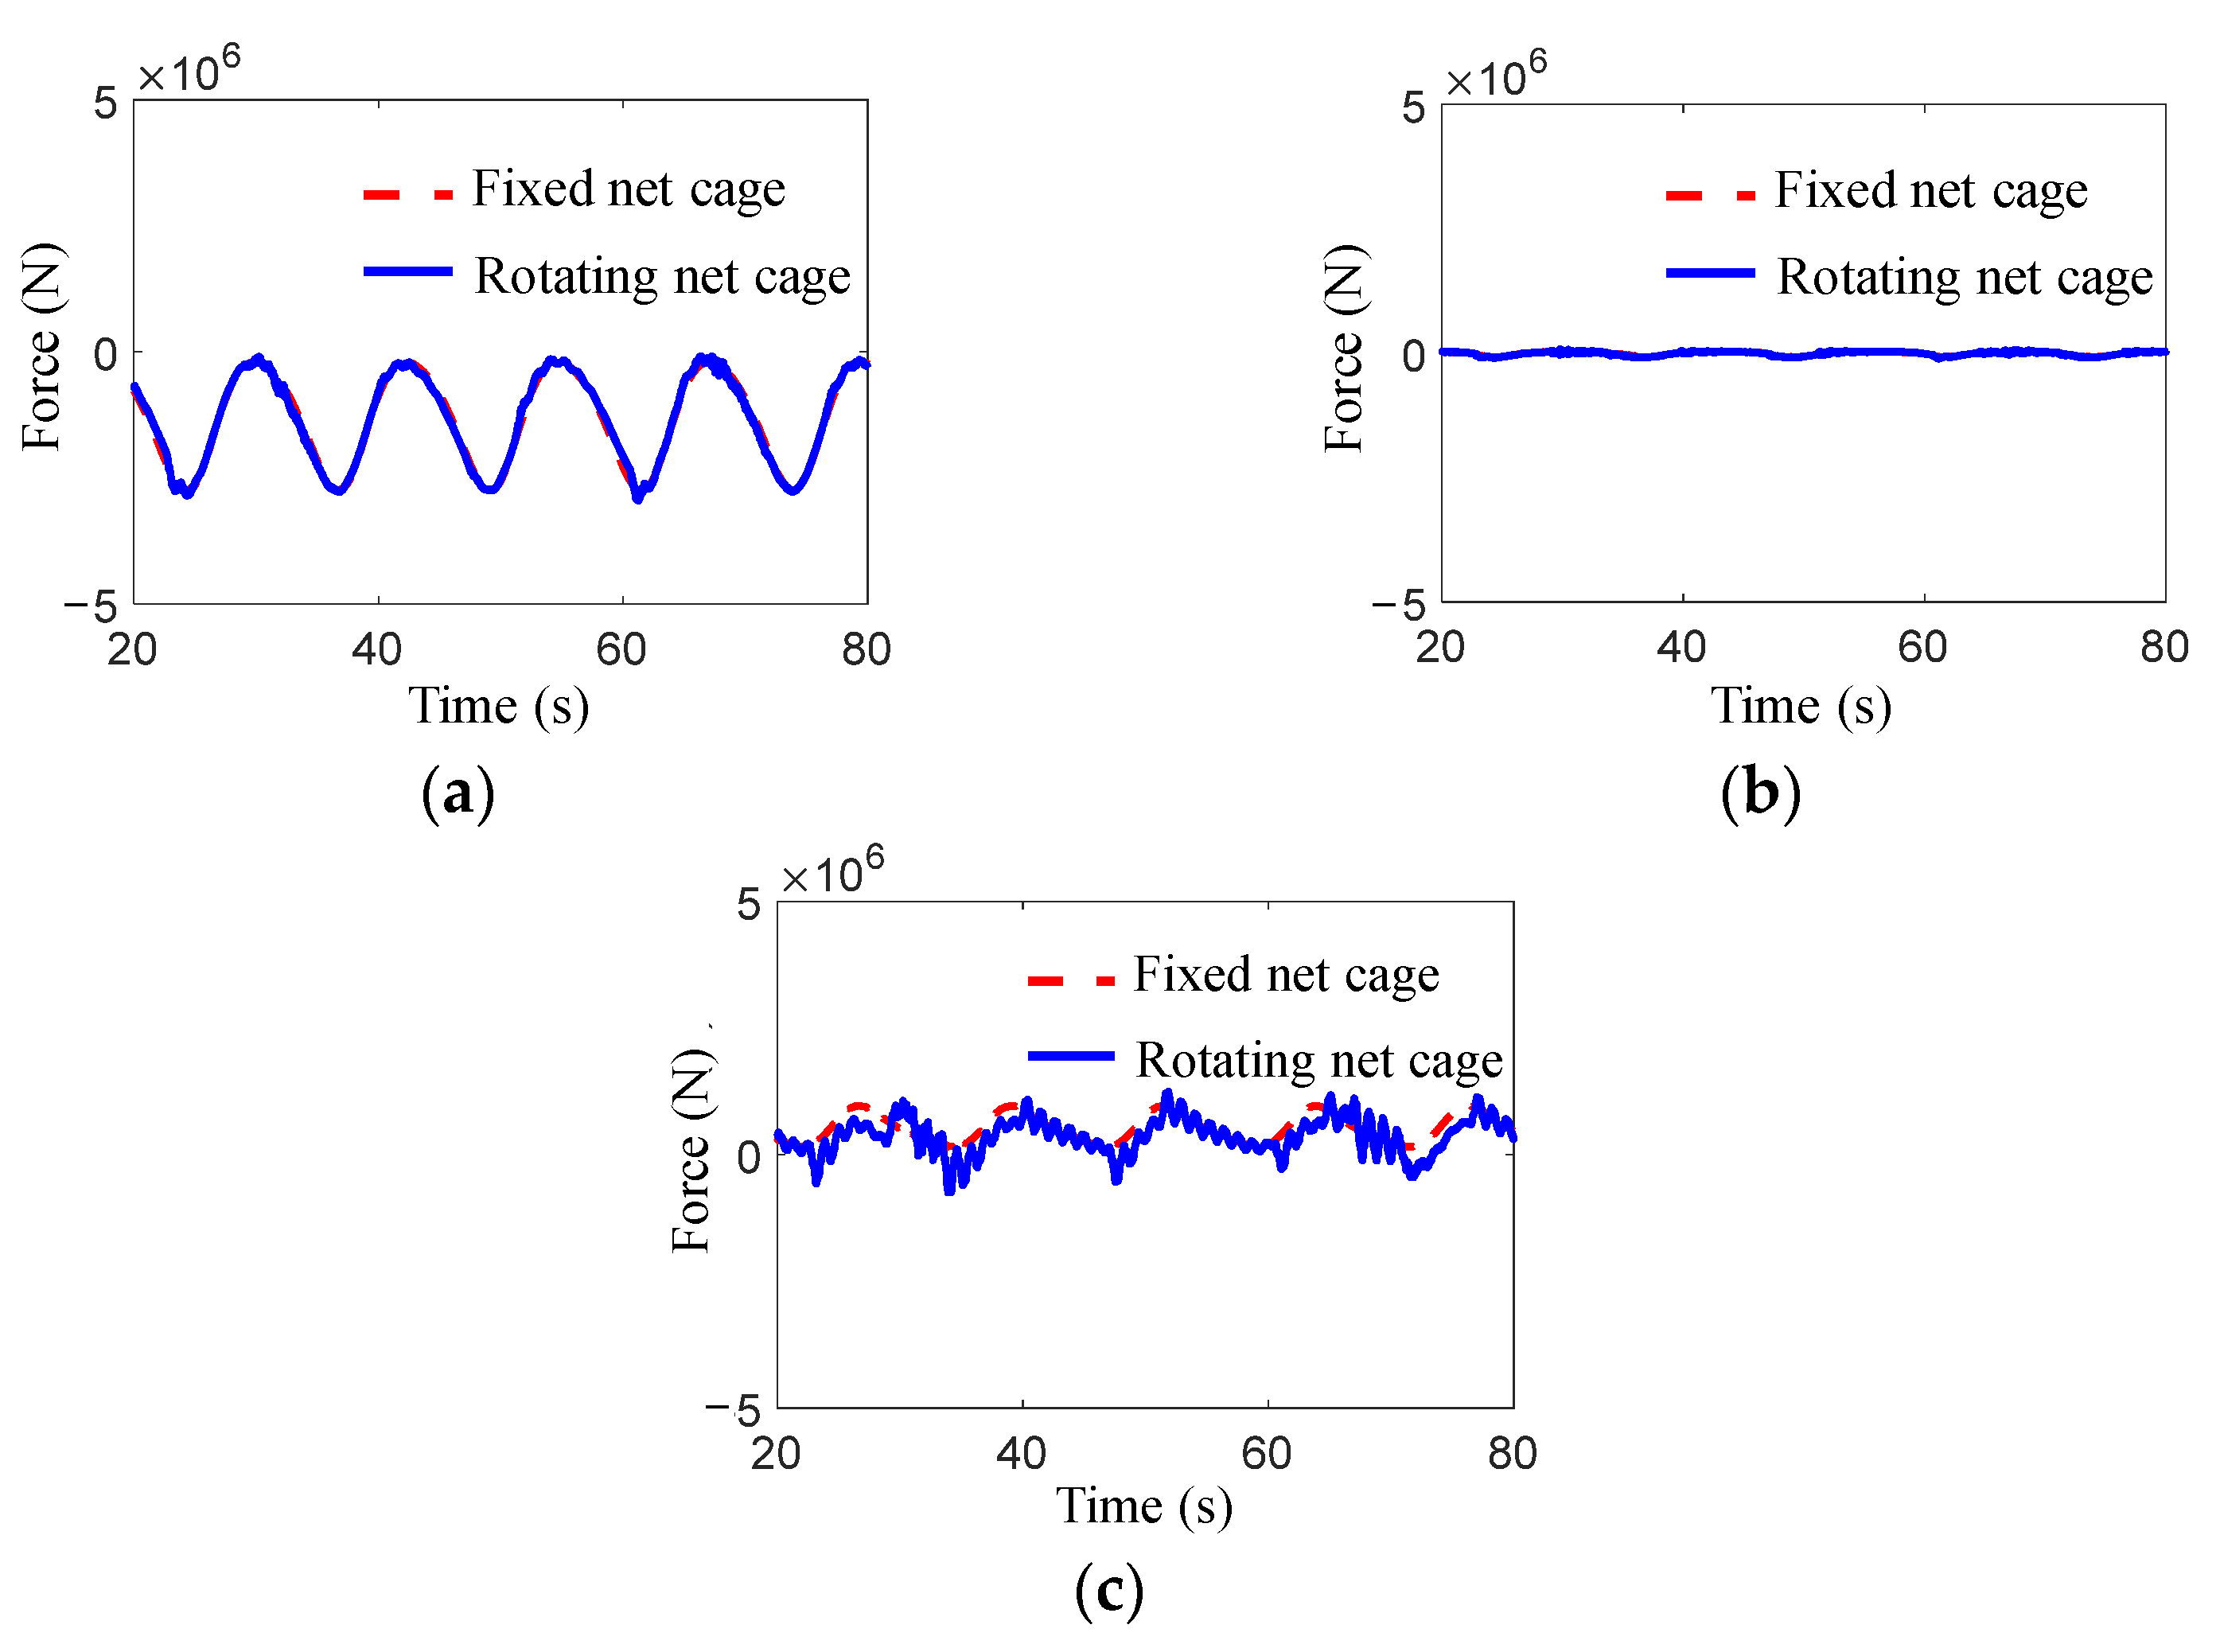
The forces acting on the cage when the cage rotated were compared with those when the cage was fixed (Figure 31). The rotation of the cage has a tiny influence on the force.
The biofouling on nets often jams the mesh and has many adverse effects on the cultured fish and the safety of facilities. It is recommended to pay attention to regular monitoring of biofouling and ensure timely cleaning to avoid extremely unfavorable conditions for aquaculture production. In addition, materials with antifouling properties should be preferred for nets. For the main structure, antifouling treatment should be carried out to ensure the safety of the cage. Due to the diversity of biofouling in the ocean, any antifouling measures are unlikely to completely eliminate the phenomenon of biofouling. Cleaning biofouling is still a necessary measure in aquaculture production. Therefore, this study proposes a fixed aquaculture platform with a horizontal cylindrical cage which can rotate the net below the water surface into the air, making cleaning more convenient. It can reduce the costs of cleaning biofouling. In addition, compared with the hydrodynamic response of the cage when it is fixed, we find that rotation of the cage driven by waves and currents does not significantly change the load acting on the structure or structural strain.

6. Conclusions

In this study, a novel fixed aquaculture platform is presented in which the net cage can rotate around the horizontal axis to aid in the cleaning of biofouling. The hydrodynamic characteristics of the aquaculture platform were studied numerically. The finite element model of both the structural frame and net were established. The results of strain, acceleration, and displacement under the combined actions of waves and currents at three typical attack angles were calculated. The effects of attack angle, water level, and cage rotation on the hydrodynamic response were discussed. The main conclusions are summarized as follows:
(1)
The strain, acceleration, and displacement results of the structure increase with the increase in wave height; however, the change with wave period is not obvious. The acceleration of the structure decreases at first and then increases with the decrease in height. Displacement at the net cage decreases with the increase in height. The strain decreases gradually from the ends of the net cage to the middle of the net cage.
(2)
The hydrodynamic response results of the structure are the largest when the attack angle is 0°. Thus, 0° is the most disadvantageous angle to the structure.
(3)
The acceleration of each measuring point of the structure increases with the increase in water depth. The largest value of displacement is mostly distributed in the designed low water level and the designed high water level. For the strain response, most of the peak values decrease with the increase in water level, and the strain is largest at the extremely low water level.
(4)
When the cage rotates, the acceleration of the cage is larger than when the cage is fixed. However, values of displacement, strain, and the force acting on the cage change indistinctively compared with those without rotation.
This fixed aquaculture platform makes it easier to clean biofouling, and the rotation of the cage does not pose a greater challenge to the safety of the structure. Therefore, this type of structure is more favorable and worth popularizing. There are many aspects that can be further studied about this fixed aquaculture platform, such as the influence of the structure’s size and the form of support on the hydrodynamic response of the structure. It is expected to provide a reference for structural design and the formulation of regulatory requirements.

Author Contributions

Conceptualization, C.B.; methodology, K.S. and C.B.; software, S.G.; validation, Z.J.; formal analysis, S.G.; investigation, C.B. and Z.J.; resources, K.S.; data curation, C.B.; writing—original draft preparation, S.G., K.S. and C.B.; writing—review and editing, Z.J. and B.W.; supervision, C.B.; project administration, K.S. and C.B.; funding acquisition, B.W. All authors have read and agreed to the published version of the manuscript.

Funding

This research was funded by the National Natural Science Foundation of China (project nos. 31972843, 52101334, 52071301 and 51939002).

Institutional Review Board Statement

Not applicable.

Informed Consent Statement

Not applicable.

Data Availability Statement

Data will be made available on request.

Acknowledgments

The authors acknowledge technical support from Power China Huadong Engineering Corporation Limited.

Conflicts of Interest

The authors declare no conflict of interest.

References

  1. Fitridge, I.; Dempster, T.; Guenther, J.; de Nys, R. The impact and control of biofouling in marine aquaculture: A review. Biofouling 2012, 28, 649–669. [Google Scholar] [CrossRef] [PubMed]
  2. Bi, C.W.; Chen, Q.P.; Zhao, Y.P.; Su, H.; Wang, X.Y. Experimental investigation on the hydrodynamic performance of plane nets fouled by hydroids in waves. Ocean Eng. 2020, 213, 107839. [Google Scholar] [CrossRef]
  3. Bi, C.W.; Zhao, Y.P.; Dong, G.H.; Wu, Z.M.; Zhang, Y.; Xu, T.J. Drag on and flow through the hydroid-fouled nets in currents. Ocean Eng. 2018, 161, 195–204. [Google Scholar] [CrossRef]
  4. Gansel, L.C.; Plew, D.R.; Endresen, P.C.; Olsen, A.I.; Misimi, E.; Guenther, J.; Jensen, Ø. Drag of clean and fouled net panels—Measurements and parameterization of fouling. PLoS ONE 2015, 10, 0131051. [Google Scholar] [CrossRef]
  5. Pica, D.; Bloecher, N.; Dell’Anno, A.; Bellucci, A.; Pinto, T.; Pola, L.; Puce, S. Dynamics of a biofouling community in finfish aquaculture: A case study from the South Adriatic Sea. Biofouling 2019, 35, 696–709. [Google Scholar] [CrossRef]
  6. Ali, A.M. Dynamic Behavior of Jacket Type Offshore Structure. Jordan J. Civ. Eng. 2012, 6, 418–435. [Google Scholar]
  7. Raheem, S.E.A. Nonlinear behaviour of steel fixed offshore platform under environmental loads. Ships Offshore Struct. 2016, 11, 1–15. [Google Scholar]
  8. Shi, W.; Park, H.; Chung, C.; Baek, J.; Kim, Y.; Kim, C. Load analysis and comparison of different jacket foundations. Renew. Energy 2013, 54, 201–210. [Google Scholar] [CrossRef]
  9. Shi, W.; Park, H.; Han, J.; Na, S.; Kim, C. A study on the effect of different modeling parameters on the dynamic response of a jacket-type offshore wind turbine in the Korean Southwest Sea. Renew. Energy 2013, 58, 50–59. [Google Scholar] [CrossRef]
  10. Terro, M.J.; Abdel-Rohman, M. Wave Induced Forces in Offshore Structures Using Linear and Nonlinear Forms of Morison’s equation. J. Vib. Control 2007, 13, 139–157. [Google Scholar] [CrossRef]
  11. Bi, C.W.; Zhao, Y.P.; Dong, G.H. Experimental study on the effects of farmed fish on the hydrodynamic characteristics of the net cage. Aquaculture 2020, 524, 735239. [Google Scholar] [CrossRef]
  12. Bi, C.W.; Zhao, Y.P.; Dong, G.H.; Zheng, Y.N.; Gui, F.K. A numerical analysis on the hydrodynamic characteristics of net cages using coupled fluid–structure interaction model. Aquac. Eng. 2014, 59, 1–12. [Google Scholar] [CrossRef]
  13. Gansel, L.C.; Rackebrandt, S.; Oppedal, F.; McClimans, T.A. Flow fields inside stocked fish cages and the near environment. J. Offshore Mech. Arct. Eng. 2014, 136, 031201. [Google Scholar] [CrossRef]
  14. Patursson, Ø.; Swift, M.R.; Tsukrov, I.; Simonsen, K.; Baldwin, K.; Fredriksson, D.W.; Celikkol, B. Development of a porous media model with application to flow through and around a net panel. Ocean Eng. 2010, 37, 314–324. [Google Scholar] [CrossRef]
  15. Winthereig-Rasmussen, H.; Simonsen, K.; Patursson, Ø. Flow through fish farming sea cages: Comparing computational fluid dynamics simulations with scaled and full-scale experimental data. Ocean Eng. 2016, 124, 21–31. [Google Scholar] [CrossRef]
  16. Bi, C.W.; Zhao, Y.P.; Dong, G.H.; Cui, Y.; Gui, F.K. Experimental and numerical investigation on the damping effect of net cages in waves. J. Fluids Struct. 2015, 55, 122–138. [Google Scholar] [CrossRef]
  17. Lader, P.F.; Olsen, A.; Jensen, A.; Sveen, J.K.; Fredheim, A.; Enerhaug, B. Experimental investigation of the interaction between waves and net structures—Damping mechanism. Aquac. Eng. 2007, 37, 100–114. [Google Scholar] [CrossRef]
  18. Martin, T.; Tsarau, A.; Bihs, H. A numerical framework for modelling the dynamics of open ocean aquaculture structures in viscous fluids. Appl. Ocean Res. 2021, 106, 102410. [Google Scholar] [CrossRef]
  19. DeCew, J.; Tsukrov, I.; Risso, A.; Swift, M.R.; Celikkol, B. Modeling of dynamic behavior of a single-point moored submersible fish cage under currents. Aquac. Eng. 2010, 43, 38–45. [Google Scholar] [CrossRef]
  20. Dong, G.H.; Xu, T.J.; Zhao, Y.P.; Li, Y.C.; Gui, F.K. Numerical simulation of hydrodynamic behavior of gravity cage in irregular waves. Aquac. Eng. 2010, 42, 90–101. [Google Scholar] [CrossRef]
  21. Huang, C.C.; Tang, H.J.; Liu, J.Y. Dynamical analysis of net cage structures for marine aquaculture: Numerical simulation and model testing. Aquac. Eng. 2006, 35, 258–270. [Google Scholar] [CrossRef]
  22. Kim, T.; Lee, J.; Fredriksson, D.W.; DeCew, J.; Drach, A.; Moon, K. Engineering analysis of a submersible abalone aquaculture cage system for deployment in exposed marine environments. Aquac. Eng. 2014, 63, 72–88. [Google Scholar] [CrossRef]
  23. Lader, P.F.; Enerhaug, B. Experimental investigation of forces and geometry of a net cage in uniform flow. IEEE J. Ocean Eng. 2005, 30, 79–84. [Google Scholar] [CrossRef]
  24. Liu, H.F.; Bi, C.W.; Zhao, Y.P. Experimental and numerical study of the hydrodynamic characteristics of a semisubmersible aquaculture facility in waves. Ocean Eng. 2020, 214, 107714. [Google Scholar] [CrossRef]
  25. Tsukrov, I.; Drach, A.; DeCew, J.; Swift, M.R.; Celikkol, B. Characterization of geometry and normal drag coefficients of copper nets. Ocean Eng. 2011, 38, 1979–1988. [Google Scholar] [CrossRef]
  26. Zhao, Y.P.; Li, Y.C.; Dong, G.H.; Gui, F.K.; Teng, B. A numerical study on dynamic properties of the gravity cage in combined wave-current flow. Ocean Eng. 2007, 34, 2350–2363. [Google Scholar] [CrossRef]
  27. Zhao, Y.P.; Chen, Q.P.; Bi, C.W.; Cui, Y. Experimental investigation on hydrodynamic coefficients of a column-stabilized fish cage in waves. J. Mar. Sci. Eng. 2019, 7, 418. [Google Scholar] [CrossRef] [Green Version]
  28. Zhao, Y.P.; Bi, C.W.; Chen, Q.P. Numerical investigation of nonlinear wave loads on a trestle-netting enclosure aquaculture facility. Ocean Eng. 2022, 257, 111610. [Google Scholar] [CrossRef]
  29. Morison, J.R.; Johnson, J.W.; Schaaf, S.A. The force exerted by surface waves on piles. J. Pet. Technol. 1950, 2, 149–154. [Google Scholar] [CrossRef]
  30. Wilson, J.F. Dynamics of offshore Structures; John Wiley & Sons, Inc.: New York, NY, USA, 1984. [Google Scholar]
  31. Chakrabarti, S.K. Hydrodynamics of Offshore Structures; Computational Mechanics Publications: Southampton, UK; SpringerVerlag: Heidelberg, Germany, 1987. [Google Scholar]
  32. Fenton, J.D. A Fifth-Order Stokes Theory for Steady Waves. J. Waterw. Port Coast. Ocean Eng. 1985, 111, 216–234. [Google Scholar] [CrossRef] [Green Version]
  33. Zhao, S.X.; Bi, C.W.; Zhang, D.L.; Yu, H.F. Hydrodynamic response analysis of a 10,000-ton offshore electrical platform in waves using a modified finite element model. Ocean Eng. 2021, 233, 109194. [Google Scholar] [CrossRef]
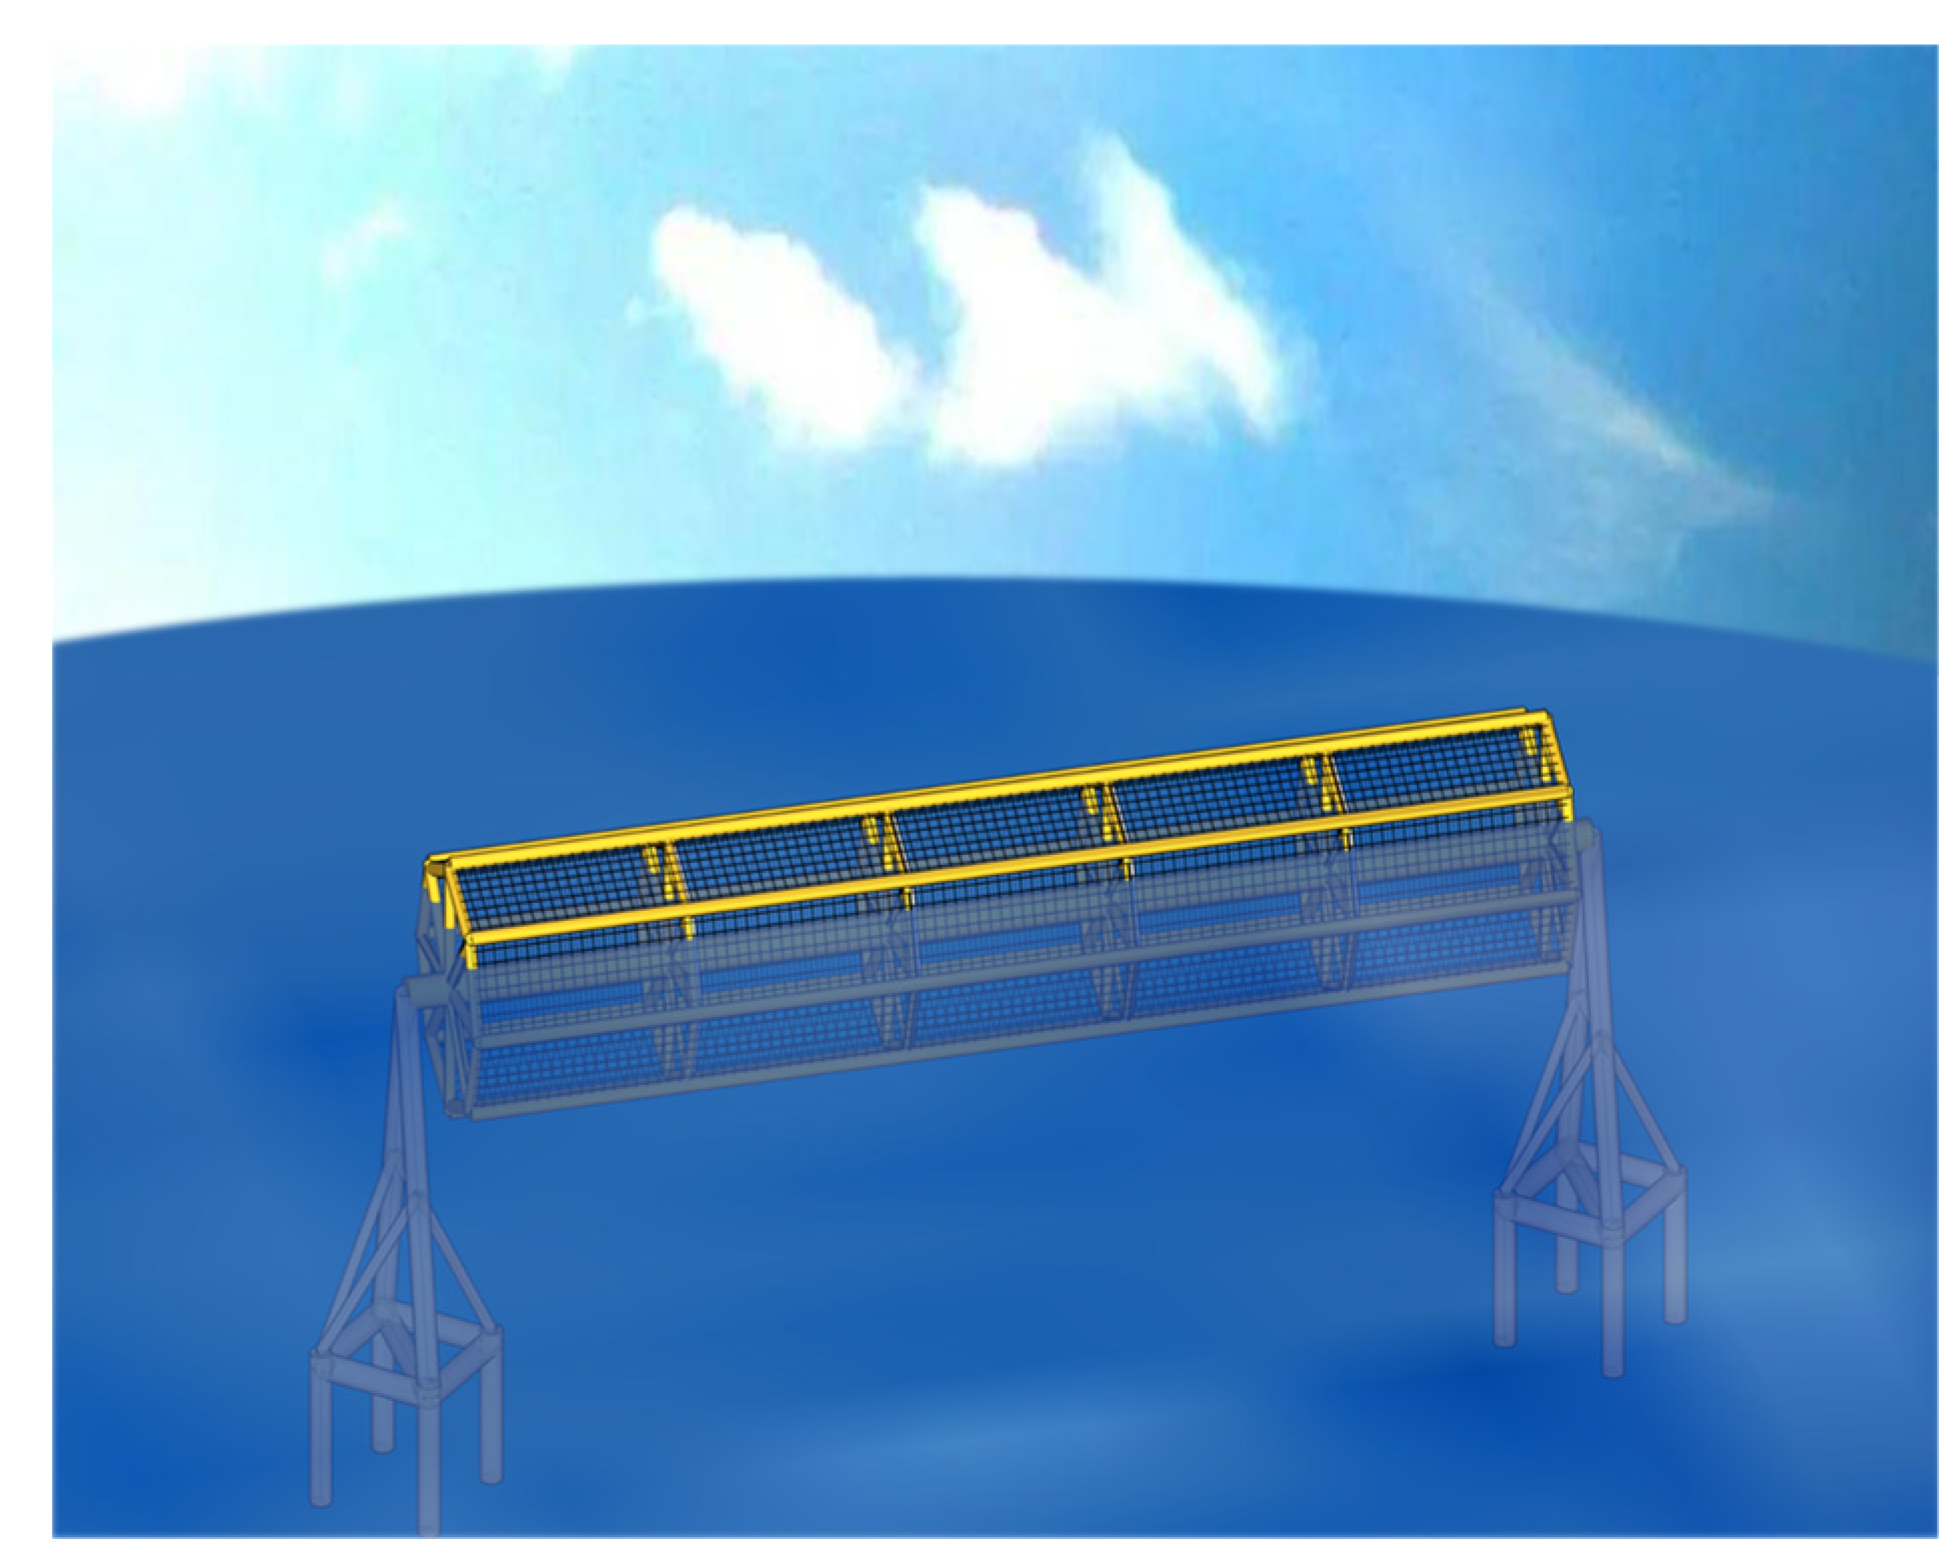
Figure 1. Sketch of the fixed aquaculture platform with a horizontal cylindrical cage.
Jmse 11 01413 g001
Figure 2. Three-view drawing of the fixed aquaculture platform. (a). Main view. (b). Lateral view. (c). Top view.
Jmse 11 01413 g002
Figure 3. Finite element model of the fixed aquaculture platform with a horizontal cylindrical cage.
Jmse 11 01413 g003
Figure 4. Experimental diagram of the monopile net cage and the numerical model. (a). The experimental diagram. (b). The numerical model.
Jmse 11 01413 g004
Figure 5. The force acting on the model under current load.
Jmse 11 01413 g005
Figure 6. The force acting on the model under wave load.
Jmse 11 01413 g006
Figure 7. The measuring points of strain, acceleration, and displacement.
Jmse 11 01413 g007
Figure 8. Strain curves with different wave heights (T = 12.4 s). (a). Strain curve of S1. (b). Strain curve of S3. (c). Strain curve of S13. (d). Strain curve of S15.
Jmse 11 01413 g008
Figure 9. Strain curves with different wave periods (H = 3m). (a). Strain curve of S1. (b). Strain curve of S3. (c). Strain curve of S13. (d). Strain curve of S15.
Jmse 11 01413 g009
Figure 10. Strain peak of measuring points S1, S2, and S3 with a 0° attack angle. (a). The peak value varies with wave height. (b). The peak value varies with wave period.
Jmse 11 01413 g010
Figure 11. Time history curves of strain for the measuring points (H = 3 m, T = 12.4 s). (a). S1, S2, and S3. (b). S13, S14, and S15.
Jmse 11 01413 g011
Figure 12. Comparison of strain at different attack angles (H = 3 m, T = 12.4 s). (a). Comparison of strain curves at S1, S2, and S3 at attack angles of 45° (left) and 90° (right). (b). Comparison of strain curves at S13, S14, and S15 at attack angles of 45° (left) and 90° (right).
Jmse 11 01413 g012
Figure 13. Time history curves of acceleration at J1, J4, J7, J10, and J13 (H = 3 m, T = 12.4 s).
Jmse 11 01413 g013
Figure 14. Comparison of peak acceleration at measuring points J1, J2, and J3. (a). Peak acceleration when T = 12.4 s. (b). Peak acceleration when H = 3 m.
Jmse 11 01413 g014
Figure 15. Comparison of acceleration frequency domain responses at J1, J3, J13, and J15. (a). Measuring points J1 and J3. (b). Measuring points J13 and J15.
Jmse 11 01413 g015
Figure 16. Time history curves of acceleration for J1 and J3 at different attack angles (H = 3 m, T = 12.4 s). (a). Comparison of time history curves for J1 at attack angles of 45° (left) and 90° (right). (b). Comparison of time history curves for J3 at attack angles of 45° (left) and 90° (right).
Jmse 11 01413 g016
Figure 17. Comparison of displacement time history curves. (a). Measuring points U1, U13, and U17. (b). Measuring points U16, U20, and U21.
Jmse 11 01413 g017
Figure 18. Comparison of peak displacement values with different wave periods and wave heights. (a). H = 3 m. (b). T = 12.4 s.
Jmse 11 01413 g018
Figure 19. Curves of displacement for U1 and U3 under different attack angles (H = 3 m, T = 12.4 s). (a). Comparison of time history curves of U1 at attack angles of 45° (left) and 90° (right). (b). Comparison of time history curves of U3 at attack angles of 45° (left) and 90° (right).
Jmse 11 01413 g019
Figure 20. Displacement peak curves of measuring points under different attack angles. (a). U1, U2, and U3. (b). U13, U14, and U15. (c). U13, U14, and U15.
Jmse 11 01413 g020
Figure 21. Acceleration peak curves of measuring points under different attack angles. (a). Measuring points J1, J4, J7, J10, and J13. (b). Measuring points J3, J6, J9, J12, and J15. (c). Measuring points J16, J17, J18, and J19. (d). Measuring points J16, J20, and J21.
Jmse 11 01413 g021
Figure 22. Strain peak curves of measuring points under different attack angles. (a). Measuring points S1, S4, S7, S10, and S13. (b). Measuring points S3, S6, S9, S12, and S15. (c). Measuring points S13, S14, and S15. (d). Measuring points S16, S17, S18, S19, and S24.
Jmse 11 01413 g022
Figure 23. Comparison curves of peak acceleration at different water levels. (a). Measuring points J3, J6, J9, J12, and J15. (b). Measuring points J16, J17, J18, J19, and J24.
Jmse 11 01413 g023
Figure 24. Frequency spectrum curves for J16.
Jmse 11 01413 g024
Figure 25. Comparison curves of peak displacement in relation to height under different water levels. (a). Measuring points U1, U4, U7, U10, and U13. (b). Measuring points U3, U6, U9, U12, and U15.
Jmse 11 01413 g025
Figure 26. Comparison curves of peak strain response in relation to longitudinal measuring points. (a). Measuring points S1, S2, and S3. (b). Measuring points S7, S8, and S9. (c). Measuring points S13, S14, and S15. (d). Measuring points S16, S17, S18, S19, and S24.
Jmse 11 01413 g026
Figure 27. Comparison curve of peak acceleration response.
Jmse 11 01413 g027
Figure 28. Acceleration frequency domain curve.
Jmse 11 01413 g028
Figure 29. Comparison of peak displacement response between rotatable and fixed net cages.
Jmse 11 01413 g029
Figure 30. Comparison curve of peak strain response.
Jmse 11 01413 g030
Figure 31. Comparison of force curves acting on the cage. (a). The force component along the X direction. (b). The force component along the Y direction. (c). The force component along the Z direction.
Jmse 11 01413 g031
Table 1. Size of the model structure.
ComponentLength
(m)
Outside Diameter (m)Inner Diameter (m)Quantity
Pipe_11221.98
Pipe_21082.52.381
Pipe_310010.948
Pipe_47.6710.9448
Pipe_51010.9448
Pipe_63021.94
Pipe_716.8910.948
Pipe_81121.98
Table 2. Marine environmental load conditions.
Case
No.
Wave Height
H (m)
Wave Period
T (s)
Velocity
(m/s)
Attack Angle β (°)
A139.3Upper velocity 1.93 m/s
Middle velocity 1.47 m/s
Bottom velocity 0.96 m/s
0
A2310.80
A3312.40
A4612.40
A5912.40
A6312.445
A7312.490
Table 3. Different water levels.
Water Level No.Water LevelValue (m)
AExtremely high water level41.73
BDesigned high water level39.04
CNormal water level33.64
DDesigned low water level30.14
EExtremely low water level28.52
Disclaimer/Publisher’s Note: The statements, opinions and data contained in all publications are solely those of the individual author(s) and contributor(s) and not of MDPI and/or the editor(s). MDPI and/or the editor(s) disclaim responsibility for any injury to people or property resulting from any ideas, methods, instructions or products referred to in the content.