Article

Numerical Investigation on Cavitation Vortex Dynamics of a Centrifugal Pump Based on Vorticity Transport Method

1
Research Center of Fluid Machinery Engineering and Technology, Jiangsu University, Zhenjiang 212013, China
2
Jiangsu Province Engineering Research Center of High-Level Energy and Power Equipment, Changzhou University, Changzhou 213164, China
*
Author to whom correspondence should be addressed.
J. Mar. Sci. Eng. 2023, 11(7), 1424; https://doi.org/10.3390/jmse11071424
Submission received: 20 June 2023 / Revised: 8 July 2023 / Accepted: 9 July 2023 / Published: 15 July 2023
(This article belongs to the Special Issue CFD Simulation of Floating Offshore Structures)

Abstract

:
Cavitation is one of the most important aspects of the stable and safe operation of a centrifugal pump. To examine the dynamics of cavitation vortex in a centrifugal pump, the cavitating flow is investigated by using the modified shear stress transport (SST) k-ω turbulence model with the Zwart cavitation model. The numerical results are confirmed by comparing them with those obtained from experimental tests. The results show that there is a critical cavitation number of σc at each flow rate condition. As the cavitation number σ exceeds σc, the pump head remains stable. Conversely, the head rapidly decreases when the σ falls below σc. As the σ decreases, the pump experiences successively incipient cavitation, slight cavitation, and severe cavitation. At the stage of severe cavitation conditions, the vortex structures are generated at the tail of cavitation in the flow passage. The vorticity transport method is employed to analyze the vortex dynamics, and it is found that the vortex area contains high vorticity. The dominant contribution to the generation of vorticity comes from the vortex stretching and dilation terms acting in different directions. The contribution of the baroclinic torque to vorticity generation at the vapor-liquid interface is significant. The Coriolis force has a negligible impact on vorticity transport.

1. Introduction

The centrifugal pump is widely utilized in diverse fields such as agricultural irrigation, water supply, the petrochemical industry, aerospace, and more [1]. With the development of industrial progress, high efficiency, stability, and low noise have become crucial indicators for evaluating the performance of a centrifugal pump [2,3]. Cavitation is an important factor influencing the operating stability and efficiency of centrifugal pumps [4,5,6]. When the pressure at a particular location falls below the saturated vapor pressure, rapid expansion of the cavitation nucleus occurs within the fluid, leading to the formation of cavitation bubbles. The presence of cavitation bubbles, along with their formation, growth, and eventual collapse, leads to the disorder of the flow field within the centrifugal pump and induces the occurrence of cavitation vortex [7,8].
In the early studies, scholars mainly observed cavitation using experimental methods. In their study, Jens et al. [9] conducted experimental investigations on rotating cavitation in two comparable impellers of a centrifugal pump with low-specific speeds using high-speed imaging techniques. Their findings suggested that the main cause of cavitation instability is the interaction between the region of cavity closure and the subsequent blade. Bachert et al. [10] conducted a study to examine the transient influences of cavitation in the volute tongue of a centrifugal pump. They employed a combination of particle image velocimetry (PIV) and fluorescent particles specially designed to investigate the phenomenon. Kumaraswamy et al. [11] studied an experimental investigation to examine the impact of various vane tip shapes on cavitation in a radial flow pump. The study revealed that there was an increase in efficiency of up to 7.5% at the highest efficiency operating point as the vane tip shape became rounder.
Capturing the microscopic characteristics of cavitation bubbles within the flow field poses significant challenges due to limitations in the available experimental equipment. Computational Fluid Dynamics (CFD) has emerged as a dependable and reliable tool for conducting comprehensive investigations into the intricate aspects of cavitating flow phenomena in hydraulic machinery, as supported by previous studies [12,13,14,15,16]. Wang et al. [17] investigated the flow field on cavitation in a centrifugal pump, utilizing the standard k-ω turbulence model. Their investigation successfully predicted the vibration and noise resulting from cavitation. In their research, Liu et al. [18] conducted a comparative analysis of various cavitation models for simulating cavitating flow in a centrifugal pump. Their findings demonstrated that the Kunz model exhibited higher prediction accuracy compared to the other two cavitation models across different operating conditions. Tan et al. [19] utilized a modified RNG k-ω turbulence model to numerically analyze the cavitation of a centrifugal pump, specifically at low flow rates. Their results indicated that the proposed method was well suited for accurately simulating cavitation flow under off-design conditions. Li [20] performed a comprehensive analysis of the unsteady behavior of cavitating flow near the leading edge of centrifugal pump blades. Their study aimed to provide a detailed understanding of how impeller inlet parameters influence cavitation, particularly under off-design operating conditions. Tao et al. [21] investigated the impact of various leading-edge shapes of blades on cavitation in centrifugal pumps using the SST k-ω turbulence model. Their analysis focused on understanding how different blade configurations affect cavitation phenomena. Fu et al. [22] investigated the cavitation and flow instability of centrifugal pumps at low flow rates. Their findings indicated that the internal flow displayed an irregular low-frequency oscillation because of its unstable behavior. Furthermore, a significant correlation was observed between the low-frequency pressure fluctuations and the flow instabilities induced by cavitation under low flow rate conditions.
The occurrence of cavitation in pumps leads to the formation of vortices and fluctuations in pressure, which cause operational instability. Previous investigations had predominantly concentrated on the analysis of performance deterioration and structural attributes of cavitating flow. Tsujimoto et al. [23,24] noted that the turbulent characteristics of the flow field were affected by unstable cavitation. The vortex was generated by cavitation in the flow passage. Consequently, these results induced a fluctuation or reduction in pump performance. Zhang et al. [25] analyzed the unsteady cavitation cloud formed by the tip leakage vortex in an axial flow pump model. Their study employed a modified SST k-ω turbulence model along with the homogeneous cavitation model to investigate the phenomenon. Huang et al. [26] numerically studied the mechanism of interaction between cavitation and vortices in a mixed-flow waterjet pump. The numerical findings demonstrated that the progression of cavitation amplifies the generation of vorticity and flow instability.
Therefore, it is valuable to explore the dynamics of cavitation vortices to gain a deeper understanding of the interaction between cavitation vortices and vorticity evolution in cavitation within a centrifugal pump. This objective is to investigate cavitation vortex dynamics by analyzing unsteady cavitating flow in a centrifugal pump. The performance curves of simulations are compared with experimental data to validate the modified shear stress transport (SST) k-ω turbulence model. Based on the vorticity transport method, the cavitation vortex dynamics are analyzed. The generation of vorticity is elucidated by examining the spatial distributions of various vorticity transport terms within the rotating flow field.

2. Numerical Method

2.1. Governing Equations

There is a complex two-phase flow of vapor and liquid in the flow passage. The process of cavitation in a pump induces an unstable vapor-liquid interface. The homogeneous assumption was adopted, assuming the same velocity and pressure for both vapor and liquid [27]. Based on the Navier-Stokes equations, the continuity and momentum equations are presented below in Cartesian coordinates as:
ρ m t + x j ( ρ m u j ) = 0
t ( ρ m u i ) + x j ( ρ m u i u j ) = f i p x i + x j [ ( μ m + μ t ) ( u i x j + u j x i 2 3 u k x k δ i j ) ]
where p is the mixture pressure, ui represents the velocity in the i direction, fi is the body force term in the i direction, and i, j, and k represent the respective directions of the Cartesian coordinates. µt is the mixture’s turbulent eddy viscosity. The ρm is the density of the mixture, µm is the viscosity of the mixture, and μt is the turbulent eddy viscosity of the mixture. The values of ρm and µm are respectively defined in relation to the volume fraction as:
ρ m = α l ρ l + α v ρ v
μ m = μ l ρ l + μ v ρ v
where ρl and ρv represent respectively the density of liquid and vapor, αl and αv are respectively the volume fractions of liquid and vapor, and μl and μv are respectively the dynamic viscosities of liquid and vapor.

2.2. Turbulence Model

In this study, the analysis of the two-phase turbulent flow is performed using the SST k-ω turbulence model [28]. The SST k-ω turbulence model takes into account the transmission of turbulent shear force and can accurately predict the flow separation under adverse pressure gradients [29]. The expressions for turbulent kinetic energy and turbulent dissipation rate are given by:
( ρ m k ) t + ( ρ m u j k ) x j = ρ m τ i j u j x j β ρ m k ω + x j [ ( μ m + σ k μ t ) k x j ]
( ρ m ω ) t + ( ρ m u j ω ) x j = ρ m τ i j u j x j ρ m α μ t β ρ m ω 2 + 2 ( 1 F 1 ) ρ m σ ω 2 ω k x i ω x i + x j μ m + σ ω μ t ω x j
The turbulent eddy viscosity of the mixture is shown as follows:
μ t = ρ m k ω 1 max 1 a , S F 2 a 1 ω
where a* is the damping coefficient of turbulent eddy viscosity accounting for the correction of the low-Reynolds-number. a* = 1 in a high-Reynolds-number flow, and a1 = 0.31. S is the strain rate dimension. F2 is an experience coefficient that equals 1.0 for boundary-layer flows and 0 for free shear layers.
In this study, the turbulent eddy viscosity based on the SST k-ω turbulence model is modified by incorporating a mixture density equation proposed by Reboud et al. [30]. The mixture density equation is expressed as follows [25]:
f ρ m = ρ v + ρ m ρ v / ρ l ρ v n · ρ l ρ v
(n = constant and n ≥ 1)
Hence, the modified mixture turbulent eddy viscosity [31] is expressed as follows:
μ t = f ρ m k ω 1 max 1 a * , S F 2 a 1 ω = ρ v + ρ m ρ v / ρ l ρ v n · ρ l ρ v k max 1 a * , S F 2 a 1 ω ω
(n = constant and n ≥ 1)
Coutier-Delgosha et al. [32,33,34] and Dular et al. [35] proposed n = 10. Liu et al. [36] adopted n = 10 in their numerical investigation of the hump characteristic of a pump turbine. For the cavitating flow in the centrifugal pump, n = 10 is employed in this study.

2.3. Zwart Cavitation Model

The cavitation model is employed to depict the evolution of two-phase flow consisting of vapor and liquid. In this study, the Zwart cavitation model is employed to account for the influence of vapor nucleus density on evaporation [27].
The transfer equation of the vapor is presented as:
( α v ρ v ) t + ( α v ρ v u j ) x j = m ˙ + m ˙
The source terms m ˙ + and m ˙ indicate the rates at which evaporation and condensation occur during the phase transition, correspondingly. These terms are derived from the generalized Rayleigh-Plesset equation, can be expressed as follows:
m ˙ + = F e 3 r n u c ( 1 α v ) ρ v R B 2 ( p v p ) 3 ρ l ( p p v )
m ˙ = F c 3 α v ρ v R B 2 ( p p v ) 3 ρ l ( p > p v )
where αv denotes the vapor volume fraction, pv represents the pressure of saturated vapor, Fe and Fc are empirical coefficients associated with the specific phase change processes, RB represents the typical bubble size in water, and rnuc represents the volume fraction of the nucleation site.
The research conducted by Zwart et al. [27] served as the basis for this study, and its findings were validated using three-dimensional cases. For instance, the occurrence of cavitating flow around a three-dimensional hydrofoil, marine propeller, and inducers [37,38,39]. The empirical coefficients are given as Fe = 50, Fc = 0.01, RB = 10−6 m, and rnuc = 5 × 10⁻⁴.

2.4. Pump Model, Mesh, and Boundary Setup

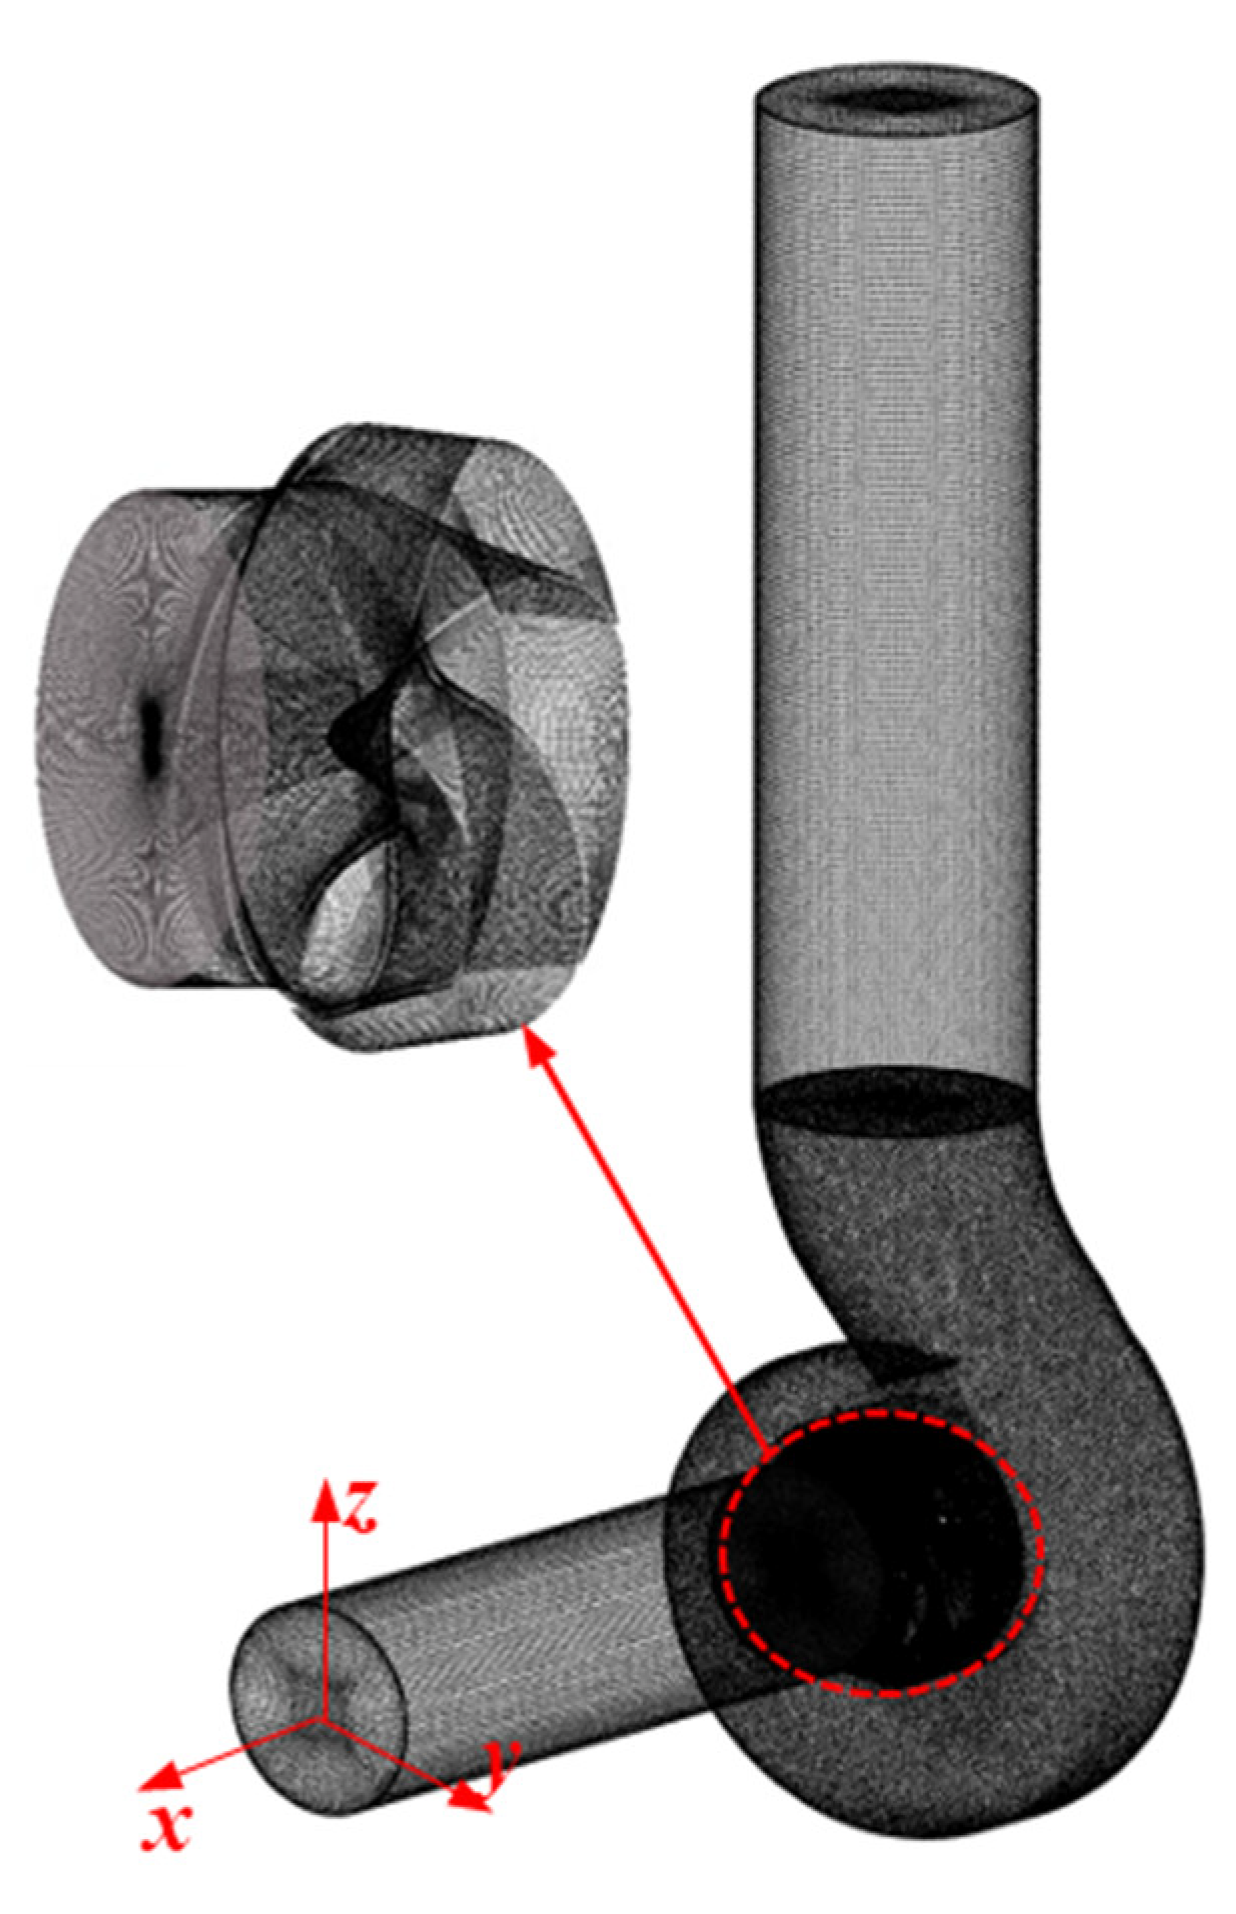
A single-stage, single-suction centrifugal pump model is employed in the present study. Table 1 presents the primary parameters. The specific speed and the rotational speed of the centrifugal pump are 320 and 1480 r/min, respectively. The centrifugal pump in this study is equipped with five impeller blades. The flowrate at the point of maximum efficiency is 550 m3/h, and the head is 12.40 m. The centrifugal pump model, as illustrated in Figure 1, includes the inlet pipe, impeller, pump chamber, volute, and outlet pipe. To minimize the impact of velocity gradients at the inlet and outlet boundaries, suitable extensions have been added to the inlet and outlet sections of the centrifugal pump.
The high-quality generation of mesh plays a crucial role in ensuring the accuracy of numerical simulations, particularly in the complex flow of the impeller and volute. The mesh generation process is performed using the commercial software ICEM 19.2. Figure 2 depicts the structured hexahedral mesh utilized for the entire computational domain. To guarantee the reliability of the numerical results, a grid independence test is conducted by employing four different mesh schemes. The mesh schemes are selected from 2.53 million to 6.95 million nodes to evaluate the impact of mesh density. Table 2 presents the grid-independent results. It has been observed that the head and efficiency of the centrifugal pump become steady when the mesh nodes exceed 5.06 million. The maximum Y plus on the impeller is below 30, which stratifies the near-wall mesh requirements of the automatic wall function of SST in CFX [40]. Therefore, mesh scheme 3 with 5.06 million mesh nodes is selected for numerical simulation under different operating conditions.
The modified equations are implemented using the CFX expression language and integrated into the ANSYS CFX 19.2 software for computational fluid dynamics (CFD) simulations. In the simulation, the impeller region is defined as the rotating domain with a rotational speed of 1480 r/min, while the remaining parts of the domain are defined as the stationary domain. To conduct steady simulations, the interfaces between the rotational and stationary components are defined as frozen rotors. The boundary condition of the inlet pipe is specified as total pressure, while the boundary condition of the outlet is defined as mass flow rate. These boundary conditions are employed to determine the operating conditions of the pump. The different cavitation conditions are obtained by decreasing the inlet pressure. The convection and diffusion terms in the governing equations are solved using high-resolution and central difference schemes, respectively, ensuring accurate and stable numerical computations. The convergence precision is set to 1 × 10⁻⁵.

3. Results and Discussion

3.1. Pump Performance Testing

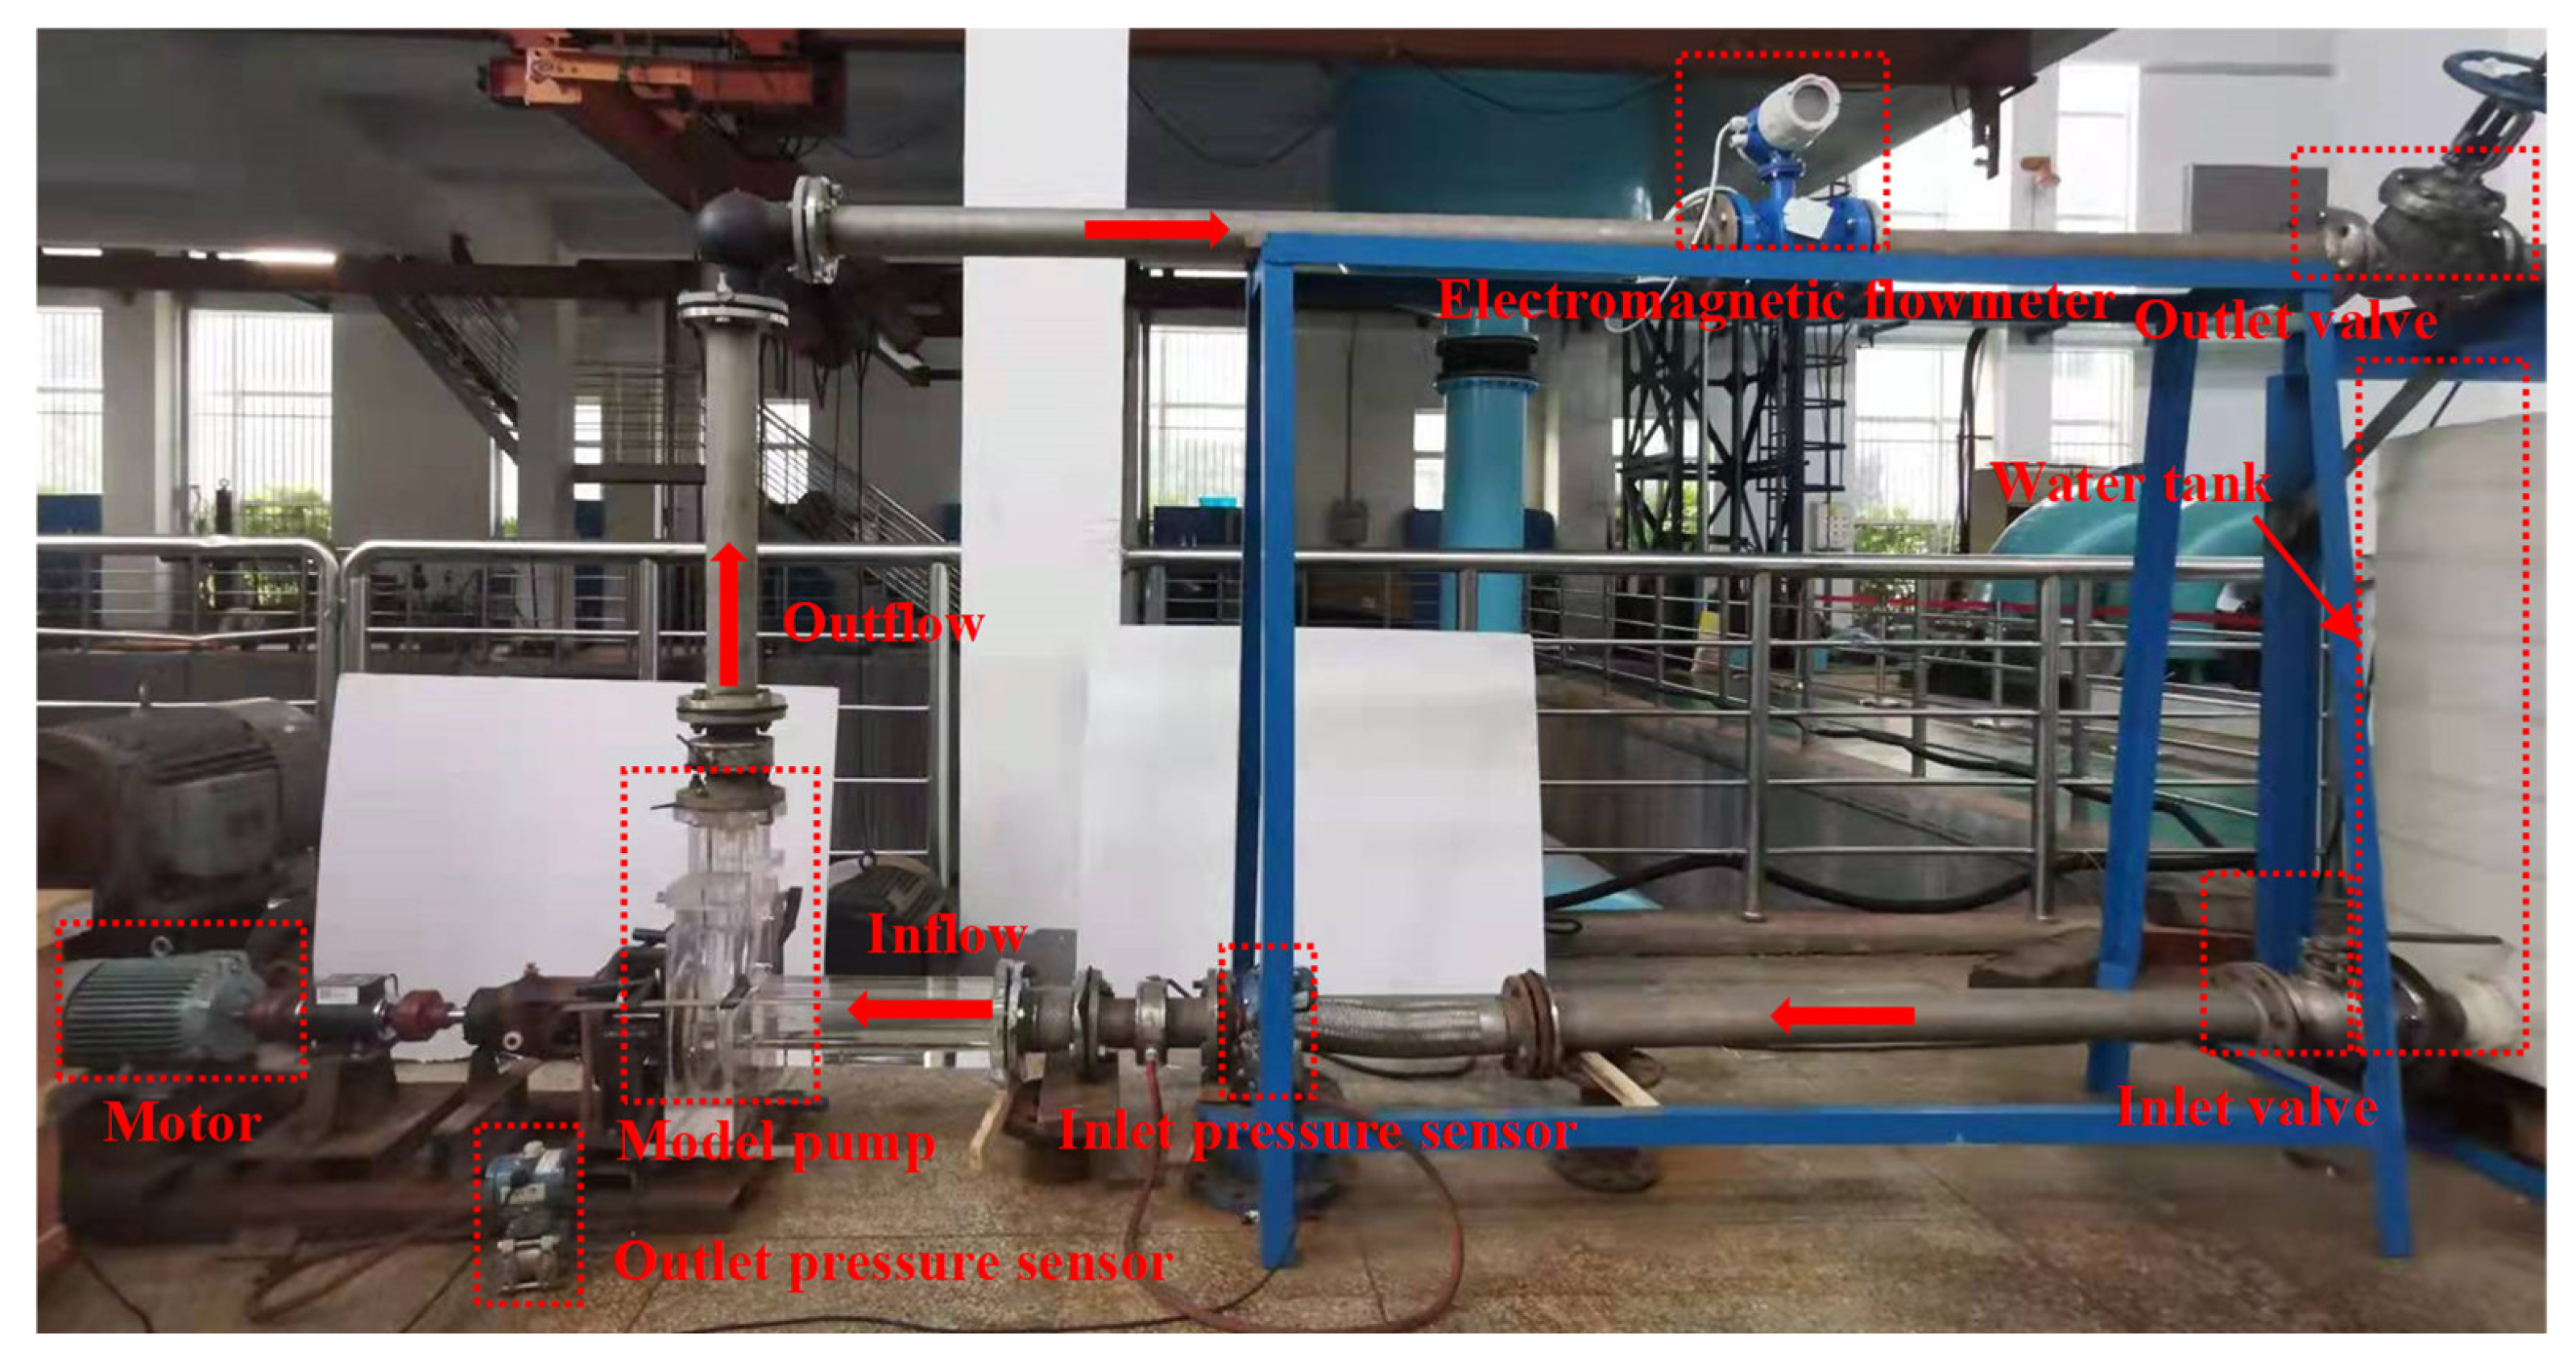
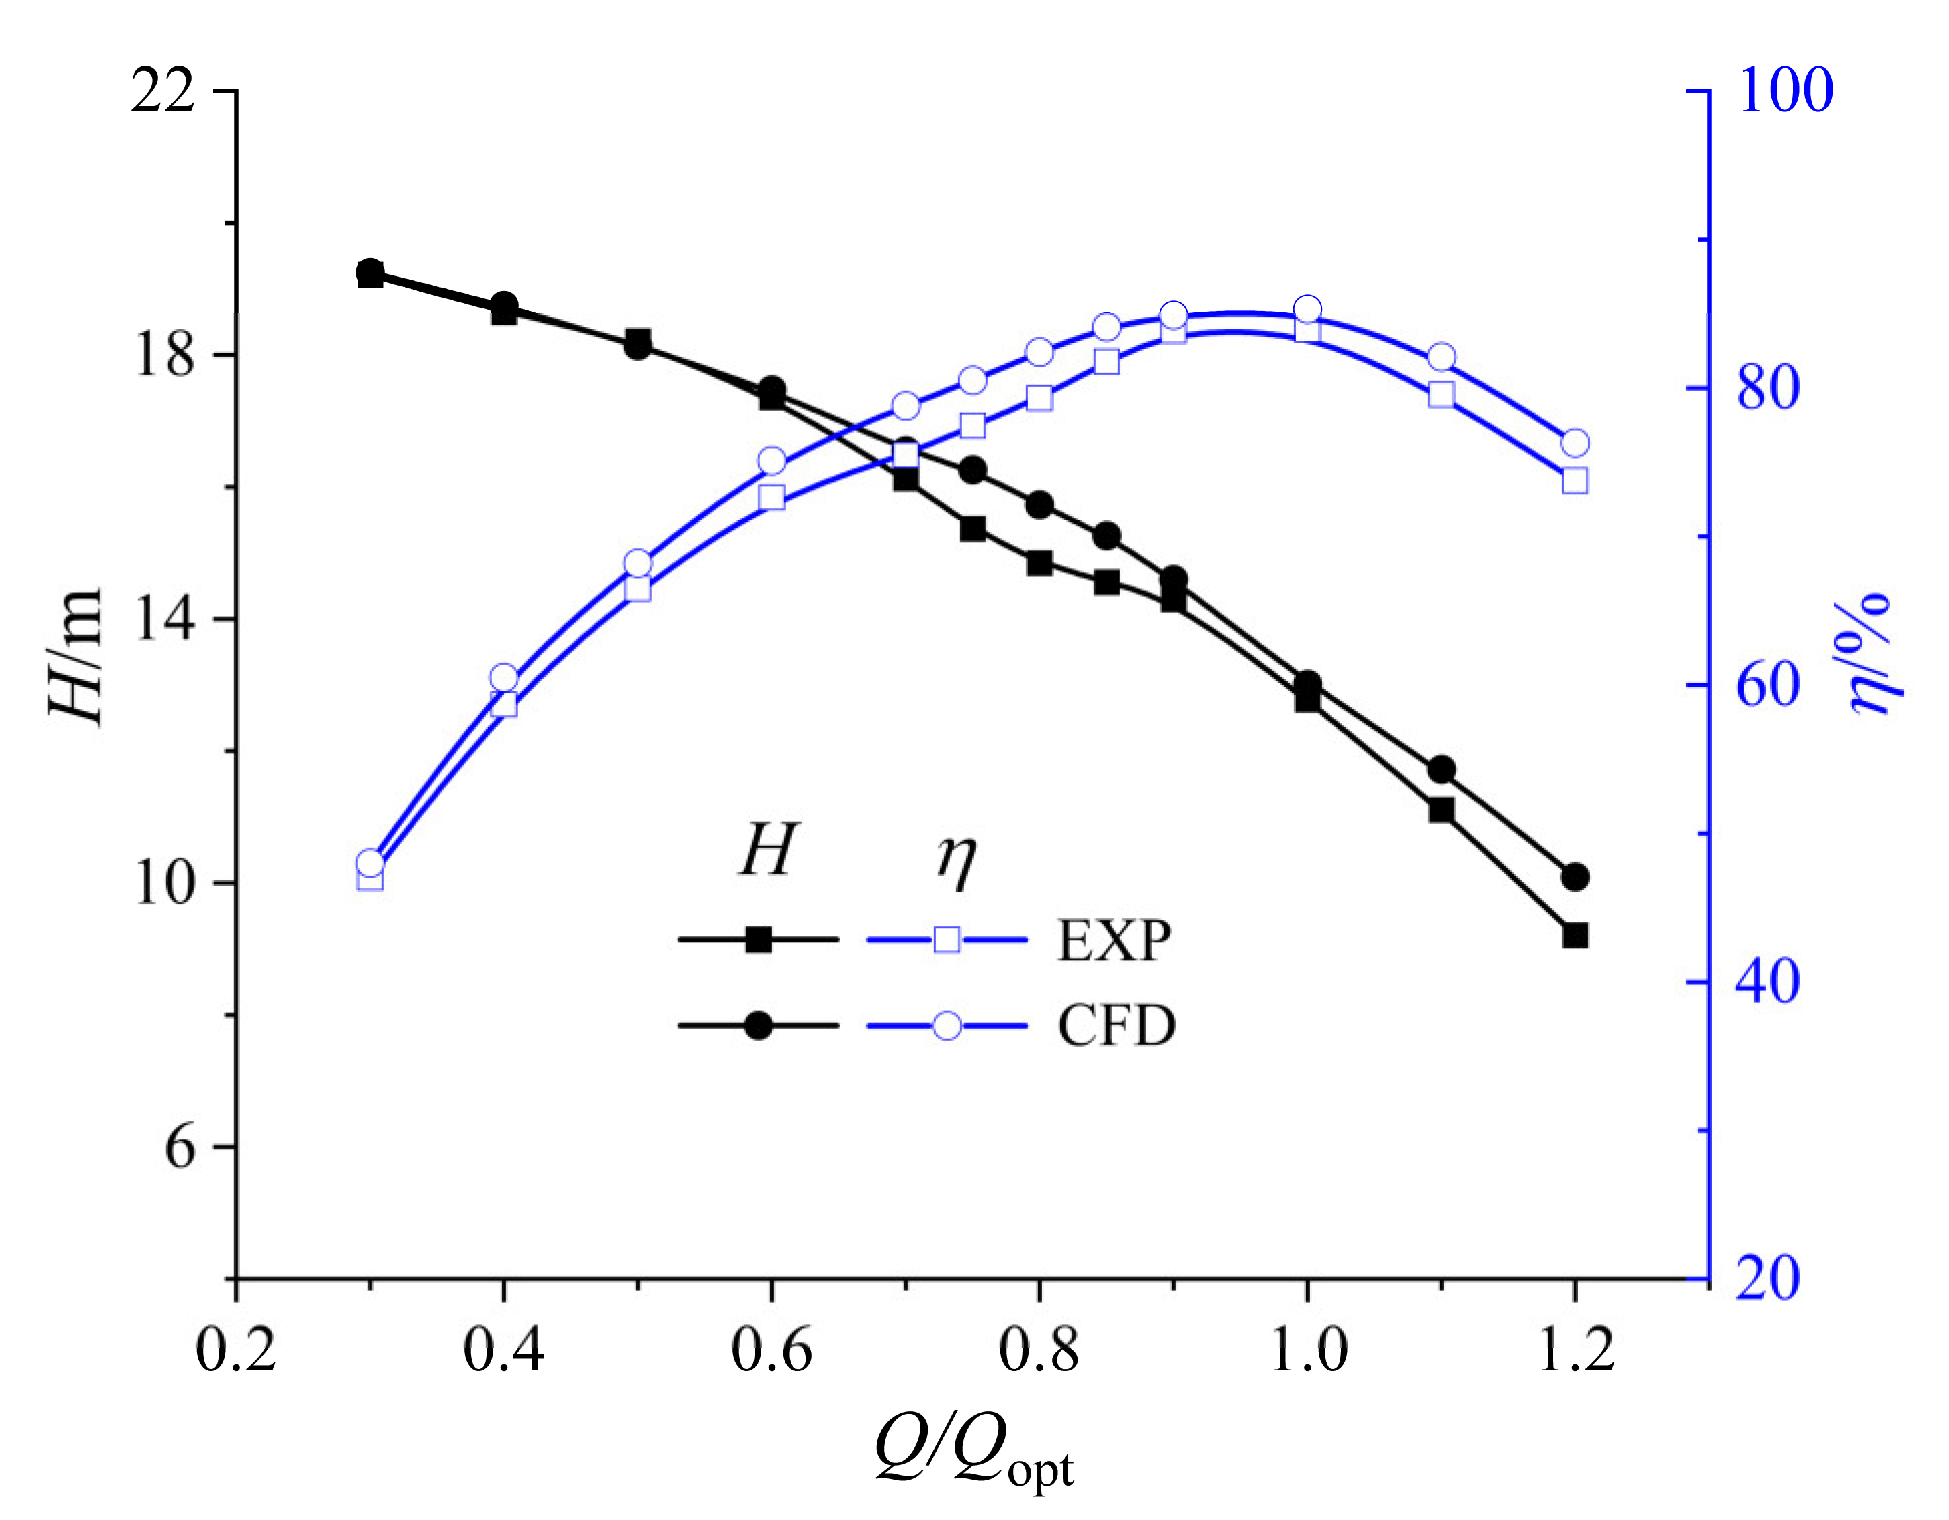
The experimental testing of the centrifugal pump model is conducted in a closed-loop setup at the National Fluid Machinery Laboratory of Jiangsu University. Figure 3 shows the centrifugal pump testing bench, including the model pump, motor, inlet valve, outlet valve, water tank, electromagnetic flow meter, and pressure sensor. The performance curve is obtained by adjusting the flowrate within the range of 0.3 Qopt to 1.2 Qopt. To ensure the reliability of the test data, the experiments are repeated three times independently. The averaged values of the head and efficiency are calculated from the obtained results. The performance curve obtained from numerical simulation and experimental testing is compared in Figure 4. The data from the numerical simulation are found to match well with the experimental data. Under the design conditions, the experimental results show a head of 12.78 m and an efficiency of 83.93%. In comparison, the numerical simulation displays a slightly higher head of 13.01 m and a slightly higher efficiency of 85.3%. The maximum errors for Q-H and Q-η are 5.9% and 4.4%, respectively. The simulation exhibits slightly higher head and efficiency compared to experimental results at the same flow rate conditions. The roughness of the blade surfaces is ignored, and the leakage at the wear ring is not considered. Overall, the numerical method adopted in the present research has enough accuracy for subsequent analysis.

3.2. Cavitation Performance Analysis

Previous studies [41,42,43] show that cavitation in centrifugal pump is mainly observed at the leading edge (LE) of blades. The results induce a decline in pump performance. As the σ decreases, the cavitation patterns on the blade surfaces develop from free cavitation bubbles to sheet cavitation. Figure 5 shows the cavitation curves obtained by numerical results at flowrates of 0.6 Qopt, 1.0 Qopt, and 1.2 Qopt.
The σ is defined as:
σ = P i n - P v a 1 2 ρ U 2 2
where Pin is the pressure of the pump inlet, Pva is the saturated vapor pressure of the liquid, ρ is the liquid density, and U2 is the circumferential velocity at the impeller outlet.
Figure 5 shows that the head at different flowrates first decreases slightly with the reduction of the σ. The head has a sudden drop when the critical value of the σ is reached, and the cavitation curves show a downtrend with a large slope. In the present study, the critical value corresponds to σc at a 3% head drop level. The σc increases with flowrates, and the σc of 0.6 Qopt, 1.0 Qopt, and 1.2 Qopt are 0.102, 0.130, and 0.288, respectively.
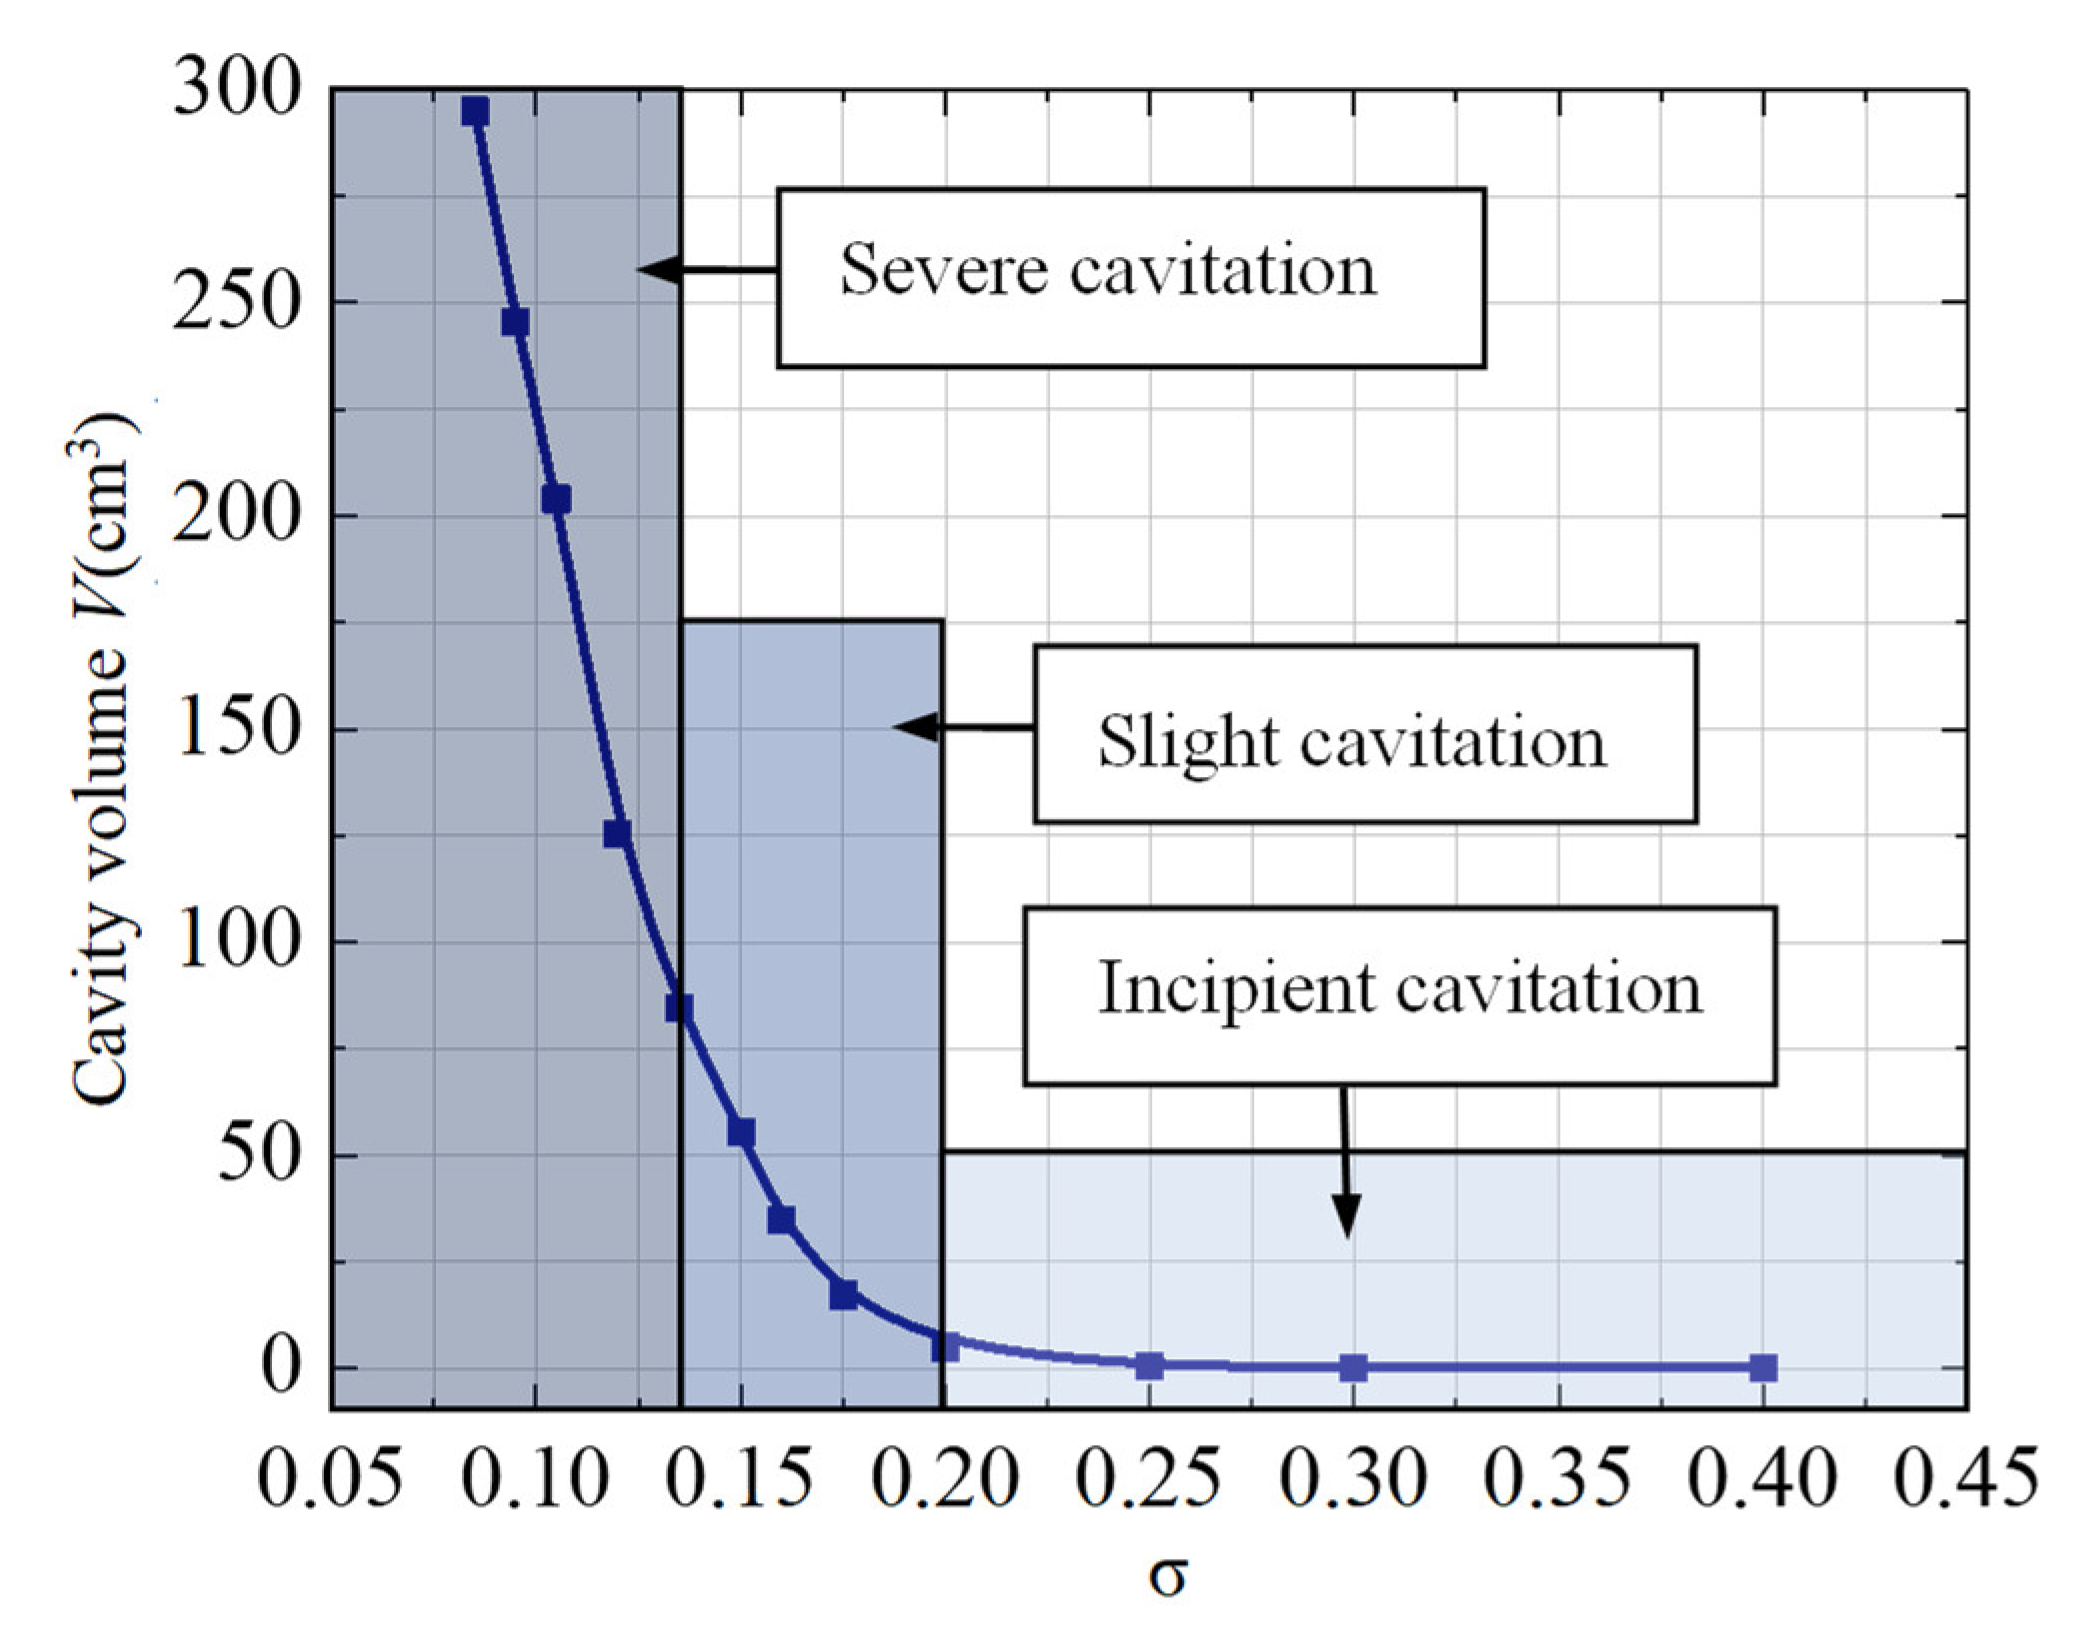
At the stage of incipient cavitation, only weak cavitation bubbles are observed in the region of the blade inlet. It hardly affects the hydraulic performance and stability of the pump. For example, the head does not change at flowrates of 1.0 Qopt when σ varies from 0.763 to 0.467. At the slight cavitation stage, the cavitation patterns are steady, and their location is relatively fixed. Though the cavitation still has no significant impact on the pump’s performance at this stage, it does induce an unstable vortex. If slight cavitation persists for an extended period, it can lead to surface erosion due to cavitation. When the σ reaches the severe stage, the head decreases significantly. The cavitation structures extend along the blade surfaces. The previous studies [24,43] show that unstable alternating cavitation occurs on the pressure side (PS) and suction side (SS) of the blade when the cavity grows to 65% of the width of the flow passage. According to the change in cavity volume, the cavitation intensity can be classified into three stages: incipient cavitation, slight cavitation, and severe cavitation. Figure 6 shows the total cavity volume with the variation of the σ at the design flowrate condition. At high cavitation numbers, the cavity volume equals 0, indicating that there is hardly cavitation in the impeller. As the σ decreases from 0.200 to 0.130, there is a gradual increase in the volume of the cavity within the impeller. Under these conditions, the severity of cavitation is still limited, and the total cavity volume grows slowly. When the σ decreases from 0.130 to 0.081, the severity of cavitation gradually increases with a continuous increase in the cavity volume fraction of the impeller. As the σ is lower, the curve of cavity volume variation has a rising trend with a large slope. This result indicates that the cavitation severity in the impeller rapidly intensifies at this stage.
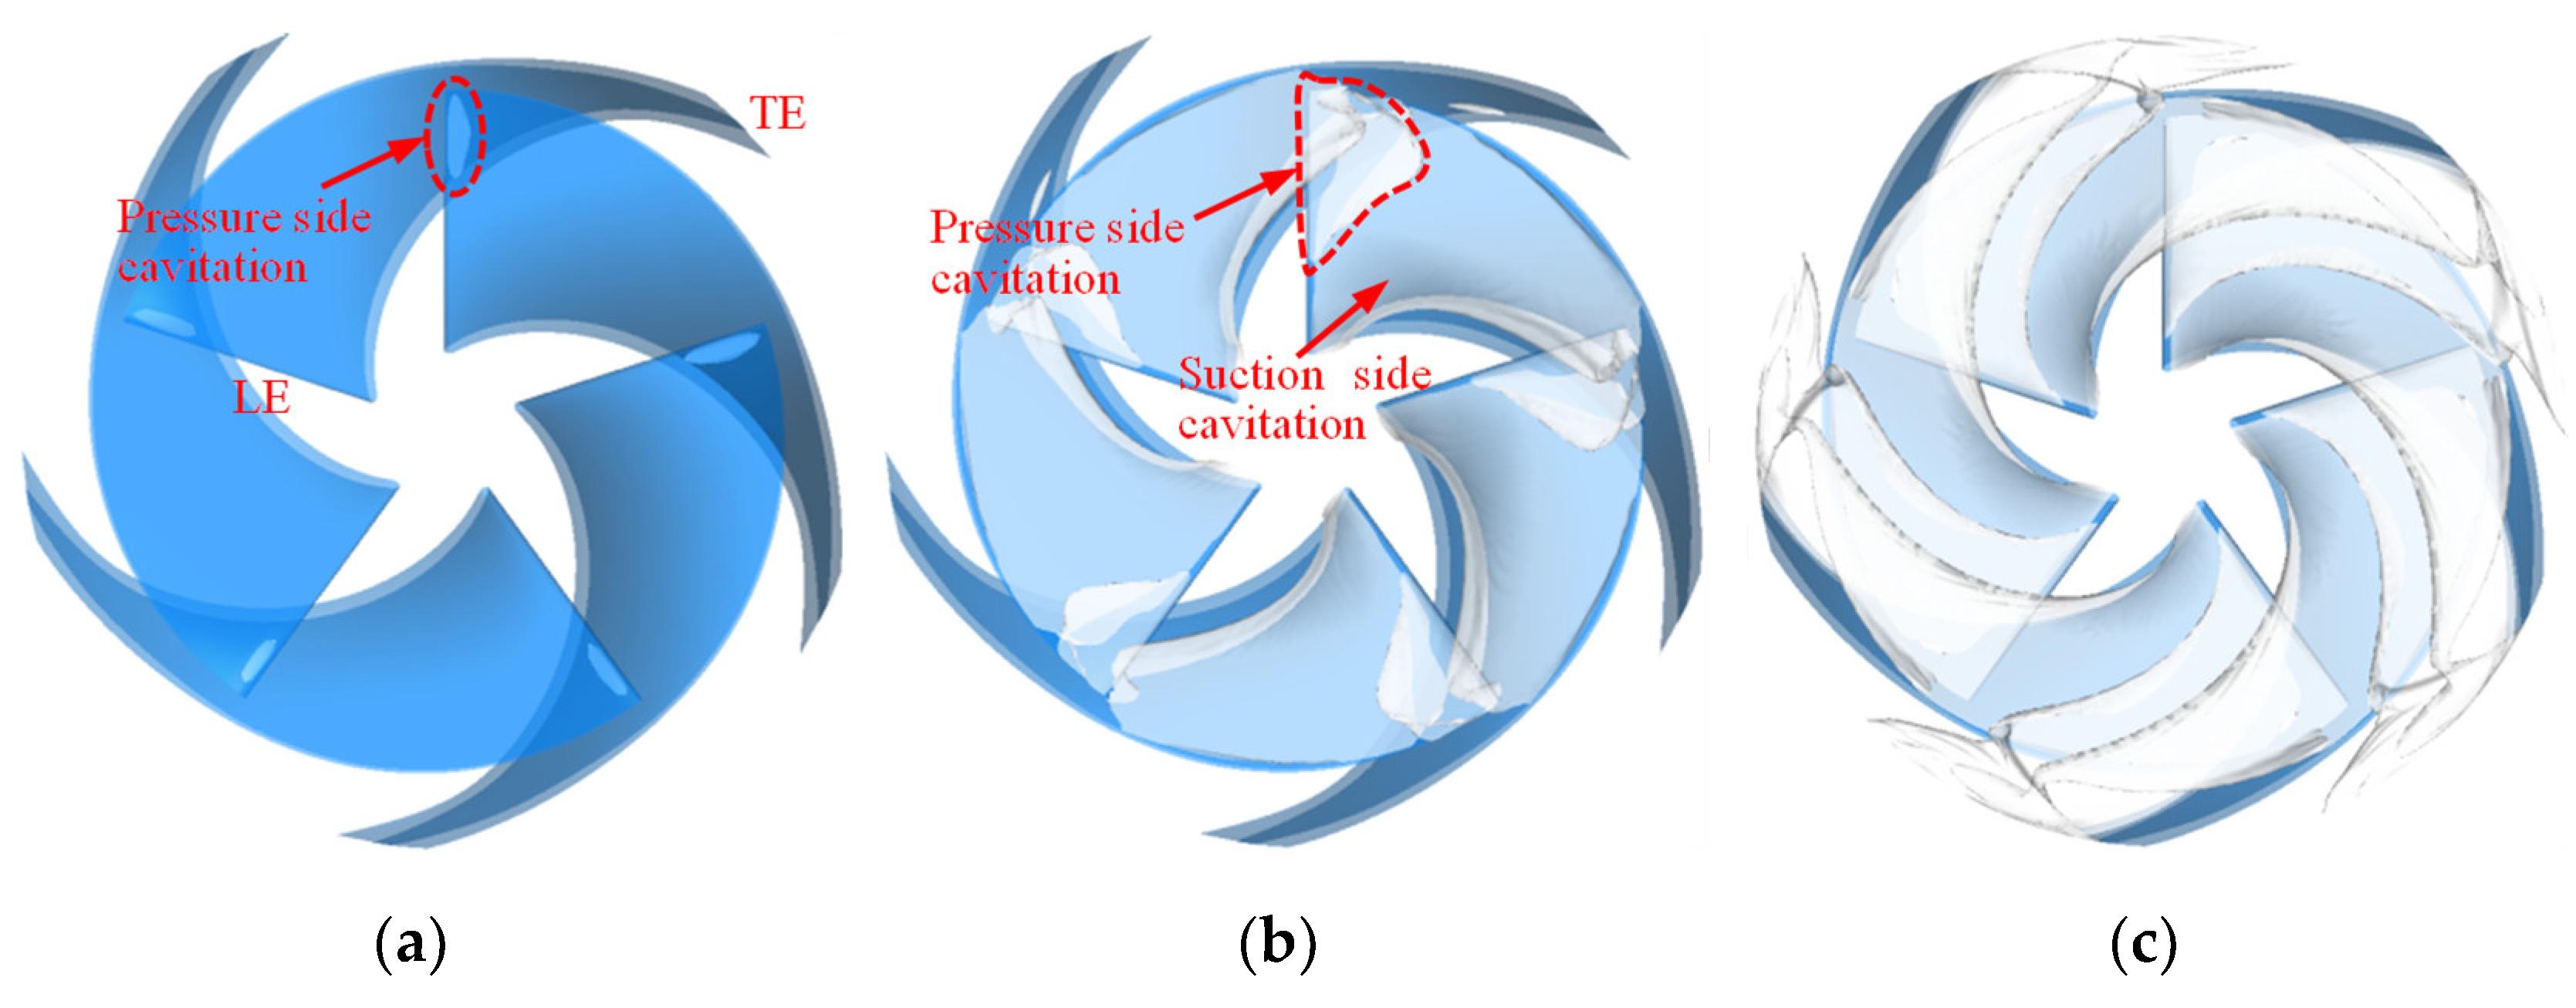
The cavitation patterns at the design condition are investigated in this study. Figure 7 shows the cavitation patterns of the impeller at various stages of incipient cavitation, slight cavitation, and severe cavitation, and the σ correspond to the stages are 0.467, 0.130, and 0.091, respectively. When the centrifugal pump is at the incipient cavitation stage, Figure 7a shows that only a small area of cavitation bubbles is generated at the leading edge of the pressure side. As the σ decreases to 0.130, Figure 7b shows that the cavitating area extends significantly near the pressure side (as shown in the red dotted line). A large area of cavitation attaches to the blade surfaces, and the thickness of the cavitation increases gradually along with the blade chord. Figure 7c describes the stage of severe cavitation in the impeller. The cavitation structures on the pressure side continue to expand. In addition, the cavitation structures on the suction side extend to the trailing edge (TE) of the blade to cover the entire surface. The cavitation structures of neighboring blades are connected. The flow passages become obstructed, leading to a significant decline in pump performance.
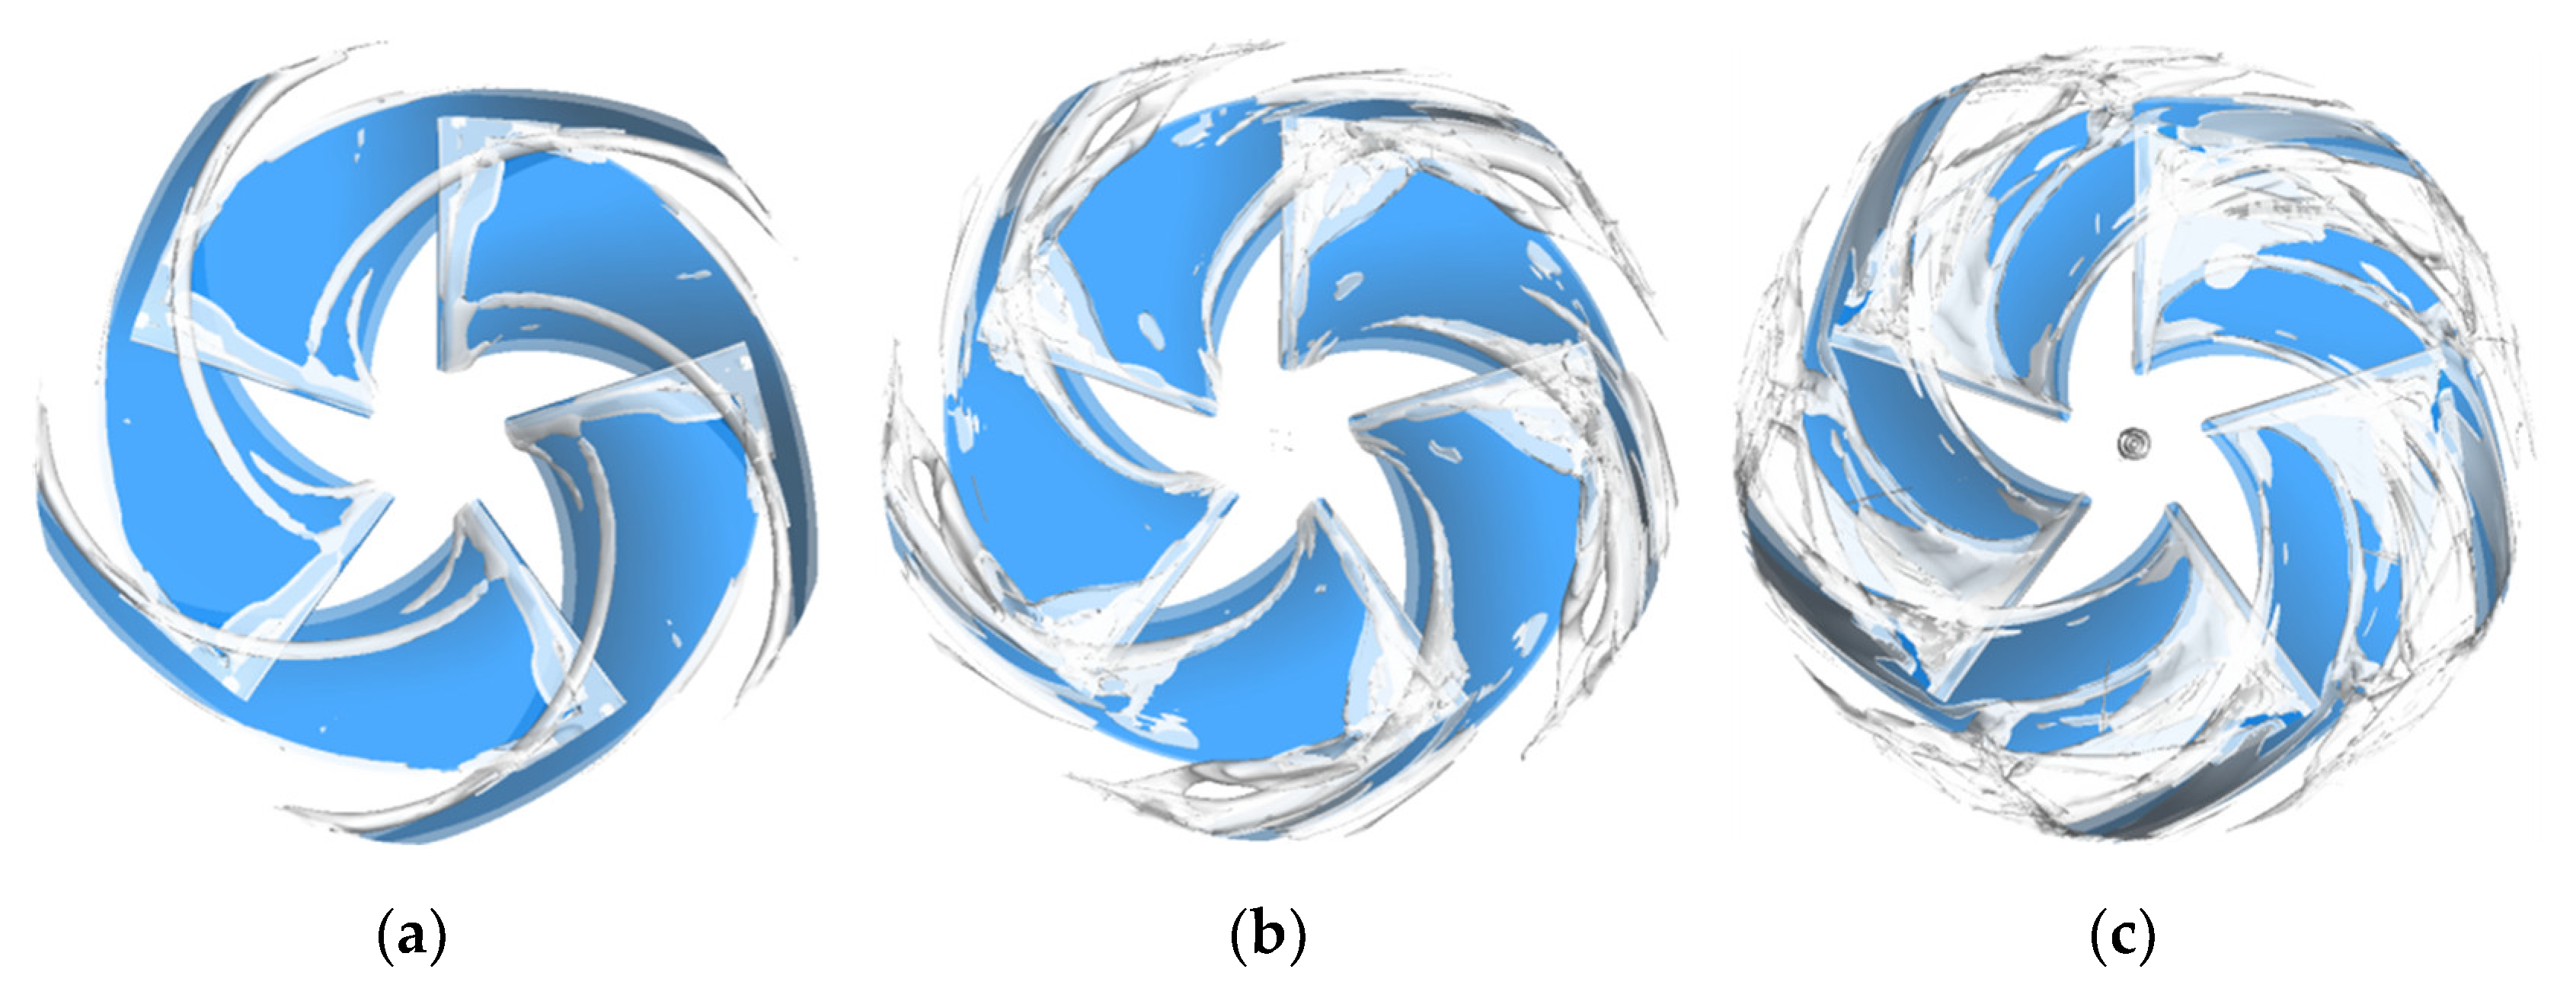
The development of cavitation in centrifugal pumps leads to energy loss and the degradation of pump performance. There is the effect of the following two aspects. On the one hand, the formation of cavitation structures leads to the blockage of the flow passage, resulting in disorder in the flow field. On the other hand, cavitation structures induce vortices in the flow passage, which affect the blade loading. This will cause direct hydraulic losses. The vortical structures in the impeller under different cavitation numbers are shown in Figure 8. In this investigation, the Q criterion is utilized for the identification of vortices. The Q criterion method based on the characteristic equation of the velocity gradient tensor can be described as follows:
λ 3 + P λ 2 + Q λ + R = 0
Hunt et al. [44] used the second matrix invariant Q to identify the existence of vortices and determined that it is greater than zero.
The Q is expressed as:
Q = 1 2 A F 2 S F 2
where S is the symmetric component of the velocity gradient tensor, and A is the antisymmetric component. S and A represent the deformation and rotation components of the flow field, respectively. The physical meaning of the Q criterion is that the vorticity of the rotating part is greater than that of the deformed part in the flow field, and the rotating effect plays a leading role.
At the stage of incipient cavitation, there is no obvious effect on the vortical structures. Figure 8a shows that only small-scale vortical structures are observed at the inlet of the blade. The suction side of the blade exhibits a slender vortical band that extends along the surface to the trailing edge. As the σ decreases to 0.130, the area of the vortex increases, and the slender vortex bands gradually increase in scale along the blade. The main vortical structures are located at the tail of the cavitation structures. Under severe cavitation conditions, the vortical structures develop further from the leading edge to the middle of the blade. At the trail of cavitation, the entire flow passage near the outlet of the impeller is almost entirely occupied by these vortical structures.
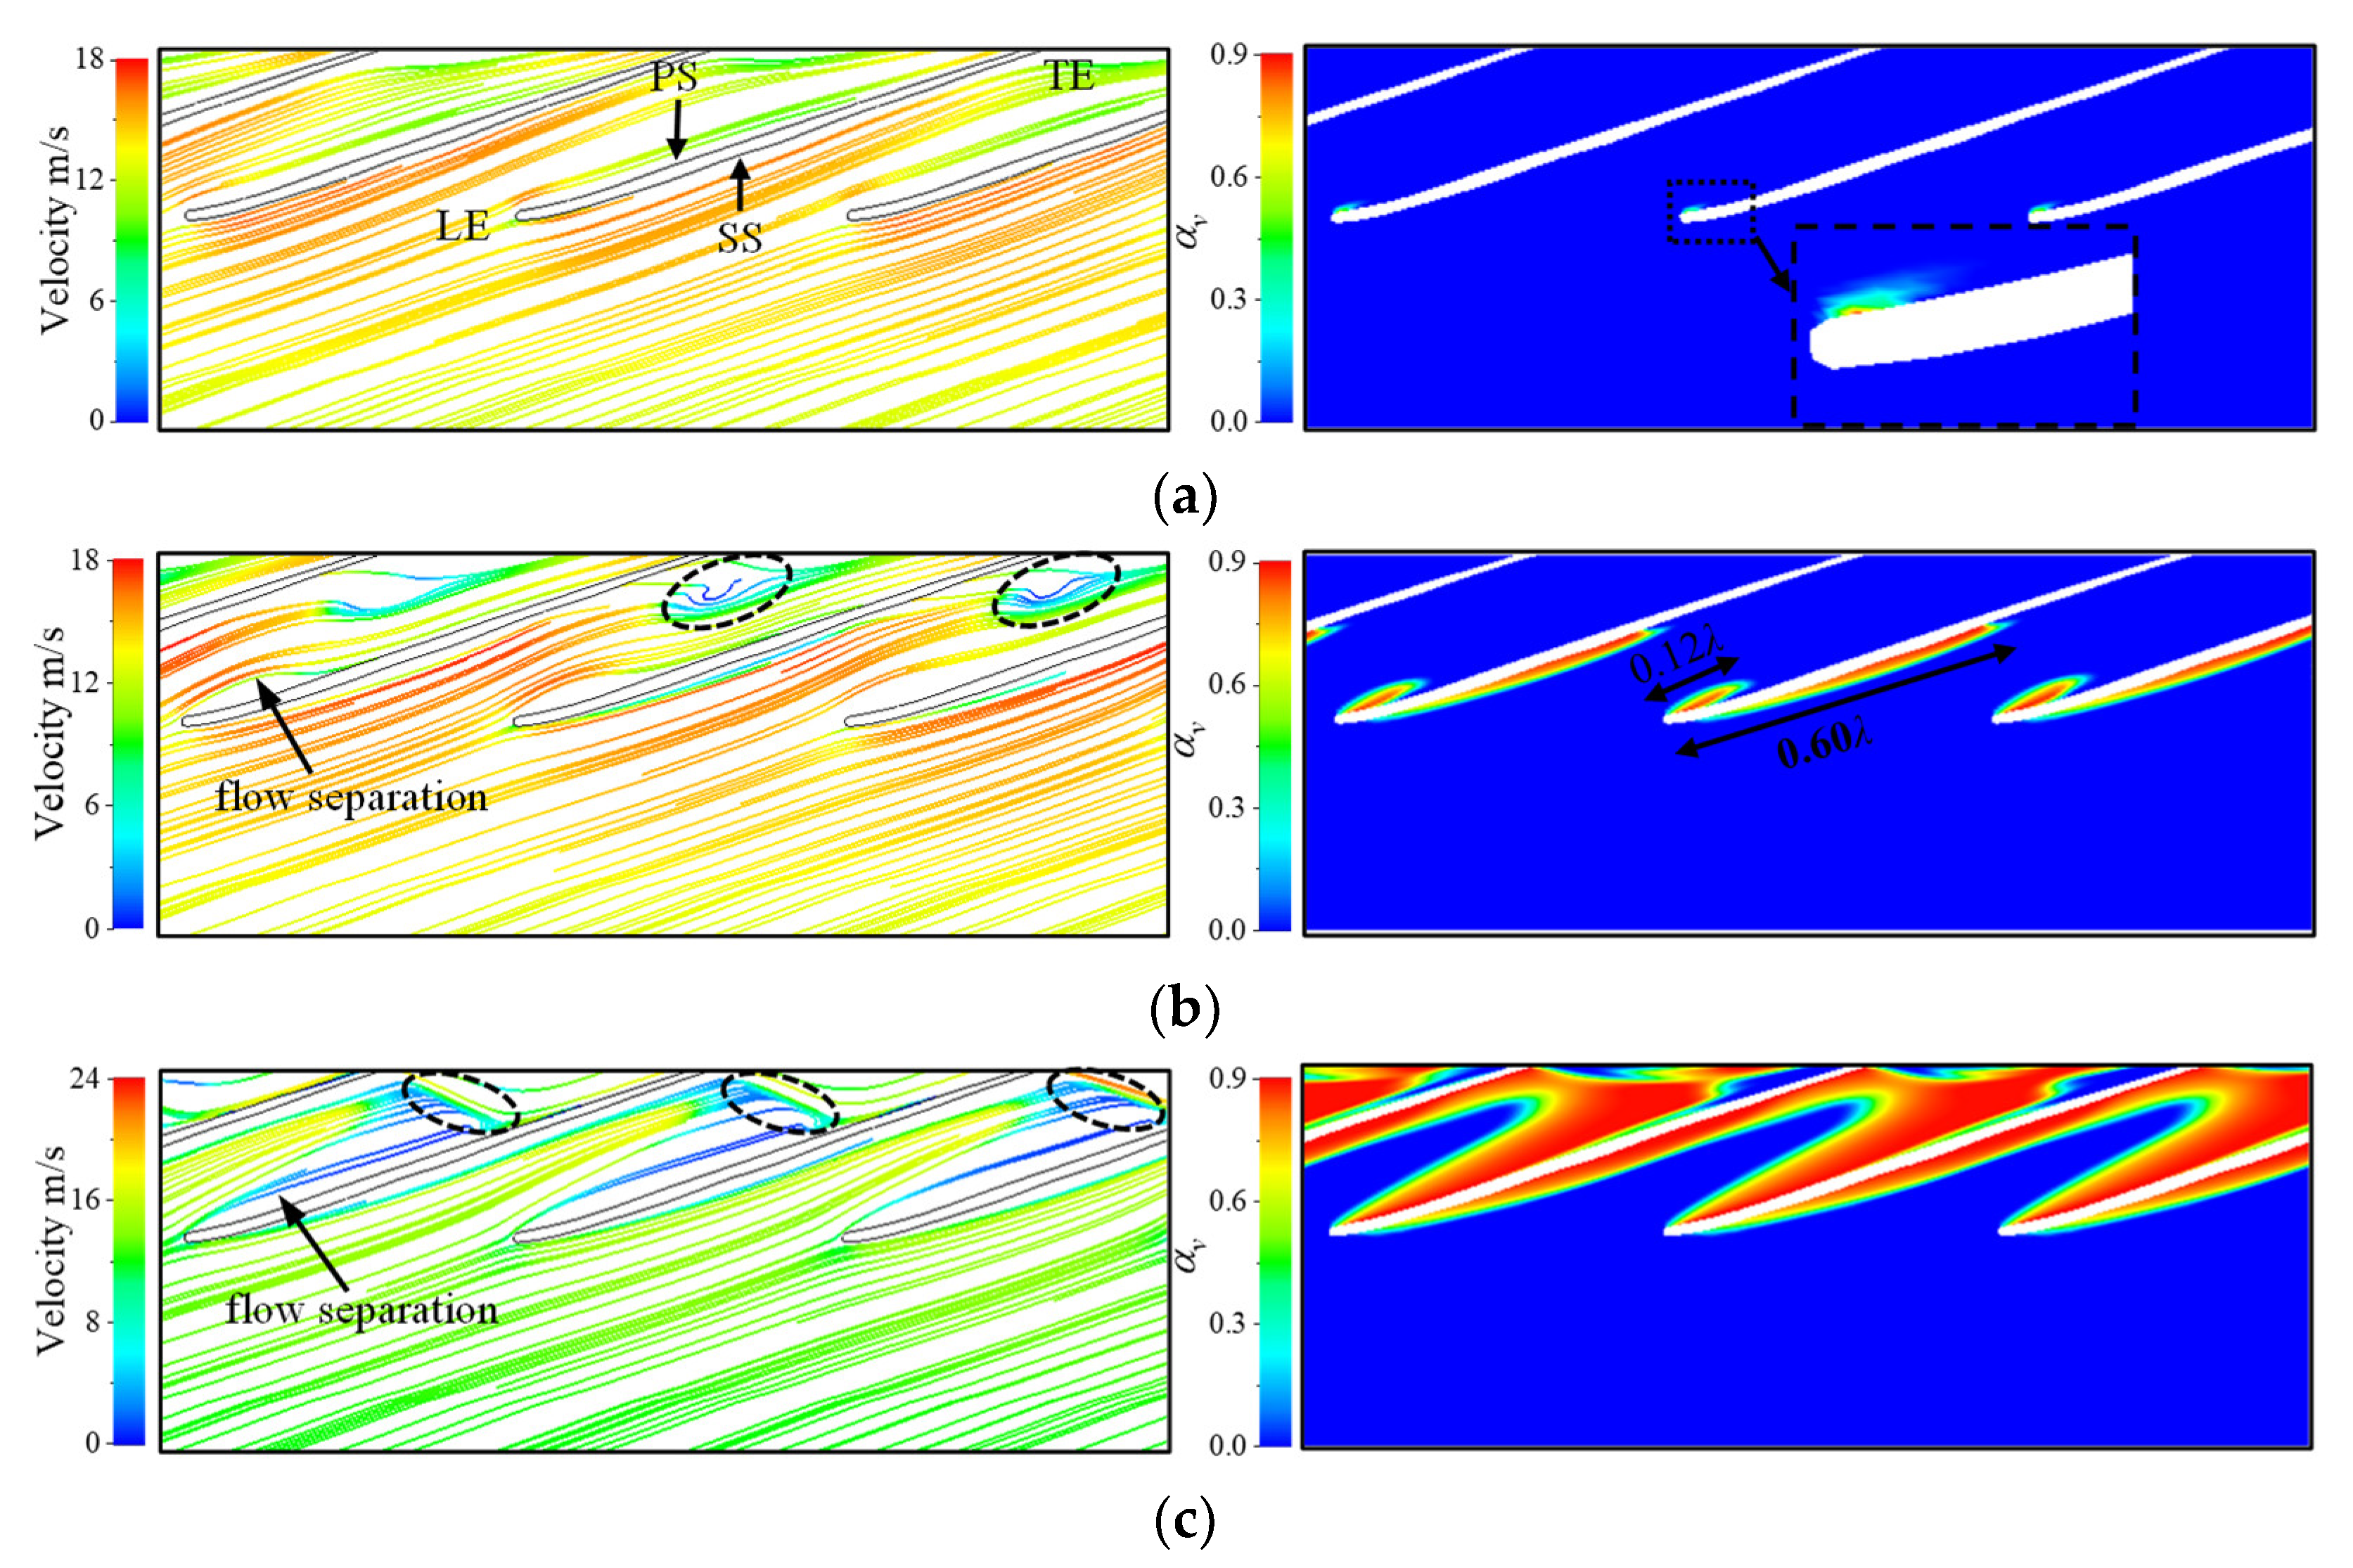
To further analyze the detailed flow field under different cavitation conditions, Figure 9 illustrates the distributions of the streamlines and cavitation at the 0.8 span plane under different cavitation numbers at the design flowrate condition. The span is the non-dimensionless distance from the front shroud to the back shroud of the impeller. αv represents the volume fraction of the vapor. λ represents the chord length from the leading edge to the trailing edge of a blade. At the stage of incipient cavitation, the flow field of the impeller remains steady. As illustrated in Figure 9a, only weak cavitation is observed at the leading edge of the blade. These structures have negligible impact on the flow field. Under the critical cavitation number condition, the flow separation is prominently observed at the leading edge of the pressure side, corresponding to the position of cavitation structures. Figure 9b illustrates that the length of the cavitation structures on the pressure side is 0.12 λ. While a large area of attached cavitation is present on the suction side, and its coverage length is 0.60 λ. The flow passage near the impeller outlet exhibits disordered streamline patterns, which are attributed to the presence of vortical structures. Meanwhile, a significant reduction in velocity is observed at the cavitation trailing edge. At the stage of severe cavitation conditions, the flow separation is strengthened, as is the formation of cavitation and vortical structures. Figure 9c shows that the entire blade surfaces are almost attached by the cavitation structures. The flow passage exhibits a higher degree of turbulence compared to that under critical cavitation conditions. Due to the interference of cavitation structures in the middle and trailing edges, there is a significant decrease in velocity, particularly at the flow passage outlet. Due to the influence of vortical structures, the streamlines deviate significantly (as indicated by the black dotted area), resulting in a reduction in hydraulic efficiency and a severe decrease in performance.

3.3. Cavitation Vortex Dynamics Analysis

The cavitation vortex dynamics of the impeller are investigated by using the transport equation of relative vorticity [45].
D Ω R D t = Ω R W Ω R W 2 × ω × W + ρ m × p ρ m 2 + ν 2 Ω R
where Ω R is the relative vorticity, W is the relative velocity, ω is the rotational angular velocity, and ν is the kinematic viscosity.
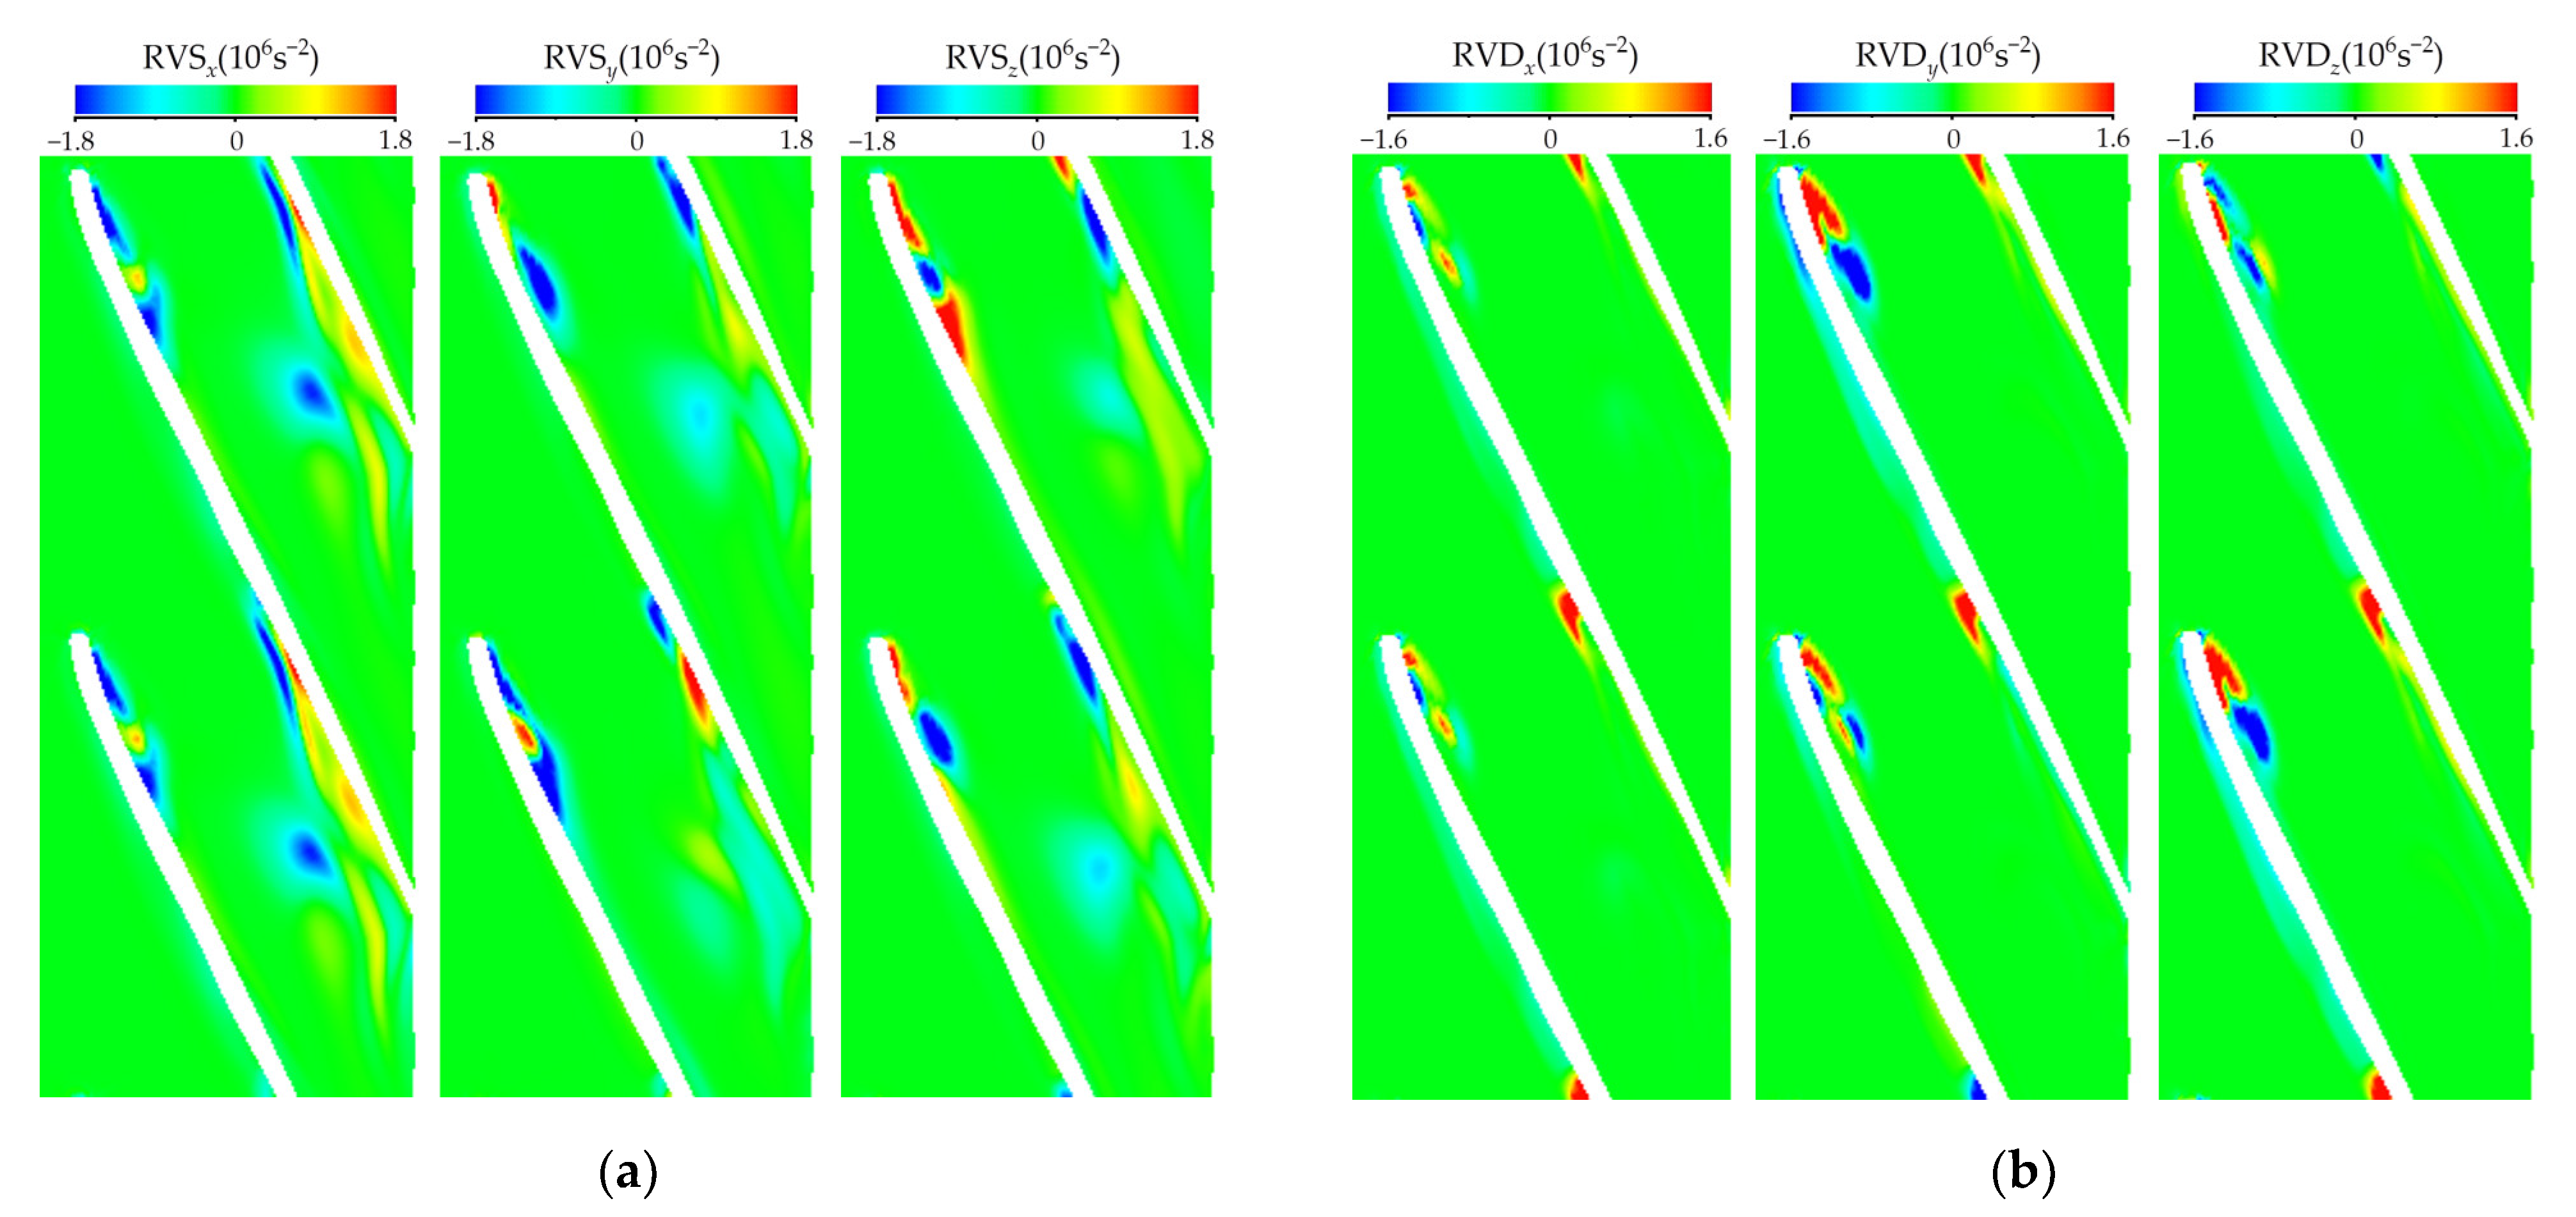
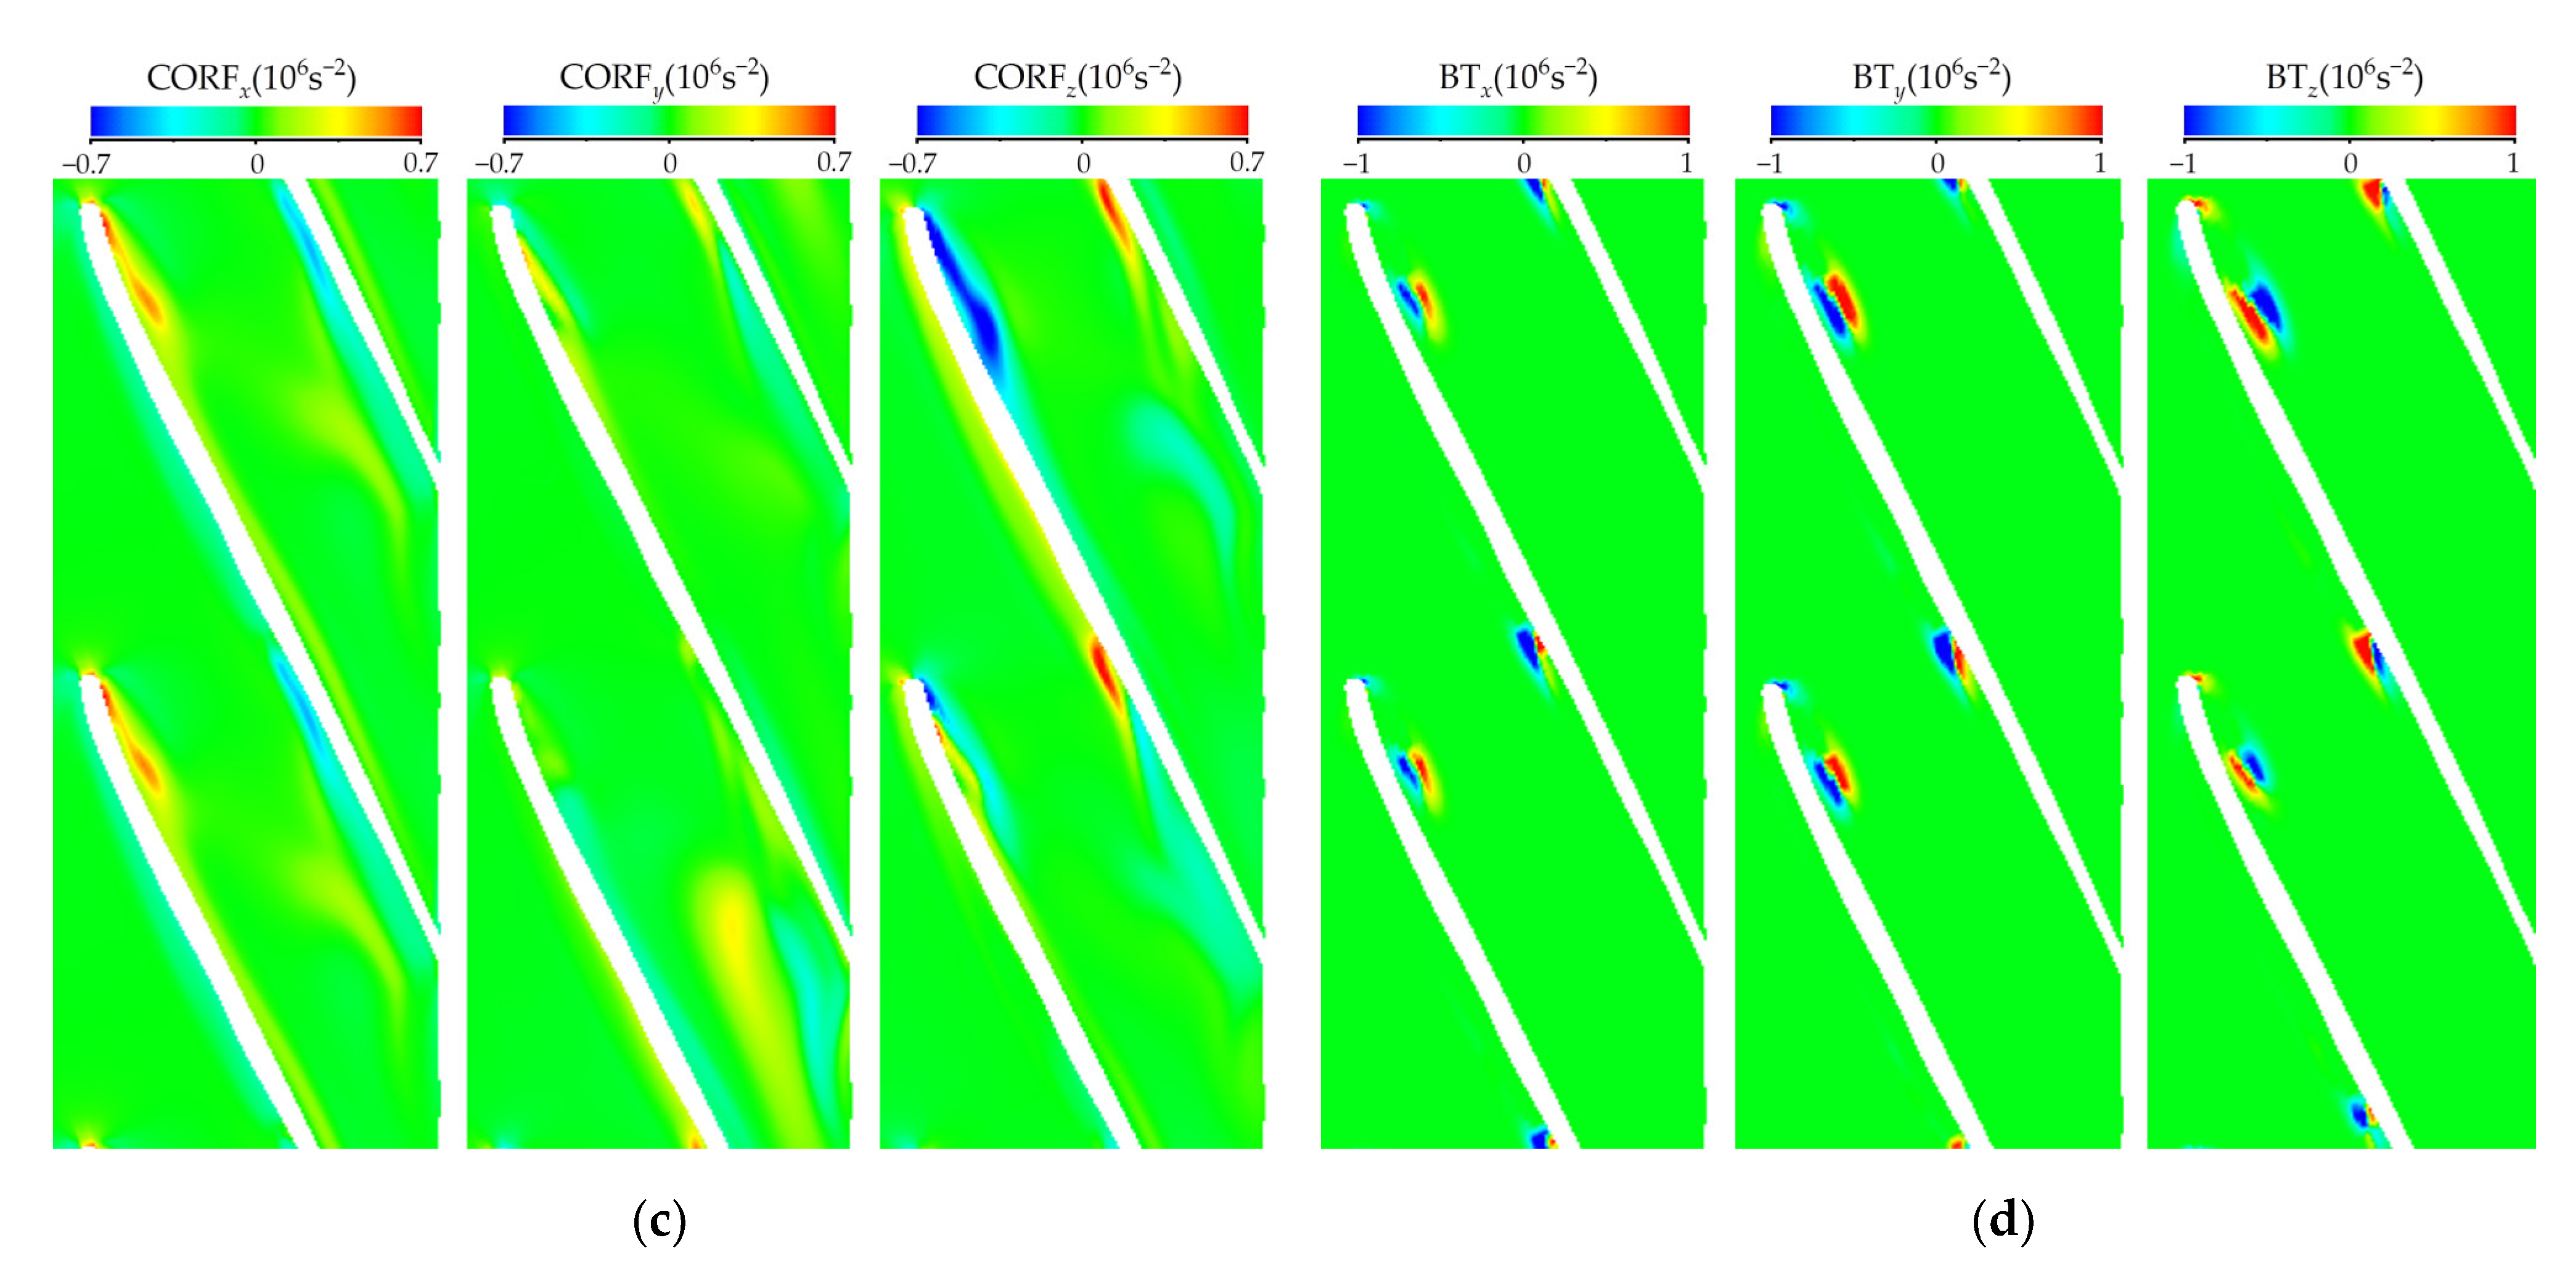
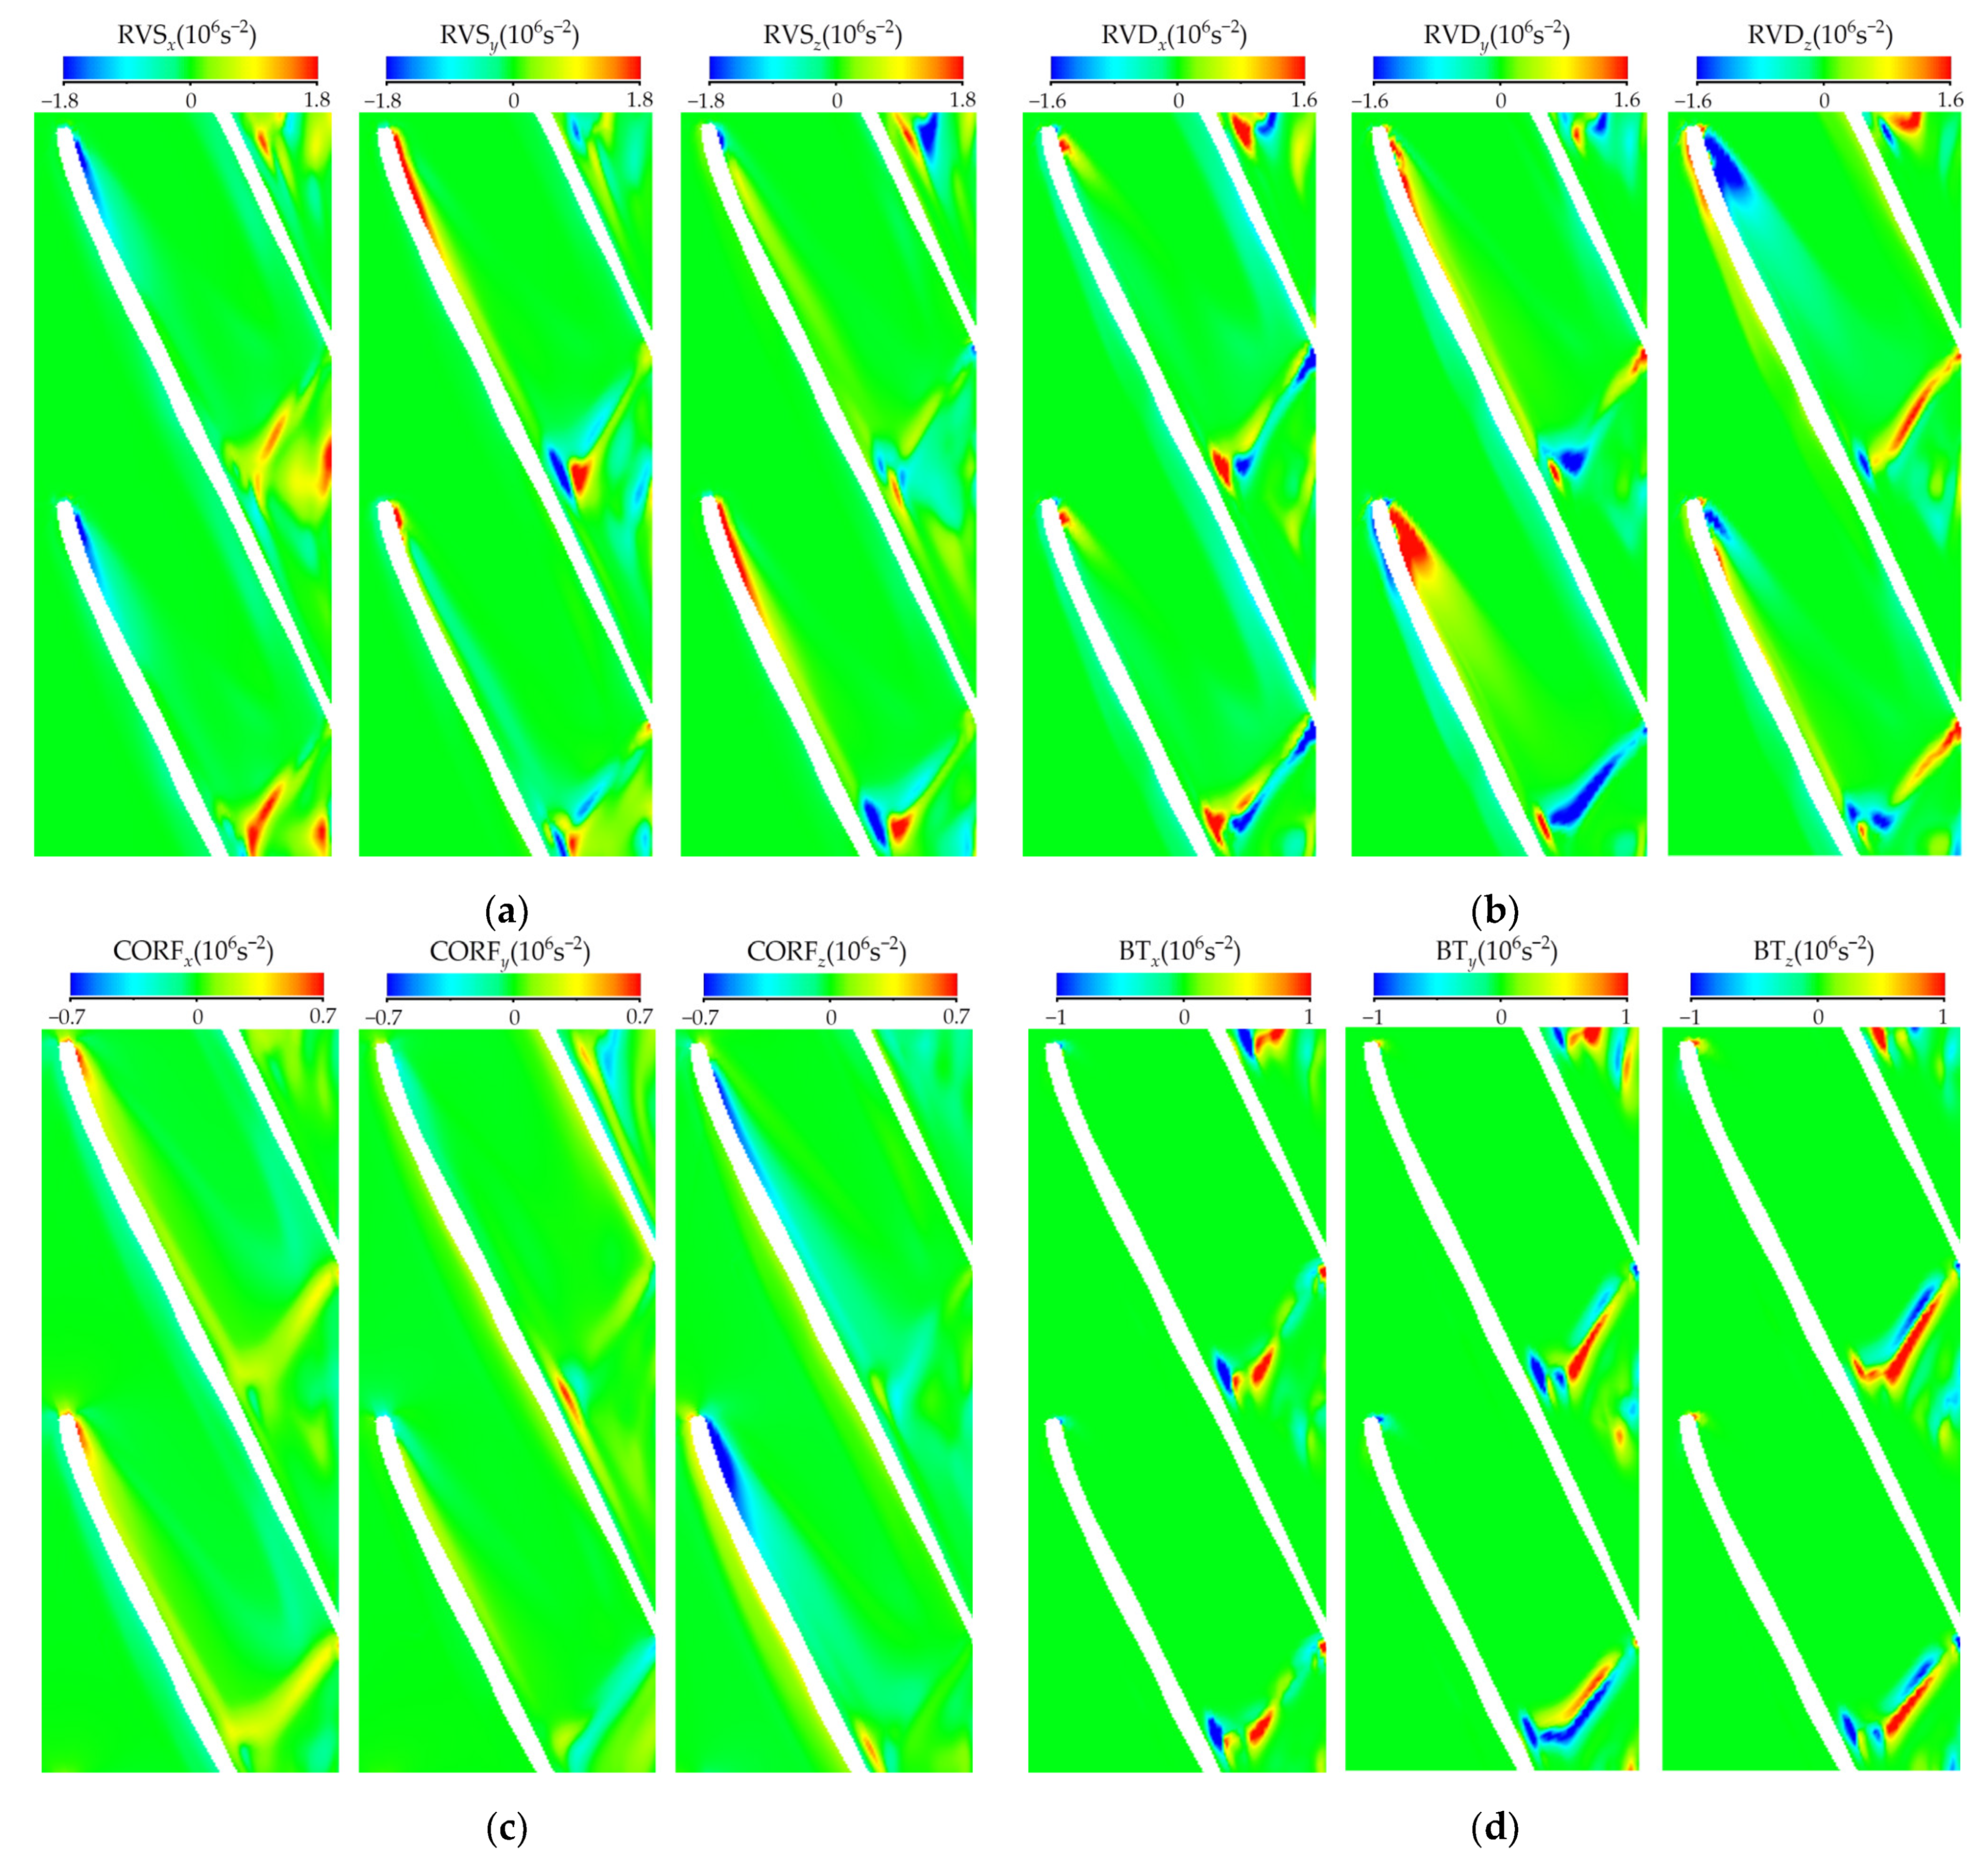
The left term is the change rate of the relative vorticity. On the right of the equation, the first term is the relative vortex stretching (RVS), which represents the effect of the velocity gradient on vorticity generation. The vorticity is stretched, twisted, or slanted when the velocity is varied along the vortex filament. The velocity gradient parallel to the vortex filament leads to stretched vorticity, and the velocity gradient perpendicular to the vortex filament leads to twisted vorticity. The second term is relative vortex dilation (RVD), which is proportional to the velocity divergence of the fluid and represents the influence of vapor expansion or contraction on vorticity. When a strong vapor-liquid exchange is present in the cavity, the rotation effect occurs because of the compressibility of the vapor phase. The third term is the Coriolis force (CORF). The CORF is an inertial force that arises from the movement of fluid particles relative to a rotating coordinate system, induced by the rotation of an impeller. As the CORF acts perpendicular to the motion direction of the object, only the object’s direction of motion is changed without changing its velocity [46]. The fourth term represents the baroclinic torque (BT), which is produced by the difference in density and pressure in the cavitation region. The fifth term represents the viscosity diffusion (VISD), which has less impact on vorticity at high Reynolds numbers [47,48]. Thus, the viscosity diffusion term is ignored in this study.
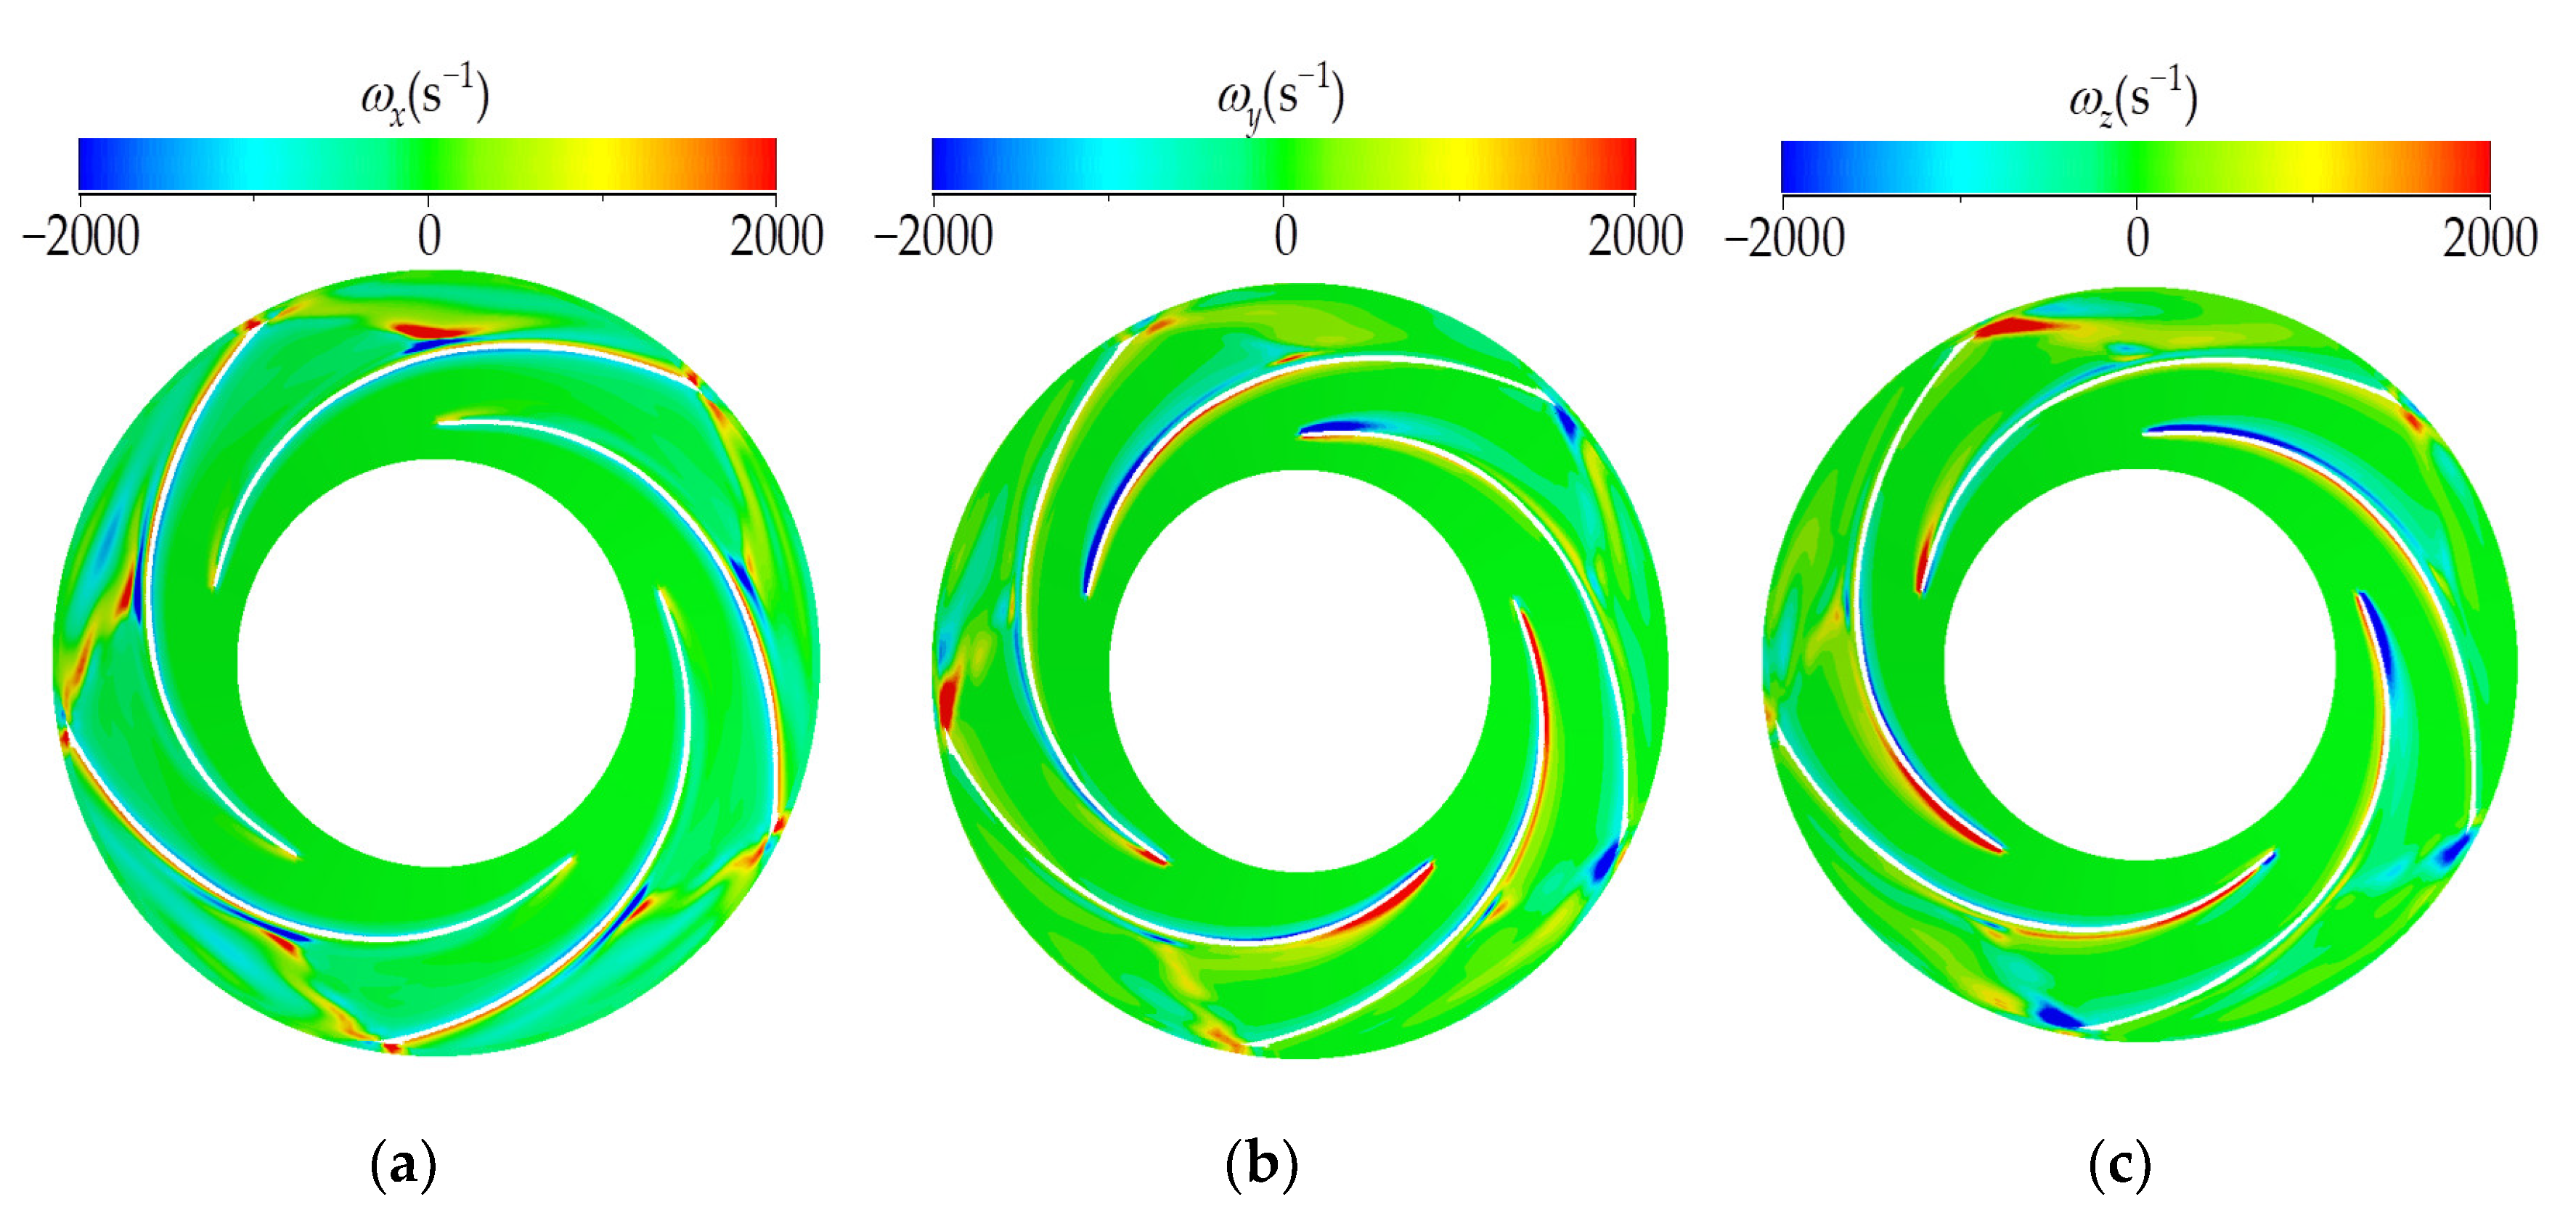
According to the previous analysis, it significantly generates vortical structures when cavitation occurs in the pump. The vortical structures lead to blockage of the flow passage and reduction of pump efficiency, especially under severe cavitation conditions. The cavitating flow field with cavitation numbers of 0.130 and 0.091 at design conditions is selected for research in this section. To investigate the impact of cavitation on vorticity components and vorticity transport terms in different directions, the vorticity is decomposed into the x, y, and z directions in cartesian coordinates, and its transport terms are analyzed, respectively. Figure 10 and Figure 11 show the vorticity components ωx, ωy, and ωz at a 0.8 span when the σ is 0.130 and 0.091, respectively. In Figure 9b, the cavitation structures attach to the blade surfaces. In addition, the vorticity components ωy and ωz are mainly distributed near the blade surface under the cavitation number of 0.130. The vorticity at the leading edge of the pressure side is larger, while the vorticity at the suction side is mainly distributed at the tail of the cavitation. x is the rotation axis of the impeller, ωx has no obvious distribution near the pressure side. Figure 9c shows that the gathered vortical structures are observed at the tail of the cavitation structures. Meanwhile, the high vorticity regions in different directions are mainly distributed at the flow passage outlet. Due to the instability of the cavitation structures at the pressure side, the ωy and ωz components also occur obviously near the pressure side, which leads to the generation of the vortex.
Figure 12 and Figure 13 show the distributions of vorticity transport terms ωx, ωy, and ωz when the σ is 0.130 and 0.091, respectively. In the cavitating flow of a centrifugal pump, cavitation structures will affect the formation and evolution of a vortex. The fluid elements are weakened by vortex deformation and stretching, which increase angular velocity and generate vorticity. Figure 12a shows the distribution of the RVS term in the x, y, and z directions at the stage of incipient cavitation. The main distribution area is consistent with the distribution of vorticity in different directions in this cavitation stage. On the pressure side, it is predominantly distributed near the leading edge. On the suction side, the RVS is mainly distributed at the tail of the cavitation. The existence of a significant velocity gradient leads to the stretching or twisting of vortex filaments. Figure 12b shows the alternately positive and negative distributions of the RVD term in the cavitation bubbles near the pressure side. This result indicates that the vorticity in different directions is formed by the expansion or contraction of the cavity. Meanwhile, the RVD term is positive at the tail of cavitation bubbles on the suction side. In comparison to the terms of the RVS and RVD, the contributions of CORF and BT to vorticity are relatively less. At the cavity interface, there is intense vapor-liquid exchange, and the density gradient deviates from the pressure gradient. The BT contributes to the vorticity, especially at the trail of the cavitation.
At the stage of severe cavitation conditions, complex vortex structures are observed in the impeller, leading to obvious blockage of the flow passage. Figure 13a shows that the vorticity transport terms in the x, y, and z directions are approximately perpendicular to the distribution of blades in the flow passage. The region of vortex at the tail of cavitation is the main area of the RVS term. The distribution of RVSx has a large range and a positive distribution. The RVSy and RVSz have a positive and negative pairwise distribution, respectively. This phenomenon indicates that the stretching and twist of vortex filaments here are significantly affected by the rotational impeller. Figure 13b illustrates the distribution of vortex dilation terms in the x, y, and z directions. The distribution of vortex dilation terms is observed at the cavitation region of the pressure side, especially at the region of the RVDy and RVDz. This result indicates there is a large vorticity generated by vapor-liquid exchange here. In addition, the components of the RVD term in the three directions are all approximately perpendicular to the blade. The structure of the cavitation tail is unstable near the vapor-liquid interface. Figure 13c shows that the CORFx is distributed at the cavitation area of the pressure side and the vortex region of the cavitation tail. Its value is comparatively small. The distribution of CORFz is obviously observed only near the pressure side. Compared with the slight cavitation stage, the CORF term contributes less to vorticity. Figure 13d shows that the BT term is observed in pairs, positive and negative, at the tail of cavitation. There are different directions on the inside and outside of the cavity due to the deviation of the density gradient and pressure gradient. The distributions of BTy and BTz are significantly larger than those of BTx, and its value is decreased compared with that of the RVS and RVD terms. The contribution to vorticity is much larger than that of CORF.

4. Discussion

The modified SST k-ω turbulence model and the Zwart cavitation model are employed for the cavitating flow in a centrifugal pump. The accuracy of the numerical method is verified by the experimental results of its performance characteristics. The main conclusions are as follows:
(1) When reducing the cavitation number under different flow rate conditions, the head remains stable first and drops suddenly at the critical cavitation number. The σc of 0.6 Qopt, 1.0 Qopt, and 1.2 Qopt corresponds to 0.102, 0.130, and 0.288, respectively. The critical cavitation number increases with the flow rate. As the σ decreases, cavitation bubbles are observed in the flow passage.
(2) According to the change in cavity volume, the process of cavitation mainly has three stages: inception cavitation, slight cavitation, and severe cavitation. At the incipient stage of cavitation, cavitation structures have negligible impact on the flow field. As the σ decreases to a critical value, the flow separation is prominently observed at the leading edge of the PS, corresponding to the position of cavitation structures. The blade on the SS has a large area of attached cavitation compared to the PS. At severe cavitation conditions, the flow separation is strengthened, and vortical structures are generated at the tail of cavitation structures on the suction side. The flow passage exhibits a higher degree of turbulence compared to that under critical conditions. These results induce blockage of flow passage and a decline in centrifugal pump performance.
(3) The vortex dynamics in a centrifugal pump at different cavitation numbers are analyzed based on the vorticity transport method. When the σ is 0.130, the regions with high vorticity in the y and z directions are predominantly located at the leading edge of the pressure side and at the trail of cavitation structures on the suction side. There is no obvious distribution in the x direction. As the σ decreases to 0.091, the entire blade surfaces are almost attached by the cavitation structures. The vortical structures are mainly gathered at the flow passage outlet. A high vorticity distribution area also occurs in the flow passage. The RVS and RVD terms, in different directions, play a leading role in vorticity generation. The BT term makes an important contribution to the generation of vorticity at the vapor-liquid interface. The CORF term has the least effect on the vorticity.
(4) The generation of vorticity and the distribution of transport terms are affected by the cavitation structures. When the pump is in a severe cavitation stage, the distribution of RVS terms indicates that there is a large velocity gradient at the cavitation bubbles. This leads to the stretching or twisting of vortex filaments. The RVD term is mainly distributed at the trail of the cavitation, and the vorticity in different directions is formed by the expansion or contraction of the cavity volume. As the density of the vapor-liquid interface changes dramatically at the trail of cavitation structures, the pressure gradient is significantly different, resulting in the obvious effect on the BT term.

Author Contributions

Conceptualization, X.S., and D.Z.; Methodology, X.S.; Software, Q.M., X.Z. and G.Y.; Writing—original draft, Q.M., X.S. and X.Z.; Writing—review & editing, Q.M. and X.Z.; Supervision, X.S., X.Z. and D.Z. All authors have read and agreed to the published version of the manuscript.

Funding

This work was funded by National Key Research and Development Program of China (No. 2022YFC3204604-01), Jiangsu Province Engineering Research Center of High-Level Energy and Power Equipment (No. JSNYDL-202205).

Institutional Review Board Statement

Not applicable.

Informed Consent Statement

Not applicable.

Data Availability Statement

Not applicable.

Acknowledgments

The authors would like to be grateful to the editors and the reviewers for their helpful and constructive comments.

Conflicts of Interest

The authors declare no conflict of interest.

Nomenclature

σcCritical cavitation number
σCavitation number
NImpeller blades number
D1Inlet pipe diameter, m
D2Outlet pipe diameter, m
QFlow discharge, m3/h
QoptOptimum flow rate, m3/h
HHead, m
nsSpecific speed
nRotating speed, r/min
ηEfficiency, %
ρmMixture density, kg/m3
uiVelocity in the i direction, m/s
fiBody force term in the i direction
µmMixture viscosity
μtMixture turbulent eddy viscosity
pMixture pressure, Pa
δTurbulent kinetic energy
αvVapor volume fraction,
μlDynamic viscosity of liquid
lSubscript that represents the liquid phase
vSubscript that represents the vapor phase
kTurbulent kinetic energy in Equation (5)
ωTurbulent dissipation rate
SStrain rate dimension
F2Experience coefficient
m ˙ + Evaporation term
m ˙ Condensation term
FeEmpirical coefficients for the mass transfer term
FcEmpirical coefficients for the mass transfer term
rnuVolume fraction of the nucleation site
RBBubble size, m
PinPump inlet pressure, Pa
PvaSaturated vapor pressure of the liquid, Pa
ρLiquid density,
U2Circumferential velocity of the impeller outlet, m/s
wxVorticity in the x direction with the Q criterion, s−1
Ω R Relative vorticity
W Relative velocity
ω Rotational angular velocity in Equation (16), rad/s
ν Kinematic viscosity.
LELeading edge
TETrailing edge
PSPressure side
SSSuction side
RVSRelative vortex stretching
RVD Relative vortex dilation
CORF Coriolis force
BTBaroclinic torque
VISD Viscos diffusion

References

  1. Huang, R.; Zhang, Z.; Zhang, W.; Mou, J.; Zhou, P.; Wang, Y. Energy performance prediction of the centrifugal pumps by using a hybrid neural network. Energy 2020, 213, 119005. [Google Scholar] [CrossRef]
  2. Pei, J.; Yuan, S.; Yuan, J. Numerical analysis of periodic flow unsteadiness in a single-blade centrifugal pump. Sci. China Tech. Sci. 2013, 56, 212–221. [Google Scholar] [CrossRef]
  3. Li, X.; Chen, B.; Luo, X.; Zhu, Z. Effects of flow pattern on hydraulic performance and energy conversion characterisation in a centrifugal pump. Renew. Energy 2020, 151, 475–487. [Google Scholar] [CrossRef]
  4. Sun, H.; Luo, Y.; Yuan, S.; Yin, J. Hilbert spectrum analysis of unsteady characteristics in centrifugal pump operation under cavitation status. Ann. Nucl. Energy 2018, 114, 607–615. [Google Scholar] [CrossRef]
  5. Medvitz, R.; Kunz, R.; Boger, D.; Lindau, J.; Yocum, A.; Pauley, L. Performance Analysis of Cavitating Flow in Centrifugal Pumps Using Multiphase CFD. J. Fluids Eng. 2002, 124, 377–383. [Google Scholar] [CrossRef]
  6. Rakibuzzaman, M.; Kim, K.; Suh, S. Numerical and experimental investigation of cavitation flows in a multistage centrifugal pump. J. Mech. Sci. Technol. 2018, 32, 1071–1078. [Google Scholar] [CrossRef]
  7. Mousmoulis, G.; Karlsen-Davies, N.; Aggidis, G.; Anagnostopoulos, I.; Papantonis, D. Experimental analysis of cavitation in a centrifugal pump using acoustic emission, vibration measurements and flow visualization. Eur. J. Mech. B/Fluids 2019, 75, 300–311. [Google Scholar] [CrossRef] [Green Version]
  8. Ramirez, R.; Avila, E.; Lopez, L.; Bula, A.; Forero, J. CFD characterization and optimization of the cavitation phenomenon in dredging centrifugal pumps. Alex. Eng. J. 2020, 59, 291–309. [Google Scholar] [CrossRef]
  9. Friedrichs, J.; Kosyna, G. Rotating Cavitation in a Centrifugal Pump Impeller of Low Specific Speed. J. Fluids Eng. 2002, 124, 356–362. [Google Scholar] [CrossRef]
  10. Bachert, R.; Stoffel, B.; Dular, M. Unsteady Cavitation at the Tongue of the Volute of a Centrifugal Pump. J. Fluids Eng. 2010, 132, 061301. [Google Scholar] [CrossRef]
  11. Christopher, S.; Kumaraswamy, S. Identification of Critical Net Positive Suction Head from Noise and Vibration in a Radial Flow Pump for Different Leading Edge Profiles of the Vane. J. Fluids Eng. 2013, 135, 121301. [Google Scholar] [CrossRef]
  12. Tan, L.; Zhu, B.; Wang, Y.; Cao, S.; Gui, S. Numerical study on characteristics of unsteady flow in a centrifugal pump volute at partial load condition. Eng. Comput. 2015, 32, 1549–1566. [Google Scholar] [CrossRef]
  13. Zhu, D.; Tao, R.; Xiao, R. Anti-Cavitation Design of the Symmetric Leading-Edge Shape of Mixed-Flow Pump Impeller Blades. Symmetry 2019, 11, 46. [Google Scholar] [CrossRef] [Green Version]
  14. Zuhra, S.; Khan, N.S.; Islam, S. Magnetohydrodynamic second—Grade nanofluid flow containing nanoparticles and gyrotactic microorganisms. Comp. Appl. Math. 2018, 37, 6332–6358. [Google Scholar] [CrossRef]
  15. Khan, N.S. Bioconvection in Second Grade Nanofluid Flow Containing Nanoparticles and Gyrotactic Microorganisms. Braz. J. Phys. 2018, 48, 227–241. [Google Scholar] [CrossRef]
  16. Tan, L.; Zhu, B.; Cao, S.; Wang, Y.; Wang, B. Numerical simulation of unsteady cavitation flow in a centrifugal pump at off-design conditions. Proc. Inst. Mech. Eng. Part C J. Mech. Eng. Sci. 2014, 228, 1994–2006. [Google Scholar]
  17. Wang, Y.; Liu, H.; Yuan, S.; Tan, M.; Kai, W. Experimental testing on cavitation vibration and noise of centrifugal pumps under off-design conditions. Trans. Chin. Soc. Agric. Eng. 2012, 28, 35–38. [Google Scholar]
  18. Liu, H.; Liu, D.; Wang, Y.; Wu, X.; Zhuang, S. Applicative evaluation of three cavitating models on cavitating flow calculation in centrifugal pump. Trans. Chin. Soc. Agric. Eng. 2012, 28, 54–59. [Google Scholar]
  19. Tan, L.; Zhu, B.; Cao, S.; Wang, Y. Cavitation flow simulation for a centrifugal pump at a low flow rate. China Sci. Bull. 2013, 58, 949–952. [Google Scholar] [CrossRef] [Green Version]
  20. Li, X.; Yuan, S.; Pan, Z.; Yuan, J.; Fu, Y. Numerical simulation of leading—Edge cavitation within the whole flow passage of a centrifugal pump. Sci. Chin. Tech. Sci. 2013, 56, 2156–2162. [Google Scholar] [CrossRef]
  21. Tao, R.; Xiao, R.; Wang, Z. Influence of Blade Leading-Edge Shape on Cavitation in a Centrifugal Pump Impeller. Energies 2018, 11, 2588. [Google Scholar] [CrossRef]
  22. Fu, Y.; Yuan, J.; Yuan, S.; Giovanni, P.; d’Agostino, L.; Huang, P.; Li, X. Numerical and Experimental Analysis of Flow Phenomena in a Centrifugal Pump Operating Under Low Flow Rates. J. Fluids Eng. 2015, 137, 011102. [Google Scholar] [CrossRef]
  23. Kang, D.; Yonezawa, K.; Horiguchi, H.; Kawata, Y.; Tsujimoto, Y. Cause of Cavitation Instabilities in Three Dimensional Inducer. Int. J. Fluid Mach. Syst. 2009, 2, 206–214. [Google Scholar] [CrossRef] [Green Version]
  24. Tani, N.; Yamanishi, N.; Tsujimoto, Y. Influence of Flow Coefficient and Flow Structure on Rotational Cavitation in Inducer. J. Fluids Eng. 2012, 134, 021302. [Google Scholar] [CrossRef]
  25. Zhang, D.; Shi, L.; Shi, W.; Zhao, R.; Wang, H. Numerical analysis of unsteady tip leakage vortex cavitation cloud and unstable suction-side-perpendicular cavitating vortices in an axial flow pump. Int. J. Mult. Flow 2015, 77, 244–259. [Google Scholar] [CrossRef]
  26. Huang, R.; Ji, B.; Luo, X.W.; Zhai, Z.H.; Zhou, J. Numerical investigation of cavitation-vortex interaction in a mixed-flow waterjet pump. J. Mech. Sci. Technol. 2015, 29, 3707–3716. [Google Scholar] [CrossRef]
  27. Zwart, P.; Gerber, A.; Belamri, T. A two-phase flow model for predicting cavitation dynamics. In Proceedings of the 5th International Conference on Multiphase Flow, Yokohama, Japan, 30 May–3 June 2004. [Google Scholar]
  28. Menter, F. Review of the shear-stress transport turbulence model experience from an industrial perspective. Int. J. Com. Fluid Dyn. 2009, 23, 305–316. [Google Scholar] [CrossRef]
  29. Bardina, J.; Huang, P.; Coakley, T. Turbulence Modeling Validation, Testing, and Development; NASA Technical Memorandum: Washington, DC, USA, 1997.
  30. Reboud, J.; Stutz, B.; Coutier-Delgosha, O. Two-Phase Flow Structure of Cavitation: Experiment and Modelling of Unsteady Effects. In Proceedings of the Third International Symposium on Cavitation, Grenoble, France, 7–10 April 1998. [Google Scholar]
  31. Shen, X.; Zhang, D.; Xu, B.; Ye, C.; Shi, W. Experimental and numerical investigation of tip leakage vortex cavitation in an axial flow pump under design and off-design conditions. Proc. Inst. Mech. Eng. Part A J. Power Energy 2020, 235, 70–80. [Google Scholar] [CrossRef]
  32. Coutier-Delgosha, O.; Fortes-Patella, R.; Reboud, J. Evaluation of the Turbulence Model Influence on the Numerical Simulations of Unsteady Cavitation. J. Fluids Eng. 2003, 125, 38–45. [Google Scholar] [CrossRef] [Green Version]
  33. Coutier-Delgosha, O.; Courtot, Y.; Joussellin, F.; Reboud, J. Numerical simulation of the unsteady cavitation behavior of an inducer blade cascade. AIAAJ 2012, 42, 560–569. [Google Scholar] [CrossRef] [Green Version]
  34. Leroux, J.; Coutier-Delgosha, O.; Astolfi, J. A joint experimental and numerical study of mechanisms associated to instability of partial cavitation on two-dimensional hydrofoil. Phys. Fluids 2005, 17, 052101. [Google Scholar] [CrossRef] [Green Version]
  35. Dular, M.; Bachert, R.; Stoffel, B.; Širok, B. Experimental evaluation of numerical simulation of cavitating flow around hydrofoil. Eur. J. Mech. B/Fluids. 2005, 24, 522–538. [Google Scholar] [CrossRef]
  36. Liu, J.; Liu, S.; Wu, Y.; Jiao, L.; Wang, L.; Sun, Y. Numerical investigation of the hump characteristic of a pump–turbine based on an improved cavitation model. Com. Fluids 2012, 68, 105–111. [Google Scholar] [CrossRef]
  37. Mejri, I.; Bakir, F.; Rey, R.; Belamri, T. Comparison of Computational Results Obtained from a Homogeneous Cavitation Model With Experimental Investigations of Three Inducers. J. Fluids Eng. 2006, 128, 1308–1323. [Google Scholar] [CrossRef]
  38. Ji, B.; Luo, X.; Peng, X.; Wu, Y.; Xu, H. Numerical analysis of cavitation evolution and excited pressure fluctuation around a propeller in non-uniform wake. Int. J. Mult. Flow 2012, 43, 13–21. [Google Scholar] [CrossRef]
  39. Seo, J.; Lele, S. Numerical investigation of cloud cavitation and cavitation noise on a hydrofoil section. In Proceedings of the 7th International Symposium on Cavitation, Ann Arbor, MI, USA, 17–22 August 2009. [Google Scholar]
  40. Menter, F.R.; Kuntz, M.; Langtry, R.B. Ten years of industrial experience with the SST turbulence model. Heat Mass Transf. 2003, 4, 625–632. [Google Scholar]
  41. Lu, J.; Yuan, S.; Siva, P.; Yuan, J.; Ren, X.; Zhou, B. The characteristics investigation under the unsteady cavitation condition in a centrifugal pump. J. Mech. Sci. Technol. 2017, 31, 1213–1222. [Google Scholar] [CrossRef]
  42. Coutier-Delgosha, O.; Fortes-Patella, R.; Reboud, J.; Hofmann, M.; Stoffel, B. Experimental and Numerical Studies in a Centrifugal Pump with Two-Dimensional Curved Blades in Cavitating Condition. J. Fluids Eng. 2003, 125, 970–978. [Google Scholar] [CrossRef] [Green Version]
  43. Otsuka, S.; Tsujimoto, Y.; Kamijo, K.; Furuya, O. Frequency Dependence of Mass Flow Gain Factor and Cavitation Compliance of Cavitating Inducers. J. Fluids Eng. 1996, 118, 400–408. [Google Scholar] [CrossRef]
  44. Hunt, J.; Wray, A.; Moin, P. Eddies, Stream, and Convergence Zones in Turbulent Flows. In Proceedings of the Summer Program in Center for Turbulence Research, Stanford, CA, USA, November 1988; pp. 193–208. [Google Scholar]
  45. Liu, Y.; Tan, L. Tip clearance on pressure fluctuation intensity and vortex characteristic of a mixed flow pump as turbine at pump mode. Renew. Energy 2018, 129, 606–615. [Google Scholar] [CrossRef]
  46. Yang, L.; Guo, Z.; Cai, P.; Wang, B. Study of the Magnitude Analysis of Coriolis Force in Hydrocyclone. Fluid Mach. 2015, 43, 21–27. [Google Scholar]
  47. Wang, Y.; Zhang, M.; Chen, T.; Huang, B. Unsteady cavitating flow of liquid hydrogen around the ogive body. J. Aero. Power 2018, 33, 1845–1854. [Google Scholar]
  48. Ji, B.; Luo, X.; Arndt, R.; Wu, Y. Numerical simulation of three-dimensional cavitation shedding dynamics with special emphasis on cavitation–vortex interaction. Ocean Eng. 2014, 87, 64–77. [Google Scholar] [CrossRef]
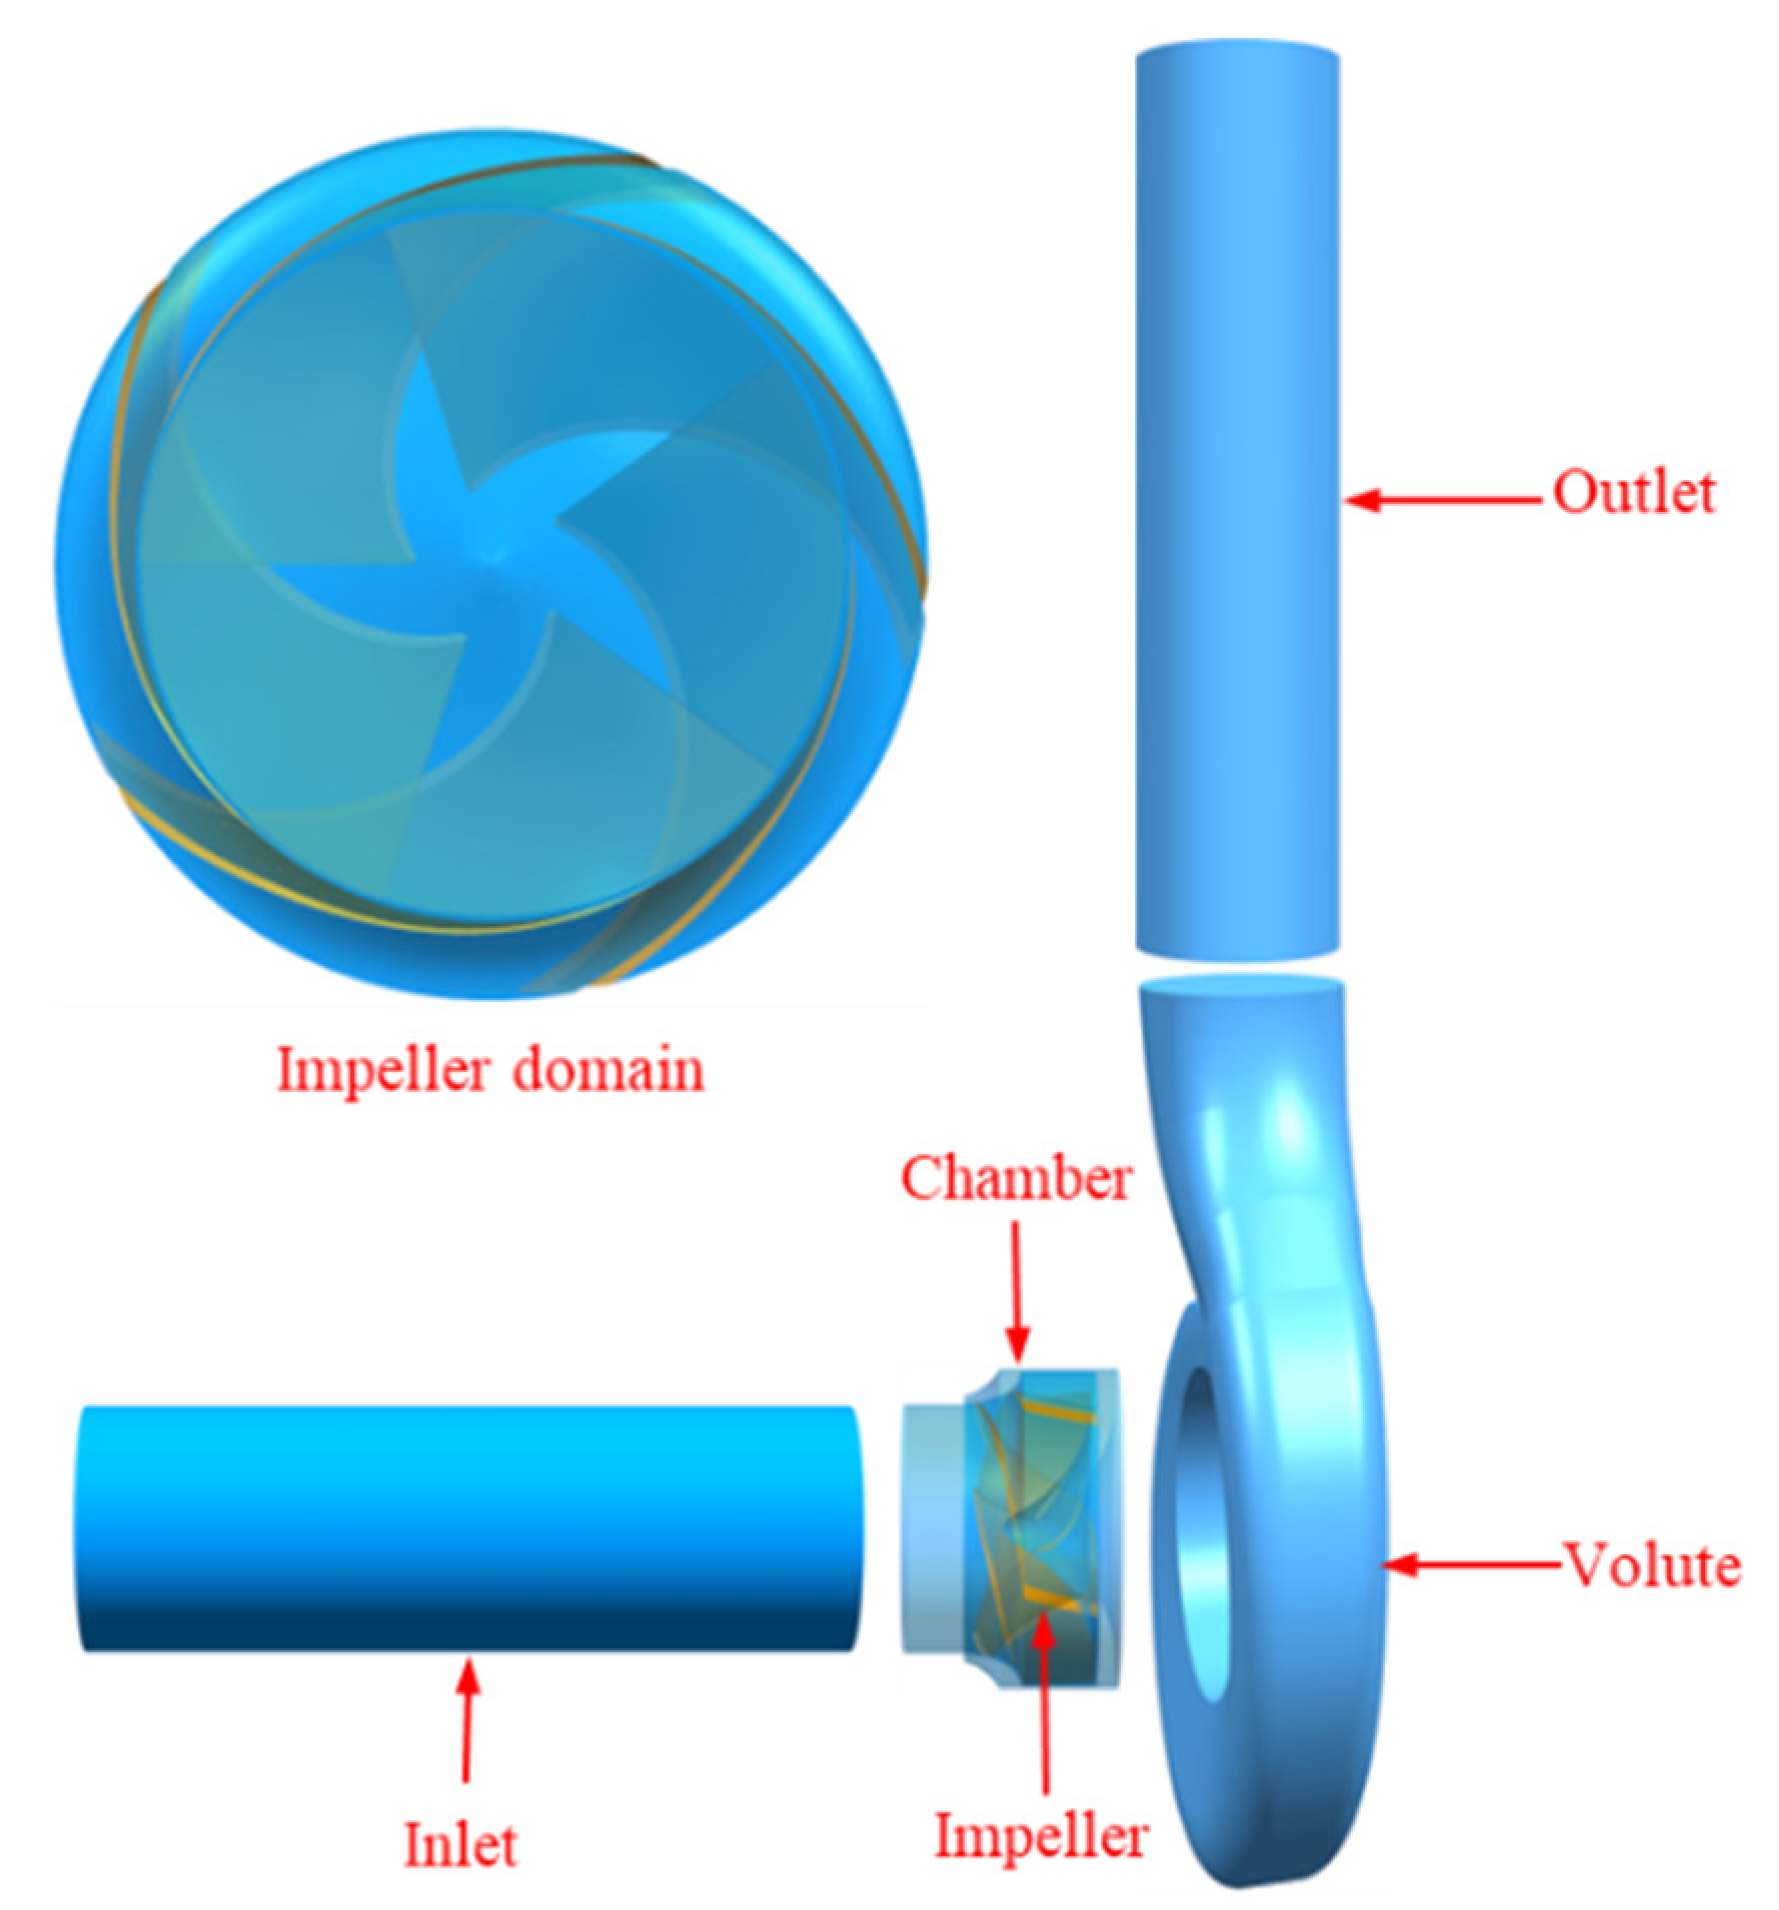
Figure 1. Centrifugal pump model.
Jmse 11 01424 g001
Figure 2. The structured hexahedral mesh of the entire domain.
Jmse 11 01424 g002
Figure 3. The centrifugal pump testing bench.
Jmse 11 01424 g003
Figure 4. Performance curves of the numerical and experimental results.
Jmse 11 01424 g004
Figure 5. Cavitation performance under flowrates of 0.6 Qopt, 1.0 Qopt, and 1.2 Qopt.
Jmse 11 01424 g005
Figure 6. Curve of cavity volume variation in the impeller with cavitation number.
Jmse 11 01424 g006
Figure 7. Cavitation patterns under different conditions at the design flowrate condition: (a) σ = 0.467; (b) σ = 0.130; and (c) σ = 0.091.
Jmse 11 01424 g007
Figure 8. Vortical structures under different cavitation numbers at the design flowrate condition: (a) σ = 0.467; (b) σ = 0.130; and (c) σ = 0.091.
Jmse 11 01424 g008
Figure 9. Streamline and cavitation distributions at a 0.8 span surface under different cavitation numbers at the design flowrate condition: (a) σ = 0.467; (b) σ = 0.130; and (c) σ = 0.091.
Jmse 11 01424 g009
Figure 10. Distributions of vorticity components ωx, ωy, and ωz at 0.8 span under σ = 0.130 at design condition: (a) ωx; (b) ωy; and (c) ωz.
Jmse 11 01424 g010
Figure 11. Distributions of vorticity components ωx, ωy, and ωz at 0.8 span under σ = 0.091 at design condition: (a) ωx; (b) ωy; and (c) ωz.
Jmse 11 01424 g011
Figure 12. Distributions of the transport terms for vorticity components ωx, ωy, and ωz under σ = 0.130 at design condition: (a) RVS; (b) RVD; (c) CORF; and (d) BT.
Jmse 11 01424 g012aJmse 11 01424 g012b
Figure 13. Distributions of the transport terms for vorticity components ωx, ωy, and ωz under σ = 0.091 at the design condition: (a) RVS; (b) RVD; (c) CORF; and (d) BT.
Jmse 11 01424 g013
Table 1. Pump parameters.
ParametersValueUnit
Impeller blades number [N]5-
Inlet pipe diameter [D1]0.270m
Outlet pipe diameter [D2]0.250m
Optimum flow rate [Qopt]550m3/h
Head [H]12.40m
Specific speed [ns]320-
Rotating speed [n]1480r/min
Table 2. Grid-independent verification.
Test CasesMesh NodesConvergence PrecisionHead (m)
Case 12,534,88410−512.63
Case 23,548,87310−512.52
Case 35,068,37210−512.51
Case 46,955,72010−512.51
Disclaimer/Publisher’s Note: The statements, opinions and data contained in all publications are solely those of the individual author(s) and contributor(s) and not of MDPI and/or the editor(s). MDPI and/or the editor(s) disclaim responsibility for any injury to people or property resulting from any ideas, methods, instructions or products referred to in the content.