Review

A Review of Marine In Situ Sensors and Biosensors

1
School of Materials Science and Engineering, Peking University, Beijing 100871, China
2
Beijing International Center for Gas Hydrate, School of Earth and Space Sciences, Peking University, Beijing 100871, China
*
Author to whom correspondence should be addressed.
J. Mar. Sci. Eng. 2023, 11(7), 1469; https://doi.org/10.3390/jmse11071469
Submission received: 14 May 2023 / Revised: 25 June 2023 / Accepted: 7 July 2023 / Published: 23 July 2023

Abstract

:
The exploration of the ocean is essential for the exploitation of marine resources and the sustainable development of human society. In order to assess both the health and the resources of the marine environment, a variety of chemical and biological sampling is needed. Traditionally, marine samples are collected on site and transported to a laboratory for analysis. Analytical methods are often tedious, and it is difficult to know the in situ real-time status. This review provides a comprehensive summary of the development of in situ chemical and biological sensors for the typical compounds in the ocean, including methane, radon, ferrous ion, carbon dioxide, microorganisms, pollutants, nutrients and seafood. Different types of sensors for each compound are highlighted, such as novel electrochemical and optical sensors. Commercial status of different sensors is introduced, and performance of representative sensors is compared and discussed deeply. The advantages and disadvantages of each sensing technique are analyzed and evaluated in detail. Finally, future prospects and work directions are presented, such as the deployment of these in situ sensors on fixed and/or moving platforms, development of microfluidic sensors and exploration of new antifouling materials and methods. This paper could serve as a resource for developing more advanced in situ chemical sensors and biosensors for marine scientific research, as well as related practical applications for monitoring marine resource exploration and exploitation and for environmental protection.

1. Introduction

The ocean contains enormous amounts of seawater, and through the general circulation of seawater, the ocean participates in numerous ecosystem regulations [1], such as global heat cycles, carbon cycles and climate systems [2,3]. Marine environments can be affected by human activities significantly such as exploration of mineral resources, dumping of waste and construction of harbors in the coastal zone [4,5]. Understanding all the factors and processes that influence the health of the marine environment is essential for the long-term protection and management of the ocean. Many chemical compounds and organisms are key to understanding the marine environment and its resources, such as methane [6,7], radon [8,9,10,11,12,13,14], ferrous ion [15,16,17,18], carbon dioxide [19,20], microorganisms [21,22], nutrients [23,24] and seafood [25,26]. The exploration and quantification of the chemical compounds and organisms in the ocean are essential for the exploitation of marine resources and the sustainable development of human society.
Traditional methods for measuring the marine analytes need to collect seawater, sediment or biota samples at the shore directly or by ship and then analyze them in the central laboratories. However, sampling locations are always limited, sampling frequency is low, and samples are easily deteriorated over time. Therefore, traditional methods are unable to monitor the distribution of analytes in space and real time. However, a wide range of spatial and temporal studies of some analytes, such as gases of radon (Rn), methane (CH4), carbon dioxide (CO2), hydrogen sulfide (H2S) and helium (He), play a significant role for better understanding key processes in the sea. Over the past few decades, the in situ approach has been increasingly used for monitoring, mapping and emergency applications. Many chemical sensors and biosensors are designed for marine analytes [27,28,29]. In situ platforms and sensors have attracted great interests due to the mechanical and operational stability, full automation, low power consumption, intelligent data collection, resistance to corrosion (including seawater corrosion and attack by biota), miniaturization and low weight. In situ platforms have been developed to achieve automated hydrological and physicochemical measurements in the field [2,4,30,31].
As illustrated in Figure 1, this review overviews many of the typical analytes and sensors for monitoring the marine environment, including the sensors for methane (Section 2), radon (Section 3), ferrous ions (Section 4), carbon dioxide (Section 5), microorganisms (Section 6), pollutants (Section 7), nutrients (Section 8) and seafood (Section 9) in the ocean. Common and novel approaches for detecting these analytes are introduced, explained and emphasized, including optical sensors (such as UV-visible light, optodes, infrared and Raman spectroscopy), chemical sensors (such as conductivity, potentiometry, amperometry and voltammetry sensors) and biosensors (such as DNA biosensors). The sensing mechanisms, performance, advantages and disadvantages of different detection methods and sensors, including point sensors and in situ sensors, are analyzed and compared. Compared to other reviews focusing on only one or several fields, such as seafood [32,33], nutrients [24,34] and carbon storage [35], this work provides a comprehensive description of commercial products and the latest development of the in situ marine sensors for different analytes. Some representative optical, chemical and biological marine sensors are summarized in the tables, and their characteristics are analyzed and compared in detail. Finally, future prospectives and work directions are proposed in the Conclusions section (Section 9).

2. Sensors for Detecting Methane (CH4)

Methane (CH4) is the second largest greenhouse gas on earth after carbon dioxide, and its warming effect is higher than that of carbon dioxide [44,45]. Methane in the ocean is primarily generated from the breakdown of organic matter [6]. Methane exists in dissolved, gaseous, hydrated or adsorbed forms. In the ocean, methane migrates via diffusion or advection [7]. In some sea areas, methane gas mainly comes from the natural gas hydrate layer in the seabed sediments, where methane escapes the seabed from the subsurface methane reservoirs on the continental shelves and the slopes of the ocean [46,47]. The natural gas hydrate is extremely sensitive to changes in temperature or pressure. In recent years, the pressure changes caused by tides or the continuous rise of global ocean temperature reduce the stability of natural gas hydrate in the seabed sediments. This causes the continuous decomposition or dissolution of methane hydrate with the release of a large amount of methane gas into seawater, and the concentration of dissolved methane in seawater is thus abnormal [6,48].
One part of the methane gas in seawater is decomposed and digested by microorganisms in seawater. This decomposition process requires a large amount of oxygen in seawater and produces a large amount of carbon dioxide, which aggravates ocean acidification and affects the total carbon amount of the global marine ecosystem and carbon cycle system [49]. Another part of methane gas is released into the atmosphere through air–sea exchange, having a significant impact on global warming [50,51].
On the other hand, natural gas hydrate (energy resource for methane) has been considered as a potential high-efficiency and cleanest burning fossil fuel in recent years [52]. The carbon dioxide produced by methane combustion is much less than that of fuel oil and coal, while the carbon quantity of methane is twice the quantity of all fossil fuels [53]. The detection of abnormal changes in seawater methane concentration is of great importance for discovering natural gas hydrate reservoirs.
Most methane measurements in the past were based on indirect or discrete sample measurements [54,55]. The traditional method for detecting dissolved methane is mainly based on gas chromatography to analyze the collected discrete water samples. However, the sample is easy to be contaminated, or methane can escape during the sample collection and retention, which would result in an error of the test result [56,57]. In recent years, bubble catcher measurements and hydroacoustic imaging technologies have been developed to derive methane flow rates [58,59]. For example, Weber et al. studied a method to estimate the methane gas flux from the seabed. It is based on acoustic mapping techniques, combing multibeam and split-beam echo sounders (Figure 2a) [60]. Jordt et al. reported a stereo-camera deep-sea sensor bubble box to observe the marine gas release sites. The system can provide bubble size distribution or fluxes for the acoustic surveys [61]. However, these sensors can only detect methane from free gas seepage and cannot map the distribution of dissolved methane.
In situ sensors can achieve real-time monitoring of dissolved methane, such as the electrochemical conductivity sensors based on semiconductor gas sensing materials [62,69], the optical sensors based on infrared absorption spectroscopy [70], Raman spectra [63] and mass spectrometry sensors [67]. Among them, electrochemical conductivity and off-axis integrated-cavity-output-spectroscopy sensing methods are commercially available.
The working principle of the electrochemical conductivity sensors with semiconductor gas sensing materials is that when methane passes through the gas liquid separation membrane and reaches the surface of the semiconductor probe (e.g., SnO2), methane electrochemically reacts with oxygen under the heating voltage, leading to a conductivity change in SnO2, and then the concentration of methane is measured. Figure 2b shows the structure of an electrochemical semiconductor methane sensor [62]. The first commercial SnO2-based in situ methane sensor was developed by Capsum company (Germany) in 1999 [71,72,73]. A polydimethylsiloxane (PDMS) membrane is used to separate dissolved gases in seawater. Methane, temperature and humidity sensing probes and other components are installed in the detection chamber. The methane gas separated by the PDMS membrane is detected by the methane sensing probe. The temperature and humidity sensor probes monitor the working temperature and humidity of the methane sensing probe, respectively. When the relative humidity inside the sensing probe reaches 100%, the sensor can be used normally. The detection range of this device is 10–4000 nM, the maximum working water depth is up to 2000 m, and the response time is usually 1–30 min. However, other gases passing through the PDMS membrane can also be oxidized on the semiconductor, which affects the stability, selectivity and detection limit of the instrument.
The optical sensors are advantageous for their characteristics of being nondestructive, rapid and highly precise. There are also many commercial products on the market with optical in situ methane sensors. The LGR company (Los gatos, CA, USA) has developed a deep water gas analyzer, which combines a dissolved gas membrane separation technology and off-axis integrated cavity output spectroscopy (Figure 2f) [36,74]. The device can detect methane from 0.7 nM to 1418.5 nM with an accuracy of 0.001 nM, a response time of 5 min and the maximum working depth of 3000 m. However, the gas-extraction membrane is easily affected by environmental conditions, showing long response time and strong hysteresis effects. Brewer et al. reported the first deep-ocean Raman in situ spectrometer (Figure 2g), which is based on the Holospec spectrometer produced by Kaiser Optical company (Ann Arbor, MI, USA) [66]. The system utilized a laser source (532 nm wavelength) and a CCD device (2048 × 512 pixel) with a 90° between the detector and the emitting source to measure the gases with a beam of 10–4400 cm−1. The system has been successfully applied to in situ detection and study of methane in deep-sea hydrothermal vents and cold springs.
In addition, many novel optical methane sensors have been reported recently. Du et al. proposed a method based on Raman spectroscopy to measure methane dissolved in water (Figure 2c) [63]. The device is based on liquid-core optical fiber (LCOF) with diode-pumped solid-state laser as the light source, which successfully detects the enrichment process of methane dissolved in water with a detection limit of below 1.14 mM. Burton et al. reported a fiber refractometer to detect methane in the deep ocean (Figure 2d) [64]. The system is based on an all-optical-fiber tip refractometry approach and the tip sensor can clearly detect the passage of methane bubbles. However, the system is easily affected by contamination, such as marine biofouling and nonbiological film deposition. Grilli et al. reported a new suboceanic detector based on absorption technology enhanced by an optical feedback cavity for in situ detection of dissolved methane in seawater (Figure 2e) [65]. It allows for a rapid response time within 30 s and a large dynamic detection range from subnmol to mM.
The miniaturization of laboratory mass spectrometry analyzers for underwater dissolved gas analysis is also a new direction in developing underwater chemical sensors in recent years [75,76]. The underwater in situ mass spectrometry analyzer is mainly composed of a filtration membrane sampling system, ionization source, mass analyzer and detection system [77]. The dissolved gas in seawater enters the vacuum analysis chamber through a PDMS membrane, and the mass spectrometer is used for the quantitative analysis of the material components [78]. Hemond et al. developed a stand-alone underwater mass spectrometer system, called “Nereus”, to enable in situ measurements of gases and vapors dissolved in seawater at a several ppb, such as atmospheric gases, biological gases and hydrocarbons (Figure 2h) [67]. Gentz et al. reported a low-power underwater cryotrap-membrane-inlet system-coupled mass spectrometer (Figure 2i) [68]. The entire system can be operated at −85 °C. The energy consumption of the system is less than 10 watts. By reducing the water vapor in the analysis line by more than 98% through the cryogenic membrane, the detection limit of the target gas can be significantly improved. The detection limit for methane was lowered from 100 to 16 nM. However, these sensors are only in the laboratory stage, and no products have reached commercialization.
Table 1 shows the characteristics of several representative commercial and uncommercial in situ marine methane sensors. In conclusion, traditional methane sensing techniques are based on indirect sample measurements with the possibility of methane escape and relatively low sensing accuracy. The sensing accuracy of electrochemical conductivity sensors is easily affected by other gases passing through the gas permeable membrane. The electrochemical semiconductor conductivity sensing method has reached commercialization, but its stability, selectivity and detection limits of the instrument are easily affected by other gases. Mass spectrometry analyzer is also a research direction, but its cost and power consumption are high, and the device size is relatively big. Recent advances in optical sensors are prospective for in situ dissolved methane sensing due to its advantages of no gas-extraction step and relatively high sensitivity and stability. More efforts for developing in situ methane marine sensors should be made to reduce the device size, minimize the internal device volume, avoid the methane consumption in the sensing process, reduce the interferences of other gases and increase the sensor stability to meet the requirements of sensing in the changeable marine environment.

3. Sensors for Detecting Radon (Rn)

Radon, an inert nonchemical reactive gas, is essential for understanding important processes in the marine environment since its concentration changes as a result of physical activities. In aquatic and marine environments, radon is valuable as a tracer of specific geophysical processes, such as measuring air/sea gas piston velocities and looking for groundwater flows into surface waters [80,81]. The half-of of radon-222 (3.83 day) is much longer than that of radon-219 (3.96 s) and radon-220 (55.6 s) [82], so radon-222 is suitable for being measured and used in studies, such as diffusion from sediments [83], earthquake studies [84], submarine groundwater discharges [9,14], land–sea interaction [85], springs [86], carbon dioxide capture and storage tasks [87], air–sea interaction [88], greenhouse gas emissions and climate change [89], energy resources (especially in the deep sea) [90].
Traditional radon measurement methods typically use liquid scintillation counting in the lab [91] or extracting the radon from water samples by a radon extraction line system, transferred to Lucas alpha scintillation cells and then measured by a counting system after being sealed for three hours to allow the radon-222 progenies (218Po, 214Po) to reach radioactive equilibrium [92]. This technique has the advantage of maximal measurement efficiencies that are close to 300%, and it has been extensively used in numerous international research programs [93,94]. However, this method takes time and can pose a lot of logistical challenges.
In recent years, many novel in situ sensors and detection systems have been reported for continuous radon measurements in the marine environment, such as the RAD-7 radon-in-air monitor system and gamma-ray spectrometer. Burnett et al. reported an automated radon-222 analyzing system for estimating the dynamics of groundwater input into the coastal zone (Figure 3a) [9]. The system detects radon-222 from a continuous stream of water (powered by a submersible pump) passing via an air–water exchanger that distributes radon from a flowing water flow to a closed air loop. The air stream is directed into a commercial RAD-7 radon-in-air monitor (Durridge Co., Inc. Bedford, MA, USA), which collects and measures the α-emitting daughters, Po-214 and Po-218, to ascertain the concentration of radon-222. Tsabaris et al. reported an underwater cerium-bromide-based gamma-ray spectrometer for in situ radioactivity measurements (Figure 3b) [11]. The system is deployed in the aquatic environment along with a conductivity–temperature (CT) sensor, which can be used to detect radon-222 daughters (Bi-214 and Pb-214) in the aquatic environment. The system’s energy resolution significantly outperformed conventional spectrometers by roughly 50%. The operation depth of the device is 400 m, and the maximum depth can reach 600 m. Similar to this system, in situ gamma-ray spectrometer KATERINA [12], the upgraded KATERINA for measuring radioactivity in the deep ocean [13], and the gamma-ray spectrometry for in situ measuring of multiple submarine springs [10] have been also reported.
In addition, sensing systems based on a pulsed ionization chamber are also popular and attractive for detecting radon. Li et al. reported an automated pulsed ionization chamber Oceanic Rn monitor (PIC-ORn) measurement system to measure dissolved radon in the surface ocean (Figure 3c) [82]. Compared to the commercial RAD-7 sensor, the system measuring efficiency is around two times higher and less impacted by relative humidity with lower cost and power consumption. Similarly, Zhao et al. proposed an in situ submersible radon (OUC-Rn) measurement system that integrated a commercial pulsed ionization chamber (PIC) radon sensor and gas extraction membrane module (Figure 3d) [8]. The system was successfully deployed in 2.5 m bay water depth over a 100 h period to observe submarine groundwater discharge with high temporal resolution and twofold measurement efficiency than RAD-7.
Table 2 shows the characteristics of several representative uncommercial in situ marine radon sensors. The time-consuming logistical requirements of collecting and analyzing samples have hindered the ability of traditional methods to make regional-scale and long-term temporal assessments. The commercial RAD-7 radon-in-air monitor sensor is popular for continuous radon measurements in marine, but its sensitivity and accuracy are easily affected by the humidity in its chamber. The gamma-ray spectrometer and pulsed ionization chamber radon sensor may be the future development direction, which can be fixed on platforms, such as buoys, autonomous underwater vehicles and gliders, remotely operated vehicles (ROVs), etc. However, to make sure that the pressure drops to the proper range prior to water entering the extraction module, it would be essential to construct a pressure-tight system for these systems in deep sea measurements.

4. Ferrous Ion (Fe2+) Sensors

Iron (Fe) is abundant in the earth’s crust, about 5.04%, next only to oxygen (0), silicon (Si) and aluminum (A1). The chemical valence states of iron in seawater are mainly ferrous ion and ferric ion, of which ferrous ion is extremely unstable and easy to reduce to Fe3+ [95,96]. In marine sediment, iron is one of the essential redox sensitive elements, and plays a key role in many biogeochemical reactions and processes, such as phosphorus release and bioavailability, sulfur cycling and remineralization of organic matter [15,16,17,18]. For example, in the ocean, although the concentration of biologically available dissolved iron is low, it controls nitrogen fixation and growth of phytoplankton, further influencing ocean–atmosphere carbon dioxide exchange and global climate change [97]. Some scientists have proposed the following opinion: if a certain amount of iron is added to the ocean, it will promote the growth of phytoplankton and accelerate the penetration of carbon dioxide from the surface to the deep ocean, which is beneficial for reducing the atmospheric carbon dioxide content, thus alleviating the greenhouse effect [98,99]. However, if the iron concentration exceeds the physical requirements, it would be toxic and act as the enzyme inhibitor, and it can cause oxidative injuries and abnormalities in Fe metabolisms of different biological activities [100,101]. Therefore, the accurate determination of Fe ions in the ocean is very meaningful and important for biogeochemical studies.
The gradient of Fe ions’ concentration distribution is very large in sediment, varying from hundreds of micromolar over millimeter to centimeter vertical scales [102,103]. However, their concentrations are very low in seawater, ranging from 0.1 to 10 nM, which poses a great challenge for their accurate determination [104]. Conventional methods for detecting dissolved Fe ions are based on atom absorption spectrometer (AAS), inductively coupled plasma mass spectrometer (ICP-MS) and spectrophotometer for analyzing the sampled pore water [105,106]. However, the sampling process is arduous and time-consuming, and ferrous ions are easily oxidized in the air, which would destroy the natural distribution of ferrous ions in sediments [107,108]. In addition, although there are significant improvements in the determination of Fe in seawater using these laboratory methods, the expensive and cumbersome equipment and complex treatment process, restrict their use to in situ detection.
Many techniques have been developed for sensing Fe ions in situ, including electrochemical methods, diffusive equilibrium in thin-film (DET) or diffusive gradients in thin-film (DGT) technique and optical methods. Among them, the sensors based on a voltametric microelectrode have been commercially available, and other methods are only in the lab stage.
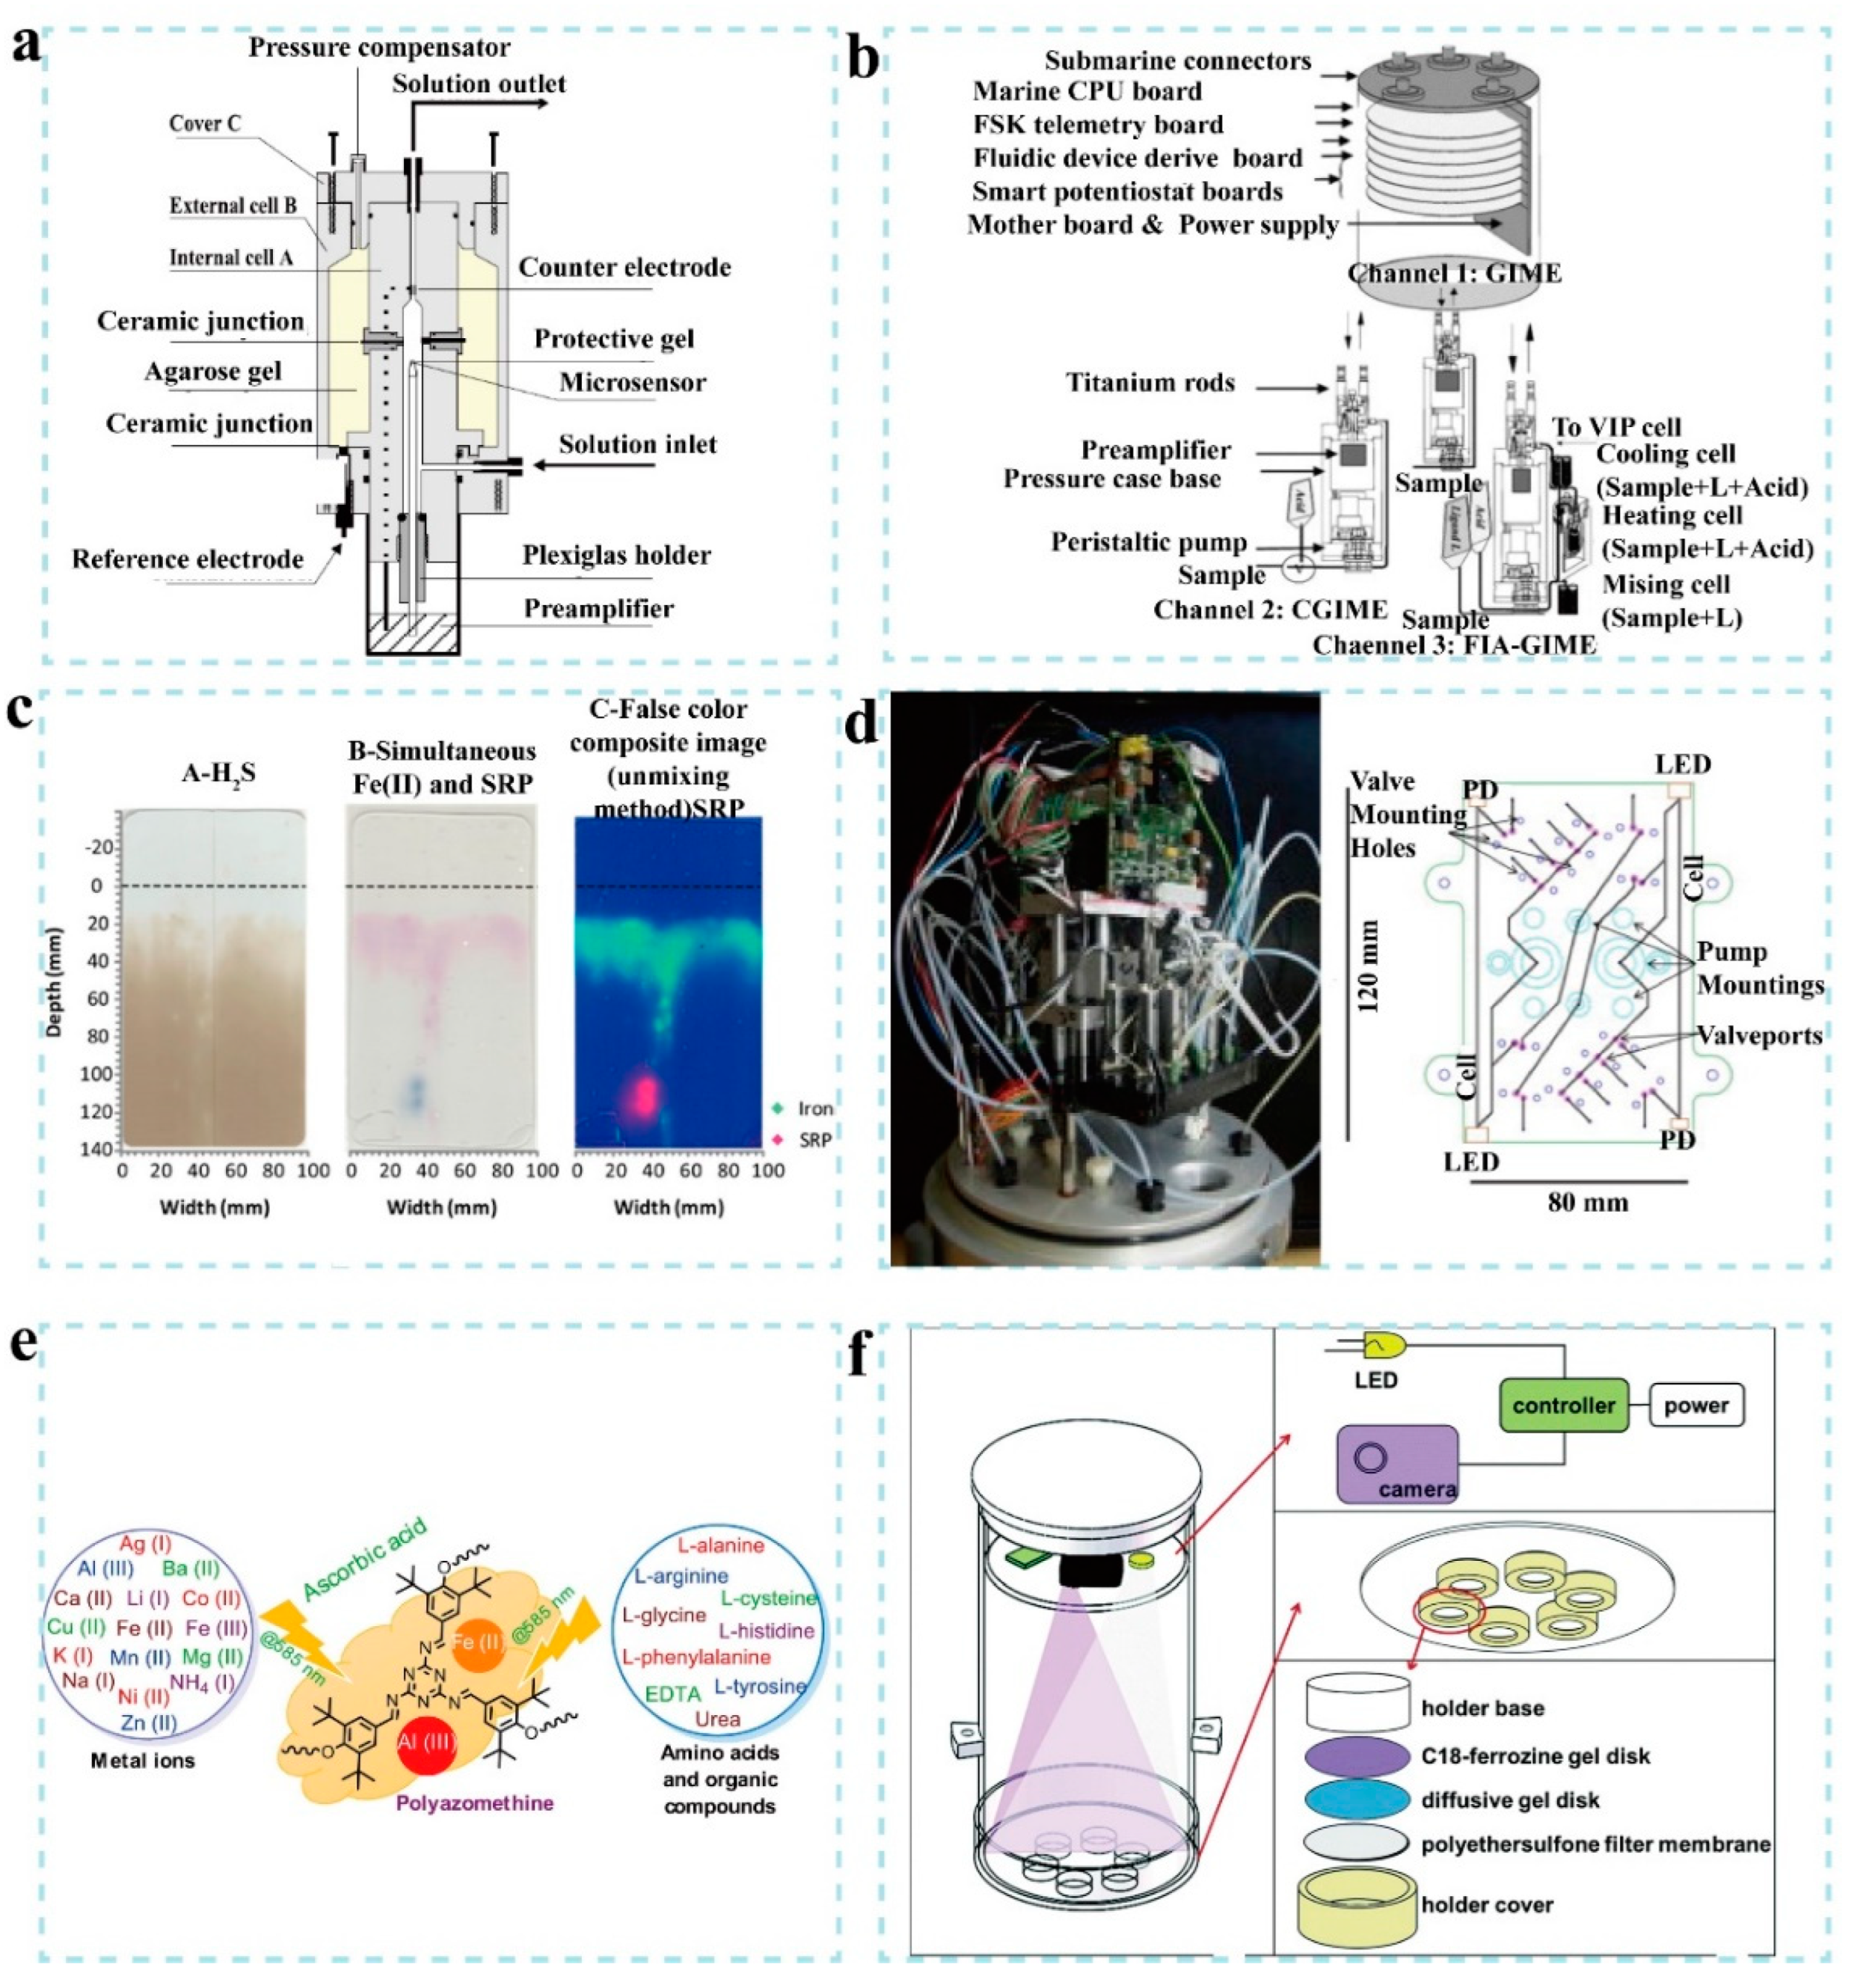
An alternative to conventional methods is based on electrochemical microelectrodes that analyze vertical and spatially interpolated profiles of sediments with submillimeter resolution [109]. Tercier-Waeber et al. reported a submersible voltammetric probe that can achieve the in situ real-time measurement of ferrous ions in sediment–water interface (Figure 4a) [110]. It is composed of a microelectrode array, a voltammetric probe and a single potentiostat. The microelectrode is made of Hg-plated-Ir and covered with agarose gel to avoid the surface fouling [111]. The detection is based on a squarewave cathodic stripping voltammetry, resulting in a response time of 5–10 min and a detection limit of 0.1 μM. The system has been commercialized for in situ measurement of trace metals [112,113]. More recently, a submersible multiphysicochemical profiler system was constructed for in situ analysis of trace metals in different estuaries and coastal waters (Figure 4b) [114]. It improved the former one and is composed of three different flow-through cells for measuring dynamic metal species and free metal ions. The system allows for 8 days of continuous analysis without the need to update the sensor. However, the surface of the electrode can be easily deactivated and the detection accuracy decreases with the addition of organic compounds in the sediment [115,116,117].
Another method is based on the diffusive equilibrium in thin-film (DET) or diffusive gradients in thin-film (DGT) technique, and it is an in situ sampling method for trace metals [106,121,122,123]. The principle of DET is similar to dialysis, and it uses a hydrogel (95% water content) as the sampling medium. The diffusion of DET is driven by the concentration gradient of the hydrogel (diffusion phase) and the target analyte in the external water body. As the diffusion process progresses, the concentration gradient decreases continuously until it reaches zero, and the sampling process is completed after the diffusion equilibrium is reached. The DGT technique is similar to the DET, and both are based on the Fick’s first law of diffusion. The DGT technology separates the ion exchange resin from the sampling solution through the ion permeable hydrogel and realizes the quantitative accumulation and measurement of the target analyte by controlling the ion exchange process through the hydrogel. Both DET and DGT are in situ passive sampling techniques, and the sampling time is usually within several hours [124,125,126]. It can also be combined with colorimetric methods to measure the distribution of Fe ions in sediments [118,127]. For example, Pages et al. proposed a colorimetric DET method for the 2D measurement of co-distributed iron(II) and sulfide in seagrass sediment porewaters [127]. Cesbron et al. combined the DET and spectrophotometric approaches to achieve the 2D image of dissolved iron and phosphate in sediment pore water, as shown in Figure 4c [118]. The advantages of this system are its sub-millimeter detection (60 μm imaging acquisition per pixel) and high spectral resolution (4.5 nm).
In addition, novel optical methods, such as planar optical sensors and microfluidic in situ analyzers, have been reported in recent years for detecting Fe ions in sediments and seawater [37,128]. Milani et al. developed a microfluidic in situ analyzer for measuring dissolved Fe in vertical profiles and aquatic environments (Figure 4d) [37]. The system combines microfluidic methods and a spectrophotometric sensor, and the mixed process of reagents and samples is based on a novel in-cell diffusion process. The core of the system is the colorimetric microfluidic chip as illustrated in the right image of Figure 4d. The chip is fabricated on the tinted PMMA (poly methyl methacrylate) with a light source of super-green-light-emitting diodes, and samples and reagents are further injected and mixed in the chip. For detecting Fe ions, the ferrozine (FZ) molecule and the sample containing Fe ions are injected into the chip to form a red-purple complex (Fe(II)(FZ)3), and the maximum absorbance of the resulting complexes is measured at 562 nm. The detection limit for dissolved Fe is 27 nM with a precision of 2.8%. Kamaci et al. studied a polyazomethine/ascorbic-acid-based fluorescent chemical sensor for measuring Al3+ and ferrous ions (Figure 4e) [119]. The detection limit for ferrous ions is 0.185 mM, and the device was demonstrated for measuring seawater samples. Zhu et al. reported a novel planar optical sensor for revealing the two-dimensional distribution of dissolved ferrous ion [128]. Guo et al. reported a novel device for in situ monitoring of dissolved Fe(II) in sediment pore water (Figure 4f) [120], by integrating sampling, enrichment and quantitative measurement. It is composed of a concentrating device based on C18-ferrozine and an optical imaging device. The sensor is installed on the ferrous ion indicator of ferrozine and transparent poly(vinyl alcohol) membrane for measuring the absorbance. The linear detection range for ferrous ions is from 0 to 200 μM with a detection limit of 4.5 μM, and the response time is 10–30 min.
Table 3 shows the characteristics of several representative commercial and uncommercial in situ marine ferrous ion sensors. Many novel electrochemical and optical sensors with low cost and low maintenance have been reported in recent years for sensing ferrous ion in marine conditions. However, the surface of the microelectrodes of electrochemical sensors is easily deactivated and the accuracy is influenced by other organic compounds in the sediment. The optical sensing method is relatively complex and immature. Therefore, there are no devices to reach commercialization or practical applications so far. The low concentration of ferrous ions in seawater, easily fouled by organic matter/biofouling, and complex sample treatment procedures are big challenges to be overcome. The DET or DGT are in situ sampling methods and suitable for combining with other sensing techniques. There is still a high demand for developing new and accurate Fe-ion analytical methods with high sensitivity, fast response, minimal sample treatment and long-term operation stability, especially for in situ measurements. It is prospective for in situ sensors to be operated wirelessly and remotely to achieve the real-time analysis of iron and iron speciation.

5. Sensors for Carbon Dioxide (CO2)

With the increasing emissions of carbon dioxide, the carbon dioxide levels in seawater continue to increase. It has been demonstrated that more than one quarter of carbon dioxide emissions finally entered into the ocean. Therefore, the ocean is the major gathering place of carbon dioxide [19,20]. The oceanic uptake of anthropogenic carbon dioxide can lead to a decrease in seawater pH and alter the ocean carbonate system significantly [129,130,131]. Six parameters are used to describe the ocean carbon dioxide and ocean carbonate system; they are total alkalinity (TA), dissolved inorganic carbon (DIC), pCO2, pH, bicarbonate ionic concentrations and carbonate ionic concentrations. Among these, pCO2 and pH are usually used for the analysis [132]. The routine seawater samplings and measurements in the laboratories are time-consuming and laborious. The sustained, autonomous, in situ measurements are more promising to provide enhanced spatial and temporal data [133,134].
Most sensors for the carbon dioxide measurements are based on four technologies: gas analysis, electrochemical, wet-chemical and fluorescent optode measurements. Among them, only the gas analysis sensor has been commercially available. Gas sensors can transfer the seawater carbon dioxide into the gas phase for analysis, and the equilibrator is the key device of the gas sensor for carbon dioxide transmissions, including bubbler, shower type, laminar flow and percolated-bed types [135,136,137,138]. The membrane-based equilibrator is more compact and suitable for in situ deployment, but the membrane is easily affected by pressure variations at different sea depths, followed by influencing the response time. The electrochemical measurements rely on the pH sensors to measure the carbon-dioxide-induced-pH change [139,140]. The pH measurement often performed using potentiometric microelectrodes. However, the accuracy of these sensors is only accurate to ±0.01 pH units [27]. The ideal pH measurement needs to be accurate to 0.001 units to meet the accuracy requirements [141]. The wet-chemical methods are usually based on the spectrophotometric system to measure the pH change in the seawater, which is determined by the absorbance of seawater with the addition of the colorimetric pH indicators [142,143]. There are several challenges for in situ spectrophotometer deployment, including the light source instability, the gas separation membrane deterioration and ease to be biofouled. The optodes for detecting the dissolved carbon dioxide in seawater are primarily based on the analyte-sensitive indicators in the gas permeable membranes [133]. Optodes have been deployed at marine for in situ measurements, with the advantage of low-power requirements, no mechanical parts and reagents requirements and no waste production.
By far, the most common carbon dioxide sensor for measurements in water is the gas analyzer, involving a gas permeable membrane for the diffusion of carbon dioxide and an infrared sensor. The Hydro CTM/CO2 sensor developed by CONTROS company is based on this principle, and it is a successful commercial marine dissolved-gas in situ-detection device, which has been deployed on various fixed or mobile platforms for in situ carbon dioxide observations [144]. As seen in Figure 5a, the core component of this device includes a gas–liquid separation device and an infrared absorption spectrum detection device [39]. The gas–liquid separation device is mainly composed of a semipermeable membrane with a silicone active layer that allows for the diffusion of carbon dioxide and separates the ambient water from the device. The detection of carbon dioxide is based on the nondispersive infrared spectrum with a range of 0–200 mM, a resolution of <33.4 nM, a response time of 60 s and a working water depth of 0–6000 m [145]. However, the response time of the device is long due to the diffusion process of carbon dioxide. In addition, the detection performance of this device is mainly determined by the materials and thickness of the semipermeable membrane. The leakage of the carbon dioxide gas stream in the semipermeable membrane is the major source for measuring errors. Therefore, it is necessary to improve the membrane in order to reduce the diffusion time and gas leakage.
In the recent two decades, many novel sensors for the carbon dioxide measurements have been reported [149,150,151]. For example, Lu et al. reported an in situ chemical pCO2 sensor based on optical fiber for surface seawater (Figure 5b) [143]. A PVC tube with an enclosed Teflon AF tube is used as the long pathlength gas permeable liquid-core waveguide for spectrophotometry, further analyzing the pH change caused by CO2. The detection time is only 2 min, and its accuracy reached 0.26–0.37% at pCO2 of 200–800 μatm. Atamanchuk et al. reported a compact, low-power and long-life optode for measuring pCO2 (Figure 5c) [38]. The service life of the sensor can reach more than 7 months underwater, and the best obtained accuracy can reach ±2 μatm in the pCO2 range of 200–1000 μatm. Zhu et al. proposed a ratiometric planar optode fluorosensor for 2D imaging of pCO2 distribution in sediments and overlying water (Figure 5d) [146]. The device can measure pCO2 patterns with pixel sizes ranging from 55 × 55 μm to 10 × 10 μm over an area of more than 150 cm2. The average relative difference between the sensor and reference pCO2 is −0.31% over a range of 0–20 matm. Graziani et al. reported the in situ, continuous monitoring of pCO2 at the coast of Panarea Island (Italy) by using a small and low-cost GasPro probes, as shown in Figure 5e [147]. For all these sensors used for in situ carbon dioxide analysis, temperature cross-sensitivity is an issue, requiring additional temperature measurements [133]. Borisov et al. proposed a planar optical sensor for the simultaneous detection of oxygen, carbon dioxide, pH and temperature (Figure 5f) [148]. It combined multi-layer materials and two spectrally independent dually sensing systems.
Table 4 shows the characteristics of several representative commercial and uncommercial in situ marine CO2 sensors. In summary, the most common carbon dioxide sensing technology is based on the combination of a gas permeable membrane and an infrared sensor. However, the performance of this method depends on the quality of the membrane which is susceptible to chemical and physical impacts. The leakage of carbon dioxide from the membrane is the main source of error in detection. Other electrochemical and wet chemical methods also have disadvantages, such as low accuracy, instability and susceptibility to biological folding. Many novel chemical and optical sensors have been reported in recent years, but their performance needs further evaluation. Optodes are prospective for in situ carbon dioxide measurements in monitoring oceanic and coastal waters, due to their low cost, low power consumption and device miniaturization. However, optodes are still in the initial stage of development, and future directions should focus on the reducing response time, reducing salinity dependency and improving stability.

6. Sensors for Detecting Marine Microorganisms

Species identification and microorganism detection are important areas for molecular biology. The rapid identification of aquatic microorganisms is meaningful for understanding coastal dynamics and marine ecosystems [21,22]. The biosensors for detecting planktonic organisms (especially for detecting toxic algae) and pathogens have been developed rapidly in recent years [152].
Toxic algae are the main toxin producers in the ocean, and they have threatened many areas around the world [153,154]. For example, Alexandrium tamarense and A. ostenfeldii algae can generate potent neurotoxins that are filtered by shellfish from the water for food and accumulated in shellfish, which become toxic to humans (and other animals) who then eat the shellfish [155]. Even very small numbers of toxic species (a few hundred cells per liter) can be enough to make shellfish toxic to humans. With whole-cell fluorescent in situ hybridization, the PCR-based assays and sandwich hybridization assays were successfully demonstrated to measure these planktonic organisms, but these methods need the samples to be transported to specialized laboratories and rely on the trained handlers and expensive equipment [156,157,158].
Diercks et al. reported a multi-biosensor chip for in situ detection of toxic algae (Figure 6a) [159]. The biosensors consisted of an array of 16 gold electrodes for detecting up to 14 target species simultaneously. McCoy et al. reported a multiplex surface plasmon resonance biosensor for monitoring the toxic bloom of Alexandrium minutum algae on the coast [160]. The detection results showed an obvious consistency with those from a light microscope. Toldra et al. proposed an electrochemical DNA biosensor for detecting Ostreopsis cf. ovata [40]. As shown in Figure 6b, isothermal recombinant polymerase amplification and sandwich hybridization are used to detect this species on electrode arrays with maleimide-coated magnetic beads. The biosensor showed the detection results in planktonic and benthic environmental samples similar to that with the qPCR and colorimetric assay methods.
Apart from the toxic algae, marine pathogens, including viruses, bacteria and protozoa, can cause the contamination of seafood, finally resulting in human infections [163,164]. Some pathogens originate from natural marine waters, such as the cholera bacterium and Vibrio cholera [165], while some others, such as fecal streptococci and escherichia coli, originate from defecation/urination/shedding of human or animal hosts and are carried via rivers or sewage effluent into coastal water [166]. For measuring these pathogens, there is no universal method due to their physical structure differences between different pathogens. One promising method is based on DNA biosensors [167,168,169].
Some novel biosensing platforms have been developed in recent years. For example, Liu et al. reported a rapid, high-throughput, portable and easy-to-operate fish-based microfluidic platform (Figure 6c) [161]. The system can simultaneously detect waterborne pathogens and evaluated their infection potential. Liu et al. reported a lateral-flow DNA-aptamer-based biosensor for detecting Singapore grouper iridovirus (SGIV) (Figure 6d) [162]. Two DNA aptamers against SGIV-infected cells were used for SGIV detection, one for target isolation and the other for the strand displacement amplification reaction. Compared to the PCR methods, the method does not need sophisticated equipment, and takes no more than 90 min for the detection.
Table 5 shows the characteristics of several representative in situ and non-in situ uncommercial marine microorganism sensors. The detection of marine microorganisms is based on biosensing technology. Toxic algae and pathogens are the most common marine microorganisms of concern, but there are no universal detection methods. Various electrochemical and optical methods and devices have been reported in recent years. However, most of the reported sensors were only tested in the laboratory, and the field testing is necessary. DNA-biosensor-based electrochemical and optical methods are the promising direction due to their specificities, and more efforts should be made to optimize their efficiency, performance, sensibility, detection limits, versatility, sophistication and automation.

7. Sensors for Detecting Marine Pollutants

Apart from the unsustainable exploitation of biological resources, human activities have brought many pollutants to the ocean in the past decades as well [170,171]. In most cases, these contaminants enter the seawater from land-based sources through industrial or urban activities and riverine inputs. Oil and gas exploitation and ship activities can release chemical contaminants directly into the marine environment [172,173]. Main pollutants in seawater include stable trace elements (e.g., cadmium, lead, mercury and tin), organic compounds (e.g., microplastics, pesticides, veterinary medicines and pharmaceuticals), hydrocarbon pollutants (e.g., fuel and oil) and radionuclides [172,174,175]. Figure 7a illustrates the origin and release of pollutants into the marine environment [176]. The sources, concentration, distribution and persistence of these contaminants can significantly affect the ecosystem [177,178]. Selective and sensitive monitoring of these pollutants is a pressing issue in marine research and is critical to the protection of the marine environment [179]. This section will focus on the traditional sensing measurements of marine pollutants and introduce some representative novel sensors and biosensors, such as screen-printed biosensors, microfluid-based automatic sensors and surface-enhanced Raman scattering sensors.
The main strategies for assessing the marine environment are based on sampling, observation and measurements. Ships conduct sea sampling and transmit these samples to the laboratory or on board. The difficulties in measuring the marine contaminants are their low concentrations. Therefore, the sensors should be able to detect these analytes at the ng/L or pg/L levels [183,184,185]. Some conventional analytical methods have been applied for the detection of pollutants [186]. For example, the detection of organic contaminants in seawater samples is mainly based on chromatography, including liquid chromatography and gas chromatography. Mass spectrometry is also widely used for environmental screening purposes [187,188]. In addition, several platforms, such as satellites, submersibles and drifters, have been constructed for automated measurements. These methods are based on direct sampling, airborne and satellite imagery and remote sensing techniques [179]. Most of remote and automated measurements are based on monitoring changes in the parameters of seawater such as temperature, conductivity, depth and turbidity [31].
In addition, some novel chemical sensors and biosensors have recently been developed for monitoring contaminants [189,190,191]. For example, Malzahn et al. reported a wearable screen-printed biosensor on a synthetic rubber neoprene underwater garment (Figure 7b) [41]. The biosensor can be used for monitoring the trace heavy metal contaminants, nitroaromatic explosives and phenolic contaminants in seawater samples. Han et al. fabricated a fully automatic whole-algae biosensor with a digital microfluidic diluter chip and an actuation element (Figure 7c) [180]. The biosensor can be used for detecting copper, lead, phenol and nonylphenol in seawater with the detection limits of 0.65 μM, 1.90 μM, 2.85 mM and 5.22 μM, respectively. Knopfmacher et al. reported a microfluidic chip integrated with a marine phytoplankton motility sensor for evaluating pollutant toxicity (Figure 7d) [181]. Two mobile marine phytoplankton cells were confined in the device, and their motilities were used as the sensor signal to achieve the high-throughput detection of Hg, Pb, Cu and phenol. Pfannkuche et al. utilized a surface-enhanced Raman scattering sensor system to detect polycyclic aromatic hydrocarbons in the Baltic Sea, as illustrated in Figure 7e [182]. The detection results were consistent with the those of GC/MS. Peron et al. also reported a surface-enhanced Raman scattering based on gold colloidal monolayer [192]. The device was used to achieve in situ analysis of naphthalene and pyrene in artificial seawater with detection limits of 10 ppb. Kolomijeca et al. also reported a portable on-board surface-enhanced Raman spectroscopy sensor system for monitoring polycyclic aromatic hydrocarbons, such as anthracene and fluoranthene [193]. The detection limit is 0.3 nM with a response time of 10 s.
Table 6 shows the characteristics of several representative in situ and non-in situ uncommercial sensors for detecting marine pollutants. As mentioned above, most of these novel sensors and biosensors developed in recent years are based on electrochemical or optical principles. These sensors are advantageous for their portability, field deployability and ease of fabrication. However, their performance in detecting analytes in real marine samples or the real marine environment needs further evaluation, including their analytical sensitivity, selectivity, detection limit, repeatability and reproducibility. Future research direction should focus on developing high-quality sensors and biosensors for continuous and in situ monitoring of contaminants rather than detecting such analytes at a particular sampling site and time. The microfluid technique can be integrated with these sensors for improving their performance.

8. Sensors for Detecting Marine Nutrients

The nutrients in the ocean, such as nitrate, phosphate and silicate, are essential for promoting the growth of microorganisms [23,24]. With accelerated urbanization, industrial and agricultural development, many nutrients are being discharged into the marine environment through industrial wastewater, agricultural waste and domestic sewage [194,195]. Eutrophication is one of the most challenging marine environmental problems, which can lead to harmful marine blooms and red tides [196,197]. Measuring these nutrients are meaningful for predicting the harmful events associated with eutrophication, monitoring marine productivity and understanding the dynamics of marine ecosystems [30,198].
Traditional methods for monitoring the nutrients rely on seawater sampling and transporting to a laboratory for standard analyses, such as spectrophotometry, colorimetry and fluorescence [199]. These methods make it difficult to determine the distribution and variation of the nutrients and identify transient marine events [200,201,202]. In addition, most of the conventional methods can only detect a concentration (nitrate, phosphate and silicate) higher than 0.1 μM, while for some oligotrophic regions, the concentration is at the nM level [27,203]. Therefore, an in situ automatic sensor with a better detection limit that can be used for long-term and continuous measurements is a promising alternative for the marine environment disaster warning systems.
According to the principle of testing, the in situ sensors for the marine nutrients are classified into colorimetric, optical and electrochemical devices [204]. Some in situ electrochemical sensors have been on the market, such as Micro-Lab, EcoLAB2 and CYCL phosphate sensors (Wetlabs, Zatto Lane Danville, WV, USA), SUNAV2 (Satlantic, Halifax, Nova Scotia, Canada) and WIZ sensors (SYSTEA, Anagni, Italy) [205,206]. However, the low accuracy, short duration, narrow detection concentration range and poor repeatability of these sensors limit their widespread use [207,208]. At a specific wavelength, the colorimetric sensor detects the analyte based on the color response, and it requires a large volume of reagents and a high power consumption. Therefore, they are not suitable for long-term monitoring applications [209]. Comparatively, the reagentless ultraviolet (UV) optical sensors based on direct UV absorption are appropriate for continuous monitoring applications [210].
In recent years, many novel in situ sensors and devices have been reported for monitoring marine nutrients [211,212]. Legrand et al. developed an autonomous electrochemical sensor for in situ silicate detection in marine environments (Figure 8a) [42]. A detection range was obtained from 1.63 μM to 132.8 μM with a detection limit of 0.32 μM and a quantification limit of 1.08 μM. Altahan et al. improved a commercial automated sensor for detecting phosphate, silicic acid, nitrate and nitrite in seawater simultaneously (Figure 8b) [213]. The analyzer showed an excellent accuracy with a deviation of 8.9% for phosphate, 4.8% for silicic acid and 7.4% for nitrate plus nitrite. Cuartero et al. proposed an in situ potentiometric device for the detection of nitrate, nitrite and chloride in seawater, which consists of a desalination unit, an acidification unit, a sensing flow cell and all-solid-state membrane electrodes (Figure 8c) [214]. It showed a fast response time of fewer than 12 s, an excellent stability with a long-term drift of less than 0.5 mV/h and an excellent reproducibility with a deviation of less than 3%. Barus et al. reported an in situ phosphate sensor for seawater based on a squarewave voltammetry (Figure 8d) [215]. The sensor was tested in a small volume (<400 μL), showing a 0.25–4 μM detection range with a 0.1 μM detection limit. Machado et al. studied a cost-effective bioluminescence sensor for real-time monitoring of marine nitrate [216]. The biosensor is based on the self-bioluminescent strain of the cyanobacteria Synechococcus elongatus pcc 7942, and it can detect nitrate at a concentration as low as 16.3 μM.
Table 7 shows the characteristics of several representative in situ uncommercial sensors for detecting marine nutrients. In situ sensors for marine nutrients should have high sensitivity because in some oligotrophic areas, nutrient concentrations in seawater are as low as 10−9 mol/L [34] and have a wide detection range because the concentrations vary by up to five orders of magnitude from region to region or from time to time. Colorimetric, electrochemical and optical approaches mentioned above are the most widely used sensing technologies. Although the detection performance of sensors has improved considerably, some technical challenges, such as limited accuracy, detection range and continuous measurement time, still exist and limit the widespread use of these new sensors. Therefore, the future direction may focus on the methods to solve these problems.

9. Seafood Sensors

Fish and other seafood products play an important role in the human diet. They are abundant with many nutrients, such as protein, unsaturated fatty acids, vitamins and minerals [25,26]. However, seafood usually have neutral pH, high water activity, low content of connective tissue and autolytic enzymes, making them highly perishable [217]. The appearance, smell, taste and meat texture deteriorate rapidly in the process of spoilage [218,219]. In addition, seafood may be contaminated with algal toxins in marine settings, bringing a big concern for food safety. Therefore, reliable methods are needed to evaluate seafood quality and safety. Various novel sensing methods and technologies, such as chemical, physical, electrical sensors and biosensors mentioned below, have been reported for the assessment of the quality and safety of seafood.
Some chemical and physical parameters can be used to evaluate the quality and freshness of seafood, such as the specific spoilage organism growth, lipid oxidation, peroxide value, total volatile basic nitrogen, polyunsaturated fatty acids and other volatiles amines [220,221,222,223]. However, these parameters are dependent on a number of factors such as species, age, fishing area, season and animal nutritional status [224]. Traditional detection techniques are tedious, destructive, expensive, time-consuming and dependent on skilled personnel [225].
Some non-destructive and environmentally friendly methods have been prevalent in recent years. Recently, many novel analytical and chemical biosensors, electronic noses, eyes and tongues, nuclear magnetic resonance spectroscopic sensors and optical spectroscopic sensors have been developed to achieve the assessment of the safety and freshness of seafood [225,226,227]. For instance, Mustafa et al. reported a portable nanoenzyme-based biosensor for detecting the release of hypoxanthine that is a product of nucleotide degradation in meat and fish, to monitor the freshness of fish [228]. As shown in Figure 9a, the biosensor is based on cerium nanoparticles and xanthine oxidase to determine the hypoxanthine content. The linear detection range can reach 597 μM, and a detection limit of 89 μM can be obtained. Chen et al. studied a semiconductor metal oxide gas sensor based on mesoporous Au-ZnO nanospheres (Figure 8b) [229]. The sensor exhibited a sensitive detection of 10 ppm trimethylamine for seafood spoilage at 250 °C. Torrarit et al. reported a flow injection amperometric sensor for detecting formalin in fresh fish (Figure 9c) [230]. The sensor is constructed on a glassy carbon electrode modified with palladium particles and carbon microspheres and can achieve an accuracy between 96% ± 1% and 105% ± 3%.
Chang et al. successfully fabricated an ultrasensitive porous-electrode-capped organic gas sensor for detecting volatile amine gas in fish (Figure 9d) [231]. It only takes one minute for the sensor to detect the ammonia concentration, which can be as low as 100 ppb. Lee et al. studied a rapid monitoring system for seafood freshness that integrated sensory evaluation, gas chromatography–mass spectroscopy (GC-MS) and a bioelectronic nose (Figure 9e) [232]. Zhao et al. reported an ultraefficient trimethylamine gas sensor for rapid assessment of seafood freshness (Figure 9f) [43], which is a resistance sensor based on WO3 nanosheets with Au nanoparticles. The sensor can detect trimethylamine at as low as 0.5 ppm.
Table 8 shows the characteristics of several representative in situ and non-in situ uncommercial marine seafood sensors. Many techniques have been used in this field, such as colorimetric, electrochemical, resistive and chromatography–mass spectroscopy methods. Although these sensors and biosensors have shown considerable potential to evaluate the safety and freshness of fish and other seafood, there is no single method available for reliably and satisfactorily measuring the overall quality of seafood, and there is no technology to be a routine method in daily practice. Therefore, combining traditional methods with novel sensing methods, such as electrochemical and spectroscopic techniques, maybe a powerful approach to the evaluation of seafood quality.

10. Summary—Perspectives

The increasing attention towards the ocean environment has greatly stimulated the development of marine sensing methods and platforms in recent years. The traditional measurement methods are based on sampling from the shore or a ship and transferring these samples to the laboratory. The whole procedure is time-consuming and tedious, and it is difficult to know the distribution of analytes because they might be changed after leaving their original condition. The in situ spatial and temporal study of some analytes, such as gases of methane, radon and carbon dioxide, is important for a better understanding of key processes in the sea. The in situ sensing platforms can have small sizes, low energy consumption and long-term stability and be highly sensitive to and selective for low concentrations of target analytes with high automation and real-time analysis.
This review summarizes and analyzes typical in situ marine sensors along with their applications, including methane sensors, radon sensors, ferrous ion sensors, carbon dioxide sensors, sensors for detecting microorganisms, pollutants, nutrients and seafood sensors. The detection of methane is important for discovering natural gas hydrate reservoirs, and methane sensors include electrochemical conductivity sensors, optical sensors and mass spectrometry sensors. The detection of radon is necessary for studying submarine groundwater discharges, and radon sensors include a radon-in-air monitoring system and a gamma-ray spectrometry and pulsed-ionization-chamber-based sensing systems. The detection of ferrous ions plays a key role in many biogeochemical reactions and processes, such as phosphorus release and bioavailability, and ferrous ion sensors include electrochemical sensors, DET or DGT sensors and optical sensors. The oceanic uptake of anthropogenic carbon dioxide can alter the ocean carbonate system, and carbon dioxide sensors include optical sensors, optode-based sensors and GasPro probes. The detection of microorganisms is meaningful for understanding coastal dynamics and marine ecosystems, and microorganism sensors include RNA biosensors for algae, surface plasmon resonance biosensors for algae and DNA sensors for algae and pathogens. The detection of pollutants is essentials for assessing the marine environment, and the sensors for detecting pollutants include screen-printed biosensors for trace heavy-metal contaminants, whole-algae biosensors for detecting copper, lead, phenol and nonylphenol in seawater, marine phytoplankton motility sensors for evaluating pollutant toxicity and surface-enhanced Raman scattering sensor system for detecting polycyclic aromatic hydrocarbons. The detection of nutrients is important for assessing the marine eutrophication, and the sensors for detecting nutrients include colorimetric, optical and electrochemical devices. The detection of seafood is mainly used for assessing the freshness and safety of various seafood, and the sensors for analyzing the freshness of seafood include chemical biosensors, electronic noses, eyes and tongues, nuclear magnetic resonance spectroscopic sensors and optical spectroscopic sensors.
Future research for the development and use of marine sensors and biosensors should focus on the development of small, portable, smart, environmentally compatible, robust, low-cost, specialized and diversified sensing platforms for in situ monitoring of these marine analytes, rather than monitoring at specific sampling locations. According to different operational depths, these in situ sensors can be integrated into stable/fixed (such as buoys and landers) and mobile platforms (such as ships of opportunity, gliders, autonomous underwater vehicles (AUVs) and remotely operated vehicles (ROVs)) in the future, on which these sensing devices can be automatically operated for continuously measuring target compounds without supervision. In the future, one of the key criteria is to provide in the market sensors that can be easily integrated in mobile and/or fixed marine platforms and provide improved data analytics (in case of huge/large data sets) through applying machine learning and artificial intelligence methods. In addition, these in situ sensors on platforms are promising for forming coastal sensor networks to obtain more real-time and three-dimensional spatial resolution data to provide insights for more effectively handling marine scientific issues, such as source–sink of methane and carbon dioxide, submarine groundwater discharges, contamination of the marine environment and greenhouse gas emissions. Technologically advanced in situ sensors on suitable platforms can be combined with reliable automated analyzing systems to provide comprehensive long-term monitoring data related to marine issues. Moreover, the in situ spatial and temporal study of these analytes can provide a better understanding of a variety of key processes at sea, such as erosion, transportation and deposition. However, the marine environment is unstable and changeable, with often large diurnal and seasonal and spatial variations in temperature and salinity, which poses a big challenge for ensuring the accuracy, stability and repeatability of marine sensors. Much multidisciplinary validation work is needed for these sensors to reach their practical application. Integration of materials science, chemistry and electronics is necessary to optimize the sensors’ quality. Microfluidics is an important approach to minimizing the size of the sensors and reducing their power consumption. The accumulation of microorganisms, plants and animals on the sensor surface can biofoul the device and deteriorate its performance; therefore, anti-biofouling strategies are necessary to develop these in situ sensors. The exploration of new antifouling materials and methods is expected to improve the stability and durability of marine long-term sensors. In addition, sensor performance should be evaluated in real seawater conditions with fluctuations in temperature and other physical and chemical characteristics. This paper provides an overview of recent development in the marine sensors and may suggest exciting opportunities for further development of advanced marine sensing platforms.

Author Contributions

Writing—original draft preparation, Y.L.; writing—review and editing, H.L. and Y.C.; funding acquisition, H.L. and Y.C. All authors have read and agreed to the published version of the manuscript.

Funding

This research was funded by grants from the Geological Survey Projects of China Geological Survey (DD20221703, DD20230063), National Natural Science Foundation of China (No. 52072007) and National Key R&D Program of China (No. 2022YFB3204400).

Institutional Review Board Statement

Not applicable.

Informed Consent Statement

Not applicable.

Data Availability Statement

The data presented in this study are available on NCBI.

Conflicts of Interest

The authors declare no conflict of interest.

References

  1. Buonocore, E.; Grande, U.; Franzese, P.P.; Russo, G.F. Trends and Evolution in the Concept of Marine Ecosystem Services: An Overview. Water 2021, 13, 2060. [Google Scholar] [CrossRef]
  2. Fukuba, T.; Fujii, T. Lab-on-a-chip technology for in situ combined observations in oceanography. Lab Chip 2021, 21, 55–74. [Google Scholar] [CrossRef] [PubMed]
  3. Ingeman, K.E.; Samhouri, J.F.; Stier, A.C. Ocean recoveries for tomorrow’s Earth: Hitting a moving target. Science 2019, 363, eaav1004. [Google Scholar] [CrossRef] [Green Version]
  4. Mills, G.; Fones, G. A review of in situ methods and sensors for monitoring the marine environment. Sens. Rev. 2012, 32, 17–28. [Google Scholar] [CrossRef]
  5. Neal, C.; Leeks, G.J.L.; Millward, G.; Harris, J.R.W.; Huthnance, J.M.; Rees, J.G.; E Millward, G. Land Ocean Interaction: Processes, functioning and environmental management: A UK perspective. Sci. Total Environ. 2003, 314–316, 801–819. [Google Scholar] [CrossRef]
  6. Niu, M.Y.; Liang, W.Y.; Wang, F.P. Methane biotransformation in the ocean and its effects on climate change: A review. Sci. China Earth Sci. 2018, 61, 1697–1713. [Google Scholar] [CrossRef]
  7. Valentine, D.L. Emerging Topics in Marine Methane Biogeochemistry. Annu. Rev. Mar. Sci. 2011, 3, 147–171. [Google Scholar] [CrossRef] [PubMed]
  8. Zhao, S.B.; Li, M.; Burnett, W.C.; Cheng, K.; Li, C.Q.; Guo, J.J.; Yu, S.L.; Liu, W.; Yang, T.; Dimova, N.T.; et al. In-situ radon-in-water detection for high resolution submarine groundwater discharge assessment. Front. Mar. Sci. 2022, 9, 1001554. [Google Scholar] [CrossRef]
  9. Burnett, W.C.; Dulaiova, H. Estimating the dynamics of groundwater input into the coastal zone via continuous radon-222 measurements. J. Environ. Radioactiv. 2003, 69, 21–35. [Google Scholar] [CrossRef]
  10. Eleftheriou, G.; Pappa, F.K.; Maragos, N.; Tsabaris, C. Continuous monitoring of multiple submarine springs by means of gamma-ray spectrometry. J. Environ. Radioactiv. 2020, 216, 106180. [Google Scholar] [CrossRef]
  11. Tsabaris, C.; Androulakaki, E.G.; Prospathopoulos, A.; Alexakis, S.; Eleftheriou, G.; Patiris, D.L.; Pappa, F.K.; Sarantakos, K.; Kokkoris, M.; Vlastou, R. Development and optimization of an underwater in-situ cerium bromide spectrometer for radioactivity measurements in the aquatic environment. J. Environ. Radioactiv. 2019, 204, 12–20. [Google Scholar] [CrossRef]
  12. Tsabaris, C.; Patiris, D.L.; Lykousis, V.K. An in situ spectrometer for continuous monitoring of radon daughters in aquatic environment. Nucl. Instrum. Methods Phys. Res. Sect. A 2011, 626, S142–S144. [Google Scholar] [CrossRef]
  13. Tsabaris, C.; Androulakaki, E.G.; Alexakis, S.; Patiris, D.L. An in-situ gamma-ray spectrometer for the deep ocean. Appl. Radiat. Isotopes 2018, 142, 120–127. [Google Scholar] [CrossRef] [PubMed]
  14. Pavlidou, A.; Papadopoulos, V.P.; Hatzianestis, I.; Simboura, N.; Patiris, D.; Tsabaris, C. Chemical inputs from a karstic submarine groundwater discharge (SGD) into an oligotrophic Mediterranean coastal area. Sci. Total Environ. 2014, 488, 1–13. [Google Scholar] [CrossRef]
  15. Morse, J.W. Interactions of trace metals with authigenic sulfide minerals: Implications for their bioavailability. Mar. Chem. 1994, 46, 1–6. [Google Scholar] [CrossRef]
  16. Turekian, K.K. Fate of Metals in Oceans. Geochim. Cosmochim. Acta 1977, 41, 1139–1144. [Google Scholar] [CrossRef]
  17. Gächter, R.; Müller, B. Why the phosphorus retention of lakes does not necessarily depend on the oxygen supply to their sediment surface. Limnol. Oceanogr. 2003, 48, 929–933. [Google Scholar] [CrossRef]
  18. Wells, M.L.; Price, N.M.; Bruland, K.W. Iron chemistry in seawater and its relationship to phytoplankton: A workshop report. Mar. Chem. 1995, 48, 157–182. [Google Scholar] [CrossRef]
  19. Le Quéré, C.; Raupach, M.R.; Canadell, J.G.; Marland, G.; Bopp, L.; Ciais, P.; Conway, T.J.; Doney, S.C.; Feely, R.A.; Foster, P.; et al. Trends in the sources and sinks of carbon dioxide. Nat. Geosci. 2009, 2, 831–836. [Google Scholar] [CrossRef] [Green Version]
  20. Millero, F.J. The Marine Inorganic Carbon Cycle. Chem. Rev. 2007, 107, 308–341. [Google Scholar] [CrossRef] [PubMed]
  21. LaGier, M.J.; Scholin, C.A.; Fell, J.W.; Wang, J.; Goodwin, K.D. An electrochemical RNA hybridization assay for detection of the fecal indicator bacterium Escherichia coli. Mar. Pollut. Bull. 2005, 50, 1251–1261. [Google Scholar] [CrossRef] [PubMed] [Green Version]
  22. Haley, S.T.; Cavender, J.F.; Murray, T.E. Detection of Alexandrium tamarensis by Rapid PCR Analysis. Biotechniques 1999, 26, 88–91. [Google Scholar] [CrossRef] [PubMed]
  23. Li, M.; Xu, K.; Watanabe, M.; Chen, Z. Long-term variations in dissolved silicate, nitrogen, and phosphorus flux from the Yangtze River into the East China Sea and impacts on estuarine ecosystem. Estuar. Coast. Shelf Sci. 2007, 71, 3–12. [Google Scholar] [CrossRef]
  24. Cao, L.; Xiang, H.; Xu, J.; Gao, Y.; Lin, C.; Li, K.; Li, Z.; Guo, N.; David, P.; He, C.; et al. Nutrient Detection Sensors in Seawater Based on ISI Web of Science Database. J. Sens. 2022, 2022, 5754751. [Google Scholar] [CrossRef]
  25. Pyz-Łukasik, R.; Chałabis-Mazurek, A.; Gondek, M. Basic and functional nutrients in the muscles of fish: A review. Int. J. Food Prop. 2020, 23, 1941–1950. [Google Scholar] [CrossRef]
  26. Xu, H.; Turchini, G.M.; Francis, D.S.; Liang, M.; Mock, T.S.; Rombenso, A.; Ai, Q. Are fish what they eat? A fatty acid’s perspective. Prog. Lipid Res. 2020, 80, 101064. [Google Scholar] [CrossRef]
  27. Moore, T.S.; Mullaugh, K.M.; Holyoke, R.R.; Madison, A.S.; Yucel, M.; Luther, G.W. Marine Chemical Technology and Sensors for Marine Waters: Potentials and Limits. Annu. Rev. Mar. Sci. 2009, 1, 91–115. [Google Scholar] [CrossRef]
  28. Kroger, S.; Law, R.J. Biosensors for marine applications—We all need the sea, but does the sea need biosensors? Biosens. Bioelectron. 2005, 20, 1903–1913. [Google Scholar]
  29. Kumari, C.R.U.; Samiappan, D.; Kumar, R.; Sudhakar, T. Fiber optic sensors in ocean observation: A comprehensive review. Optik 2019, 179, 351–360. [Google Scholar] [CrossRef]
  30. Wang, F.; Zhu, J.M.; Chen, L.F.; Zuo, Y.F.; Hu, X.J.; Yang, Y. Autonomous and In Situ Ocean Environmental Monitoring on Optofluidic Platform. Micromachines 2020, 11, 68. [Google Scholar] [CrossRef] [Green Version]
  31. Briciu-Burghina, C.; Power, S.; Delgado, A.; Regan, F. Sensors for Coastal and Ocean Monitoring. Ann. Rev. Anal. Chem. 2023, 16, 451–469. [Google Scholar]
  32. Wang, Q.; Yang, Q.L.; Wu, W. Ensuring seafood safe to spoon: A brief review of biosensors for marine biotoxin monitoring. Crit. Rev. Food Sci. 2022, 62, 2495–2507. [Google Scholar] [CrossRef]
  33. Tian, Y.L.; Du, L.P.; Zhu, P.; Chen, Y.T.; Chen, W.; Wu, C.S.; Wang, P. Recent progress in micro/nano biosensors for shellfish toxin detection. Biosens. Bioelectron. 2021, 176, 112899. [Google Scholar]
  34. Wei, H.; Pan, D.W.; Han, H.T. Electrochemical monitoring of marine nutrients: From principle to application. Trac-Trends Anal. Chem. 2021, 138, 116242. [Google Scholar] [CrossRef]
  35. Blomberg, A.E.A.; Waarum, I.K.; Totland, C.; Eek, E. Marine Monitoring for Offshore Geological Carbon Storage-A Review of Strategies, Technologies and Trends. Geosciences 2021, 11, 383. [Google Scholar] [CrossRef]
  36. LGR. Deep Water Gas Analyzer. 2022. Available online: http://www.lgrinc.com/documents/LGR_DWGA_Datasheet (accessed on 24 June 2023).
  37. Milani, A.; Statham, P.J.; Mowlem, M.C.; Connelly, D.P. Development and application of a microfluidic in-situ analyzer for dissolved Fe and Mn in natural waters. Talanta 2015, 136, 15–22. [Google Scholar] [CrossRef]
  38. Atamanchuk, D.; Tengberg, A.; Thomas, P.J.; Hovdenes, J.; Apostolidis, A.; Huber, C.; Hall, P.O.J. Performance of a lifetime-based optode for measuring partial pressure of carbon dioxide in natural waters. Limnol. Oceanogr. Meth. 2014, 12, 63–73. [Google Scholar] [CrossRef] [Green Version]
  39. Fietzek, P.; Fiedler, B.; Steinhoff, T.; Kortzinger, A. In situ Quality Assessment of a Novel Underwater pCO(2) Sensor Based on Membrane Equilibration and NDIR Spectrometry. J. Atmos. Ocean. Tech. 2014, 31, 181–196. [Google Scholar] [CrossRef] [Green Version]
  40. Toldra, A.; Alcaraz, C.; Diogene, J.; O’Sullivan, C.K.; Campas, M. Detection of Ostreopsis cf. ovata in environmental samples using an electrochemical DNA-based biosensor. Sci. Total Environ. 2019, 689, 655–661. [Google Scholar] [CrossRef]
  41. Malzahn, K.; Windmiller, J.R.; Valdes-Ramirez, G.; Schoning, M.J.; Wang, J. Wearable electrochemical sensors for in situ analysis in marine environments. Analyst 2011, 136, 2912–2917. [Google Scholar] [CrossRef]
  42. Legrand, D.C.; Mas, S.; Jugeau, B.; David, A.; Barus, C. Silicate marine electrochemical sensor. Sens. Actuator B Chem. 2021, 335, 129705. [Google Scholar] [CrossRef]
  43. Zhao, C.; Shen, J.B.; Xu, S.S.; Wei, J.; Liu, H.Q.; Xie, S.Q.; Pan, Y.J.; Zhao, Y.; Zhu, Y.H. Ultra-efficient trimethylamine gas sensor based on Au nanoparticles sensitized WO3 nanosheets for rapid assessment of seafood freshness. Food Chem. 2022, 392, 133318. [Google Scholar] [CrossRef]
  44. Ruppel, C.D.; Kessler, J.D. The interaction of climate change and methane hydrates. Rev. Geophys. 2017, 55, 126–168. [Google Scholar] [CrossRef]
  45. Zhang, J.; Wang, Y.Y.; Wang, Y.; Bai, Y.; Feng, X.; Zhu, J.H.; Lu, X.H.; Mu, L.W.; Ming, T.Z.; de Richter, R.; et al. Solar Driven Gas Phase Advanced Oxidation Processes for Methane Removal-Challenges and Perspectives. Chem. Eur. J. 2022, 28, e202201984. [Google Scholar]
  46. Judd, A.G. Natural seabed gas seeps as sources of atmospheric methane. Environ. Geol. 2004, 46, 988–996. [Google Scholar] [CrossRef]
  47. Liu, H.T.; Zhan, L.S.; Lu, H.L. Mechanisms for upward migration of methane in marine sediments. Front. Mar. Sci. 2022, 9, 1031096. [Google Scholar] [CrossRef]
  48. Kelley, D.S.; Fruh-Green, G.L. Abiogenic methane in deep-seated mid-ocean ridge environments: Insights from stable isotope analyses. J. Geophys. Res. Solid Earth 1999, 104, 10439–10460. [Google Scholar] [CrossRef]
  49. Valentine, D.L.; Kastner, M.; Wardlaw, G.D.; Wang, X.C.; Purdy, A.; Bartlett, D.H. Biogeochemical investigations of marine methane seeps, Hydrate Ridge, Oregon. J. Geophys. Res. Biogeo. 2005, 110, G02005. [Google Scholar] [CrossRef] [Green Version]
  50. Amouroux, D.; Roberts, G.; Rapsomanikis, S.; Andreae, M.O. Biogenic gas (CH4, N2O, DMS) emission to the atmosphere from near-shore and shelf waters of the north-western Black Sea. Estuar. Coast. Shelf Sci. 2002, 54, 575–587. [Google Scholar] [CrossRef] [Green Version]
  51. Rosentreter, J.A.; Borges, A.V.; Deemer, B.R.; Holgerson, M.A.; Liu, S.D.; Song, C.L.; Melack, J.; Raymond, P.A.; Duarte, C.M.; Allen, G.H.; et al. Half of global methane emissions come from highly variable aquatic ecosystem sources. Nat. Geosci. 2021, 14, 225–230. [Google Scholar] [CrossRef]
  52. Sloan, E.D. Fundamental principles and applications of natural gas hydrates. Nature 2003, 426, 353–359. [Google Scholar] [CrossRef]
  53. Chong, Z.R.; Yang, S.H.B.; Babu, P.; Linga, P.; Li, X.S. Review of natural gas hydrates as an energy resource: Prospects and challenges. Appl. Energy 2016, 162, 1633–1652. [Google Scholar] [CrossRef]
  54. Gentz, T.; Damm, E.; von Deimling, J.S.; Mau, S.; McGinnis, D.F.; Schluter, M. A water column study of methane around gas flares located at the West Spitsbergen continental margin. Cont. Shelf Res. 2014, 72, 107–118. [Google Scholar] [CrossRef]
  55. Westbrook, G.K.; Thatcher, K.E.; Rohling, E.J.; Piotrowski, A.M.; Pälike, H.; Osborne, A.H.; Nisbet, E.G.; Minshull, T.A.; Lanoisellé, M.; James, R.H.; et al. Escape of methane gas from the seabed along the West Spitsbergen continental margin. Geophys. Res. Lett. 2009, 36, L15608. [Google Scholar] [CrossRef] [Green Version]
  56. Boulart, C.; Mowlem, M.C.; Connelly, D.P.; Dutasta, J.P.; German, C.R. A novel, low-cost, high performance dissolved methane sensor for aqueous environments. Opt. Express 2008, 16, 12607–12617. [Google Scholar] [CrossRef]
  57. Liu, L.P.; Ryu, B.; Sun, Z.L.; Wu, N.Y.; Cao, H.; Geng, W.; Zhang, X.R.; Jia, Y.G.; Xu, C.L.; Guo, L.; et al. Monitoring and research on environmental impacts related to marine natural gas hydrates: Review and future perspective. J. Nat. Gas Sci. Eng. 2019, 65, 82–107. [Google Scholar] [CrossRef]
  58. Greinert, J.; Artemov, Y.; Egorov, V.; De Batist, M.; McGinnis, D. 1300-m-high rising bubbles from mud volcanoes at 2080m in the Black Sea: Hydroacoustic characteristics and temporal variability. Earth Planet. Sc. Lett. 2006, 244, 1–15. [Google Scholar] [CrossRef]
  59. Sahling, H.; Romer, M.; Pape, T.; Berges, B.; Fereirra, C.D.; Boelmann, J.; Geprags, P.; Tomczyk, M.; Nowald, N.; Dimmler, W.; et al. Gas emissions at the continental margin west of Svalbard: Mapping, sampling, and quantification. Biogeosciences 2014, 11, 6029–6046. [Google Scholar] [CrossRef] [Green Version]
  60. Weber, T.C.; Mayer, L.; Jerram, K.; Beaudoin, J.; Rzhanov, Y.; Lovalvo, D. Acoustic estimates of methane gas flux from the seabed in a 6000 km(2) region in the Northern Gulf of Mexico. Geochem. Geophy. Geosy. 2014, 15, 1911–1925. [Google Scholar] [CrossRef] [Green Version]
  61. Jordt, A.; Zelenka, C.; von Deimling, J.S.; Koch, R.; Koser, K. The Bubble Box: Towards an Automated Visual Sensor for 3D Analysis and Characterization of Marine Gas Release Sites. Sensors 2015, 15, 30716–30735. [Google Scholar] [CrossRef] [Green Version]
  62. Garcia-Betancourt, M.L.; Masson, M. Environmental and geologic application of solid-state methane sensors. Environ. Geol. 2004, 46, 1059–1063. [Google Scholar] [CrossRef]
  63. Du, Z.F.; Chen, J.; Ye, W.Q.; Guo, J.J.; Zhang, X.; Zheng, R. Investigation of Two Novel Approaches for Detection of Sulfate Ion and Methane Dissolved in Sediment Pore Water Using Raman Spectroscopy. Sensors 2015, 15, 12377–12388. [Google Scholar] [CrossRef] [Green Version]
  64. Burton, G.; Melo, L.; Warwick, S.; Jun, M.; Bao, B.; Sinton, D.; Wild, P. Fiber refractometer to detect and distinguish carbon dioxide and methane leakage in the deep ocean. Int. J. Greenh. Gas Control 2014, 31, 41–47. [Google Scholar] [CrossRef]
  65. Grilli, R.; Triest, J.; Chappellaz, J.; Calzas, M.; Desbois, T.; Jansson, P.; Guillerm, C.; Ferre, B.; Lechevallier, L.; Ledoux, V.; et al. Sub-Ocean: Subsea Dissolved Methane Measurements Using an Embedded Laser Spectrometer Technology. Environ. Sci. Technol. 2018, 52, 10543–10551. [Google Scholar] [CrossRef] [Green Version]
  66. Brewer, P.G.; Malby, G.; Pasteris, J.D.; White, S.N.; Peltzer, E.T.; Wopenka, B.; Freeman, J.; Brown, M.O. Development of a laser Raman spectrometer for deep-ocean science. Deep. Sea Res. Part I 2004, 51, 739–753. [Google Scholar] [CrossRef]
  67. Hemond, H.; Camilli, R. NEREUS: Engineering concept for an underwater mass spectrometer. Trac-Trends Anal. Chem. 2002, 21, 526–533. [Google Scholar] [CrossRef] [Green Version]
  68. Gentz, T.; Schluter, M. Underwater cryotrap-membrane inlet system (CT-MIS) for improved in situ analysis of gases. Limnol. Oceanogr. Meth. 2012, 10, 317–328. [Google Scholar] [CrossRef] [Green Version]
  69. Tang, Q.J.; Wang, X.Y.; Zhang, H.; Liu, Z.; Guan, X.F. Thin-film samarium nickelate as a potential material for methane sensing. J. Mater. Res. 2022, 37, 3816–3830. [Google Scholar] [CrossRef]
  70. Lechevallier, L.; Grilli, R.; Kerstel, E.; Romanini, D.; Chappellaz, J. Simultaneous detection of C2H6, CH4, and delta C-13-CH4 using optical feedback cavity-enhanced absorption spectroscopy in the mid-infrared region: Towards application for dissolved gas measurements. Atmos. Meas. Tech. 2019, 12, 3101–3109. [Google Scholar] [CrossRef] [Green Version]
  71. Aleksanyan, M.S. Methane sensor based on SnO2/In2O3/TiO2 nanostructure. J. Contemp. Phys. (Armen. Acad. Sci.) 2010, 45, 77–80. [Google Scholar] [CrossRef]
  72. Fukasawa, T.; Hozumi, S.; Morita, M.; Oketani, T.; Masson, M. Dissolved methane sensor for methane leakage monitoring in methane hydrate production. In Proceedings of the Oceans 2006 Conference, Boston, MA, USA, 18–22 September 2006; pp. 449–454. [Google Scholar]
  73. Fukasawa, T.; Oketani, T.; Masson, M.; Groneman, J.; Hara, Y.; Hayashi, M. Optimized METS sensor for methane leakage monitoring. In Proceedings of the International Conference OCEANS 2008 and MTS/IEEE Kobe Techno-Ocean, Kobe, Japan, 8–11 April 2008; pp. 456–499. [Google Scholar]
  74. Gülzow, W.; Rehder, G.; Schneider, B.; Deimling, J.S.V.; Sadkowiak, B. A new method for continuous measurement of methane and carbon dioxide in surface waters using off-axis integrated cavity output spectroscopy (ICOS): An example from the Baltic Sea. Limnol. Oceanogr. Methods 2011, 9, 176–184. [Google Scholar] [CrossRef]
  75. Short, R.T.; Fries, D.P.; Toler, S.K.; Lembke, C.E.; Byrne, R.H. Development of an underwater mass-spectrometry system for in situ chemical analysis. Meas. Sci. Technol. 1999, 10, 1195–1201. [Google Scholar] [CrossRef]
  76. Giroud, S.; Tomonaga, Y.; Brennwald, M.S.; Takahata, N.; Shibata, T.; Sano, Y.; Kipfer, R. New experimental approaches enabling the continuous monitoring of gas species in hydrothermal fluids. Front. Water 2023, 4, 1032094. [Google Scholar] [CrossRef]
  77. Chua, E.J.; Savidge, W.; Short, R.T.; Cardenas-Valencia, A.M.; Fulweiler, R.W. A Review of the Emerging Field of Underwater Mass Spectrometry. Front. Mar. Sci. 2016, 3, 209. [Google Scholar] [CrossRef] [Green Version]
  78. Camilli, R.; Duryea, A.N. Characterizing Spatial and Temporal Variability of Dissolved Gases in Aquatic Environments with in situ Mass Spectrometry. Environ. Sci. Technol. 2009, 43, 5014–5021. [Google Scholar] [CrossRef]
  79. Yuan, F.; Hu, M.; He, Y.; Chen, B.; Yao, L.; Xu, Z.; Kan, R. Development of an in situ analysis system for methane dissolved in seawater based on cavity ringdown spectroscopy. Rev. Sci. Instrum. 2020, 91, 083106. [Google Scholar] [CrossRef]
  80. Schubert, M.; Paschke, A.; Lieberman, E.; Burnett, W.C. Air-Water Partitioning of Rn-222 and its Dependence on Water Temperature and Salinity. Environ. Sci. Technol. 2012, 46, 3905–3911. [Google Scholar] [CrossRef]
  81. Burnett, W.C.; Aggarwal, P.K.; Aureli, A.; Bokuniewicz, H.; Cable, J.E.; Charette, M.A.; Kontar, E.; Krupa, S.; Kulkarni, K.M.; Loveless, A.; et al. Quantifying submarine groundwater discharge in the coastal zone via multiple methods. Sci. Total Environ. 2006, 367, 498–543. [Google Scholar] [CrossRef]
  82. Li, C.Q.; Zhao, S.B.; Zhang, C.L.; Li, M.; Guo, J.J.; Dimova, N.T.; Yang, T.; Liu, W.; Chen, G.Q.; Yu, H.M.; et al. Further refinements of a continuous radon monitor for surface ocean water measurements. Front. Mar. Sci. 2022, 9, 1047126. [Google Scholar] [CrossRef]
  83. Corbett, D.R.; Burnett, W.C.; Cable, P.H.; Clark, S.B. A multiple approach to the determination of radon fluxes from sediments. J. Radioanal. Nucl. Chem. 1998, 236, 247–252. [Google Scholar] [CrossRef]
  84. Chen, Z.; Li, Y.; Liu, Z.F.; Wang, J.; Zhou, X.C.; Du, J.G. Radon emission from soil gases in the active fault zones in the Capital of China and its environmental effects. Sci. Rep. 2018, 8, 16772. [Google Scholar] [CrossRef] [Green Version]
  85. Quindos, L.S.; Soto, J.; Villar, E. Determination of radon daughter products near land-sea discontinuities by gamma spectrometry. J. Aerosol. Sci. 1983, 14, 495–498. [Google Scholar] [CrossRef]
  86. Choubey, V.M.; Bartarya, S.K.; Ramola, R.C. Radon in Himalayan springs: A geohydrological control. Environ. Geol. 2000, 39, 523–530. [Google Scholar] [CrossRef]
  87. Elio, J.; Ortega, M.F.; Nisi, B.; Mazadiego, L.F.; Vaselli, O.; Caballero, J.; Quindos-Poncela, L.S.; Sainz-Fernandez, C.; Pous, J. Evaluation of the applicability of four different radon measurement techniques for monitoring CO2 storage sites. Int. J. Greenh. Gas Control 2015, 41, 1–10. [Google Scholar] [CrossRef]
  88. Taguchi, S.; Tasaka, S.; Matsubara, M.; Osada, K.; Yokoi, T.; Yamanouchi, T. Air-sea gas transfer rate for the Southern Ocean inferred from Rn-222 concentrations in maritime air and a global atmospheric transport model. J. Geophys. Res. Atmos. 2013, 118, 7606–7616. [Google Scholar] [CrossRef]
  89. Lee, K.; Ha, K.; Lee, S.H.; Yoon, Y.; Kim, D.H.; Kim, Y. A continuous radon monitoring system for integration into the climate change observation network. J. Radioanal. Nucl. Chem. 2021, 330, 547–554. [Google Scholar] [CrossRef]
  90. Fouladi-Fard, R.; Amraei, A.; Fahiminia, M.; Hosseini, M.R.; Mahvi, A.H.; Oskouei, A.O.; Fiore, M.; Mohammadbeigi, A. Radon concentration and effective dose in drinking groundwater and its relationship with soil type. J. Radioanal. Nucl. Chem. 2020, 326, 1427–1435. [Google Scholar] [CrossRef]
  91. Freyer, K.; Treutler, H.C.; Dehnert, J.; Nestler, W. Sampling and measurement of radon-222 in water. J. Environ. Radioactiv. 1997, 37, 327–337. [Google Scholar] [CrossRef]
  92. Stringer, C.E.; Burnett, W.C. Sample bottle design improvements for radon emanation analysis of natural waters. Health Phys. 2004, 87, 642–646. [Google Scholar]
  93. Key, R.M.; Brewer, R.L.; Stockwell, J.H.; Guinasso, N.L.; Schink, D.R. Some improved techniques for measuring radon and radium in marine sediments and in seawater. Mar. Chem. 1979, 7, 251–264. [Google Scholar] [CrossRef]
  94. Broecker, W.S.; Li, Y.H.; Cromwell, J. Radium-226 and Radon-222—Cconcentration in Atlantic and Pacific Oceans. Science 1967, 158, 1307–1310. [Google Scholar] [CrossRef] [PubMed]
  95. Rose, A.L.; Waite, T.D. Kinetic model for Fe(II) oxidation in seawater in the absence and presence of natural organic matter. Environ. Sci. Technol. 2002, 36, 433–444. [Google Scholar] [CrossRef] [PubMed]
  96. Fitzsimmons, J.N.; Conway, T.M. Novel Insights into Marine Iron Biogeochemistry from Iron Isotopes. Annu. Rev. Mar. Sci. 2023, 15, 383–406. [Google Scholar] [CrossRef]
  97. Boye, M.; Nishioka, J.; Croot, P.; Laan, P.; Timmermans, K.R.; Strass, V.H.; Takeda, S.; de Baar, H.J.W. Significant portion of dissolved organic Fe complexes in fact is Fe colloids. Mar. Chem. 2010, 122, 20–27. [Google Scholar] [CrossRef] [Green Version]
  98. Martin, J.H. Glacial-interglacial CO2 change: The iron hypothesis. Paleoceanography 1990, 5, 1–13. [Google Scholar] [CrossRef]
  99. Barbeau, K.; Rue, E.L.; Bruland, K.W.; Butler, A. Photochemical cycling of iron in the surface ocean mediated by microbial iron(III)-binding ligands. Nature 2001, 413, 409–413. [Google Scholar] [CrossRef]
  100. Frias-Espericueta, M.G.; Voltolina, D.; Osuna-Lopez, J.I. Acute toxicity of copper, zinc, iron, and manganese and of the mixtures copper-zinc and iron-manoanese to whiteleg shrimp Litopenaeus vannamei postlarvae. Bull. Environ. Contam. Toxicol. 2003, 71, 68–74. [Google Scholar] [CrossRef]
  101. Dong, Y.Q.; Song, G.L.; Zhang, J.W.; Gao, Y.H.; Wang, Z.M.; Zheng, D.J. Biocorrosion induced by red-tide alga-bacterium symbiosis and the biofouling induced by dissolved iron for carbon steel in marine environment. J. Mater. Sci. Technol. 2022, 128, 107–117. [Google Scholar] [CrossRef]
  102. Severmann, S.; McManus, J.; Berelson, W.M.; Hammond, D.E. The continental shelf benthic iron flux and its isotope composition. Geochim. Cosmochim. Acta 2010, 74, 3984–4004. [Google Scholar] [CrossRef]
  103. Aller, R.C.; Heilbrun, C.; Panzeca, C.; Zhu, Z.B.; Baltzer, F. Coupling between sedimentary dynamics, early diagenetic processes, and biogeochemical cycling in the Amazon-Guianas mobile mud belt: Coastal French Guiana. Mar. Geol. 2004, 208, 331–360. [Google Scholar] [CrossRef]
  104. Millero, F.J.; Yao, W.S.; Aicher, J. The speciation of Fe(II) and Fe(III) in natural waters. Mar. Chem. 1995, 50, 21–39. [Google Scholar] [CrossRef]
  105. Stookey, L.L. Ferrozine—A new spectrophotometric reagent for Iron. Anal. Chem. 1970, 42, 779–781. [Google Scholar] [CrossRef] [Green Version]
  106. Stockdale, A.; Davison, W.; Zhang, H. Micro-scale biogeochemical heterogeneity in sediments: A review of available technology and observed evidence. Earth-Sci. Rev. 2009, 92, 81–97. [Google Scholar] [CrossRef] [Green Version]
  107. Blomqvist, S. Quantitative Sampling of Soft-Bottom Sediments—Problems and Solutions. Mar. Ecol. Prog. Ser. 1991, 72, 295–304. [Google Scholar] [CrossRef]
  108. Troup, B.N.; Bricker, O.P.; Bray, J.T. Oxidation effect on the analysis of iron in the interstitial water of recent anoxic sediments. Nature 1974, 249, 237–239. [Google Scholar] [CrossRef]
  109. Suarez, E.M.; Lepkova, K.; Forsyth, M.; Tan, M.K.Y.; Kinsella, B.; Machuca, L.L. In Situ Investigation of Under-Deposit Microbial Corrosion and its Inhibition Using a Multi-Electrode Array System. Front. Bioeng. Biotech. 2022, 9, 803610. [Google Scholar] [CrossRef]
  110. Tercier-Waeber, M.L.; Buffle, J.; Confalonieri, F.; Riccardi, G.; Sina, A.; Graziottin, F.; Fiaccabrino, G.C.; Koudelka-Hep, M. Submersible voltammetric probes for in situ real-time trace element measurements in surface water, groundwater and sediment-water interface. Meas. Sci. Technol. 1999, 10, 1202–1213. [Google Scholar] [CrossRef]
  111. Tercier, M.L.; Buffle, J.; Graziottin, F. Novel voltammetric in-situ profiling system for continuous real-time monitoring of trace elements in natural waters. Electroanal. 1998, 10, 355–363. [Google Scholar] [CrossRef]
  112. Howell, K.A.; Achterberg, E.P.; Braungardt, C.B.; Tappin, A.D.; Turner, D.R.; Worsfold, P.J. The determination of trace metals in estuarine and coastal waters using a voltammetric in situ profiling system. Analyst 2003, 128, 734–741. [Google Scholar] [CrossRef]
  113. Lin, M.Y.; Hu, X.P.; Pan, D.W.; Han, H.T. Determination of iron in seawater: From the laboratory to in situ measurements. Talanta 2018, 188, 135–144. [Google Scholar] [CrossRef]
  114. Tercier-Waeber, M.L.; Confalonieri, F.; Riccardi, G.; Sina, A.; Noel, S.; Buffle, J.; Graziottin, F. Multi Physical-Chemical profiler for real-time in situ monitoring of trace metal speciation and master variables: Development, validation and field applications. Mar. Chem. 2005, 97, 216–235. [Google Scholar] [CrossRef]
  115. Ma, S.; Luther, G.W.; Keller, J.; Madison, A.S.; Metzger, E.; Emerson, D.; Megonigal, J.P. Solid-state Au/Hg microelectrode for the investigation of Fe and mn cycling in a freshwater wetland: Implications for methane production. Electroanal. 2008, 20, 233–239. [Google Scholar] [CrossRef] [Green Version]
  116. Anschutz, P.; Sundby, B.; Lefrancois, L.; Luther, G.W.; Mucci, A. Interactions between metal oxides and species of nitrogen and iodine in bioturbated marine sediments. Geochim. Cosmochim. Acta 2000, 64, 2751–2763. [Google Scholar] [CrossRef]
  117. Brendel, P.J.; Luther, G.W. Development of a Gold Amalgam Voltammetric Microelectrode for the Determination of Dissolved Fe, Mn, O2, and S(-II) in Porewaters of Marine and Freshwater Sediments. Environ. Sci. Technol. 1995, 29, 751–761. [Google Scholar] [CrossRef]
  118. Cesbron, F.; Metzger, E.; Launeau, P.; Deflandre, B.; Delgard, M.L.; Thibault de Chanvalon, A.; Geslin, E.; Anschutz, P.; Jezequel, D. Simultaneous 2D Imaging of Dissolved Iron and Reactive Phosphorus in Sediment Porewaters by Thin-Film and Hyperspectral Methods. Environ. Sci. Technol. 2014, 48, 2816–2826. [Google Scholar] [CrossRef] [Green Version]
  119. Kamaci, U.D.; Kamaci, M.; Peksel, A. A dual responsive colorimetric sensor based on polyazomethine and ascorbic acid for the detection of Al (III) and Fe (II) ions. Spectrochim. Acta Part A Mol. Biomol. Spectrosc. 2021, 254, 119650. [Google Scholar]
  120. Guo, C.R.; Ma, M.J.; Yuan, D.X.; Huang, Y.M.; Lin, K.N.; Feng, S.C. In situ measurement of dissolved Fe(II) in sediment pore water with a novel sensor based on C18-ferrozine concentration and optical imaging detection. Anal. Methods 2019, 11, 133–141. [Google Scholar] [CrossRef]
  121. Amato, E.D.; Simpson, S.L.; Belzunce-Segarra, M.J.; Jarolimek, C.V.; Jolley, D.F. Metal Fluxes from Porewaters and Labile Sediment Phases for Predicting Metal Exposure and Bioaccumulation in Benthic Invertebrates. Environ. Sci. Technol. 2015, 49, 14204–14212. [Google Scholar] [CrossRef] [PubMed] [Green Version]
  122. Fones, G.R.; Davison, W.; Hamilton-Taylor, J. The fine-scale remobilization of metals in the surface sediment of the North-East Atlantic. Cont. Shelf Res. 2004, 24, 1485–1504. [Google Scholar] [CrossRef]
  123. Guan, D.; Wei, T.; Yuan, Z.; Li, G.; Chen, Z. A Review of Researches on Bioavailability and Interfacial Processes of Arsenic Based on Passive Sampling Techniques: Progress and Prospect. Acta Pedol. Sin. 2021, 58, 344–356. [Google Scholar]
  124. Harper, M.P.; Davison, W.; Tych, W. Temporal, spatial, and resolution constraints for in situ sampling devices using diffusional equilibration: Dialysis and DET. Environ. Sci. Technol. 1997, 31, 3110–3119. [Google Scholar] [CrossRef]
  125. Li, C.; Ding, S.M.; Yang, L.Y.; Wang, Y.; Ren, M.Y.; Chen, M.S.; Fan, X.F.; Lichtfouse, E. Diffusive gradients in thin films: Devices, materials and applications. Environ. Chem. Lett. 2019, 17, 801–831. [Google Scholar] [CrossRef]
  126. Metzger, E.; Viollier, E.; Simonucci, C.; Prevot, F.; Langlet, D.; Jezequel, D. Millimeter-scale alkalinity measurement in marine sediment using DET probes and colorimetric determination. Water Res. 2013, 47, 5575–5583. [Google Scholar] [CrossRef] [PubMed] [Green Version]
  127. Pages, A.; Teasdale, P.R.; Robertson, D.; Bennett, W.W.; Schafer, J.; Welsh, D.T. Representative measurement of two-dimensional reactive phosphate distributions and co-distributed iron(II) and sulfide in seagrass sediment porewaters. Chemosphere 2011, 85, 1256–1261. [Google Scholar] [CrossRef] [PubMed]
  128. Zhu, Q.Z.; Aller, R.C. Two-dimensional dissolved ferrous iron distributions in marine sediments as revealed by a novel planar optical sensor. Mar. Chem. 2012, 136, 14–23. [Google Scholar] [CrossRef]
  129. Woosley, R.J.; Millero, F.J.; Wanninkhof, R. Rapid anthropogenic changes in CO2 and pH in the Atlantic Ocean: 2003–2014. Glob. Biogeochem. Cycles 2016, 30, 70–90. [Google Scholar] [CrossRef] [Green Version]
  130. Thomas, H.; Prowe, A.E.F.; van Heuven, S.; Bozec, Y.; de Baar, H.J.W.; Schiettecatte, L.S.; Suykens, K.; Kone, M.; Borges, A.V.; Lima, I.D.; et al. Rapid decline of the CO2 buffering capacity in the North Sea and implications for the North Atlantic Ocean. Glob. Biogeochem. Cycles 2007, 21. [Google Scholar] [CrossRef] [Green Version]
  131. Iversen, M.H. Carbon Export in the Ocean: A Biologist’s Perspective. Annu. Rev. Mar. Sci. 2023, 15, 357–381. [Google Scholar] [CrossRef]
  132. Marion, G.M.; Millero, F.J.; Camões, M.F.; Spitzer, P.; Feistel, R.; Chen, C.T.A. PH of seawater. Mar. Chem. 2011, 126, 89–96. [Google Scholar] [CrossRef]
  133. Clarke, J.S.; Achterberg, E.P.; Connelly, D.P.; Schuster, U.; Mowlem, M. Developments in marine pCO(2) measurement technology; towards sustained in situ observations. Trac-Trends Anal. Chem. 2017, 88, 53–61. [Google Scholar] [CrossRef] [Green Version]
  134. Zhang, L.; Qu, K.; Wu, X.E.; Wen, M.; Lv, W. The development of in situ detection technology and device for dissolved methane and carbon dioxide in deep sea. Mar. Geol. Lett. 2022, 38, 1–18. [Google Scholar]
  135. Goyet, C.; Beauverger, C.; Brunet, C.; Poisson, A. Distribution of carbon dioxide partial pressure in surface waters of the Southwest Indian Ocean. Tellus B 1991, 43, 1–11. [Google Scholar] [CrossRef]
  136. Weiss, R.F. Determinations of Carbon Dioxide and Methane by Dual Catalyst Flame Ionization Chromatography and Nitrous Oxide by Electron Capture Chromatography. J. Chromatogr. Sci. 1981, 19, 611–616. [Google Scholar] [CrossRef]
  137. Poisson, A.; Metzl, N.; Brunet, C.; Schauer, B.; Bres, B.; Ruizpino, D.; Louanchi, F. Variability of sources and sinks of CO2 in the western Indian and southern oceans during the year 1991. J. Geophys. Res. Oceans 1993, 98, 22759–22778. [Google Scholar] [CrossRef]
  138. Cooper, D.J.; Watson, A.J.; Ling, R.D. Variation of P-CO2 along a North Atlantic shipping route (UK to the Caribbean): A year of automated observations. Mar. Chem. 1998, 60, 147–164. [Google Scholar] [CrossRef]
  139. Zhao, P.S.; Cai, W.J. An improved potentiometric pCO(2) microelectrode. Anal. Chem. 1997, 69, 5052–5058. [Google Scholar] [CrossRef]
  140. Rerolle, V.M.C.; Floquet, C.F.A.; Mowlem, M.C.; Bellerby, R.; Connelly, D.P.; Achterberg, E.P. Seawater-pH measurements for ocean-acidification observations. Trac-Trends Anal. Chem. 2012, 40, 146–157. [Google Scholar] [CrossRef]
  141. Seidel, M.P.; DeGrandpre, M.D.; Dickson, A.G. A sensor for in situ indicator-based measurements of seawater pH. Mar. Chem. 2008, 109, 18–28. [Google Scholar] [CrossRef]
  142. Degrandpre, M.D. Measurement of seawater pCO2 using a renewable-reagent fiber optic sensor with colorimetric detection. Anal. Chem. 1993, 65, 331–337. [Google Scholar] [CrossRef]
  143. Lu, Z.M.; Dai, M.H.; Xu, K.M.; Chen, J.S.; Liao, Y.H. A high precision, fast response, and low power consumption in situ optical fiber chemical pCO(2) sensor. Talanta 2008, 76, 353–359. [Google Scholar] [CrossRef]
  144. Fietzek, P.; Kramer, S.; Esser, D. Deployments of the HydroC (TM) (CO2/CH4) on stationary and mobile platforms—Merging trends in the field of platform and sensor development. In Proceedings of the MTS/IEEE OCEANS Conference, Kona, HI, USA, 19–22 September 2011. [Google Scholar]
  145. Canning, A.R.; Fietzek, P.; Rehder, G.; Kortzinger, A. Technical note: Seamless gas measurements across the land-ocean aquatic continuum—Corrections and evaluation of sensor data for CO2, CH4 and O-2 from field deployments in contrasting environments. Biogeosciences 2021, 18, 1351–1373. [Google Scholar] [CrossRef]
  146. Zhu, Q.Z.; Aller, R.C.; Fan, Y.Z. A new ratiometric, planar fluorosensor for measuring high resolution, two-dimensional pCO(2) distributions in marine sediments. Mar. Chem. 2006, 101, 40–53. [Google Scholar] [CrossRef]
  147. Graziani, S.; Beaubien, S.E.; Bigi, S.; Lombardi, S. Spatial and Temporal pCO(2) Marine Monitoring Near Panarea Island (Italy) Using Multiple Low-Cost GasPro Sensors. Environ. Sci. Technol. 2014, 48, 12126–12133. [Google Scholar] [CrossRef] [PubMed]
  148. Borisov, S.M.; Seifner, R.; Klimant, I. A novel planar optical sensor for simultaneous monitoring of oxygen, carbon dioxide, pH and temperature. Anal. Bioanal. Chem. 2011, 400, 2463–2474. [Google Scholar] [CrossRef] [PubMed] [Green Version]
  149. Schrumpf, A.; Lengerer, A.; Schmid, N.; Kazda, M. Portable Measurement System for in situ Estimation of Oxygen and Carbon Fluxes of Submerged Plants. Front. Plant Sci. 2021, 12, 765089. [Google Scholar] [CrossRef]
  150. Zhang, Z.H.; Li, M.; Yang, T.; Zang, Z.X.; Li, N.; Zheng, R.E.; Guo, J.J. Seconds-Scale Response Sensor for In Situ Oceanic Carbon Dioxide Detection. Anal. Chem. 2023, 95, 3577–3586. [Google Scholar] [CrossRef] [PubMed]
  151. Li, M.; Du, B.L.; Guo, J.J.; Zhang, Z.H.; Lu, Z.Y.; Zheng, R.E. A low-cost in-situ CO2 sensor based on a membrane and NDIR for long-term measurement in seawater. J. Oceanol. Limnol. 2022, 40, 986–998. [Google Scholar] [CrossRef]
  152. Bergamasco, A.; Nguyen, H.Q.; Caruso, G.; Xing, Q.G.; Carol, E. Advances in Water Quality Monitoring and Assessment in Marine and Coastal Regions. Water 2021, 13, 1926. [Google Scholar] [CrossRef]
  153. Lee, J.; Choi, J.; Fatka, M.; Swanner, E.; Ikuma, K.; Liang, X.W.; Leung, T.; Howe, A. Improved detection of mcyA genes and their phylogenetic origins in harmful algal blooms. Water Res. 2020, 176, 115730. [Google Scholar] [CrossRef]
  154. Tang, T.; Effiong, K.; Hu, J.; Li, C.; Xiao, X. Chemical Prevention and Control of the Green Tide and Fouling Organism Ulva: Key Chemicals, Mechanisms, and Applications. Front. Mar. Sci. 2021, 8, 618950. [Google Scholar] [CrossRef]
  155. Penna, A.; Magnani, M. Identification of Alexandrium (Dinophyceae) species using PCR and rDNA-targeted probes. J. Phycol. 1999, 35, 615–621. [Google Scholar] [CrossRef]
  156. Metfies, K.; Huljic, S.; Lange, M.; Medlin, L.K. Electrochemical detection of the toxic dinoflagellate Alexandrium ostenfeldii with a DNA-biosensor. Biosens. Bioelectron. 2005, 20, 1349–1357. [Google Scholar] [CrossRef] [Green Version]
  157. Guillou, L.; Nezan, E.; Cueff, V.; Denn, E.E.L.; Cambon-Bonavita, M.A.; Gentien, P.; Barbier, G. Genetic diversity and molecular detection of three toxic dinoflagellate genera (Alexandrium, Dinophysis, and Karenia) from French coasts. Protist 2002, 153, 223–238. [Google Scholar] [CrossRef]
  158. Kim, C.J.; Sako, Y. Molecular identification of toxic Alexandrium tamiyavanichii (Dinophyceae) using two DNA probes. Harmful Algae 2005, 4, 984–991. [Google Scholar] [CrossRef]
  159. Diercks, S.; Metfies, K.; Medlin, L.K. Development and adaptation of a multiprobe biosensor for the use in a semi-automated device for the detection of toxic algae. Biosens. Bioelectron. 2008, 23, 1527–1533. [Google Scholar] [CrossRef]
  160. McCoy, G.R.; McNamee, S.; Campbell, K.; Elliott, C.T.; Fleming, G.T.A.; Raine, R. Monitoring a toxic bloom of Alexandrium minutum using novel microarray and multiplex surface plasmon resonance biosensor technology. Harmful Algae 2014, 32, 40–48. [Google Scholar] [CrossRef]
  161. Liu, Y.S.; Deng, Y.L.; Chen, C.K.; Khoo, B.L.; Chua, S.L. Rapid detection of microorganisms in a fish infection microfluidics platform. J. Hazard. Mater. 2022, 431, 128572. [Google Scholar] [CrossRef] [PubMed]
  162. Liu, J.X.; Zhang, X.Y.; Zheng, J.Y.; Yu, Y.P.; Huang, X.H.; Wei, J.G.; Mukama, O.; Wang, S.W.; Qin, Q.W. A lateral flow biosensor for rapid detection of Singapore grouper iridovirus (SGIV). Aquaculture 2021, 541, 736756. [Google Scholar] [CrossRef]
  163. Zielinski, O.; Busch, J.A.; Cembella, A.D.; Daly, K.L.; Engelbrektsson, J.; Hannides, A.K.; Schmidt, H. Detecting marine hazardous substances and organisms: Sensors for pollutants, toxins, and pathogens. Ocean Sci. 2009, 5, 329–349. [Google Scholar] [CrossRef] [Green Version]
  164. Doni, L.; Martinez-Urtaza, J.; Vezzulli, L. Searching pathogenic bacteria in the rare biosphere of the ocean. Curr. Opin. Biotechnol. 2023, 80, 102894. [Google Scholar] [CrossRef]
  165. Dutta, D.; Kaushik, A.; Kumar, D.; Bag, S. Foodborne Pathogenic Vibrios: Antimicrobial Resistance. Front. Microbiol. 2021, 12, 638331. [Google Scholar] [CrossRef] [PubMed]
  166. Kay, D.; Bartram, J.; Pruss, A.; Ashbolt, N.; Wyer, M.D.; Fleisher, J.M.; Fewtrell, L.; Rogers, A.; Rees, G. Derivation of numerical values for the World Health Organization guidelines for recreational waters. Water Res. 2004, 38, 1296–1304. [Google Scholar] [CrossRef] [PubMed]
  167. Straub, T.M.; Chandler, D.P. Towards a unified system for detecting waterborne pathogens. J. Microbiol. Meth. 2003, 53, 185–197. [Google Scholar] [CrossRef]
  168. Hong, S.R.; Jeong, H.D.; Hong, S. QCM DNA biosensor for the diagnosis of a fish pathogenic virus VHSV. Talanta 2010, 82, 899–903. [Google Scholar] [CrossRef] [PubMed]
  169. Toldra, A.; Furones, M.D.; O’Sullivan, C.K.; Campas, M. Detection of isothermally amplified ostreid herpesvirus 1 DNA in Pacific oyster (Crassostrea gigas) using a miniaturised electrochemical biosensor. Talanta 2020, 207, 120308. [Google Scholar] [CrossRef] [PubMed]
  170. Johnston, E.L.; Roberts, D.A. Contaminants reduce the richness and evenness of marine communities: A review and meta-analysis. Environ. Pollut. 2009, 157, 1745–1752. [Google Scholar] [CrossRef]
  171. Rathi, B.S.; Kumar, P.S.; Show, P.L. A review on effective removal of emerging contaminants from aquatic systems: Current trends and scope for further research. J. Hazard. Mater. 2021, 409, 124413. [Google Scholar] [CrossRef]
  172. Tornero, V.; Hanke, G. Chemical contaminants entering the marine environment from sea-based sources: A review with a focus on European seas. Mar. Pollut. Bull. 2016, 112, 17–38. [Google Scholar] [CrossRef]
  173. Sheikh, M.A.; Fasih, M.M.; Strand, J.; Ali, H.R.; Bakar, A.H.; Sharif, H.M. Potential of silicone passive sampler for Tributyltin (TBT) detection in tropical aquatic systems. Reg. Stud. Mar. Sci. 2020, 35, 101171. [Google Scholar] [CrossRef]
  174. Ojemaye, C.Y.; Petrik, L. Pharmaceuticals in the marine environment: A review. Environ. Rev. 2019, 27, 151–165. [Google Scholar] [CrossRef]
  175. Kuznetsova, O.V.; Timerbaev, A.R. Marine sediment analysis-A review of advanced approaches and practices focused on contaminants. Anal. Chim. Acta 2022, 1209, 339640. [Google Scholar] [CrossRef] [PubMed]
  176. Saravanakumar, K.; SivaSantosh, S.; Sathiyaseelan, A.; Naveen, K.V.; AfaanAhamed, M.A.; Zhang, X.; Priya, V.V.; MubarakAli, D.; Wang, M.H. Unraveling the hazardous impact of diverse contaminants in the marine environment: Detection and remedial approach through nanomaterials and nano-biosensors. J. Hazard. Mater. 2022, 433, 128720. [Google Scholar] [CrossRef] [PubMed]
  177. Kroger, S.; Piletsky, S.; Turner, A.P.F. Biosensors for marine pollution research, monitoring and control. Mar. Pollut. Bull. 2002, 45, 24–34. [Google Scholar] [CrossRef] [PubMed]
  178. Camara, J.S.; Montesdeoca-Esponda, S.; Freitas, J.; Guedes-Alonso, R.; Sosa-Ferrera, Z.; Perestrelo, R. Emerging Contaminants in Seafront Zones. Environmental Impact and Analytical Approaches. Separations 2021, 8, 95. [Google Scholar] [CrossRef]
  179. Justino, C.I.L.; Freitas, A.C.; Duarte, A.C.; Santos, T. Sensors and biosensors for monitoring marine contaminants. Trends Environ. Anal. 2015, 6, 21–30. [Google Scholar] [CrossRef]
  180. Han, S.; Zhang, Q.; Zhang, X.C.; Liu, X.M.; Lu, L.; Wei, J.F.; Li, Y.C.; Wang, Y.H.; Zheng, G.X. A digital microfluidic diluter-based microalgal motion biosensor for marine pollution monitoring. Biosens. Bioelectron. 2019, 143, 111597. [Google Scholar] [CrossRef]
  181. Zheng, G.X.; Li, Y.J.; Qi, L.L.; Liu, X.M.; Wang, H.; Yu, S.P.; Wang, Y.H. Marine phytoplankton motility sensor integrated into a microfluidic chip for high-throughput pollutant toxicity assessment. Mar. Pollut. Bull. 2014, 84, 147–154. [Google Scholar] [CrossRef]
  182. Pfannkuche, J.; Lubecki, L.; Schmidt, H.; Kowalewska, G.; Kronfeldt, H.D. The use of surface-enhanced Raman scattering (SERS) for detection of PAHs in the Gulf of Gdansk (Baltic Sea). Mar. Pollut. Bull. 2012, 64, 614–626. [Google Scholar] [CrossRef]
  183. Ronan, J.M.; McHugh, B. A sensitive liquid chromatography/tandem mass spectrometry method for the determination of natural and synthetic steroid estrogens in seawater and marine biota, with a focus on proposed Water Framework Directive Environmental Quality Standards. Rapid Commun. Mass Spectrom. 2013, 27, 738–746. [Google Scholar] [CrossRef]
  184. Sanchez-Avila, J.; Quintana, J.; Ventura, F.; Tauler, R.; Duarte, C.M.; Lacorte, S. Stir bar sorptive extraction-thermal desorption-gas chromatography-mass spectrometry: An effective tool for determining persistent organic pollutants and nonylphenol in coastal waters in compliance with existing Directives. Mar. Pollut. Bull. 2010, 60, 103–112. [Google Scholar] [CrossRef]
  185. Lisboa, N.S.; Fahning, C.S.; Cotrim, G.; dos Anjos, J.P.; de Andrade, J.B.; Hatje, V.; da Rocha, G.O. A simple and sensitive UFLC-fluorescence method for endocrine disrupters determination in marine waters. Talanta 2013, 117, 168–175. [Google Scholar] [CrossRef]
  186. Jung, S.; Cho, S.H.; Kim, K.H.; Kwon, E.E. Progress in quantitative analysis of microplastics in the environment: A review. Chem. Eng. J. 2021, 422, 130154. [Google Scholar] [CrossRef]
  187. da Costa, B.M.C.; Duarte, A.C.; Rocha-Santos, T.A.P. Environmental monitoring approaches for the detection of organic contaminants in marine environments: A critical review. Trends Environ. Anal. 2022, 33, e00154. [Google Scholar] [CrossRef]
  188. Kotke, D.; Gandrass, J.; Xie, Z.Y.; Ebinghaus, R. Prioritised pharmaceuticals in German estuaries and coastal waters: Occurrence and environmental risk assessment. Environ. Pollut. 2019, 255, 113161. [Google Scholar] [CrossRef] [PubMed]
  189. Humbert, K.; Debret, M.; Morin, C.; Cosme, J.; Portet-Koltalo, F. Direct thermal desorption-gas chromatography-tandem mass spectrometry versus microwave assisted extraction and GC-MS for the simultaneous analysis of polyaromatic hydrocarbons (PAHs, PCBs) from sediments. Talanta 2022, 250, 123735. [Google Scholar] [CrossRef] [PubMed]
  190. Monaghan, J.; Xin, Q.; Aplin, R.; Jaeger, A.; Heshka, N.E.; Hounjet, L.J.; Gill, C.G.; Krogh, E.T. Aqueous naphthenic acids and polycyclic aromatic hydrocarbons in a meso-scale spill tank affected by diluted bitumen analyzed directly by membrane introduction mass spectrometry. J. Hazard. Mater. 2022, 440, 129798. [Google Scholar] [CrossRef]
  191. Schnitzler, L.; Zarzycki, J.; Gerhard, M.; Konde, S.; Rexer, K.-H.; Erb, T.J.; Maier, U.G.; Koch, M.; Hofmann, M.R.; Moog, D. Lensless digital holographic microscopy as an efficient method to monitor enzymatic plastic degradation. Mar. Pollut. Bull. 2021, 163, 111950. [Google Scholar] [CrossRef] [PubMed]
  192. Peron, O.; Rinnert, E.; Lehaitre, M.; Crassous, P.; Compere, C. Detection of polycyclic aromatic hydrocarbon (PAH) compounds in artificial sea-water using surface-enhanced Raman scattering (SERS). Talanta 2009, 79, 199–204. [Google Scholar] [CrossRef]
  193. Kolomijeca, A.; Kronfeldt, H.D.; Kwon, Y.H. A Portable Surface Enhanced Raman Spectroscopy (SERS) Sensor System Applied for Seawater and Sediment Investigations on an Arctic Sea-Trial. Int. J. Offshore Polar 2013, 23, 161–165. [Google Scholar]
  194. Wang, H.; Wang, G.C.; Gu, W.H. Macroalgal blooms caused by marine nutrient changes resulting from human activities. J. Appl. Ecol. 2020, 57, 766–776. [Google Scholar] [CrossRef]
  195. Hong, H.S.; Chen, N.W.; Wang, D.L. River-estuary-coast continuum: Biogeochemistry and ecological response to increasing human and climatic changes—Editorial overview. Estuar. Coast. Shelf Sci. 2015, 166, 144–145. [Google Scholar] [CrossRef]
  196. Hu, W.; Li, C.H.; Ye, C.; Wang, J.; Wei, W.W.; Deng, Y. Research progress on ecological models in the field of water eutrophication: CiteSpace analysis based on data from the ISI web of science database. Ecol. Model. 2019, 410, 108779. [Google Scholar] [CrossRef]
  197. Cloern, J.E.; Abreu, P.C.; Carstensen, J.; Chauvaud, L.; Elmgren, R.; Grall, J.; Greening, H.; Johansson, J.O.R.; Kahru, M.; Sherwood, E.T.; et al. Human activities and climate variability drive fast-paced change across the world’s estuarine-coastal ecosystems. Glob. Chang. Biol. 2016, 22, 513–529. [Google Scholar] [CrossRef] [PubMed]
  198. Nyenje, P.M.; Foppen, J.W.; Uhlenbrook, S.; Kulabako, R.; Muwanga, A. Eutrophication and nutrient release in urban areas of sub-Saharan Africa—A review. Sci. Total Environ. 2010, 408, 447–455. [Google Scholar] [CrossRef] [PubMed]
  199. Nehir, M.; Esposito, M.; Begler, C.; Franke, C.; Zielinski, O.; Achterberg, E.P. Improved Calibration and Data Processing Procedures of OPUS Optical Sensor for High-Resolution in situ Monitoring of Nitrate in Seawater. Front. Mar. Sci. 2021, 8, 663800. [Google Scholar] [CrossRef]
  200. Chen, X.Y.; Zhou, G.H.; Mao, S.; Chen, J.H. Rapid detection of nutrients with electronic sensors: A review. Environ. Sci. Nano 2018, 5, 837–862. [Google Scholar] [CrossRef]
  201. Nightingale, A.M.; Beaton, A.D.; Mowlem, M.C. Trends in microfluidic systems for in situ chemical analysis of natural waters. Sens. Actuator B Chem. 2015, 221, 1398–1405. [Google Scholar] [CrossRef] [Green Version]
  202. Prien, R.D. The future of chemical in situ sensors. Mar. Chem. 2007, 107, 422–432. [Google Scholar] [CrossRef]
  203. Daly, K.L.; Byrne, R.H.; Dickson, A.G.; Gallager, S.M.; Perry, M.J.; Tivey, M.K. Chemical and biological sensors for time-series research: Current status and new directions. Mar. Technol. Soc. J. 2004, 38, 121–143. [Google Scholar] [CrossRef]
  204. Daniel, A.; Laes-Huon, A.; Barus, C.; Beaton, A.D.; Blandfort, D.; Guigues, N.; Knockaert, M.; Muraron, D.; Salter, I.; Woodward, E.M.S.; et al. Toward a Harmonization for Using in situ Nutrient Sensors in the Marine Environment. Front. Mar. Sci. 2020, 6, 773. [Google Scholar] [CrossRef] [Green Version]
  205. Aguilar, D.; Barus, C.; Giraud, W.; Calas, E.; Vanhove, E.; Laborde, A.; Launay, J.; Temple-Boyer, P.; Striebig, N.; Armengaud, M.; et al. Silicon-based electrochemical microdevices for silicate detection in seawater. Sens. Actuator B Chem. 2015, 211, 116–124. [Google Scholar] [CrossRef] [Green Version]
  206. Jonca, J.; Fernandez, V.L.; Thouron, D.; Paulmier, A.; Graco, M.; Garcon, V. Phosphate determination in seawater: Toward an autonomous electrochemical method. Talanta 2011, 87, 161–167. [Google Scholar] [CrossRef] [PubMed]
  207. Johnson, K.S.; Needoba, J.A.; Riser, S.C.; Showers, W.J. Chemical sensor networks for the aquatic environment. Chem. Rev. 2007, 107, 623–640. [Google Scholar] [CrossRef] [PubMed]
  208. Ye, Z.P.; Yang, J.Q.; Zhong, N.; Tu, X.; Jia, J.N.; Wang, J.D. Tackling environmental challenges in pollution controls using artificial intelligence: A review. Sci. Total Environ. 2020, 699, 134279. [Google Scholar] [CrossRef]
  209. Grand, M.M.; Laes-Huon, A.; Fietz, S.; Resing, J.A.; Obata, H.; Luther, G.W.; Tagliabue, A.; Achterberg, E.P.; Middag, R.; Tovar-Sanchez, A.; et al. Developing Autonomous Observing Systems for Micronutrient Trace Metals. Front. Mar. Sci. 2019, 6, 35. [Google Scholar] [CrossRef] [Green Version]
  210. Finch, M.S.; Hydes, D.J.; Clayson, C.H.; Weigl, B.; Dakin, J.; Gwilliam, P. A low power ultra violet spectrophotometer for measurement of nitrate in seawater: Introduction, calibration and initial sea trials. Anal. Chim. Acta 1998, 377, 167–177. [Google Scholar]
  211. Yuan, D.-X.; Huang, Y.-M.; Wang, T. Research Progress of Analytical Methods with Molecular Spectroscopy for Determination of Trace Nutrients and Metals in Seawaters. Huanjing Kexue 2022, 43, 4822–4834. [Google Scholar]
  212. Yang, Z.M.; Li, C.; Chen, F.; Liu, C.; Cai, Z.F.; Cao, W.X.; Li, Z.H. An in situ analyzer for long-term monitoring of nitrite in seawater with versatile liquid waveguide capillary cells: Development, optimization and application. Mar. Chem. 2022, 245, 104149. [Google Scholar] [CrossRef]
  213. Altahan, M.F.; Esposito, M.; Achterberg, E.P. Improvement of On-Site Sensor for Simultaneous Determination of Phosphate, Silicic Acid, Nitrate plus Nitrite in Seawater. Sensors 2022, 22, 3479. [Google Scholar] [CrossRef]
  214. Cuartero, M.; Crespo, G.; Cherubini, T.; Pankratova, N.; Confalonieri, F.; Massa, F.; Tercier-Waeber, M.L.; Abdou, M.; Schafer, J.; Bakker, E. In Situ Detection of Macronutrients and Chloride in Seawater by Submersible Electrochemical Sensors. Anal. Chem. 2018, 90, 4702–4710. [Google Scholar] [CrossRef] [Green Version]
  215. Barus, C.; Romanytsia, I.; Striebig, N.; Garcon, V. Toward an in situ phosphate sensor in seawater using Square Wave Voltammetry. Talanta 2016, 160, 417–424. [Google Scholar] [CrossRef]
  216. Machado, M.C.; Vimbela, G.V.; Tripathi, A. Creation of a low cost, low light bioluminescence sensor for real time biological nitrate sensing in marine environments. Environ. Technol. 2021, 43, 4002–4009. [Google Scholar] [CrossRef] [PubMed]
  217. Cozzolino, D.; Murray, I. A Review on the Application of Infrared Technologies to Determine and Monitor Composition and Other Quality Characteristics in Raw Fish, Fish Products, and Seafood. Appl. Spectrosc. Rev. 2012, 47, 207–218. [Google Scholar] [CrossRef]
  218. Li, J.R.; Lu, H.X.; Zhu, J.L.; Wang, Y.B.; Li, X.P. Aquatic products processing industry in China: Challenges and outlook. Trends Food Sci. Tech. 2009, 20, 73–77. [Google Scholar] [CrossRef]
  219. Parlapani, F.F.; Mallouchos, A.; Haroutounian, S.A.; Boziaris, I.S. Microbiological spoilage and investigation of volatile profile during storage of sea bream fillets under various conditions. Int. J. Food Microbiol. 2014, 189, 153–163. [Google Scholar] [CrossRef]
  220. Li, X.P.; Chen, Y.; Cai, L.Y.; Xu, Y.X.; Yi, S.M.; Zhu, W.H.; Mi, H.B.; Li, J.R.; Lin, H. Freshness assessment of turbot (Scophthalmus maximus) by Quality Index Method (QIM), biochemical, and proteomic methods. LWT Food Sci. Technol. 2017, 78, 172–180. [Google Scholar] [CrossRef]
  221. Yao, L.; Luo, Y.K.; Sun, Y.Y.; Shen, H.X. Establishment of kinetic models based on electrical conductivity and freshness indictors for the forecasting of crucian carp (Carassius carassius) freshness. J. Food Eng. 2011, 107, 147–151. [Google Scholar] [CrossRef]
  222. Onal, A. A review: Current analytical methods for the determination of biogenic amines in foods. Food Chem. 2007, 103, 1475–1486. [Google Scholar] [CrossRef]
  223. Cheng, J.H.; Sun, D.W.; Zeng, X.A.; Liu, D. Recent Advances in Methods and Techniques for Freshness Quality Determination and Evaluation of Fish and Fish Fillets: A Review. Crit. Rev. Food Sci. 2015, 55, 1012–1025. [Google Scholar] [CrossRef]
  224. Cheng, J.H.; Sun, D.W.; Han, Z.; Zeng, X.A. Texture and Structure Measurements and Analyses for Evaluation of Fish and Fillet Freshness Quality: A Review. Compr. Rev. Food Sci. Food Saf. 2014, 13, 52–61. [Google Scholar] [CrossRef]
  225. Franceschelli, L.; Berardinelli, A.; Dabbou, S.; Ragni, L.; Tartagni, M. Sensing Technology for Fish Freshness and Safety: A Review. Sensors 2021, 21, 1373. [Google Scholar] [CrossRef]
  226. Hassoun, A.; Karoui, R. Quality evaluation of fish and other seafood by traditional and nondestructive instrumental methods: Advantages and limitations. Crit. Rev. Food Sci. 2017, 57, 1976–1998. [Google Scholar] [CrossRef]
  227. Karunathilaka, S.R.; Ellsworth, Z.; Yakes, B.J. Detection of decomposition in mahi-mahi, croaker, red snapper, and weakfish using an electronic-nose sensor and chemometric modeling. J. Food Sci. 2021, 86, 4148–4158. [Google Scholar] [CrossRef] [PubMed]
  228. Mustafa, F.; Othman, A.; Andreescu, S. Cerium oxide-based hypoxanthine biosensor for Fish spoilage monitoring. Sens. Actuator B Chem. 2021, 332, 129435. [Google Scholar] [CrossRef]
  229. Chen, Y.Q.; Li, Y.X.; Feng, B.X.; Wu, Y.; Zhu, Y.H.; Wei, J. Self-templated synthesis of mesoporous Au-ZnO nanospheres for seafood freshness detection. Sens. Actuator B Chem. 2022, 360, 131662. [Google Scholar] [CrossRef]
  230. Torrarit, K.; Kongkaew, S.; Samoson, K.; Kanatharana, P.; Thavarungkul, P.; Chang, K.H.; Abdullah, A.F.L.; Limbut, W. Flow Injection Amperometric Measurement of Formalin in Seafood. ACS Omega 2022, 7, 17679–17691. [Google Scholar] [CrossRef] [PubMed]
  231. Chang, L.Y.; Chuan, M.Y.; Zan, H.W.; Meng, H.F.; Lu, C.J.; Yeh, P.H.; Chen, J.N. One-Minute Fish Freshness Evaluation by Testing the Volatile Amine Gas with an Ultrasensitive Porous-Electrode-Capped Organic Gas Sensor System. ACS Sens. 2017, 2, 531–539. [Google Scholar] [CrossRef] [PubMed]
  232. Lee, K.M.; Son, M.; Kang, J.H.; Kim, D.; Hong, S.; Park, T.H.; Chun, H.S.; Choi, S.S. A triangle study of human, instrument and bioelectronic nose for non-destructive sensing of seafood freshness. Sci. Rep. 2018, 8, 547. [Google Scholar] [CrossRef] [Green Version]
Figure 1. Schematic illustrations of marine sensors. The insert images of Figure 1 from top and clockwise: (1) deep water gas analyzer developed by the LGR company (Los gatos, CA, USA) [36]; (2) in situ cerium bromide spectrometer for measuring radioactivity underwater, reproduced from [11] with permission from Elsevier Sci. Ltd., 2019; (3) microfluidic in situ analyzer for measuring dissolved Fe in vertical profiles and aquatic environments, reproduced from [37] with permission from Elsevier, 2015; (4) compact, low-power, lifetime-based optode for measuring pCO2, reproduced from [38] with permission from Wiley, 2014; (5) commercial Hydro CTM/CO2, reproduced from [39] with permission from Amer. Meteorological Soc., 2014; (6) electrochemical DNA biosensor for detecting Ostreopsis cf. ovata, reproduced from [40] with permission from Elsevier, 2019; (7) wearable screen-printed biosensor, reproduced from [41] with permission from Royal Soc. Chemistry, 2011; (8) autonomous electrochemical sensor for in situ silicate detection in marine environments, reproduced from [42] with permission from Elsevier Science SA, 2021; (9) ultraefficient trimethylamine gas sensor for rapid assessment of seafood freshness, reproduced from [43] with permission from Elsevier Sci. Ltd., 2022.
Jmse 11 01469 g001
Figure 2. Illustrations and images of bubble, electrochemical, optical and mass-spectrometry methane sensors. (a) Stereo-camera deep-sea sensor bubble box, reproduced from [61] with permission from MDPI, 2016. The top left image is the box without cameras during development. The top right image is the box on remotely operated vehicle. (b) Structure of semiconductor methane sensor with external semipermeable membrane, membrane support, semiconductor part, electronic part and connector, reproduced from [62] with permission from Springer, 2014. (c) Experimental setup of the system based on Raman spectroscopy with liquid-core optical fiber (LCOF) to measure methane dissolved in water, reproduced from [63] with permission from MDPI, 2015. (d) High-pressure test system of fiber refractometer for detecting methane in deep ocean, reproduced from [64] with permission from Elsevier Sci. Ltd., 2014. (e) Camera image and the experimental setup of the Sub-Ocean probe to achieve in situ and continuous detection of dissolved methane in seawater (MFC: mass flow controllers; MB: membrane block; EV: electronic valve; OFCEAS: absorption spectroscopy technique), reproduced from [65] with permission from Amer. Chemical Soc., 2018. (f) Deep-water gas analyzer developed by the LGR company (Los gatos, CA, USA) [36]. (g) Design of the first deep-ocean Raman in situ spectrometer, including two pressure housings for the power/laser/computer and the optical bench, reproduced from [66] with permission from Pergamon-Elsevier Science Ltd., 2004. (h) Major components of self-contained underwater mass-spectrometry system within glass pressure sphere, called “Nereus”, reproduced from [67] with permission from Elsevier Sci. Ltd., 2002. (i) Major components of an underwater cryotrap-membrane-inlet-system-coupled mass spectrometer, including Ricor cooler (K508), membrane inlet system, Pirani pressure sensor and solenoid valve, reproduced from [68] with permission from Wiley, 2012.
Jmse 11 01469 g002
Figure 3. Schemes and images of several radon sensors. (a) Water exchanger RAD-7 continuous monitoring system, reproduced from [9] with permission from Elsevier Sci. Ltd., 2003. (b) In situ cerium bromide spectrometer for measuring radioactivity underwater, reproduced from [11] with permission from Elsevier Sci. Ltd., 2019. (c) Automated pulsed-ionization chamber Oceanic Rn monitor (PIC-ORn)—radon measurement system for tracking radon levels in water over time—reproduced from [82] with permission from Frontiers Media SA., 2022. (d) In situ submersible radon (OUC-Rn) measurement system, reproduced from [8] with permission from Frontiers Media SA., 2022. Submersible capsule houses the parts that are enclosed by the dashed lines.
Jmse 11 01469 g003
Figure 4. Schemes and images of several ferrous ion sensors. (a) Pressure-compensated submersible voltammetric in situ-profiling flow-through cell for real-time ferrous ion measurement in sediment–water interface, reproduced from [110] with permission from IOP Publishing Ltd., 1999. The system is built into titanium housing (100 cm in length, 7 cm in diameter) with pressure sensor and depth sensor also incorporated into the system. (b) Design of three individual channel voltammetric probes and fluidic device of the multiphysicochemical profiler system, reproduced from [114] with permission from Elsevier, 2005. (c) Detection results of Fe ions distribution measured by the combined DET and spectrophotometric approach, reproduced from [118] with permission from Amer Chemical Soc., 2014. The left image shows DGT probe with sulfide (brown color). The middle image shows DET probe with iron (red-purple color) and orthophosphate (blue color). The right image is the false-color composite image of DET probe with orthophosphate distribution (red channel) and iron distribution (green color). (d) Microfluidic in situ analyzer for measuring dissolved Fe in vertical profiles and aquatic environments, reproduced from [37] with permission from Elsevier 2015. The right image shows essential components of the microfluid chip, including its external shape (green color), location of LEDs (large orange rectangles), photodiodes (small orange rectangles), recesses for pump mountings (turquoise color), microfluidic channels (black color), valve ports (pink color) and mounting holes (indigo color). (e) Novel double-cation target colorimetric sensor based on polyazomethine and ascorbic acid for measuring Al3+ and ferrous ions, reproduced from [119] with permission from Pergamon-Elsevier Science Ltd., 2021. (f) Novel sensor based on C18-ferrozine concentration and optical imaging for in situ monitoring of dissolved ferrous ions in sediment pore water, including its structure of the imaging part, sample plate and assembly structure of the concentrating device, reproduced from [120] with permission from Royal Soc. Chemistry, 2019.
Jmse 11 01469 g004
Figure 5. Illustrations and images of carbon dioxide sensors. (a) Commercial Hydro CTM/CO2 including water pump, flow head, semipermeable membrane, equilibrator, heater and NDIR detector, reproduced from [39] with permission from Amer. Meteorological Soc., 2014. (b) In situ optical-fiber chemical pCO2 sensor system for surface seawater, including gas sensing device, optical fiber, Teflon AF tube, indicator/blank solution pump (1), water/air pump (2), detector (3), automatic controller (4), indicator/blank solution reservoir (5), light source (6) and three-way pinch valve (7), reproduced from [143] with permission from Elsevier, 2018. (c) Compact, low-power, lifetime-based optode for measuring pCO2, reproduced from [38] with permission from Wiley, 2014. The top image shows the outside view of the sensor, and the bottom image illustrates the sensing foil made of dual lifetime referencing material coated by a thin film of polyester or with glass support. (d) Ratiometric planar optode fluorosensor system for pCO2 distribution, reproduced from [146] with permission from Elsevier, 2006. (e) GasPro probe for continuous in situ pCO2 monitoring, reproduced from [147] with permission from Amer. Chemical Soc., 2014. The top image illustrates the structure of the GasPro probe, and the bottom image illustrates the spatial distribution of temperature and pCO2 (each black point represents a GasPro sensor). (f) Cross-sections of planar optical sensor for detecting oxygen, carbon dioxide, pH and temperature simultaneously, reproduced from [148] with permission from Springer Heidelberg, 2011. The sensor consists of two sensing layers separated by a silicone layer: the top layer for sensing CO2 and O2 simultaneously and the bottom layer for sensing temperature and pH simultaneously.
Jmse 11 01469 g005
Figure 6. Schemes and images of several biosensors for detection of microorganisms. (a) Electrode array of rRNA biosensor with 16 gold electrodes and a combined counter/reference electrode above the electrode array for in situ detection of toxic algae, reproduced from [159] with permission from Elsevier Advanced Technology, 2008. (b) Electrochemical DNA biosensor with screen-printed electrode array and magnetic oligocomplex immobilization for detecting Ostreopsis cf. ovata, reproduced from [40] with permission from Elsevier, 2019. (c) Design and application of the fish infection microfluidic based teleost model (TelM) platform for rapid detection of microorganisms, reproduced from [161] with permission from Elsevier, 2022. (d) Structure, principle and process of lateral-flow biosensor for detecting Singapore grouper iridovirus (SGIV) in groupers, reproduced from [162] with permission from Elsevier, 2021.
Jmse 11 01469 g006
Figure 7. Marine pollutants and pollutant sensors. (a) Origin and release of pollutants into the marine environment, reproduced from [176] with permission from Elsevier, 2022. (b) Wearable screen-printed biosensor on an underwater garment for in situ analysis in marine environments, reproduced from [41] with permission from Royal Soc. Chemistry, 2011. (c) Components and working principle of fully automatic digital microfluidic diluter-based microalgal motion biosensor including the digital microfluidic diluter chip, an actuation element, and a detector element with the droplet cross-split way, reproduced from [180] with permission from Elsevier Advanced Technology, 2019. (d) Design and working principle of microfluidic chip integrated with marine phytoplankton motility sensor for high-throughput assessment of pollutant toxicity with the two PDMS layers structure and four uniform structure units in the chip, reproduced from [181] with permission from Pergamon-Elsevier Science Ltd., 2014. (e) Field-operable surface-enhanced Raman scattering (SERS) sensor system (EF: edge filters; M: mirror; LBPF: laser bandpass filter; Q: quartz glass window; GR: grism; TE cooled CCD: thermoelectric cooled charged coupled device), reproduced from [182] with permission from Pergamon-Elsevier Science Ltd., 2012.
Jmse 11 01469 g007
Figure 8. Schemes and images of several sensors for marine nutrients. (a) Autonomous electrochemical in situ silicate sensor and its stainless steel cage and battery pack ready for deployment, reproduced from [42] with permission from Elsevier Science SA., 2021. (b) Five major components of improved commercial automated sensor for simultaneous determination of phosphate, silicic acid and nitrate plus nitrite in seawater, including 16-way rotary valves, motor drive of the syringe, the syringe plunger, three colorimetric detectors and electronic controller inside metal box, reproduced from [213] with permission from MDPI, 2022. (c) Detection procedure and working principle of new electrochemical probe for in situ detection of nitrate, nitrite and chloride in seawater (NO: normally open; NC: normally closed; CAL SOL: calibration solution; RE: reference electrode), reproduced from [214] with permission from Amer. Chemical Soc., 2018. (d) Design of a sensor for in situ phosphate detection in seawater based on square-wave voltammetry, reproduced from [215] with permission from Elsevier, 2016.
Jmse 11 01469 g008
Figure 9. Schemes and images of several sensors for seafood. (a) Operational principle of nanoenzyme biosensor with cerium-oxide-nanoparticle-based biosensing label to detect the release of hypoxanthine, reproduced from [228] with permission from Elsevier Science SA, 2021. (b) Self-templated synthesis and monitoring process of semiconductor metal oxide gas sensor based on mesoporous Au-ZnO nanospheres, reproduced from [229] with permission from Elsevier Science SA., 2022. (c) Flow injection amperometric sensor based on glassy carbon electrode modified with palladium particles and carbon microspheres for detecting formalin in fresh fish, reproduced from [230] with permission from Amer. Chemical Soc., 2022. (d) Generation of volatile base amines and working principle of porous-electrode-capped organic gas sensor for detecting volatile amine gas, reproduced from [231] with permission from Amer. Chemical Soc., 2017. (e) Nondestructive and rapid seafood freshness monitoring system, including human evaluation test, instrumental analysis (GC-MS) and olfactory receptor/CNT bioelectronic nose, reproduced from [232] with permission from Nature Portfolio, 2018. (f) Ultraefficient trimethylamine gas sensor based on Au-nanoparticle-sensitized WO3 nanosheets for rapid assessment of seafood freshness, reproduced from [43] with permission from Elsevier Sci. Ltd., 2022.
Jmse 11 01469 g009
Table 1. Characteristics of representative commercial and uncommercial in situ marine methane sensors.
CharacterizationsTarget AnalytesSensing PrincipleDetection RangeDetection TimePrecisionOperation DepthWhether Commercial?References
SnO2-based electrochemical semiconductor sensorCH4 in the waterElectrochemical semiconductor10–4000 nM1–30 min--Yes[71,72,73]
Dissolved gas membrane separation technology integrated with an off-axis integrated cavity output spectroscopyCH4 in the waterOptical0.7–1418.5 nM5 min0.001 nM-Yes[36,74]
Fiber refractometerCO2 and CH4 leakage in the deep oceanOptical-90 s12%Maximum 950 mNo[64]
Sub-Ocean probe based on the optical feedback cavity-enhanced absorption techniqueDissolved CH4 in seawaterOpticalSubnmol to mM30 s3.3–9.3%Test at 620 m depthNo[65]
Cryotrap-membrane-inlet-system-coupled mass spectrometerCH4 in the waterMass spectrometry16–100 nMMilliseconds16 nMMaximum 200 mNo[68]
Continuous-wave cavity ringdown spectroscopy techniqueCH4 dissolved in seawaterOpticalUp to 5 ppmv240 s~0.002 ppmv-No[79]
Table 2. Characteristics of representative uncommercial in situ marine radon sensors.
CharacterizationsTarget AnalytesSensing PrincipleDetection RangeDetection TimePrecisionOperation DepthReferences
Automated radon-222 analyzing system for estimating the dynamics of groundwater input into the coastal zoneRadon-222 in coastal waterCommercial radon-in-air analyzer RAD7 system integrated with a water/gas exchanger2170 ± 830 Bq/m31–2 h5%–10% uncertainties1.5 m[9]
Underwater in situ cerium-bromide-based gamma-ray spectrometerRadon-222 daughters (Bi-214 and Pb-214) in the aquatic environmentGamma-ray spectrometer250 ± 10 Bq/m3 for Bi-2143 h-Operated at 400 m and maximum 600 m[11]
KATERINA gamma-ray spectrometerRadon daughters in the aquatic environmentGamma-ray spectrometer2.8–6.8 Bq/L100 min--[12]
Upgraded KATERINA for measuring radioactivity in the deep oceanRadon daughters in the deep oceanGamma-ray spectrometer0.75–13.4 Bq/L7200 s-2700 m[13]
Gamma-ray spectrometry for in situ measuring of multiple submarine springsActivities of radon progenies for the direct estimation of SGD variationsGamma-ray spectrometer4.73–12.49 Bq/m3~3 hMaximum uncertainty 16.3 ± 2.5Maximum 400 m[10]
Automated pulsed ionization chamber Oceanic Rn monitor (PIC-ORn) measurement systemRadon-222 in the surface oceanPulsed ionization chamber20–300 Bq/m31 h<10% uncertainties1–3 m[82]
Submersible radon (OUC-Rn) measurement systemRadon-222 in the surface oceanPulsed ionization chamber18.0–50.1 Bq/m32 h~95%2.5 m[8]
Table 3. Characteristics of representative commercial and uncommercial in situ marine ferrous ion sensors.
CharacterizationsTarget AnalytesSensing PrincipleDetection RangeDetection TimeDetection LimitOperation DepthWhether Commercial?References
Submersible voltammetric probeTrace metals in surface water, groundwater and sediment–water interfaceElectrochemical-5–10 min0.1 μMAllowable depth of 500 mYes[110]
DET and spectrophotometric approaches to achieve the 2D image of dissolved ironDissolved iron and phosphate in sediment porewatersDET-optical10–200 μM~20 min~1 μM10–80 mmNo[118]
Microfluidic and spectrophotometric in situ analyzerDissolved Fe and Mn in natural watersMicrofluid-optical0–200 μM~3 min27 nMMaximum depth of over 300 mNo[37]
Novel planar optical sensorDissolved Fe2+ distribution in marine sedimentsOptical0–200 μM10–30 min4.5 μM15 cmNo[128]
Polyazomethine/ascorbic-acid-based fluorescent chemical sensorAl3+ and Fe2+ in seawaterOptical20–500 μM-0.185 μM-No[119]
Integration of a C18-ferrozine-based concentrating device and an optical imaging deviceFe2+ in marine sedimentsOptical5–100 μM60–120 min4.5 μM0.6–1.5 mNo[120]
Table 4. Characteristics of representative commercial and uncommercial in situ marine CO2 sensors.
CharacterizationsTarget AnalytesSensing PrincipleDetection RangeDetection TimePrecisionOperation DepthWhether Commercial?References
Hydro CTM/CO2 sensorCarbon dioxide concentration in seawaterGas permeable membrane-optical0–200 mM60 sResolution < 33.4 nM-Yes[144]
Fiber sensorpCO2Optical200–800 μatm120 s0.26–0.37%~1 mNo[143]
Compact, low-power, lifetime-based optodepCO2Optical0–5000 μatm45–264 s±2 μatm5–12.6 mNo[38]
Ratiometric planar optode fluorosensor2D imaging of pCO2 distribution in sedimentsOptical0–20 matm~2.5 min−0.31%0–4 cmNo[146]
GasPro sensorpCO2Gas permeable membrane-optical0.4–4.6 matm2 min±2% accuracy and a detection limit of 0.02 matm0–30 mYes[133,147]
Planar optical sensorOxygen, carbon dioxide, pH and temperature in seawaterOptical0–4 kPa35 s--No[148]
Table 5. Characteristics of representative in situ and non-in situ marine microorganism sensors.
CharacterizationsTarget AnalytesSensing PrincipleDetection RangeDetection TimePrecisionOperation DepthWhether in situ?References
Multiprobe chip and a semi-automated rRNA biosensorSimultaneous detection of up to 14 toxic algaeElectrochemical-Less than 2 h--Yes[159]
Multiplex surface plasmon resonance biosensorToxic bloom of Alexandrium minutum algae on the coastOptical1700–1,700,000 cells/L-<4000 cells/LSampling depth from 0.5 m to 3.5 mYes[160]
Electrochemical DNA-based biosensorOstreopsis cf. ovata in environmental samplesElectrochemical0.086–85.573 ng/μL-RSD < 8.4%-No[40]
Rapid, high-throughput, portable and easy-to-operate fish-based microfluidic platformWaterborne pathogensMicrofluid-optical-1–3 days--No[161]
Lateral-flow biosensorSingapore grouper iridovirusImmunoassay5 × 104–5 × 10⁶ /mLNo more than 90 min--No[162]
Electrochemical DNA biosensorIsothermally amplified ostreid herpesvirus 1 DNA in Pacific oysterElectrochemical10–108 OsHV-1 target copies30 minRSD = 3.8–6.8%-No[169]
Table 6. Characteristics of representative in situ and non-in situ uncommercial sensors for detecting marine pollutants.
CharacterizationsTarget AnalytesSensing PrincipleDetection RangeDetection TimePrecisionOperation DepthWhether in situ?References
Wearable screen-printed biosensor fabricated on underwater garmentsTrace heavy metal contaminants, nitroaromatic explosives and phenolic contaminantsElectrochemicalPhenol: 0–5.5 μM; 4-chlorophenol: 0–25 μM; catechol: 0–5 μM; copper: 10–90 ppb; TNT: 100–900 ppb.60 s2.07%-Yes[41]
Fully automatic whole-algae biosensor consisting of a digital microfluidic diluter chip, an actuation element, a detector element and a microalgae bioreporter.Copper, lead, phenol and nonylphenol in seawaterMicrofluid-opticalCopper: 0.95–3.22 μM; lead: 2.42–5.54 μM; phenol: 2.87–7.01 mM; nonylphenol: 6.34–10.87 μM.2 h--No[180]
Microfluidic chip integrated with a marine phytoplankton motility sensorToxicity of Hg, Pb, Cu and phenol in seawaterMicrofluid-optical-2 h--Yes[181]
Field-operable surface-enhanced Raman scattering sensor systemPolycyclic aromatic hydrocarbons in the Baltic SeaOpticalHeavily polluted waters (>150 (12PAH) ng/L); phenanthrene at the highest concentration (140 ng/L) and of chrysene (2.7 ng/L)-In agreement with the GC/MS determination7–110 mYes[182]
Surface-enhanced Raman scattering based on gold colloidal monolayerNaphthalene and pyreneOptical-10 s--Yes[192]
Portable on-board surface-enhanced Raman spectroscopy sensor systemAnthracene and fluorantheneOptical-10 s--Yes[193]
Table 7. Characteristics of representative in situ uncommercial sensors for detecting marine nutrients.
CharacterizationsTarget AnalytesSensing PrincipleDetection RangeDetection TimePrecisionOperation DepthWhether in situ?References
In situ silicate detection and monitoring in ocean environments without any use of liquid reagentSilicate in oceanElectrochemical1.63–132.8 μM-2.4%1.6 mYes[42]
Improved on-site automated sensorPhosphate, silicic acid, nitrate and nitrite in seawaterColorimetricPhosphate: 0.2–100 μM; silicic acid: 0.2–100 μM; nitrate: 0.5–100 μM; nitrite: 0.4–100 μM180 sRSD of 8.9% for phosphate, 4.8% for silicic acid and 7.4% for nitrate plus nitrite1 mYes[213]
A submersible probe consisting of a desalination unit, an acidification unit and a sensing flow cell containing all-solid-state membrane electrodesNitrate, nitrite and chloride in seawaterElectrochemical-12 s8%2.3 ± 0.3 mYes[214]
In situ seawater phosphate sensor using squarewave voltammetryPhosphate in seawaterElectrochemical0.25–4 μM5 min--Yes[215]
Low-cost, low-light bioluminescence sensorNitrate in marine environmentsBioluminescence0–150 mg/L30 minCoefficient of variance <10%-Yes[216]
Table 8. Characteristics of representative in situ and non-in situ uncommercial marine seafood sensors.
CharacterizationsTarget AnalytesSensing PrincipleDetection RangeDetection TimePrecisionOperation DepthWhether in situ?References
Portable all-in-one nanoenzyme-based biosensor for fish freshness monitoringHypoxanthineColorimetric300–597 μM-±0.2 μM-No[228]
Metal oxide gas sensor based on mesoporous Au-ZnO nanospheresTrimethylamineMeasurement of electrical resistance0.4–10 ppm12 s response time and 127 s recovery time for 10 ppm trimethylamine99.72%-Yes[229]
Flow injection amperometric sensorFormalinElectrochemical0.025–15 mM1 mL/min according to the volume of sampleBetween 96% ± 1% and 105% ± 3%-No[230]
Ultrasensitive porous-electrode-capped organic gas sensorVolatile amine gasOrganic semiconductor10–70 mg/100 g1 mincorrelation coefficient = 0.932–0.998-No[231]
Monitoring system with integrated sensory evaluation, gas chromatography–mass spectroscopy and a bioelectronic noseDimethyl sulfide and trimethylamineChromatography–mass spectroscopy with a bioelectronic nose----Yes[232]
Ultraefficient gas sensor based on Au-nanoparticle-sensitized WO3 nanosheets for assessment of seafood freshnessTrimethylamineMeasurement of electrical resistance1–50 ppm8 s--Yes[43]
Disclaimer/Publisher’s Note: The statements, opinions and data contained in all publications are solely those of the individual author(s) and contributor(s) and not of MDPI and/or the editor(s). MDPI and/or the editor(s) disclaim responsibility for any injury to people or property resulting from any ideas, methods, instructions or products referred to in the content.

