Abstract
The paper introduces the Oil-Slick Hub (OSH), a computational platform to facilitate the data visualization of a large database of petroleum signatures observed on the surface of the ocean with synthetic aperture radar (SAR) measurements. This Internet platform offers an information search and retrieval system of a database resulting from >20 years of scientific projects that interpreted ~15 thousand offshore mineral oil “slicks”: natural oil “seeps” versus operational oil “spills”. Such a Digital Mega-Collection Database consists of satellite images and oil-slick polygons identified in the Gulf of Mexico (GMex) and the Brazilian Continental Margin (BCM). A series of attributes describing the interpreted slicks are also included, along with technical reports and scientific papers. Two experiments illustrate the use of the OSH to facilitate the selection of data subsets from the mega collection (GMex variables and BCM samples), in which artificial intelligence techniques—machine learning (ML)—classify slicks into seeps or spills. The GMex variable dataset was analyzed with simple linear discriminant analyses (LDAs), and a three-fold accuracy performance pattern was observed: (i) the least accurate subset (~65%) solely used acquisition aspects (e.g., acquisition beam mode, date, and time, satellite name, etc.); (ii) the best results (>90%) were achieved with the inclusion of location attributes (i.e., latitude, longitude, and bathymetry); and (iii) moderate performances (~70%) were reached using only morphological information (e.g., area, perimeter, perimeter to area ratio, etc.). The BCM sample dataset was analyzed with six traditional ML methods, namely naive Bayes (NB), K-nearest neighbors (KNN), decision trees (DT), random forests (RF), support vector machines (SVM), and artificial neural networks (ANN), and the most effective algorithms per sample subsets were: (i) RF (86.8%) for Campos, Santos, and Ceará Basins; (ii) NB (87.2%) for Campos with Santos Basins; (iii) SVM (86.9%) for Campos with Ceará Basins; and (iv) SVM (87.8%) for only Campos Basin. The OSH can assist in different concerns (general public, social, economic, political, ecological, and scientific) related to petroleum exploration and production activities, serving as an important aid in discovering new offshore exploratory frontiers, avoiding legal penalties on oil-seep events, supporting oceanic monitoring systems, and providing valuable information to environmental studies.
1. Introduction
An image-processing methodological procedure to identify mineral oil “slicks” (i.e., natural oil “seeps” and operational oil “spills”) based on the sea-surface radar texture was developed during a pilot project conducted in 1997 on the offshore Amazon River mouth basin in the northern Brazilian coast [1]. This proof-of-concept methodology has been tested on a field validation with a controlled oil-spill experiment and the simultaneous acquisition of a RADARSAT-1 image [2]. The success of this methodology led to its use on a permanent, long-term project to monitor oil slicks on the offshore Campeche Bay region in the southeastern Mexican coast [3].
This oil-slick detection methodology has been applied over two decades by the Laboratory of Computational Methods in Engineering (LAMCE) of the Federal University of Rio de Janeiro (UFRJ, Brazil) within the context of a strategic partnership with the Brazilian National Petroleum Company (Petrobras, Brazil) Research and Development Center (Centro de Pesquisas Leopoldo Américo Miguez de Mello: CENPES). This scientific joint venture carried out studies aimed at interpreting oil slicks observed at the surface of the ocean—both in the Mexican portion of the Gulf of Mexico (GMex) and the Brazilian Continental Margin (BCM). A series of projects had as its center of attention many scientific and technical concerns from the offshore petroleum industry, varying between sedimentary basins, exploration blocks, or production fields available through government tender processes both in Mexico and Brazil.
As a result, a substantial oil-slick database acquired with space-borne synthetic aperture radar (SAR) systems was produced. The need to adapt this extremely large amount of information associated with the advent of new artificial-intelligence concepts (e.g., machine-learning techniques (ML)) motivated a reformulation of the existing database, thus fine-tuning it to the present-day technological transformations. This led to the idealization of a “Digital Mega-Collection Database”. This database is a repository of thousands of SAR images acquired between 1997 and 2022. It also contains thousands of oil-slick target polygons and a series of attributes describing the interpreted slicks (e.g., area and perimeter).
Within this scope, an Internet platform (named “Oil-Slick Hub” (OSH)) was developed as a resource that integrates valuable information that can be directly used in defining strategies for offshore petroleum exploration and production, as well as for environmental monitoring programs. The OSH aims to give flexibility to the customization of data visualization and search tools, whose major purpose is to allow easy and fast access to the content of the mega collection, i.e., manage satellite images and oil-slick polygons. The OSH differs from any other WebGIS tool due to a ML module used to classify seeps from spills. The motivation for creating the OSH concerns the research aims of LAMCE/UFRJ and CENPES/Petrobras. This computational platform is presently hosted on a server installed at LAMCE.
The objective of the paper is two-fold: (i) introduce the OSH platform and describe its main functionalities and (ii) integrate the OSH with a ML module to classify oil slicks into oil seeps or oil spills. The paper framework is organized as follows. Section 2 presents a summary of the Digital Mega-Collection Database, the identified oil slicks, the explored satellite images, and the study areas. Section 3 presents the OSH architecture, structure, visual interface environment, and modules. Section 4 reports on two ML-application experiments using the OSH to select subsets of GMex variables and subsets of BCM samples to classify oil slicks. Our results, discussion, conclusions, and recommendations for future work are summarized in Section 5 and Section 6. In the current paper, oil “slicks” refer to oil “seeps” and oil “spills”, and all images are satellite-based.
2. Digital Mega-Collection Database
Because the Digital Mega-Collection Database is an important part of our research, this section is dedicated to describing this repository. Besides including ~15 thousand petroleum signatures observed on the surface of the ocean with ~3 thousand SAR images, the mega collection also includes related technical reports, conference presentations (e.g., [4,5]), M.Sc. dissertations (e.g., [6,7]), Ph.D. theses (e.g., [8,9]), and scientific papers (e.g., [10,11]). The technical reports contextualize the explored satellite imagery and their associated interpreted oil-slick polygons, as well as describe the classification process undergone by each image, also presenting any relevant and available local geological information.
2.1. Oil Slicks versus Satellite Imagery
Operational oil spills are the result of human-related petroleum leakages, whereas natural oil-seep plumes are usually recurring standalone slicks observed on the surface of the ocean of most marine-hydrocarbon provinces [12]. Spills are associated with the direct activity of the petroleum industry, such as those involving the customary procedures on drilling platforms, oil rigs, vessels, or tankers, as well as those linked to the common minor incidents and the rare major accidents of oil-well blowouts, shipwrecks, or groundings [13]. Seeps indicate the existence of oil generation and migration processes, as the knowledge of their location may reduce the geological risks in new exploratory frontiers while facilitating the identification of active petroleum systems [14].
Even though other sensors (e.g., visible [15] or hyperspectral [16]) may be used to identify oil slicks, SAR is deemed the best satellite sensor to scan large oceanic areas for the surveillance of oil slicks, being capable of operating day and night in almost any weather condition while maintaining high spatial resolution [17]. The detection of sea-surface oil slicks with SAR images is possible when there is a smoothing of capillary waves caused by the presence of oil-spill leakages or oil-seep plumes [18]. Oil on the ocean’s surface forms a layer of sub-millimeter to centimeter thickness that increases local viscosity. The formation of capillary waves usually occurs when ideal wind speeds range between >3 m/s and <10 m/s [19,20].
Despite SAR’s ability to detect oil slicks, these targets may be misinterpreted due to environmental phenomena that have a similar signature as oil in SAR imagery [21]. These false targets are known as “look-alike slicks”, e.g., low-wind speeds, upwelling conditions, algal blooms, rain cells, and biogenic films [22]. Therefore, identifying sea-surface oil slicks with remotely sensed SAR satellites is not a simple task [23].
During the execution of the numerous projects that provided data to the mega collection, the acquired SAR imagery was processed using the Unsupervised Semivariogram Textural Classifier (USTC [2]). This image processing procedure allowed an accurate interpretation of oil-slick targets. All satellite images were processed using the PCI Geomatica. Georeferenced 8-bit scaled SAR images (RADARSAT-1, RADARSAT-2, and Sentinel-1, each of which was built on experiences gained from its processor) have been used.
- −
- RADARSAT: The two RADARSAT satellites were built in collaboration between the Canadian Space Agency (CSA) and MacDonald, Dettwiler, and Associates Ltd. (MDA). They both perform SAR C-band imaging (λ = 5.6 cm), have a circular and sun-synchronous orbit, and fly on altitudes of ~798 km with an inclination of 98.6° and period of 100.7 min, allowing them to fully cover the Earth’s surface within 24 days for the same operating mode [24]. RADARSAT-1 was launched in 1995 and obtained images with a wide variety of nominal resolutions (8 to 100 m), incidence angles (10° to 49°), and coverage areas (from 50 × 50 km to 500 × 500 km); this satellite is no longer in operation. RADARSAT-2, launched in 2007, in addition to having additional spatial resolution options, wider incidence angles, and larger imaged areas, has more advanced features, such as data acquisition in different polarization combinations, the ability to image both right and left sides, and obtaining high spatial resolution data (~3 m).
- −
- Sentinel-1: The recent European Space Agency’s (ESA) Sentinel-1 mission carries a C-band multi-polarized SAR sensor with vertical–vertical (VV), horizontal–horizontal (HH), and VH and HV polarizations. The two Sentinel-1 satellites, launched in 2014 (1A) and 2016 (1B), can provide a large number of images over continents and oceans, with different modes of data acquisition, allowing the usage of distinct nominal resolutions, angles of incidence, and imaged bandwidths. The great advantage of the Sentinel-1 satellites is to provide data without further costs. On the other hand, their main disadvantages are: (i) a temporal resolution of 12 days for the same location and (ii) an image acquisition with the same characteristics not allowing the imaging mode choice. This satellite operates in four exclusive acquisition modes [25], but its main acquisition swath mode allows combining a swath width of 250 km with a moderate geometric resolution of 5 m to 20 m [26]. Sentinel-1A is still in operation, whereas Sentinel-1B has been retired.
2.2. Study Areas
The mega collection contains information from two study sites where the presence of oil slicks has already been historically verified: the Mexican GMex coast and along the BCM. While satellite-domain specialists interpreted all satellite images, most of the identified oil slicks were field-validated by the Mexican state-owned petroleum company (Petróleos Mexicanos: Pemex) and Petrobras offshore staff. The GMEx database is comprehensively described elsewhere; please refer to Carvalho et al. [3].
- −
- Gulf of Mexico (GMex): The GMex oil slicks have been imaged from 2000 to 2012, mostly in the production and exploitation region of salt diapirs in the Mexican portion of the Gulf, Campeche Bay (Figure 1). These data are a result of a long-term joint effort project between LAMCE/UFRJ, CENPES/Petrobras, Pemex, and MDA that permanently monitored oil slicks in the regions of interests of the Mexican company [3]. It consists of ~14 thousand interpreted oil-slick targets with a well-balanced seep–spill distribution: seeps (~45%) versus spills (~55%). Measurements from the two RADARSAT satellites are included in the GMex database. Even though the studied GMex oil slicks come from a specific portion of the Gulf, the observed seep–spill balance matches a global oil-slick inventory completed by Dong et al. [27], in which 43.3% of the Gulf of Mexico slicks imaged with Sentinel images acquired between 2014 and 2019 were seeps.
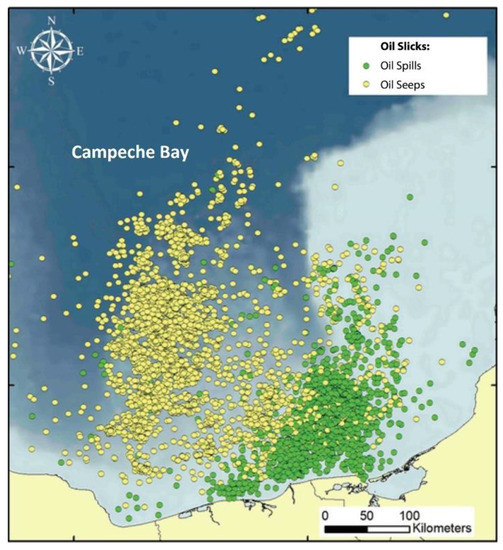 Figure 1. Location of the explored oil slicks in Campeche Bay (Mexican Gulf of Mexico—GMex): oil spills (green circles) and oil seeps (yellow circles).
- −
- Brazilian Continental Margin (BCM): Almost one thousand BCM oil slicks were acquired between 1998 and 2021, during which numerous projects were carried out between LAMCE/UFRJ and CENPES/Petrobras. Most of these projects were carried out with an exploration focus, which produced unbalanced seep–spill distributions—most oil-slick targets are oil seeps. Fourteen of the sixteen offshore sedimentary basins off the Brazilian coast were investigated; these are listed in Figure 2 from north to south: Amazonas River Mouth Basin (26 targets), Barreirinhas (13 targets), Ceará (40 targets), Potiguar (44 targets), Pernambuco-Paraíba (16 targets), Sergipe-Alagoas and Jacuípe (51 targets), Camamu-Almada (47 targets), Jequitinhonha (22 targets), Cumuruxatiba (24 targets), Espírito Santo (250 targets), Campos (164 targets), Santos (150 targets), and Pelotas (55 targets). Exceptions are the Pará-Maranhão (to the north) and Mucuri (to the southeast) basins. Measurements from different SAR satellites are included in the BCM database: RADARSAT-1, RADARSAT-2, and Sentinel-1.
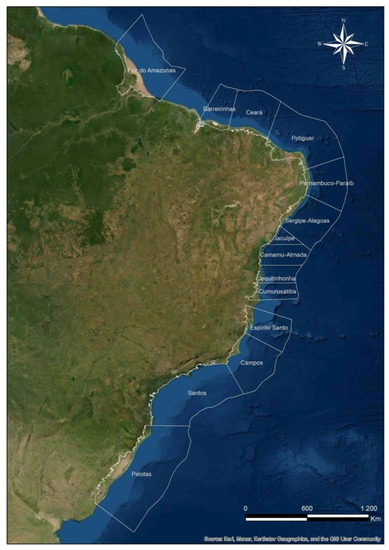 Figure 2. Fourteen investigated sedimentary basins on the Brazilian Continental Margin (BCM).
3. Oil-Slick Hub (OSH)
The OSH offers an information retrieval system that allows straightforward access to a specific, large database of satellite images and technical reports related to research projects carried out to identify mineral oil slicks on the surface of the ocean—Digital Mega-Collection Database. This Internet platform provides interactive maps, which offer resources for selecting, viewing, and downloading the selected papers, reports, satellite images, georeferenced slick polygons, and a series of attributes describing the interpreted slicks. A flowchart summarizes the main methodological steps of the OSH in Figure 3.
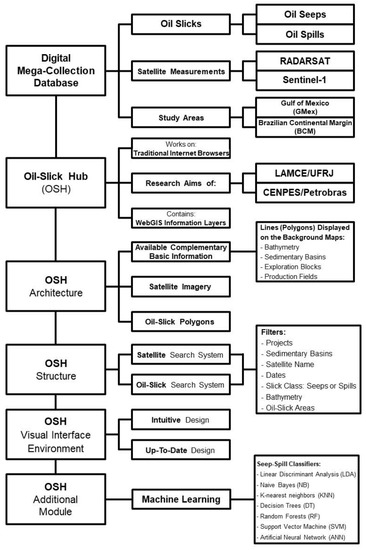
Figure 3.
Main Oil-Slick Hub (OSH) methodological steps.
Two Internet platforms served as inspiration and reference for designing the OSH: (i) the National Centers for Environmental Information (NCEI) Maps and Geospatial Products within the National Oceanic and Atmospheric Administration’s (NOAA) [28] and (ii) the ESA’s Copernicus Open Access Hub—Scihub [29]. The NCEI platform consists of data visualization tools to display various types of data on a single viewing environment, thus combining different information and several variables of specific locations—marine geology, geophysics, bathymetry, and climate monitoring are examples of data types that can be viewed with this platform. Scihub is a platform in which users can access the Sentinel mission satellite data; this includes satellite images, oil slicks, water quality, wind, waves, ships, agriculture, and deforestation monitoring, among other data.
The OSH was designed to work efficiently on the web through the most popular and traditional browsers; it can be accessed from different types of devices, not only desktop computers or notebooks but also mobile devices such as tablets and smartphones, regardless of the operating system. The rationale for designing the OSH was directly related, but is not limited, to LAMCE/UFRJ scientific research purposes and CENPES/Petrobras petroleum production and exploration plans of actions. Any further developments of this computational platform (including but not limited to the acquisition of more data or the availability of the URL to the general public) directly depend upon the approval of upcoming funding to guarantee the proper functioning of this Internet tool that requires maintenance, and consequently, future and regular supporting grants.
3.1. OSH Architecture
The architecture of the OSH and its output-display results use a set of tools for visualizing the satellite-image data, oil-slick polygons, and related information. As such, the OSH architecture is divided into three parts:
- −
- Part I—Basic Information: This refers to the “available complementary basic information” to be displayed on the background maps: lines (polygons) representing the bathymetry, sedimentary basins, offshore exploration blocks, and production fields;
- −
- Part II—Satellite Images: This comprises the access to the satellite images that are shown in a reduced and optimized format to allow them to be easily uploaded and displayed online; and
- −
- Part III—Oil-Slick Polygons: This comprises displaying the seep–spill polygons and the associated attributes describing them, such as target identification, class (seep or spill), area, and perimeter of the oil-slick polygons, among other variables.
Each of these three parts contains a unique database system file that is organized into categories. This makes the search system’s filters work effectively; the search systems and their respective filters are explained in Section 3.2 below. A set of server-level scripts allows the OSH to receive new additional data to the current mega collection. Any new individually added data are automatically included in an easy, automatic, and fast way to an exclusive system file of each part.
3.2. OSH Structure
The OSH was structured to facilitate data visualization according to the user’s choice. The user has easy access to WebGIS information layers that display the available complementary basic information. Another information the user can access is the site location (latitude and longitude) given by the mouse pointer when navigating the map; this makes it easier to identify the location of georeferenced polygons and satellite images.
The information within the mega collection can be accessed by means of two specific search systems—one to search for satellite-related information and another to search for information concerning the oil-slick data. In both search systems, users can select several predefined filters. In the first search system, the satellite information can be looked for by means of four individual filters: (i) project; (ii) sedimentary basin; (iii) satellite name; and (iv) dates (start and end: day, month, or year). In the second search system, besides performing the same four satellite filters, oil-slick polygons are also explored by three additional filters: (i) slick class (seeps or spills); (ii) minimum and maximum bathymetry; and (iii) minimum and maximum oil-slick areas. We are considering further developing this filter to include the slick metadata name ID (i.e., identification), as this might assist in large eventual accident studies. To provide a light, clean, and uncluttered interface, by default, only a portion of the mega-collection metadata is offered as filtering options. However, this can be customized for specific applications—see Section 4 below.
3.3. OSH Visual Interface Environment
The OSH interface was planned to have a simple view of background maps and data of interest. The OSH layout has buttons to activate the satellite and oil-slick data search systems, as well as to show the available complementary basic information. The OSH has an intuitive and up-to-date design to obtain a forthright and uncluttered view of the mega collection.
Prior to the implementation of the OSH, a careful investigation was conducted to analyze the mega-collection content, e.g., data types and file sizes and formats. A meticulous study was also carried out on the many associated technical report documents. This data preparation helped to determine the unique OSH architecture, the optimum data structure to be implemented, the finest type of visualization solution to be adopted, and the most efficient scripts to be used. These actions aimed to meet requirements of computational efficiency, interactivity, and online access.
After this pre-planning, a trial version of the OSH was developed using a small set of real data from the mega collection. This served as a ground base for testing the OSH proof-of-concept stage. Then, once these initial evaluations were completed and satisfied, a first definitive version was defined using the entire mega-collection database. A series of illustrative figures depict below some of the OSH functionalities.
Figure 4 (top panel) presents the initial OSH screen—a two-dimensional background map of the BCM. On the uppermost right of this figure, a menu is shown where it is possible to choose different types of background maps and layers that display information, such as the different federal states and the available complementary basic information. It is possible to observe another displayed map type in Figure 4 (bottom panel). Figure 5 displays the coastal bathymetry (top panel) and the exploration-block shapefiles (bottom panel).
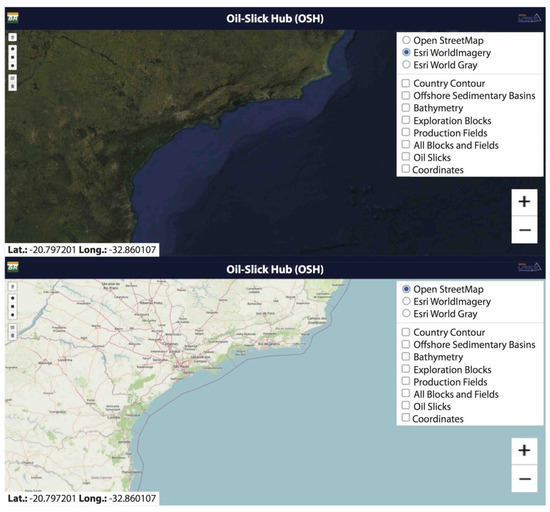
Figure 4.
Oil-Slick Hub (OSH) main screen (top panel) and map with roads and street names (bottom panel). The layer’s menu is shown on the top right.

Figure 5.
Coastal bathymetry (top panel) and exploration block shapefiles (bottom panel).
Figure 6 illustrates the open menu for accessing the two search systems options (Section 3.2). This menu, which is activated when clicking on the uppermost left menu, allows the user to search, display, and filter for both satellite and oil-slick data. This menu includes the different filter options for each search system: project name, sedimentary basin, explored satellite, and start and end date. Other filters are offered only for the oil-slick data search system, as follows: class (seeps or spills), bathymetry (minimum and maximum values), and slick areas (minimum and maximum values).

Figure 6.
Data system menu to search, display, and filter for satellite and oil-slick data.
Figure 7 (top panel) displays a georeferenced satellite-image shapefile frame resulting from the search engine illustrated in Figure 6. By clicking on the frame, a menu opens containing the satellite-image information and an option to download and view the satellite measurement. Upon clicking on the ‘Quick Look’ button, the satellite image related to that specific frame is displayed (Figure 7: bottom panel). Figure 8 shows the oil-slick shapefiles resulting from a certain search combining the satellite frame depicted in Figure 7 and a bathymetry layer.
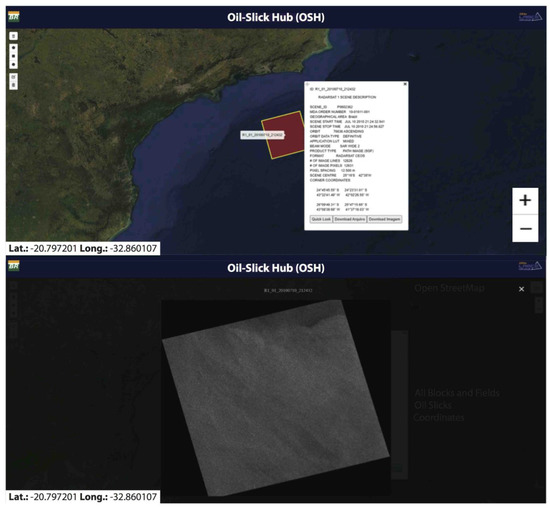
Figure 7.
Satellite-image shapefile frame (red square) and its associated information menu (top panel). Display of a synthetic aperture radar (SAR) satellite image (bottom panel).
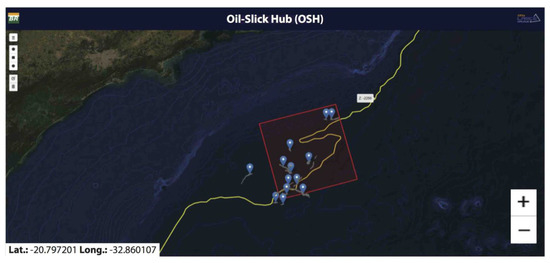
Figure 8.
Example of oil-slick shapefiles and satellite frame (red square) displayed after a combined georeferenced satellite-image search with a bathymetry layer (2250 m).
3.4. Additional OSH Modules
Besides promoting access and straightforward data visualization of the mega-collection information, the OSH was developed by taking into account the integration with modules for data preparation, treatment, and processing. One of these modules uses ML techniques to differentiate sea-surface oil-slick targets observed in SAR imagery—this is described in Section 4 below. The use of the ML module is indeed one of the foremost differentials between the OSH and any other WebGIS tool.
The ML module within the OSH is based on a previous Ph.D. investigation [9] and ongoing research [3,10,30,31,32,33,34]. Dr. Carvalho disclosed in his Ph.D. thesis that it is possible to use only two basic morphological variables (area and perimeter) to classify slicks into seeps and spills with one of the simplest ML classification methods, i.e., linear discriminant analysis (LDA [35]); this is further considered in Section 4.1 below. In a continuous effort to improve the slick classification, other “traditional” ML methods were also explored and tested for the seep–spill classification task: naive Bayes (NB), K-nearest neighbors (KNN), decision trees (DT), random forests (RF), support vector machines (SVM), and artificial neural networks (ANN). This is addressed in Section 4.2 below. The next research steps of our future studies are to compare these simple and traditional ML methods with “deep-learning” methods (DL [36]), thus trying to improve even further the detection performance of oil-slick targets—see Section 6.1 below.
4. Classification Experiments
Among the many major advantages of using ML classifiers to distinguish seeps from spills is that potential slick targets interpreted by human operators can reach increased reliability based on artificial intelligence [37]. In fact, the OSH-ML module is suitable for analyzing a set of thousands of satellite images and thousands of oil-slick targets such as those explored here.
Here, two ML classification experiments have been conducted to explore the selection options and capabilities of the OSH. This selection approach facilitates and automates the choice of subsets of variables and subsets of samples. An initial case-study experiment was put forward in Section 4.1 to verify the ability of OSH to select variable subsets, in which the GMex database was explored. An additional case-study experiment was proposed in Section 4.2 to verify the OSH capacity in selecting sample subsets, in which the BCM database was exploited.
The accuracies of our classifiers were rated following a specific methodology, in which five evaluators were directly extracted from 2-by-2 confusion matrices [38]: (i) overall accuracy: ratio of all accurate decisions by all possible results; (ii) sensitivity: informs how well known oil-spills targets were classified; (iii) specificity: informs how well known oil-seep targets were classified; (iv) positive-predictive value: reports how well the models classified known oil spills; and (v) negative-predictive value: reports how well the models classified known oil seeps. The outcomes of our algorithms (predicted classes) were compared to baseline interpretations performed by experts (true classes), and for an algorithm to be considered valid and useful, all five performance metrics must simultaneously reach a “performance benchmark” [39]—i.e., 60%, as suggested by Carvalho [9]. The algorithms were voided, with at least one metric falling below this limit.
Even though the five performance metrics explored here provide an easy, thorough description of the algorithms performance, the performance of classification algorithms can be evaluated in several other ways [40]. Other than the explored metrics, one could possibly measure the effectiveness of classification algorithms with the area under the curve (AUC [41]), Cohen’s Kappa coefficient [42], F-measure (i.e., square root of sensitivity times the positive-predictive value [43]), etc.
The ML classification experiments described in the two subsections that follow are a product under development, and this is the first time the ML module is used as an active OSH function. Besides automatically differentiating seep–spill targets already existing in the mega collection, the OSH-ML module can promote the use of pre-trained ML algorithms to be applied to new data, even from different regions (transfer learning). Considered upcoming initiatives are further discussed in Section 6.1 below.
4.1. Variable Subsets: Linear Discriminant Analysis (LDA) in the Gulf of Mexico (GMex)
The entire GMex database was used to select variable subsets (Section 2.2). Different variable subsets were applied to LDAs. This elementary but powerful classifier generates a linear discriminant function, as opposed to other more complex ML classifiers, such as those explored in the second experiment shown in Section 4.2 below. Past studies also used this computationally efficient classification method to classify oil-slick signatures [30,31].
All samples within the GMex database were used to train the LDAs. In addition to non-transformed data, cube root, and log10 transformed data were also considered. Nineteen variable subsets were investigated using the three available types of attributes: (i) acquisition aspects (eight variables: satellite name, beam mode, date, month, season, acquisition time, and daylight or nighttime image acquisition); (ii) morphological information (17 variables, e.g., area, perimeter, perimeter to area ratio, etc.); and (iii) location attributes (three variables: latitude, longitude, and bathymetry). This study did not include Meteorological and Oceanographic conditions as did Carvalho et al. [32,33,34]; such information was not logged during the projects that collected the data.
4.2. Sample Subsets: Machine-Learning Classifiers in the Brazilian Continental Margin (BCM)
Different sample subsets were selected from the BCM database (Section 2.2). These subsets were applied to six traditional ML techniques, which were divided into “simple” (NB, KNN, and DT) and “advanced” (RF, SVM, and ANN). The same pool of classification methods was used in another past study but applied to classify ocean-slick signatures: oil spills versus look-alike slicks (Carvalho et al. [34]—see references therein for more about these ML techniques).
Here, only non-transformed data were considered. The evaluation of these ML techniques occurred with a random subsampling cross-validation method repeated ten times, in which the available samples were divided into two fixed partitions: 70% for training and 30% for testing [44]. The algorithms were evaluated based on the test partition.
Because of the large spatial-temporal sampling range of the BCM samples, of the fourteen explored sedimentary basins, this second case study considered only three of them: Campos, Santos, and Ceará (Figure 2). The first two basins, located on the southeast coast of Brazil, have well-developed oil and gas reservoirs with many long-established exploration and production offshore facilities, whereas the latter basin is on the northeast Brazilian coast, being a promising new region recently arousing attention from petroleum companies, such as Petrobras. Within this scope, four sample subsets were proposed using data from these three BCM basins: (i) all three basins together; (ii) Campos with Santos; (iii) Campos with Ceará; and (iv) only samples from Campos.
This experiment used all 13 descriptive morphological variables within the BCM database; this set of variables was also one of the variable subsets used in the first experiment. Differently from the Gmex database, the seep–spill balance of the BCM database is not uniformly distributed within the three basins. Regarding the number of seeps and spills explored here, while all samples in Santos are seeps, Ceará has most of them also as seeps (4/5 s), and Campos has a close to 50/50 class balance. When all three basins are considered together, the ratio is 3/4 of seeps and 1/4 of spills.
5. Results and Discussion
5.1. Classification Experiment I: LDA in the GMex
The classification results of the first experiment are depicted per variable subset in the several plots found in Figure 9. From this figure, a two-fold main outcome is observed. The first one was that transformed data (cube root and log10) reached superior accuracies than non-transformed data, independently of variable subsets or performance metrics. The second one was a clear accuracy-performance pattern guided by the type of attribute accounted for (i) only acquisition aspects (GMex.1); (ii) all three attribute types, only morphological information with location attributes, or only location attributes (GMex.1 to GMex.9); and (iii) only morphological information (GMex.10 to GMex.19).

Figure 9.
Classification results of the 1st experiment that used the Oil-Slick Hub (OSH) to select variable subsets of the Gulf of Mexico (GMex) database applied to linear discriminant analysis (LDA); see Section 5.1. (A) Overall accuracy. (B) Sensitivity. (C) Specificity. (D) Positive-predictive value. (E) Negative-predictive value. Data transformations: non-transformed (blue), cube root (red), and log10 (green). The investigated nineteen variable subsets are numbered: GMex-1 to GMex.19. Variable subsets were chosen from the three available attribute types: (i) acquisition aspects (8 variables: satellite name, beam mode, date, month, season, acquisition time, and if the image was acquired at daylight or nighttime); (ii) morphological information (17 variables, e.g., area, perimeter, perimeter to area ratio, etc.); and (iii) location attributes (3 variables: latitude, longitude, and bathymetry). Variable subset groups: (i) only acquisition aspects (GMex.1); (ii) all three attribute types, only morphological information with location attributes, or only location (GMex.1 to GMex.9); and (iii) only morphological information (GMex.10 to GMex.19). Different data transformation: none with cube (blue), none with log (red), and cube and log (green).
Regarding the observed accuracy-performance pattern of the variable subset results, one should note three relevant matters about the information shown in Figure 9 plots:
- −
- Least Accurate (~65%): In addition to having the lowest overall accuracy, the subset of variables solely using acquisition aspects (GMex.1) had poor accuracy levels on other performance metrics (<60%), so it was considered void.
- −
- Best Result (>90%): The higher overall accuracies were achieved with the inclusion of location attributes (GMex.2 to GMex.9). These successful results were always accompanied by high values in the other four performance metrics. Likewise, when only two location attributes (latitude and longitude) were considered, the overall accuracy remained at about ~90% (GMex.9). This clearly demonstrates that the GMex database has a strong dependence on the sample location. To this matter, one should note that while Figure 1 qualitatively displays that seeps and spills tend to occur in different regions of the Mexican Gulf of Mexico, this experiment has quantitatively defined the seep–spill distinguishment using a simple ML technique, i.e., LDA. Consequently, even though the use of location variables was successful in the GMex database, it is possible that these algorithms cannot be applied in other regions with different latitudes and longitude domains (transfer learning).
- −
- Moderate Performance (~70%): All ten variable subsets using only morphological information (GMex.10 to GMex.19) reached overall-accuracy levels of ~70%. However, not all subsets were deemed useful based on the other performance metrics—performance benchmarks < 60% were observed; see + and − signs in Figure 9. Even though superior accuracies were achieved when location attributes were included, the exclusive use of morphological information increases the chance to apply the algorithms using these combinations of variables to new data, even from different regions (transfer learning), as one can surely find samples within the same domain as the morphological information (e.g., area, perimeter, perimeter to area ratio, etc.) explored in the mega collection.
An unprecedented complementary achievement observed in this experiment is related to the successful accuracy performance reached exclusively using one piece of morphological information, i.e., we were able to use a single variable to classify oil slicks with ~70% overall accuracy. This occurred in two cases: in GMex.14 using a Compact Ratio ((CMPCT = 4 × Pi × area)/(perimeter^2)) and in GMex.15 solely using the slick area. While the latter was void due to performance metrics < 60%, the former was valid with values reaching ~70% of overall accuracy. These two subsets exclusively account for only one variable consisted of a pair of data transformations: none with cube (blue), none with log (red), or cube and log (green), as color-coded in Figure 9. The use of only one variable undergoing different data transformations to classify oil slicks is a clear indication that our continuous research effort continues improving the seep–spill classification and providing up-to-date knowledge to the oil-slick satellite remote-sensing community [3,9,10,30,31,32,33,34].
5.2. Classification Experiment II: ML in the BCM
This experiment produced 24 different classification outcomes: four sample subsets times six traditional ML techniques. These are presented in Table 1. From this table, we observe that simple and advanced ML techniques similarly and successfully discriminated seeps from spills.

Table 1.
Classification results of the second experiment that used the Oil-Slick Hub (OSH) to select sample subsets of the Brazilian Continental Margin (BCM) database applied to six machine-learning (ML) techniques: naive Bayes (NB), k-nearest neighbors (KNN), decision trees (DT), random forests (RF), support vector machines (SVM), and artificial neural networks (ANN). The seep–spill balance, fixed 70–30 train–test partitions, overall accuracies (given based on the test set), ranks (between parentheses), and valid (+ and −) maximum (Max.) and minimum (Min.) accuracies are shown. The hashtag (#) indicates void sample subsets, i.e., at least one performance metric below the performance benchmark of 60%. See Section 5.2.
In the two subsets considering samples from Santos Basin (all three basins together and Campos with Santos), seven of the twelve possible results were deemed void, i.e., at least one performance metric had a performance benchmark <60%; see hashtag (#) in Table 1. The cause for such a pattern is that, in Santos, there were no spill samples, and these samples represent 42.4% of considered oil slicks (Section 4.2); consequently, this caused an unbalanced class distribution in the subsets considering those samples. On the other hand, all of the other twelve possible results, not considering Santos’ samples (Campos with Ceará and only samples from Campos), were valid and useful in all five performance metrics (Table 1).
The best ML technique was not the same in all four BCM sample subsets. A close analysis of Table 1 indicates that advanced techniques usually had slightly superior accuracies. The exception was a simple technique (NB) that was three times the second-best algorithm. NB was deemed the most effective algorithm once because the best algorithm (RF) instance was void; the unbalanced seep–spill observed in Campos with Santos samples may have caused this pattern. Independently of the applied ML techniques, the maximum valid overall accuracies in the four BCM sample subsets were all >85%, whereas their minimum valid overall accuracies were still all >70% (Table 1). Among the valid results, the most effective algorithms per sample subsets were as follows:
- −
- RF (86.8%): Campos, Santos, and Ceará;
- −
- NB (87.2%): Campos with Santos;
- −
- SVM (86.9%): Campos with Ceará; and
- −
- SVM (87.8%): Only Campos.
An interesting analysis that one can make is to compare the ML results with the LDA ones. The results from using the same variable subset of 13 variables (GMex.11) explored on the six ML-technique BCM experiment (>85%) were superior to those from the analogous LDA results of the GMex experiment (~70%).
6. Conclusions
One of the main differentials of the Internet platform presented here (Oil-Slick Hub (OSH)) is that it gives access to a long-term satellite database of mineral oil slicks (Digital Mega-Collection Database). The OSH accommodates the investigation intents of the Laboratory of Computational Methods in Engineering (LAMCE) of the Federal University of Rio de Janeiro (UFRJ, Brazil) and the Brazilian National Petroleum Company (Petrobras, Brazil) Research and Development Center (Centro de Pesquisas Leopoldo Américo Miguez de Mello: CENPES). It facilitates data visualization while offering reliable information search and retrieval systems, being designed to be a friendly system working efficiently on traditional Internet browsers. The OSH refines the identification, implementation, testing, and validation of classification algorithms to handle large volumes of data acquired by several synthetic aperture radar (SAR) systems used to detect sea-surface petroleum signatures.
This study brought together an important technical–scientific mega collection and a customized Internet platform. This duo has the capacity of being a helpful management tool for studies applied to the oil and gas industry, for example, data analyses aiming at discovering new offshore exploratory oil frontiers and avoiding legal penalties on oil-seep events. The versatility of the mega collection and OSH pair can meet not only the demands of the petroleum industry but also other related purposes, such as providing valuable information to data assimilation predictive models, oceanic monitoring systems, environmental studies, etc.
The OSH can receive data preparation, treatment, and processing modules. The first of them, a machine-learning (ML) module, facilitates the implementation of oil-slick classifiers with a quick and accurate strategy to discriminate oil seeps from oil spills. Prior to applying the OSH-ML module, several data preparation procedures (e.g., data statistics, missing data, outliers, data transformations, class asymmetry, etc.) were performed to define subsets of variables and subsets of samples from the mega collection. These subsets were suitable to the two considered case sites, the Gulf of Mexico (GMex) and the Brazilian Continental Margin (BCM).
In the two classification experiments, different ML techniques, from the simplest (linear discriminant analysis: LDA) to more complex classifiers (e.g., support vector machines: SVM), were evaluated. These two application experiments served as case study examples of what could become pre-trained classifiers available for OSH users to be applied to other data, thus being able to carry out transfer-learning studies in any other region.
The first experiment demonstrated that location attributes (latitude, longitude, and bathymetry) control the GMex database seep–spill differentiation when LDAs were applied. Overall accuracies of >90% have been reached when these attributes were considered. If location attributes were not included, and only morphological information (e.g., area, perimeter, perimeter to area ratio, etc.) was accounted for, overall accuracies of ~70% were observed independently of the variable subset (Figure 9). Regarding eventual transfer-learning applications, while location-attribute domains are not easily found to be the same in different regions, the morphological-information domain of slicks has a greater chance of being met.
The implementation of six ML techniques in the second experiment demonstrated that if one were to choose a single ML technique, and a region within the BCM database, to increase its chance to discriminate seeps from spills, SVM in Campos Basin would be recommended (Table 1: 87.8%). However, it has been confirmed that any of the six explored ML techniques, regardless of which basin was analyzed, had a similar capability to propose successful seep–spill classifications.
6.1. Recommendations and Future Work
The OSH can receive a much larger dataset than the current content of the Digital Mega-Collection Database. The acquisition of measurements from additional SAR satellites, such as those from newer constellation missions, e.g., [45,46], can reduce current temporal frequency gaps in the search for potential oil-slick targets. Moreover, the use of measurements from various SAR satellites can increase the offshore operation planning of the petroleum industry, thus improving the reliability of offshore exploration and production activities.
New oil-slick targets will also be incorporated into the mega collection in eventual upcoming projects. Additional sea-surface targets (i.e., look-alike slicks) are also planned to be registered and not discarded on newly acquired images. Within this scope, besides being successfully used on seep–spill differentiations, the OSH will also facilitate the ML classification of other potential targets, e.g., oil slicks versus look-alike slicks [32,33].
Additionally, despite our successful ML classification results, a further step into improving the seep–spill classification accuracies is the use of DL architectures. The understanding of which parameters, domains, and classifiers can be trained in data of regions with proven oil-slick targets, such as the GMex ones, can be effectively applied in classifying features of different regions, such as those off the BCM, or vice versa—this is referred to as transfer learning [47].
Three other future possible initiatives are as follows:
- −
- Obtaining more accurate models by collaborating with classifiers and maintaining data privacy: federated learning, also called collaborative learning [48];
- −
- Besides using supervised ML or DL methods, classification training may reach efficient results if unsupervised learning or self-supervised learning methods are used [49]; and
- −
- Determining the classification uncertainties via probability methods to try to increase the oil-slick classification reliability [50].
Author Contributions
N.F.F.E.: conceptualization, investigation, methodology, supervision, and writing (original draft, editing, and review); F.P.d.M.: funding acquisition and writing (review); L.L.: funding acquisition, supervision, and resources; C.B.: data curation; P.M.S.: data curation, formal analysis, investigation, methodology, and writing (original draft); G.C.: data curation, formal analysis, investigation, methodology, and writing (original draft and review); M.C.S.L.: data curation, formal analysis, investigation, methodology, and writing (original draft and editing); L.M.D.: data curation, formal analysis, investigation, methodology, and writing (original draft and editing); G.d.A.C.: conceptualization, data curation, formal analysis, investigation, methodology, and writing (original draft, editing, and review). All authors have read and agreed to the published version of the manuscript.
Funding
The Brazilian National Postdoctoral Program (Programa Nacional de Pós Doutorado: PNPD) of the Coordination for the Improvement of Higher Education Personnel (Coordenação de Aperfeiçoamento de Pessoal de Nível Superior: CAPES), Carlos Chagas Filho Foundation for Supporting Research in the State of Rio de Janeiro (Fundação Carlos Chagas Filho de Amparo à Pesquisa do Estado do Rio de Janeiro: FAPERJ), and Petróleo Brasileiro S.A. (Petrobras—Cooperation Agreement number 2018/00241-1).
Acknowledgments
We are grateful to: (i) Roberta Santana and Peter J. Minnett for constructive discussions; (ii) Carlos “Papito” Castro for the English improvement amendments; and (iii) the Canadian Space Agency (CSA) and MacDonald, Dettwiler, and Associates Ltd. (MDA) for the Earth observation satellite data.
Conflicts of Interest
The authors declare no conflict of interest.
References
- Almeida-Filho, R.; Miranda, F.P.; Lorenzzetti, J.A.; Pedroso, E.C.; Beisl, C.H.; Landau, L.; Baptista, M.C.; Camargo, E.G. RADARSAT-1 Images in Support of Petroleum Exploration: The Offshore Amazon River Mouth Example. Can. J. Remote Sens. 2005, 31, 289–303. [Google Scholar] [CrossRef]
- Miranda, F.P.; Quintero-Marmol, A.M.; Pedroso, E.C.; Beisl, C.H.; Welgan, P.; Morales, L.M. Analysis of RADARSAT-1 data for offshore monitoring activities in the Cantarell Complex, Gulf of Mexico, using the unsupervised semivariogram textural classifier (USTC). Can. J. Remote Sens. 2004, 30, 424–436. [Google Scholar] [CrossRef]
- Carvalho, G.A.; Minnett, P.J.; de Miranda, F.P.; Landau, L.; Moreira, F. The Use of a RADARSAT-Derived Long-Term Dataset to Investigate the Sea Surface Expressions of Human-Related Oil Spills and Naturally-Occurring Oil Seeps in Campeche Bay, Gulf of Mexico. Can. J. Remote Sens. Spec. Issue Long-Term Satell. Data Appl. 2016, 42, 307–321. [Google Scholar] [CrossRef]
- Mendoza, A.; Miranda, F.; Bannerman, K.; Pedroso, E.; Herrera, M. Satellite Environmental Monitoring of Oil Spills in the South Gulf of Mexico. In Proceedings of the Offshore Technology Conference (OCT 16410), Houston, TX, USA, 3–6 May 2004. 7p. [Google Scholar]
- Bannerman, K.; Rodríguez, M.H.; Miranda, F.P.; Pedroso, C.E.; Cáceres, R.G.; Castillo, O.L. Operational Applications of RADARSAT-2 for the Environmental Monitoring of Oil Slicks in the Southern Gulf of Mexico. In Proceedings of the International Geoscience and Remote Sensing Symposium (IGARSS ‘09), Cape Town, South Africa, 12–17 July 2009; pp. iii-381–iii-383. [Google Scholar] [CrossRef]
- Da Silva, A.F.T. Identification of Interesting Association Rules in a Gulf of Mexico Oil-Seepage Database. Master’s Thesis, COPPE, Federal University of Rio de Janeiro (UFRJ), Rio de Janeiro, Brazil, 2008. [Google Scholar]
- Ferreira, V.V.A. Characterization and Classification of Ocean Targets in SAR Images Using the Dynamic Fractal Dimension in Different Environmental Scenarios in the Gulf of Mexico. Master’s Thesis, COPPE, Federal University of Rio de Janeiro (UFRJ), Rio de Janeiro, Brazil, 2016. [Google Scholar]
- Pedroso, E.C. Oil-Seepages Ranking as a Support for Oil Exploration in Ultra-Deep Waters: A Case Study in the Gulf of Mexico. Ph.D. Thesis, COPPE, Federal University of Rio de Janeiro (UFRJ), Rio de Janeiro, Brazil, 2009. [Google Scholar]
- Carvalho, G.A. Multivariate Data Analysis of Satellite-Derived Measurements to Distinguish Natural from Man-Made Oil Slicks on the Sea Surface of Campeche Bay (Mexico). Ph.D. Thesis, COPPE, Federal University of Rio de Janeiro (UFRJ), Rio de Janeiro, Brazil, 2015. [Google Scholar]
- Carvalho, G.A.; Minnett, P.J.; de Miranda, F.P.; Landau, L.; Paes, E.T. Exploratory Data Analysis of Synthetic Aperture Radar (SAR) Measurements to Distinguish the Sea Surface Expressions of Naturally-Occurring Oil Seeps From Human-Related Oil Spills in Campeche Bay (Gulf of Mexico). ISPRS Int. J. Geo-Inf. 2017, 6, 379. [Google Scholar] [CrossRef]
- Torres, S.B.; Bevilacqua, L.; Miranda, F.P.; Beisl, C.H. Detection of Seepage Slicks in Cantarell Complex (Gulf of Mexico) Using Polarimetric SAR Data of Radarsat-2. Rev. Bras. De Geofísica Braz. J. Geophys. 2018, 36, 137–150. [Google Scholar] [CrossRef]
- MacDonald, I.R.; Garcia-Pineda, O.; Beet, A.; Daneshgar Asl, S.; Feng, L.; Graettinger, G.; French-McCay, D.; Holmes, J.; Hu, C.; Huffer, F.; et al. Natural and unnatural oil slicks in the Gulf of Mexico. J. Geophys. Res. Oceans 2015, 120, 8364–8380. [Google Scholar] [CrossRef]
- Leifer, I.; Lehr, W.J.; Simecek-Beatty, D.; Bradley, E.; Clark, R.; Dennison, P.; Hu, Y.; Matheson, S.; Jones, C.E.; Holt, B.; et al. Review—State of the Art Satellite and Airborne Marine Oil Spill Remote Sensing: Application to the BP Deepwater Horizon Oil Spill. Remote Sens. Environ. 2012, 124, 185–209. [Google Scholar] [CrossRef]
- Kennicutt, M.C. Oil and Gas Seeps in the Gulf of Mexico. In Habitats and Biota of the Gulf of Mexico: Before the Deepwater Horizon Oil Spill; Ward, C., Ed.; Springer: New York, NY, USA, 2017; Chapter 5; 868p. [Google Scholar] [CrossRef]
- Mityagina, M.; Lavrova, O. Satellite Survey of Offshore Oil Seep Sites in the Caspian Sea. Remote Sens. 2022, 14, 525. [Google Scholar] [CrossRef]
- Pelta, R.; Carmon, N.; Ben-Dor, E. A Machine Learning Approach to Detect Crude Oil Contamination in a Real Scenario Using Hyperspectral Remote Sensing. Int. J. Appl. Earth Obs. Geoinf. 2019, 82, 101901. [Google Scholar] [CrossRef]
- Fingas, M.F.; Brown, C.E. Review of oil spill remote sensing. Spill Sci. Technol. Bull. 1997, 4, 199–208. [Google Scholar] [CrossRef]
- Jackson, C.R.; Apel, J.R. Synthetic Aperture Radar Marine User’s Manual; NOAA/NESDIS, Office of Research and Applications: Washington, DC, USA, 2004; Available online: https://www.sarusersmanual.com/ (accessed on 8 May 2023).
- Bern, T.-I.; Wahl, T.; Anderssen, T.; Olsen, R. Oil Spill Detection Using Satellite Based SAR: Experience from a Field Experiment. Photogramm. Eng. Remote Sens. 1993, 59, 423–428. [Google Scholar]
- Johannessen, J.A.; Digranes, G.; Espedal, H.; Johannessen, O.M.; Samuel, P.; Browne, D.; Vachon, P. SAR Ocean Feature Catalogue; ESA Publication Division: Noordwijk, The Netherlands, 1994; 106p. [Google Scholar]
- Bentz, C.M.; Lorenzzetti, J.A.; Kampel, M. Multi-Sensor Synergetic Analysis of Mesoscale Oceanic Features: Campos Basin, South-Eastern Brazil. Int. J. Remote Sens. 2004, 25, 4835–4841. [Google Scholar] [CrossRef]
- Espedal, H.A. Detection of Oil Spill and Natural Film in the Marine Environment by Spaceborne Synthetic Aperture Radar. Ph.D. Thesis, Department of Physics, University of Bergen and Nansen Environmental and Remote Sensing Center (NERSC), Bergen, Norway, 1998. [Google Scholar]
- Alpers, W.; Holt, B.; Zeng, K. Oil Spill Detection by Imaging Radars: Challenges and Pitfalls. Remote Sens Environ. 2017, 201, 133–147. [Google Scholar] [CrossRef]
- Fox, P.A.; Luscombe, A.P.; Thompson, A.A. RADARSAT-2 SAR Modes Development and Utilization. Can. J. Remote Sens. 2004, 30, 258–264. [Google Scholar] [CrossRef]
- ESA. S-1A & S-1B Annual Performance Report for 2020. 2020. Available online: https://sentinel.esa.int/documents/247904/4607145/Sentinel-1-Annual-Performance-Report-2020.pdf/1eac12a7-26ca-002c-b3ff-78f6a1d77653 (accessed on 8 May 2023).
- De Zan, F.; Monti Guarnieri, A. TOPSAR: Terrain Observation by Progressive Scans. IEEE Trans. Geosci. Remote Sens. 2006, 44, 2352–2360. [Google Scholar] [CrossRef]
- Dong, Y.; Liu, Y.; Hu, C.; MacDonald, I.R.; Lu, Y. Chronic Oiling in Global Oceans. Science 2022, 376, 1300–1304. [Google Scholar] [CrossRef]
- NCEI (National Centers for Environmental Information). Maps and Geospatial Products. 2022. Available online: www.ncei.noaa.gov/maps-and-geospatial-products/ (accessed on 8 May 2023).
- Copernicus. Copernicus Open Access Hub (Scihub). 2022. Available online: https://scihub.copernicus.eu/ (accessed on 8 May 2023).
- Carvalho, G.A.; Minnett, P.J.; Paes, E.T.; Miranda, F.P.; Landau, L. Refined analysis of RADARSAT-2 Measurements to Discriminate Two Petrogenic Oil-Slick Categories: Seeps Versus Spills. J. Mar. Sci. Eng. 2018, 6, 153. [Google Scholar] [CrossRef]
- Carvalho, G.A.; Minnett, P.J.; Paes, E.T.; Miranda, F.P.; Landau, L. Oil-Slick Category Discrimination (Seeps vs. Spills): A Linear Discriminant Analysis Using RADARSAT-2 Backscatter Coefficients in Campeche Bay (Gulf of Mexico). Remote Sens. 2019, 11, 1652. [Google Scholar] [CrossRef]
- Carvalho, G.A.; Minnett, P.J.; Ebecken, N.F.F.; Landau, L. Classification of Oil Slicks and Look-Alike Slicks: A Linear Discriminant Analysis of Microwave, Infrared, and Optical Satellite Measurements. Remote Sens. 2020, 12, 2078. [Google Scholar] [CrossRef]
- Carvalho, G.A.; Minnett, P.J.; Ebecken, N.F.F.; Landau, L. Oil Spills or Look-Alikes? Classification Rank of Surface Ocean Slick Signatures in Satellite Data. Remote Sens. 2021, 13, 3466. [Google Scholar] [CrossRef]
- Carvalho, G.A.; Minnett, P.J.; Ebecken, N.F.F.; Landau, L. Machine-Learning Classification of SAR Remotely-Sensed Sea-Surface Petroleum Signatures—Part 1: Training and Testing Cross Validation. Remote Sens. 2022, 14, 3027. [Google Scholar] [CrossRef]
- McLachlan, G. Discriminant Analysis and Statistical Pattern Recognition; A Whiley-Interescience Publication; JohnWiley & Sons, Inc.: Brisbane, QLD, Australia, 1992; 534p, ISBN 0-471-61531-5. [Google Scholar]
- Al-Ruzouq, R.; Gibril, M.B.A.; Shanableh, A.; Kais, A.; Hamed, O.; Al-Mansoori, S.; Khalil, M.A. Sensors, Features, and Machine Learning for Oil Spill Detection and Monitoring: A Review. Remote Sens. 2020, 12, 3338. [Google Scholar] [CrossRef]
- Jafarzadeh, H.; Mahdianpari, M.; Homayouni, S.; Mohammadimanesh, F.; Dabboor, M. Oil Spill Detection from Synthetic Aperture Radar Earth Observations: A Meta-Analysis and Comprehensive Review. GISci. Remote Sens. 2021, 58, 1952542. [Google Scholar] [CrossRef]
- Trevethan, R. Sensitivity, Specificity, and Predictive Values: Foundations, Pliabilities, and Pitfalls in Research and Practice. Front. Public Health 2017, 5, 7. [Google Scholar] [CrossRef] [PubMed]
- Carvalho, G.A. The Use of Satellite-Based Ocean Color Measurements for Detecting the Florida Red Tide (Karenia brevis). Master’s Thesis, University of Miami, Miami, FL, USA, 2008. [Google Scholar]
- Espíndola, R.P.; Ebecken, N.F.F. On Extending F-measure and G-mean Metrics to Multi-class Problems. WIT Trans. Inf. Commun. Technol. 2005, 35, 25–34. [Google Scholar] [CrossRef]
- Swets, J.A. Measuring the Accuracy of Diagnostic Systems. Science 1988, 240, 1285–1293. [Google Scholar] [CrossRef]
- Stemler, S.E. A Comparison of Consensus, Consistency, and Measurement Approaches to Estimating Interrater Reliability. Pract. Assess. Res. Eval. 2004, 9, 4. [Google Scholar] [CrossRef]
- Lewis, D.; Gale, W.A. Sequential Algorithm for Training Text Classifiers. In Proceedings of the 17th Annual International ACM SIGIR Conference on Research and Development in Information Retrieval, Dublin, Ireland, 3–6 July 1994; Springer: Berlin/Heidelberg, Germany, 1994; pp. 3–12. [Google Scholar]
- Burman, P. A Comparative Study of Ordinary Cross-Validation, v-Fold Cross-Validation and the Repeated Learning-Testing Methods. Biometrika 1989, 76, 503–514. [Google Scholar] [CrossRef]
- ICEYE. 2022. Available online: https://earth.esa.int/eogateway/missions/iceye/ (accessed on 8 May 2023).
- COSMO-SkyMed. 2022. Available online: https://earth.esa.int/eogateway/missions/cosmo-skymed-second-generation/ (accessed on 8 May 2023).
- Pan, S.J.; Yang, Q. A survey on transfer learning. IEEE Trans. Knowl. Data Eng. 2010, 22, 1345–1359. [Google Scholar] [CrossRef]
- Kairouz, P.; McMahan, H.B.; Avent, B.; Bellet, A.; Bennis, M.; Bhagoji, A.N.; Charles, B.Z.; Cormode, G.; Cummings, R.; D’Oliveira, R.G.L.; et al. Advances and Open Problems in Federated Learning. arXiv 2021, arXiv:1912.04977. [Google Scholar]
- Chen, T.; Kornblith, S.; Norouzi, M.; Hinton, G. A Simple Framework for Contrastive Learning of Visual Representations. In Proceedings of the 37th International Conference on Machine Learning, Vienna, Austria, 13–18 July 2020. [Google Scholar]
- Murphy, K.P. Machine Learning: A Probabilistic Perspective; The MIT Press: Cambridge, MA, USA, 2012. [Google Scholar]


Disclaimer/Publisher’s Note: The statements, opinions and data contained in all publications are solely those of the individual author(s) and contributor(s) and not of MDPI and/or the editor(s). MDPI and/or the editor(s) disclaim responsibility for any injury to people or property resulting from any ideas, methods, instructions or products referred to in the content. |
© 2023 by the authors. Licensee MDPI, Basel, Switzerland. This article is an open access article distributed under the terms and conditions of the Creative Commons Attribution (CC BY) license (https://creativecommons.org/licenses/by/4.0/).