Article

Sensitivity Analysis of Modal Parameters of a Jacket Offshore Wind Turbine to Operational Conditions

1
Department of Civil and Environmental Engineering, Tufts University, Medford, MA 02155, USA
2
National Renewable Energy Laboratory, Golden, CO 80401, USA
3
Department of Bridge Engineering, Tongji University, Shanghai 200092, China
*
Author to whom correspondence should be addressed.
J. Mar. Sci. Eng. 2023, 11(8), 1524; https://doi.org/10.3390/jmse11081524
Submission received: 26 June 2023 / Revised: 24 July 2023 / Accepted: 27 July 2023 / Published: 30 July 2023
(This article belongs to the Special Issue Tenth Anniversary of JMSE – Recent Advances and Future Perspectives)

Abstract

:
Accurate estimation of offshore wind turbine (OWT) modal parameters has a prominent effect on the design loads, lifetime prediction, and dynamic response of the system. Modal parameters can vary during the operation of OWTs. This paper studies the variation and sensitivity analysis of an OWT’s modal parameters with respect to operational and environmental conditions. Three finite element models of a jacket-supported OWT at the Block Island Wind Farm are created within the OpenSees, SAP2000, and OpenFAST platforms and validated using experimental measurements. The OpenFAST model is used to simulate the modal parameters of the turbine under various wind speed, rotor speed, power, yaw angle, mean sea level, blade pitch angle, and soil spring values. The model-predicted modal parameters of the first fore–aft (FA) and side–side (SS) modes are compared to those identified from experimental measurements. Results from the simulations show that the first FA natural frequency and damping ratio mostly depend on the rotor speed and wind speed, respectively, while yaw angle and mean sea level do not have a visible effect. It is observed that there is about 8% stiffening in the first FA frequency and an aerodynamic damping of 7.5% during the operation of the OWT.

1. Introduction

Approximately 40 offshore wind projects are currently under development across the United States. The Biden administration’s goal is to deploy 30 GW of offshore wind energy in the United States by 2030 [1]. The new offshore wind farms will take advantage of recently developed larger and more efficient turbines. GE Renewable Energy has developed Haliade-X 14-MW with a rotor diameter of 220 m and a blade length of 107 m [2]. Vestas plans to install a 15-MW offshore wind turbine prototype, known as V236-15-MW, at a facility in Denmark in 2023. The turbine will stand 280 m tall, with a rotor diameter of 236 m. Due to the rapid development of larger offshore wind turbines (OWTs) and the growth in the offshore wind industry, there is a need to have a better understanding of OWT dynamic properties to ensure that the design of these large flexible rotors will withstand the conditions experienced during their lifetime.
Dynamic properties of an OWT are important factors used in the design of the OWT tower and foundation. The most important of these properties are natural frequencies and damping ratios of the first fore–aft (FA) and side–side (SS) modes. Carswell et al. studied the effects of foundation damping on the vibration response of OWTs [3]. Damping ratio is a dimensionless measure of how oscillations decay in a system when disturbed from a static equilibrium. The damping ratio (ζ) is a modal parameter of a system that can vary from undamped (ζ = 0) to underdamped (ζ < 1) to critically damped (ζ = 1) to overdamped (ζ > 1) [4]. The accurate estimation of the wind turbine natural frequencies and damping has a pronounced effect on the design loads, lifetime prediction, and dynamic response of the system [5]. In the design of jacket-supported OWTs, the resonance effects of wind and wave loads should be avoided, and a dynamic response analysis of the structure is necessary [6,7]. While the modal parameters are assumed as constants during the design, they actually can vary during the operation of OWTs. This study investigates the variation and sensitivities of these important dynamic properties with respect to operational conditions such as wind speed, rotor speed, power, yaw, and pitch as well as soil stiffness. Accurately modeling this relationship will help designers and owners better understand the OWT’s dynamic response in different operational conditions and therefore help them with better fatigue life estimation. Modal parameters of linear dynamic systems can be identified using measurements collected from vibration sensors that are installed on the structure or using noncontact image-based sensors [8,9,10,11,12,13]. The natural frequencies of the first FA/SS modes of an OWT are fundamental parameters for the design of the tower and the foundation. In order to avoid the resonance of the operating turbine, the natural frequency of the FA/SS modes should be kept at a reasonable distance from the rotor frequency excitation bands and the external loading excitation bands, shown in Figure 1. The spinning of the rotor causes cyclic excitation at the rotor frequency, commonly referred to as “1P”. Additionally, having n blades induces a blade passing frequency to the tower of the OWT, known as “3P” for three-bladed turbines. Therefore, ranges of the 1P and 3P frequencies (and often their multiples, such as 6P and 9P) are potential excitation ranges to be avoided.
Det Norske Veritas (DNV) code suggests that the first natural frequency should not be within 10% of the 1P and 3P ranges [14]. Waves also excite the system within a narrow range of low frequencies (about 0.1 Hz in Figure 1) that must be avoided to reduce the fatigue of the support structure [15]. The wind excites the system over a wide range of frequencies, and the loads are critical for the fatigue of the rotor nacelle assembly (RNA) and the support structure. The natural frequency of the first bending mode (f0), which is often the same for the FA and SS directions, should therefore lie within three possible regions: soft–soft, soft–stiff (the common one), and stiff–stiff, as shown in Figure 1. Three design types are: (a) soft–soft design where f0 ≤ f1P,min in which the structure is very flexible, (b) soft–stiff design, meaning the f0 lies between 1P and 3P with safety margins (f1P,maxf0 ≤ f3P,min), and (c) stiff–stiff design where f0 > f3P,max with a very stiff support structure. The stiff–stiff design is considered a conservative design and requires a very stiff and massive tower and foundation with a higher cost of construction and installation than a soft–stiff support structure design. So, the soft–stiff design is the economical solution for avoiding the resonance of the wind turbine system. The optimal design of a wind turbine system requires the consideration of any change in the system frequency due to the environmental/operational conditions, which is discussed in this paper. The OWT’s dynamic response to wind and wave loads also depends on the natural frequency of the wind turbine system due to the dynamic nature of the loads and the relatively low first frequency of the system. A fatigue assessment can be performed for the OWT using environmental conditions during its service lifetime by continuous monitoring during the operation of the OWT [16,17].
Several studies can be found in the literature that focus on modeling or modal identification of OWTs. Bouzid et al. developed a finite element (FE) model of an installed OWT with monopile considering soil–structure interaction and found a great match between the measured and predicted natural frequencies [18]. Liu et al. performed the load analysis of a 5-MW wind turbine and showed that aerodynamic damping could significantly affect the structural response of the operating turbine and the tower vibrations that would affect the lifetime fatigue loads of the tower [19]. Yeter et al. [20] studied the FE model of a scaled Vestas 2-MW wind turbine (5 MW) with a tripod support structure to determine the stress transfer functions of the fatigue hotspots and used them for the fatigue assessment of the foundation. In [21], Yeter et al. analyzed the experimental measurements along with an FE model of a jacket structure to perform model updating and damage identification based on modal flexibility. Fatigue assessment of fixed-bottom wind turbines is studied by many researchers by using FE models, numerical simulations, or experimental measurements [22,23,24,25].
Operational conditions such as rotor speed and blade pitch and environmental conditions such as wind speed, yaw angle, rotor speed, mean sea level, blade pitch, and wind and wave loads have been shown to affect the wind turbine’s modal parameters. Dong et al. [26] studied the structural vibration characteristics of a 2.5-MW OWT prototype with a composite bucket under different operational conditions and extreme typhoon status by analyzing the observed vibration response data. They concluded that the structural vibration showed a positive correlation with the wind speed in standstill conditions, wherein the wind turbine was affected only by the environmental excitations. As the wind speed increased, the OWT structure vibrated more severely, and the dominant frequencies varied between 0.317 Hz and 0.344 Hz. Noren-Cosgriff and Kaynia [27] studied the first natural frequencies and damping ratios of a 3.6-MW monopile-supported OWT in the North Sea that was affected by environmental loads from wave and wind as well as nonlinear soil behavior. They used linear regression to model the variation of the natural frequencies based on measured data. Their results showed that during a storm event, the first natural frequency decreased as load increased until the storm peak and then increased after the storm. Hu et al. [28] monitored a 5-MW OWT for two years and studied the environmental and operational effects on the dynamic properties of the turbine. They showed that the observed frequency varied due to the operation of the rotor blades and the nacelle position. The first bending modes in FA and SS were found to be closely spaced with the same mode shapes but in perpendicular directions.
A Campbell diagram is a classical way to show the relationship between forcing mechanisms in rotary machinery as a function of the rotation rate of the system, relative to important system resonances over the system’s operating range [29]. Peterson et al. assumed a constant value for the support structure’s first two lateral modes for all rotor speeds in the Campbell diagram for a representative OWT design [29]. Jonkman [30] studied the Campbell diagram for a National Renewable Energy Laboratory (NREL) 5-MW reference OWT spinning in a vacuum condition in the absence of aerodynamics. Based on this numerical study of the OpenFAST model, Jonkman showed that in the vacuum condition, tower FA and SS bending modes had natural frequencies that were independent of rotor speed [31]. Meng et al. [32] studied the centrifugal stiffening effect for the NREL 5-MW reference turbine and found that it had a great impact on the fundamental frequency of the blade (10% increase in frequency) but had less impact on other modal frequencies. Prowell et al. constructed an experimentally validated wind turbine system of an onshore 65-kW wind turbine in both OpenFAST and OpenSees [33]. By comparing the models, they showed the capability of OpenFAST to simulate earthquake excitations. Chen et al. studied an aerodynamic damping matrix that can be used in finite element (FE) modeling of wind turbines considering rotor–tower interaction [34]. The damping matrix components described the key features of the coupling behavior between FA and SS vibrations of the wind turbine. They assumed that the vibration and aerodynamics were decoupled, so the aerodynamic calculation was carried out separately, based on the modified NREL 5-MW reference onshore wind turbine. They indicated that coupling between FA and SS directions had a significant influence on the damping in both FA and SS directions. The FA damping ratio was about 7% at a wind speed of 13 m/s, and it was reduced by increasing the wind speed. For a wind speed of 20 m/s in the coupled FA/SS directions, there was a significant reduction of more than 50% for the damping ratios comparing to the decoupled case.
This study creates a multiphysics model in OpenFAST to investigate the effects of different operational conditions such as the ones found during standstill and normal operations, as well as different environmental conditions, on the modal parameters of the OWTs in the Block Island Wind Farm (BIWF) located in New Shoreham, RI, USA. The changes in modal parameters predicted from numerical models are compared to those observed in the field from continuous monitoring of the turbine. Although several studies have been performed on the sensitivity of the natural frequency of fixed-bottom OWTs, there is a gap in the literature related to the sensitivity of the first natural frequency and damping ratio of the jacket-supported OWT to operational/environmental conditions and comparison with field measurements. To fill this gap, we develop a multiphysics OpenFAST model of the 6-MW fixed-bottom jacket-supported OWT at the BIWF (see Figure 2), which enables us to simulate several environmental and operational conditions. The modeling takes advantage of existing modules of OpenFAST, including ElastoDyn, SubDyn, AeroDyn, HydroDyn, and InflowWind [35]. We compare the simulation results with the measured data to compare the trends predicted in the model with those observed in the data. We also develop two FE models of this OWT in OpenSees and SAP2000 structural analysis platforms and compare their modal parameters with the OpenFAST model. OpenSees is an object-oriented framework for FE analysis [36], which is extensively used in earthquake engineering [37,38,39,40] and soil–pile interaction modeling [41]. In this study, we also evaluate the effects of blade pitching and the aerodynamic damping and stiffening effects on the wind turbine structure.

2. Materials and Methods

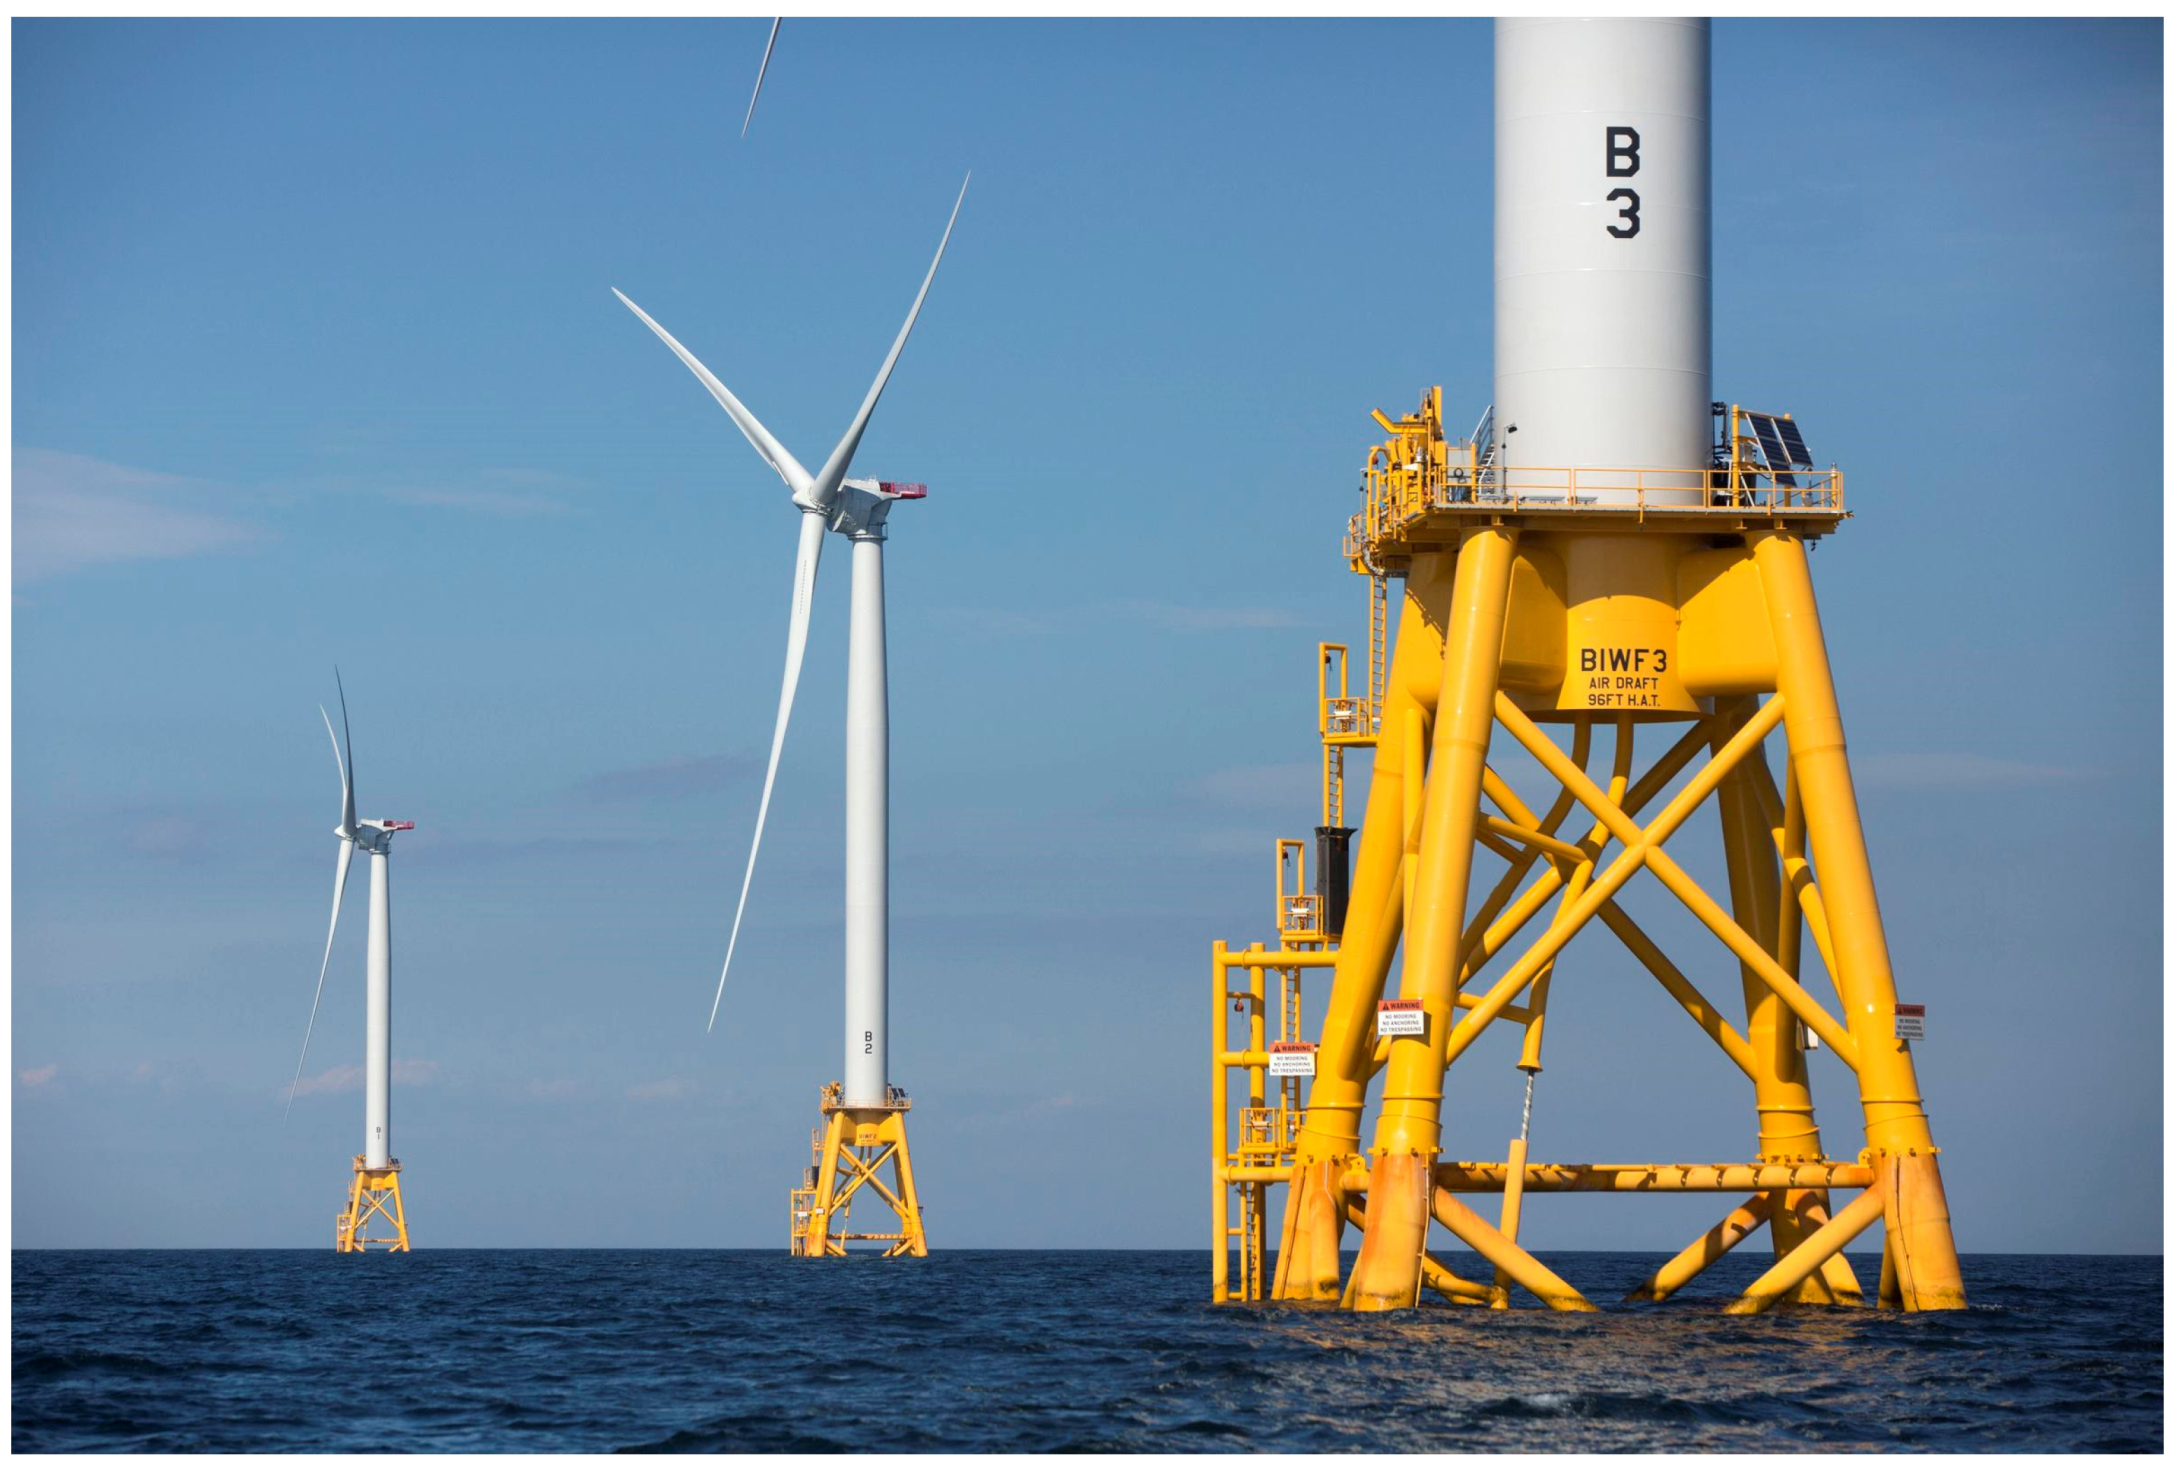
2.1. B2 OWT at the BIWF

The BIWF consists of five GE Haliade 6-MW turbines mounted on jacket support structures located approximately 3 miles southeast of Block Island in Rhode Island state waters. Completed in 2016, the BIWF is the first offshore wind farm built and operated in the USA. The turbines are labeled B1 to B5, and B2 is the focus of investigation in this paper because vibration sensors were mounted onto this turbine. In this section, the structural information of the B2 turbine, its instrumentation and monitoring system, and the operational modal analysis (OMA) of this wind turbine system are explained.

2.1.1. B2 OWT Structural Information

The B2 OWT consists of blades, tower, jacket, nacelle, hub, and drivetrain. Detailed properties of the blades and drivetrain were not available from the manufacturer for the B2 turbine, so most of them were scaled from the NREL 5-MW reference turbine [42]. The mass of three blades is 80 tons, each blade is 73 m in length, and the mass density along their length is scaled from the NREL 5-MW blade properties based on the ratio of the chord between the two turbine blades. The same airfoils as the NREL 5-MW turbine are used for the aerodynamic properties of the blades.
The jacket and tower are made of steel, and their geometries are extracted from the design drawings. The tower is 80 m tall and has a varying diameter and thickness along its height. It consists of circular tube sections with a base diameter of 6 m with wall thickness of 42 mm and a top diameter of 4 m with wall thickness of 38 mm. The Young’s modulus of steel is set as 200 GPa, the shear modulus is 80.8 GPa, and the effective density of the steel is 8000 kg/m2. The jacket and tower are connected with a rigid transition piece (TP) in the model. The TP mass is 42.8 tons and the mass of the deck legs attached to it is 38.0 tons, leading to an assumed total mass of 80.8 tons for the TP. The RNA mass is specified as 430 tons with the center of mass 4.2 m upwind of the yaw axis and 2.1 m above the tower top. The mass moment of inertia matrix [I] of the RNA at the tower top was computed from the OpenFAST model as given in Equation (1). The values are not shown, as they are protected under a nondisclosure agreement.
I = I x x I x y I x z I y x I y y I y z I z x I z y I z z k g · m 2
where Ixx, Iyy, and Izz are moments of inertia, and Ixy, Iyx, Ixz, Izx, Iyz, and Izy are products of inertia; x, y, and z are the nacelle frame coordinates, as shown later in the paper in Figure 7.

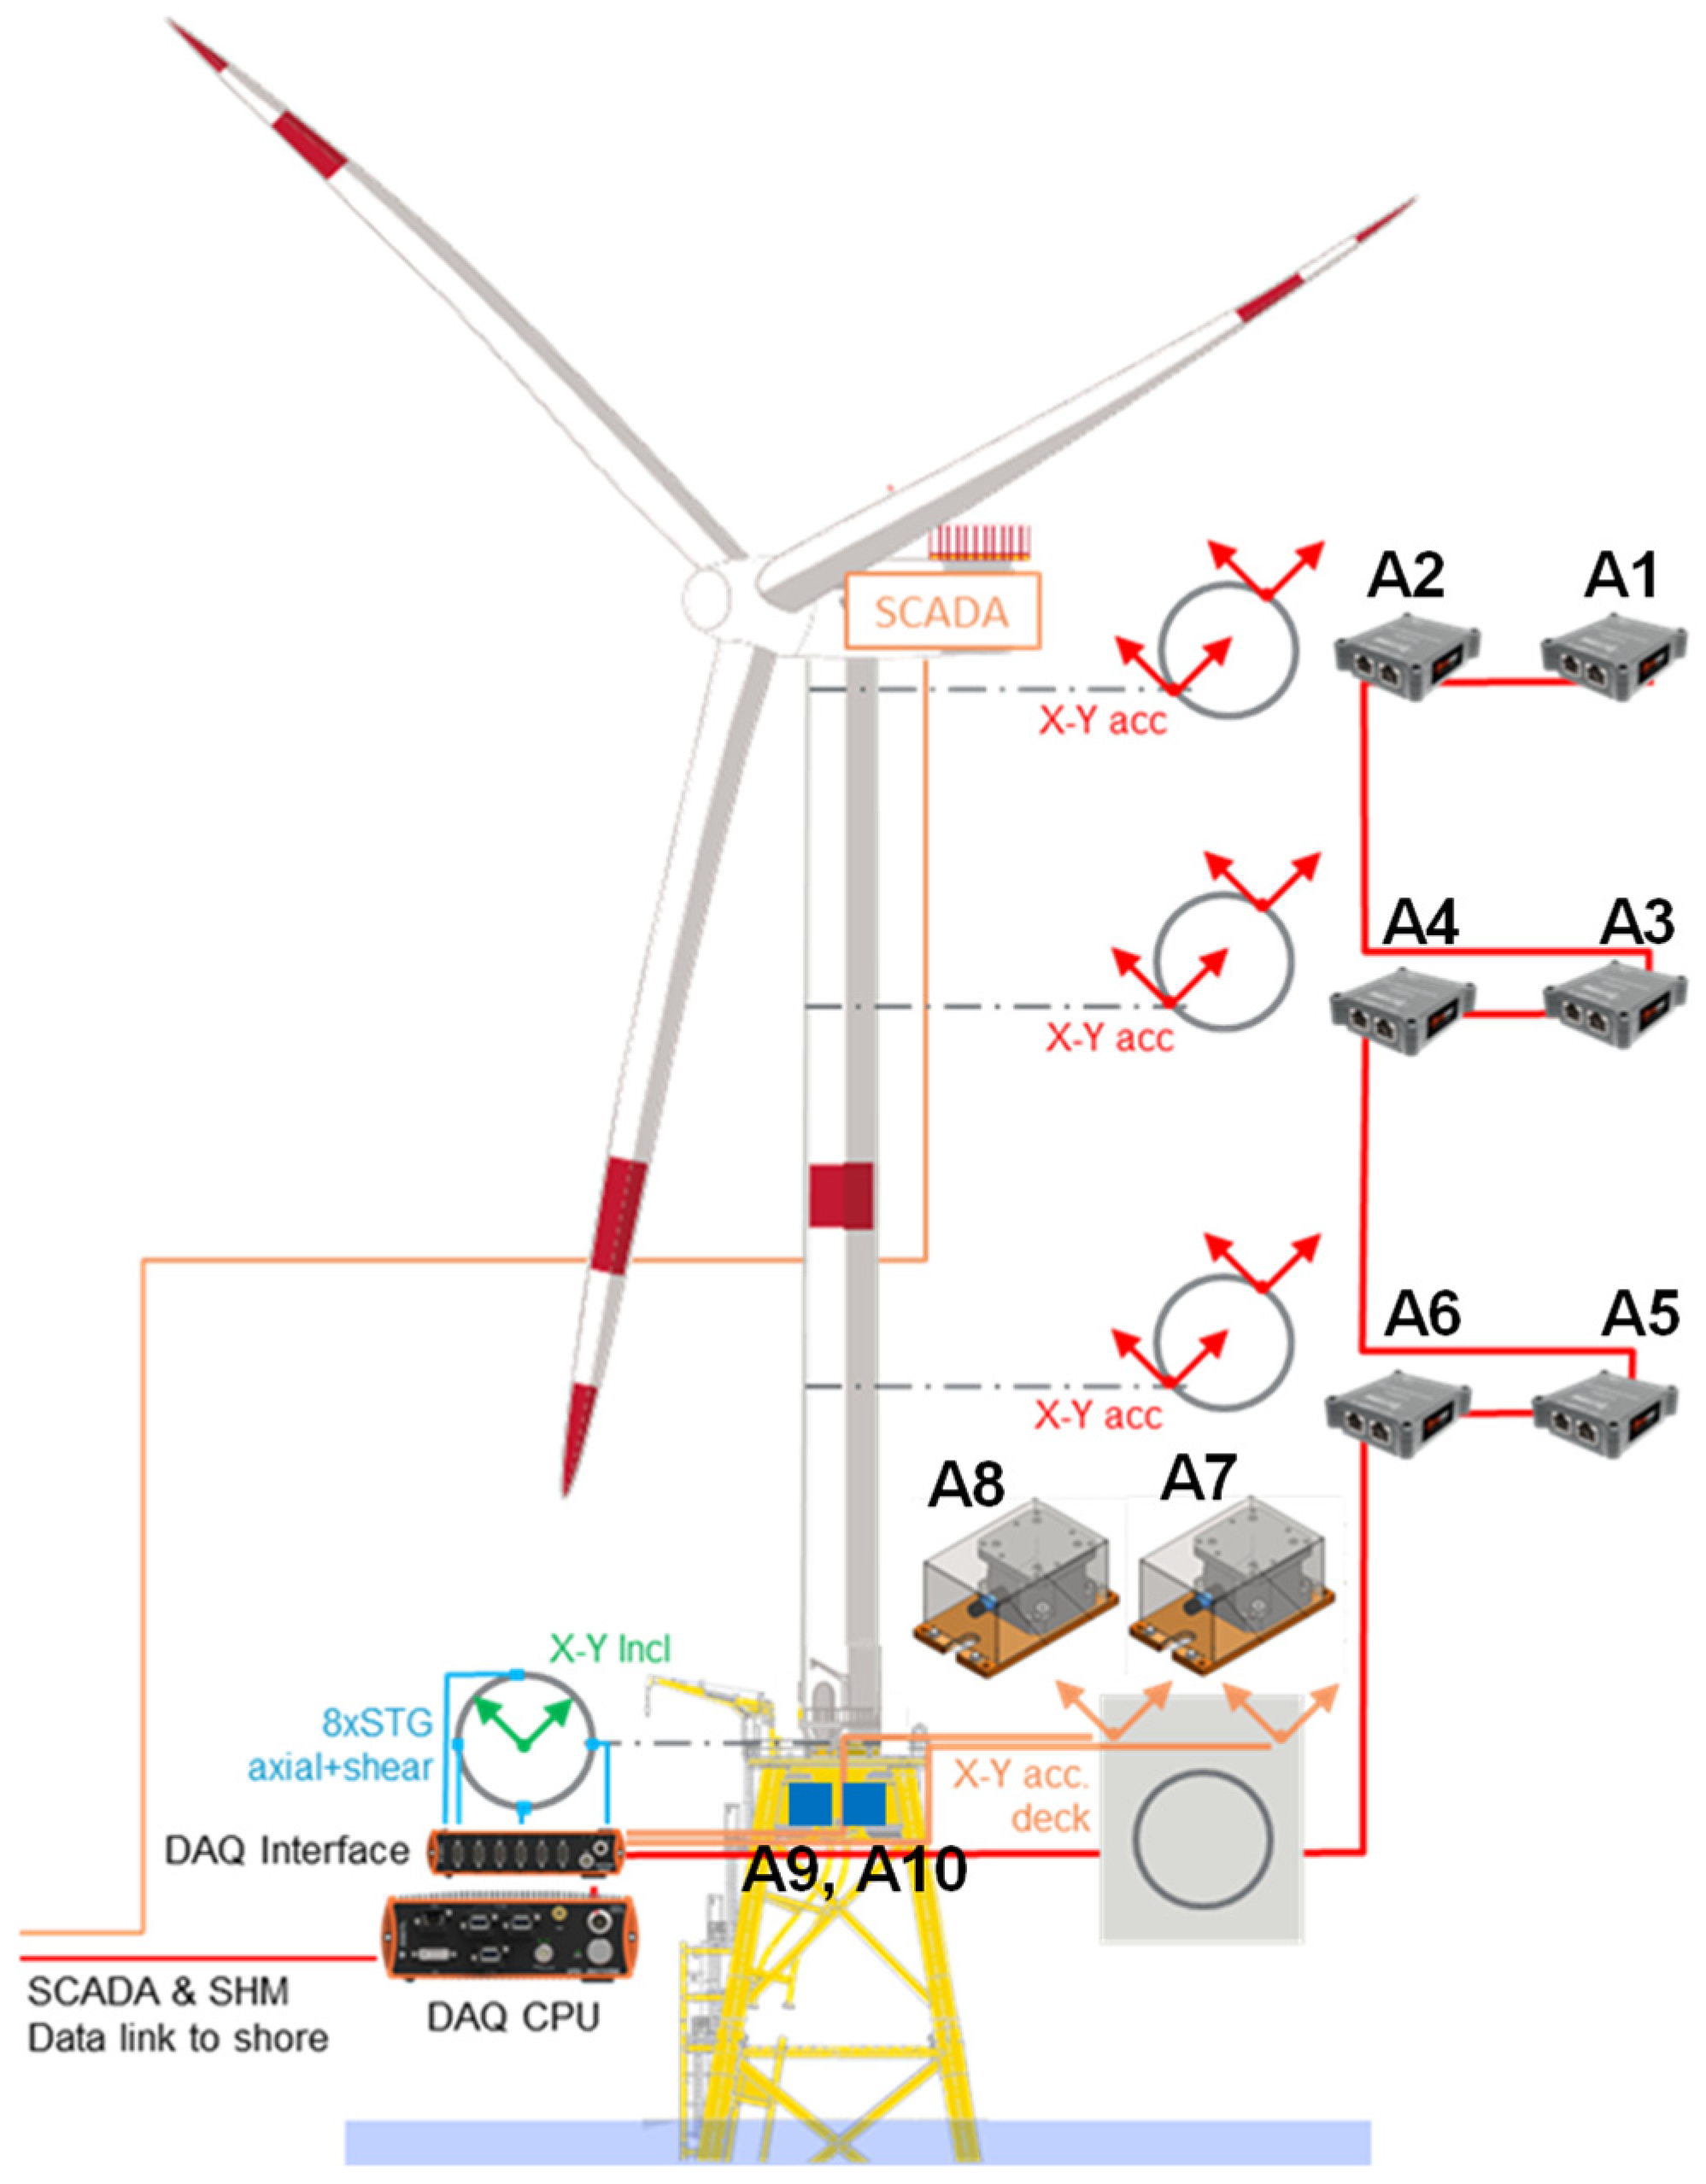
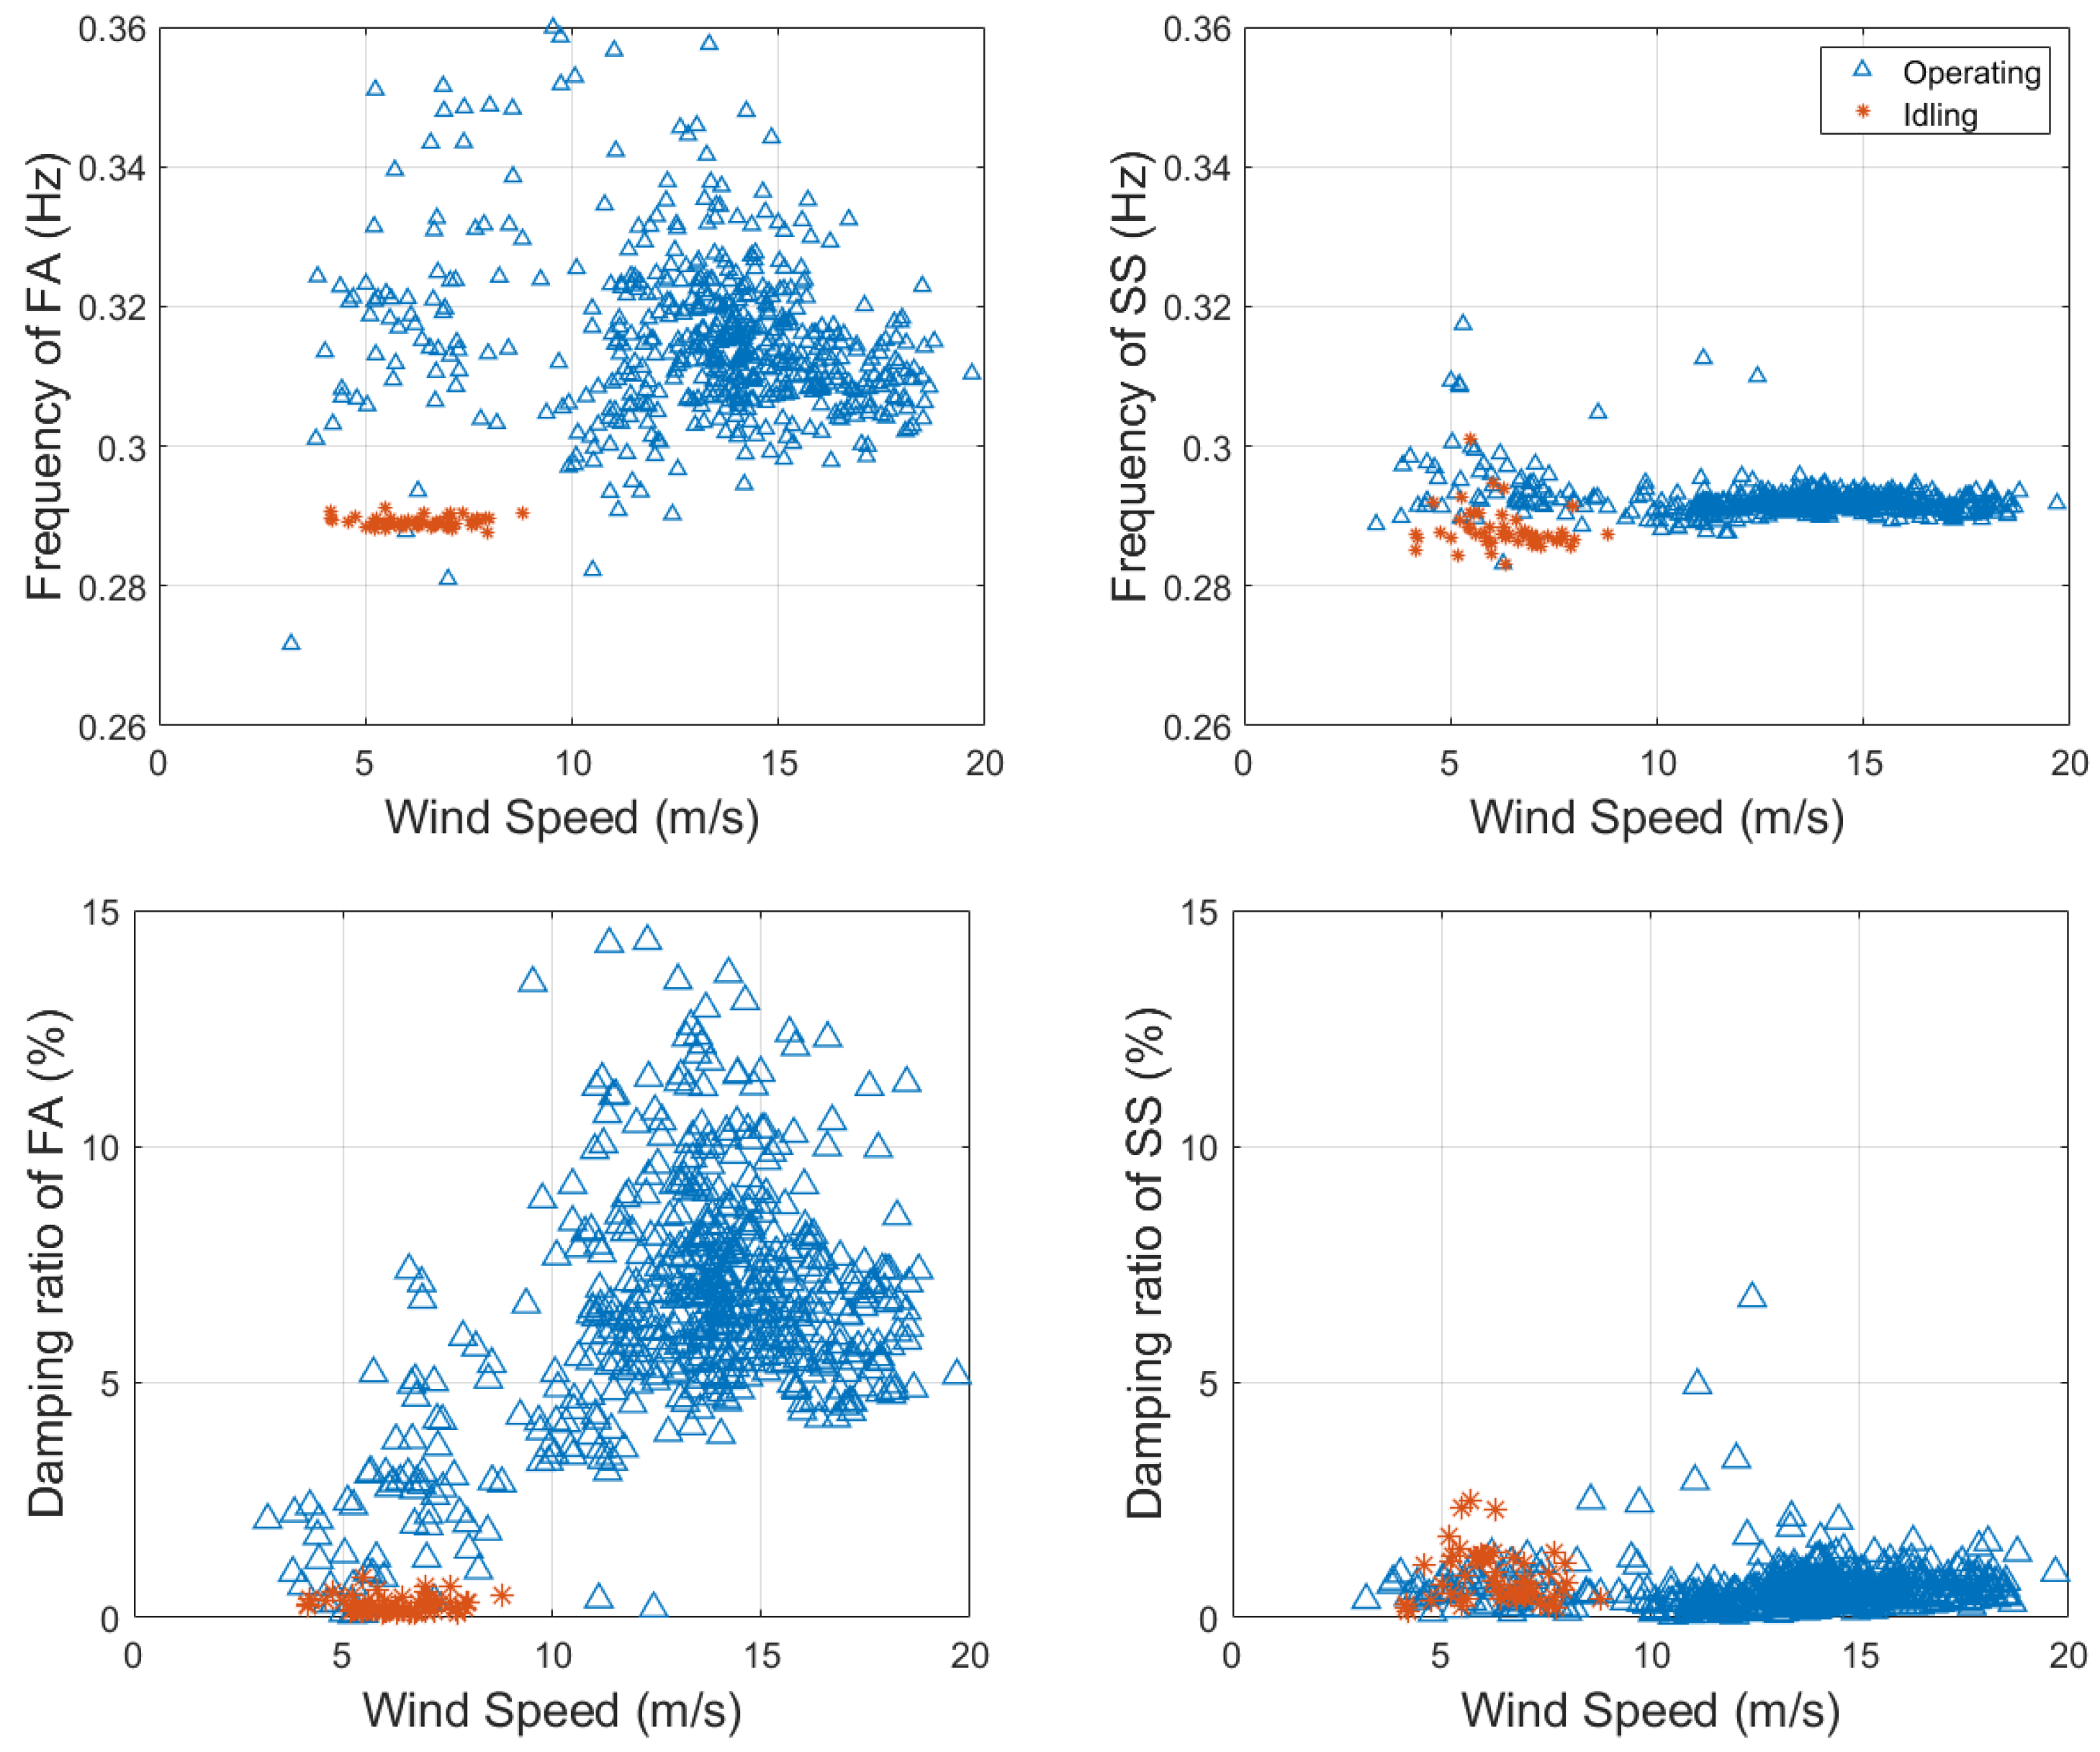
2.1.2. Instrumentation of Monitoring System and Identified Modal Parameters

The instrumentation system along the B2 turbine, including vibration sensors and data acquisition (DAQ) system, is shown in Figure 3. The sensors include nine wired accelerometers. The accelerometer sensors are installed on the inside of the tower at different levels using magnetic connections. The wired accelerometers are named A1 to A10, but A8 was not fully installed due to complications in running its cable to the DAQ system. Sensors A1–A6 are installed in pairs at three levels and at the opposite ends of a diagonal line on each level. Sensors A7 and A8 are installed at the deck on top of the jacket (A8 is installed but its cable is not yet connected), and A9 and A10 are installed at the DAQ system cabinet, which is located below the deck. Sensors A7, A8, and A10 are biaxial accelerometers, whereas others are triaxial. The type of triaxial accelerometer is the MonoDAQ-E-gMeter, which is a fully integrated low-noise 3D micro-electromechanical system (MEMS) accelerometer, and the biaxial accelerometers are assembled using 2 PCB 393B04 integrated circuit piezoelectric (ICP) accelerometers mounted inside a waterproof enclosure. Data are collected continuously and saved into files every 10 min with a sampling frequency of 50 Hz. More detailed information about the instrumentation can be found in [43].

2.1.3. System Identification Results

Experimental modal parameters, including the natural frequencies, damping ratios, and mode shapes of the turbine, are estimated from measured vibration data using an operational (or output-only) modal analysis (OMA) method. In this study, the data-driven stochastic subspace identification (SSI-DATA) method [44,45], which is a well-known OMA approach, is applied to 10 min windows of acceleration time histories over one week of operation (21 April 2021 to 27 April 2022) and one day of idling (14 June 2021) measurements, with a total of 588 data sets. SSI-DATA is a parametric system identification method that fits a linear state-space model to the output-only measurements [46,47]. The method provides estimates for the state-space matrices in a stochastic linear dynamic formulation where input is considered unknown. The modal parameters of the system (i.e., natural frequencies, damping ratios, and mode shapes of a system) are then extracted from the estimated state and output matrices. A detailed analysis of the data is provided in our companion paper [47].
Through the SSI-DATA method, the first FA and SS natural frequencies and damping ratios are identified from the measurements and plotted versus wind speed, as shown in Figure 4. The frequencies of SS mode do not vary significantly with wind speed and the average is 0.292 Hz. In the FA direction under the idling condition, the frequency does not change with wind speed, but under operating (power-generation) conditions, the frequency varies between 0.27 and 0.36 Hz with a mean value of 0.31 Hz and a standard deviation of 0.013 Hz. Moreover, the damping ratio of the first SS mode is identified at approximately 1%, and the damping ratio of the FA mode varies between 0 and 15% with a mean value of 5.9% and a standard deviation of 3.0%. Overall, the identified natural frequencies and damping ratios of the monitored turbine are observed to be very sensitive to the operational state of the turbine (idling vs. operating). The detailed system identification results over a full year of monitoring can be found in Song et al. [47]. Song et al. also proposed a framework for digital twinning of the B2 OWT for long-term structural health monitoring [48].

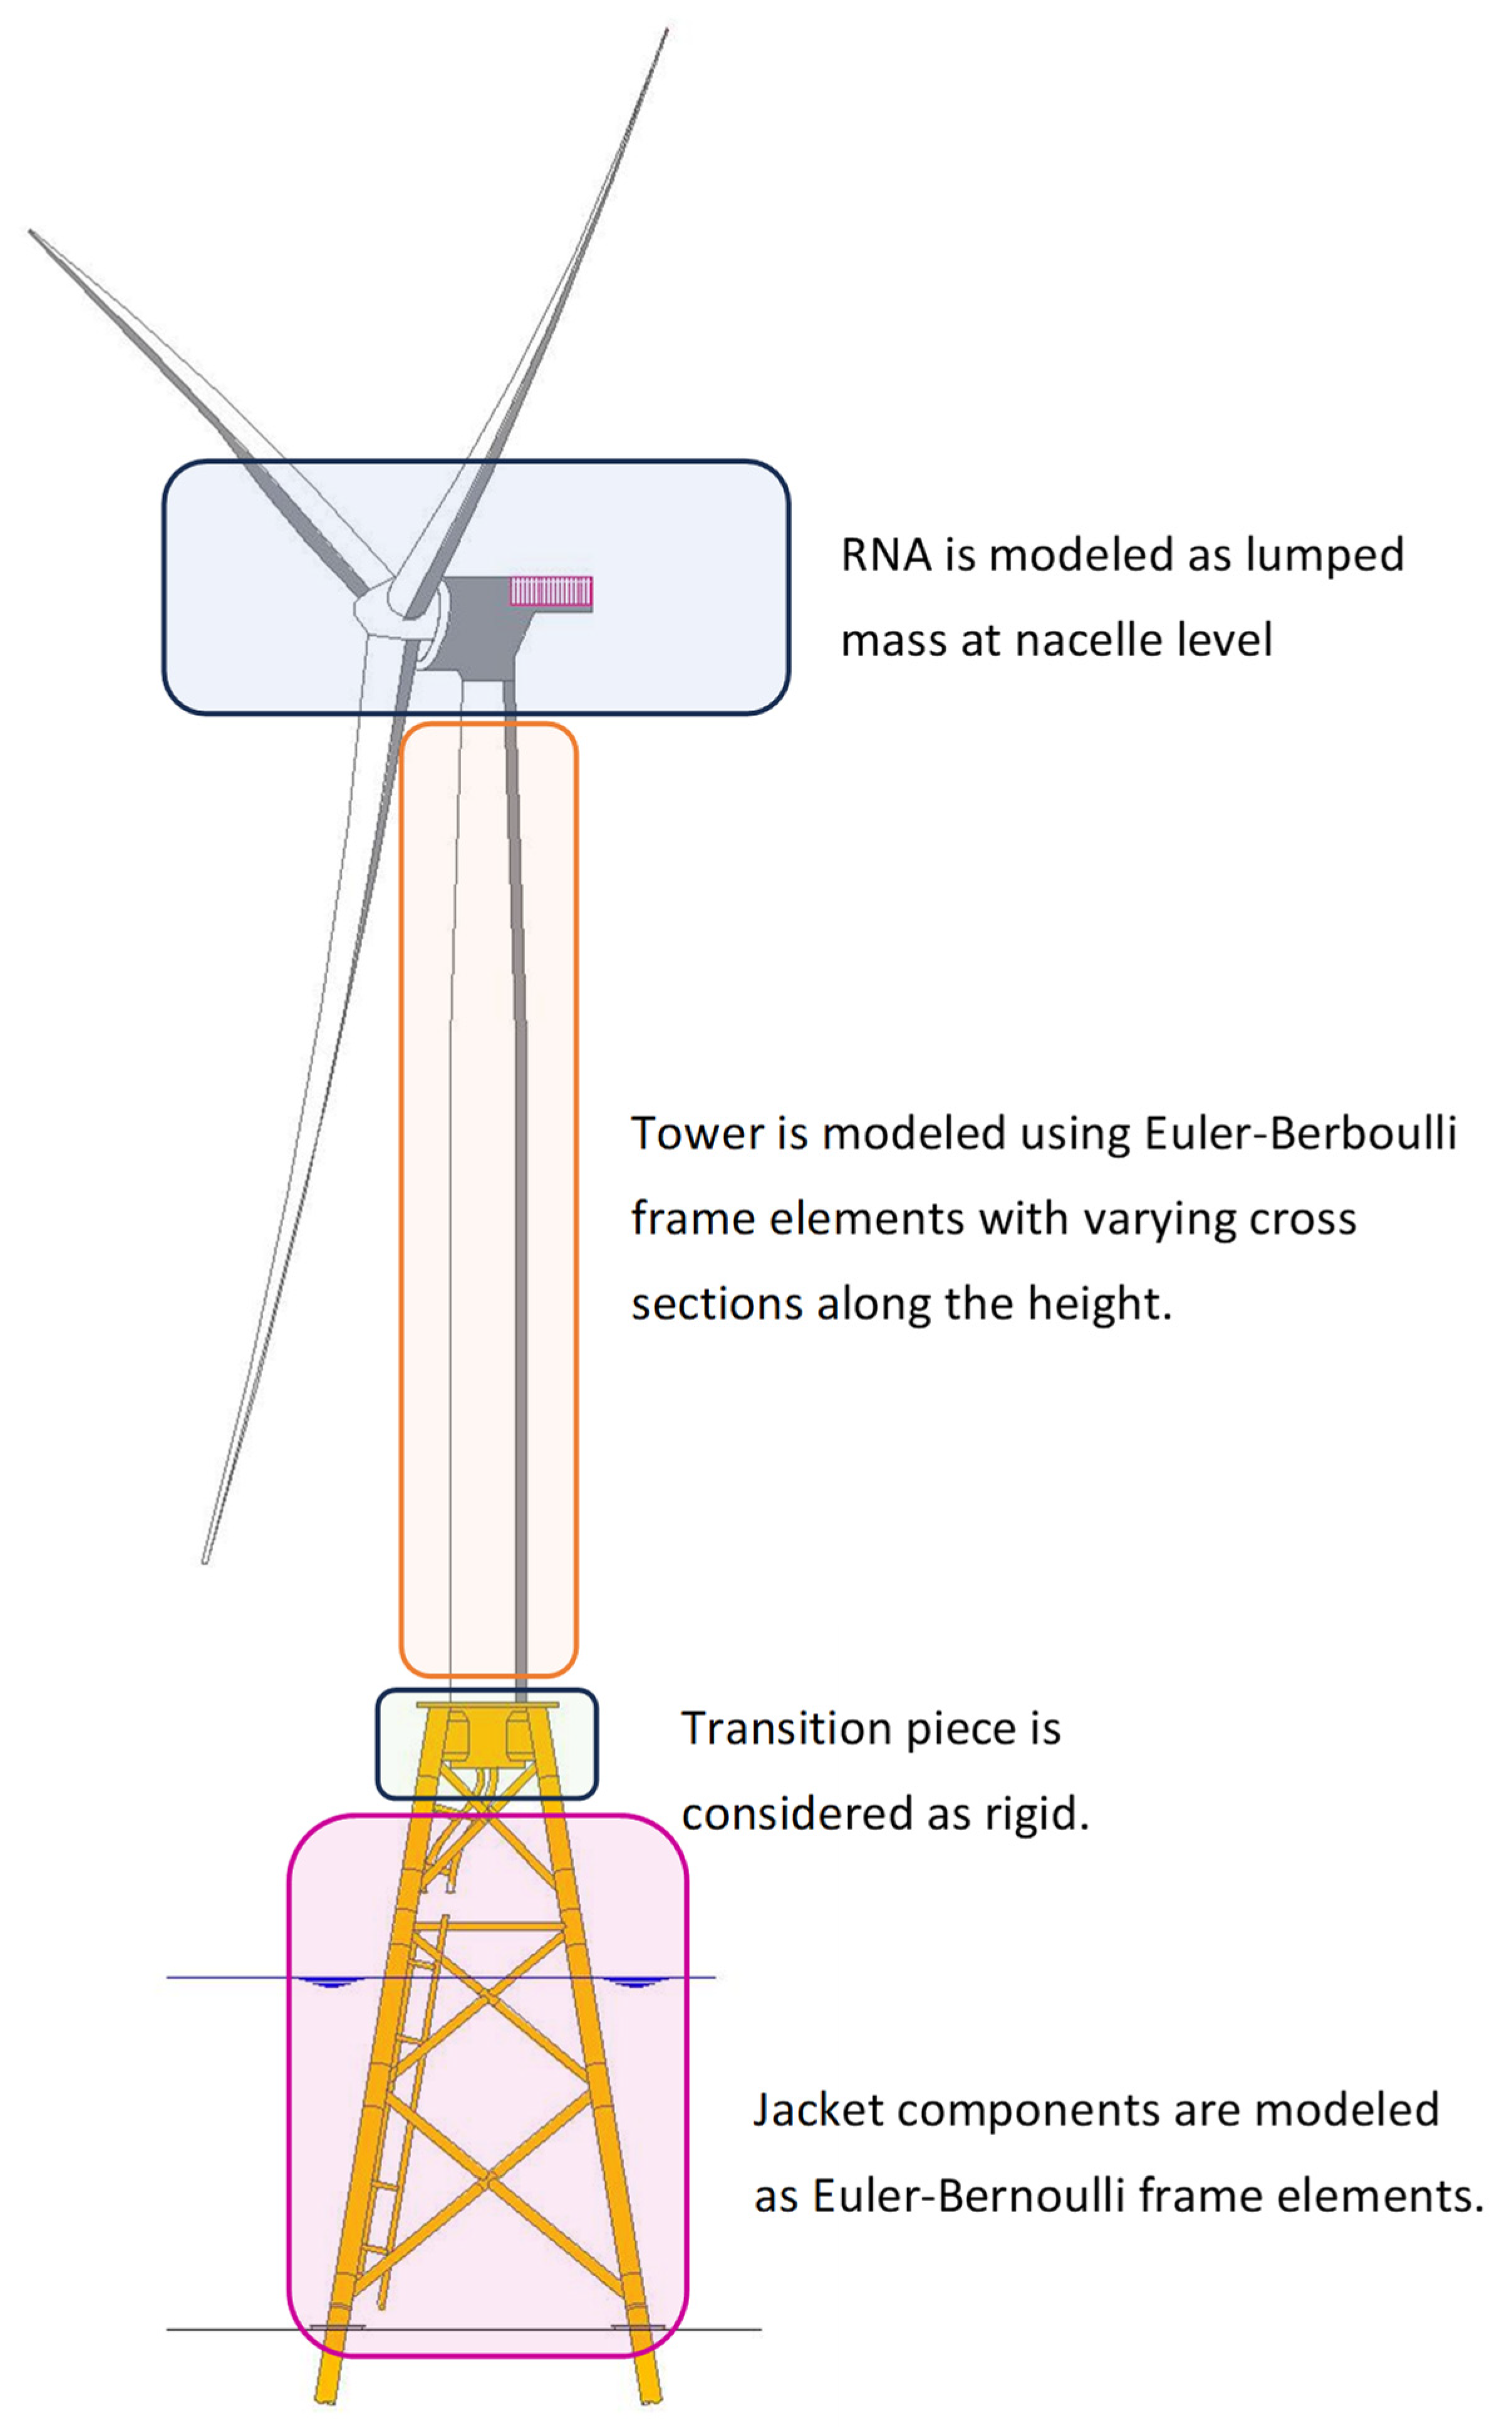
2.2. Modeling of B2 OWT

Three models of the B2 turbine are created in the OpenSees, SAP2000, and OpenFAST platforms. The details of the models are explained in the following subsections. The correlation between the models and the identified modal parameters from measurements is used to verify the models.

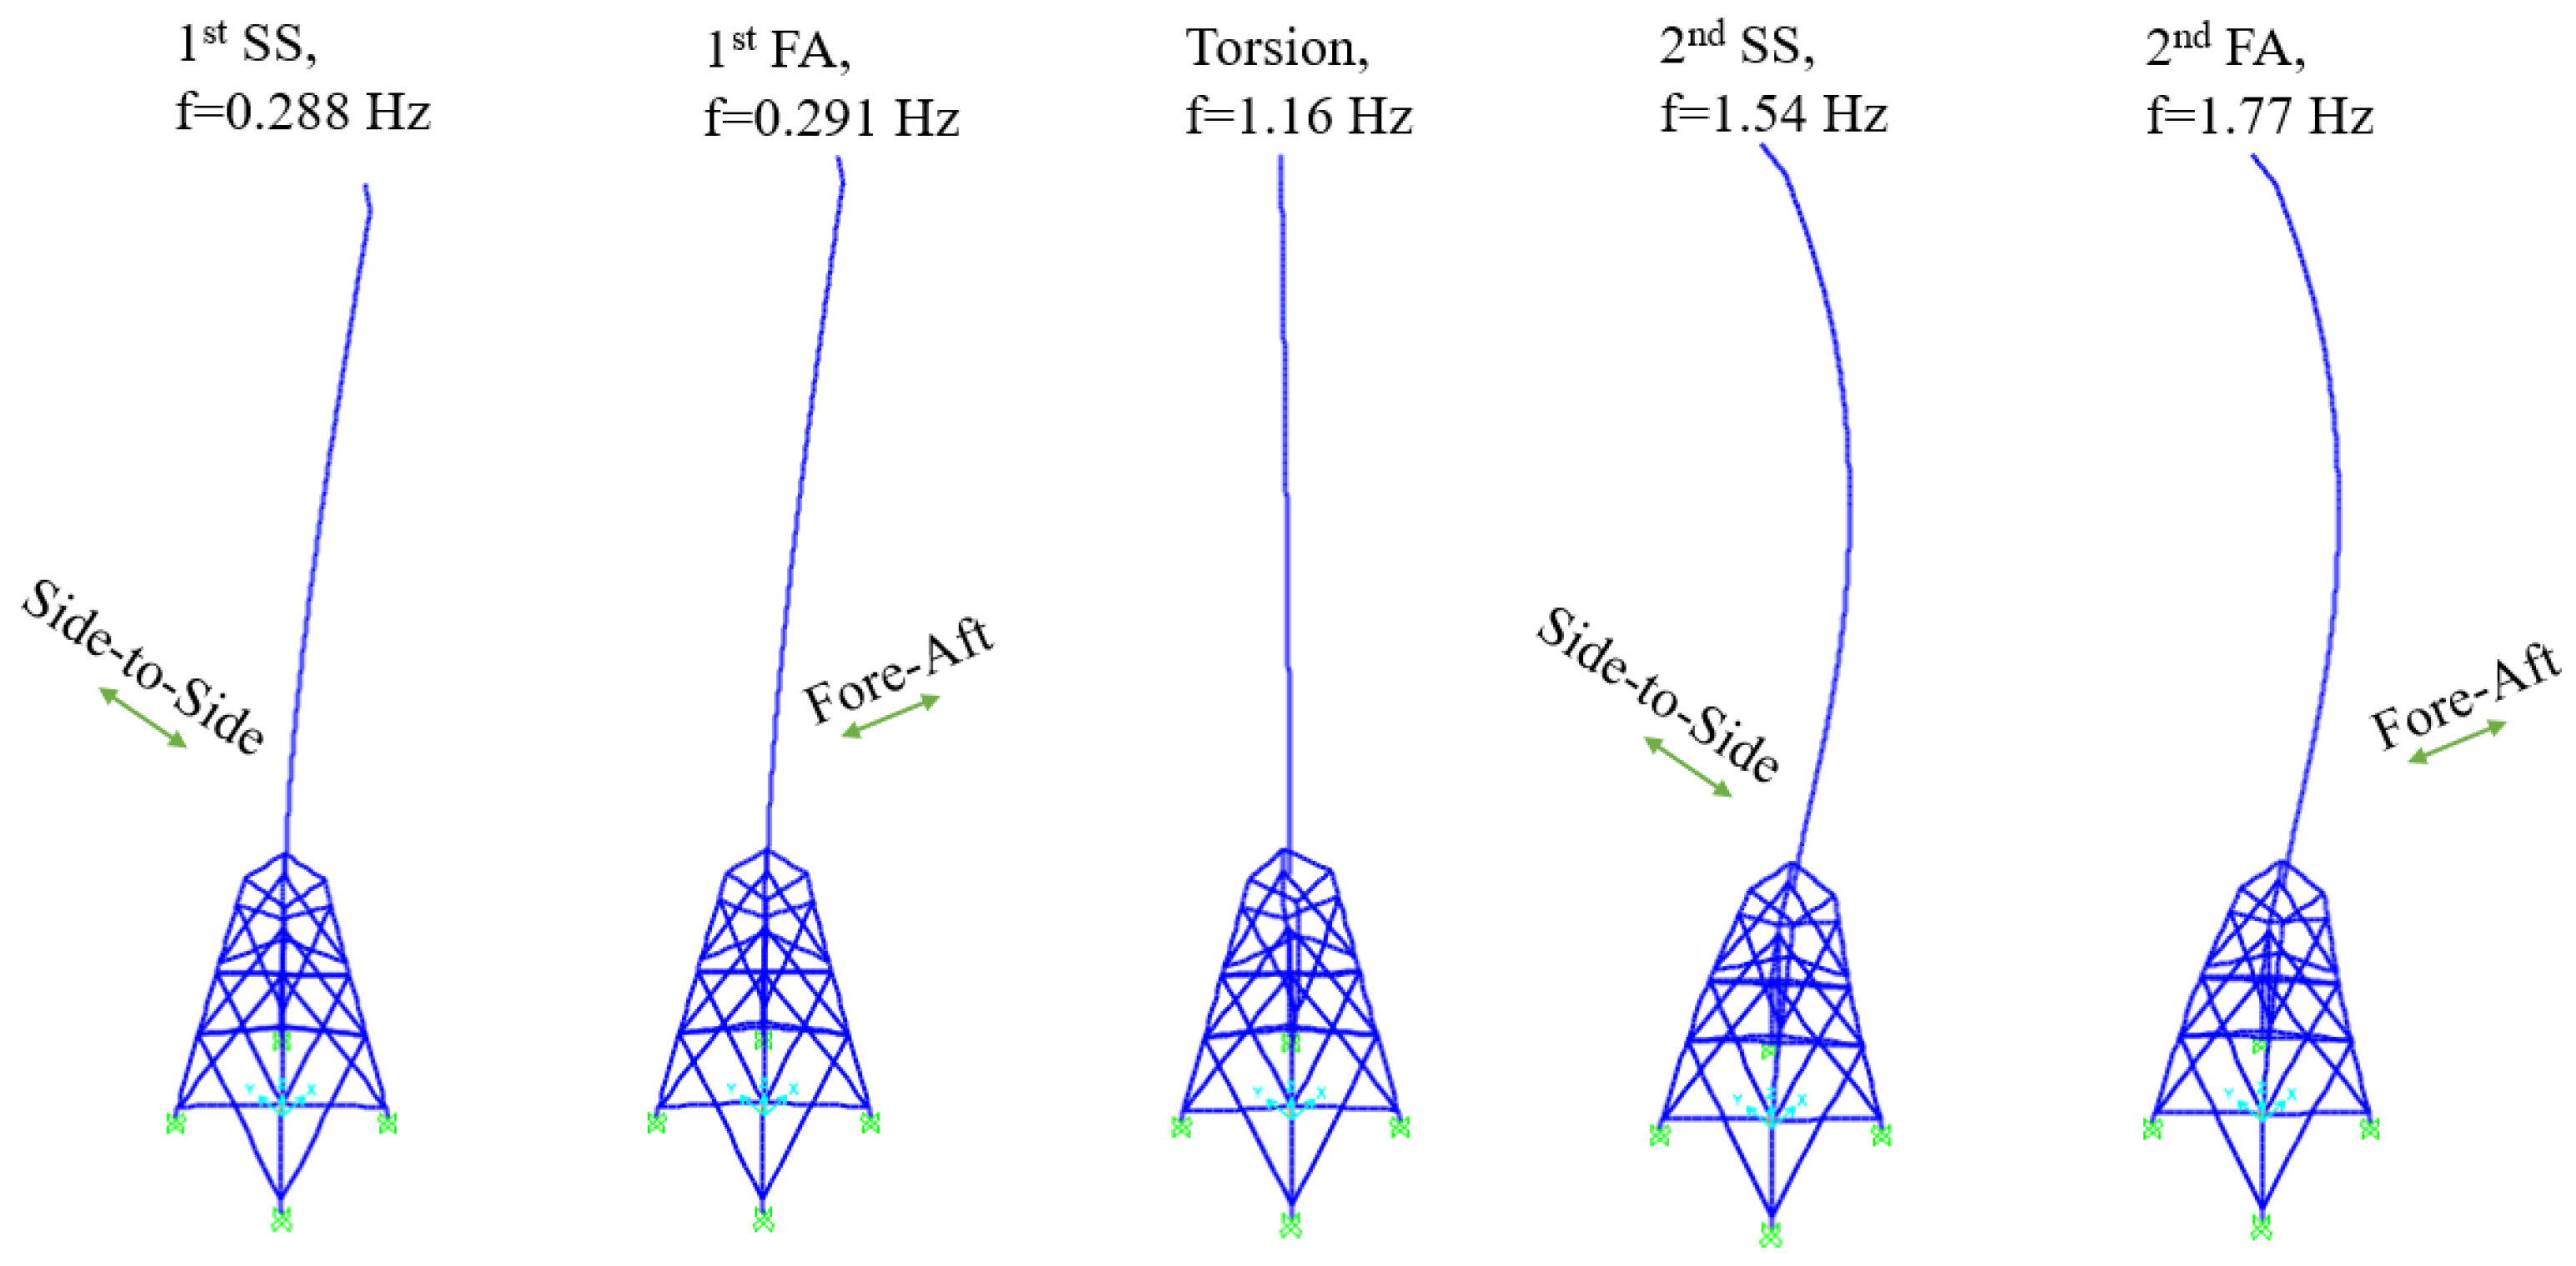
2.2.1. OpenSees and SAP2000 Models

Two linear elastic FE models of the B2 turbine, as shown in Figure 5, are developed in the structural analysis software platforms OpenSees and SAP2000. The jacket and the tower are modeled using linear elastic frame elements. The tower model is divided into multiple elements to consider changes in cross sections. The RNA is modeled as a lumped mass located at its center of mass and is connected to the wind turbine structure using a rigid, massless beam at the tower top. Only the diagonal elements of the mass moment of inertia matrix, introduced in Equation (1), are included in the FE models. The connection of the jacket to the foundation is assumed to be fixed. The TP is modeled as rigid to connect the tower to the substructure.
The modal parameters of the first and second FA and SS modes as well as the torsional mode from the SAP2000 and OpenSees models are observed to be identical, which verified the consistency and accuracy of the FE models. Figure 6 shows the mode shapes of the SAP2000 model, which are consistent with those of the OpenSees model.

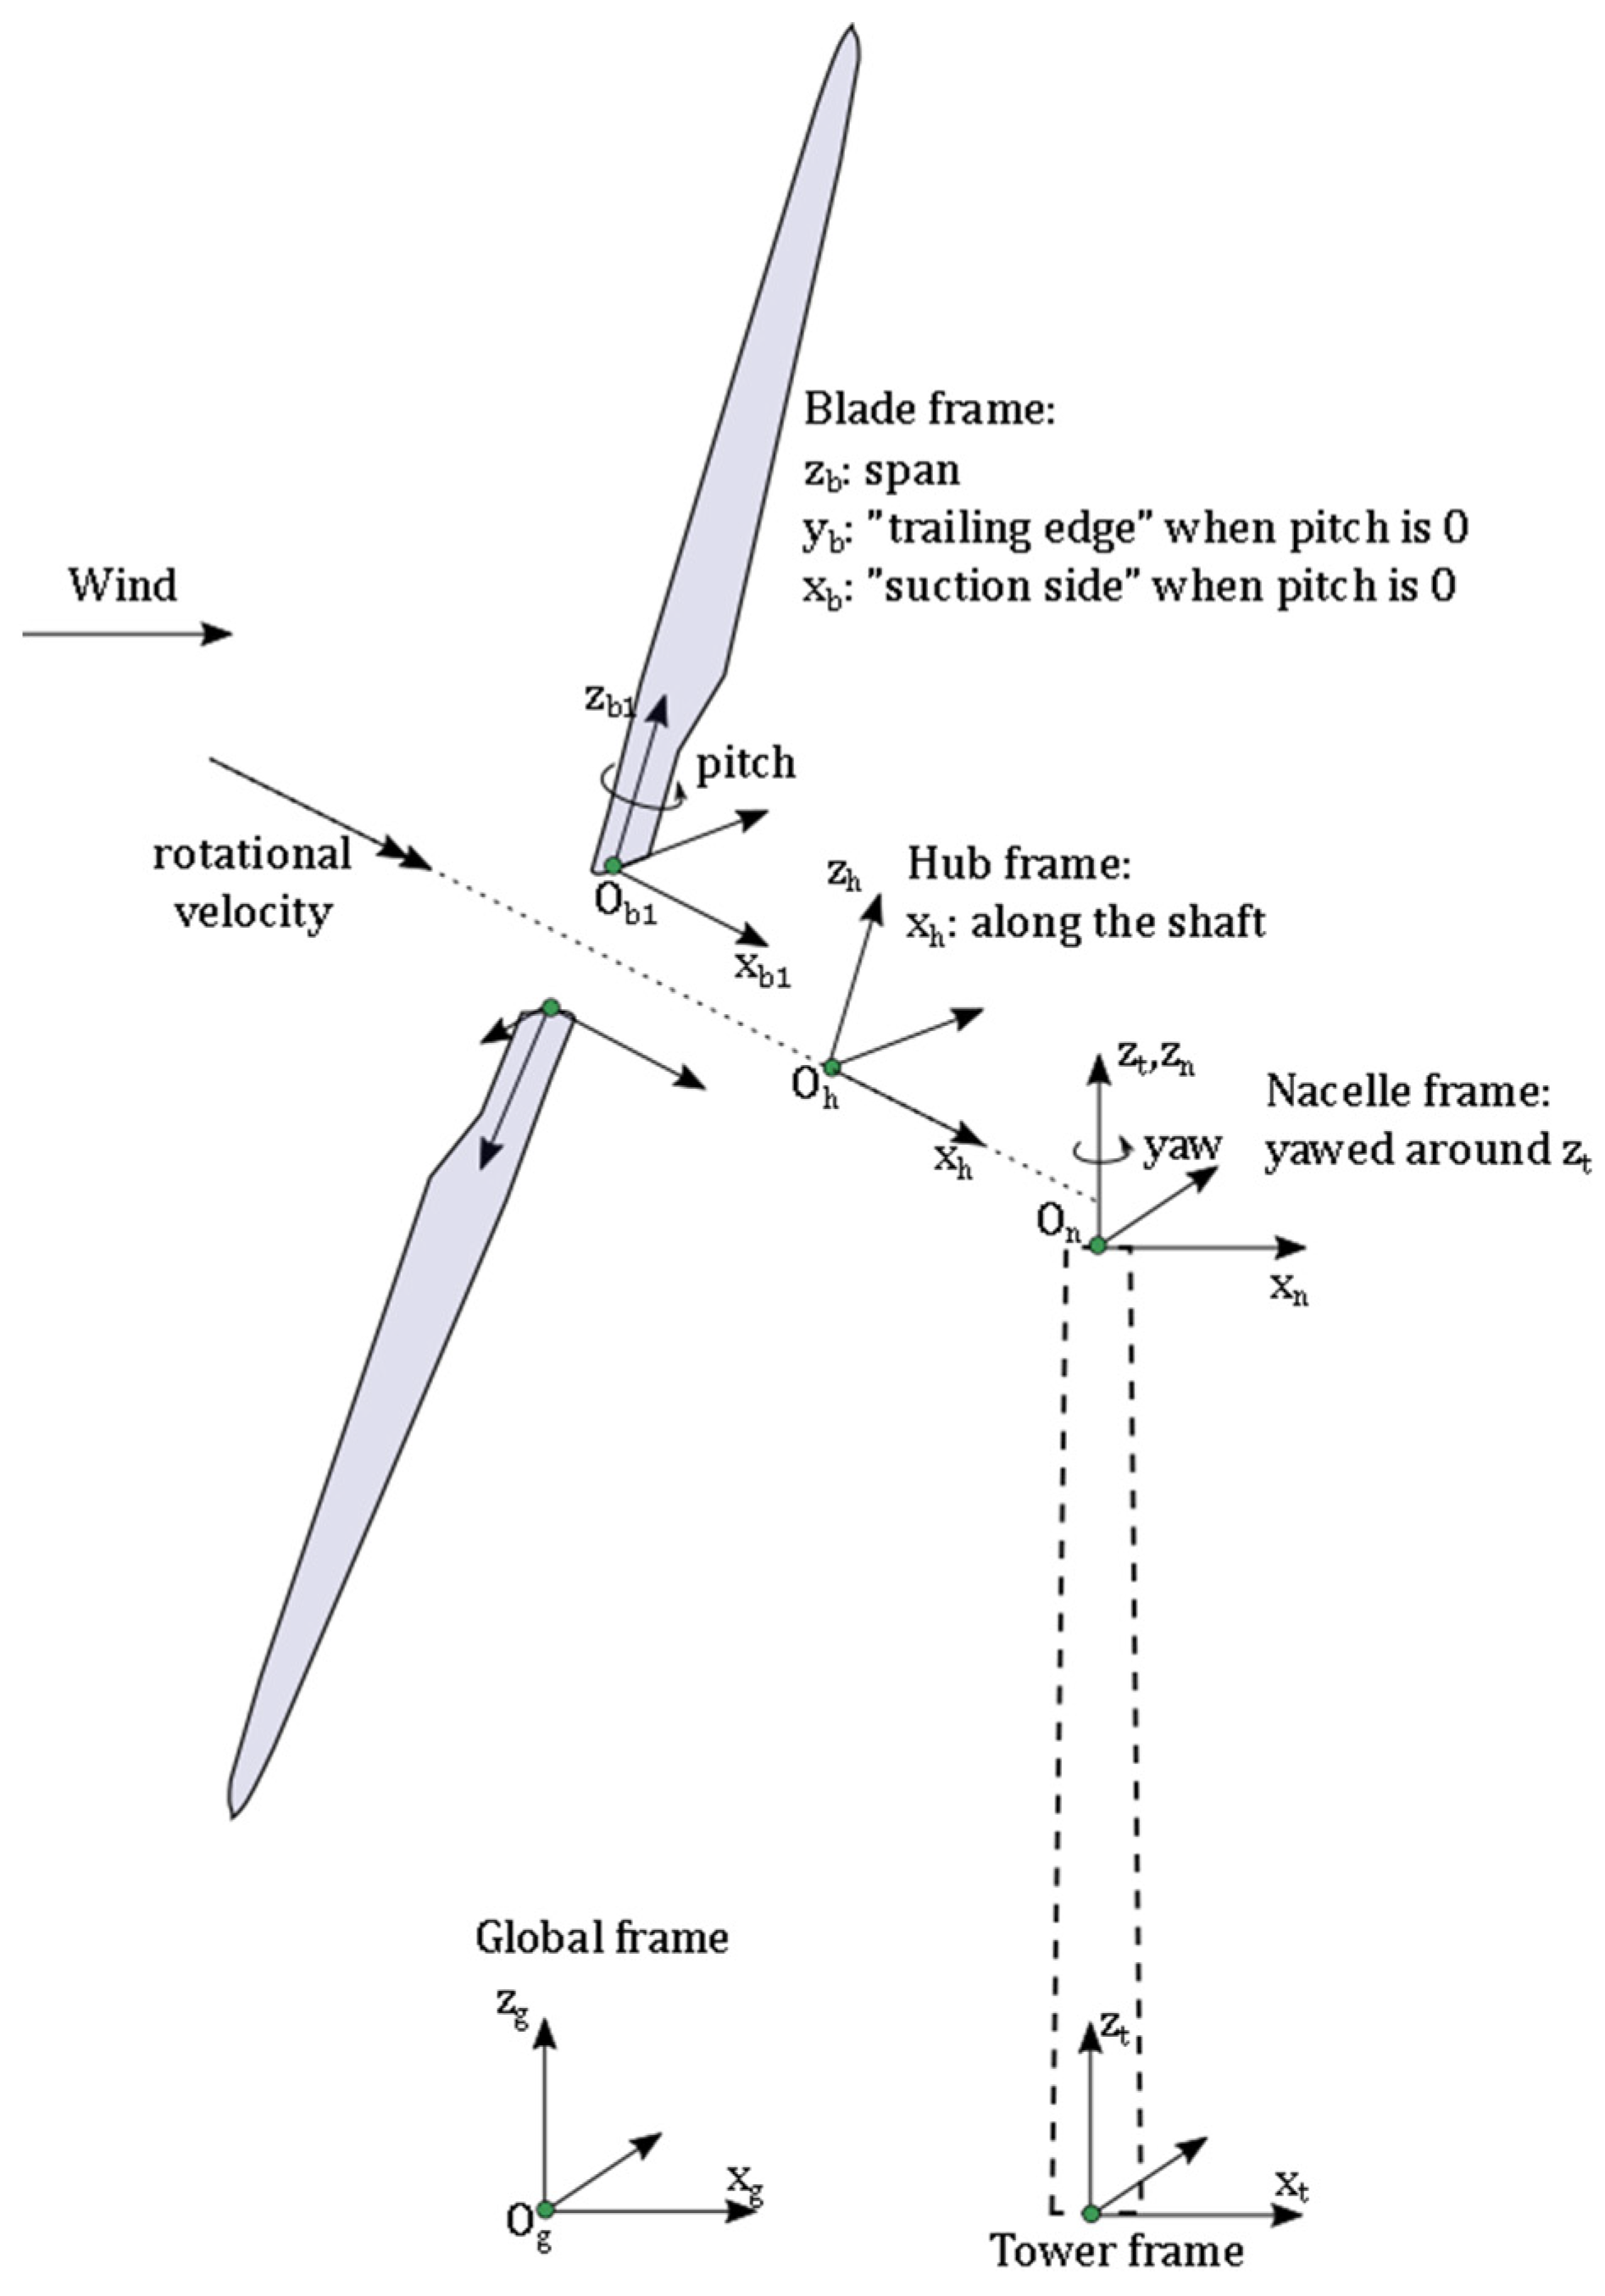
2.2.2. OpenFAST Model

OpenFAST is a multiphysics, multifidelity tool for simulating the coupled dynamic response of wind turbines. The tool enables the analysis of a range of wind turbine configurations, including two- or three-bladed horizontal-axis rotors, pitch or stall regulation, rigid or teetering hubs, upwind or downwind rotors, and lattice or tubular towers. The wind turbine can be modeled on land or offshore on fixed-bottom or floating substructures. OpenFAST is written as a modular framework, wherein different modules work together as a simulation of a wind turbine [49]. As shown in Figure 7, OpenFAST uses the coordinate system where xg follows the nominal wind direction (positive downwind) and the z-axis is vertical. The FA and SS directions are assumed to be in the xn and yn directions, respectively, and are perpendicular to each other.
The RNA is modeled in the ElastoDyn module with detailed information about the blades, hub, nacelle, and drivetrain. Certain hub, nacelle, and drivetrain properties are estimated and scaled based on the NREL 5-MW reference turbine [42]. The structural model is coupled with an aerodynamic model based on the blade element momentum (BEM) theory [50,51]. SubDyn is used to model the jacket, transition piece, and tower. The jacket and tower are modeled as steel structures in SubDyn. The tower is divided into multiple elements with changing cross sections. All structural members are modeled using beam elements. SubDyn uses the Craig–Bampton reduction method to reduce the degrees of freedom compared to the full FE model [52]. In this study, eight Craig–Bampton modes are considered. Rayleigh damping is used to model structural damping in SubDyn. For the boundary conditions, the wind turbine is assumed fixed at the seabed. The AeroDyn module [53] is used to simulate aerodynamic loads on the blades. The InflowWind module is used to introduce the wind environmental conditions; we consider a steady wind speed taken as the mean wind speed.
HydroDyn is used for calculating hydrodynamic loads on the foundation. For calculating hydrodynamic loads on a structure, HydroDyn uses multiple approaches: a potential-flow theory solution, a strip-theory solution, or a hybrid of the two [54]. The strip-theory solution is used for this study because it is preferable for members of substructures that are small in diameter relative to a typical wavelength. The strip theory uses the relative form of Morison’s equation that includes distributed fluid-inertia, added-mass, and viscous-drag components. HydroDyn accounts for the effect of water on the modal parameters of the B2 OWT by calculating the strip-theory loads on the substructure.
The modal parameters of the OpenFAST model are extracted using linearization of the underlying nonlinear system equations [31,55]. Although the physics involved in wind energy is nonlinear, linearization helps us to understand the system response. Since the azimuthal position of the blades might affect the modal parameters, 12 linearization times are performed to catch several azimuthal angles. The linearization times are times at which the nonlinear system equations are linearized. Each simulation runs for about 600 s, and at the end the wind turbine system is linearized at 12 linearization times corresponding to azimuthal positions from 0° to 360° with 30° increments. The linear models from the different azimuths are then averaged after applying the multiblade coordinate. A multiblade coordinate transformation [56] is then used to obtain the average modal parameters from different linearization times. For all of the simulations in this study, steady airfoil aerodynamics (no dynamic stall) is used. During linearization, we assumed frozen wake for the dynamic wind inflow. During linearization, no waves are assumed in HydroDyn and water is still.
Figure 7. OpenFAST main coordinate system [57].
Jmse 11 01524 g007

2.2.3. Model–Data Correlation

Modal parameters obtained from the OpenFAST and OpenSees models are compared to the experimental measurements for the first and second FA and SS bending modes of the turbine in Table 1. The identified modal parameters are averaged over 144 data sets collected on 22 April 2021. The average and standard deviation of the identified frequencies and the modal assurance criterion (MAC) values for comparison between mode shapes are reported.
The correlation between the identified and model mode shapes is evaluated by the MAC value, which is calculated based on Equation (2):
MAC φ 1 , φ 2 = φ 1 T × φ 2 2 φ 1 T × φ 1 · φ 2 T × φ 2
where φ1,φ2 are two mode shapes that are compared, and by design 0 ≤ MAC ≤ 1. A MAC value of 1 means that the mode shapes are identical, and a MAC value of 0 means perpendicular mode shapes. Here, MAC values are in the range of 0.92–0.97 which indicates a good match between the OpenFAST model and the identified modes. The OpenSees and SAP2000 models result in identical natural frequencies and have MAC = 1 for their mode shapes. Therefore, only the OpenSees model is included in Table 1.
The modal parameters obtained from the OpenFAST model are presented for two cases: rigid or flexible blades. Frequencies of the first FA/SS modes obtained for a turbine with rigid blades are higher than the ones from the turbine with flexible blades, whereas the second FA/SS modes have higher frequencies for a turbine with flexible blades. The turbine with flexible blades is used in the simulations of this paper and for determining the effect of blade flexibility on modal parameters. Some simulations with rigid blades are also performed and are presented in Section 3.1.2. From here on, the model in OpenFAST refers to the model with flexible blades.
The modal parameters obtained from the OpenFAST model are generally in close agreement with their counterparts identified from the measurements, but there are also some differences. For instance, the first SS frequency is 0.275 Hz for OpenFAST, and the identified frequency for the same mode from measurements is 0.292 Hz, resulting in a 6% difference. The first FA frequency obtained from the OpenFAST model differs from the identified frequency by 13%. The maximum difference between modal frequencies between the identified and OpenFAST model is 16% (the second SS mode). The difference between the identified and OpenFAST results may be attributable to the fact that the natural frequency depends on the environmental and operational conditions, which is the main focus of this study. The modal parameters of the OpenFAST model are extracted for a parked turbine; however, the natural frequencies of the BIWF turbine are identified during the operation and idling conditions.
Comparing the OpenFAST and OpenSees models, the frequencies are generally close for all the considered modes. A small discrepancy is observed for the first SS mode, which is 0.288 Hz for the OpenSees model and 0.275 Hz for OpenFAST model, resulting in a 5% difference. The maximum difference between the OpenSees and OpenFAST models is observed for the second bending modes. The second FA frequencies are found as 2.41 Hz and 1.77 Hz for the OpenFAST and OpenSees models, respectively, which is a 36% difference. The cause of the difference may be that the OpenFAST model accounts for blade flexibility while the OpenSees model does not include modeling of blades, and the RNA is modeled as a rigid mass at the tower top. If the blades are assumed rigid in the OpenFAST model, the second FA frequency will be 1.77 Hz, which is the same as the frequency obtained from the OpenSees model. The identified frequency for the same mode from measurements is 2.24 Hz in the idling conditions, which is 21% and 8% different from the OpenSees and OpenFAST models, respectively. The OpenFAST model gives more reasonable results for the second mode frequency. The mode shape comparison provides MAC values of larger than 0.92 for all modes, so both OpenFAST and OpenSees models are well correlated with the identified mode shapes from the data measurements.

3. Results

3.1. Numerical Sensitivity Analysis of Modal Parameters

In this section, we study the sensitivity of modal parameters (natural frequencies and damping ratios) of the B2 OWT for various operating conditions obtained using the numerical analysis tool OpenFAST. In Section 2.2, we validate the model of the B2 OWT in the OpenFAST tool, which is the focus of this study, with the experimental data. The operating conditions of the turbine (wind speed, rotor speed, and pitch angle of blades) are available from the measured supervisory control and data acquisition (SCADA) data. In this study, we select a reduced set of conditions for our numerical analyses, discussed in Section 3.1.1. The OpenFAST model of the B2 turbine is then used to simulate the modal parameters at these conditions. The results show that there are some aerodynamic and stiffening effects on the modal parameters of the first FA mode. First, we simulate the modal parameters of the B2 OWT for typical operating conditions and study the overall change in the modal parameters in Section 3.1.2. Second, to study the effects of individual operating conditions on the modal parameters, we conduct a sensitivity analysis of the modal parameters for wind speed, rotor speed, nacelle yaw angle, mean sea level, and soil stiffness in Section 3.1.3. Finally, an analytical formulation of the damping ratio calculation is provided to compare with the simulation results in Section 3.1.4.

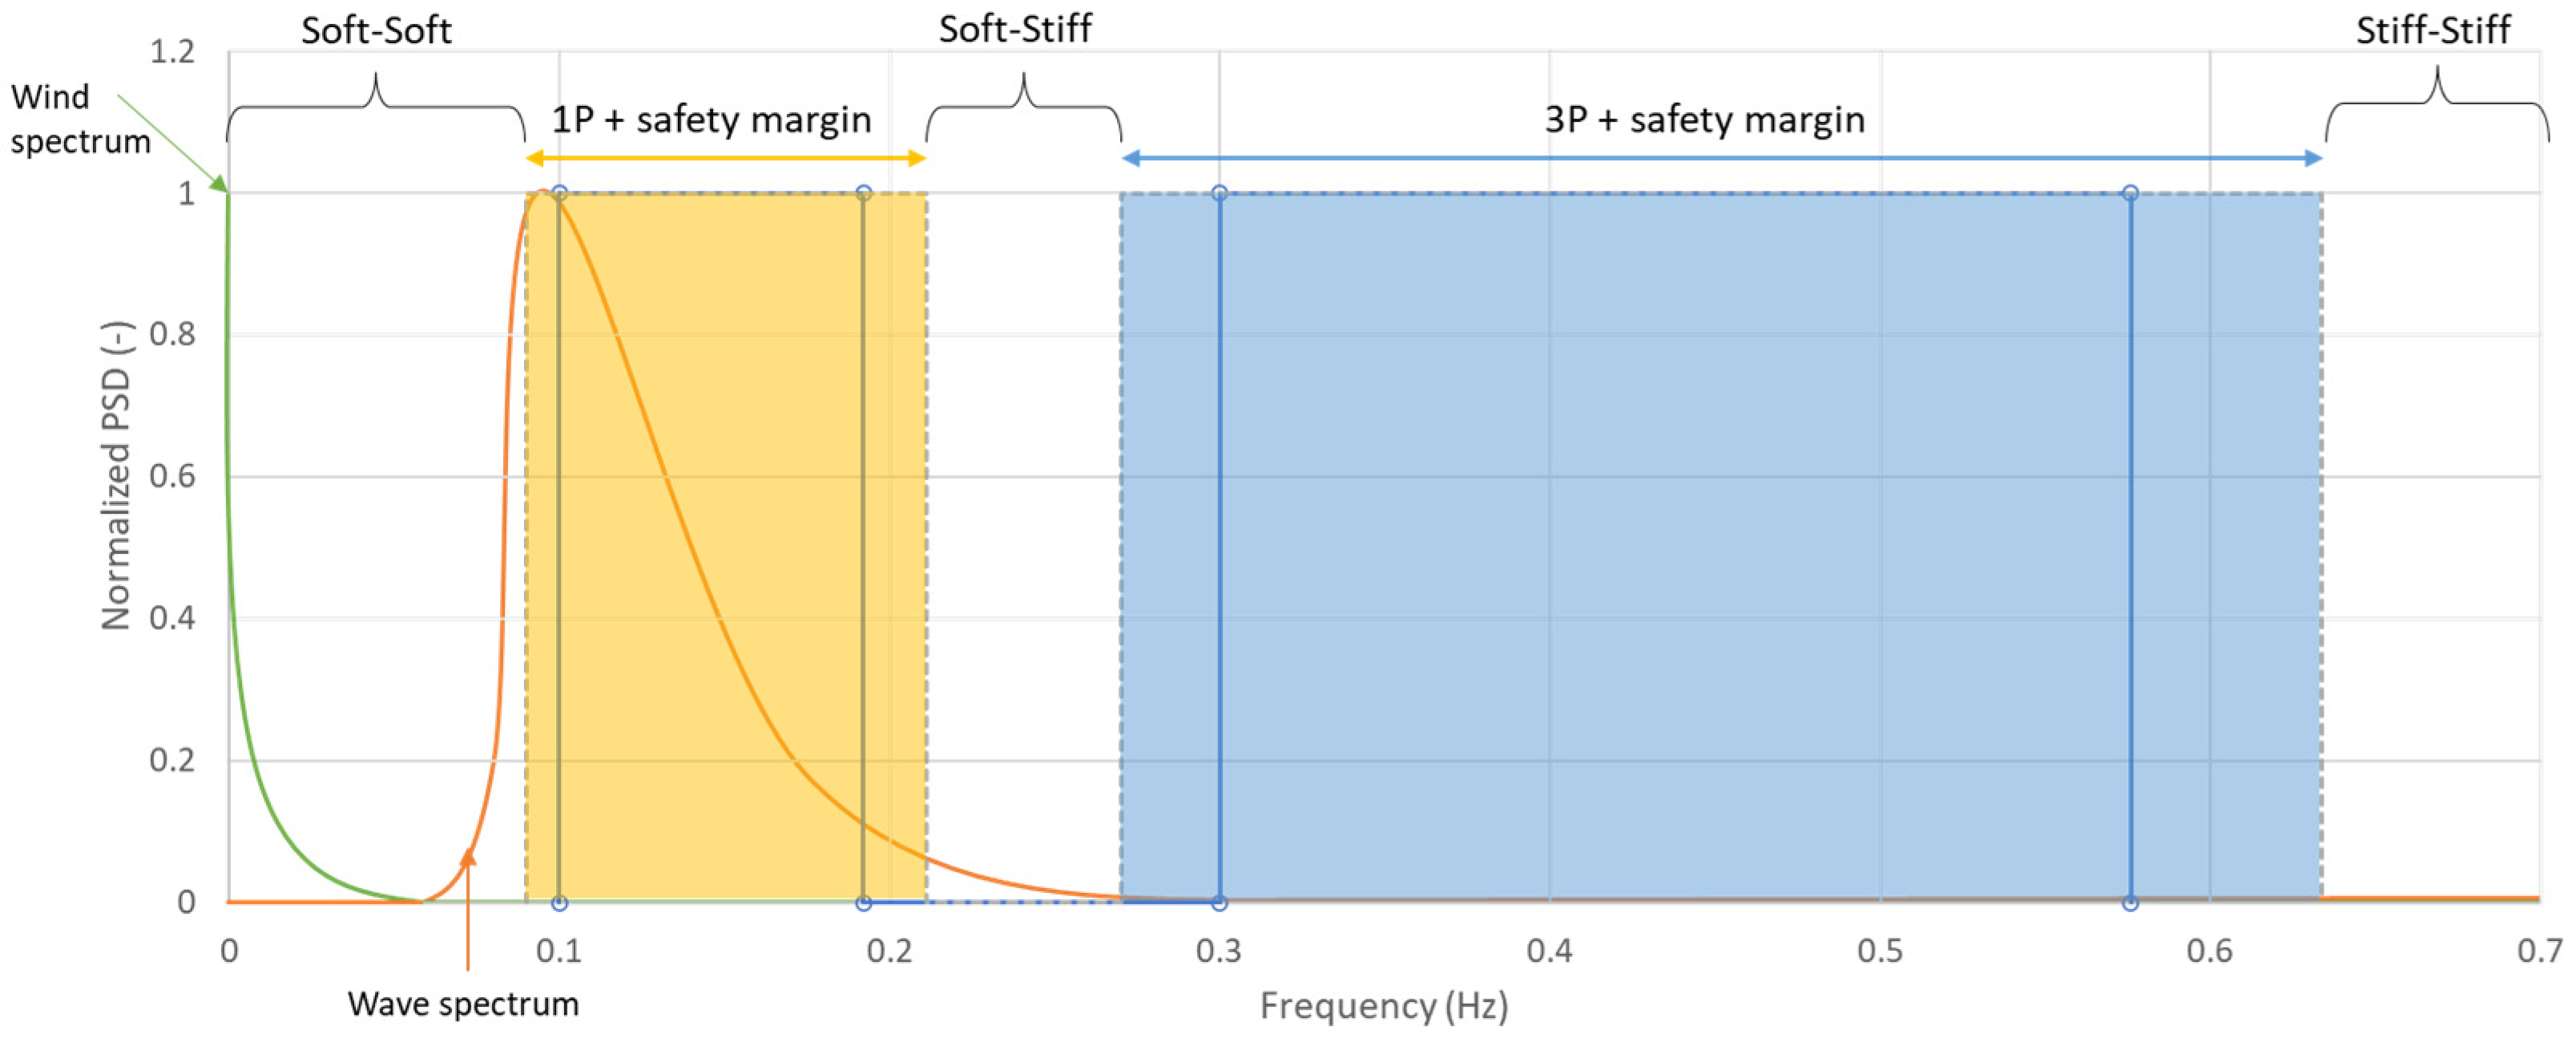
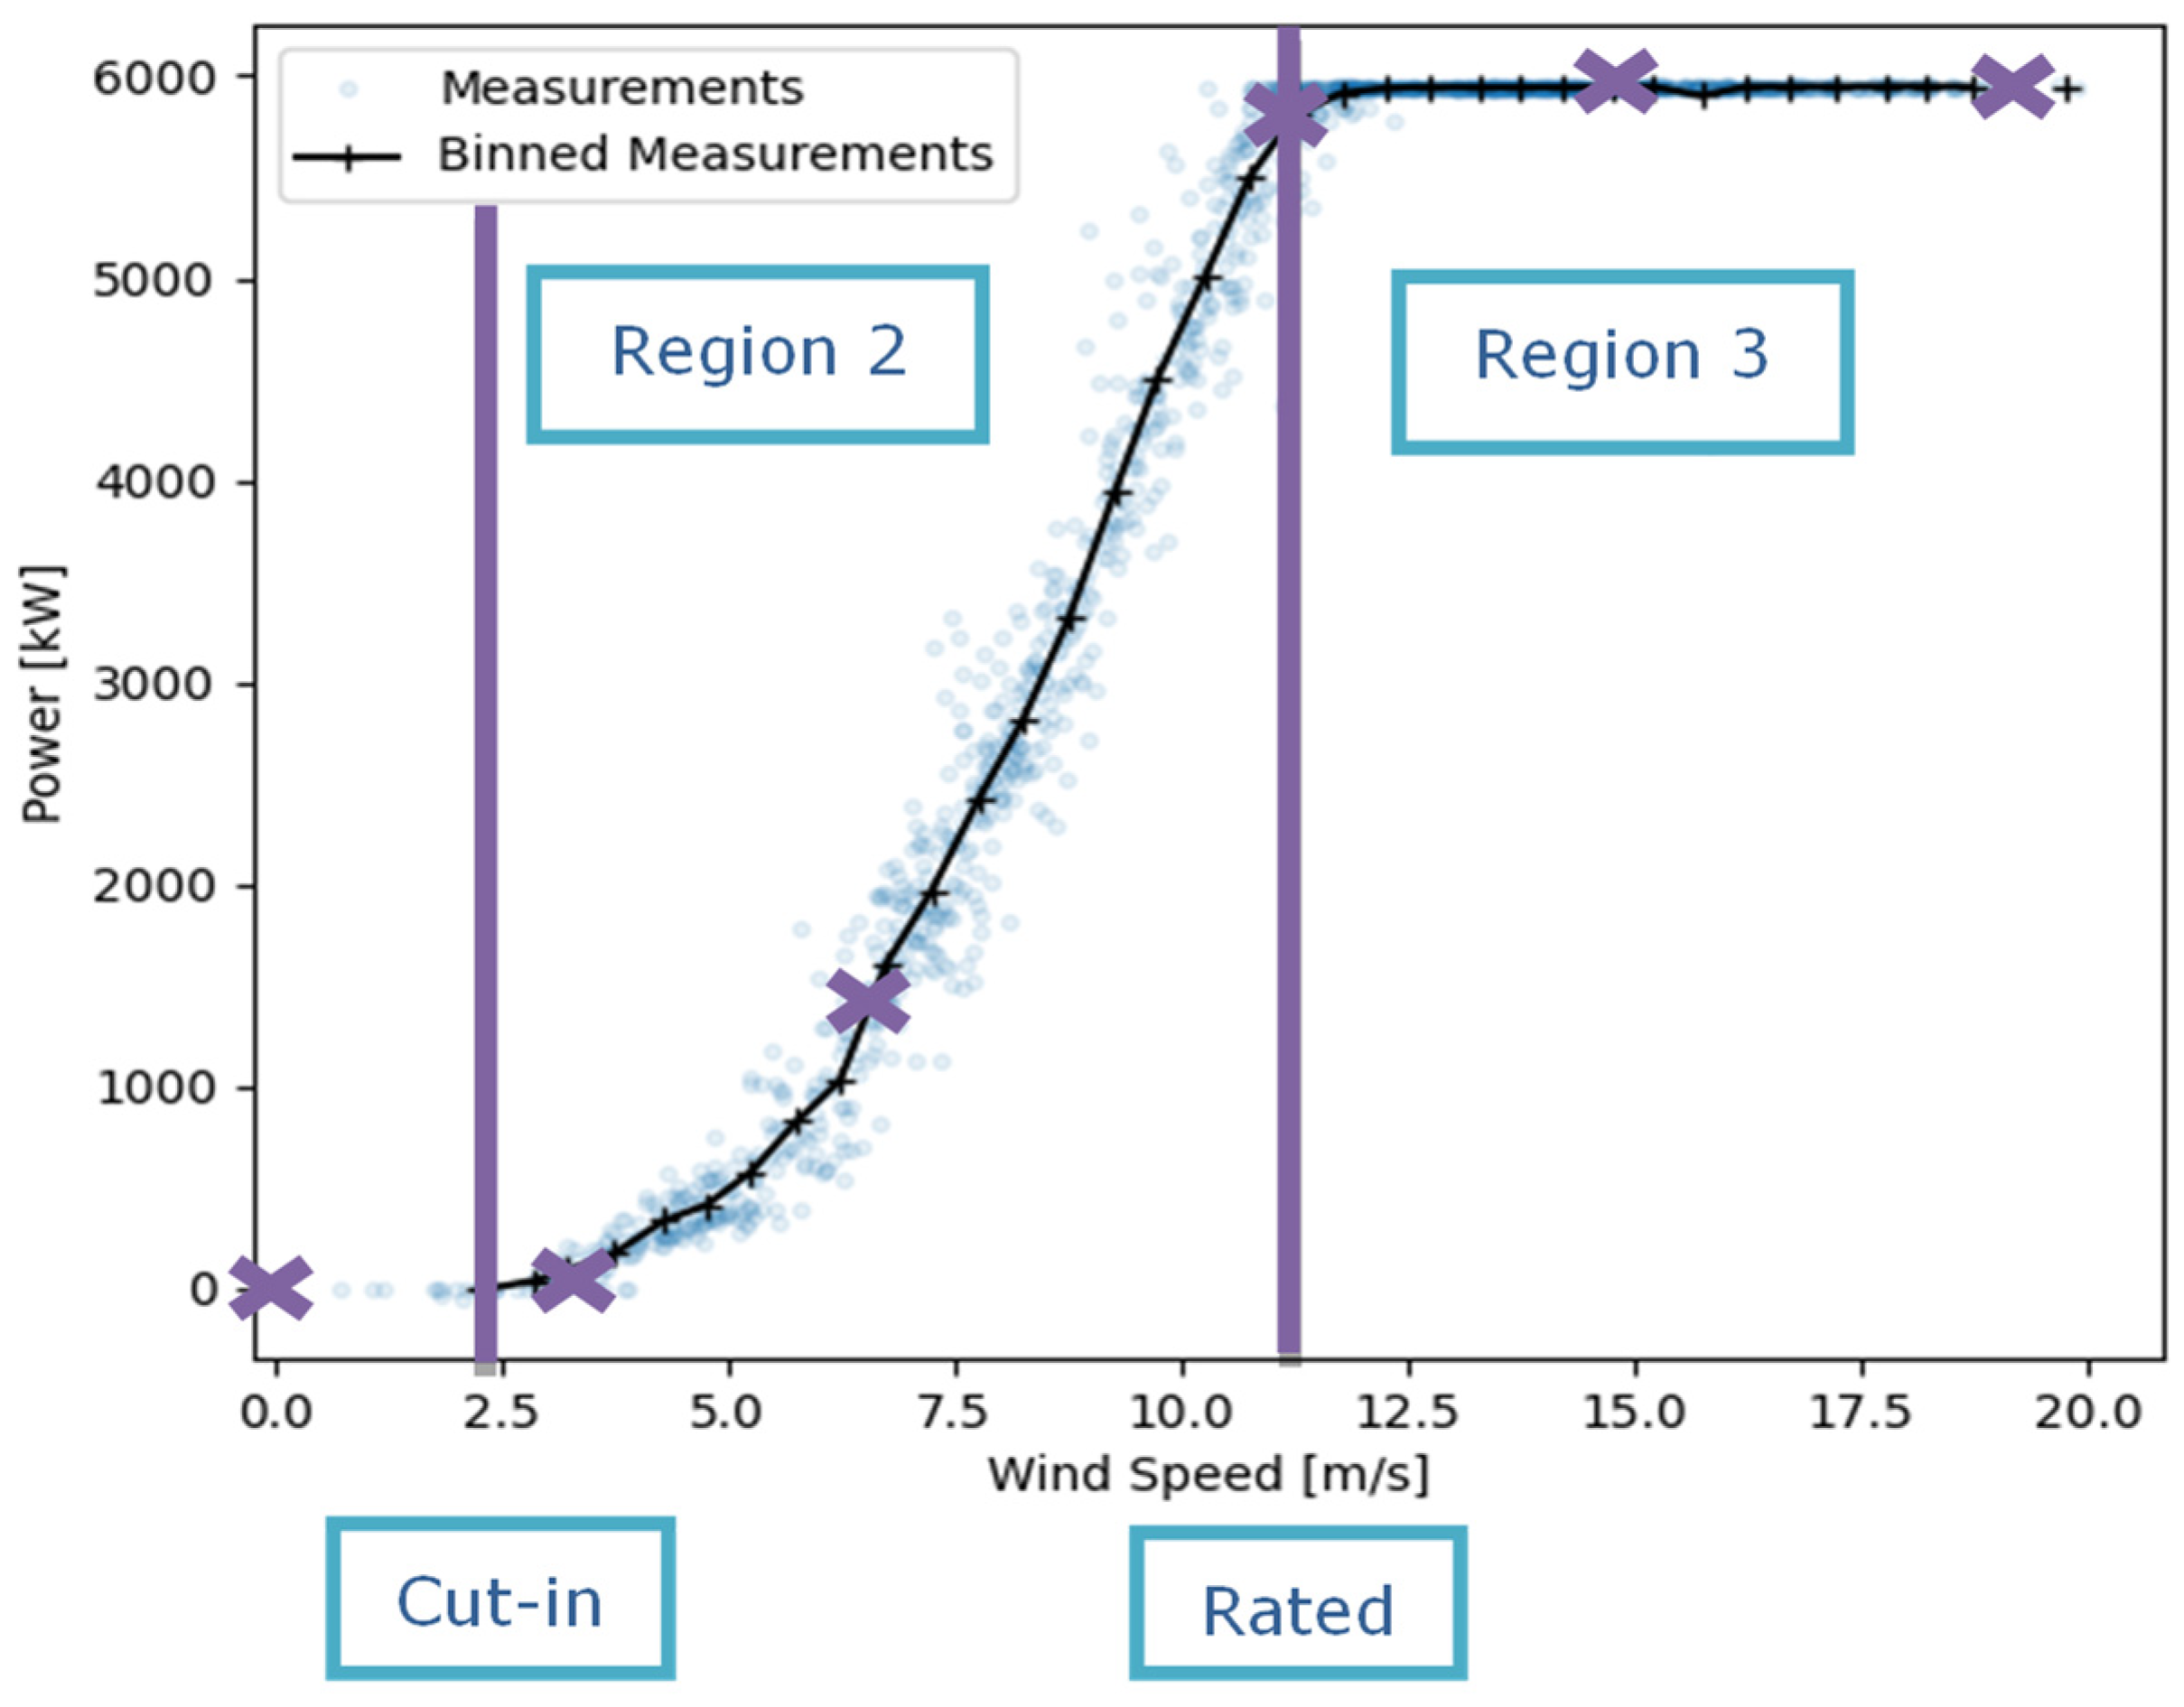
3.1.1. Considered Environmental/Operational Conditions

Figure 8 shows the power curve obtained from SCADA data of the BIWF-B2 turbine between 19 April 2021 and 29 April 2021, for a total of 1441 samples of 10-min averaged data. The data are binned by wind speed; all the data located within a prescribed wind speed band are averaged. In the figure, the power curve is divided into three regions. Region 1 is where the turbine is idling (i.e., zero power generation and potential spin-up of the rotor). Region 2 is the region where the turbine operates in conditions to maximize the power capture for a given wind speed between the cut-in and rated wind speed. No pitching occurs in Region 2. Region 3 is the control region where power is held constant at its rated value, the controller actively pitches the blades, and the wind speed is greater than or equal to the rated wind speed (11.5 m/s).
For our numerical analyses, we select a subset of operational and environmental conditions across the different regions. The points selected are shown in Table 2 and in Figure 8 (where “x” indicates the points with wind speed below 20 m/s). For the data point selected in Region 1, we assume a parked turbine, with rotor speed, wind speed, and pitch angle of zero, and the generator degree of freedom is turned off, as if the shaft brake was engaged. Two points in Region 2 and three points in Region 3 are selected; one of the Region 3 points is at the boundary of Regions 2 and 3. The cut-out wind speed is 25 m/s for this turbine, at which the controller would turn off the turbine to protect it (zero power generation); however, in this numerical sensitivity analysis, we consider wind speeds of 27 m/s and 31 m/s with the rated rotor speed to further study the dependence of the modal parameters with respect to wind speed and pitch angle, which are denoted by two additional points marked with asterisks in Table 2, and the overall region above rated wind speed is referred to as Region 3*.

3.1.2. Sensitivity of Modal Parameters to Considered Conditions in OpenFAST

In this section, we investigate the sensitivity of natural frequencies and damping ratios of the B2 OWT for typical operating conditions where wind speed, rotor speed, and pitch vary jointly and depend on one another. There are similar studies in the literature that focus on the variation of the blade modes, as they change significantly more with operating conditions than the tower/system modes; however, based on our findings, the OWT system modal parameters of the first bending modes can also change significantly. We considered two cases in which blades are assumed to be rigid or flexible to capture the effect of the flexibility of the blades on modal parameters. We present the results for the simulations in Regions 1–3* in Figure 9. We observe that the first SS natural frequency and damping ratio of the turbine do not change in Region 2, despite the change in wind speed and rotor speed. However, the damping ratio of the first FA mode increases from 1% to 8.5% when the wind speed changes from 0 to 11.5 m/s in both cases of flexible/rigid blades. This change is caused by the aerodynamic damping.
The first FA natural frequency is 0.279 Hz and 0.272 Hz when the blades are assumed to be rigid and flexible, respectively, for a parked turbine. Flexible blades make the wind turbine system more flexible than a rigid case in the parked condition; however, the turbine with flexible blades becomes stiffer while in operation. The first FA frequency of the turbine with rigid blades stays constant in Regions 2–3*. The flexibility of blades could capture the stiffening of the turbine due to the centrifugal effect of blades. For a turbine with flexible blades, the first FA natural frequency increases by 7% from 0.272 Hz to 0.291 Hz when the wind speed changes from 0 to 11 m/s and the rotor speed changes from 0 to 11 rpm. The reason for this change in frequency is probably the rotational stiffening of the blades that is also discussed in Section 3.1.4.
In Region 3*, the rotor is spinning at its rated speed as the wind speed increases beyond the rated speed. Again, the first SS natural frequency and damping ratio do not change with wind speed. The natural frequency of the first FA mode increases from 0.291 Hz to 0.295 Hz when the wind speed increases from the rated speed of 11 m/s to 23 m/s. It then increases to 0.297 Hz at the wind speed of 31 m/s. Overall, an increase of 8.5% in natural frequency of the FA mode is observed in Region 3* compared to the parked condition.
As the wind speed increases, in both cases of rigid/flexible blades, the damping ratio of the first FA mode stays somewhat constant between 8.5% and 9%. The aerodynamic damping in this region does not vary significantly. As the wind speed increases, the controller pitches the blades such that the turbine captures less energy from the wind, which appears to limit the effect of the aerodynamic damping. The aerodynamic damping reaches its maximum when the turbine captures the most available energy from wind in Region 3*.

3.1.3. Sensitivity of Modal Parameters with Respect to Individual Operational Parameters

In Section 3.1.2, changes in modal parameters of the wind turbine were investigated when rotor speed, wind speed, and pitch angle varied jointly with what was considered to be the typical operating conditions. These joint conditions introduce centrifugal stiffening and aerodynamic stiffening effects. In this section, we investigate the sensitivity of modal parameters to individual environmental/operational conditions including wind speed, rotor speed, yaw angle, and mean sea level when they are changed individually. In this way, we could know where the tower stiffening in the first FA frequency and FA/SS damping ratios comes from, which is discussed in Section 3.1.2. Some of the conditions investigated may be unrealistic, but the study is useful for understanding overall effects on modal parameters.

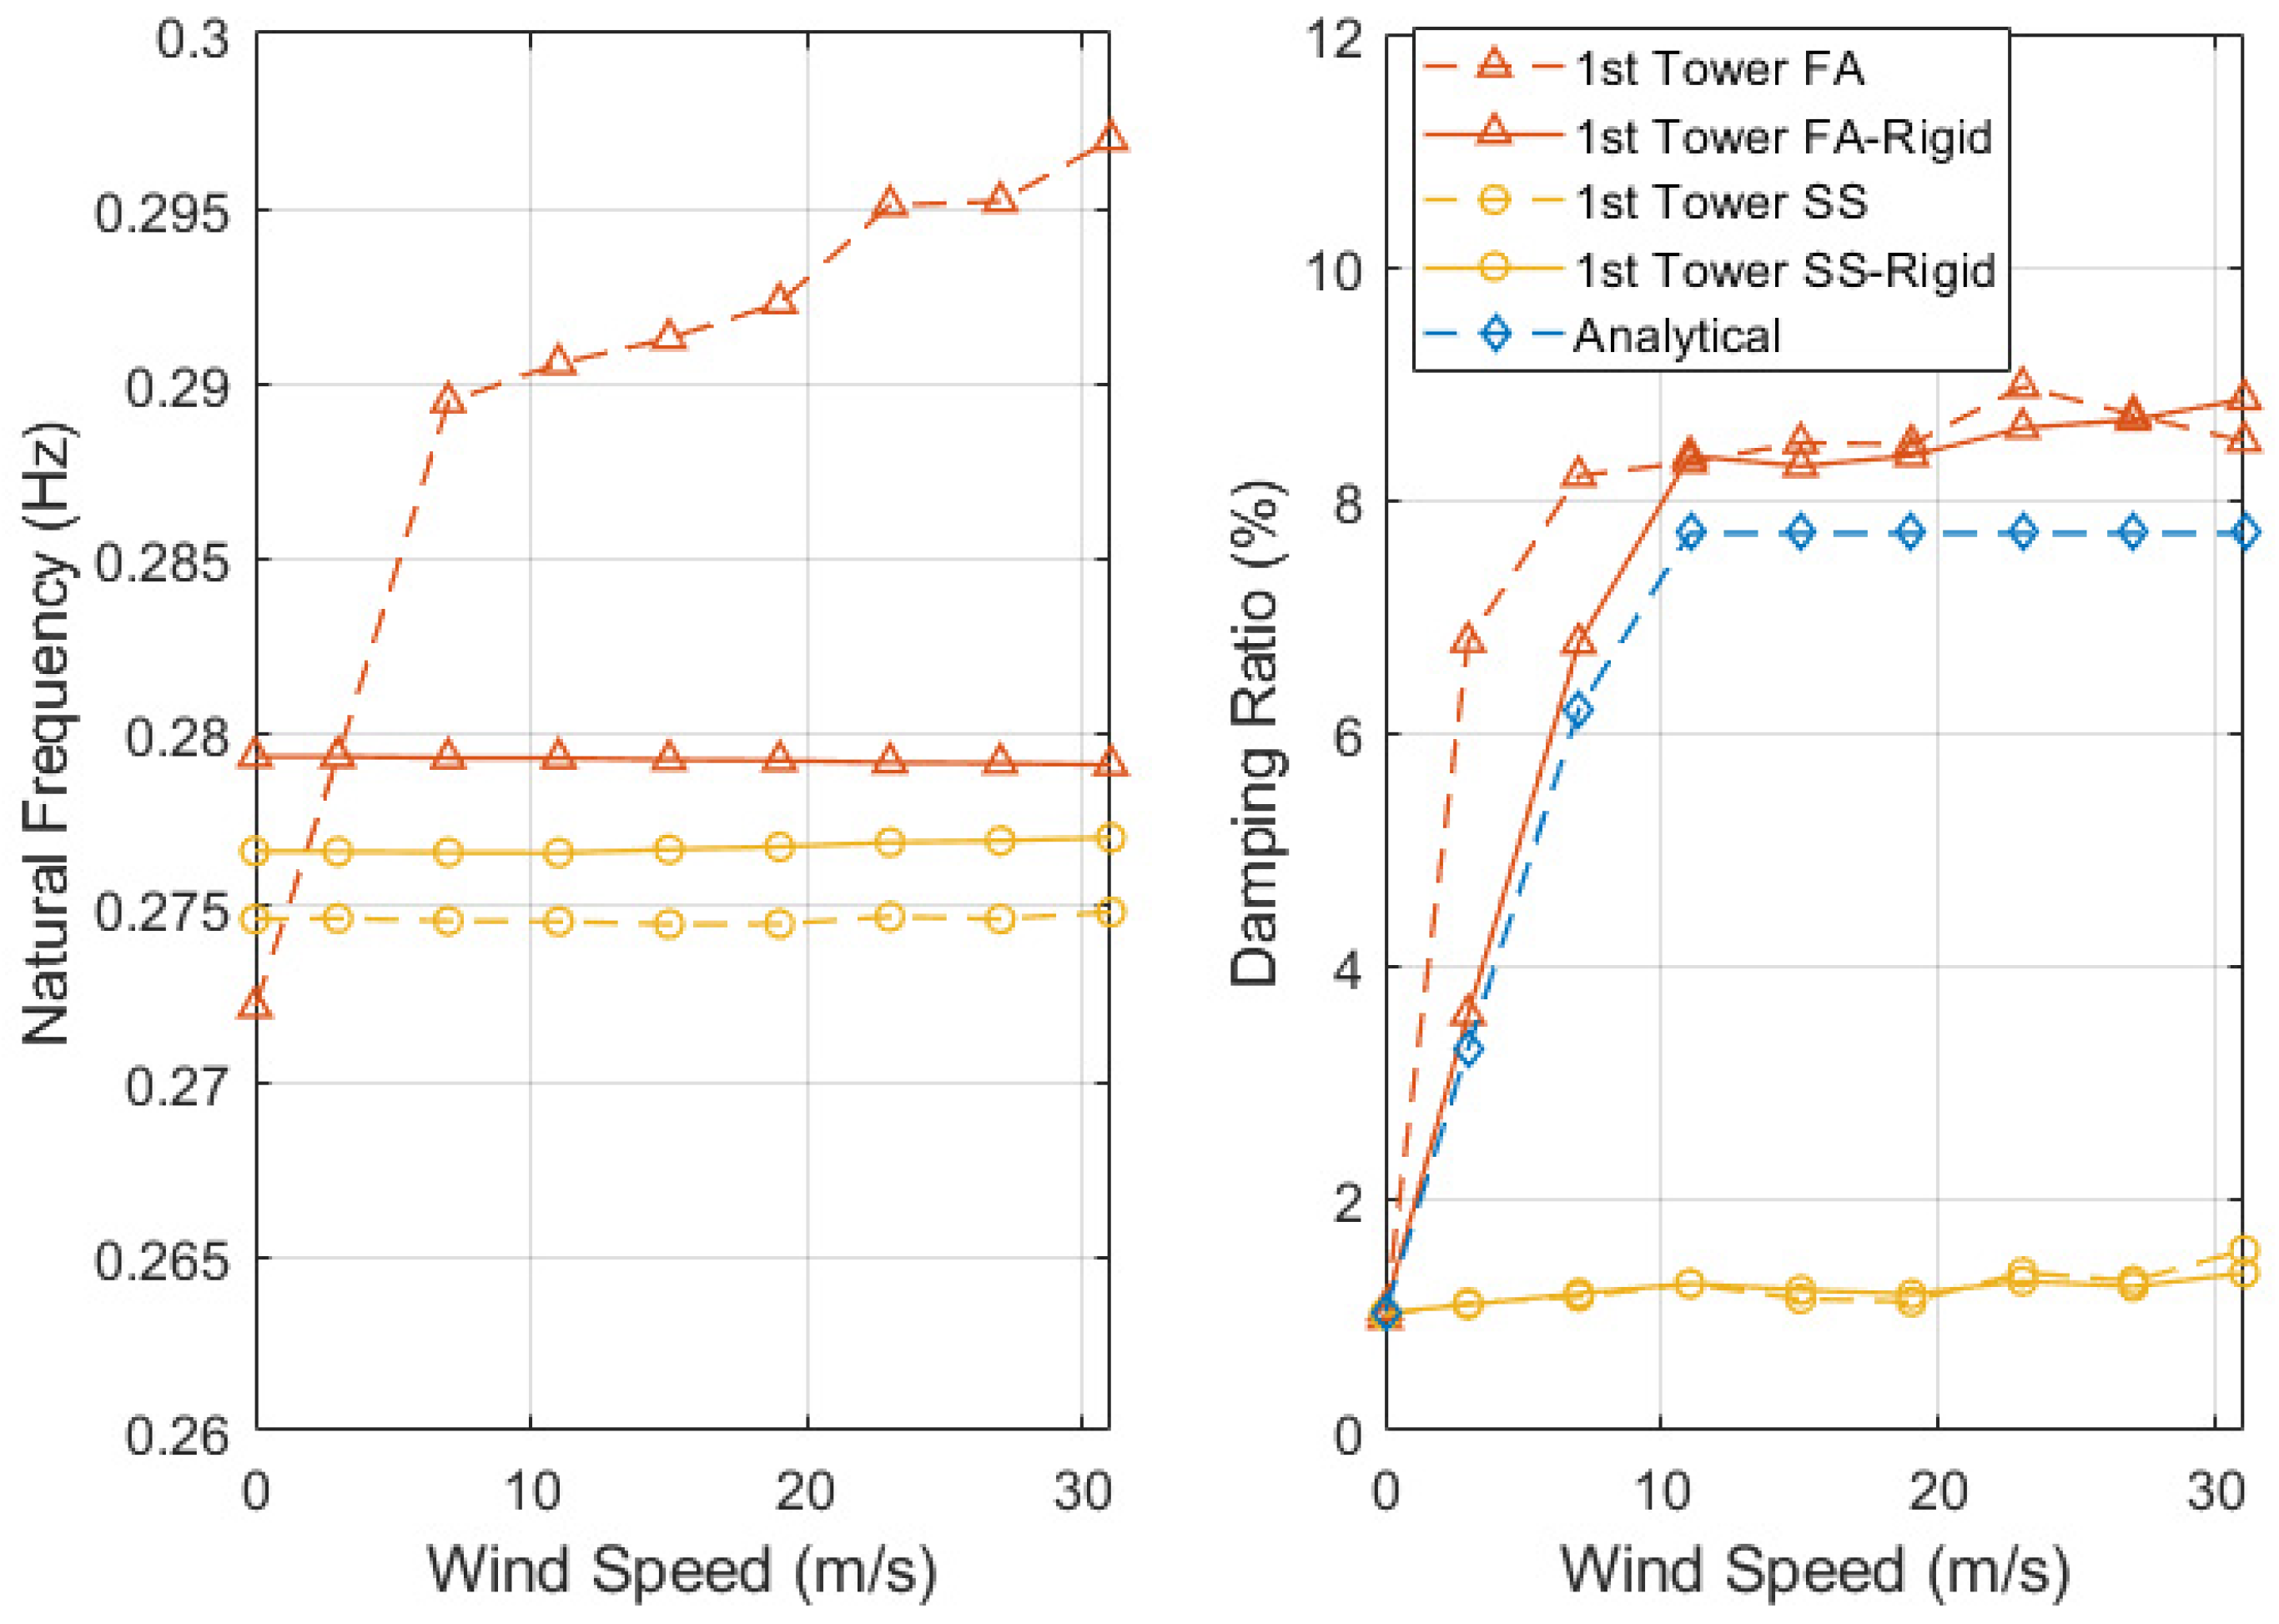
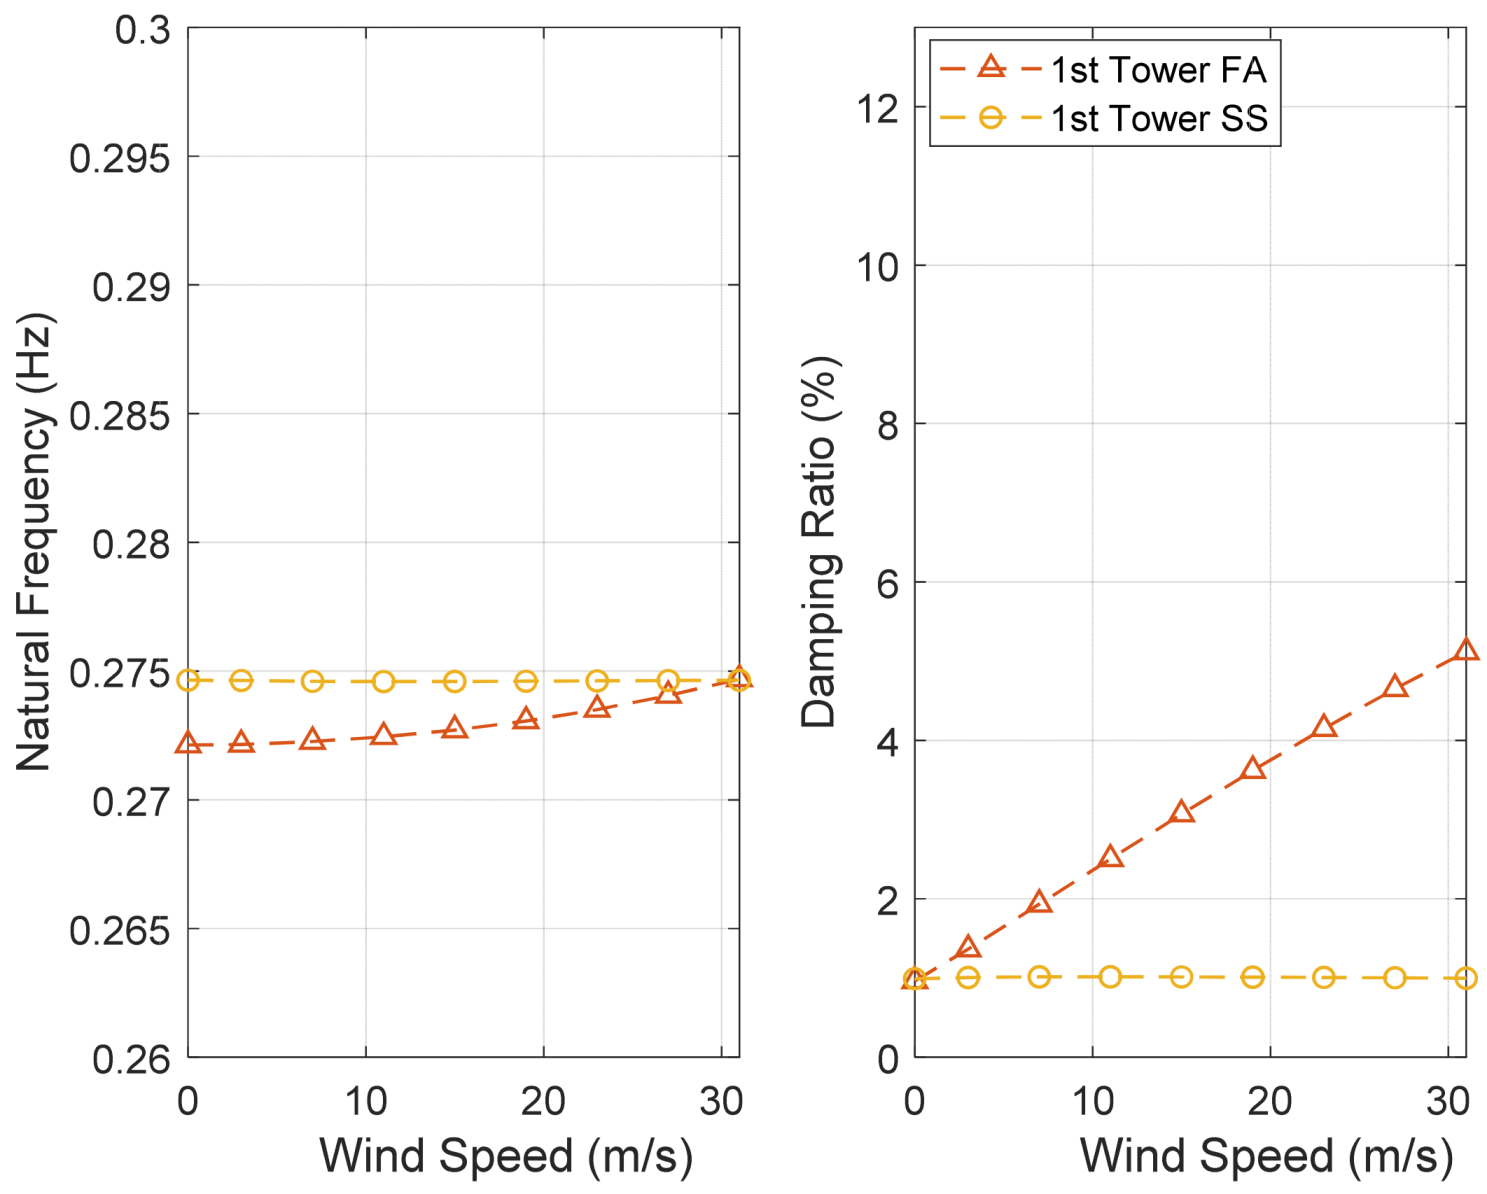
Effect of Wind Speed

In this section, we study the effect of wind speed under parked or rotating conditions. In the parked case, the shaft is locked (rpm = 0) and the wind speed is varied between 0 and 31 m/s. In the rotating case, the turbine operates at its rated rotor speed and the wind speed is varied between 11 and 31 m/s with zero pitch angle of the blades.
The results for the parked case are shown in Figure 10. We do not observe significant variations of the first FA and SS natural frequencies in the parked condition as the wind speed changes. The SS damping ratio does not change with wind speed, but the FA damping ratio increases linearly from 1 to 5% when wind speed grows to 31 m/s. This proves that aerodynamic damping is present in the nonrotating case; however, for an operating turbine, the damping ratio of the FA mode is higher than that of the parked turbine. For instance, the damping ratio at the rated wind speed of 11 m/s in Region 3 is 8.5% (Figure 9), whereas it is 2.5% for a parked turbine (Figure 10). It is indeed expected that both rotor speed and wind speed have effects on the aerodynamic damping ratio of the FA mode (see Section 3.1.4).
The results for the rotating case are shown in Figure 11. We observe that the first tower SS natural frequency and damping ratio do not change with wind speed. The natural frequency of the first FA mode reduces from 0.292 Hz to 0.274 Hz when the wind speed increases from the rated speed of 11 m/s to 31 m/s. As the wind speed increases, the damping ratio of the first FA mode decreases from 8.5% (rated wind speed) to 4.9% (19 m/s), then increases to 7.2% for a wind speed of 31 m/s.
The aerodynamic damping in this region is expected to decrease because the tip speed ratio (TSR) and the thrust coefficient decrease for higher wind speeds. TSR, denoted as λ, is defined in [50] as:
λ = Ω R U
where Ω (rad/s) is the rotational speed of the blades, R is the blade length (m), and U is the wind speed (m/s).
In Equation (3), as wind speed increases for a constant rotor speed, zero pitch, and R = 75 m, λ decreases from 8.2 to 2.9 when wind speed increases from 11 m/s to 31 m/s. Accordingly, the thrust coefficient decreases. The values of TSR and thrust coefficient (CT) for different wind speeds are given in Table 3. The maximum CT is 0.61 (wind speed of 11 m/s) and the lowest is 0.16 (wind speed of 31 m/s). Therefore, the thrust force and aerodynamic stiffening effect decrease in Region 3 with the increase in wind speed, resulting in a decrease in the natural frequencies of the FA mode. Reduction in the TSR also results in less aerodynamic damping.

Effect of Pitch Angle of Blades

To determine the effect of pitch angle on the modal parameters in Region 3*, we compare the results from Section 3.1.2 and Section 3.1.3. We studied the modal parameters in Region 3* with varying wind speed and pitch angle in Section 3.1.2., while in Section 3.1.3. the modal parameters were obtained in Region 3* with varying wind speed and zero pitch angle. Comparing results of simulations of an operating turbine with or without the pitch angle of blades in Region 3* (Figure 9 and Figure 11) shows that pitch angle of blades has a stiffening effect on the natural frequency of the first FA mode. The pitch angle also increases the first FA modal damping ratio.

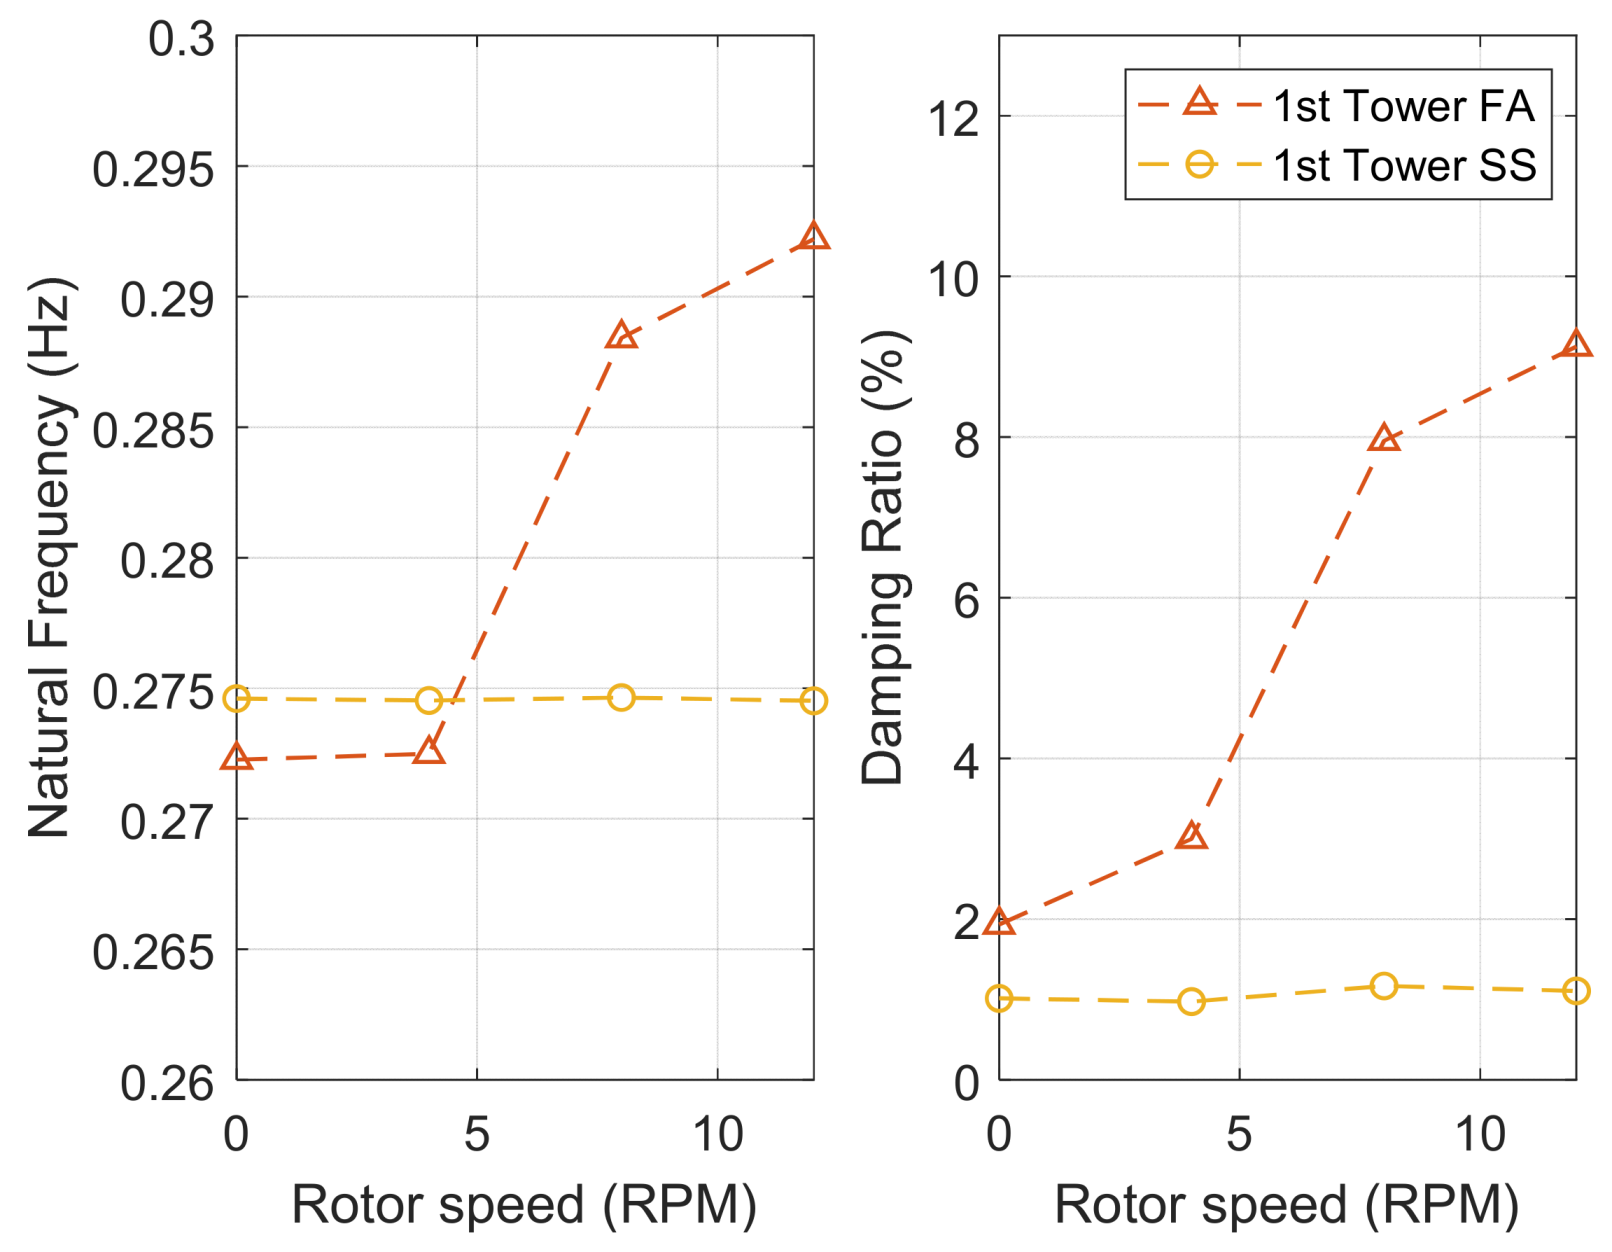
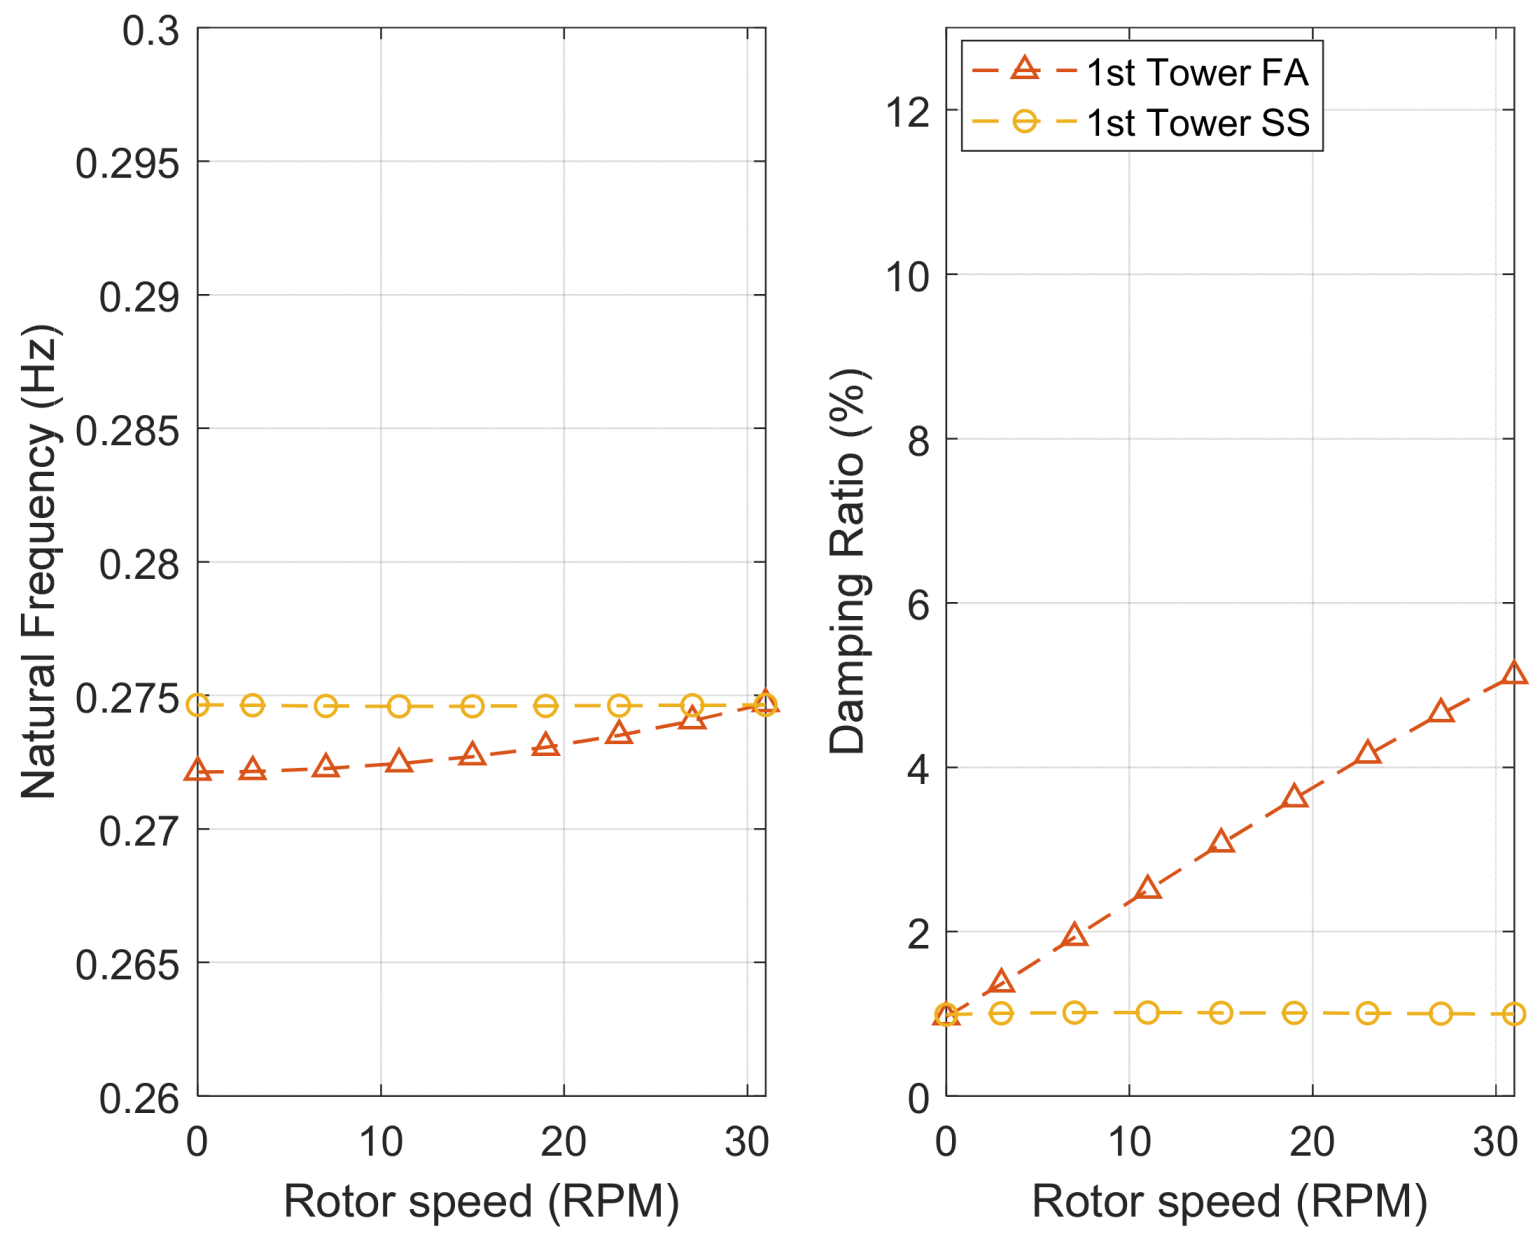
Effect of Rotor Speed

In this subsection, the OpenFAST model is simulated at a constant wind speed of 7 m/s, and the rotor speed varies between 0 and 11.5 m/s. As shown in Figure 12, the SS natural frequency and damping ratio do not change with varying rpm. The changes in FA frequency and damping ratio observed in Figure 12 are similar to the ones observed for Region 2 when the wind speed is varied (see Figure 9). For a constant wind speed of 7 m/s, the effects of rotor speed on frequency and damping ratio of the FA mode are comparable to the situation where rotor speed and wind speed change at the same time; therefore, we can conclude that the main contributing factor is the rotational speed.

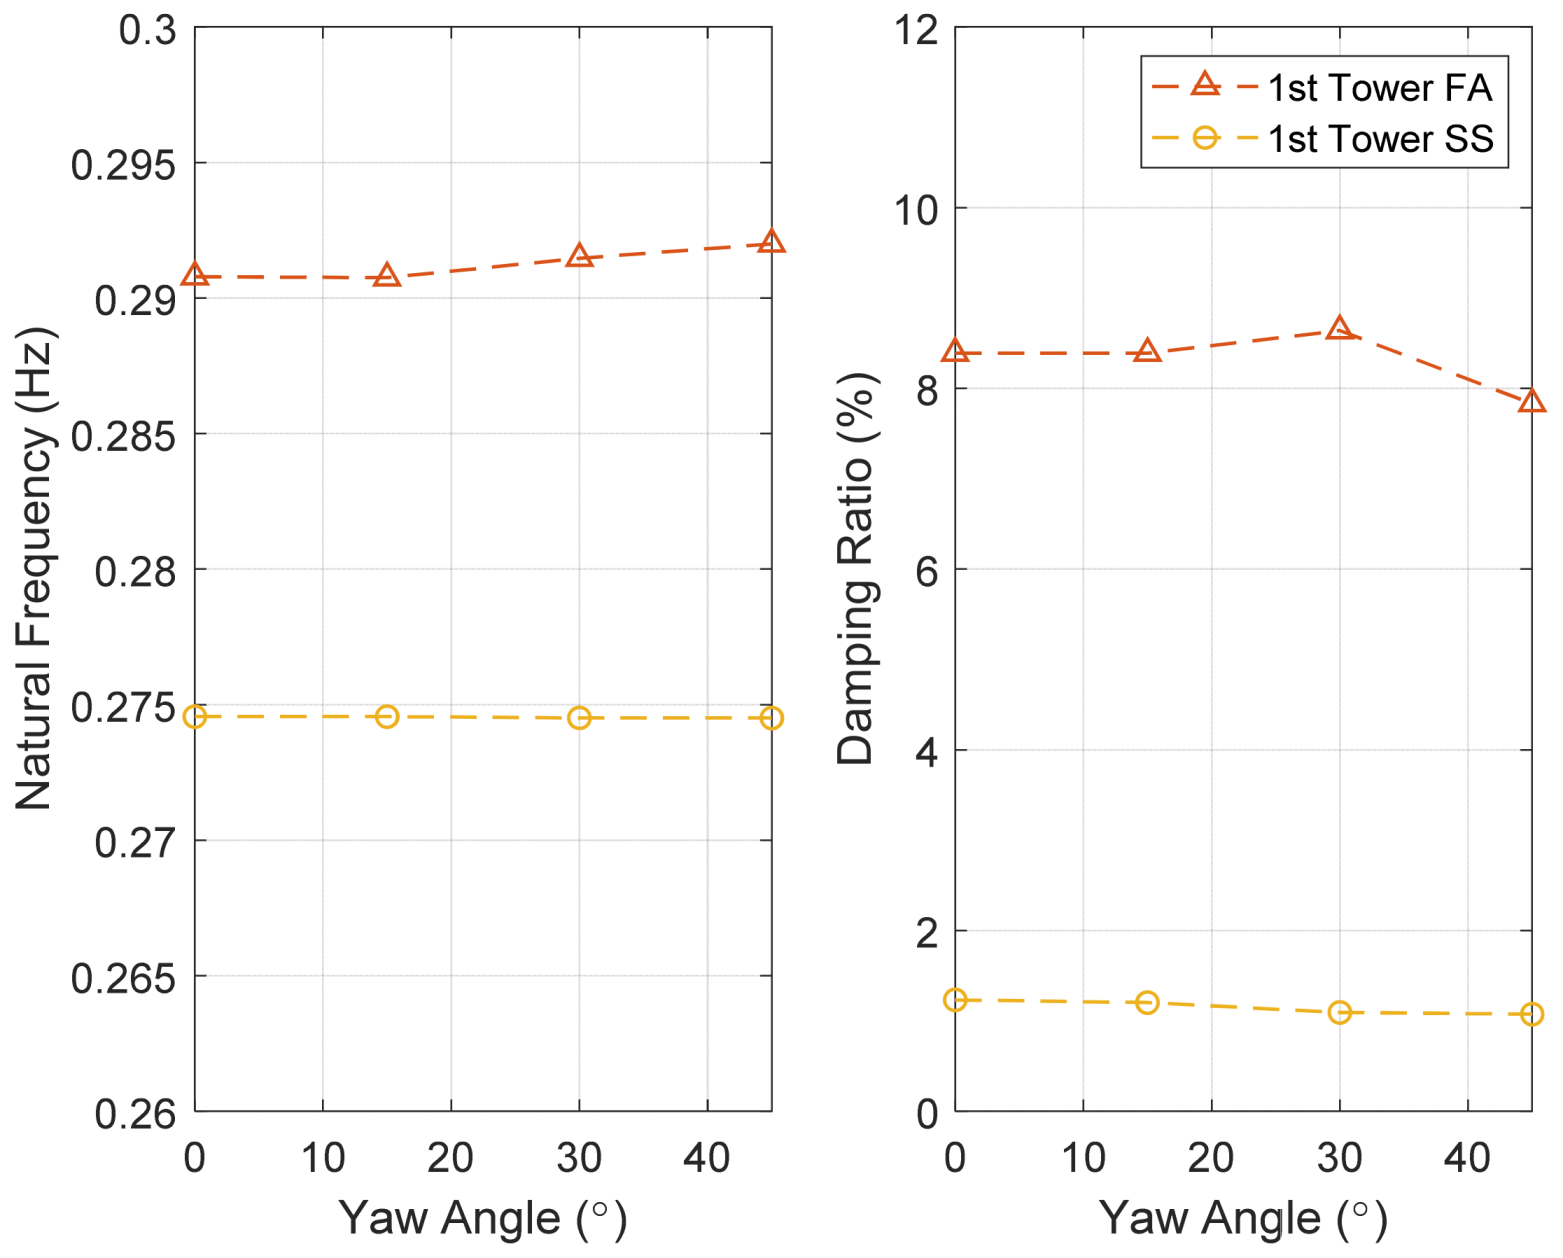
Effect of Nacelle Yaw Angle

To determine the effect of nacelle yaw angle on the natural frequencies and damping ratios of the first FA/SS modes, several yaw angles from 0 to 45° are considered. Note that this is considered because of the symmetry of the support structure, which is a four-legged jacket. For a monopile, the yaw would not affect the model dynamics. A yaw angle of 0° corresponds to the FA/SS directions being parallel to the sides of the platform, and for a yaw of 45° the FA/SS directions are along the diagonals of the platform. The OpenFAST simulations are at the rated wind speed of 11 m/s, aligned with the nacelle direction, and a rotor speed of 11.5 rpm. As shown in Figure 13, the frequency of the FA mode increases by less than 0.02 Hz with the yaw angle, which is negligible. The damping ratio also does not change remarkably by changing the yaw angle. The reason could be that the truss structure of the jacket makes the foundation very stiff, and the orientation of the turbine does not change the response of the turbine significantly. The natural frequency, though, increases slightly at the yaw position of 45° since the jacket is stiffer in its diagonal direction.

Effect of Mean Sea Level

This subsection investigates the effect of mean sea level (MSL) on the first FA/SS frequencies. To study the effect of water on modal parameters of the substructure, simulations are performed with or without using the HydroDyn module. Three cases are considered for simulations of OpenFAST in standstill vacuum conditions (no aerodynamic loads to isolate the effect of MSL), namely MSL = 0 m, 27.75 m, and 32.75 m. MSL = 0 means there is no water in the model and the HydroDyn module is not used. MSL = 27.75 m is the water level at the site of the turbine in Block Island. For the cases of MSL > 0, we use the HydroDyn module in the simulations. The first natural frequencies of the FA/SS modes remain constant at 0.275 Hz and 0.272 Hz in all three cases. Therefore, adding still water to the model does not significantly affect the modal frequencies. Different results may be obtained with different support structures. Monopiles are known to be more compliant, and therefore the system frequencies are more likely to be affected by the hydrodynamics (hydrodynamic added mass, damping, and stiffness).

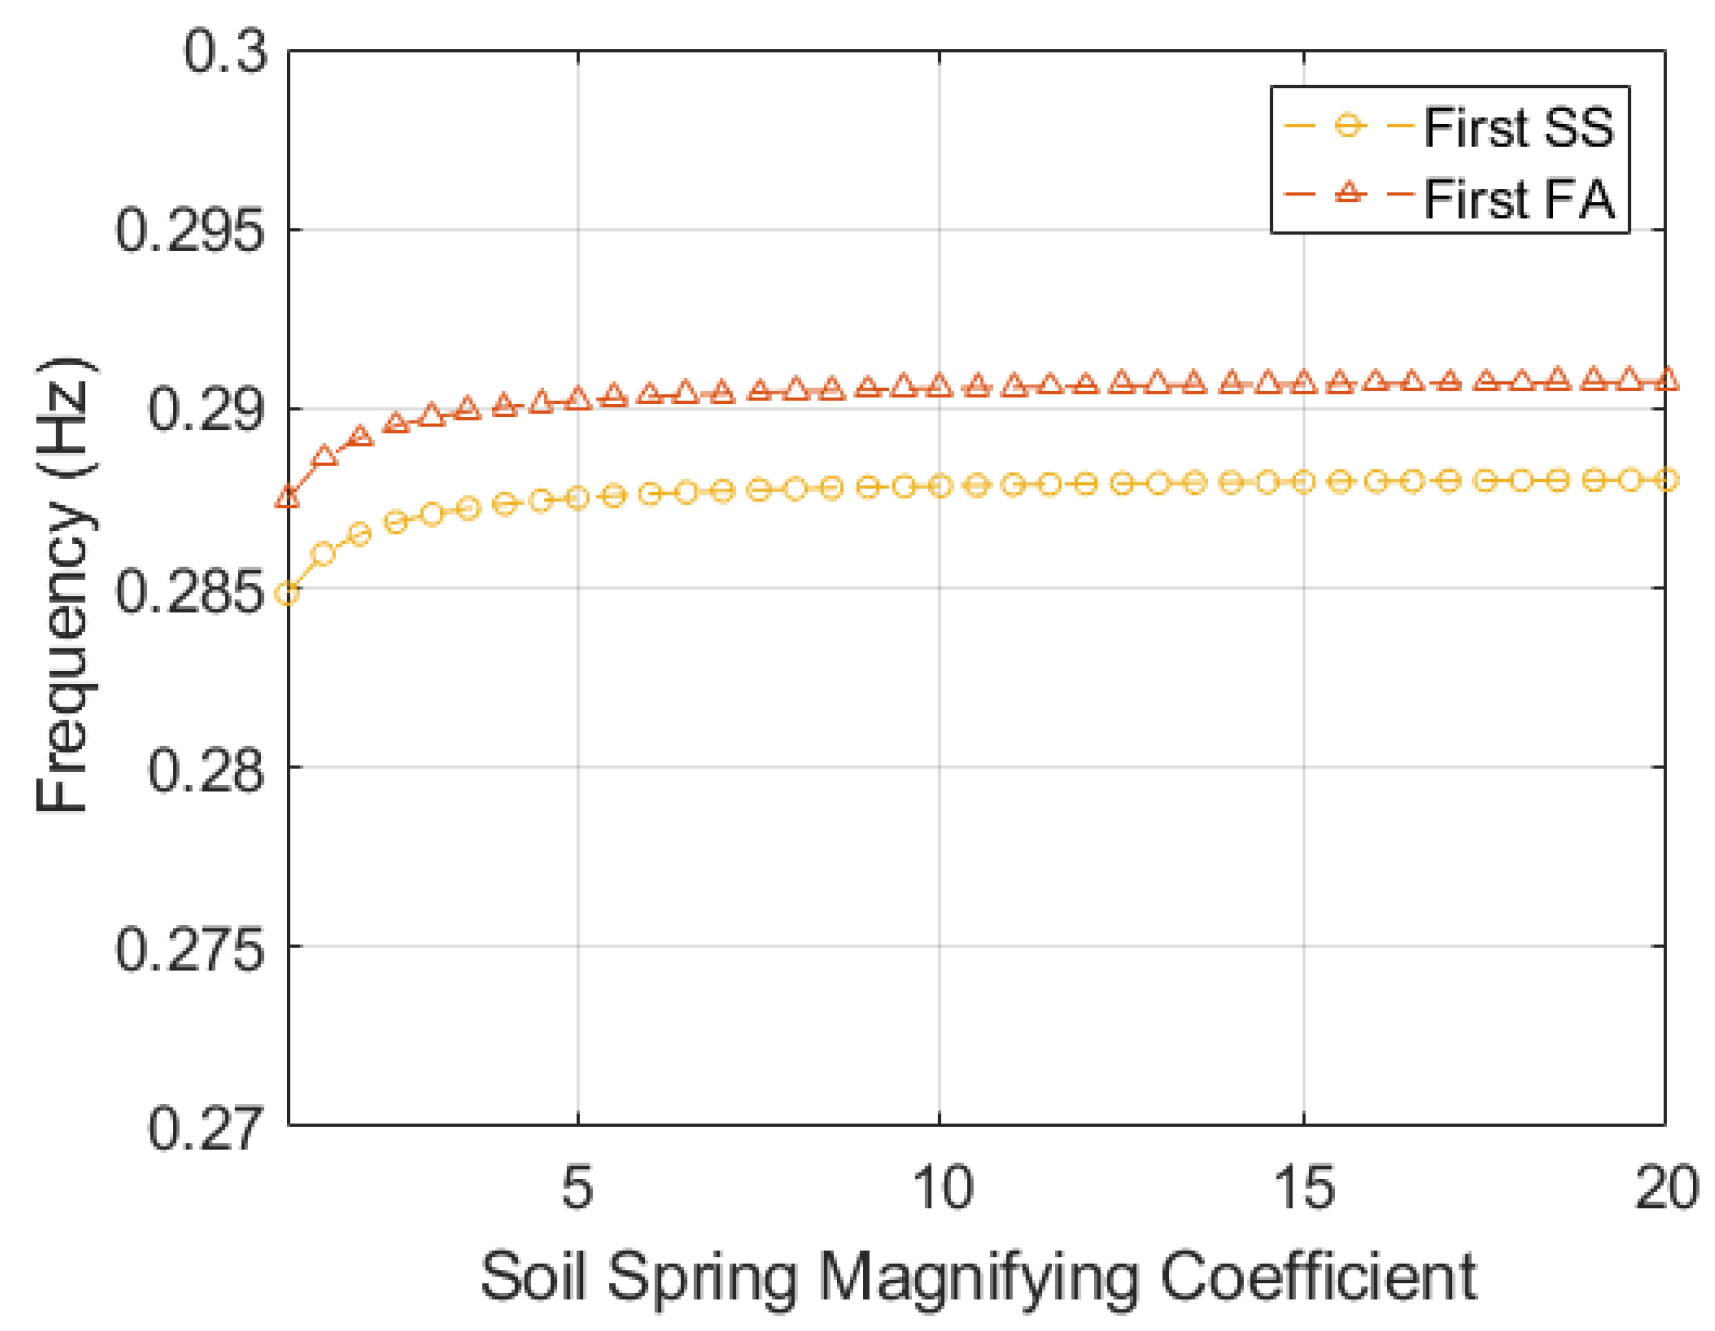
Effect of Soil Stiffness

This subsection studies the effect of soil stiffness (represented as soil springs) on the modal parameters of the B2 OWT. The soil stiffness is modeled using four vertical soil springs with equivalent stiffness under the jacket legs at mudline level. To study the sensitivity of the first FA/SS natural frequencies to the soil stiffness, a range of spring stiffnesses from 2.36 × 10⁹ Pa (initial soil spring value) to 2.36 × 109 × 20 Pa with increments of 2.36 × 109 × 0.5 is considered in the OpenSees FE model of the B2 OWT, where the soil spring magnifying coefficient increases from 1 to 20. As shown in Figure 14, the vertical soil spring has small effects (less than 1% stiffening effect) on both the FA and SS natural frequencies. A similar study was performed for effects of lateral and rotational soil springs, and it was concluded that the effects of lateral and rotational soil springs are much smaller than vertical springs and thus negligible. However, soil springs are reported to affect the monopiles more significantly [58].

3.1.4. Analytical Sensitivity

In this section, we evaluate analytically the aerodynamic damping of the B2 OWT and study the rotational effects on the stiffening of the operating turbine.

Aerodynamic Damping—Analytical Expressions

The main sources of damping in a wind turbine include aerodynamic, structural, soil, hydrodynamic, and supplemental damping (from devices) [59]. For an operating turbine, the most significant source of damping is the aerodynamic damping in the FA direction, which originates from the interaction between the wind and the rotor [34]. The drag force from the wind on the blades impedes the rotor vibration. The aerodynamic damping effect is implicitly included in fully coupled wind turbine modeling packages such as OpenFAST. Many research studies have used such packages to observe the effect of inflow wind speeds, pitch angles, and rotation speeds on the FA aerodynamic damping [60,61,62]. Van Der Tempel [63] proposed a formula for calculating the aerodynamic damping, which is simplified by Manwell et al. [64] as shown in Equation (4). It is assumed that the rotor is operating at a relatively high tip speed ratio.
ζ = c a d p c c = B ρ C l α Ω S 1 b 4 m ω n
where cc is the critical damping equal to 2n, cadp is the aerodynamic damping term equal to B 2 ρ c l α Ω s 1 b , S1b (m3) is the first moment of area of one blade, B is the number of blades, Ω is the rotational speed, ρ is the atmospheric density, C is an assumed lift curve slope (assumed to be constant along the blade span, i.e., before stall), m is the RNA mass, and ωn is the first natural frequency of the wind turbine. The parameters used for the B2 OWT are S1b = 7080 m3, B = 3, Ω = 1.204 rad/s (11.5 rpm), ρ = 1.225 kg/m3, C = 2 π rad−1, m = 4.3 × 10⁵ kg, and ωn = 1.71 rad/s (fn = 0.272 Hz). This leads to an aerodynamic damping ratio of ζ = 6.7%. On the other hand, the numerical model’s total damping ratio is 8.5% at the rated rotor speed and rated wind speed, shown in Figure 9. The simulation damping ratio is computed as 1% for a parked turbine, which is the structural Rayleigh damping. The damping ratio at the rated wind speed includes both structural and aerodynamic damping. So, the total analytical damping ratio is 7.7%, which is the summation of the structural damping of 1% and the aerodynamic damping of 6.7%. The total analytical damping of 7.7% is in reasonable agreement with the numerical damping ratio of 8.5% from OpenFAST, as shown in Figure 10. The identified damping ratios from measured data, shown in Figure 4, are between 3 and 15% for wind speed greater than or equal to the rated wind speed, and the analytical damping ratio is within this range.

Rotational Effects on Stiffness

The stiffening of the wind turbine system is due to the centrifugal [65,66] and gyroscopic effects. The gyroscopic effect on the turbine frequency is studied by many researchers on floating offshore wind turbines (FOWTs). Bahramiasl et al. showed that the rotation of the blades had shifted the peak of heave, surge, pitch, and yaw spectrums to a higher frequency due to the gyroscopic effect appearing as an additional damping term [67]. Høeg and Zhang investigated the effect of gyroscopic effects on dynamic responses of FOWTs in idling and operational conditions [68]. They developed a 17-degrees-of-freedom FOWT model and focused on the correct procedure for capturing the full gyroscopic couplings in linear equations of motions. Staino and Basu proposed the modeling and control of vibrations in wind turbines due to a change in the rotational speed of the blades [69]. They included the effects of gravity and centrifugal stiffening due to the rotation of the blades. They found that the rotor acceleration affected the stiffness of the system through the interaction between the blades and the tower. Their work showed how the changes in rotational speed affected the mechanical performance of the system.
Although the stiffening from rotational acceleration in floating turbines is the focus of many research studies, it is not considered significant for the fixed-bottom OWTs. However, in our BIWF study, we have observed about an 8% increase in the FA frequency from parked to operating conditions. One of the factors involved in the stiffening of the turbine system can be the centrifugal stiffening of the blades that will stiffen the system and affect the frequency of the first FA mode. Also at play is the gyroscopic effect of the spinning rotor. The inertia properties of the rotor change with the deflection of the blades, and any changes in the rotor inertia will affect the system frequency. Aerodynamic loads also add stiffness and damping to the system and play a role in increasing the first FA frequency.

3.2. Sensitivity Analysis Using Experimental Data

In this section, effects of different operational and environmental conditions on the identified modal parameters of the OWT are studied using experimental data. Three different regression models are fitted to the first FA natural frequency/damping ratio as a function of SCADA variables representing operational conditions. Six variables (X1 to X6) are selected as the inputs to multivariable linear regression models with modal parameters (natural frequencies and damping ratios of the FA mode) as the outputs. The input (or predictor) variables, X1 to X6, are the normalized wind speed, rotor speed, power, yaw angle, wind misalignment, and collective pitch angle of the blades. All the input values are available in the SCADA data of the turbine and are averaged over 10-min windows. The output or response, Y, is either the first FA natural frequency or the first FA damping ratio, estimated using the acceleration measurements through SSI-DATA [70]. All variables are scaled to be in the range [0, 1]. Three models are considered in this sensitivity study: (1) the standard multiple linear regression model, (2) the multiple linear regression model with interaction terms, and (3) the polynomial degree 2 regression model with interaction terms. The model forms 1–3 are represented in Equations (5)–(7), respectively. The regression coefficients are estimated through a least squares problem.
y ^ = β ^ 0 + β ^ 1 x 1 + β ^ 2 x 2 + + β ^ 6 x 6
y ^ = β ^ 0 + β ^ 1 x 1 + β ^ 2 x 2 + + β ^ 6 x 6 + β ^ 12 x 1 x 2 + β ^ 13 x 1 x 3 + + β ^ 16 x 1 x 6 + β ^ 23 x 2 x 3 + β ^ 24 x 2 x 4 + + β ^ 26 x 2 x 6 + + β ^ 56 x 5 x 6
y ^ = β ^ 0 + β ^ 1 x 1 + β ^ 2 x 2 + + β ^ 6 x 6 + β ^ 11 x 1 2 + β ^ 12 x 1 x 2 + β ^ 13 x 1 x 3 + + β ^ 16 x 1 x 6 + β ^ 22 x 2 2 + β ^ 23 x 2 x 3 + β ^ 24 x 2 x 4 + + β ^ 26 x 2 x 6 + + β ^ 56 x 5 x 6 + β ^ 66 x 6 2
where:
  • y ^ : prediction of Y based on Xi = xi for any i = 1, …, 6
β ^ i and β ^ i j : estimated model coefficients for i, j = 1, …, 6. The accuracy of the models is determined by the R2, which is used to measure the goodness-of-fit. It provides the measure of fit in a form of the proportion of variances, and it takes a value between 0 and 1. R2 = 1 means all the variability in the output (i.e., frequency and damping) can be explained by the inputs (i.e., perfect fit), and R2 close to zero indicates that the regression model cannot explain any of the variability in the output (i.e., worst fit).
As shown in Table 4, the R2 statistic for the FA frequency of all models is relatively low, and it increases slightly with additional model complexity. This means that these simple regression models can account for some variabilities in the first FA frequency and damping ratio. For example, R2 is 0.48 for Model 3, indicating that 48% of the variability in the output (first FA frequency) has been explained by the regression model. The R2 for the first FA damping ratio is larger than those for the FA frequency, 0.64 for Model 3; therefore, the variability of the first FA damping ratio is better explained by the regression models. The R2 of the first FA damping ratio also increases slightly when adding model complexity.
The regression coefficients of the normalized inputs can indicate the influence of inputs on the output, i.e., the level of sensitivity. As shown in Table 5, rotor speed has the largest coefficient, β ^ 2 = 0.06, for the first FA frequency, so the first FA is most sensitive to rotor speed. It should be noted that the coefficient values are relative. The parameters with larger effects on the first FA damping are rotor speed and power while wind speed and pitch angle also show moderate effects.

4. Discussion

In this study, a stiffening effect is observed on the first tower natural frequency in the FA direction by increasing wind speed and rotor speed from idling to operation. The first FA natural frequency increases by 8.5% from 0.272 Hz to 0.295 Hz. The stiffening of the wind turbine system mostly happens in Regions 1 and 2 of the power curve. In Region 3 of the power curve, the rotor speed is constant, and, as the wind speed increases from 12 m/s to 31 m/s, the first FA natural frequency slightly increases from 0.295 Hz to 0.297 Hz. The stiffening of the first FA mode can likely be attributed to the centrifugal stiffening of the blades. This is supported by the fact that the simulation with rigid blades (therefore without centrifugal stiffening effects) did not show a stiffening of the first FA mode. Based on the simulation results, the pitch angle of blades also affects the natural frequency of the first FA mode. It also increases the first FA damping ratio.
The first FA damping ratios identified from the measurements over the considered time windows vary between 0 and 15% with a mean value of 5.9% and standard deviation of 3.0%. A simplified analytical calculation was presented and provided a mean damping ratio of 7.7% for the first FA mode considering the aerodynamic damping, which is close to the identified damping ratios. The OpenFAST results show that the damping ratio of the first FA mode increases from 1% to 8.5% when the wind speed changes from 0 to 11 m/s, whereas it stays constant for greater wind speeds (as the blades are pitched and the rotor speed is constant).
In parked conditions (nonrotating), we do not observe significant variations of the first FA and SS natural frequencies as the wind speed increases. We observe some aerodynamic damping in the nonrotating case, but it is significantly lower than in the operating case.
From the coefficients of regression models fitted to the experimental results, the first FA natural frequency was observed to be more affected by the rotor speed compared to other operational and environmental factors considered. The change in FA damping ratio depends on rotor speed, power, and to a lesser extent on wind speed and pitch.
Based on the experimental and the simulation results, the natural frequency and damping ratio of the first SS mode are generally constant and do not show significant variation with operational and environmental conditions.

5. Summary and Conclusions

In this paper, we developed three models of an OWT with a jacket support structure in the BIWF using the OpenSees, SAP2000, and OpenFAST modeling tools and compared their modal parameters with experimental data. Using the OpenFAST model, we investigated the dependencies of the first FA and SS natural frequencies and damping ratios with respect to several operational and environmental conditions for the B2 OWT. Furthermore, regression models were used to study the sensitivity of six operational variables on the natural frequency and damping of the first FA mode of this OWT using experimental data. Based on results from simulations and the regression model, we observed that the increases in wind speed, rotor speed, power, and pitch angle of blades have stiffening effects on the first FA natural frequency and increase the first FA damping ratio of the B2 OWT. It is concluded that there is about 8% stiffening, i.e., an increase in the first FA frequency, and the aerodynamic damping is 7.5% during the operation of the turbine. On the other hand, the impacts of yaw angle, soil spring stiffness, and the presence of water or mean sea level on the first FA natural frequency and damping ratio of the jacket-supported B2 OWT are negligible.
We expect that the stiffening effect of rotor speed, wind speed, power, and pitch angle of blades on the first FA natural frequency and their impacts on the first FA damping ratio are true for other fixed-bottom OWTs (e.g., monopiles). We also expect that the yaw angle would not affect the first natural frequency and damping ratio, whereas the conclusions on the soil spring stiffness and mean sea level cannot be extended to monopiles.

Author Contributions

Conceptualization, B.M., E.M.H. and A.R.; software, N.P.-M., E.B. and M.S.; validation, M.S. and N.P.-M.; formal analysis, N.P.-M.; investigation, N.P.-M.; methodology, N.P.-M., E.B. and M.S.; resources, B.M., E.M.H., E.B. and A.R.; data curation, N.P.-M. and M.S.; writing—original draft preparation, N.P.-M.; writing—review and editing, N.P.-M., E.B., M.S., B.M. and E.M.H.; validation, N.P.-M. and M.S.; visualization, N.P.-M. and M.S.; supervision, B.M., E.M.H. and A.R.; project administration, B.M., E.M.H. and A.R.; funding acquisition, B.M., E.M.H. and A.R.; All authors have read and agreed to the published version of the manuscript.

Funding

This research was funded by National Offshore Wind Research & Development Consortium (NOWRDC) grant number 154719. This work was authored in part by the National Renewable Energy Laboratory, operated by Alliance for Sustainable Energy, LLC, for the U.S. Department of Energy (DOE) under Contract No. DE-AC36-08GO28308. Mingming Song acknowledges the support by the National Natural Science Foundation of China (52208199) and the Fundamental Research Funds for the Central Universities.

Institutional Review Board Statement

Not applicable.

Informed Consent Statement

Not applicable.

Data Availability Statement

Data are unavailable due to privacy.

Acknowledgments

The support of the National Offshore Wind Research & Development Consortium (NOWRDC) and National Renewable Energy Laboratory is gratefully acknowledged.

Conflicts of Interest

The views expressed in the article do not necessarily represent the views of the DOE or the USA Government. The publisher, by accepting the article for publication, acknowledges that the USA Government retains a nonexclusive, paid-up, irrevocable, worldwide license to publish or reproduce the published form of this work or allow others to do so, for USA Government purposes.

References

  1. House, T.W. Fact Sheet: Biden Administration Jumpstarts Offshore Wind Energy Projects to Create Jobs; The White House: Washington, DC, USA, 2021. [Google Scholar]
  2. GE-Renewable-Energy. Haliade-X 14-MW Offshore Wind Turbine. Available online: https://www.ge.com/renewableenergy/wind-energy/offshore-wind/haliade-x-offshore-turbine (accessed on 1 February 2020).
  3. Carswell, W.; Johansson, J.; Løvholt, F.; Arwade, S.R.; Madshus, C.; DeGroot, D.J.; Myers, A.T. Foundation damping and the dynamics of offshore wind turbine monopiles. Renew. Energy 2015, 80, 724–736. [Google Scholar] [CrossRef]
  4. Steidel, R.F. An Introduction to Mechanical Vibrations, 1st ed.; John Wiley & Sons: Hoboken, NJ, USA, 1971; p. 464. [Google Scholar]
  5. Koukoura, C.; Natarajan, A.; Vesth, A. Identification of support structure damping of a full scale offshore wind turbine in normal operation. Renew. Energy 2015, 81, 882–895. [Google Scholar] [CrossRef]
  6. Li, N.; Shi, W.; Han, X.; Li, X.; Verma, A.S.; Liu, C. Dynamic analysis of an integrated offshore structure comprising a jacket-supported offshore wind turbine and aquaculture steel cage. Ocean Eng. 2023, 274, 114059. [Google Scholar] [CrossRef]
  7. Shittu, A.A.; Mehmanparast, A.; Amirafshari, P.; Hart, P.; Kolios, A. Sensitivity analysis of design parameters for reliability assessment of offshore wind turbine jacket support structures. Int. J. Nav. Archit. Ocean Eng. 2022, 14, 100441. [Google Scholar] [CrossRef]
  8. Yun, H.B.; Eslami, E.; Zhou, L. Noncontact stress measurement from bare UHPC surface using R aman piezospectroscopy. J. Raman Spectrosc. 2018, 49, 1540–1551. [Google Scholar] [CrossRef]
  9. Eslami, E.; Zhou, L.; Yun, H.-B. Noncontact Absolute Stress Measurement for UHPC Using Raman Piezospectroscopy. In Proceedings of the Transportation Research Board 98th Annual Meeting, Washington, DC, USA, 13–17 January 2019; p. 12. [Google Scholar]
  10. Khedmatgozar Dolati, S.S.; Caluk, N.; Mehrabi, A.; Khedmatgozar Dolati, S.S. Non-Destructive Testing Applications for Steel Bridges. Appl. Sci. 2021, 11, 9757. [Google Scholar] [CrossRef]
  11. Poozesh, P.; Baqersad, J.; Niezrecki, C.; Avitabile, P.; Harvey, E.; Yarala, R. Large-area photogrammetry based testing of wind turbine blades. Mech. Syst. Signal Process. 2017, 86, 98–115. [Google Scholar] [CrossRef]
  12. Khadka, A.; Fick, B.; Afshar, A.; Tavakoli, M.; Baqersad, J. Non-contact vibration monitoring of rotating wind turbines using a semi-autonomous UAV. Mech. Syst. Signal Process. 2020, 138, 106446. [Google Scholar] [CrossRef]
  13. Vahedi, M.; Khoshnoudian, F.; Hsu, T.Y.; Partovi Mehr, N. Transfer function-based Bayesian damage detection under seismic excitation. Struct. Des. Tall Spec. Build. 2019, 28, e1619. [Google Scholar] [CrossRef]
  14. Veritas, N. Guidelines for Design of Wind Turbines; Det Norske Veritas: Wind Energy Department, Risø National Laboratory: London, UK, 2002. [Google Scholar]
  15. Bhattacharya, S. Design of Foundations for Offshore Wind Turbines; John Wiley & Sons: Hoboken, NJ, USA, 2019; p. 371. [Google Scholar]
  16. Ziegler, L.; Muskulus, M. Fatigue Reassessment for Lifetime Extension of Offshore Wind Monopile Substructures. In Journal of Physics: Conference Series; IOP Publishing: Bristol, UK, 2016; p. 092010. [Google Scholar]
  17. Bouty, C.; Schafhirt, S.; Ziegler, L.; Muskulus, M. Lifetime extension for large offshore wind farms: Is it enough to reassess fatigue for selected design positions? Energy Procedia 2017, 137, 523–530. [Google Scholar] [CrossRef]
  18. Bouzid, D.A.; Bhattacharya, S.; Otsmane, L. Assessment of natural frequency of installed offshore wind turbines using nonlinear finite element model considering soil-monopile interaction. J. Rock Mech. Geotech. Eng. 2018, 10, 333–346. [Google Scholar] [CrossRef]
  19. Liu, X.; Lu, C.; Li, G.; Godbole, A.; Chen, Y. Effects of aerodynamic damping on the tower load of offshore horizontal axis wind turbines. Appl. Energy 2017, 204, 1101–1114. [Google Scholar] [CrossRef]
  20. Yeter, B.; Garbatov, Y.; Guedes Soares, C. Fatigue damage assessment of fixed offshore wind turbine tripod support structures. Eng. Struct. 2015, 101, 518–528. [Google Scholar] [CrossRef]
  21. Liu, K.; Yan, R.-J.; Guedes Soares, C. Damage identification in offshore jacket structures based on modal flexibility. Ocean Eng. 2018, 170, 171–185. [Google Scholar] [CrossRef]
  22. Renqiang, X.; Xiuli, D.; Piguang, W.; Chengshun, X.; Endi, Z.; Suyu, W. Dynamic analysis of 10 MW monopile supported offshore wind turbine based on fully coupled model. Ocean Eng. 2021, 234, 109346. [Google Scholar] [CrossRef]
  23. Joey, V.; Claus, K.; John Dalsgaard, S.; Gianluca, Z. Fatigue reliability of large monopiles for offshore wind turbines. Int. J. Fatigue 2020, 134, 105487. [Google Scholar] [CrossRef]
  24. Ding, L.; Shun-Peng, Z.; José, A.F.O.C.; Abílio, M.P.; Milan, V.; Filippo, B. Fatigue reliability of wind turbines: Historical perspectives, recent developments and future prospects. Renew. Energy 2022, 200, 724–742. [Google Scholar] [CrossRef]
  25. Augustyn, D.; Ulriksen, M.D.; Sørensen, J.D. Reliability Updating of Offshore Wind Substructures by Use of Digital Twin Information. Energies 2021, 14, 5859. [Google Scholar] [CrossRef]
  26. Dong, X.; Lian, J.; Wang, H.; Yu, T.; Zhao, Y. Structural vibration monitoring and operational modal analysis of offshore wind turbine structure. Ocean Eng. 2018, 150, 280–297. [Google Scholar] [CrossRef]
  27. Norén-Cosgriff, K.; Kaynia, A.M. Estimation of natural frequencies and damping using dynamic field data from an offshore wind turbine. Mar. Struct. 2021, 76, 102915. [Google Scholar] [CrossRef]
  28. Hu, W.-H.; Thöns, S.; Rohrmann, R.G.; Said, S.; Rücker, W. Vibration-based structural health monitoring of a wind turbine system Part II: Environmental/operational effects on dynamic properties. Eng. Struct. 2015, 89, 273–290. [Google Scholar] [CrossRef]
  29. Petersen, B.; Pollack, M.; Connell, B.; Greeley, D.; Davis, D.; Slavik, C.; Goldman, B.; Medley, L. Evaluate the Effect of Turbine Period of Vibration Requirements on Structural Design Parameters: Technical Report of Findings; Applied Physical Sciences Corp.: Groton, CT, USA, 2010; p. 130. [Google Scholar]
  30. Jonkman, B.; Mudafort, R.M.; Platt, A.; Branlard, E.; Sprague, M.; Jonkman, J.; Hayman, G.; Vijayakumar, G.; Buhl, M.; Ross, H.; et al. OpenFAST/openfast: OpenFAST v3.2.0, v3.2.0; Zenodo: 2022. Available online: https://zenodo.org/record/6827846 (accessed on 16 May 2023).
  31. Jonkman, J. FAST modularization framework for wind turbine simulation: Full-system linearization. J. Phys. Conf. Ser. 2016, 753, 082010. [Google Scholar] [CrossRef]
  32. Meng, H.; Jin, D.; Li, L.; Liu, Y. Analytical and numerical study on centrifugal stiffening effect for large rotating wind turbine blade based on NREL 5MW and WindPACT 1.5 MW models. Renew. Energy 2021, 183, 321–329. [Google Scholar] [CrossRef]
  33. Prowell, I.; Elgamal, A.-W.M.; Jonkman, J.M. FAST Simulation of Wind Turbine Seismic Response. In Proceedings of the Asian-Pacific Network of Centers for Earthquake Engineering Research (ANCER) Workshop, Urbana-Champaign, IL, USA, 13–14 August 2009; p. 15. [Google Scholar]
  34. Chen, C.; Duffour, P.; Fromme, P. Modelling wind turbine tower-rotor interaction through an aerodynamic damping matrix. J. Sound Vib. 2020, 489, 115667. [Google Scholar] [CrossRef]
  35. OpenFAST. OpenFAST Documentation. Available online: http://openfast.readthedocs.io/ (accessed on 16 May 2023).
  36. Mazzoni, S.; McKenna, F.; Scott, M.H.; Fenves, G.L. OpenSees command language manual. Pac. Earthq. Eng. Res. (PEER) Cent. 2006, 264, 137–158. [Google Scholar]
  37. Okumus, P.; Basereh, S. Simplified Analytical Models for Evaluating Retrofitted Reinforced Concrete Shear Walls. In Proceedings of the 17th World Conference on Earthquake Engineering, 17WCEE, Sendai, Japan, 13–18 September 2020. [Google Scholar]
  38. Taslimi, A.; Tehranizadeh, M. The effect of vertical near-field ground motions on the collapse risk of high-rise reinforced concrete frame-core wall structures. Adv. Struct. Eng. 2022, 25, 410–425. [Google Scholar] [CrossRef]
  39. Khedmatgozar Dolati, S.S.; Mehrabi, A.; Dolati, S.S.K. Application of VD-LRBP System for Bridges in Seismic Zones. In Proceedings of the Active and Passive Smart Structures and Integrated Systems XVI, Long Beach, CA, USA, 6 March–11 April 2022; pp. 44–52. [Google Scholar]
  40. Soraghi, A.; Huang, Q. Simple rebar anchorage slip macromodel considering corrosion. Eng. Struct. 2022, 262, 114357. [Google Scholar] [CrossRef]
  41. Moeini, M.; Ghyabi, M.; Dolatshahi, K.M. Seismic Soil-Pile Interaction Considering Nonlinear Soil Column Behavior in Saturated and Dry Soil Conditions. Int. J. Geotech. Geol. Eng. 2017, 11, 188–194. [Google Scholar] [CrossRef]
  42. Jonkman, J.; Butterfield, S.; Musial, W.; Scott, G. Definition of a 5-MW Reference Wind Turbine for Offshore System Development; National Renewable Energy Lab.(NREL): Golden, CO, USA, 2009; p. 75. [Google Scholar]
  43. Hines, E.M.; Baxter, C.D.; Ciochetto, D.; Song, M.; Sparrevik, P.; Meland, H.J.; Strout, J.M.; Bradshaw, A.; Hu, S.-L.; Basurto, J.R. Structural instrumentation and monitoring of the Block Island Offshore Wind Farm. Renew. Energy 2023, 202, 1032–1045. [Google Scholar] [CrossRef]
  44. Van Overschee, P.; De Moor, B. Subspace Identification for Linear Systems: Theory—Implementation—Applications; Springer Science & Business Media: New York, NY, USA, 2012. [Google Scholar]
  45. Moser, P. Continuous monitoring of the Dowling Hall Footbridge. Ph.D. Thesis, Tufts University, Medford, MA, USA, 2010. [Google Scholar]
  46. Peeters, B. System Identification and damage Detection in Civil Engeneering. Ph.D. Thesis, Katholike Universite Leuven, Belgium, 2000. [Google Scholar]
  47. Song, M.; Partovi Mehr, N.; Moaveni, B.; Hines, E.M.; Ebrahimian, H.; Bajric, A. One Year Monitoring of an Offshore Wind Turbine: Variability of Modal Parameters to Ambient and Operational Conditions. Eng. Struct. 2023. [Google Scholar]
  48. Song, M.; Moaveni, B.; Ebrahimian, H.; Hines, E.; Bajric, A. Joint parameter-input estimation for digital twinning of the Block Island wind turbine using output-only measurements. Mech. Syst. Signal Process. 2023, 198, 110425. [Google Scholar] [CrossRef]
  49. Jonkman, J. The new modularization framework for the FAST wind turbine CAE tool (NREL/CP-5000-57228). In Proceedings of the 51st AIAA Aerospace Sciences Meeting, including the New Horizons Forum and Aerospace Exposition, Dallas, TX, USA, 7–10 January 2013. [Google Scholar]
  50. Branlard, E. Wind Turbine Aerodynamics and Vorticity-Based Methods: Fundamentals and Recent Applications; Springer: Cham, Switzerland, 2017; Volume 7. [Google Scholar]
  51. Hansen, M.O.L. Aerodynamics of Wind Turbines, 3rd ed.; Routledge: London, UK; New York, NY, USA, 2015; p. 192. [Google Scholar]
  52. Branlard, E.; Shields, M.; Anderson, B.; Damiani, R.; Wendt, F.; Jonkman, J.; Musial, W.; Foley, B. Superelement reduction of substructures for sequential load calculations in OpenFAST. In Journal of Physics: Conference Series; IOP Publishing: Bristol, UK, 2020; p. 12033. [Google Scholar]
  53. Moriarty, P.J.; Hansen, A.C. AeroDyn Theory Manual (NREL/EL-500-36881); National Renewable Energy Lab. (NREL): Golden, CO, USA, 2005; p. 47. [Google Scholar]
  54. Jonkman, J.M.; Robertson, A.N.; Hayman, G.J. HydroDyn User’s Guide and Theory Manual; National Renewable Energy Laboratory: Golden, CO, USA, 2021. [Google Scholar]
  55. Johnson, N.; Jonkman, J.; Wright, A.; Hayman, G.; Robertson, A. Verification of Floating Offshore Wind Linearization Functionality in OpenFAST. In Journal of Physics: Conference Series; IOP Publishing: Bristol, UK, 2019; p. 012022. [Google Scholar]
  56. Coleman, R.P.; Feingold, A.M. Theory of Self-Excited Mechanical Oscillations of Helicopter Rotors with Hinged Blades; National Advisory Committee for Aeronautics (NACA): Washington, DC, USA, 1957. [Google Scholar]
  57. Branlard, E.; Brownstein, I.; Strom, B.; Jonkman, J.; Dana, S.; Baring-Gould, E.I. A multi-purpose lifting-line flow solver for arbitrary wind energy concepts. Wind Energy Sci. 2021, 7, 455–467. [Google Scholar] [CrossRef]
  58. Yeter, B.; Garbatov, Y.; Guedes Soares, C. Uncertainty analysis of soil-pile interactions of monopile offshore wind turbine support structures. Appl. Ocean Res. 2019, 82, 74–88. [Google Scholar] [CrossRef]
  59. Shirzadeh, R.; Devriendt, C.; Bidakhvidi, M.A.; Guillaume, P. Experimental and computational damping estimation of an offshore wind turbine on a monopile foundation. J. Wind Eng. Ind. Aerodyn. 2013, 120, 96–106. [Google Scholar] [CrossRef]
  60. Valamanesh, V.; Myers, A.T. Aerodynamic damping and seismic response of horizontal axis wind turbine towers. J. Struct. Eng. 2014, 140, 04014090. [Google Scholar] [CrossRef]
  61. Salzmann, D.J.C.; Van der Tempel, J. Aerodynamic damping in the design of support structures for offshore wind turbines. In Proceedings of the Copenhagen Offshore Wind Conference, Copenhagen, Denmark, 26–28 October 2005; pp. 26–28. [Google Scholar]
  62. Ozbek, M.; Rixen, D.J. Operational modal analysis of a 2.5 MW wind turbine using optical measurement techniques and strain gauges. Wind Energy 2013, 16, 367–381. [Google Scholar] [CrossRef]
  63. Van Der Tempel, J. Design of Support Structures for Offshore Wind Turbines. Ph.D. Thesis, TU Delft, Delft, The Netherlands, 2006. [Google Scholar]
  64. Manwell, J.F.; McGowan, J.G.; Rogers, A.L. Wind Energy Explained: Theory, Design and Application, 3rd ed.; John Wiley & Sons: Hoboken, NJ, USA, 2010. [Google Scholar]
  65. Hansen, M.H. Improved modal dynamics of wind turbines to avoid stall-induced vibrations. Wind Energy: Int. J. Prog. Appl. Wind Power Convers. Technol. 2003, 6, 179–195. [Google Scholar] [CrossRef]
  66. Malcolm, D.J. Modal response of 3-bladed wind turbines. ASME J. Sol. Energy Eng. 2002, 124, 372–377. [Google Scholar] [CrossRef]
  67. Bahramiasl, S.; Abbaspour, M.; Karimirad, M. Experimental study on gyroscopic effect of rotating rotor and wind heading angle on floating wind turbine responses. Int. J. Environ. Sci. Technol. 2018, 15, 2531–2544. [Google Scholar] [CrossRef]
  68. Høeg, C.E.; Zhang, Z. The influence of gyroscopic effects on dynamic responses of floating offshore wind turbines in idling and operational conditions. Ocean Eng. 2021, 227, 108712. [Google Scholar] [CrossRef]
  69. Staino, A.; Basu, B. Dynamics and control of vibrations in wind turbines with variable rotor speed. Eng. Struct. 2013, 56, 58–67. [Google Scholar] [CrossRef]
  70. Peeters, B.; De Roeck, G. Reference-based stochastic subspace identification for output-only modal analysis. Mech. Syst. Signal Process. 1999, 13, 855–878. [Google Scholar] [CrossRef]
Figure 1. Normalized power spectral density for typical wind and wave loads, and the range of rotor-induced excitation ranges (1P and 3P ranges) to avoid resonance of the Block Island OWT.
Jmse 11 01524 g001
Figure 2. Wind turbines B1–B3 (from left to right) standing in the Block Island Wind Farm, RI, USA (Photo: Michael Dwyer).
Jmse 11 01524 g002
Figure 3. Instrumentation layout of sensors along with the BIWF-B2 turbine, reprinted from [43], with permission from Elsevier, 2023.
Jmse 11 01524 g003
Figure 4. Identified first FA/SS natural frequencies and damping ratios of the B2 turbine using experimental data of one week of operation (21 April 2021 to 27 April 2021) and one day of idling (14 June 2021). Red stars and blue triangles are related to the idling and operating turbine, respectively.
Jmse 11 01524 g004
Figure 5. Model of B2 OWT.
Jmse 11 01524 g005
Figure 6. Natural frequencies and mode shapes from the SAP2000 and OpenSees models.
Jmse 11 01524 g006
Figure 8. Power curve for the B2 OWT showing Regions 1, 2, and 3 of the power generation.
Jmse 11 01524 g008
Figure 9. Campbell diagram of the B2 OWT turbine for the first FA and SS bending modes according to the OpenFAST model, in the cases of flexible blades (1st Tower FA and 1st Tower SS) and rigid blades (1st Tower FA-Rigid and 1st Tower SS-Rigid), and the analytical damping ratio for the first FA mode.
Jmse 11 01524 g009
Figure 10. Campbell diagrams for the first FA and SS tower bending modes of the OWT in the parked condition (rotor rpm = 0).
Jmse 11 01524 g010
Figure 11. Campbell diagrams for the first FA and SS tower bending modes of the B2 OWT operating in Region 3*.
Jmse 11 01524 g011
Figure 12. Campbell diagrams for the first FA and SS tower bending modes of the B2 OWT operating at a constant wind speed of 7 m/s and varying rotor speed.
Jmse 11 01524 g012
Figure 13. Yaw angle effect on the first FA and SS tower bending modes of the B2 OWT, operating at the rated wind speed of 11 m/s and rotor speed of 11.5 rpm.
Jmse 11 01524 g013
Figure 14. Effect of vertical soil spring on the first FA and SS tower bending modes of the B2 OWT in a parked condition.
Jmse 11 01524 g014
Table 1. Natural frequency and MAC Comparison between OpenFAST, OpenSees, and the identified modes.
ModeOpenFAST Freq. [Hz] FlexibleOpenFAST Freq. [Hz] RigidOpenSees Freq. [Hz]Mean (std) Identified Freq. [Hz]Mean (std) MAC of OpenFAST vs. Identified Mean (std) MAC of Opensees vs. Identified
First SS0.2750.2770.2880.292 (0.001) 10.97 (0.04) 10.97 (0.04) 1
First FA0.2720.2790.2910.313 (0.007)0.92 (0.06)0.92 (0.06)
Second SS1.661.601.541.98 (0.016)0.95 (0.03)0.97 (0.03)
Second FA2.411.871.772.24 (0.076)0.94 (0.07)0.93 (0.07)
1 Mean (standard deviation) is computed over 144 data sets collected on 22 April 2021.
Table 2. Selected wind speeds, rotor speeds, and pitch angle of blades for OpenFAST simulations of the B2 OWT.
Region Wind Speed (m/s)Rotor Speed (rpm)Blade Pitch (°)
Region 10.00.00
Region 23.03.90
7.08.90
11.011.50
Region 3 *1511.59
1911.514
2311.519
27 *11.5 *24 *
31 *11.5 *29 *
* Non-normal operating conditions in Region 3 in which the rotor spins at the rated rpm for wind speeds greater than the cut-out wind speed.
Table 3. Mean of the tip speed ratio and rotor aerodynamic thrust coefficient over time, obtained from the OpenFAST simulations of the turbine operating at the rated rotor speed, varying wind speed, and zero pitch angle of blades in Region 3*.
Wind Speed (m/s)Rotor Aero CT (-)TSR (-)
110.61 8.19
150.45 5.98
190.33 4.70
230.20 3.92
270.18 3.33
310.16 2.82
Table 4. R2 statistics for the multiple linear regression models.
ModelFA FrequencyFA Damping
10.380.59
20.460.63
30.480.64
Table 5. Coefficients of Model 1, multiple linear regression model with only main effects.
Regression CoefficientRelated Variable NameFA FrequencyFA Damping
Intercept ( β ^ 0 )Constant0.301.80
β ^ 1 Wind speed−0.01−1.48
β ^ 2 Rotor speed0.063.90
β ^ 3 Power−0.033.21
β ^ 4 Yaw−0.01−0.81
β ^ 5 Misalignment−0.01−0.95
β ^ 6 Pitch−0.01−1.57
Disclaimer/Publisher’s Note: The statements, opinions and data contained in all publications are solely those of the individual author(s) and contributor(s) and not of MDPI and/or the editor(s). MDPI and/or the editor(s) disclaim responsibility for any injury to people or property resulting from any ideas, methods, instructions or products referred to in the content.

