Article

A Coupled Tensor–DEM–FEM Model for the Whole Process of Internal Fine-Scale Damage to Surface Damage in Red-Bed Soft Rocks in the Coastal Area of South China

1
School of Civil Engineering, Sun Yat-sen University, No. 135 Xingang West Road, Guangzhou 510275, China
2
Guangdong Engineering Research Centre for Major Infrastructures Safety, Sun Yat-sen University, Guangzhou 510275, China
3
Institute of Estuarine and Coastal Research/Guangdong Provincial Engineering Research Center of Coasts, Islands and Reefs, School of Ocean Engineering and Technology, Sun Yat-sen University, Guangzhou 510275, China
*
Authors to whom correspondence should be addressed.
These authors contributed equally to this work.
J. Mar. Sci. Eng. 2023, 11(8), 1542; https://doi.org/10.3390/jmse11081542
Submission received: 12 July 2023 / Revised: 28 July 2023 / Accepted: 31 July 2023 / Published: 2 August 2023
(This article belongs to the Section Geological Oceanography)

Abstract

:
Calculation and characterization of the whole process of internal microscopic damage to surface damage in red-bed soft rock is a theoretical research difficulty and an urgent need for engineering safety protection. However, the current study cannot accurately and directly correlate internal and external damage. Therefore, in this paper, a coupled tensor–DEM–FEM model is proposed to deal with surface damage by indoor triaxial test digital image processing (DIC), internal damage by FJM acoustic emission study, and internal and external damage by moment tensor correlation. The study demonstrates that the whole process damage process of the red-bed soft rock peak front can be divided into six distinct phases, with early damage beginning with the elastic phase; the local strain divergence value begins to spiral out of control during the period of crack acceleration development; the overall acoustic emission intensity distribution is in the range of [−8.5, −6.3] in two dimensions and in the range of [−11, −9] in three dimensions; the R were between −40 and 40, which corresponded to the results of the indoor tests. A model has been developed that allows a direct reflection of the whole damage process. The method can be used to better understand the disaster mechanism and guide engineering practice.

1. Introduction

Red-bed soft rocks in South China’s coastal areas are widespread engineering and building materials as well as geotechnical engineering carriers. Their mechanical properties are complicated, and disasters frequently exhibit the features of substantial deformation of the entire damage process [1,2]. Traditional methods for studying the whole period characteristics of red-bed soft rock disasters cannot directly reflect the whole process of internal fine damage and crack clustering in red-bed soft rock, making the process time-consuming and prone to error expansion through multiple transformations. However, the aforementioned characteristics of the whole process of damage are crucial to engineering safety. At the same time, the internal degradation of red-bed soft rocks is a cumulative process, and the cascading effect of fine damage occurs continually, eventually leading to disasters [3,4]. So, it is necessary to conduct a multifaceted and multiscale correlation study of the damage process in red-bed soft rocks to propose effective damage mechanisms for engineering practice.
Until now, plenty of work has been conducted to explain the whole process of red bed chondrite damage. Surface damage, internal damage, and their correlations are the three basic characteristics of red-bed soft rock damage [5,6,7]. CT technology can be used to analyze the microscopic damage state at various phases of the rock mass damage process [8]; however, it is extremely difficult to detect the instantaneous dynamics of damage during the entire rock mass damage process using CT technology [9,10]. While the acoustic emission technique can be used to evaluate instantaneous changes in interior damage and analyze the rock body’s development mechanism during the damage process [11,12], the dynamic expansion law of surface cracks can be measured using the DIC approach [13,14]. As a result, the combination of acoustic emission and DIC technology can simultaneously measure and investigate the internal and surface damage of red-bed soft rock. It has become one of the most essential tools at the moment. This is what makes the correlation characterization of internal and external damage and its calculation based on acoustic emission and DIC techniques in red-bed soft rock a key to research. Especially the characterization and calculation of the whole process of internal microscopic damage to surface damage are hot spots [15,16]. At present, the characterization and calculation of the whole process of internal microscopic damage to surface damage in red-bed soft rock are mainly based on other rock methods. There are mainly analytical methods, data statistics methods, and numerical simulation methods. The damage calculation formula is used to calculate the damage evolution process. In this regard, researchers completed relevant work. The damage evolution equation is investigated using the foothold of internal rock damage factors, and an ontological model of damage is proposed. The whole process of damage factors from the interior to the outside of fragile rocks was directly calculated [17]. The calculation techniques for damage variables and damage thresholds are proposed based on the rock damage theory of energy mechanisms. It provides an efficient method for energy conversion and damage characterization, and it quantitatively expresses the real damage status of rocks [18]. However, the method has the problems of an imprecise damage estimate and the significant error of the traditional constitutive equation. To solve this issue, the data statistics technique was used, which involves describing the rock damage evolution law using statistical distribution theory. Internal flaws (e.g., cracks, joints, and pores) in rocks have a random distribution, and researchers have studied the whole process of internal fine-scale damage to surface damage in rocks using statistical approaches mixed with damage ontology models [19,20]. Using a statistical approach for the acoustic emission parameters, the fractal dimension of the spatial distribution of the acoustic emission is computed, and an accurate evaluation of the internal and exterior damage to the rock body may be derived [21]. Statistical damage parameters may be used to create the linked tensor model of internal and exterior damage to jointed rock [22]. However, the data statistics approach can only extract patterns and correlations from the data type, implying that there is limited validation of the data’s quality and authenticity [23]. This is supplemented by numerical simulation approaches that can track rock damage information precisely. Finite element and discrete element approaches dominate numerical simulation methods [24,25,26]. Due to the requirements of continuity and minimal deformation of the rock body, the finite element approach is difficult to adequately characterize the damage condition of the rock body [27]. DEM uses the mineral particle as a unit, which is frequently limited by the particle’s computing efficiency [28]. In modeling the interaction process between a continuous material and a discrete medium like the red-bed soft rock damage, the DEM–FEM interface coupling model based on the parameter transfer between the two media can be chosen [29]. However, existing numerical simulation methods employ Bond damage in the parallel contact model (PBM) as an internal damage event to depict the rock’s damage process through the spatial and temporal evolution of PBM damage [30,31]. In fact, the above process has two major drawbacks: one is that the PBM damage is only a model failure in the discrete element concept, which differs from the real acoustic emission process reflecting the damage. Second, PBM, as a bonding model at the contact point of spherical particles, has a lower self-locking effect in simulating the damage process of the rock than the genuine mineral crystal model; hence, its tensile strength ratio is illogical. Third, because PBM is dependent on a transformed power wave into a moment tensor, the computation process will be extremely complex [32,33].
In conclusion, the characterization and quantification of the whole process of internal fine-scale damage to surface damage is a highly popular topic. As a result, the purpose of this research is to present a simple and straightforward way of correlating internal and exterior damage. To do this, the following challenges must be overcome: (1) There are differences between the PBM damage analysis and the actual situation; (2) the calculation process will be very complicated based on the conversion of the recorded power wave at the moment tensor; and (3) the FEM and DEM cannot individually represent the interaction process between the continuous material and the discrete medium.
To address the aforementioned deficiencies, this paper conducts a triaxial compression visualization test of red-bed soft rocks using a geotechnical multifield coupled damage whole process high spatial and temporal resolution 3D visualization test system. We applied strain tensor variance statistics, with a large sample size of the strain field obtained by digital image technology (DIC), to the local deformation variance characteristics of different stages of the macroscopic disaster process. In the DEM modeling procedure, the novel FJM’s acoustic emission moment tensor was employed to connect the internal microscopic damage and exterior deformation of the red-bed soft rock with the contact force grouping tensor. A 2D and 3D state calibration method for this model is proposed for red-bed soft rocks. The whole process of the external red-bed soft rock damage is recreated using the coupled DEM–FEM approach, and the viability of this method is proved by comparing the results with the processing results of digital image technology.

2. Research Contents and Methods

The coupled tensor–DEM–FEM model is a research method used to analyze the whole process of damage, from internal microscopic damage to surface damage in a rock body. The FEM represents the surface deformation cloud, the DEM represents microscopic damage, and the tensor model represents the overall damage features from the interior to the surface. To address the problem of characterizing the whole process of a disaster caused by fine view damage inside a red-bed soft rock disaster, this paper begins with the triaxial compression visualization test based on the geotechnical multifield coupled damage whole process high spatial and temporal resolution 3D visualization test system. We used the DIC technique to identify the strain field on the surface of the red-bed soft rock and obtain the surface damage of the red-bed soft rock. The seismic behavior of the acoustic emission event was directly analyzed by moment tensor to study the whole process of clumping of fine view cracks based on the acoustic emission mechanism of the discrete element FJM to obtain the force and displacement information around the cracks inside the red-bed soft rock. The feasibility of this method was confirmed by comparing the processing results of the DIC technique; the method’s principle is depicted in Figure 1.

2.1. Visualization Test of Red-Bed Soft Rock Triaxial Compression Disaster

The triaxial compression visualization test under the natural state of red-bed soft rock was carried out using the geotechnical multifield coupled damage whole process high spatial and temporal resolution 3D visualization test system (see Figure 2) developed by Professor Cuiying Zhou’s team at Sun Yat-sen University. To create the pressure chamber, the system uses high-strength transparent material and a specific sealing procedure, allowing for a totally transparent loading environment while ensuring the strength and stiffness required for safety. The system is outfitted with a digital imaging technology (DIC) system, which consists primarily of eight sets of CMOS high-definition cameras calibrated in 360° correlation around the rock sample.
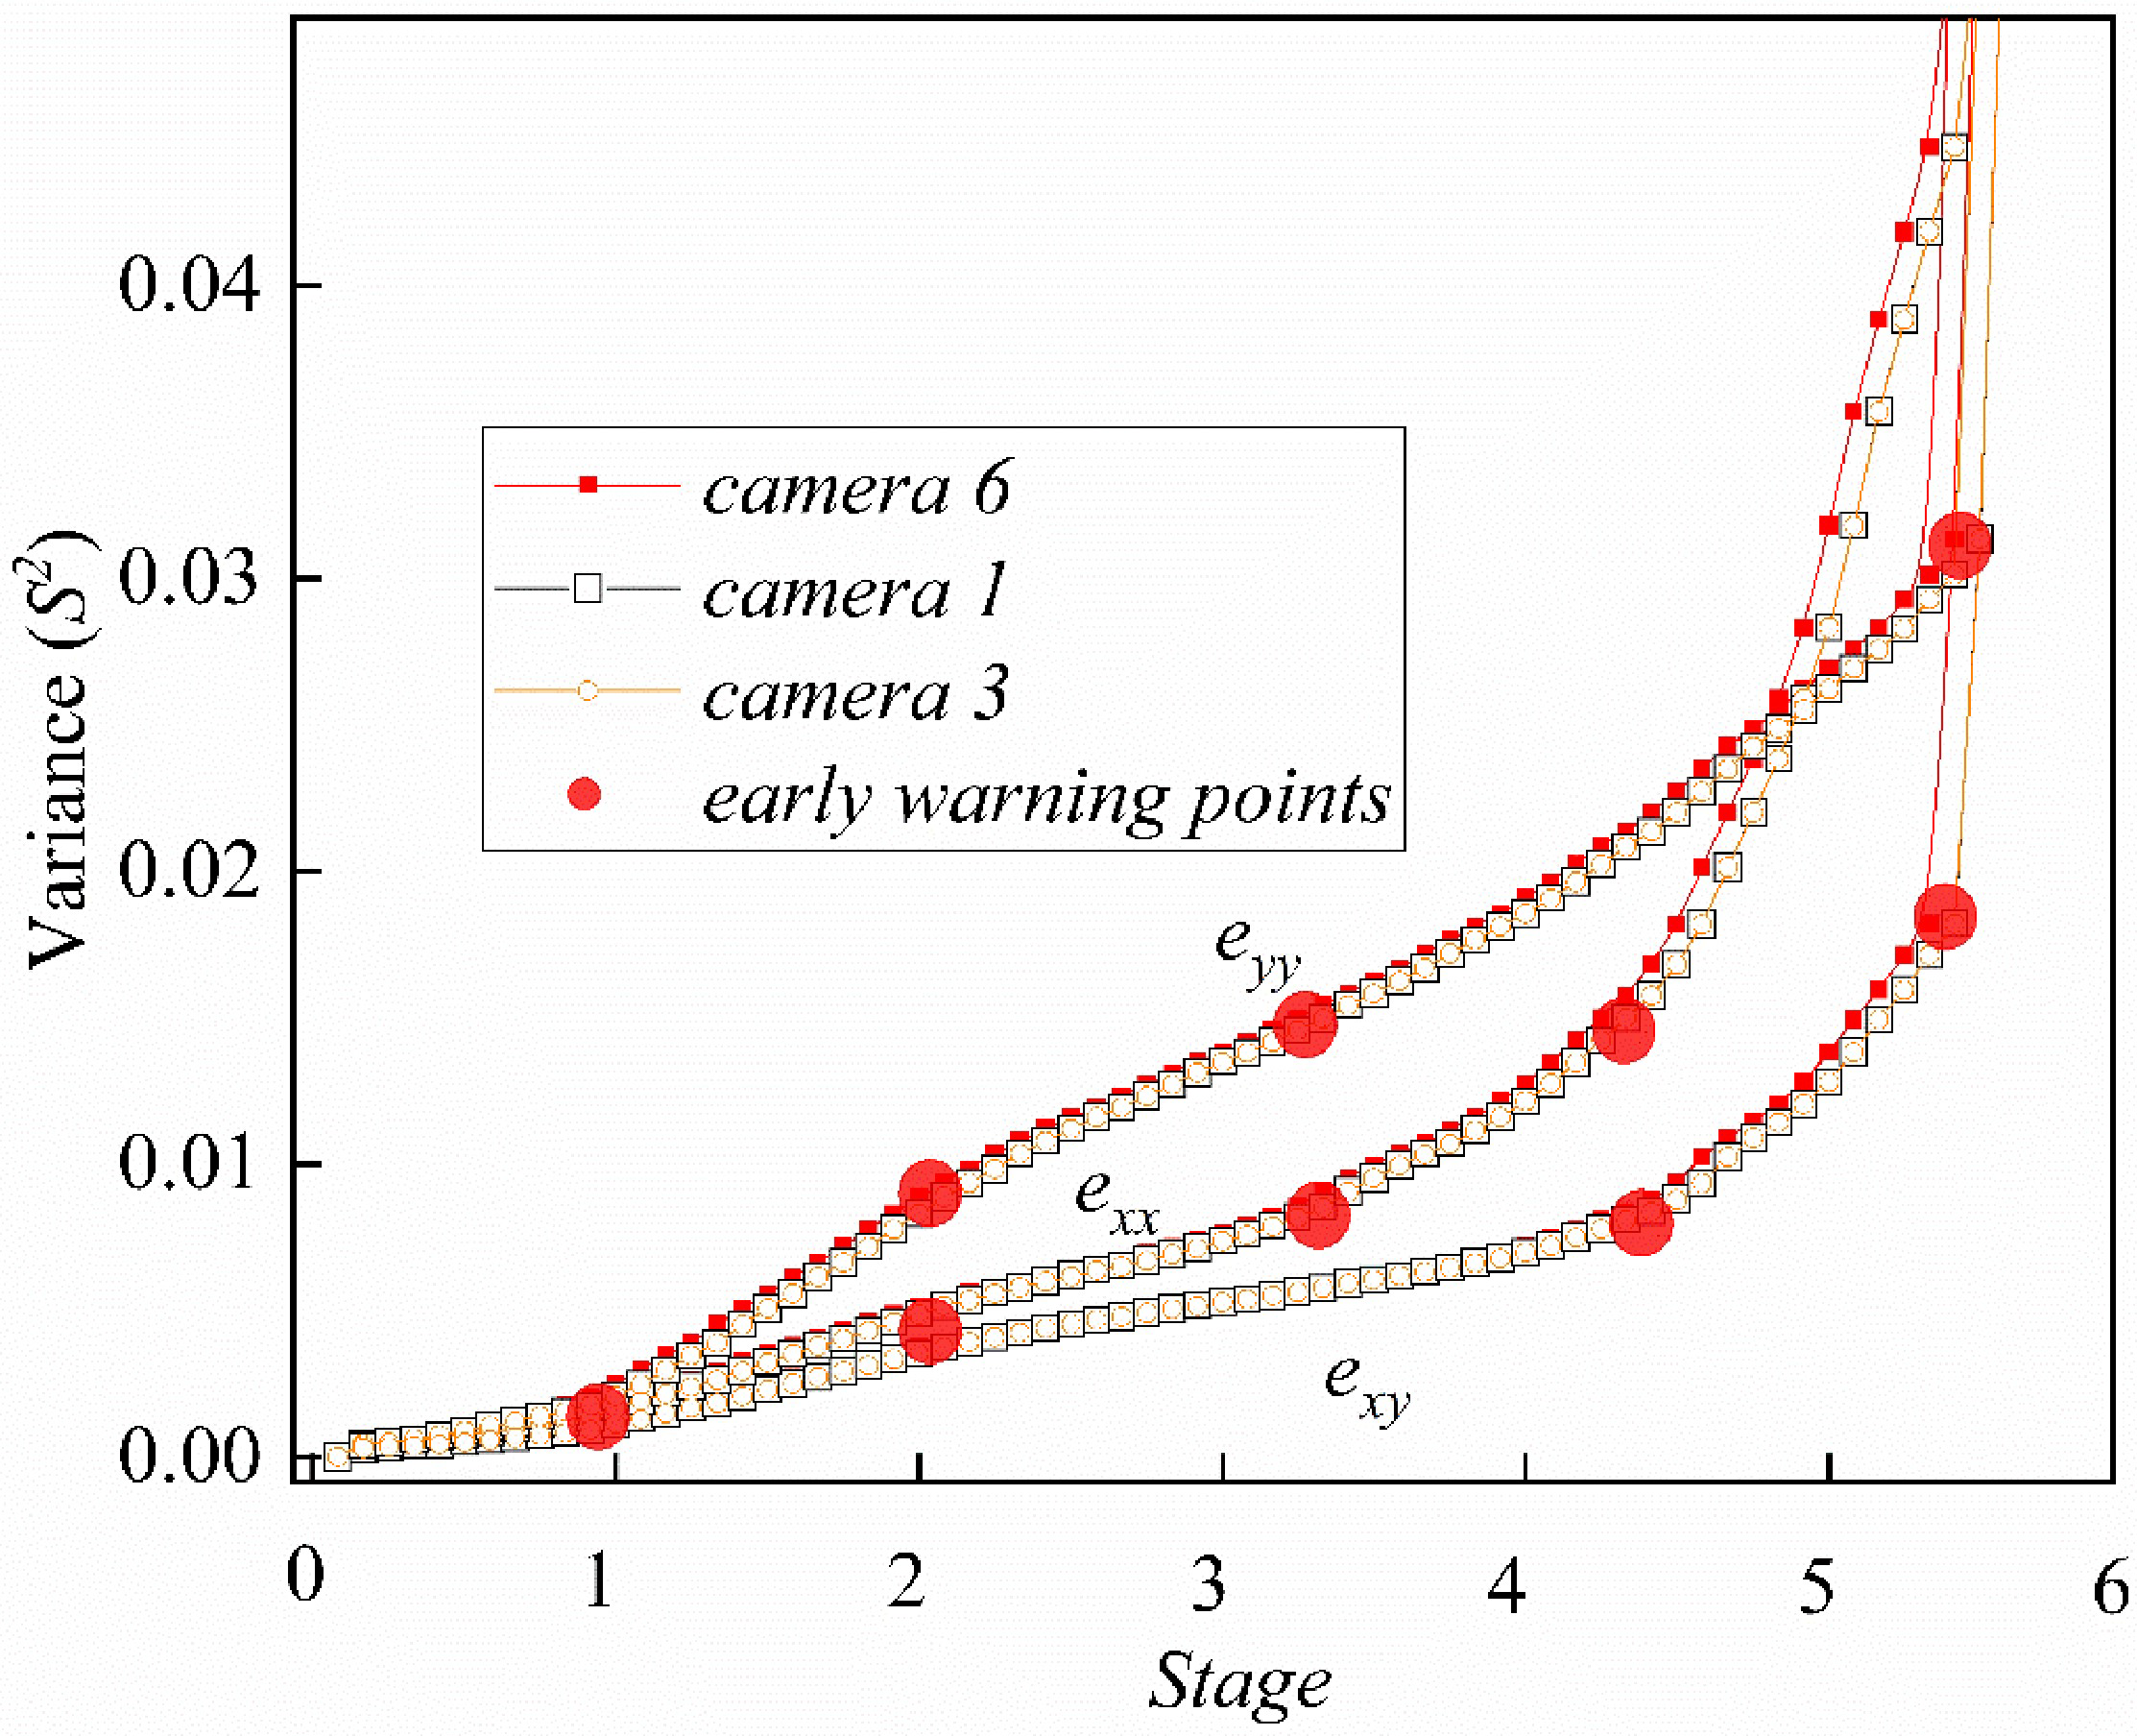
In this article, rock samples were collected from a typical red bed in a riverine area of the Pearl River Delta in South China. The rock sample is low-intensity with a rapid softening process and a chaotic microstructure, and its disaster displays a progressive process. Scattering was performed for the red-bed soft rock test in order to obtain processing applicable to digital images. The specimen was placed in the center of a totally permeable visual loading test system’s press bearing plate, and the test system’s high-resolution image module for internal and exterior damage was calibrated. At the start of the test, lateral pressure and axial stress were applied at a loading rate of about 0.05 MPa/s and added to a predetermined lateral pressure value, followed by a loading rate of 0.02 mm/min until the specimen was damaged. Digital image technology can advance beyond limited human eye recognition to obtain information on red-bed soft rock disasters. Because variance can reflect a dataset’s deviation from its average value, the strain variance of the entire damage process is used in this paper to reflect the deformation characteristics of different stages.
S = 1 n 1 k = 1 n ( X k X ¯ ) 2
where n is the total number of samples, X k is the kth node’s strain value, and X ¯ is the average strain value.
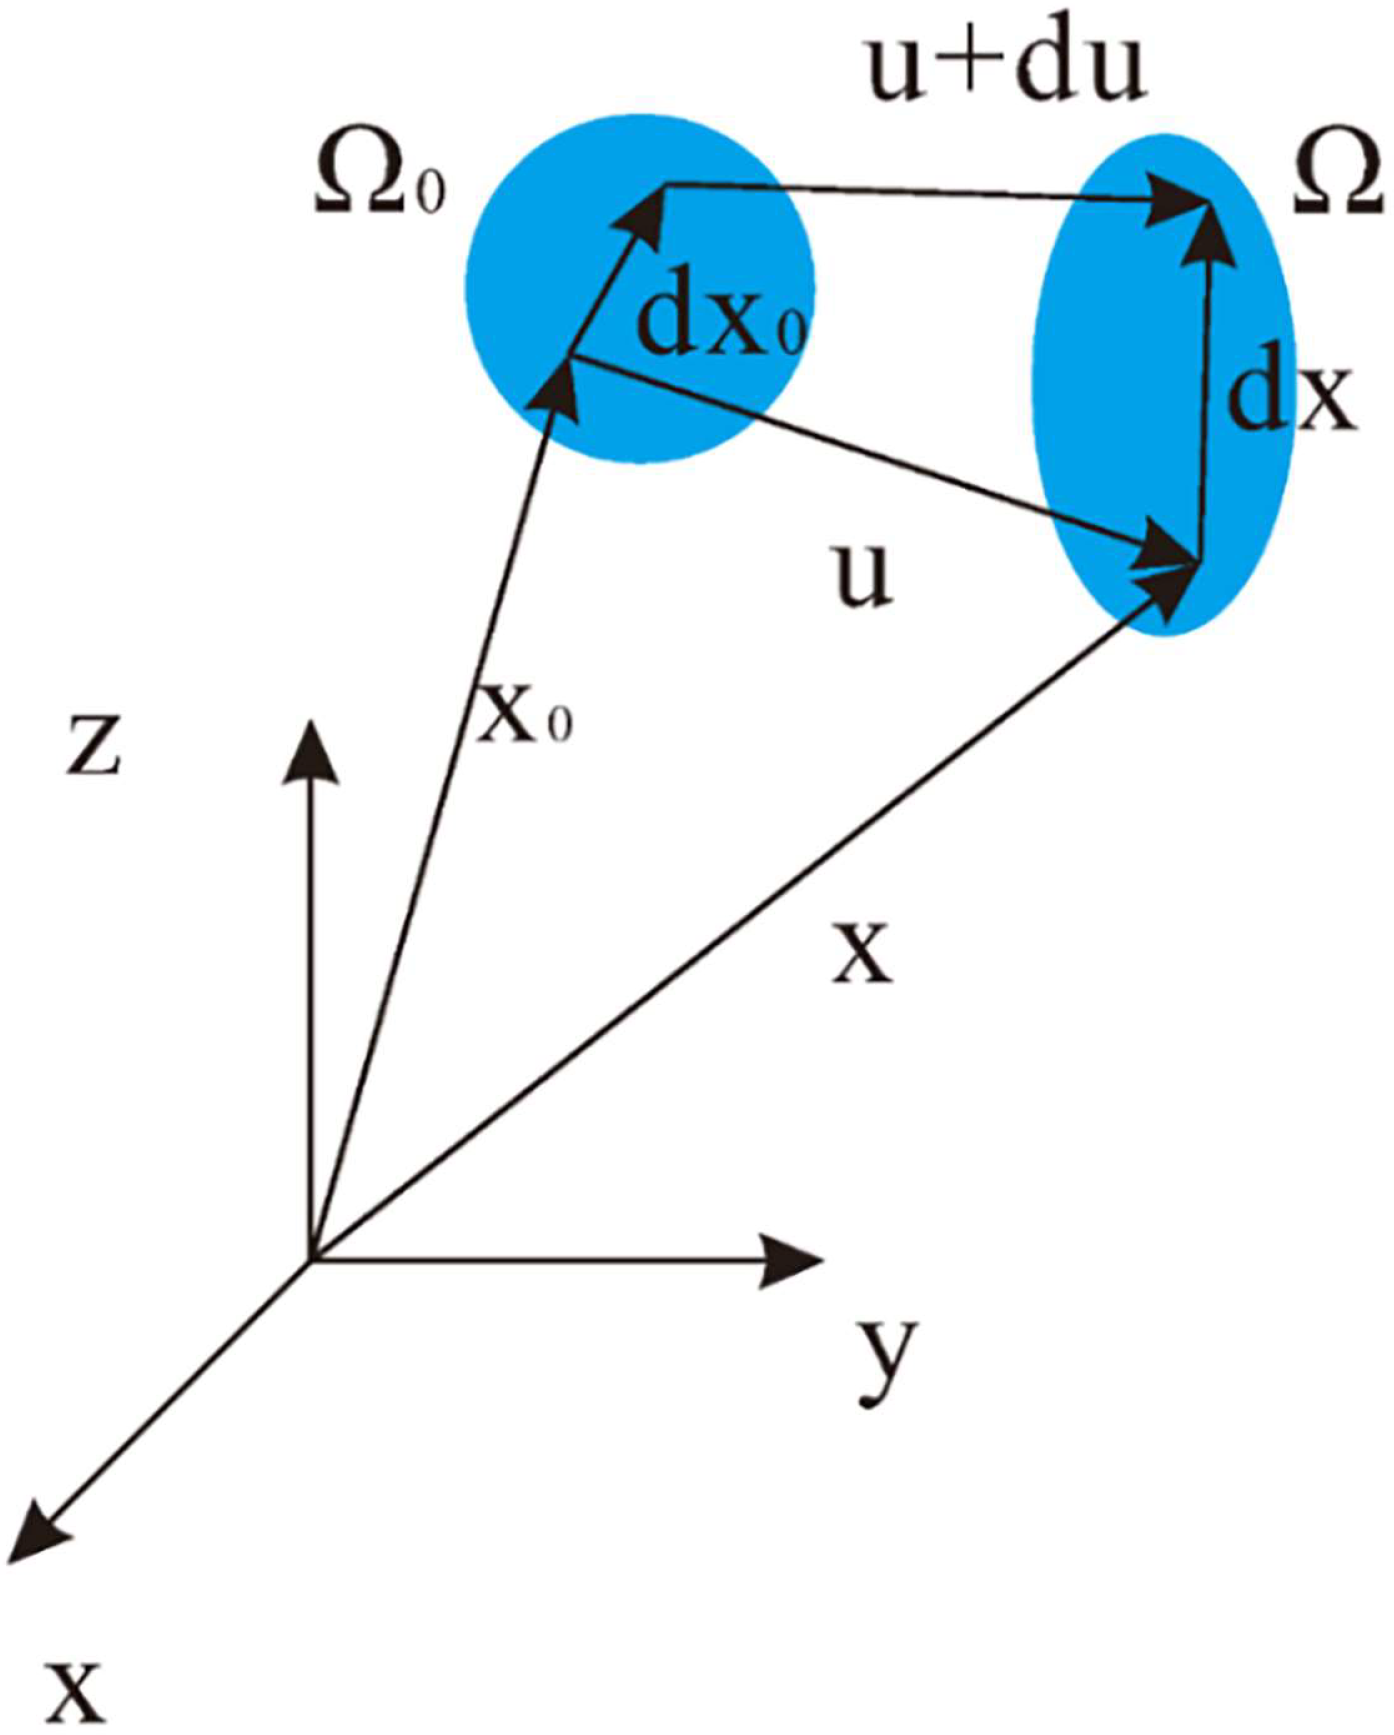
Figure 3 depicts a deformation process diagram of red-bed soft rock used in this article to calculate variance more intuitively. The displacement vector u represents the displacement of the position vector x 0 to x at one location in the red-bed soft rock, u = ( u , v , w ) , and the three components indicate the displacement vectors in three directions, respectively. In the two-dimensional strain calculation method, u = ( u , v ) . In order to examine the deformation, the distance between the two proximity points is assumed to be infinitely tiny, with the real displacement between the two locations being x 0 + dX 0 to x + d X , and the changes in d X 0 and d X being expressed by the deformation gradient F as follows:
d x = x x 0 d x 0 = F d x 0
F = 1 + u x u y u z v x 1 + v y v z w x w y 1 + w z
Two-dimensional situation:
F = 1 + u x u y v x 1 + v y
The selection of strain tensors has many forms; this paper chose the Green–Lagrange strain tensor:
ϵ = ϵ x x ϵ x y ϵ x y ϵ y y = 1 2 ( F T F )

2.2. FJM of Meso-Damage Evolution in Red-Bed Soft Rock

The discrete element is a numerical simulation method based on mineral particles that is an effective method for reducing the damage in the fine view of indoor tests [34,35]. The parallel bond model (PBM) is the most commonly utilized model for the simulation of the damage process in rocks. The PBM as a bond model at the contact point site of spherical particles has a poorer self-locking action than the genuine mineral crystal model, and its tensile to compressive strength ratio is illogical. Therefore, it has been gradually replaced in recent years by two models that better reflect the self-locking effect of mineral grains: the granular model and the flat-joints model [36]. Therefore, in this paper, the FJM was chosen as the basis for modeling discrete elements, 2D and 3D calibration methods are provided, and acoustic emission analysis is carried out to reflect the evolution of fine damage within red-bed soft rocks.

2.2.1. Flat-Joint Model

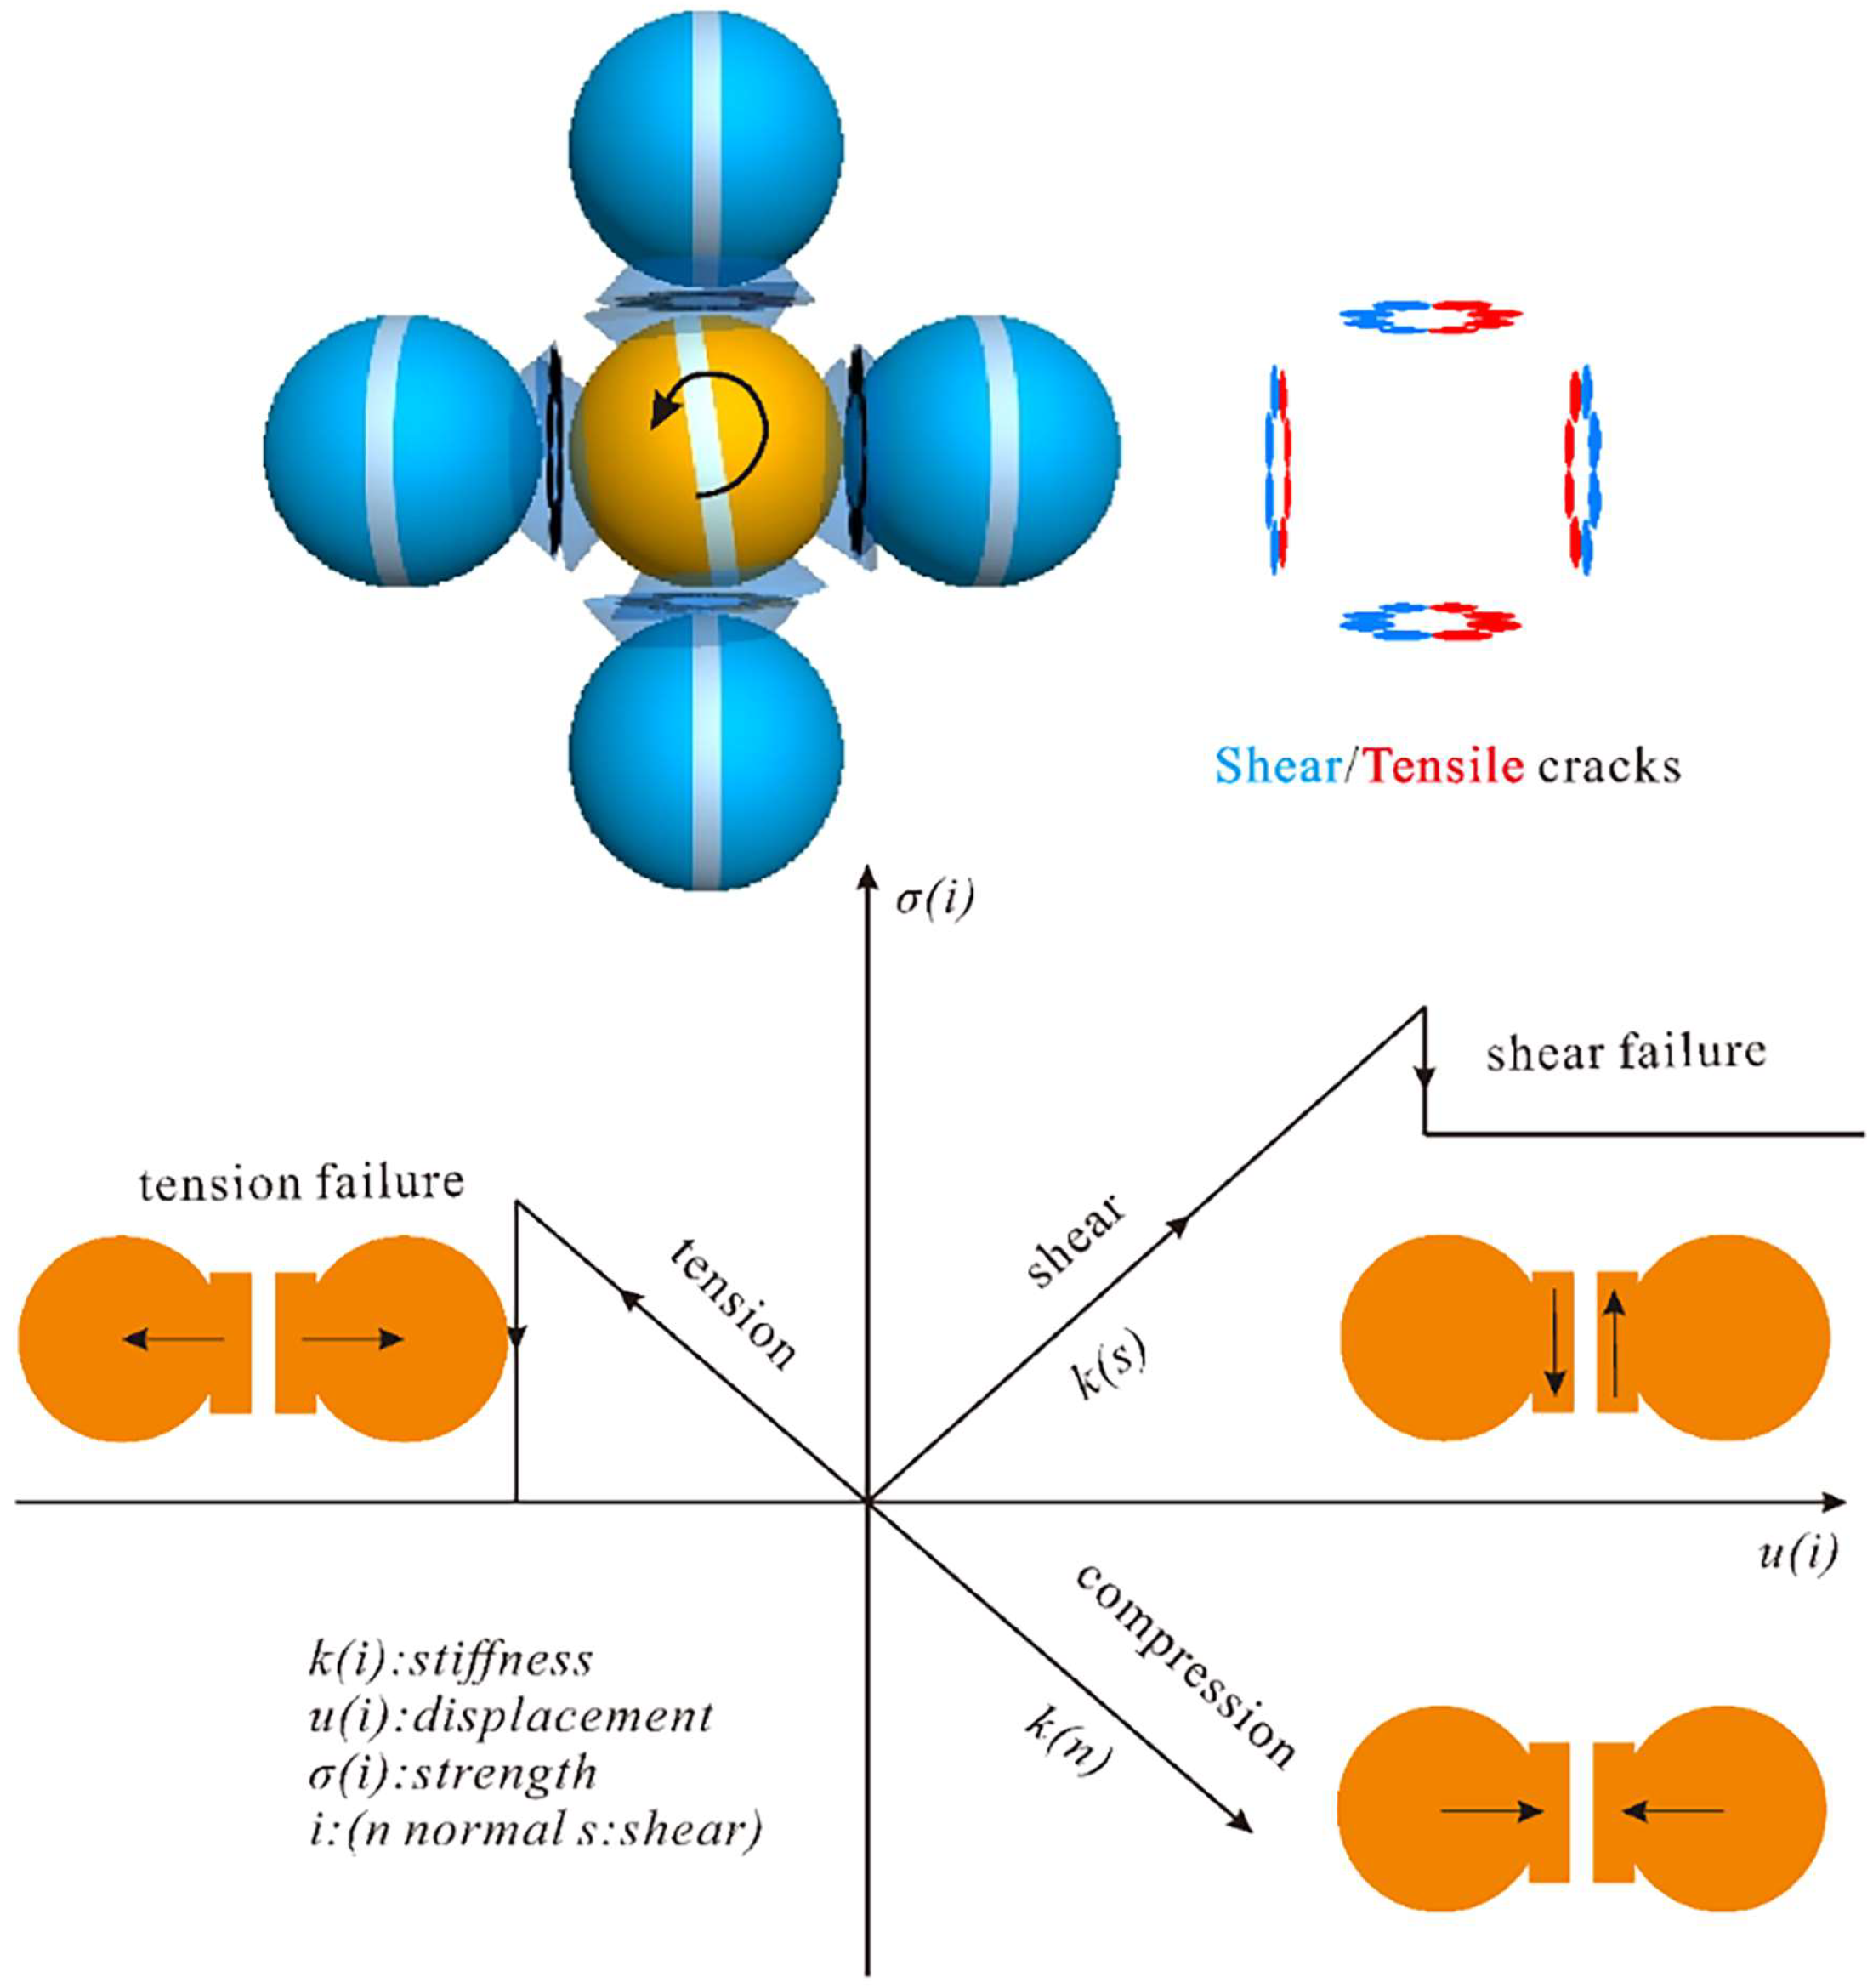
By modifying the point contact state at the contact location, the FJM approximates particle contact as the surface contact of mineral crystals. The damage determination of FJM is shown in Figure 4. Tension cracks are formed when the normal tensile stress exceeds the tensile strength; shear cracks are formed when the applied tangential stress exceeds the unit shear strength. The contact surface in the FJM differs significantly from that in the parallel bonding model. Because the FJM divides the contact surface between particles into several units that are merged to form a contact surface, the units themselves can be destroyed. The computing efficiency decreases as the number of units increases. When the number of units is more than four, the effect on the results is insignificant [37], and eight contact units are chosen, on balance, in this paper. The activation distance, which impacts the overall bond number, must be considered during the FJM application procedure. The discrete element particles are rigid spheres that do not deform, and the mechanical calculation of their contact process displays displacement and deformation based on the overlap amount. The FJM is active by default only when the contact distance is less than zero. The contact model of linear elasticity controls the mechanical properties of the FJM before damage in this situation. To avoid this, the initial activation gap must be larger than zero. However, in order to avoid cross-bonding, this distance must not surpass the particles’ minimum radius. As a result, in this paper, the initial activation gap was set at 0.8 times the minimum particle radius. The radius of the FJM contact surface is determined by a value of 0.5774 times the minimum particle radius.

2.2.2. Acoustic Emission Mechanism

Because the forces on the particles and their resulting motions can be calculated directly in the model during the PFC procedure, calculating the moment tensor directly based on the change in the contact force of the surrounding particles during the cohesive disruption will be easier than converting the recorded power wave into a moment tensor.
The particles that were originally in contact at both ends of the microcrack are referred to as the “source particles” in this paper. As the source particles travel, the contact between them deforms, causing the contact force to alter. As a result, the microcrack’s area of action is the same as the center of the circle, and the radius of action is the diameter of the largest source particle. As a result, the contact force change of all contacts on the source particle is multiplied by the corresponding force arm (the distance between the contact point position and the center of the microcrack), and the summing operation provides the moment tensor component, as shown in the expression:
M i j = ( F i R j )
where F i is the i-th component of contact force variation and R j is the j-th component of distance between contact point and microcrack center. If the acoustic emission event contains only one microcrack, the center of the microcrack is the spatial location of the acoustic emission event; if the acoustic emission event contains multiple microcracks, the geometric center of all microcracks is the spatial location of the acoustic emission event.
To improve computing performance, the moment tensor with the highest scalar moment value is used as the moment tensor for each emission event and saved. The scalar moment is formulated according to the moment tensor matrix.
M 0 = m j 2 2 1 2
where m j is the j-th eigenvalue of the moment tensor matrix.
The moment tensor is recalculated at each time step during the duration of the acoustic emission event; if no new microcrack is produced in the microfracture action region during that time period, this acoustic emission event contains only one microcrack; if a new microcrack is produced and its action region overlaps with the old microcrack action region, the microcrack is considered to belong to the same acoustic emission event. In this case, the acoustic emission contains multiple microcracks. As a result, the source particle regions were superimposed, and the duration was recalculated and extended.

2.3. Tensor Model of Surface Damage Caused by Internal Damage in Red-Bed Soft Rock

The interior fine-scale damage evolution of red-bed soft rocks was produced using the FJM acoustic emission model described above. This data can accurately represent the fine mechanical properties of red-bed soft rocks. The moment tensor approach is introduced in this research to further examine the total damage features of red-bed soft rocks from the interior to the surface, and a three-dimensional stress-fabric analysis is proposed as a result.

2.3.1. Moment Tensor Method

The moment tensor can be thought of as the same effect created by equating the equivalent displacements caused by the contact forces operating on the particle surface to the body forces in the discrete particle technique. When the internal fine view damage occurs, the source information is formed, and in seismology, the source information may be retrieved in inversion by recording the power waves released from the source. Moment tensor theory is frequently employed to examine the source information [38]. In the present study, we adopt the modeling method proposed by Zhao et al. [39]. The moment tensor is seen in source analysis as the actual force at the source replaced by an analogous set of forces producing a displacement at the surface equal to the actual force. Gilbert [40] developed this approach for calculating displacements at free surfaces, and the observed spatiotemporal connection for arbitrary displacements can be stated as:
d n x , t = M k j G n j , k s t ¯
where M k j is a set of second-order seismic moment tensors M , and G n j , k denotes the nine generalized moment tensor states in the three-dimensional case. ExpressingM completely, there are:
M = M x x M x y M x z M y x M y y M y z M z x M z y M z z
M = a 1   a 2   a 3 m a 1 T a 2 T a 3 T = a 1 x a 2 x a 3 x a 1 y a 2 y a 3 y a 1 z a 2 z a 3 z m 1 m 2 m 3 a 1 x a 1 y a 1 z a 2 x a 2 y a 2 z a 3 x a 3 y a 3 z
where the diagonalized matrix m is the one that can be decomposed again.
m = m 1 m 2 m 3 = 1 3 t r M t r M t r M + m 1 * m 2 * m 3 *
where m i is the eigenvalue of the matrix and tr(M) is the trace of the matrix. The first half of the Equation (11) is the spherical tensor part of m i , and the second half is the bias tensor part. Based on this, the concept of R-value was introduced by Feignier and Young [41]:
R = t r M 100 t r M + m i *
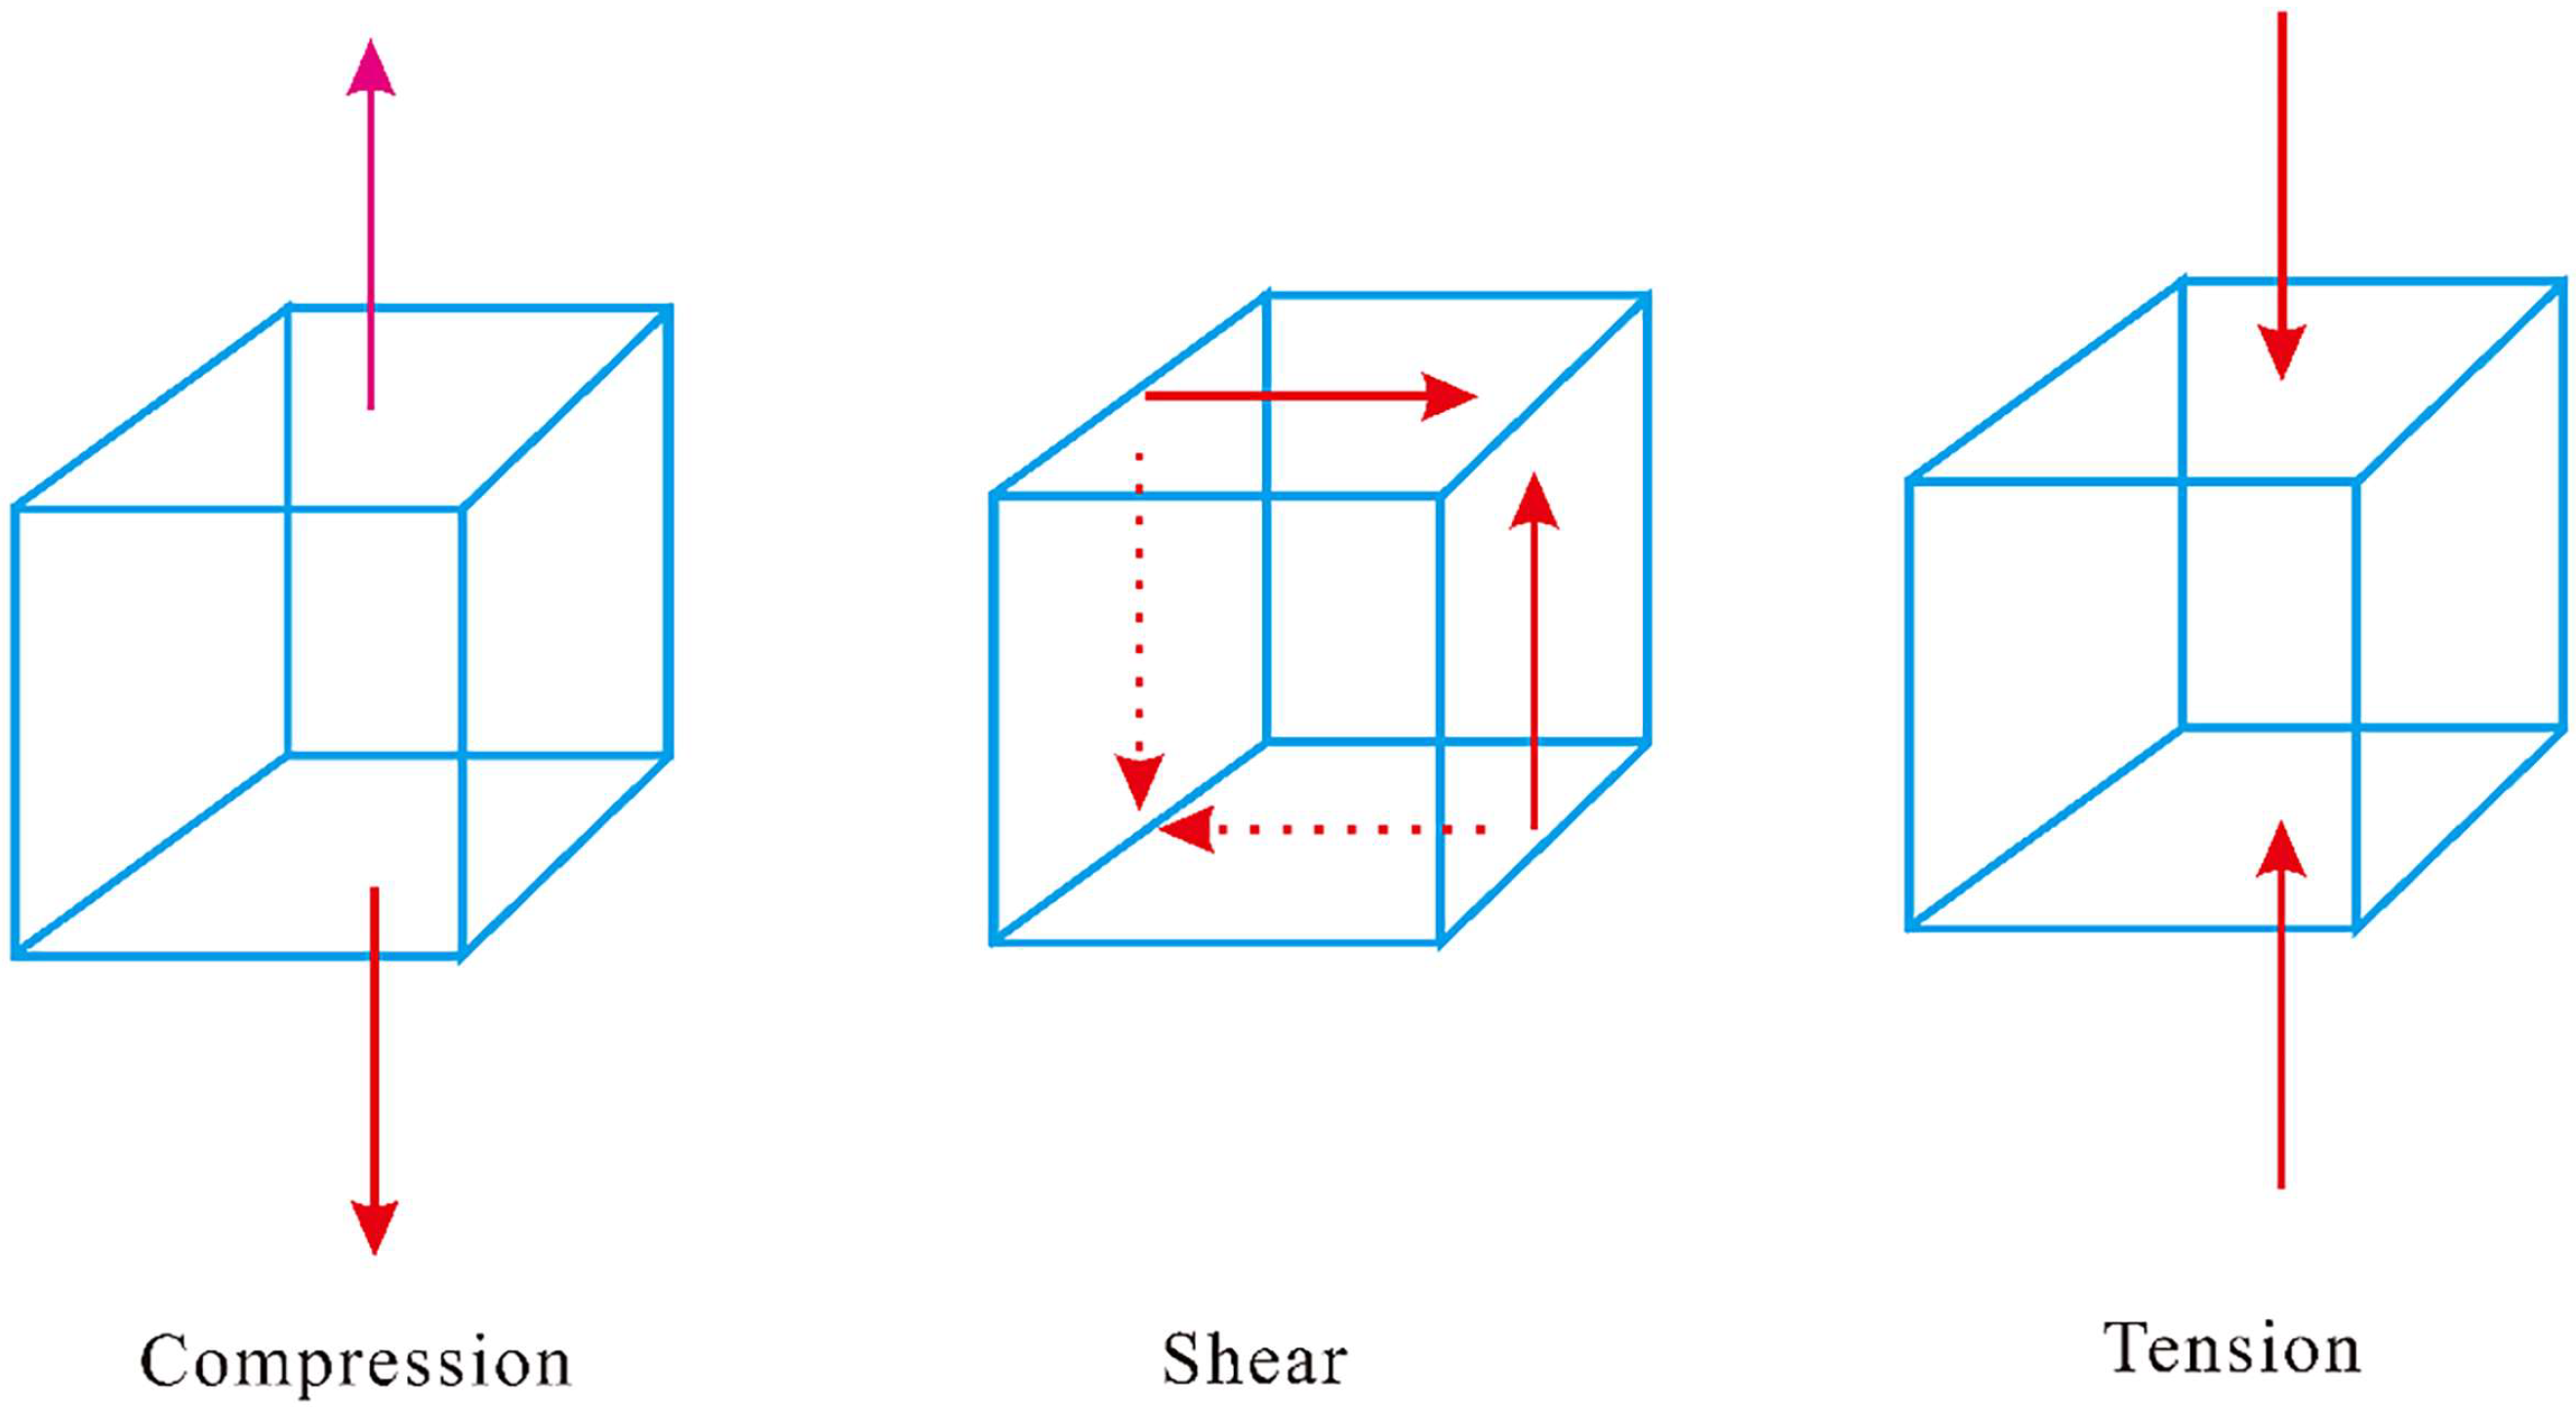
For different seismic damage states, the R-values change. Three common damage state force patterns are provided in Figure 5, namely, tension damage, shear damage, and compression damage. The R-values and moment tensor forms are listed in Table 1.

2.3.2. Three-Dimensional Stress-Fabric Analysis

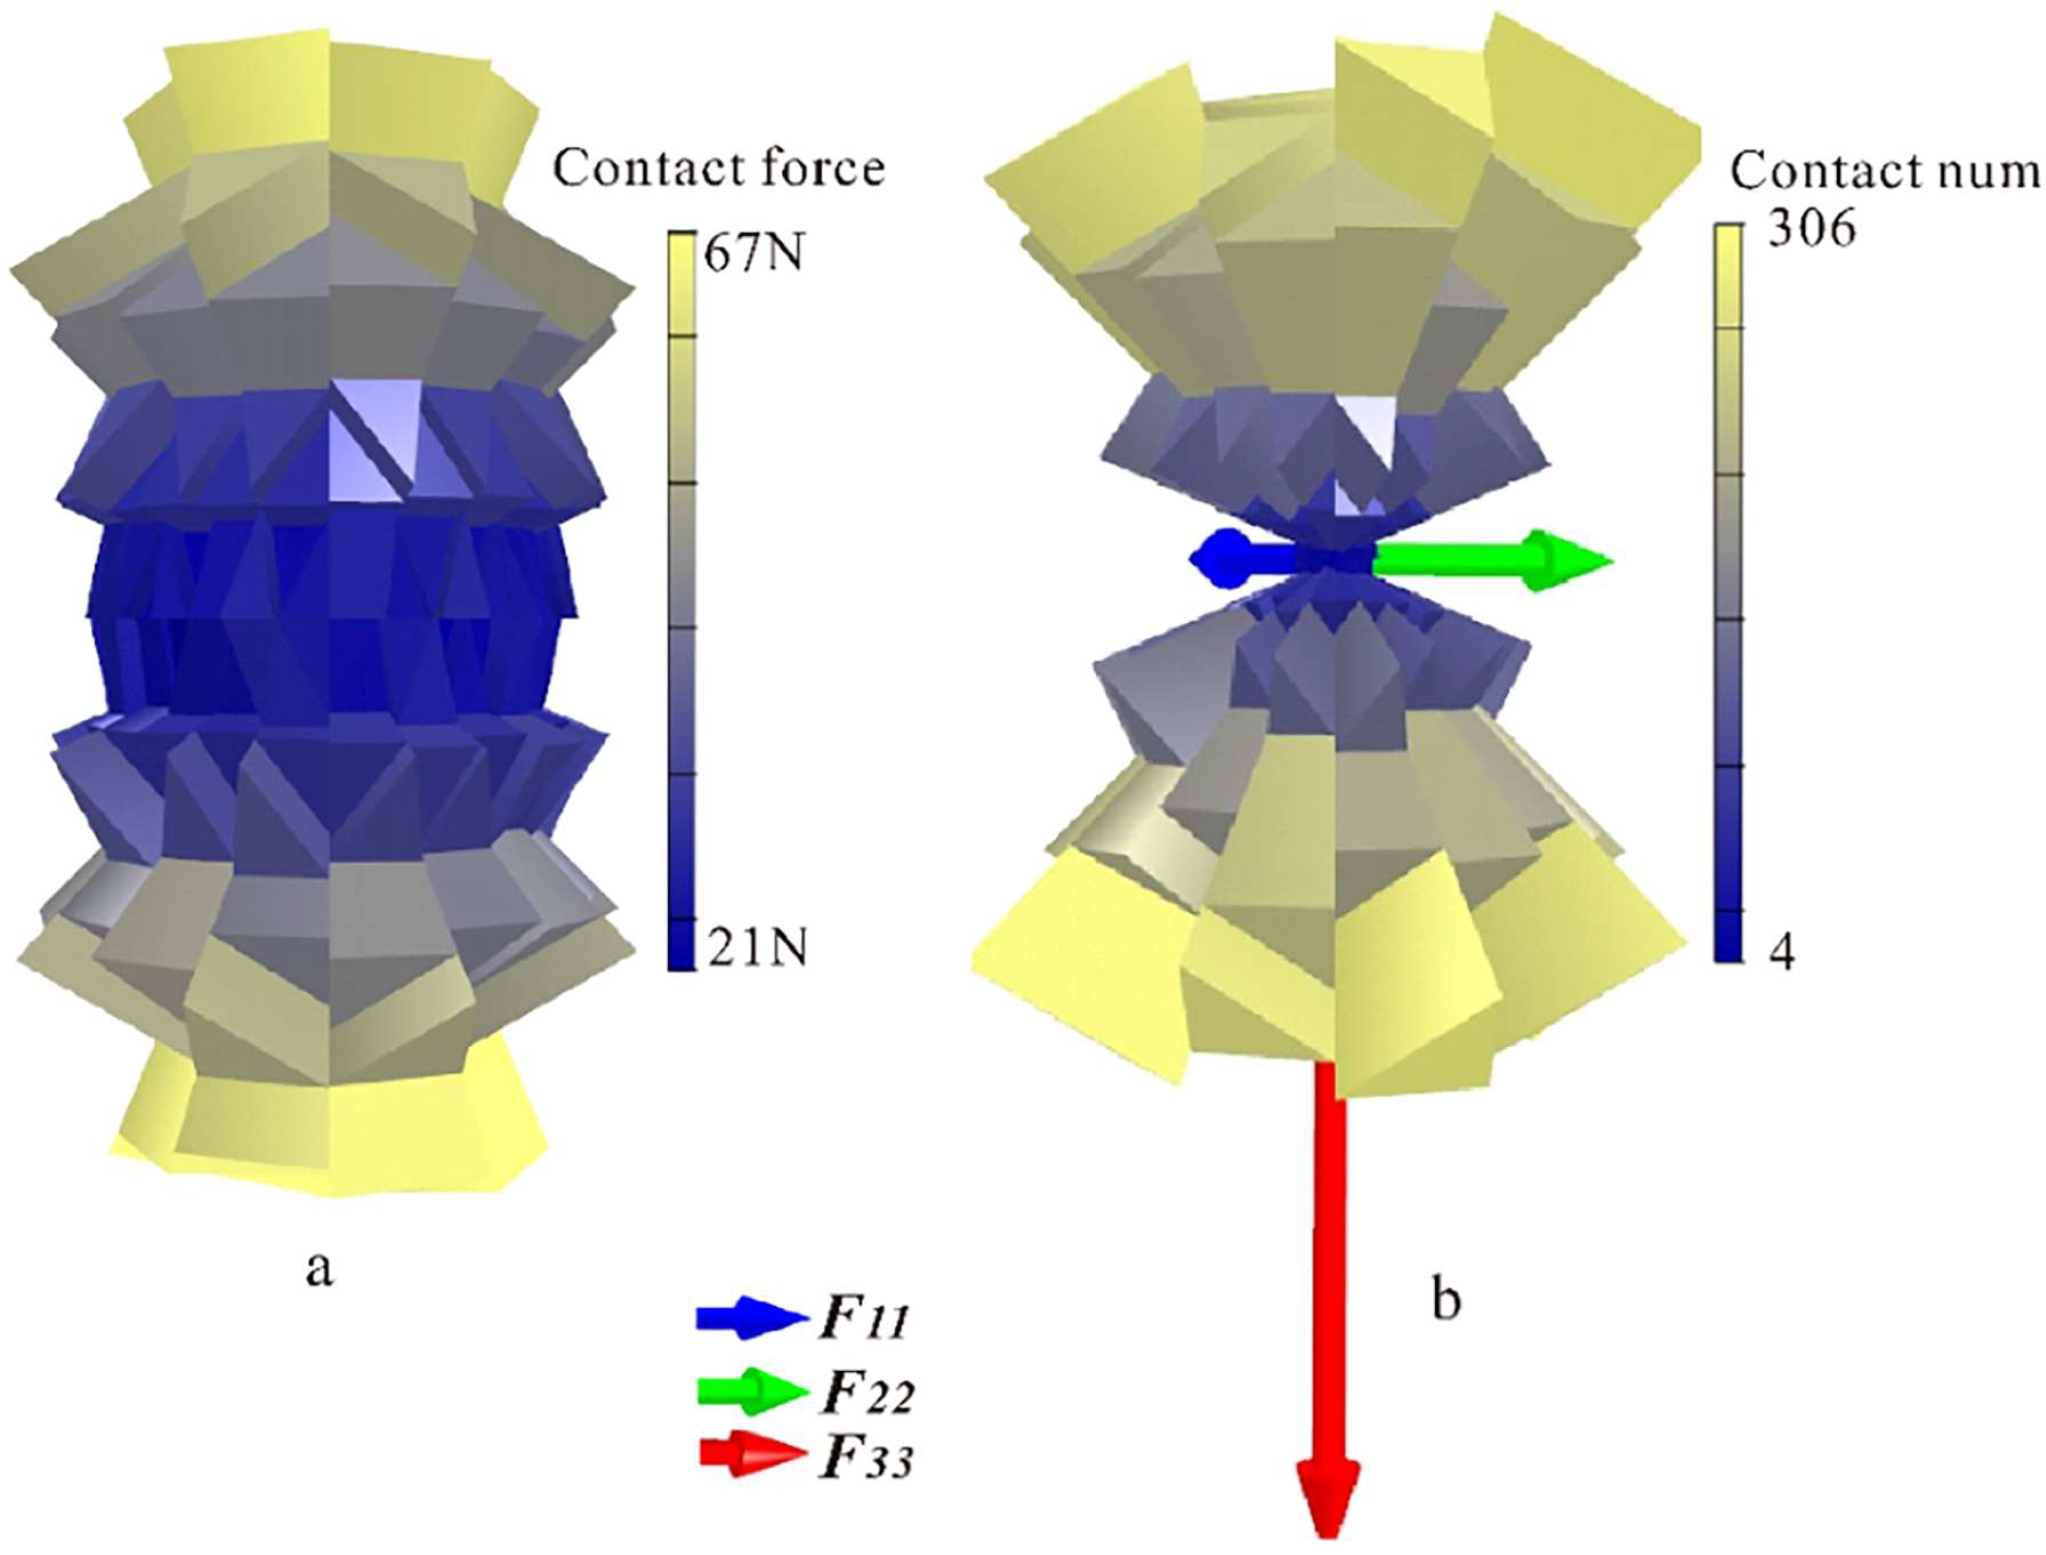
The contact distribution normal to the grains can be used to provide the structural description of red-bed soft rocks (mineral grain assemblages), and the contact density function is the function that describes the contact distribution. In a spherical coordinate system, the most widely employed contact density function is a Fourier triangle series. In this article, a spherical coordinate system was developed for this purpose, as shown in Figure 6, with the local coordinate system at the particle contact consisting of orthogonal unit vectors n , s , and t , where:
n = c o s θ i + s i n θ c o s β j + s i n θ s i n β k s = s i n θ i c o s θ c o s β j c o s θ s i n β k t = s i n β j c o s β k
where i , j , and k are distributed as unit vectors in the x , y , and z directions.
The contact density function takes the form of a second-order Fourier series as proposed by Chang et al. [42]:
ξ θ , β = 1 4 π 1 + a 4 3 c o s 2 θ + 1 + 3 b s i n 2 θ c o s 2 β
The tensor in the Cartesian coordinate system takes the form of:
ξ n = 1 4 π D i j n i n j
where D i j is the contact density tensor:
D i j = 1 + a 1 a 2 + 3 b 1 a 2 3 b
In the formula, a and b are the parameters defining the normal anisotropic distribution of the contact.
In addition to the contact density tensor, the fabric tensor has been proposed to characterize the spatial arrangement structure of particles, which is commonly defined as [7]:
F i j = 1 N N c n i n j
where N is the number of contacts, using the contact density function written in integral form as follows:
F i j = 0 2 π 0 π ξ θ , β n i n j s i n θ d θ d β
Substituting Equation (14) into Equation (18), we can obtain the group structure tensor:
F i j = 1 15 5 + 2 a 5 a + 6 b 5 a 6 b
In this paper, the results of anisotropy coefficients a and b are analyzed by two deterioration indexes in discrete element test results.

2.4. DEM–FEM Coupling Model for the Whole Process of Red-Bed Soft Rock Disaster

The DEM of mineral particles functions as a unit, often constrained by the computation efficiency of the particles, which cannot be indefinitely small, signaling that displacement is also calculated as a unit of particles occurring intermittently. As a result, DEM cannot efficiently depict the overall deformation cloud map. While most digital image technology test processing methods are performed in the interior visual settings of the environment, other more complex test conditions can only be analyzed numerically. The coupled DEM–FEM model can couple the interaction of continuous materials and discrete media through parameter transfer. As a result, this article applies the principle of equivalence and presents a DEM–FEM coupling approach that approximates digital image technology, as shown in Figure 7. Weighting factors are determined for each vertex by taking the triangle area opposite a vertex and dividing it by the total area of the triangle [43].
In fact, the DEM–FEM coupling approach has been presented in previous research as a method capable of compensating for the inadequacies of discrete element computational forces in large tunnel and slope projects [44,45]. The wall coupling method is employed in this paper to more closely approach the true state of the exterior cladding. The DEM and FEM are run on their respective model components, with the FEM mesh expanding the coupled wall and the DEM generating the inside particles. During the computation of the coupled DEM–FEM, the motions of the wall vertices and cell nodes are synchronized. The FEM cell node velocities are transferred to the coupling wall vertices, causing the DEM particles to generate forces and deformations. The forces and deformations of the particles are transmitted back to the FEM as updated boundary conditions via the coupling wall based on the distance distribution. As a result, the computation of the discrete and continuous domains can be coupled. The researchers used the same coupling method to analyze the deformation in triaxial tests [46,47].

3. Results and Discussion

3.1. Three-Dimensional Visualization Test of Multifield Coupling Damage of Red-Bed Soft Rock with High Time–Space Resolution in the Whole Process

3.1.1. Laboratory Test Results

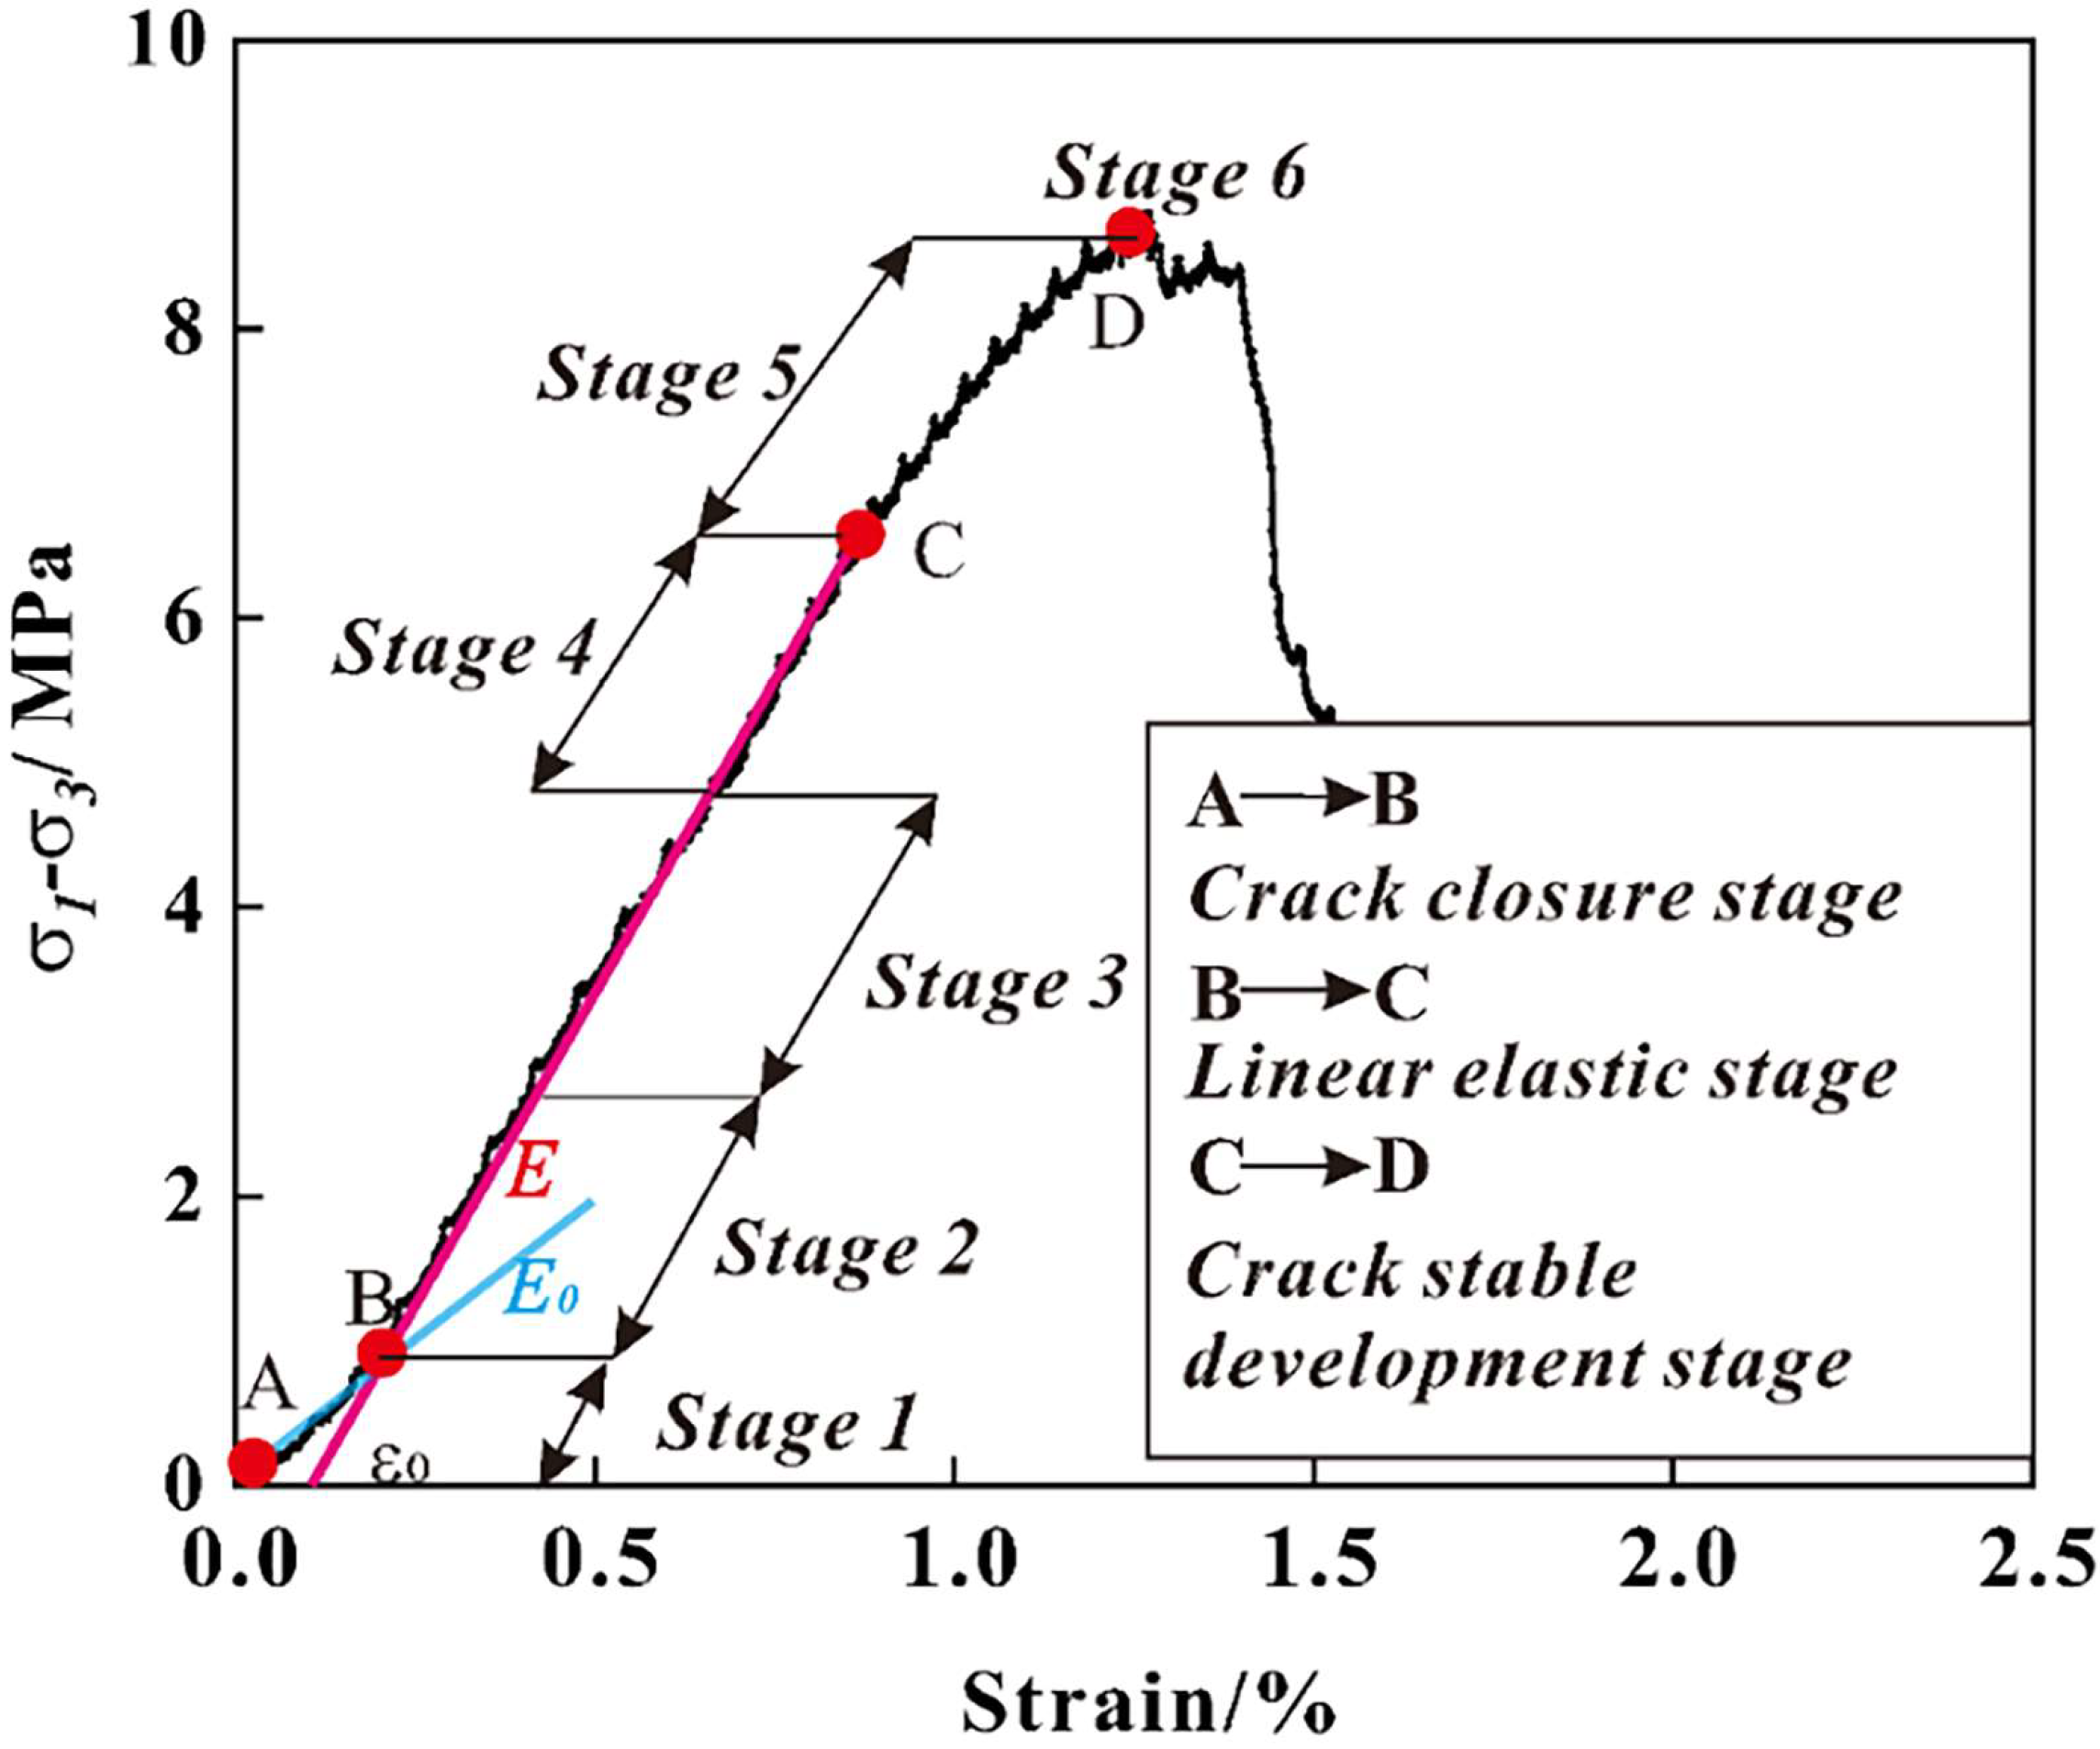
The compression-density stage, linear elastic stage, fracture accelerated development stage, and damage stage are the standard pre peak loading curves of rocks. Figure 8 depicts the stress-strain curve of red-bed soft rock during the loading process in the indoor test. Its mechanical curve is separated into three major stages, A–B being the initial crack and pore compacting stages, which are reflected by the curve’s downward convexity. The linear elastic stage (B–C) is often regarded as a rather stable mechanical feature of the rock at this stage, with only a minor degree of crack sprouting. C–D is the stage of increased fracture expansion, and the red-bed soft rock process is nearing completion. After D is the final failure stage, distinguished by a rapid decline in the curve and maximum crack development. In order to better illustrate the features of each stage, a total of six sub-stages were divided in front of the peak (stages 1–6), and the analysis in the subsequent article largely corresponds to these stages.
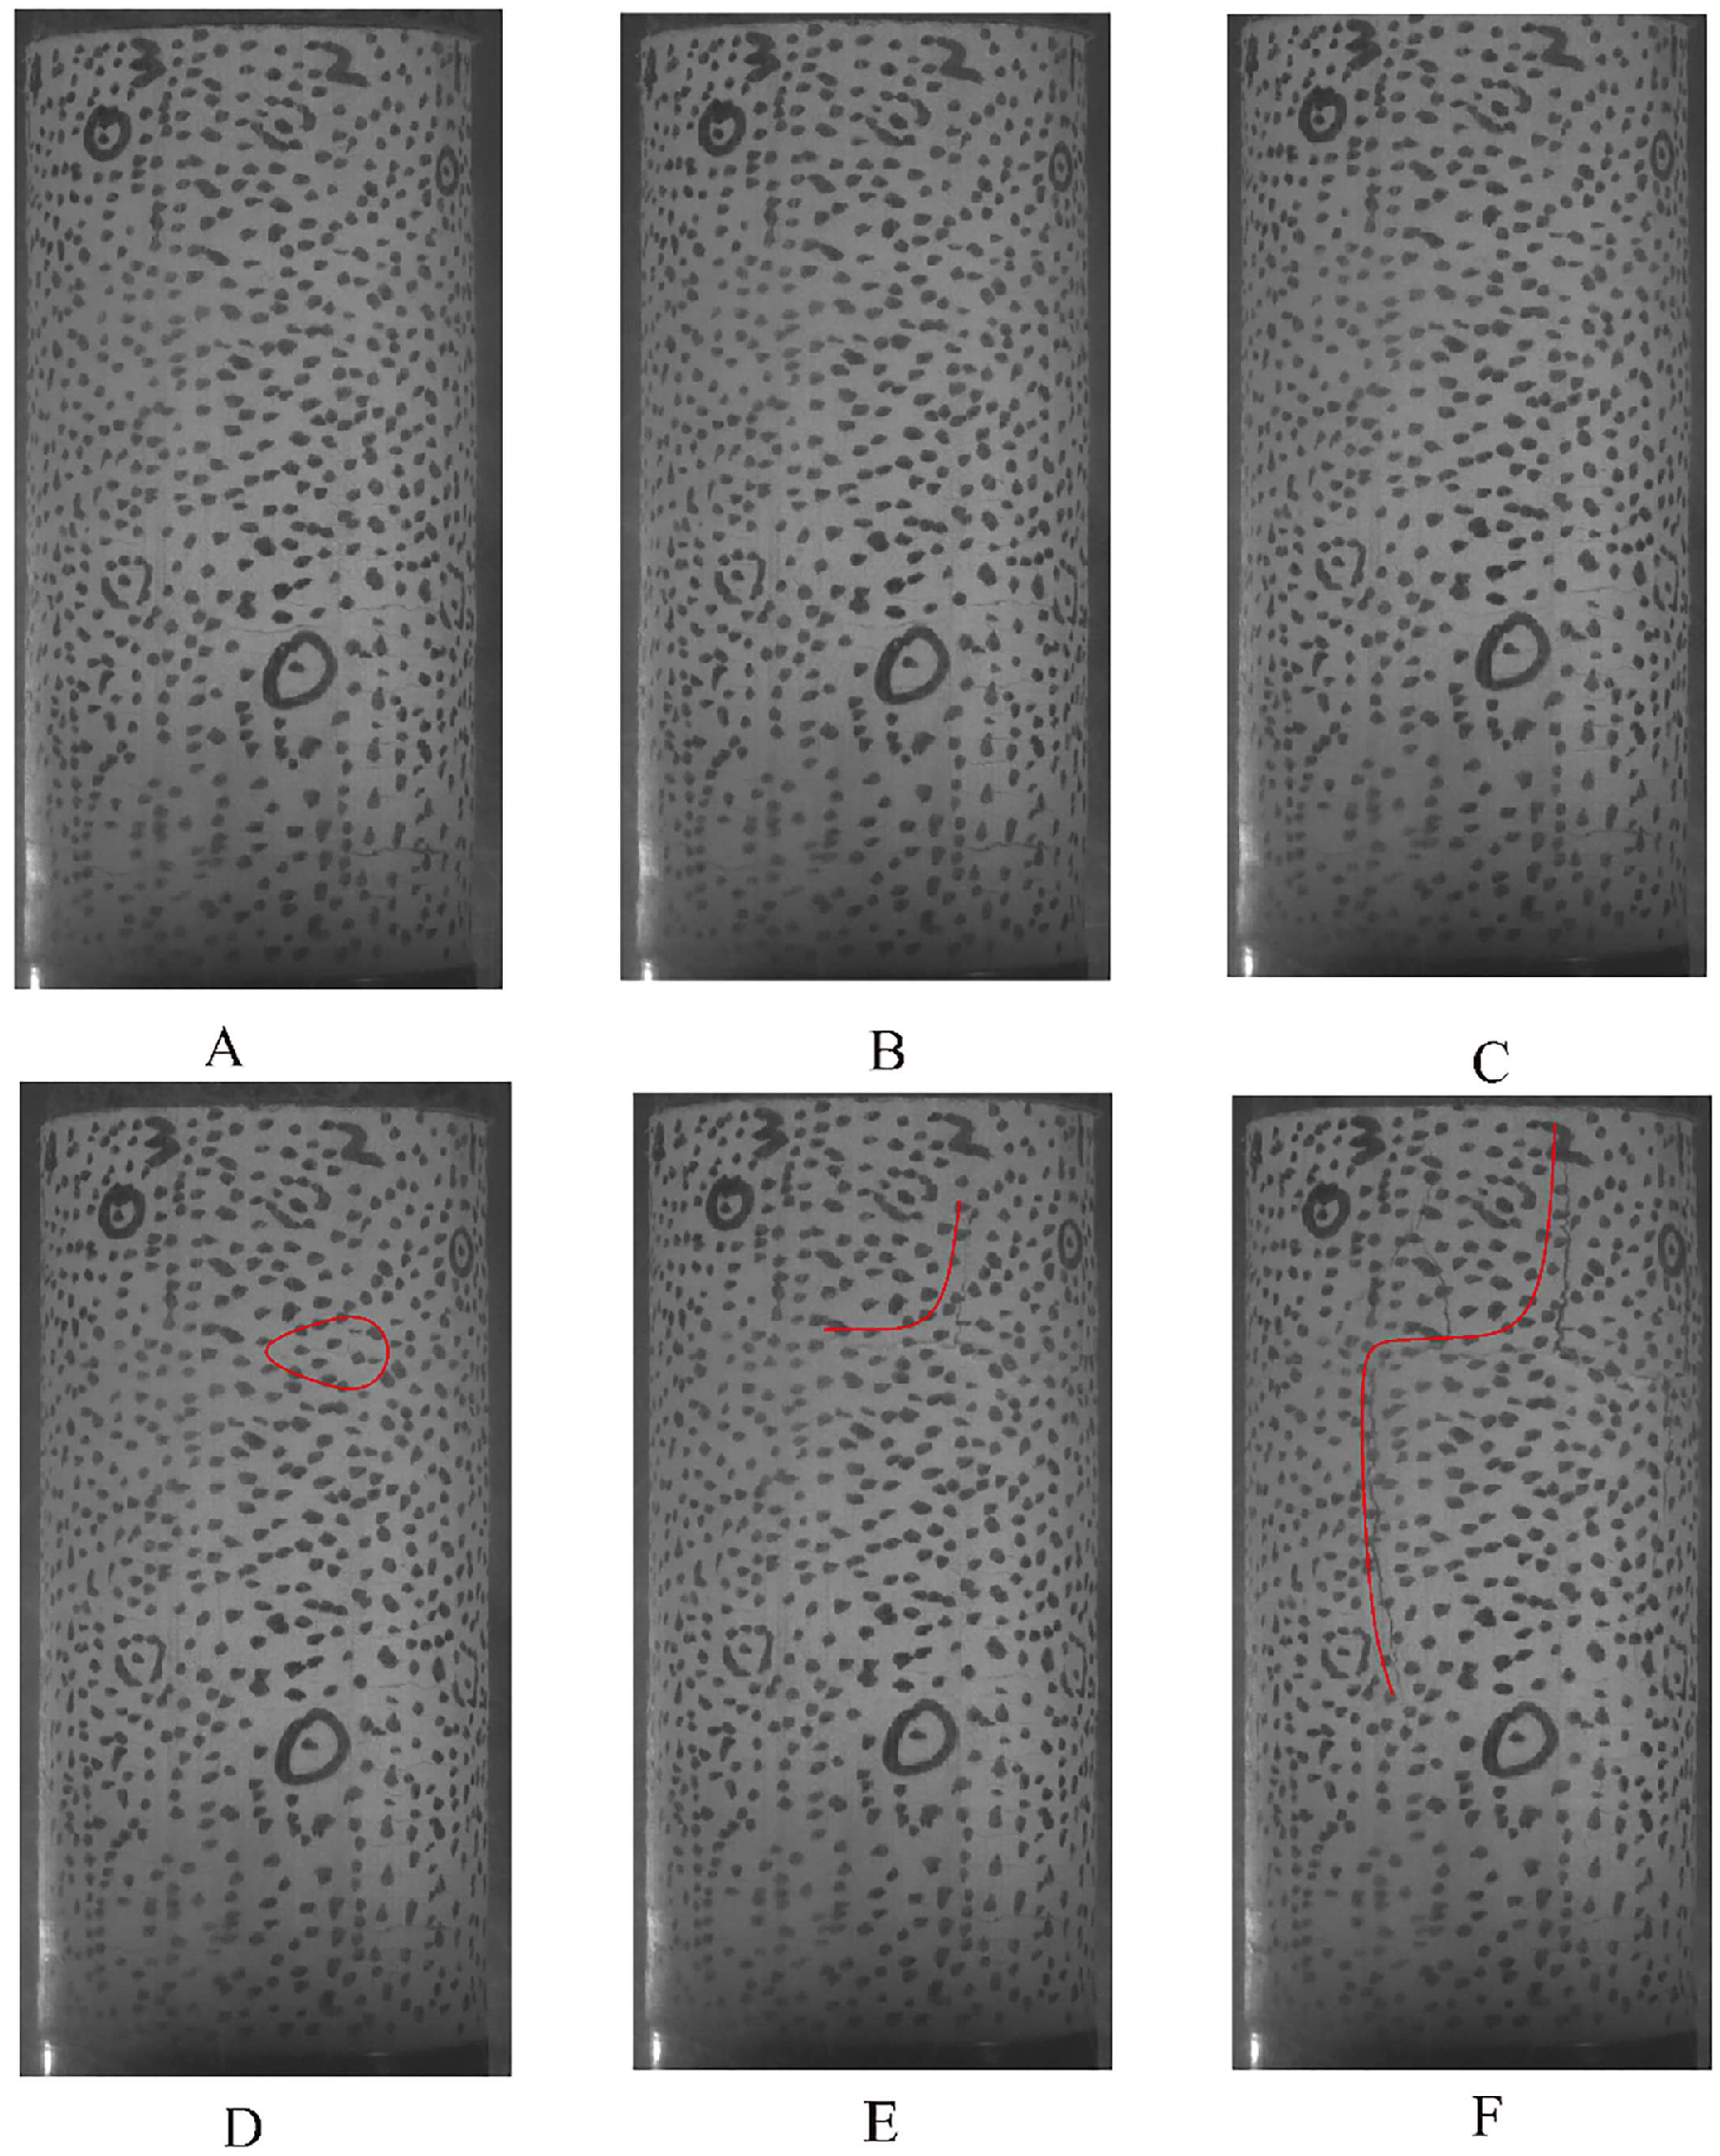
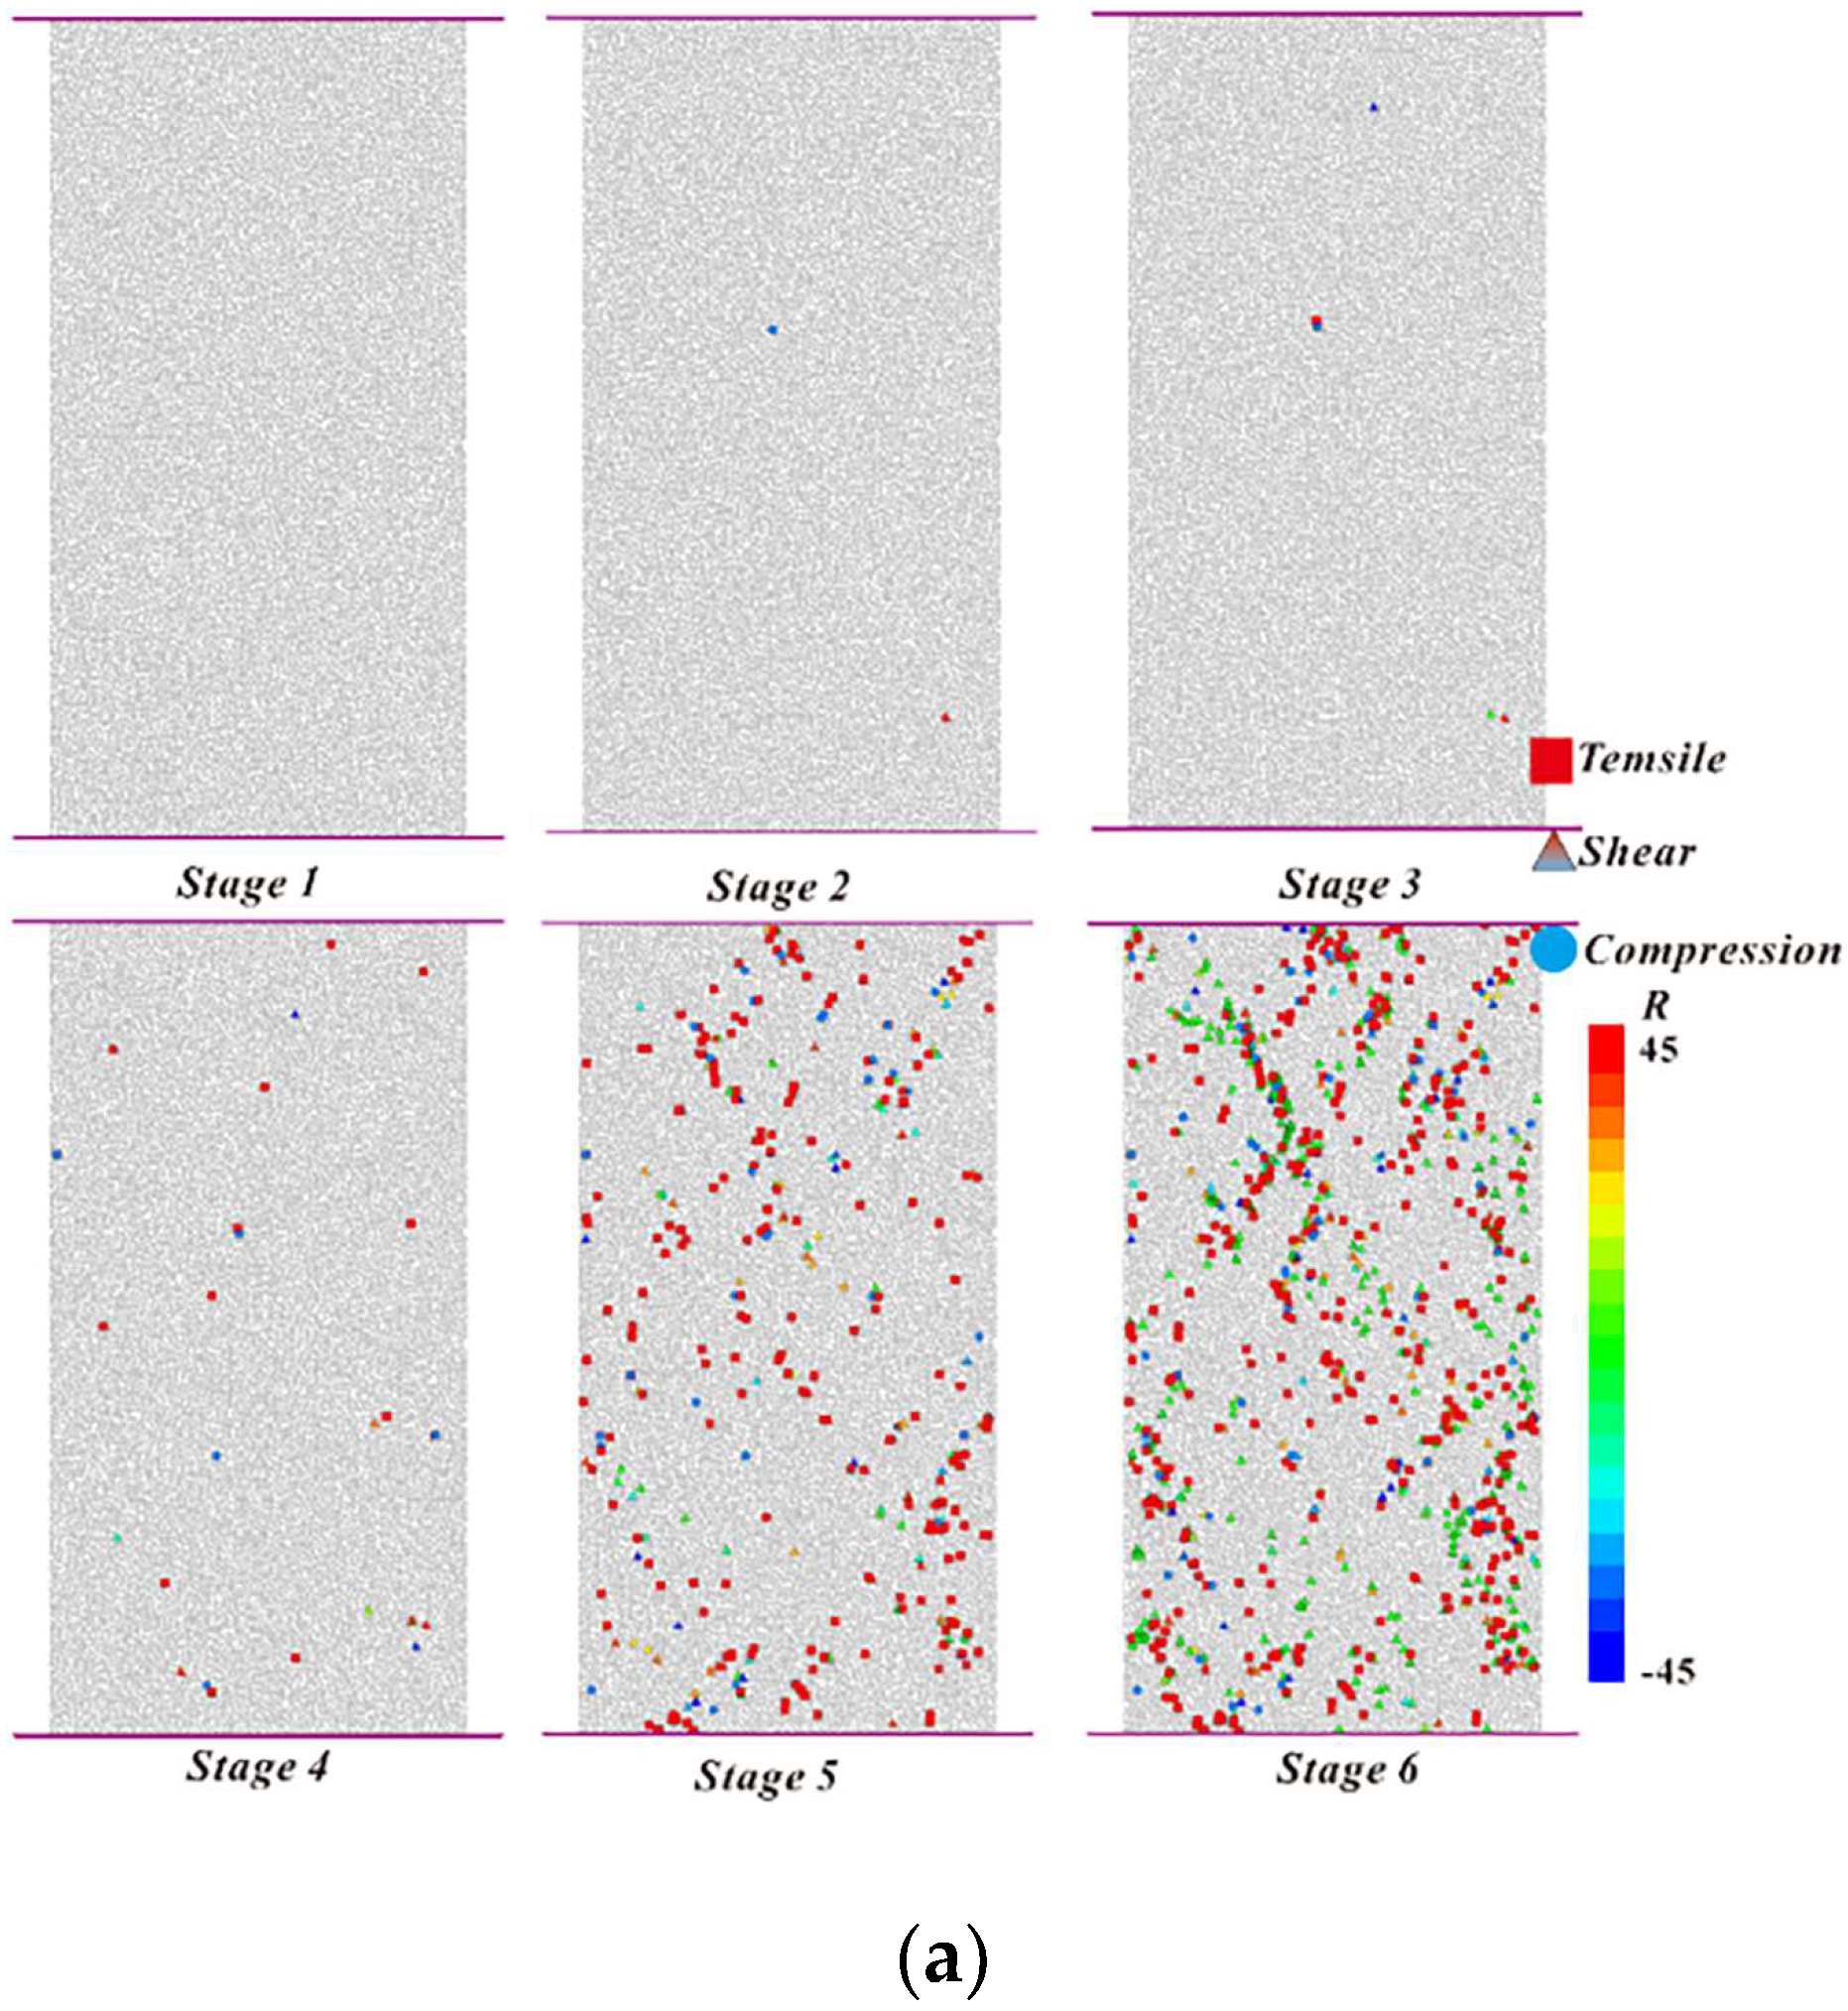
This study depicts the various stages of red-bed soft rock degradation in Figure 9 using a fully transparent loading mechanism and a high-definition camera. In terms of crack development, the resolution of the camera and the naked eye cannot see stages 1–3; hence, the chamber couldn’t discern the difference between stages 2 and 3, and their variations must be reflected in the DIC’s strain field variance. However, the beginning sprouting point of macroscopic cracks occurring in stage 4 may be dimly photographed. Stages 5–6 involve accelerated crack development, where the microcracks develop and cluster, eventually creating huge macroscopic cracks.
Because indoor stress-strain curves can only provide limited information on the red-bed soft rock disaster, this research explores the changes in displacement and strain fields using digital image technology during the entire process of the red-bed soft rock tragedy.

3.1.2. Digital Image (DIC) Analysis

Figure 10a,b depict the 3D and 2D displacement fields of the entire red-bed soft rock disaster process, respectively. According to the figure, the overall displacement of the compression and density stages is reasonably uniform, the displacement of the upper and lower layers is greater than the displacement of the middle by the loading condition, and the stratification is uniform. Abrupt changes in local displacement can be found in stages 2 and 3, which is due to the local concentration of stress; thus, it can be assumed that this stage had initial damage that led to stress adjustment, and the process of stress redistribution produced stress concentrations of varying degrees. Stage 4 is the last stage of the linear elastic stage, in which the rock is approaching an uncontrollable accelerated damage process. The figure shows that the abrupt change in displacement gradually shows regularity until stage 5, when the phenomenon of left and right delamination appears when macroscopic cracks have been generated.
We believe that damage during the loading process will result in stress concentration and an abrupt change in local displacement, and that this local phenomenon is the embodiment of the damage accumulation process. To better reflect the above characteristics, this paper reflects the characteristics of the entire red-bed soft rock damage process through the strain information statistics of all the recorded points.

3.1.3. DIC Full-Field Strain Analysis

The strain values of almost 110,000 nodes were evaluated in this experiment for different phases of s values obtained after ANOVA, as shown in Figure 11. The figure analyzes three sets of cameras with different orientations. The three sets of cameras correspond to different positions on the three-dimensional surface space of the red-bed soft rock. However, the errors in the three sets of curves are very small, and the curves almost overlap, indicating that full-field strain analysis has high reliability with a sufficient number of samples. The coordinates were processed according to the phases depicted in Figure 8 throughout the pre peak damage phase. The first dramatic change in variance occurs after the end of the compression phase, signaling the beginning of the linear elastic phase, which already possesses the stress concentration and strain field inhomogeneity brought about by compression. Stages 2 are the first stages of the elastic phase, and the process exhibits a stable amplification of the deformation variance, followed by a clear drop in the slope in stages 3. The reason for this is that the mineral particles, cementation, and self-locking processes in the initial stage have been destroyed and rebuilt after the recompacting in the elastic stage, slowing the strain concentration phenomenon reflected by the variance in the middle of the elastic stage. The variance growth rate increases again in the late elastic stages, stages 4, and the rate of increase in this interval is driven by the stress adjustment produced by the beginning sprouting of cracks, which impacts the strain field. Finally, in stage 5, the rock gradually enters the stage of accelerated crack expansion, and the variance increase rate also gradually increases exponentially. At this point, macroscopic cracks and internal damage are everywhere, and the mechanical properties of the red-bed soft rock are greatly deteriorated.
In summary, this information may effectively reflect the macroscopic mechanical properties of red-bed soft rocks, and the coupled DEM–FEM model is employed in this paper to further analyze the entire process of internal fine damage generating disaster in red-bed soft rocks.

3.2. Analysis of the Results of the Tensor–DEM–FEM Coupling Model for the Whole Process of Damage and Disaster of Red-Bed Soft Rock

In this paper, the acoustic emission of the FJM first shows the internal fine damage evolution law of red-bed soft rocks; then, the tensor model reflects the process of internal damage to surface damage of red-bed soft rocks. Finally, the coupled DEM–FEM model is used to restore the whole process of the red-bed soft rock disaster, and the feasibility of this paper’s method is validated using digital image technology.

3.2.1. Analysis of Meso-Damage Results in Red-Bed Soft Rock

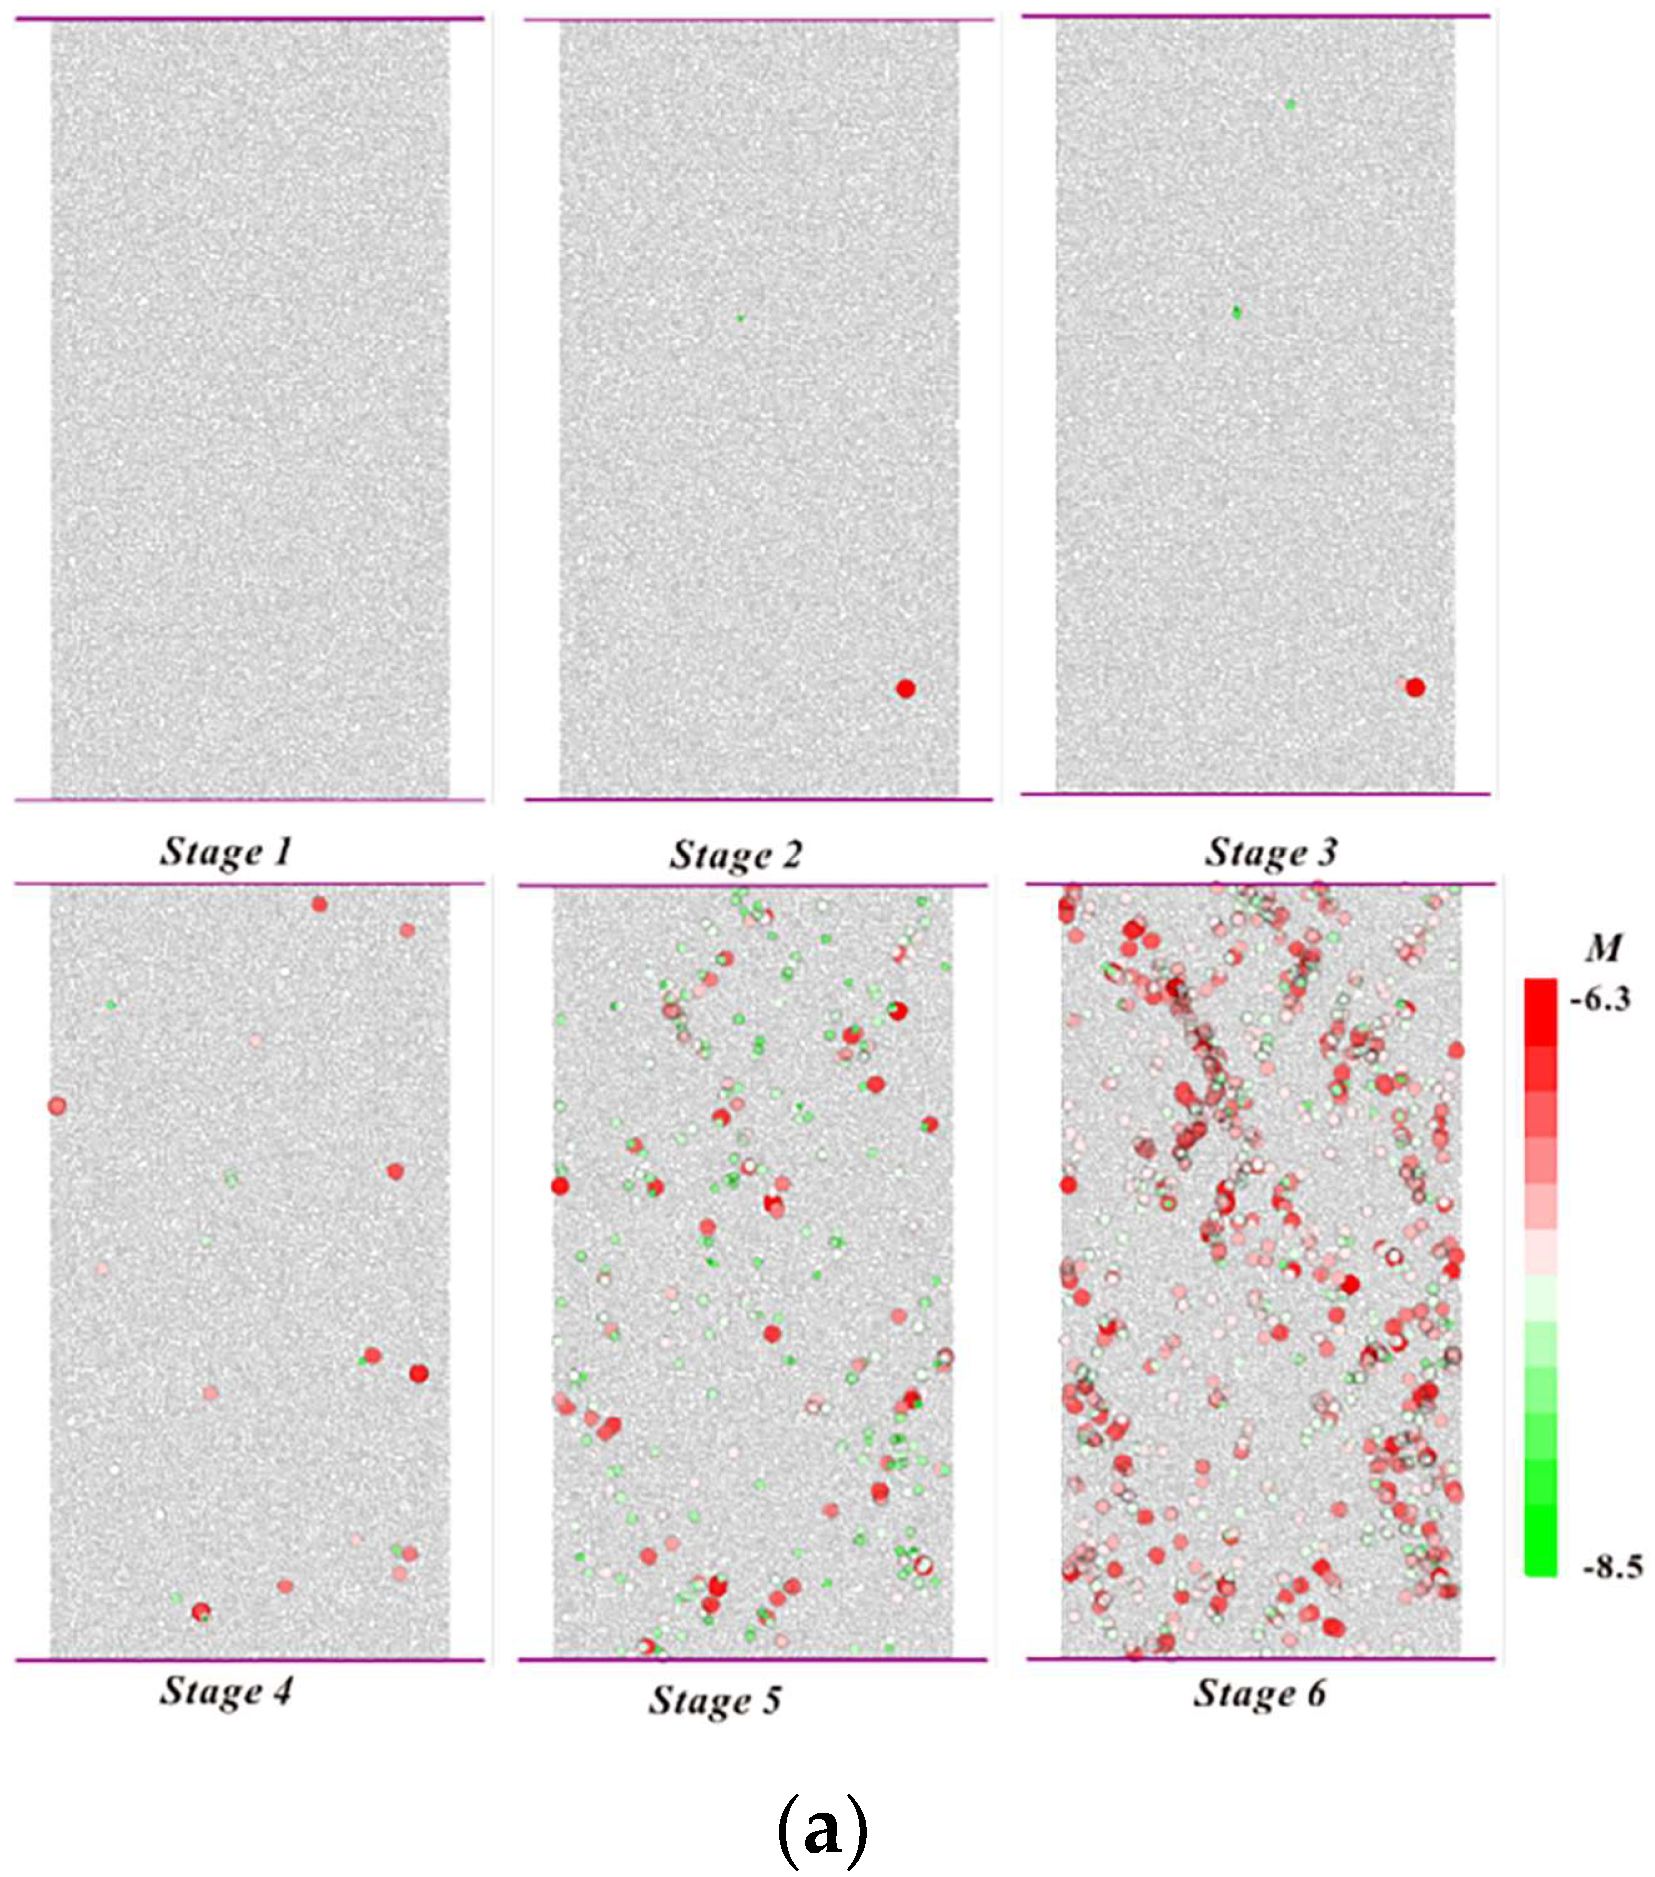
Figure 12a depicts the 2D DEM simulation process acoustic emission intensity information, which shows that the overall acoustic emission intensity is dispersed in the interval [−8.5, −6.3]. Acoustic emission events begin to be counted in the elastic initial and mid-elastic phases, which are caused by stress adjustment during the first compression-density phase. Because the stress level is low at this time, only a small amount of damage occurs where the stress is highly concentrated. This process has a minor impact on the overall mechanical characteristics; however, it can be used as an early indicator of the damage process in red-bed soft rocks. This is followed by a considerable increase in acoustic emission counts in the late elastic phase, when the process’s damage profile is created by the greater stress profile and anisotropy of the internal contact forces. This anisotropy results in only localized damage development. The full-scale damage growth does not begin until the accelerated crack development stage, when the microdamage eventually clusters to generate enormous macroscopic cracks, leading to the final disaster.
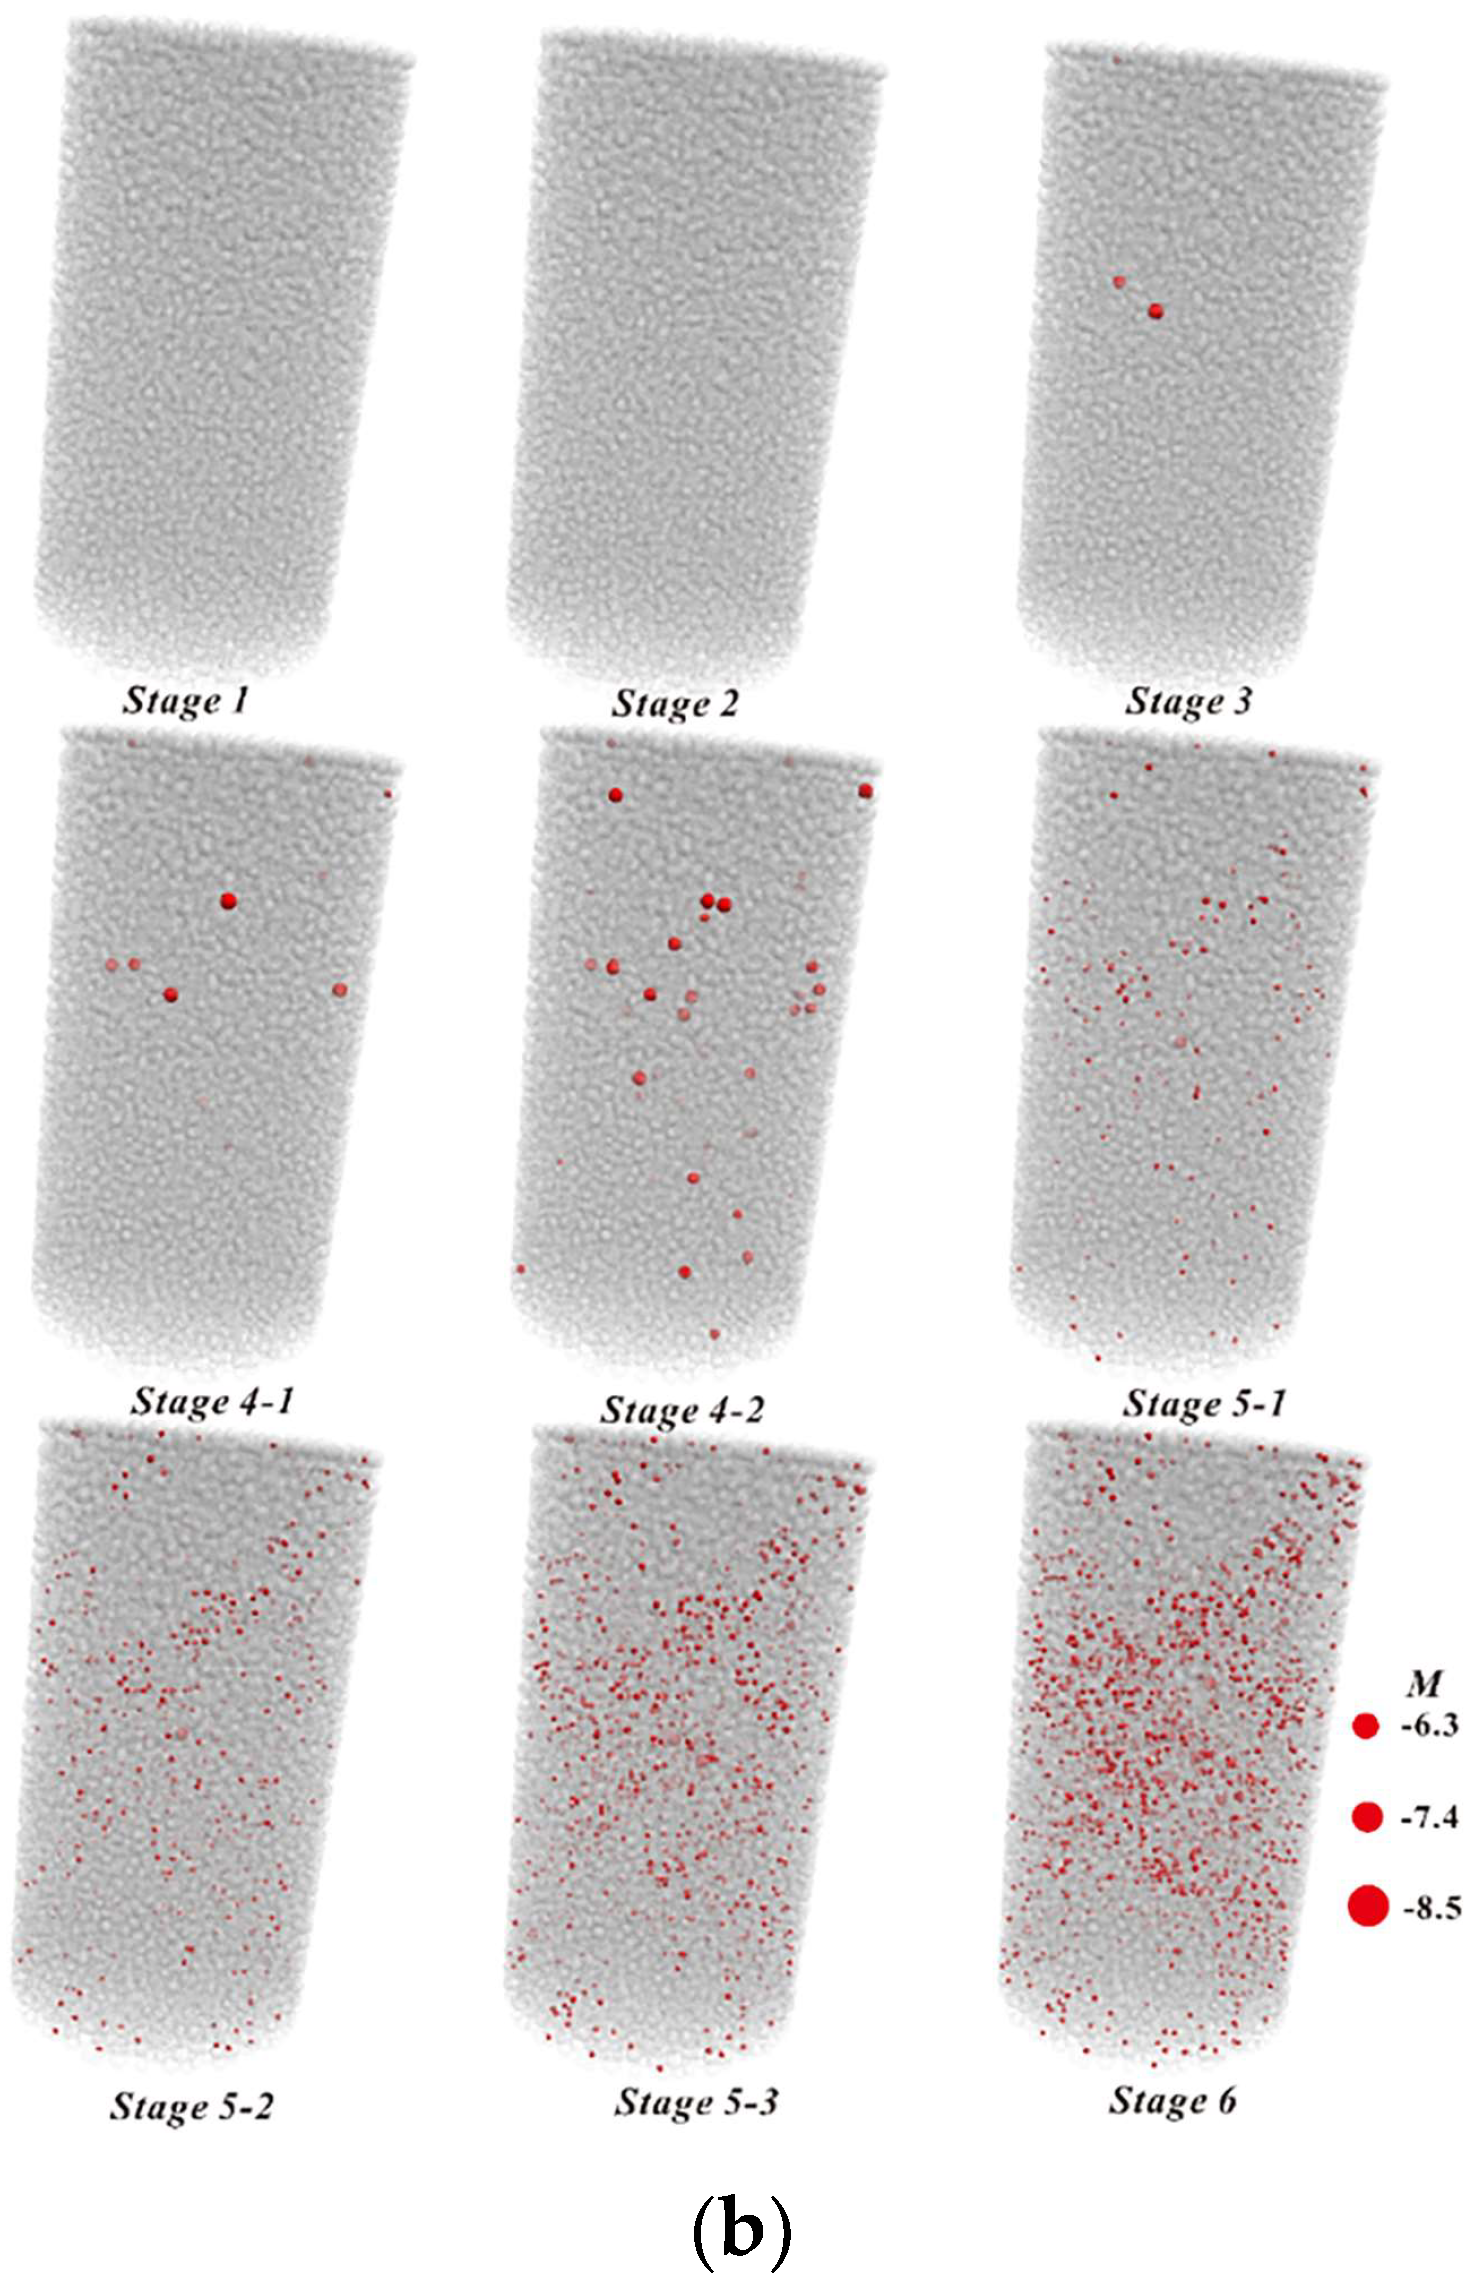
Similarly, in Figure 12b, we show the acoustic emission intensity during the 3D DEM simulation, and it is shown that the overall acoustic emission intensity is spread in the [−11, −9] interval. Because the 2D state particles default to a disk with a unit thickness of 1, the total intensity values are lower than the 2D DEM statistics, and the process departs from the genuine force state in the 3D state. When compared to the 2D example, the acoustic emission counting events in the 3D situation are delayed overall, and the acoustic emission events only begin to be counted in the mid-elastic and late elastic stages. This is owing to the particles’ stronger self-locking action in three-dimensions, where the damaging process necessitates higher amounts of stress. Acoustic emission counts begin to grow in the late elastic phase, and the damage profile of this process is once again produced by the greater stress profile and anisotropy of the internal contact forces. At the start of the accelerated crack development phase, the full range of damage is manifested. Eventually, microdamage continues to cluster to produce large macroscopic cracks, leading to eventual damage, and the overall acoustic emission statistics are distributed in a specific direction.

3.2.2. Analysis of the Results of Internal Damage and Surface Damage in Red-Bed Soft Rock

To some extent, the contact density tensor and contact force tensor in DEM can reflect the anisotropy of internal forces. This anisotropy increases with loading and may reflect internal damage and mechanical deterioration. Figure 13 depicts the spatial polar coordinate column statistics of contact force and contact density during the loading of discrete element specimens of red-bed soft rock, which correspond to the previously mentioned contact force tensor and contact density tensor, as well as the relative magnitudes of the principal coordinates of the contact force tensor. Figure 13 only reflects the qualitative characteristics of contact anisotropy, which cannot reflect the contact anisotropy of the damage process. The a and b values in the contact density tensor mentioned in Section 2 are used in this paper to quantify this anisotropy.
Figure 14 indicates that the anisotropy index of the contact force does not increase gradually during the entire pre peak loading phase but has reached its highest value in the mid-elastic phase. We believe that this anisotropic distribution is formed during the initial loading process of the red-bed soft rock, that the process was exhibited prior to the development of damage, and that the stress level is low enough not to induce microdamage. The stress concentration effect generated by this anisotropic stress state is continuously enhanced as the stress level rises, eventually leading to damage. As a result, according to this viewpoint, the final damage pattern and course of the red-bed soft rock are caused by the original internal structure. This anisotropy is visible in the early stages of loading, peaks, and then stabilizes in the late elastic period and does not alter during the accelerated crack growth stage.

3.2.3. Verification of the Whole Process of Damage and Disaster in Red-Bed Soft Rock

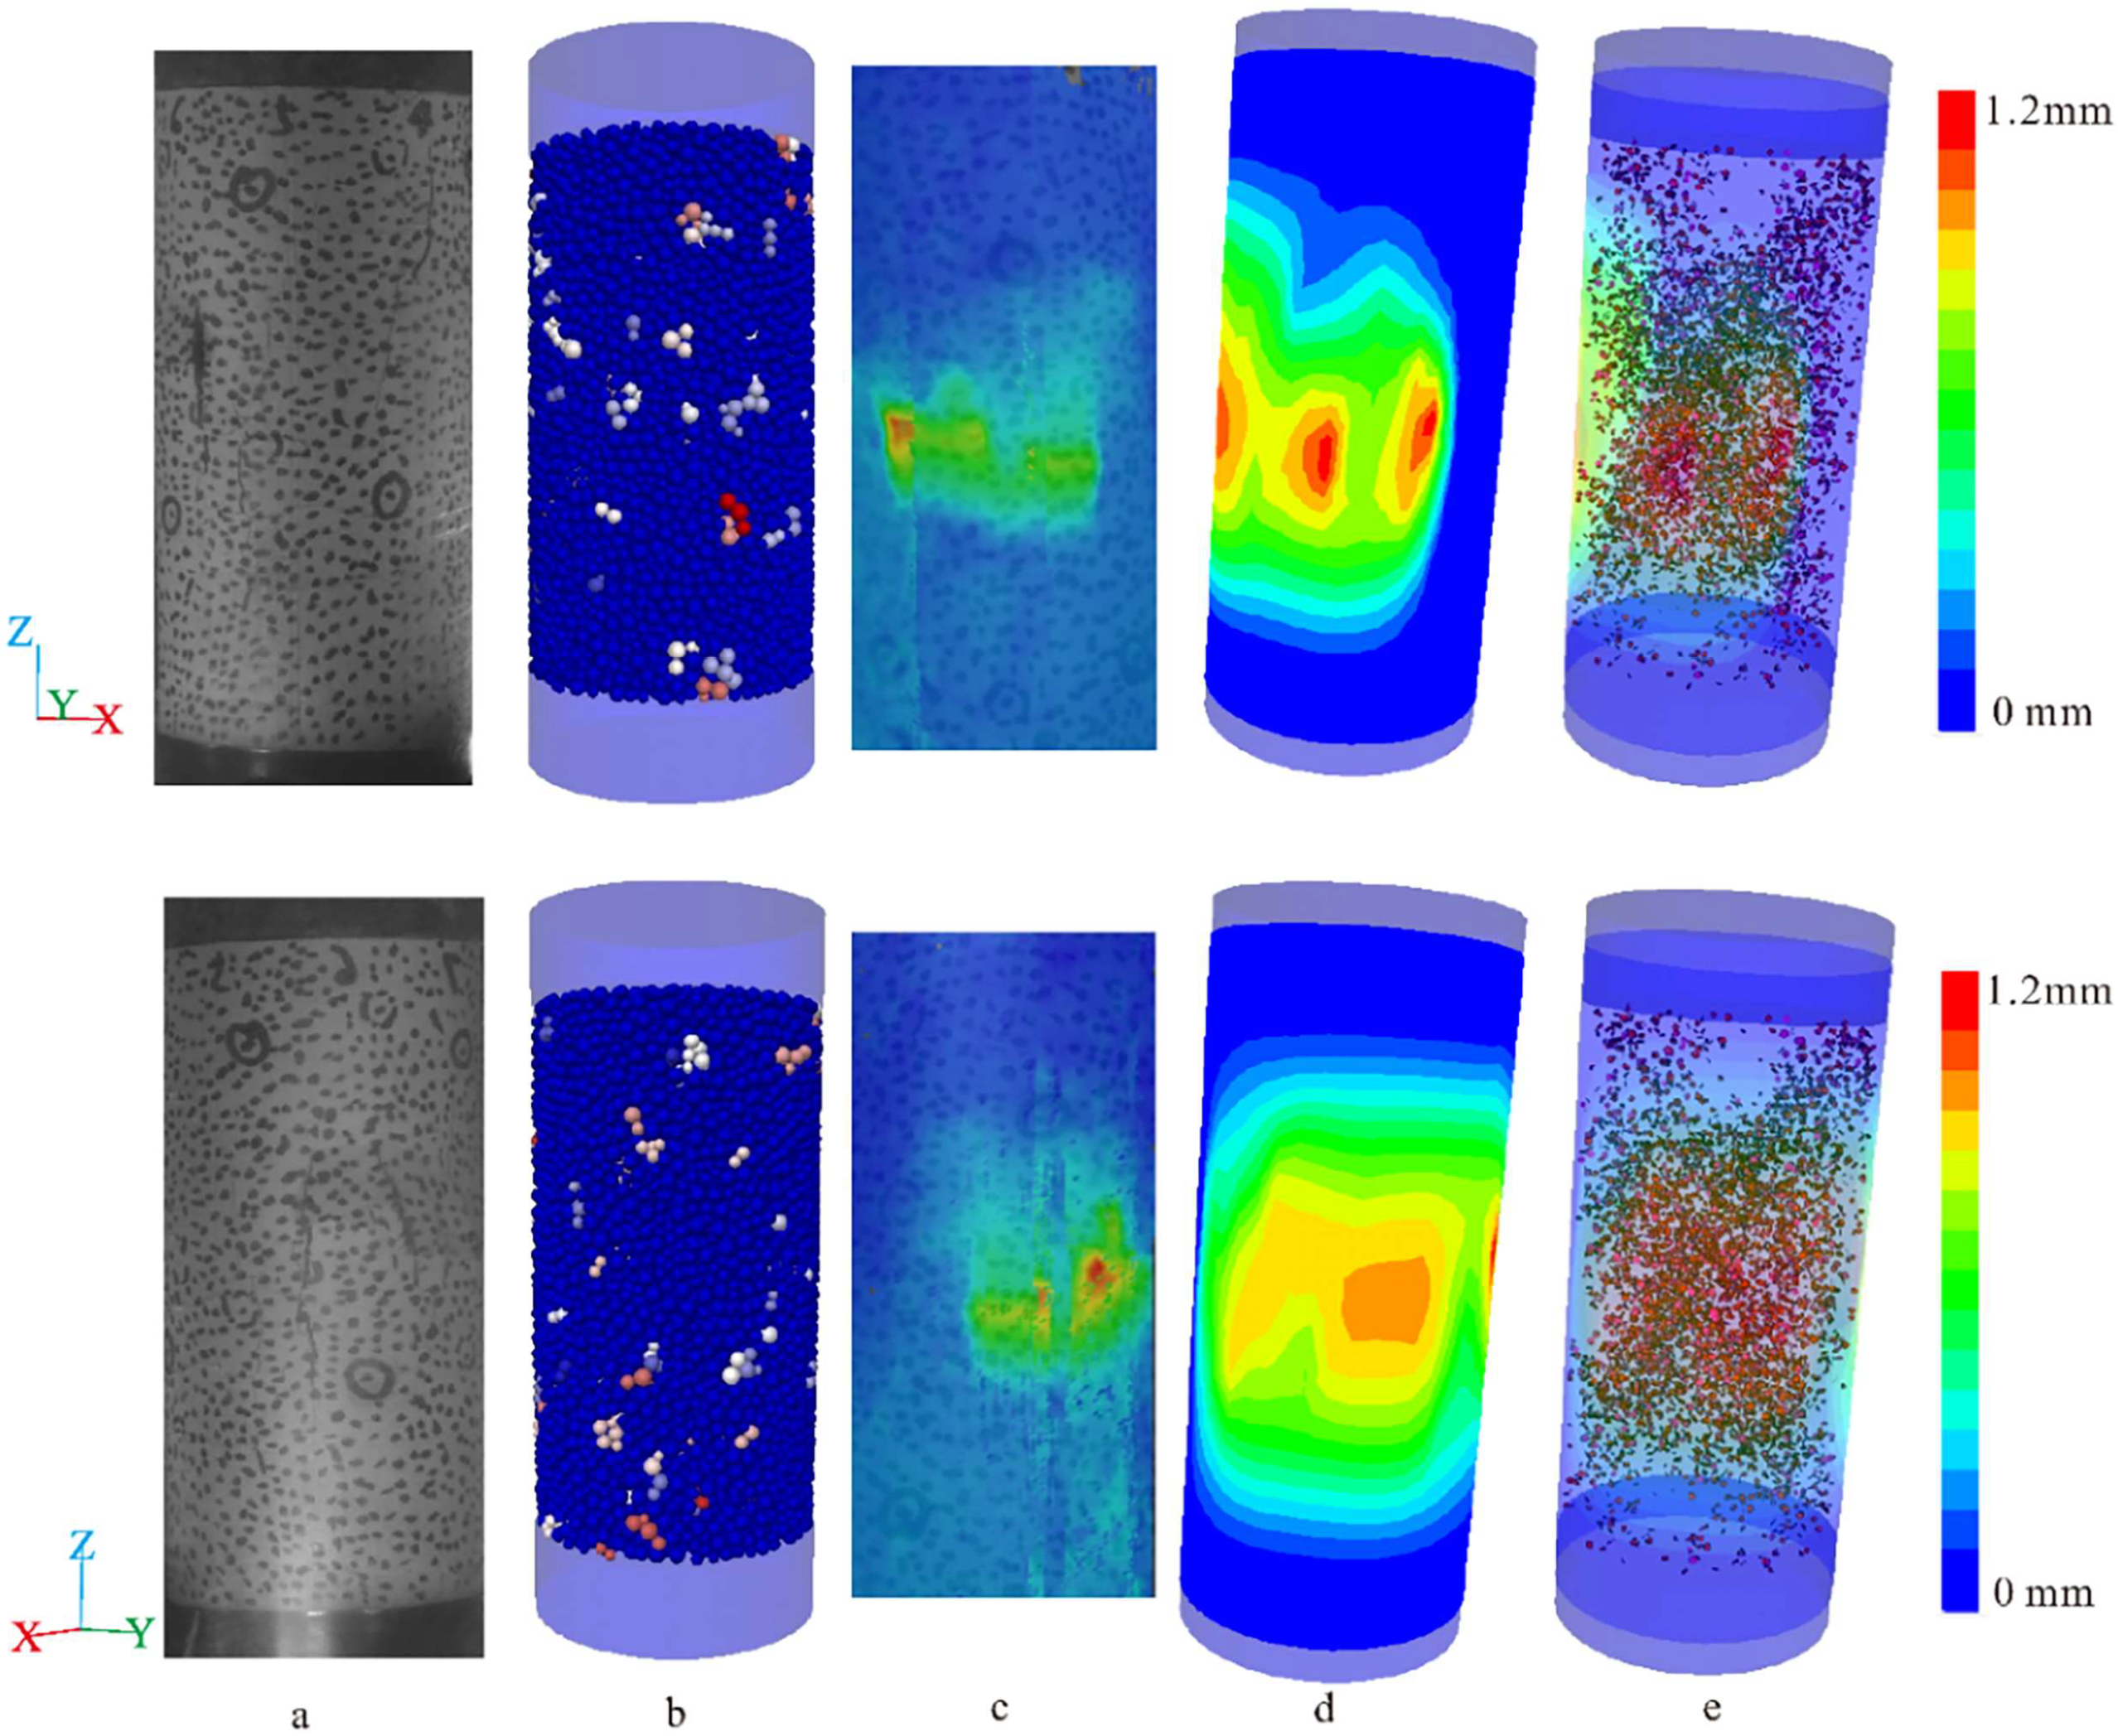
The 3D digital image of the indoor specimen can actually be seen as a film applied on the surface of the red-bed soft rock, and it is the displacement field of this film that is captured. Therefore, this paper adopts an equivalent approach to approximate the whole process of damage in red-bed soft rock.
Figure 15 depicts the results of the coupled tensor–DEM–FEM approach for simulating the rock strain field. These images were captured near the end of the accelerated crack expansion stage. At this point, the large deformation and macroscopic cracks of the red-bed soft rock have been generated. And the displacement field of the FEM film shows a similar pattern to the horizontal displacement field of the same cross-section as the results of the digital image processing technique. Thus, it can be assumed that this coupling method can restore the DIC test process to some extent. It is verified that the tensor–DEM–FEM coupling is in general agreement with the indoor test results.

3.3. Discussion of Research Results

3.3.1. Calibration Method of FJM

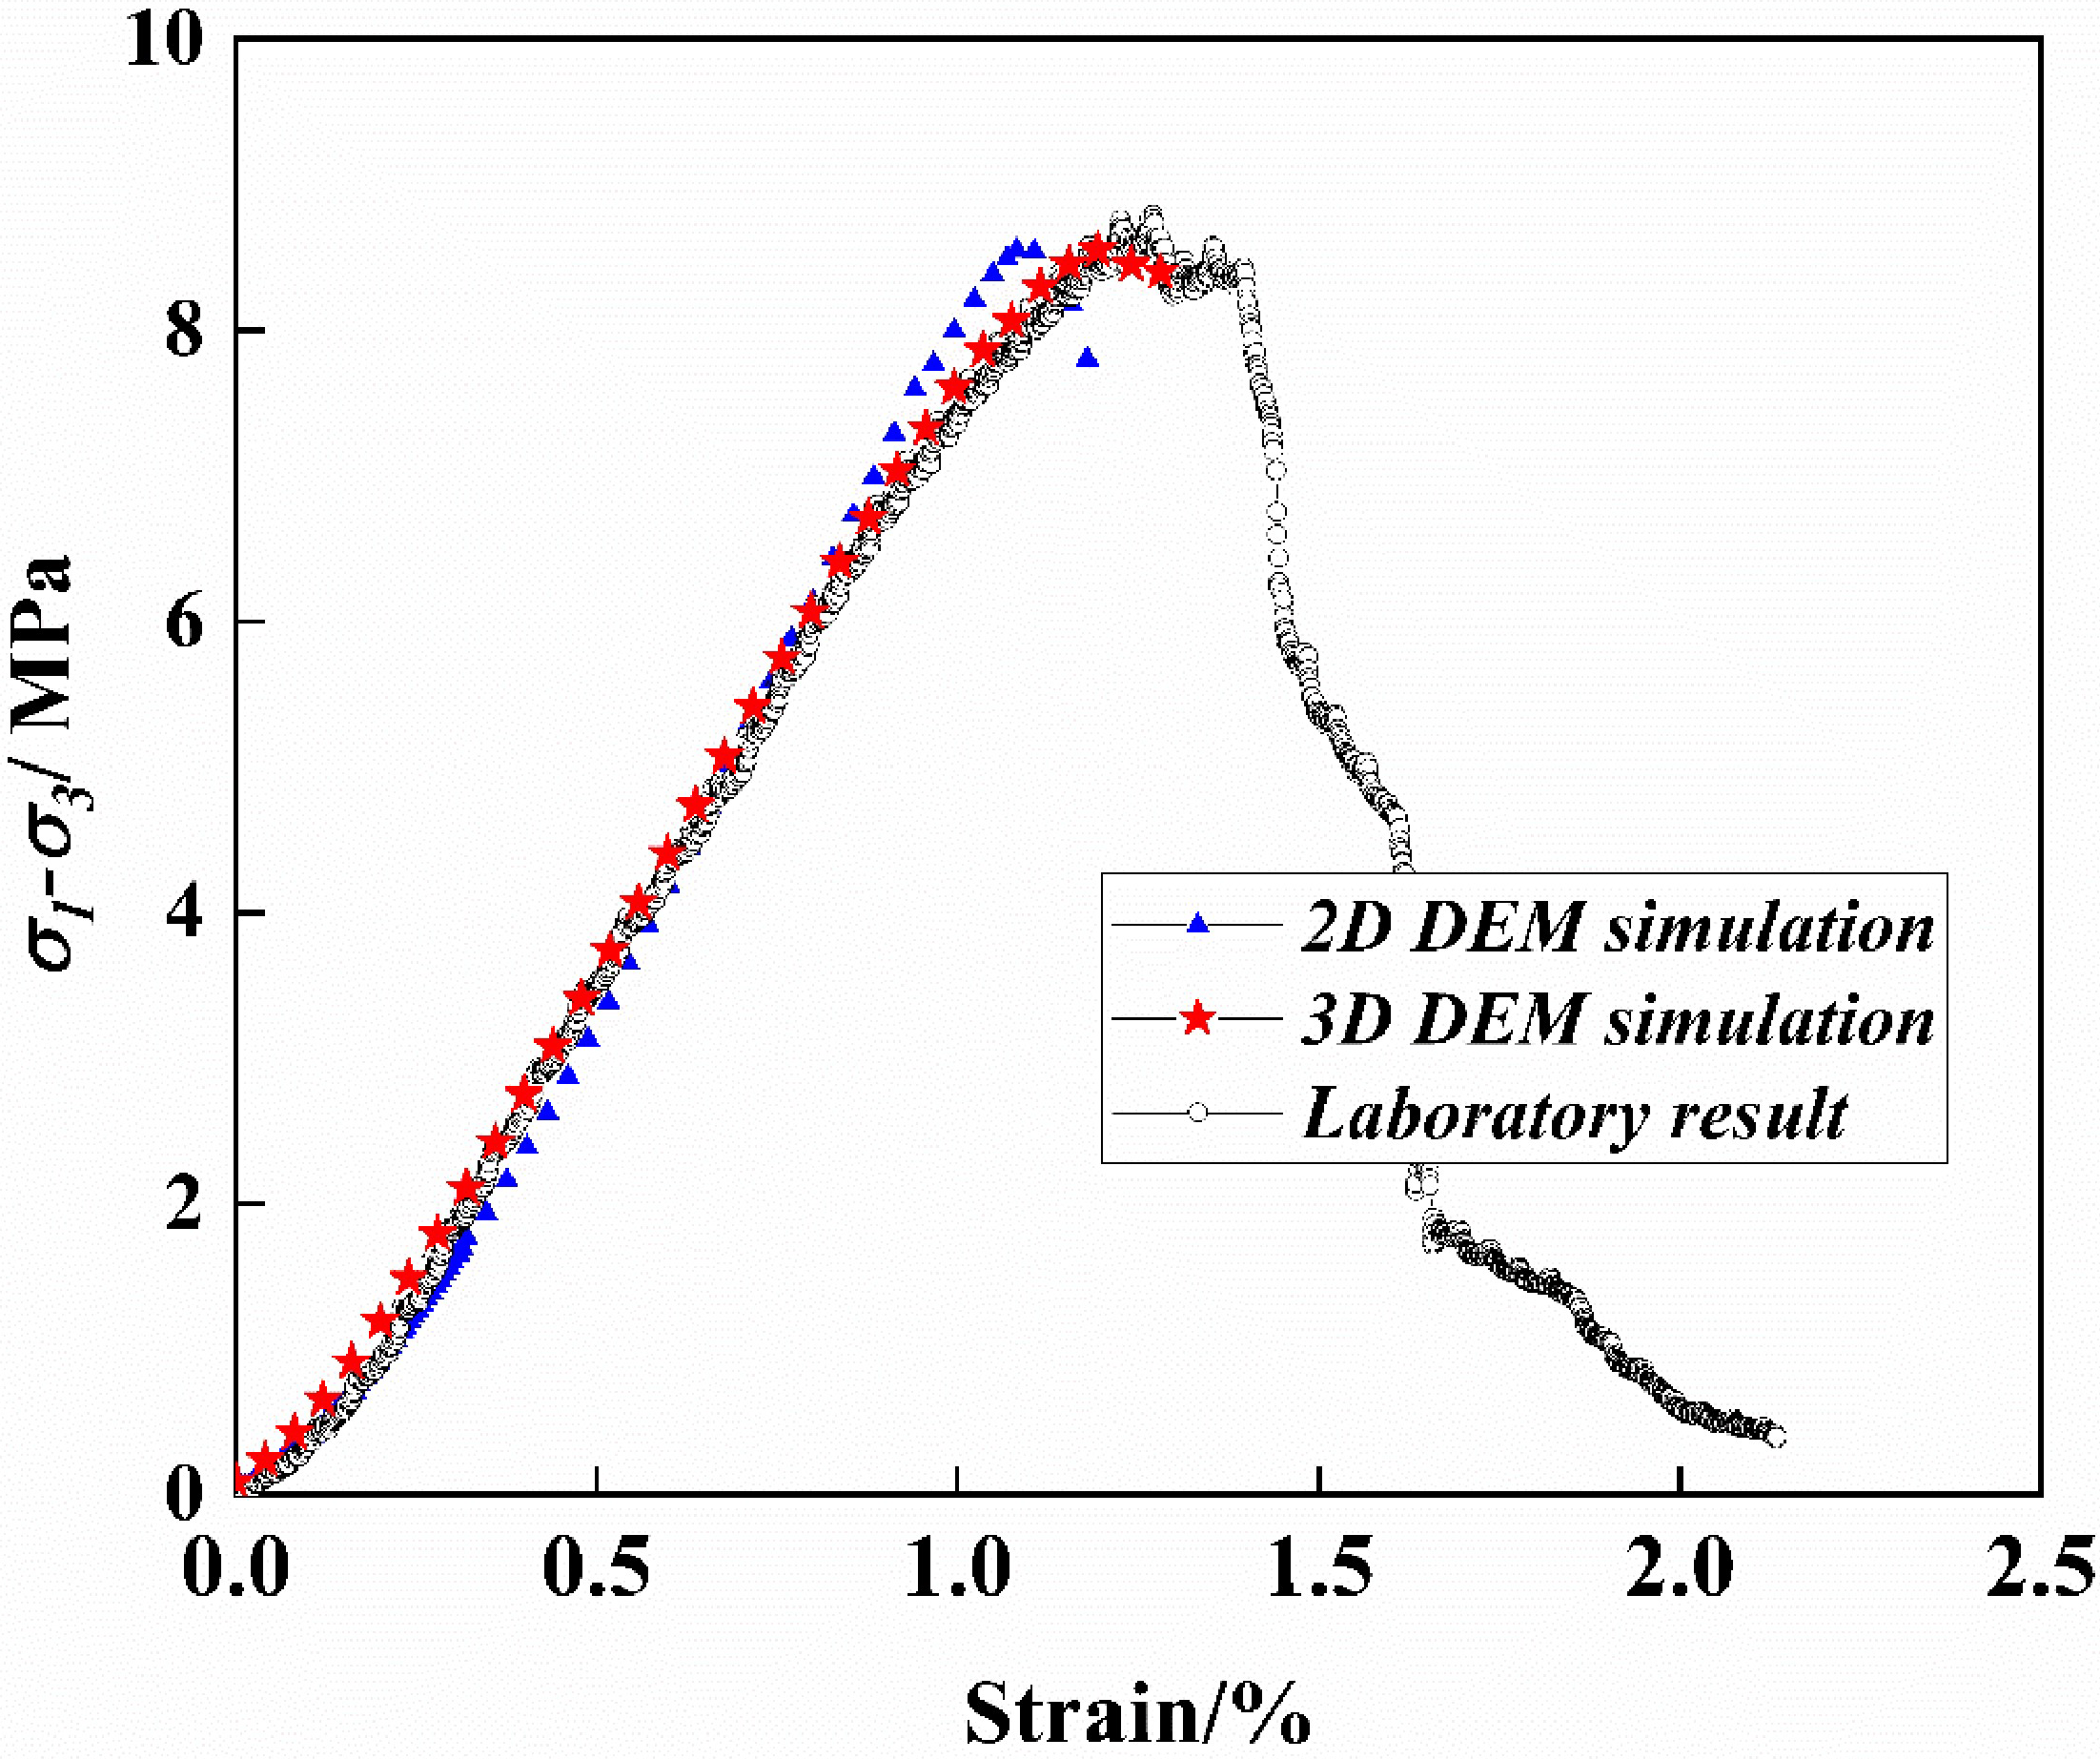
The calibration of the FJM has received little attention, particularly for red-bed soft rocks, whose compression-density phase features make trial-and-error calibration more challenging. The calibrated rock elastic modulus and peak strength are calculated using numerical rock samples that mimic the features of indoor experiments. For that purpose, this work thoroughly covers the process of calibrating red-bed soft rocks with compacted stages using the FJM, as well as providing 2D and 3D methods of calibrating red-bed soft rocks using the FJM.
There are many fine-scale parameters involved in the discrete element, and the calibration process of the parameters affecting the simulation effect will be described in detail in this paper. The model’s size is 500 × 1 00 mm, which is consistent with the indoor test. The simulation accuracy can be ensured when the ratio of model size to particle size is greater than 68 [48] in a 2D case, and the accuracy requirement is satisfied when the number of particles exceeds 15,000 [49] in a 3D case. In this paper, an average particle size of 0.5 mm was chosen, and the ratio of size to particle size was greater than 100, which meets the accuracy requirements. The initial pore parameters are determined by g 0 = ε 0 L / [ ( n 1 ) ( 1 f ) ] , f is the bond ratio, and its ratio is (1 − f ) ; g 0 is the FJM contact surface spacing, L is the specimen length, and n is the average number of particles along the specimen loading axis. The number of initial pores and cracks directly affects E 0 / E . In this paper, L = 100 mm, ε 0 = 2.45 × 10 3 , and n = 143 ; i.e., E 0 / E = 2.848 . The values of g 0 and f are adjusted according to this result. Following this, the final strength parameters are calibrated. The strength calibration process for the flat nodal model is similar to that for the parallel bond model, with the deformation modulus E comparable to the indoor test findings. The selection of the bond strength parameters c determines the macroscopic strength of the red-bed soft rock simulation test; the calibration of this process refers to the method corresponding to the calibration of the discrete element strength parameters [50,51], and the final strength parameters are obtained after certain trial and error steps.
The final 2D and 3D discrete element parameters and indoor experimental parameters in this paper are listed in Table 2 and Table 3, and the final calibration results are shown in Figure 16.

3.3.2. Analysis of the Disaster Damage Index of Red-Bed Soft Rock

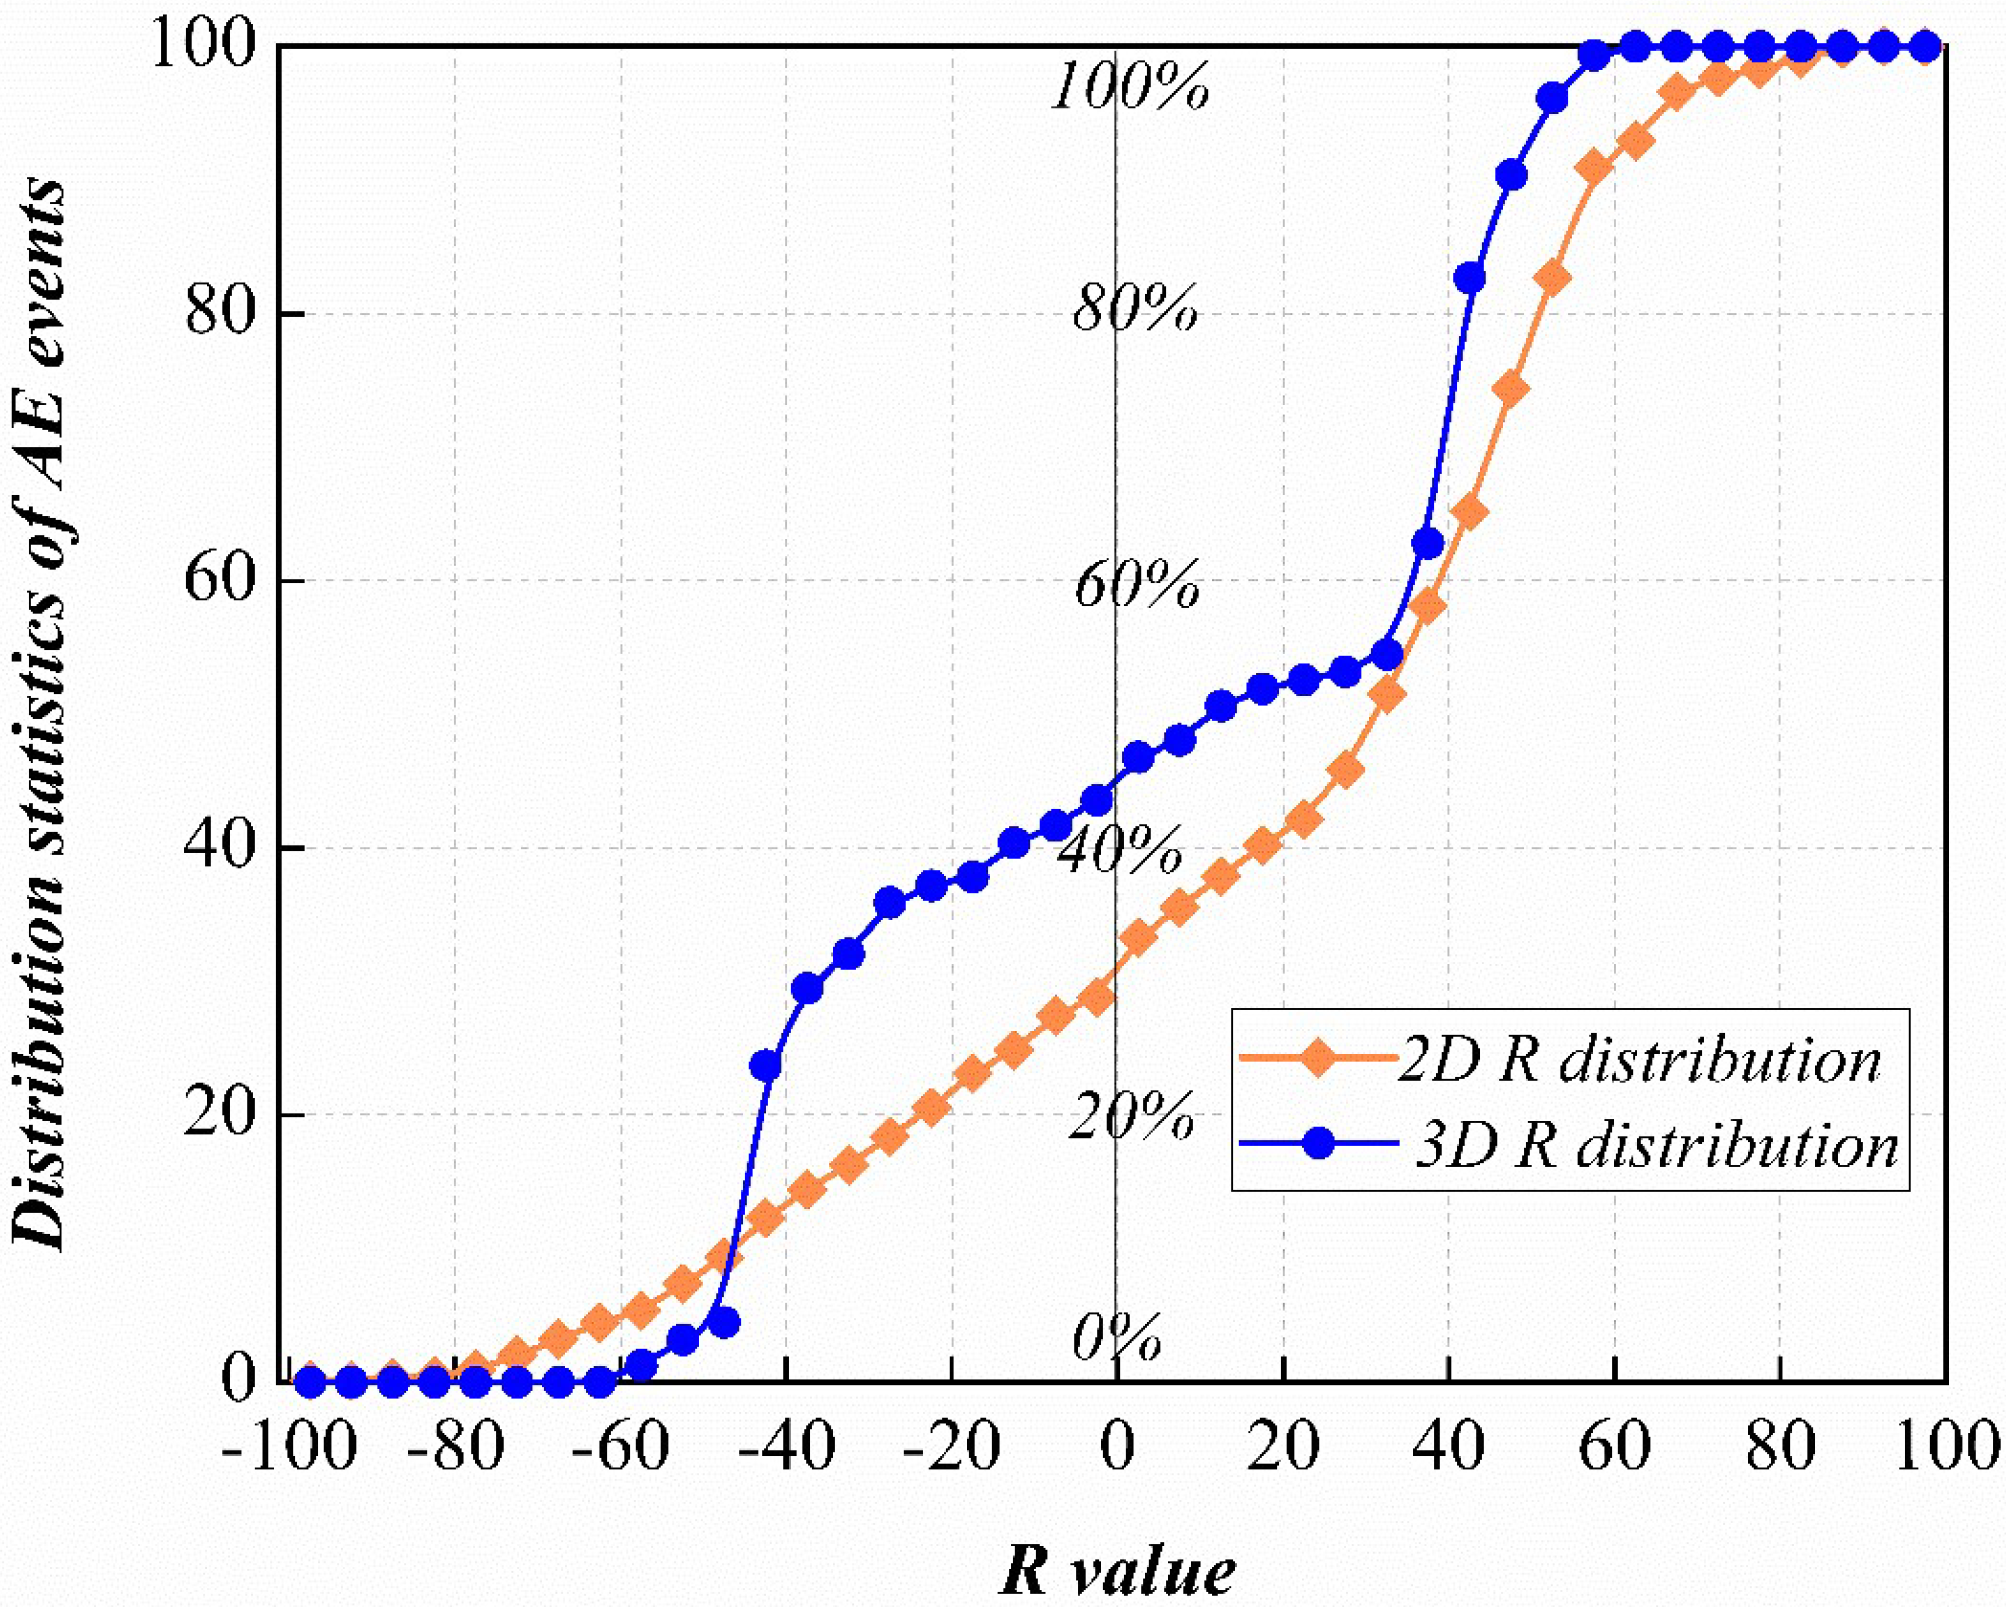
Based on the moment tensor calculation method described above, the moment tensor intensity and R-value acoustic emission metrics were determined for various stages of 2D and 3D DEM. Both metrics reflect information that the PCF’s own tension crack statistics do not capture, such as the R-value, which distinguishes the seismic mechanism of the damage, and the intensity metric, which allows for the analysis of acoustic emission count information and the acoustic emission value (b-value). The G–R criterion proposes that a power series formula can approximate the state of the acoustic emission frequency–intensity distribution:
l o g 10 N = a b M
where M is the acoustic emission intensity mentioned above, and b is the acoustic emission value.
The intensity information of acoustic emission from 2D and 3D DEM was counted, and the frequency distribution of the counts is illustrated in Figure 17a,b, respectively. In the growth phase, the cut modulus fit of the intensity data by Equation (20) produces a b value of 1.22 for the 2D case and 1.74 for the 3D case. According to the plots, the 2D intensity of −7.4 has the highest frequency of acoustic emission, while the 3D intensity of −9.7 has the highest frequency of acoustic emission. The b-value reflects the intensity of the acoustic emission process, i.e., the damage development process. Although the overall acoustic emission intensity modulus is lower in the 3D case, the b-value increases instead, which is caused by the higher contact density of the particles in the 3D case and, thus, the higher frequency of acoustic emission.
The maximum value of the action area in this work is determined at 6 times the particle radius and a single action duration of 40 cycle steps based on the classification of the acoustic emission source information by the R-value presented in Section 2. Figure 18 shows that the R-values of the moment tensor at the time of particle damage under different force states change slightly from those indicated in Section 2.2. The acoustic emission events were tallied individually during 2D and 3D DEM loading, and the damage mechanisms of various types of sources are depicted in Figure 19. The source mechanism analysis demonstrates that the source information of the tensional damage mechanism is most frequently spread during the ultimate disaster; however, the source information of the compressional damage type is least dispersed. This is due to the internal mineral structural properties of the red-bedded chondritic mineral grains, which cause the deformation to be more easily broken along the tangential and normal axes. The 3D compressional damage mechanism has more source information than the 2D case; however, the shear damage mechanism has the least. This is because the self-locking action of mineral particles is more evident in three dimensions, making shear-slip damage more difficult, and the closely packed local particle clusters are more prone to extrusion damage as the stress level increases. Similarly, the damage process of red-bed soft rocks is thought to be primarily regulated by the formation of tension-type fine-view damage. A detailed examination of the final damage state reveals that both shear-type and tension-type fine-scale damage exhibit directionality, implying that the presence of shear damage modifies the final macroscopic fracture morphology.
Figure 20 depicts the results of fitting the probability distribution of R-values for 2D and 3D acoustic emission. The curve mutation in the 2D case occurs only at R = 40, with the remainder of the cases showing uniform growth; the curve in the 3D example exhibits 2 points out of the mutation of −40 and 40, which is consistent with the phenomenon discussed above.
In conclusion, the research method used in this paper can effectively recognize the entire disaster process of red-bed soft rock. It can be used to examine the entire disaster process on red-bed slopes, tunnels, and other projects in order to offer preventive measures. The research material in this work is limited to the red-bed soft rock in the coastal area of South China; however, the research method can also be extended to other fields such as mining.

4. Conclusions

(1)
On the basis of the tensor–DEM–FEM linked model, the whole process of internal fine-scale damage to surface damage in red-bed soft rock was obtained. The early damage occurs in the elastic stage, and the local strain begins to spiral out of control during the crack acceleration stage. Tensile damage information has the highest distribution frequency in the final damage process, indicating that the growth of tensile-type fine-scale damage is primarily controlling the damage process.
(2)
It was found that the overall acoustic emission intensity distribution of the internal microscopic damage and surface damage correlation of red-bed soft rocks is [−8.5, −6.3] in 2D and [−11, −9] in 3D; the highest intensity of acoustic emission frequency is −7.4 in 2D and 1.74 in 3D; the b-value of the damage acceleration feature is 1.22 and 1.74, respectively, in 2D and 3D; and the R-value is mutated in the vicinity of the DIC results, which accord with the results of the indoor test.
(3)
The approach described in this study for estimating and defining the entire process of internal fine-scale damage to surface damage is a new reference for understanding different sorts of rock damage processes that is not confined and may be applied to other fields such as mining.

Author Contributions

Conceptualization, Z.L. and C.Z.; methodology, Z.L.; writing—review and editing, Y.W.; writing—original draft preparation, visualization, C.X.; experiment, G.C.; software, C.X.; validation, Y.W., J.L. and Z.L.; formal analysis, Y.W. and J.L.; investigation, Z.L.; resources, G.C.; data curation, Z.L; supervision, C.Z.; project administration, C.Z.; funding acquisition, C.Z. All authors have read and agreed to the published version of the manuscript.

Funding

The research is supported by the National Natural Science Foundation of China (NSFC) (Grant Numbers: 42293354, 42293351, 42293355, 42277131, and 41977230).

Institutional Review Board Statement

Not applicable.

Informed Consent Statement

Not applicable.

Data Availability Statement

All relevant data are within the manuscript.

Conflicts of Interest

The authors declare no conflict of interest.

References

  1. Liu, Z.; Zhou, C.; Li, B.; Zhang, L.; Liang, Y. Effects of grain dissolution-diffusion sliding and hydro-mechanical interaction on the creep deformation of soft rocks. Acta Geotech. 2020, 15, 1219–1229. [Google Scholar] [CrossRef]
  2. Yu, L.; Lai, H.; Zhou, C.; Liu, Z.; Zhang, L. Percolation Threshold of Red-Bed Soft Rock during Damage and Destruction. Appl. Sci. 2022, 12, 7615. [Google Scholar] [CrossRef]
  3. Xue, Y.; Ma, X.; Qiu, D.; Yang, W.; Li, X.; Kong, F.; Zhou, B.; Qu, C. Analysis of the factors influencing the nonuniform deformation and a deformation prediction model of soft rock tunnels by data mining. Tunn. Undergr. Space Technol. 2021, 109, 103769. [Google Scholar] [CrossRef]
  4. Liu, G.-Y.; Chen, Y.-L.; Du, X.; Azzam, R. A fractional viscoplastic model to predict the time-dependent displacement of deeply buried tunnels in swelling rock. Comput. Geotech. 2021, 129, 103901. [Google Scholar] [CrossRef]
  5. Bruning, T.; Karakus, M.; Nguyen, G.D.; Goodchild, D. An experimental and theoretical stress-strain-damage correlation procedure for constitutive modelling of granite. Int. J. Rock Mech. Min. Sci. 2019, 116, 1–12. [Google Scholar] [CrossRef]
  6. Xia, C.; Zhou, C.; Zhu, F.; Liu, Z.; Cui, G. The Critical Indicator of Red-Bed Soft Rocks in Deterioration Process Induced by Water Basing on Renormalization Group Theory. Appl. Sci. 2021, 11, 7968. [Google Scholar] [CrossRef]
  7. Shirole, D.; Hedayat, A.; Walton, G. Illumination of Damage in Intact Rocks by Ultrasonic Transmission-Reflection and Digital Image Correlation. J. Geophys. Res. Solid Earth 2020, 125, e2020JB019526. [Google Scholar] [CrossRef]
  8. Wevers, M.; Nicolaï, B.; Verboven, P.; Swennen, R.; Roels, S.; Verstrynge, E.; Lomov, S.; Kerckhofs, G.; Van Meerbeek, B.; Mavridou, A.M. Applications of CT for non-destructive testing and materials characterization. In Industrial X-ray Computed Tomography; Springer: Berlin/Heidelberg, Germany, 2018; pp. 267–331. [Google Scholar]
  9. Ju, Y.; Sun, H.; Xing, M.; Wang, X.; Zheng, J. Numerical analysis of the failure process of soil-rock mixtures through computed tomography and PFC3D models. Int. J. Coal Sci. Technol. 2018, 5, 126–141. [Google Scholar] [CrossRef]
  10. Shirole, D.; Walton, G.; Ostrovsky, L.; Masoumi, H.; Hedayat, A. Non-linear ultrasonic monitoring of damage progression in disparate rocks. Int. J. Rock Mech. Min. Sci. 2018, 111, 33–44. [Google Scholar] [CrossRef]
  11. Raziperchikolaee, S.; Alvarado, V.; Yin, S. Quantitative Acoustic Emissions Source Mechanisms Analysis of Soft and Competent Rocks through Micromechanics-Seismicity Coupled Modeling. Int. J. Geomech. 2021, 21, 04020269. [Google Scholar] [CrossRef]
  12. Kim, J.-S.; Kim, G.-Y.; Baik, M.-H.; Finsterle, S.; Cho, G.-C. A new approach for quantitative damage assessment of in-situ rock mass by acoustic emission. Geomech. Eng. 2019, 18, 11–20. [Google Scholar] [CrossRef]
  13. Holmes, J.; Sommacal, S.; Stachurski, Z.; Das, R.; Compston, P. Digital image and volume correlation with X-ray micro-computed tomography for deformation and damage characterisation of woven fibre-reinforced. Compos. Struct. 2022, 279, 114775. [Google Scholar] [CrossRef]
  14. Munoz, H.; Taheri, A.; Chanda, E.K. Pre-Peak and Post-Peak Rock Strain Characteristics During Uniaxial Compression by 3D Digital Image Correlation. Rock Mech. Rock Eng. 2016, 49, 2541–2554. [Google Scholar] [CrossRef]
  15. Lobanov, D.; Yankin, A.; Mullahmetov, M.; Chebotareva, E.; Melnikova, V. The Analysis of Stress Raisers Affecting the GFRP Strength at Quasi-Static and Cyclic Loads by the Theory of Critical Distances, Digital Image Correlation, and Acoustic Emission. Polymers 2023, 15, 2087. [Google Scholar] [CrossRef] [PubMed]
  16. Verstrynge, E.; De Wilder, K.; Drougkas, A.; Voet, E.; Van Balen, K.; Wevers, M. Crack monitoring in historical masonry with distributed strain and acoustic emission sensing techniques. Constr. Build. Mater. 2018, 162, 898–907. [Google Scholar] [CrossRef]
  17. Gong, F.; Zhang, P.; Xu, L. Damage constitutive model of brittle rock under uniaxial compression based on linear energy dissipation law. Int. J. Rock Mech. Min. Sci. 2022, 160, 105273. [Google Scholar] [CrossRef]
  18. Akdag, S.; Karakus, M.; Taheri, A.; Giang, N.; He, M. Effects of Thermal Damage on Strain Burst Mechanism for Brittle Rocks Under True-Triaxial Loading Conditions. Rock Mech. Rock Eng. 2018, 51, 1657–1682. [Google Scholar] [CrossRef]
  19. Sirdesai, N.N.; Singh, A.; Sharma, L.K.; Singh, R.; Singh, T.N. Determination of thermal damage in rock specimen using intelligent techniques. Eng. Geol. 2018, 239, 179–194. [Google Scholar] [CrossRef]
  20. Zhao, Z.; Peng, H.; Wu, W.; Chen, Y.-F. Characteristics of shear-induced asperity degradation of rock fractures and implications for solute retardation. Int. J. Rock Mech. Min. Sci. 2018, 105, 53–61. [Google Scholar] [CrossRef]
  21. Zhou, Z.; Zhao, C.; Cai, X.; Huang, Y. Three-dimensional modeling and analysis of fractal characteristics of rupture source combined acoustic emission and fractal theory. Chaos Solitons Fractals 2022, 160, 112308. [Google Scholar] [CrossRef]
  22. Arson, C. Micro-macro mechanics of damage and healing in rocks. Open Geomech. 2020, 2, 41. [Google Scholar] [CrossRef]
  23. Borrelli, L.; Ciurleo, M.; Gulla, G. Shallow landslide susceptibility assessment in granitic rocks using GIS-based statistical methods: The contribution of the weathering grade map. Landslides 2018, 15, 1127–1142. [Google Scholar] [CrossRef]
  24. Khayrutdinov, M.M.; Kongar-Syuryun, C.B.; Khayrutdinov, A.M.; Tyulyaeva, Y.S. Improving Safety when Extracting Water-soluble Ores by Optimizing the Parameters of the Backfill Mass. Bezop. Tr. V Promyshlennosti 2021, 53–59. [Google Scholar] [CrossRef]
  25. Adigamov, A.; Yudenkov, A. Stress-strain behavior model of disturbed rock mass with regard to anisotropy and discontinuities. Min. Inf. Anal. Bull 2021, 8, 93–103. [Google Scholar] [CrossRef]
  26. Meng, F.; Pu, H.; Sasaoka, T.; Shimada, H.; Liu, S.; Dintwe, T.K.M.; Sha, Z. Time effect and prediction of broken rock bulking coefficient on the base of particle discrete element method. Int. J. Min. Sci. Technol. 2021, 31, 643–651. [Google Scholar] [CrossRef]
  27. Vazaios, I.; Vlachopoulos, N.; Diederichs, M.S. Mechanical analysis and interpretation of excavation damage zone formation around deep tunnels within massive rock masses using hybrid finite-discrete element approach: Case of Atomic Energy of Canada Limited (AECL) Underground Research Laboratory (URL) test tunnel. Can. Geotech. J. 2019, 56, 35–59. [Google Scholar] [CrossRef]
  28. Xia, C.; Liu, Z.; Zhou, C. Burger’s Bonded Model for Distinct Element Simulation of the Multi-Factor Full Creep Process of Soft Rock. J. Mar. Sci. Eng. 2021, 9, 945. [Google Scholar] [CrossRef]
  29. Leclerc, W.; Haddad, H.; Guessasma, M. DEM-FEM coupling method to simulate thermally induced stresses and local damage in composite materials. Int. J. Solids Struct. 2019, 160, 276–292. [Google Scholar] [CrossRef]
  30. Mohammadnejad, M.; Dehkhoda, S.; Fukuda, D.; Liu, H.; Chan, A. GPGPU-parallelised hybrid finite-discrete element modelling of rock chipping and fragmentation process in mechanical cutting. J. Rock Mech. Geotech. Eng. 2020, 12, 310–325. [Google Scholar] [CrossRef]
  31. Saadat, M.; Taheri, A. A cohesive discrete element based approach to characterizing the shear behavior of cohesive soil and clay-infilled rock joints. Comput. Geotech. 2019, 114, 103109. [Google Scholar] [CrossRef]
  32. Gutierrez-Ch, J.G.; Senent, S.; Estebanez, E.; Jimenez, R. Discrete element modelling of rock creep behaviour using rate process theory. Can. Geotech. J. 2021, 58, 1231–1246. [Google Scholar] [CrossRef]
  33. Oladele, T.; Bbosa, L.; Weatherley, D. Textural and Mineralogical Controls on Rock Strength Elucidated Using a Discrete Element Method Numerical Laboratory. Minerals 2021, 11, 1015. [Google Scholar] [CrossRef]
  34. Lin, C.; Xia, C.; Zhang, H.; Liu, Z.; Zhou, C. Simulated Short- and Long-Term Deformation in Coastal Karst Caves. J. Mar. Sci. Eng. 2022, 10, 1315. [Google Scholar] [CrossRef]
  35. Lin, C.; Xia, C.; Liu, Z.; Zhou, C. A Comprehensive Correlation Study of Structured Soils in Coastal Area of South China about Structural Characteristics. J. Mar. Sci. Eng. 2022, 10, 508. [Google Scholar] [CrossRef]
  36. Saadat, M.; Taheri, A. A cohesive grain based model to simulate shear behaviour of rock joints with asperity damage in polycrystalline rock. Comput. Geotech. 2020, 117, 103254. [Google Scholar] [CrossRef]
  37. Yang, X.-X.; Qiao, W.-G. Numerical investigation of the shear behavior of granite materials containing discontinuous joints by utilizing the flat-joint model. Comput. Geotech. 2018, 104, 69–80. [Google Scholar] [CrossRef]
  38. Cheng, A.; Shu, P.; Deng, D.; Zhou, C.; Huang, S.; Ye, Z. Microscopic acoustic emission simulation and fracture mechanism of cemented tailings backfill based on moment tensor theory. Constr. Build. Mater. 2021, 308, 125069. [Google Scholar] [CrossRef]
  39. Zhao, Y.; Zhao, G.; Zhou, J.; Ma, J.; Cai, X. Failure mechanism analysis of rock in particle discrete element method simulation based on moment tensors. Comput. Geotech. 2021, 136, 104215. [Google Scholar] [CrossRef]
  40. Gilbert, F. A Discussion on the measurement and interpretation of changes of strain in the Earth-Derivation of source parameters from low-frequency spectra. Philos. Trans. R. Soc. A Math. Phys. Eng. Sci. 1973, 274, 369–371. [Google Scholar] [CrossRef]
  41. Feignier, B.; Young, R.P. Moment tensor inversion of induced microseismic events: Evidence of non-shear failures in the -4 < M < -2 moment magnitude range. Geophys. Res. Lett. 1992, 19, 1503–1506. [Google Scholar] [CrossRef]
  42. Ohtsu, M. Acoustic emission theory for moment tensor analysis. Res. Nondestruct. Eval. 1995, 6, 169–184. [Google Scholar] [CrossRef]
  43. Kongar-Syuryun, C.; Ubysz, A.; Faradzhov, V. Models and algorithms of choice of development technology of deposits when selecting the composition of the backfilling mixture. IOP Conf. Ser. Earth Environ. Sci. 2021, 684, 012008. [Google Scholar] [CrossRef]
  44. Xia, C.; Liu, Z.; Zhou, C.; Zhang, L. A Meso/Macroscale Theoretical Model for Investigating the Large Deformation of Soft Rock Tunnels Considering Creep and Anisotropic Effects. Rock Mech. Rock Eng. 2023, 56, 4901–4922. [Google Scholar] [CrossRef]
  45. Meng, Q.X.; Wang, H.L.; Xu, W.Y.; Cai, M.; Xu, J.; Zhang, Q. Multiscale strength reduction method for heterogeneous slope using hierarchical FEM/DEM modeling. Comput. Geotech. 2019, 115, 103164. [Google Scholar] [CrossRef]
  46. Chaudry, M.A.; Woitzik, C.; Duster, A.; Wriggers, P. A multiscale DEM-FEM coupled approach for the investigation of granules as crash-absorber in ship building. Comput. Part. Mech. 2022, 9, 179–197. [Google Scholar] [CrossRef]
  47. Zhou, Q.; Xu, W.-J.; Lubbe, R. Multi-scale mechanics of sand based on FEM-DEM coupling method. Powder Technol. 2021, 380, 394–407. [Google Scholar] [CrossRef]
  48. Cheng, Y.; Wong, L.N.Y. A study on mechanical properties and fracturing behavior of Carrara marble with the flat-jointed model. Int. J. Numer. Anal. Methods Geomech. 2020, 44, 803–822. [Google Scholar] [CrossRef]
  49. Li, B.; Guo, L.; Zhang, F.-s. Macro-micro investigation of granular materials in torsional shear test. J. Cent. South Univ. 2014, 21, 2950–2961. [Google Scholar] [CrossRef]
  50. Rong, H.; Li, G.; Liang, D.; Sun, C.; Zhang, S.; Sun, Y. Numerical Investigation on the Evolution of Mechanical Properties of Rock Affected by Micro-Parameters. Appl. Sci. 2020, 10, 4957. [Google Scholar] [CrossRef]
  51. Rybak, J.M.; Kongar-Syuryun, C.; Tyulyaeva, Y.; Khayrutdinov, A.M.; Akinshin, I. Geomechanical substantiation of parameters of technology for mining salt deposits with a backfill. Min. Sci. 2021, 28, 19–32. [Google Scholar] [CrossRef]
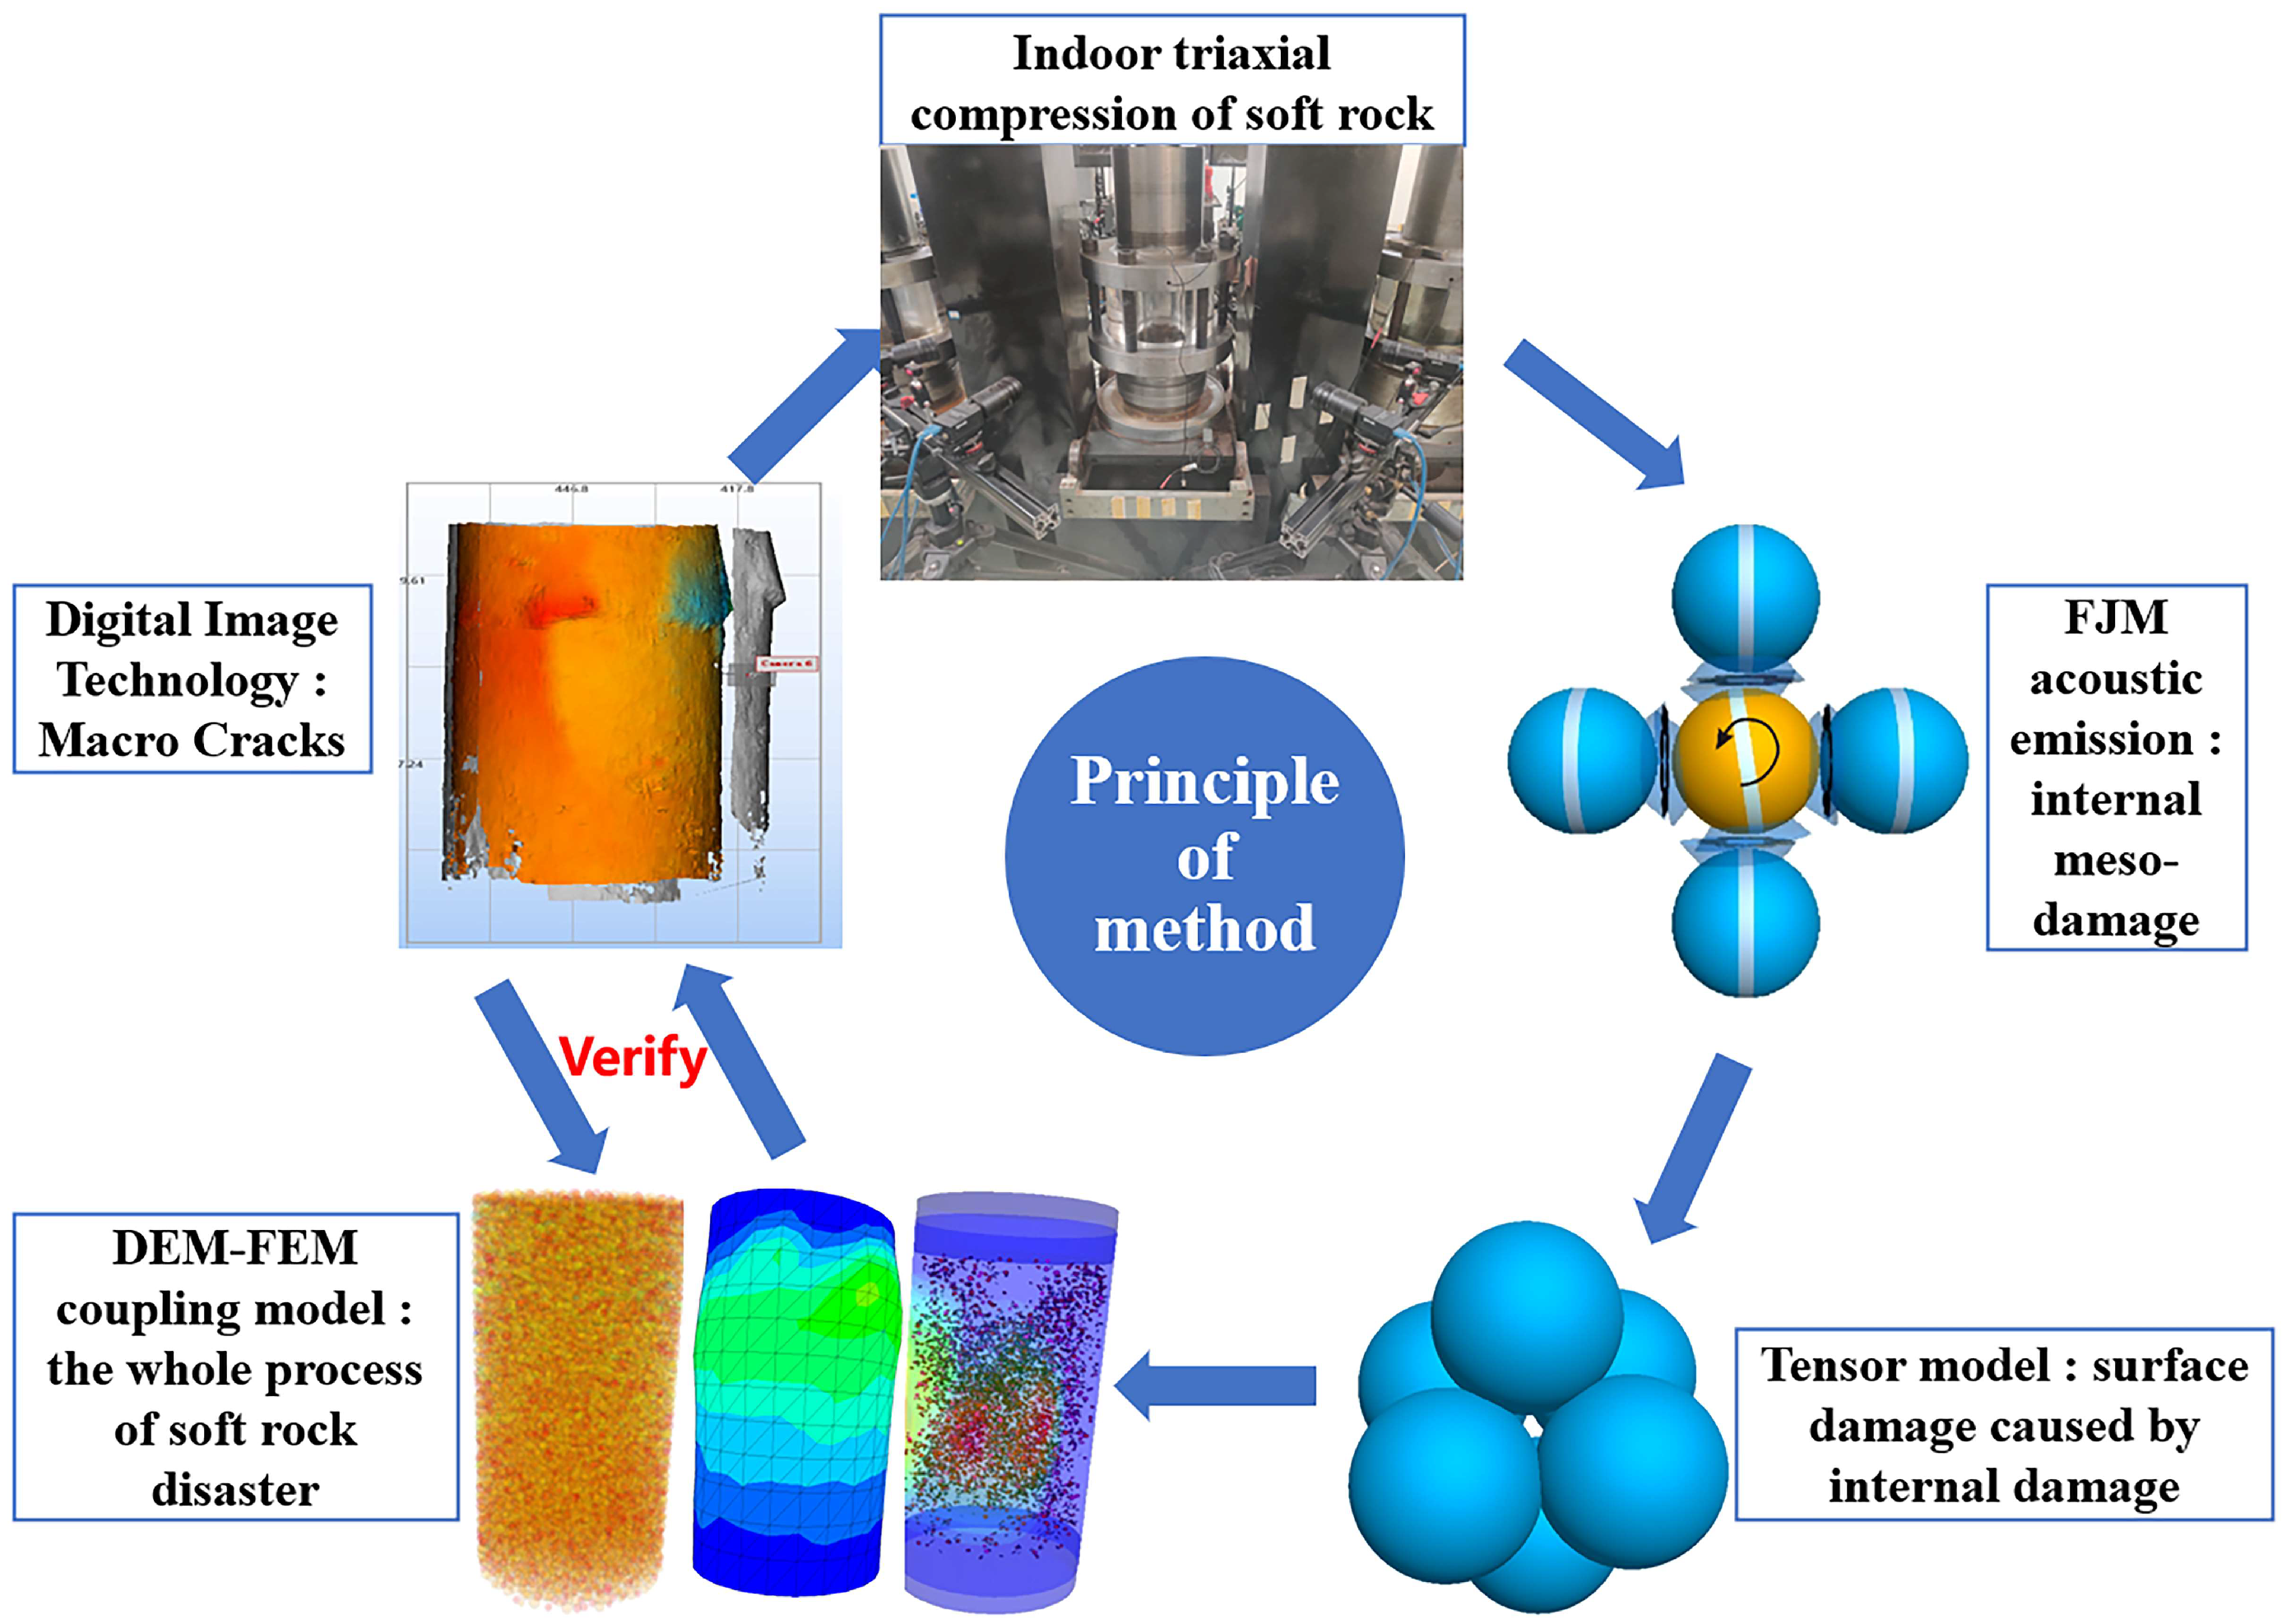
Figure 1. Principle diagram of the research method for whole period characteristics of the red-bed soft rock disaster.
Jmse 11 01542 g001
Figure 2. Multifield coupling damages the whole process in a high-spatial-temporal-resolution 3D visualization test system.
Jmse 11 01542 g002
Figure 3. Soft rock deformation process diagram.
Jmse 11 01542 g003
Figure 4. FJM and its damage judgment diagram.
Jmse 11 01542 g004
Figure 5. Three common failure states in source analysis.
Jmse 11 01542 g005
Figure 6. Spatial diagram of particle contact force.
Jmse 11 01542 g006
Figure 7. DEM–FEM coupling process diagram.
Jmse 11 01542 g007
Figure 8. Stress-strain curve of red-bed soft rock in the loading process and division of different stages.
Jmse 11 01542 g008
Figure 9. Surface crack propagation in red-bed soft rock disaster processes (A): stage 1; (B): stage 2; (C): stage 3; (D): stage 4; (E): stage 5; (F): stage 6.
Jmse 11 01542 g009
Figure 10. Evolution of the surface displacement field in the red-bed soft rock disaster process: (a) Two dimensions; (b) Three-dimensions ((A): stage 1; (B): stage 2; (C): stage 3; (D): stage 4; (E): stage 5; (F): stage 6).
Jmse 11 01542 g010
Figure 11. Statistics of variance differentiation of pre peak strain.
Jmse 11 01542 g011
Figure 12. Acoustic emission intensity statistics at different stages: (a) 2D DEM; (b) 3D DEM.
Jmse 11 01542 g012aJmse 11 01542 g012b
Figure 13. Spatial columnar statistics of contact force and contact density: (a) Contact force tensor; (b) Contact density tensor.
Jmse 11 01542 g013
Figure 14. Variation in anisotropic parameters.
Jmse 11 01542 g014
Figure 15. DEM–FEM coupled simulation of DIC strain field results: (a) Indoor rock specimen; (b) Discrete element specimen; (c) 2D digital image; (d) DEM–FEM coupled membrane; (e) DEM–FEM coupled damage.
Jmse 11 01542 g015
Figure 16. Two-dimensional and three-dimensional calibration results of the discrete element test.
Jmse 11 01542 g016
Figure 17. Acoustic emission count and b value: (a) 2D DEM; (b) 3D DEM.
Jmse 11 01542 g017
Figure 18. Stress diagram and R-value of three failure states in discrete element.
Jmse 11 01542 g018
Figure 19. Acoustic emission R-value and its type statistics in different stages: (a) 2D DEM; (b) 3D DEM.
Jmse 11 01542 g019aJmse 11 01542 g019b
Figure 20. Distribution probability statistical curve of R-value.
Jmse 11 01542 g020
Table 1. Three common source moment tensor forms and R-values.
Failure MechanismmR
Compression m 0 0 −42.86
Pure shear 0 0 0 0
Tension m 0 0 42.86
Table 2. Main mechanical parameters in a discrete-element two-dimensional model.
Test Sample2D DEM Sample
Strength/MPaE/MPaE0/MPa σ t /MPa Cohesion/MPaFriction Anglek RatiouDamp RatioWidth/mmHeight/mmMean Radius/mm
8.9974342612201.20.30.5501000.42
Table 3. Main mechanical parameters in a discrete-element three-dimensional model.
Test Sample3D DEM Sample
Strength/MPaE/MPaE0/MPa σ t /MPa Cohesion/MPaFriction Anglek RatiouDamp RatioWidth/mmHeight/mmMean Radius/mm
8.99743422640201.20.30.5501000.81
Disclaimer/Publisher’s Note: The statements, opinions and data contained in all publications are solely those of the individual author(s) and contributor(s) and not of MDPI and/or the editor(s). MDPI and/or the editor(s) disclaim responsibility for any injury to people or property resulting from any ideas, methods, instructions or products referred to in the content.