Article

The Effect of Oleic Acid-Enriched Diet in Hybrid Groupers (Epinephelus fuscoguttatus × Epinephelus lanceolatus) upon Infection with Vibrio vulnificus Using an LC-qTOF-MS Approach

by
Maya Erna Natnan
1,
Chen-Fei Low
1,
Chou-Min Chong
2,
Wanilada Rungrassamee
3 and
Syarul Nataqain Baharum
1,*
1
Metabolomics Research Laboratory, Institute of Systems Biology (INBIOSIS), Universiti Kebangsaan Malaysia, Bangi 43600, Selangor, Malaysia
2
Laboratory of Immunogenomics, Department of Aquaculture, Faculty of Agriculture, Universiti Putra Malaysia, Serdang 43400, Selangor, Malaysia
3
National Center for Genetic Engineering and Biotechnology, National Science and Technology Development Agency, 111 Thailand Science Park, Phahonyothin Rd. Khlong Luang, Pathum Thani 12120, Thailand
*
Author to whom correspondence should be addressed.
J. Mar. Sci. Eng. 2023, 11(8), 1563; https://doi.org/10.3390/jmse11081563
Submission received: 13 June 2023 / Revised: 11 July 2023 / Accepted: 11 July 2023 / Published: 7 August 2023
(This article belongs to the Special Issue Nutrition and Immunity for Sustainable Marine Aquaculture Development)

Abstract

:
The aim of this study was to evaluate the impact of oleic acid supplements on the liver metabolome of hybrid grouper fingerlings (Epinephelus fuscoguttatus × Epinephelus lanceolatus) challenged with Vibrio vulnificus. Oleic acid was used as a fish feed supplement because it has been reported to enhance the immune response of fish. After six weeks of feeding trials with the control and experimental diets (oleic acid immunostimulant), 10 fish were randomly selected from each treatment and challenged with V. vulnificus by immersion for 30 min. After seven days of post-bacterial challenge, the liver samples of surviving infected groupers were dissected and used for metabolomics fingerprinting using liquid chromatography coupled with quadrupole time-of-flight mass spectrometry (LC-qTOF-MS). The results were then analyzed using MetaboAnalyst 5.0 and SIMCA+P software. From the analyses conducted, out of 639 primary metabolites detected, a total of 66 metabolites were significantly identified from the liver samples of grouper fed control and oleic acid diets. Further analysis also showed that the control and oleic acid diets have significantly different metabolites by the discriminating clustering of samples based on the PLS-DA analysis. Based on the Kyoto Encyclopedia of Genes and Genomes (KEGG) pathway enrichment analysis, the known metabolites pathways with high impact values are alanine, aspartate, and glutamate metabolism (0.13) followed by purine metabolism pathways (0.05). Moreover, out of these highly impacted metabolic pathways, L-glutamine (8.71%), L-lysine (4.05%), L-carnitine (11.53%), and inosine (10.49%) were the several metabolites that were highly abundant in the liver sample of surviving infected hybrid groupers fed with dietary oleic acid. The changes of metabolites contributed to improving the immune system of the fish. Thus, our results advance our understanding of the immunological regulation of the hybrid groupers’ immune response toward oleic acid immunostimulants against Vibrio infection.

1. Introduction

Groupers are among the most popular marine finfish that are captured and cultured in the entire East Asian region. As a consequence of this high demand for grouper products, the prices and capture pressure on groupers are substantially elevated [1]. Moreover, the rapid growth of hybrid grouper farming as compared to other grouper farming is due to the high sale prices, stable market demand, and fast growth rate which contributes significantly to the aquaculture sector and local communities’ economy. Unfortunately, the rapid increase in grouper farming makes it challenging for farmers to maintain good aquacultural practices. One of the most important concerns is the change in their rearing system from extensive to superintensive farming, which ultimately causes groupers to be more easily exposed to diseases [2,3]. Bacterial infection is one of the major causes of fish mortality. Vibriosis caused by Vibrio sp. bacteria have been reported to affect not only marine fish but also shellfish. According to the recent survey by Chong et al. [4], vibriosis outbreaks make up approximately 66.7% of the total diseases in grouper spp., with a mortality rate that might reach up to 50% [5,6]. In Malaysia, Vibrio vulnificus (33%) has been identified to be among the most prevalent Vibrio sp. that occur among grouper fish on Malaysia aquaculture farms, followed by Vibrio alginolyticus (24%) and Vibrio parahaemolyticus (22%) [7]. Common symptoms include lethargy, hemorrhagic lesions on the skin, gill necrosis, popping eyes, ulcerative skin lesions, abnormal swimming, and darkened skin [3].
In current practices, antibiotics have been used widely in preventing bacterial infection. Some antibiotics, such as chloramphenicol, florfenicol, oxolinic acid, and streptomycin, are among the most common antibiotics used for treating vibriosis [8]. However, the rampant use of these antibiotics has caused bacteria to become resistant, and antibiotics are no longer effective. Immunostimulants are substances, either natural or synthetic, that can be used to stimulate the immune response of organisms by inducing or increasing the functions of any of their components involving immune mechanisms such as stimulating macrophages in catfish [9,10], overexpression of cathelicidins and cytokine IL-1β in rainbow trout [11], and elevated TNF-α and IL-1β levels in Oreochromis niloticus [12]. A study by Guluarte et al. [13] determined that a probiotic from yeast, Kluyveromyces lactis M3 with the dominant fatty acids including oleic acid, linoleic acid, palmitic acid, and palmitoleic acid, showed immunostimulant activities in gilthead seabream, Sparus aurata, after probiotic dietary supplementation. In another study, the injection of fatty acids identified as hexadecanoic acid and 13-octadecenoic acid from starfish (Acantaster planci) into catfish (Clarias sp.) can prevent any Aeromonas hydrophila infection [9]. From these studies, we can verify that fatty acids could be considered an appropriate immunostimulant that was able to increase the fish immune system.
The use of advanced technologies such as omics approaches has become a powerful tool in life science research, including fish studies. Metabolomics is among other omics studies including genomics, transcriptomics, and proteomics that use high-advance tools to better understand the molecular mechanisms of the fish immune system [14]. A study by Du et al. [15] using a metabolomics approach enabled them to identify two metabolites, namely, serine and proline, that play a crucial role in eliminating Streptococcus iniae in tilapia. Other studies on fish disease while emphasizing the use of metabolomics approaches can be reported on several other fish species, including grouper [16], Atlantic salmon [17], zebrafish [18], and rainbow trout [19]. A review paper has also been published discussing the current knowledge of metabolomic approaches not only in dealing with the impacts, challenges, and limitations of fish disease studies, but also the potential of these new therapeutic strategies to enhance fish disease resistance [20].
Our study is an extension of our earlier reported study [21], where we concluded that the dietary oleic acid showed the most promising result in elevating immune response activation. In this study, the livers of surviving hybrid groupers fed control and oleic acid-formulated diets were analyzed to elucidate the metabolic adaptation after Vibrio challenge. An untargeted metabolomics analysis using liquid chromatography (LC) attached to a quadrupole time of flight mass spectrometer (qTOF-MS) detector was used to detect and identify metabolome changes based on their mass-to-charge ratio of hybrid grouper immune organs involved in immune defense mechanisms due to V. vulnificus infection after hybrid grouper fed with oleic acid-enriched formulation diet.

2. Materials and Methods

The rearing of fish and experimental procedures were carried out at the Hatchery Unit, Institute of Bioscience, Universiti Putra Malaysia (UPM) in accordance with the Guidelines and Regulation for Experimental Animals approved by the Universiti Kebangsaan Malaysia Animal Ethical Committee (UKMAEC) (IBC/Ack/2/2019). The current metabolomics study is an extension of our previous study [21], and the sample source was acquired from an earlier study, as mentioned in Section 2.1, Section 2.2, Section 2.3 and Section 2.4.

2.1. Diet Preparation

The fish diet formulation was from Natnan et al. [21]. The fatty acid formulated diet was prepared to contain an equal amount of oleic acid (2%), while the control formulated diet was prepared without the addition of oleic acid. Soybean meal and fish meal were used as the main protein sources, while vegetable oil from commercial corn oil was used as the main lipid source (total lipid was 0.91 g/mL and omega-6 was 0.486 g/mL). Dry ingredients such as soybean meal, fish meal, corn flour, vitamin mixture, and mineral mixture were mixed thoroughly for 30 min. After 30 min, wet ingredients including vegetable oil and distilled water were added and mixed for an additional 30 min. The mixture was then extruded through a mincer (3 mm die hole). The resultant strands were cut into 3 mm x 5 mm pellets before oven-drying at 45 °C overnight. The feed was then kept in an airtight container and stored at −20 °C. The formulation diet (%) can be found in Table 1. The proximate composition of the experimental diets and composition profile of fatty acid were measured according to the 20th Edition of the Association of Official Analytical Chemists (AOAC) (Table 2).

2.2. Experimental Design

Hybrid grouper fingerlings (E. fuscoguttatus × E. lanceolatus) with lengths of approximately 8–10 cm were obtained from the local hatchery farm of Pantai Dasar Sabak, Kota Bahru, Kelantan. Acclimatization of the fish was performed in the experimental facilities at the Hatchery Unit, Institute of Bioscience, Universiti Putra Malaysia. After initial acclimation for one week in a 1000 L fiberglass tank filled with filtered seawater, a total of 90 healthy fish were equally assigned to six glass aquaria. Further acclimatization was carried out for another five days before the fish were fed their respective feeding diets. During the acclimation period, fish were fed commercial fish feed provided by the farm. The fish feed formulation included the addition of oleic acid to the formulated diet, while the control diet was without the addition of any immunostimulant. The feeding regime was carried out for six weeks, where the fish were fed twice daily at 9:00 a.m. and 4:00 p.m., with feeding rates of 4% of body weight per day throughout the experiment duration. During the experiment, the fish were supplied with aeration, and the water quality was maintained by exchanging seawater at approximately 50% of the volume every two days. Water quality parameters such as temperature (28.0 ± 1 °C), salinity (30 ± 1 ppt), and pH (8.0 ± 1) were also maintained during the feeding experiment. The uneaten feed was removed after each feeding. The experiment was performed in triplicate.

2.3. Bacterial Culture

The V. vulnificus was primarily isolated from grouper fish infected with vibriosis [22]. Bacterial culture conditions were carried out as described in our previous study [21]. Briefly, from the glycerol stock, the bacteria were revived on thiosulfate citrate bile salt sucrose (TCBS) agar plates with the addition of 1.2% NaCl. The agar plates were incubated at 30 °C for 18–24 h before the isolated bacteria were subcultured in tryptic soy broth (TSB) with the addition of 1.2% NaCl. The culture was then incubated again at 30 °C for 18–24 h before used for bacterial challenge.

2.4. Lethal Dose (LD50) Bacterial Challenge

The lethal dose (LD50) experiment was done by Natnan et al. [21]. The bacterial culture concentration was adjusted to approximately 5.4 × 10⁷ CFU/mL using seawater before it was used for bacterial challenge (LD50). After six weeks of the feeding trial, all fish were challenged with the LD50 of V. vulnificus. The fish were immersed in V. vulnificus for 30 min before being transferred back into the respective glass aquaria containing filtered seawater. The fish were then fed the same feeding regimen for seven days. The mortality and symptoms were then observed within this post-challenge period. The surviving infected fish from the control tanks and fish tank fed with oleic acid diet were then sampled for LC–MS analysis. During post-bacterial challenge, the dead fish were screened for the presence of Vibrio by swabbing the grouper’s skin and gills and streaked on TCBS agar plate, which is known as a selective agar media for growing of Vibrio sp. bacteria.

2.5. Sample Collection

After a week of post-bacterial challenge, livers were collected from four surviving groupers in each glass aquarium (oleic acid = three replicate tanks and control = three replicate tanks) and pooled together as one biological replicate according to their respective feeding group. The sample was pooled to ensure the minimum requirement in volume for metabolite extraction. A total of four biological replicates from the control group and four biological replicates from the oleic acid group were prepared for metabolite extraction. Each biological sample had four technical replicates.

2.6. Metabolite Extraction

Liver dissection was performed and pooled before snap freezing with liquid nitrogen. Samples were then stored at −80 °C prior to metabolite extraction. For each replicate, pooled organs were separately ground with liquid nitrogen. The powder samples were then subjected to metabolite extraction as described by Mayalvanan [23] and Wu et al. [24] with slight modification. The samples were mixed with solvents in a final ratio of 2.0:2.0:1.8 using methanol:chloroform:water. The samples were added to the previously mentioned respective ratios of cold methanol and cold water before vortexing. After that, chloroform was added and vortexed. The mixture was then incubated on ice for 40 min, before centrifugation at 10,000 rpm for 10 min at 4 °C. After centrifugation, the supernatant formed two separate layers. Cold chloroform and cold water were again added to this separated supernatant before centrifugation at 4 °C and 10,000 rpm for 20 min. The final upper biphasic layer was removed and transferred to a new vial before being sent for LC-qTOF-MS analysis. During the extraction of the metabolites, the solvents and samples were kept cold to avoid any degradation.

2.7. LC–MS Sample Analysis Using LC-qTOF-MS

Samples were run on LC-qTOF-MS without dilution. Caffeine (194.19 g/mol) in 100 mg/L solution was spiked into all samples as the internal standard solution to enable the system to analyze and evaluate the reaction relationship between the sample and the internal standard. Samples were analyzed using ultrahigh-performance liquid chromatography (UHPLC) and connected to an UltiMate 3000 UHPLC system (Dionex, Sunnyvale, CA, USA) coupled with a MicroTOF-Q III detector (Bruker Daltonic, Bremen, Germany). A preliminary electrospray ionization (ESI) for both positive and negative modes was done according to Mayalvanan (2019) study. Positive electrospray ionization (ESI) mode was then chosen, where higher compounds were detected compared to negative electrospray ionization mode while connected to a mass spectrometer (MS). Sample separations were performed on a C18 Thermo Scientific column (AcclaimTM Polar Advantage II) (Thermo-Fisher Scientific, Waltham, MA, USA). The column dimensions are 3 mm × 150 mm, 3 µm. The system flow rate was set to 0.4 mL/min, the temperature was 40 °C, and the injection volume was 1 µL. The mobile phase used in this analysis consisted of two mobile phases, phase A (0.1% formic acid in water) and phase B (100% acetonitrile, ACN). The best separation of the samples was achieved by using a gradient elution method with a total run time of 22 min. The following gradients were used: 95% for phase A, and 5% for phase B (0–3 min), 20% for phase A, and 80% for phase B (3–10 min), 20% for phase A, and 80% for phase B (10–15 min), and 95% for phase A and 5% for phase B (15–22 min). The ESI (positive) parameters for the MicroTOF-Q were set as follows: capillary voltage 4500 V, nebulizer pressure at 1.2 bar, drying gas flow at 8 L/min, temperature source for 200 °C, and m/z values in the range from 50 to 600 Da. Caffeine (100 mg/L) was added as an internal standard to all samples and eluted at 7.94 min (RSD ± 1.488).

2.8. Mass Spectrometry Data Processing and Data Analysis

The obtained raw mass spectral data were filtered and processed using Profile Analysis version 2.1 software (Bruker Daltonic, Bremen, Germany) [25]. The large metabolomics data were filtered in preparation for retention time alignment. The preprocessed data were filtered using Find Molecular Features (FMF), which enabled us to identify peaks and quantitatively filtered out all relevant information from the raw data. This resulted in data reduction as true signals could be distinguished from noises. The data were then subjected to retention-time alignment by using a shift vector algorithm, where a pairwise comparison was performed between automatically assigned master runs to account for nonlinear retention time shifts. After achieving the desired bulk of data, bucketing of the data was carried out to generate a data table for statistical analysis. Using ProfileAnalysis version 2.1, bucket tables were customized accordingly based on the extracted FMF compounds from the raw data. Here, advanced data bucketing can be adjusted according to the parameters (time alignment, retention time, and m/z value). The mass range of this dataset was set to 50–600 m/z to filter out long-chain fatty acids, long-chain peptides, and other irrelevant molecules to the study. A line spectrum with positive spectrum polarity was used. Find Molecular Features (FMF) and retention time alignment was used to mine the LC-qTOF-MS data and to extract relevant RT-m/z pairs. The FMF parameters used were as follows: S/N threshold: 5, correlation coefficient: 0.7, minimum compound length: 10, smoothing width: 5. A 30% filtering was applied to the data to filter out missing values. A final processed dataset comprising RT-m/z pairs and their corresponding peak intensity observed from their respective peak heights is obtained.
Data normalization was then carried out using MetaboAnalyst 5.0 (https://www.metaboanalyst.ca/MetaboAnalyst/ModuleView.xhtml accessed on 15 November 2022) against the internal standard caffeine (RT-m/z value: 7.94 min—195.087). t-tests were performed on the data using MetaboAnalyst 5.0 to determine significant differences (p < 0.05) between the groups. Briefly, the intensity data were log-transformed and scaled using Pareto. Normalized data were subjected to multivariate analysis using SIMCA P+ version 14.1. A principal component analysis (PCA) and a partial least-square discriminant analysis (PLS-DA) were performed with the goodness of fit (R2X(cum) and R2Y(cum)) and predictive power (Q2(cum)) to distinguish better separation between groups. Permutation tests were also performed to ensure the validity of the PLS-DA models. Using MetaboAnalyst 5.0, other data analyses, such as heatmaps were also performed. For compound identification, online software included Metabolite and Chemical Entity Database (METLIN) (https://metlin.scripps.edu/landing_page.php?pgcontent=mainPage accessed on 25 November 2022), and MassBank (http://www.massbank.jp/Search accessed on 25 November 2022).

2.9. Metabolite Identification

Metabolite compounds were identified using several common metabolomics platforms for MS and MS/MS data, including METLIN, MassBank, and Kyoto Encyclopedia Gene and Genome (KEGG) (https://www.genome.jp/kegg/ accessed on 25 November 2022). Metabolite identification was performed by comparing the accuracy of the m/z values. Additional data analyses such as heatmaps were also performed using MetaboAnalyst 5.0 to visualize metabolite profiles and reveal relationships between metabolites and the feeding treatment.

2.10. Metabolic Biosynthetic Pathway Mapping

Pathway enrichment analysis was performed using MetPa and KEGG to visualize the interactions of metabolic pathways. Lists of metabolites present in the liver of surviving infected grouper fed control and oleic acid diets were recorded, and pathways corresponding to the metabolite lists were extracted for both sets of samples. These pathways have been matched with those listed in KEGG to visualize how all involved pathways interact with each other. A comparative analysis was performed to identify unique pathways in the surviving infected grouper fed with an oleic acid diet. Relevant signaling pathways were integrated and appropriately mapped to understand the metabolic adaptations of surviving infected groupers fed with an oleic acid diet to Vibrio infection.

3. Results

3.1. Metabolite Profile of the Liver of Surviving Infected Grouper Fed Control and Oleic Acid Diets

The effects of the oleic acid diet on the metabolome of hybrid groupers were investigated on the liver of groupers infected with V. vulnificus. Livers were obtained from the surviving-infected grouper fed oleic acid and control diets for six weeks. Four biological individuals were pooled from two groups with four technical replicates. The samples were analyzed using LC-qTOF-MS and after normalization, the blank was eliminated, and the relevant mass ranges were filtered out with a filtering frequency of 30%. The average number of total metabolites was 639 in the control and oleic acid samples. Out of the 639 metabolites screened, only 66 metabolites were significantly different at p < 0.05 for the control and oleic acid samples using t-test analysis in MetaboAnalyst 5.0. Among the identified metabolites, 34 metabolites were present in the liver of surviving infected grouper fed the control diet, while approximately 51 metabolites were present in the liver of surviving infected groupers fed the oleic acid diet (Supplementary Table S1).

3.2. Metabolite Comparison between Control and Oleic Acid Diets

The Venn diagram in Figure 1 shows the distribution of significantly different metabolites between the surviving infected groupers fed oleic acid and the control samples. Based on Figure 1, a higher number of unique metabolites were identified in the liver of groupers fed oleic acid (20 metabolites) compared to the liver of groupers fed the control diet (12 metabolites). The higher number of unique metabolites might suggest that they contribute significantly to the activation of the immune response in groupers. It is also observed that 25 metabolites were present in both oleic acid and control samples.

3.3. Identification and Classification of Metabolites

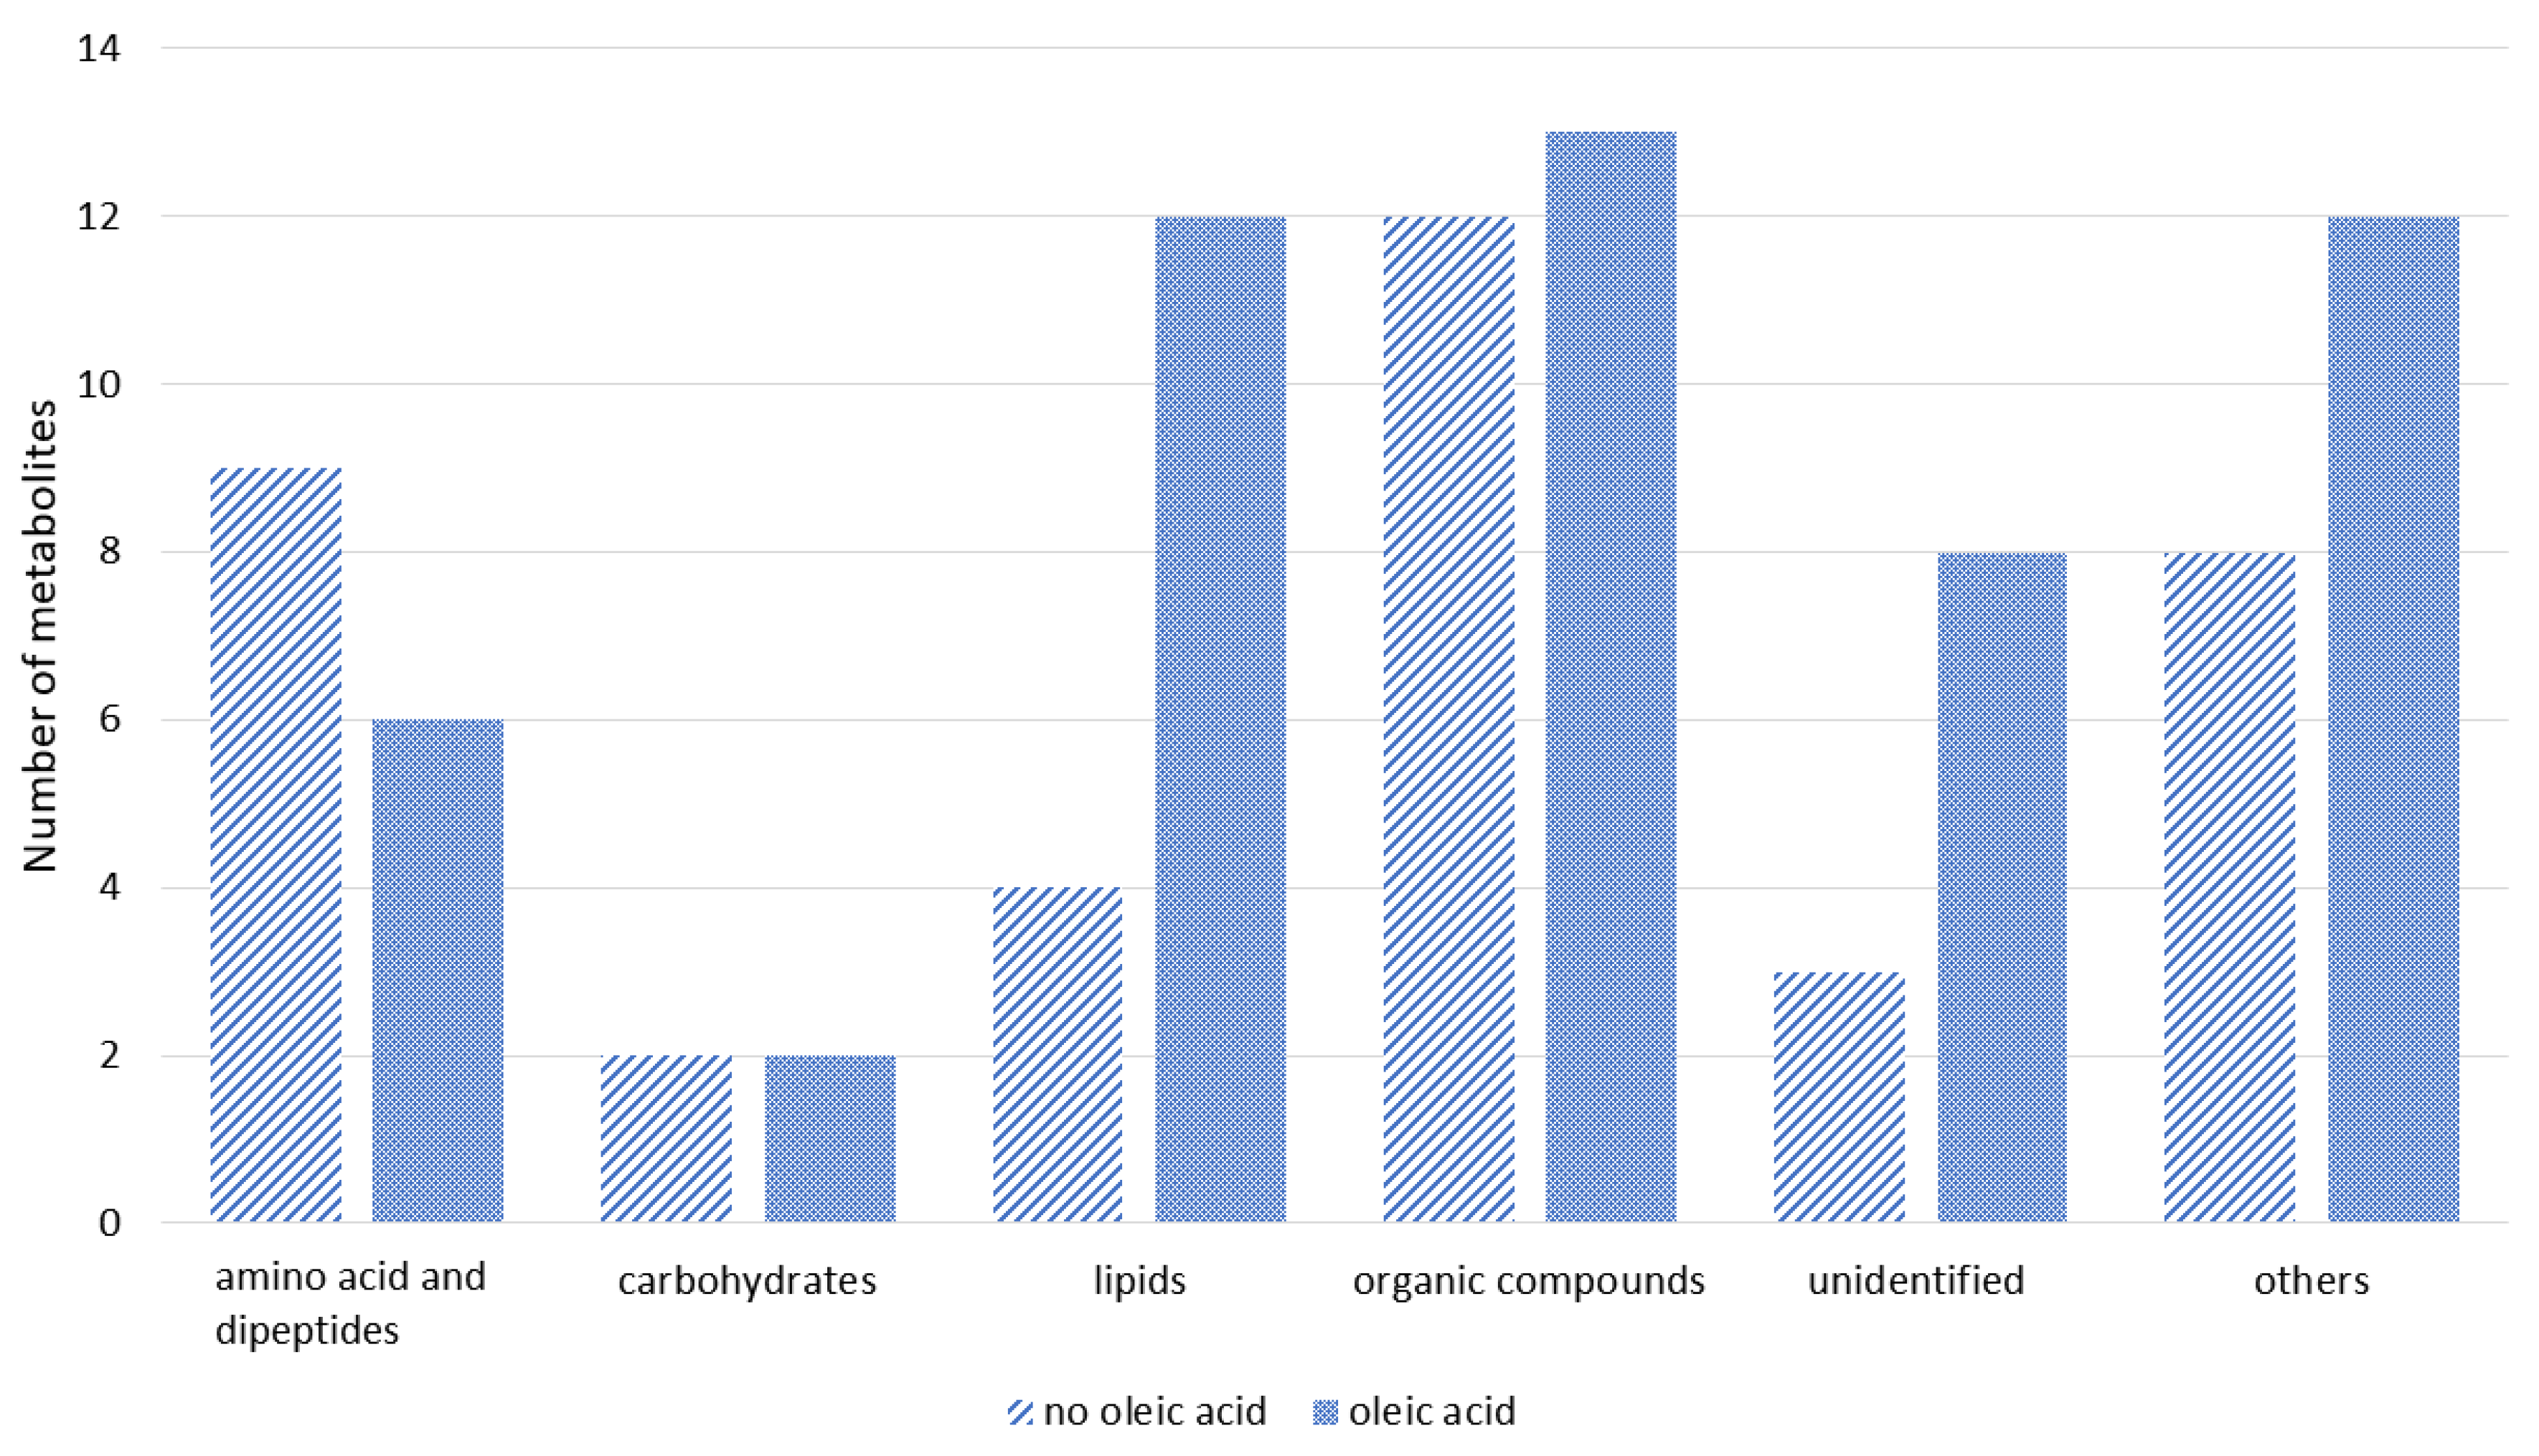
The obtained significantly different m/z values were compared against several free databases, such as METLIN, MassBank, and MetFrag, to identify the significant compounds. The list of putative metabolites detected from the surviving groupers can be referred to in Supplementary Table S1, while the putatively identified metabolites can be grouped as in Figure 2. Based on Figure 2, more metabolites were detected in the sample of groupers fed with oleic acid diet compared to the sample from groupers fed with the control diet. The majority of metabolites identified were from the amino acid, carbohydrate, and fatty acid groups followed by metabolites from phospholipid, peptide, carboxylic acid, hydrocarbon, amine, indoles, nucleotide, nucleoside, phenol, polyketides, and pyrimidine groups. Approximately eleven metabolite compounds were unable to be identified (Supplementary Table S1). From the list of putative metabolites detected, several amino acid metabolites in surviving infected fish fed with oleic acid diet showed significantly higher metabolite intensities including L-glutamine (8.71%), L-lysine (4.05%), and L-carnitine (11.53%), compared with surviving infected fish fed with the control diet; L-glutamine (5.75%), L-lysine (1.26%), and L-carnitine (4.7%).

3.4. Metabolic Pattern Analysis Using Multivariate Statistical Analysis (MVA) between Grouper Fed Oleic Acid and Control Diets

All metabolite intensities for each sample were normalized. Caffeine was used as an internal standard. To obtain a general overview of the variability spread of the data, a PCA was performed. In our study, the score plot from the PCA model of normalized data was collected from 8 samples with 639 variables. The score plot for the first PC (PC1) is 0.236, while the second PC (PC2) has a value of 0.187 with total variance (R2X) of 42.3%, separating the oleic acid and the control groups. The PCA (Figure 3a) showed that grouper livers fed oleic acid and control diets were indistinctly separated according to their group.
A further analysis using a supervised method was constructed. Thus, PLS-DA (Figure 3b) was performed to identify the discriminant of the two groups. A clearly separated clustering between the control and oleic acid diets indicates that there are some significant metabolites that contribute to group discrimination. The separation between different fish feeds was achieved using the first two-component model, PC1 (0.226) versus PC2 (0.13) with a total variance (R2X) percentage of 35.6% (Figure 3b).
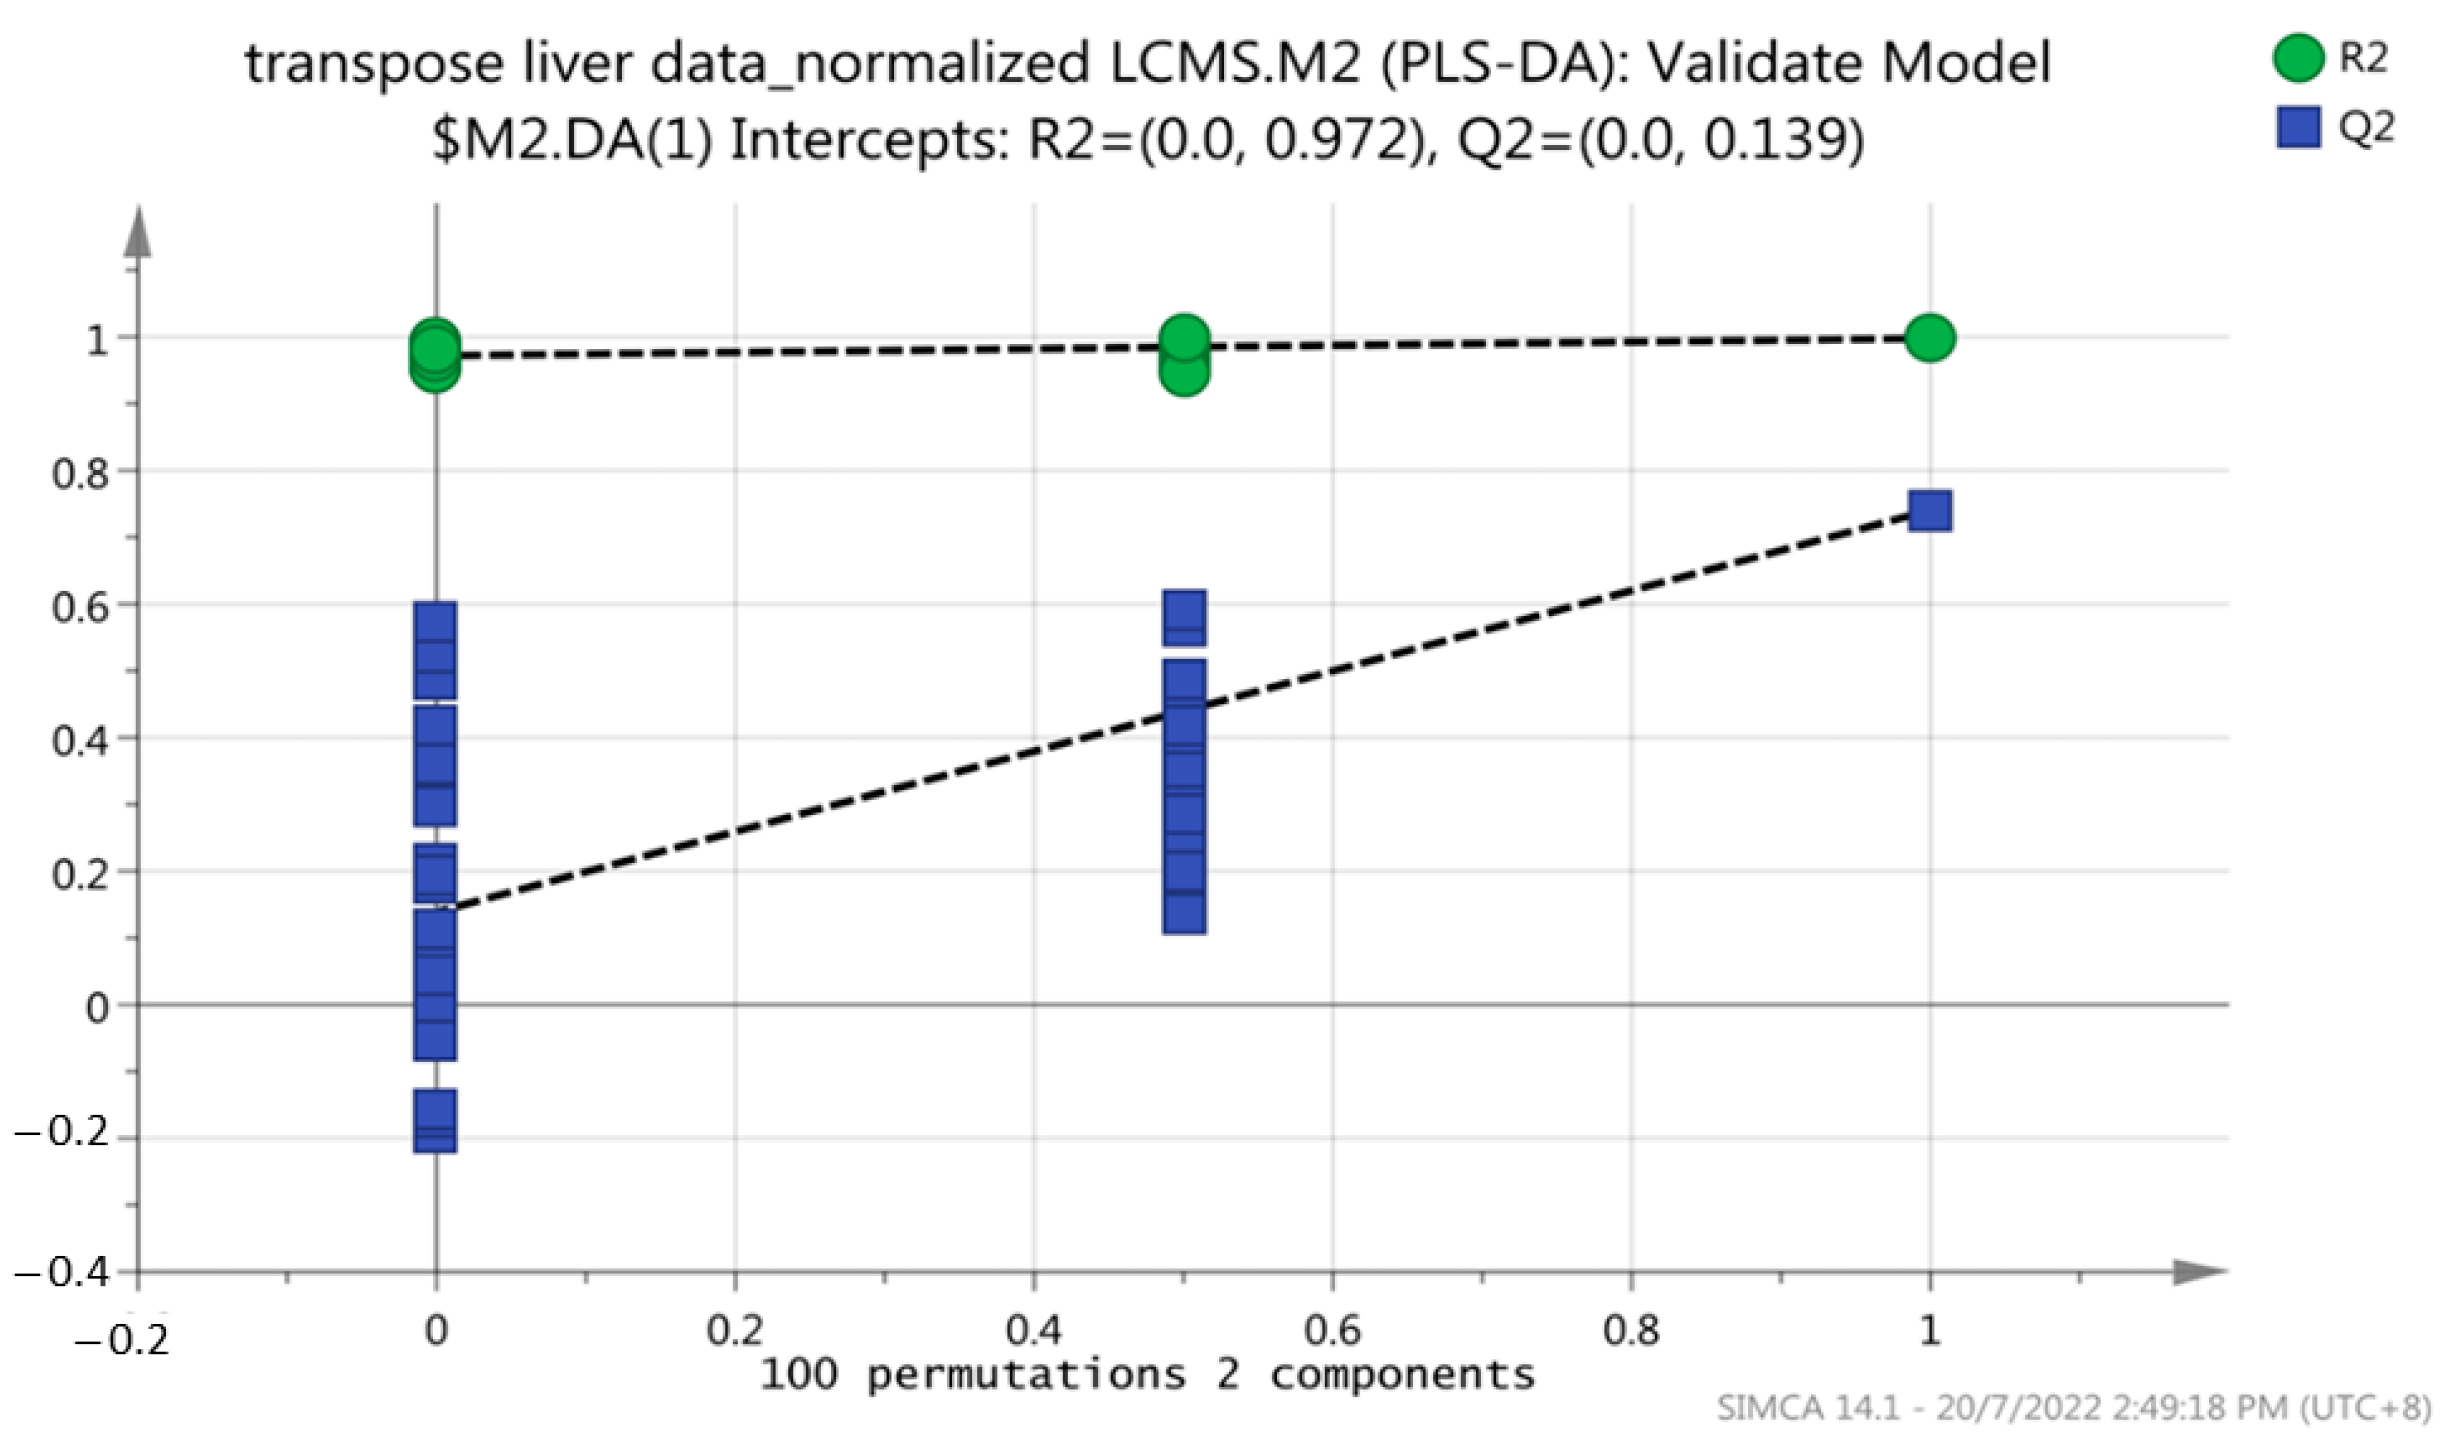
A permutation test was performed on all models to evaluate overfitting. The model was validated using 2-fold cross-validation and permutation testing (100 permutations). The R2 and Q2 regression lines were constructed to validate the overfitting. Figure 4 shows that the y-axis intercepts of the R2 and Q2 regression lines were 0.972 and 0.139, respectively. In addition, all R2Y and Q2 values to the left were lower than the original points to the right of the blue regression line of the Q2 points, indicating that this PLS-DA model is not overfitting and is valid for this metabolomic profiling.

3.5. PLS-DA Loading Plot and Variable Importance on Projection (VIP) Score Plot

The discrimination of metabolites can be determined using the variable importance on projection (VIP). The VIP score value indicates the contribution of a variable to the metabolite’s discrimination between classes of samples. VIP score values greater than one were considered significant. A loading plot was built on the 639 spectral bins of the LC-qTOF-MS feed profiles. The RT-m/z pairs are mostly scattered from the upper right to the center of the quadrant and to the lower left quadrant of the loading plot. The further the point is from the origin, the greater the weight value. In general, the furthest away RT-m/z pairs from the origin indicated the separation between groups and contributed to the differentiated marker compound. Discrimination metabolites were obtained on normalized raw data using statistical significance thresholds for VIP values obtained from the PLS-DA model. The p-values were calculated by one-way analysis of variance (ANOVA). Table 3 shows the top 30 metabolites with VIP values of more than one and p values less than 0.05 (p < 0.05), which were considered statistically significant metabolites. As shown in VIP Table 3, the metabolites that contributed to the separation in groupers fed with oleic acid diet are as follows: 12.74 min: 343.228 m/z, 1.78 min: 175.072 m/z, 1.43 min: 274.873 m/z, 2.67 min: 348.070 m/z, 13.20 min: 301.217 m/z, 1.41 min: 242.925 m/z, 13.39 min: 478.294 m/z, 13.69 min: 327.232 m/z, 15.07 min: 454.293 m/z, 11.81 min: 341.205 m/z, and 16.43 min: 303.232 m/z. Meanwhile, in groupers fed with the control diet, only three metabolites were detected in contributing to the separation in the PLS-DA loading plot, including 10.11 min: 447.085 m/z, 2.01 min: 425.166 m/z, and 1.92 min: 885.247 m/z. The results of this study show that the groupers fed the control diet were the most affected by vibriosis, as there are few metabolites that are recoverable.

3.6. Hierarchical Clustering Analysis of Metabolites (Heatmap)

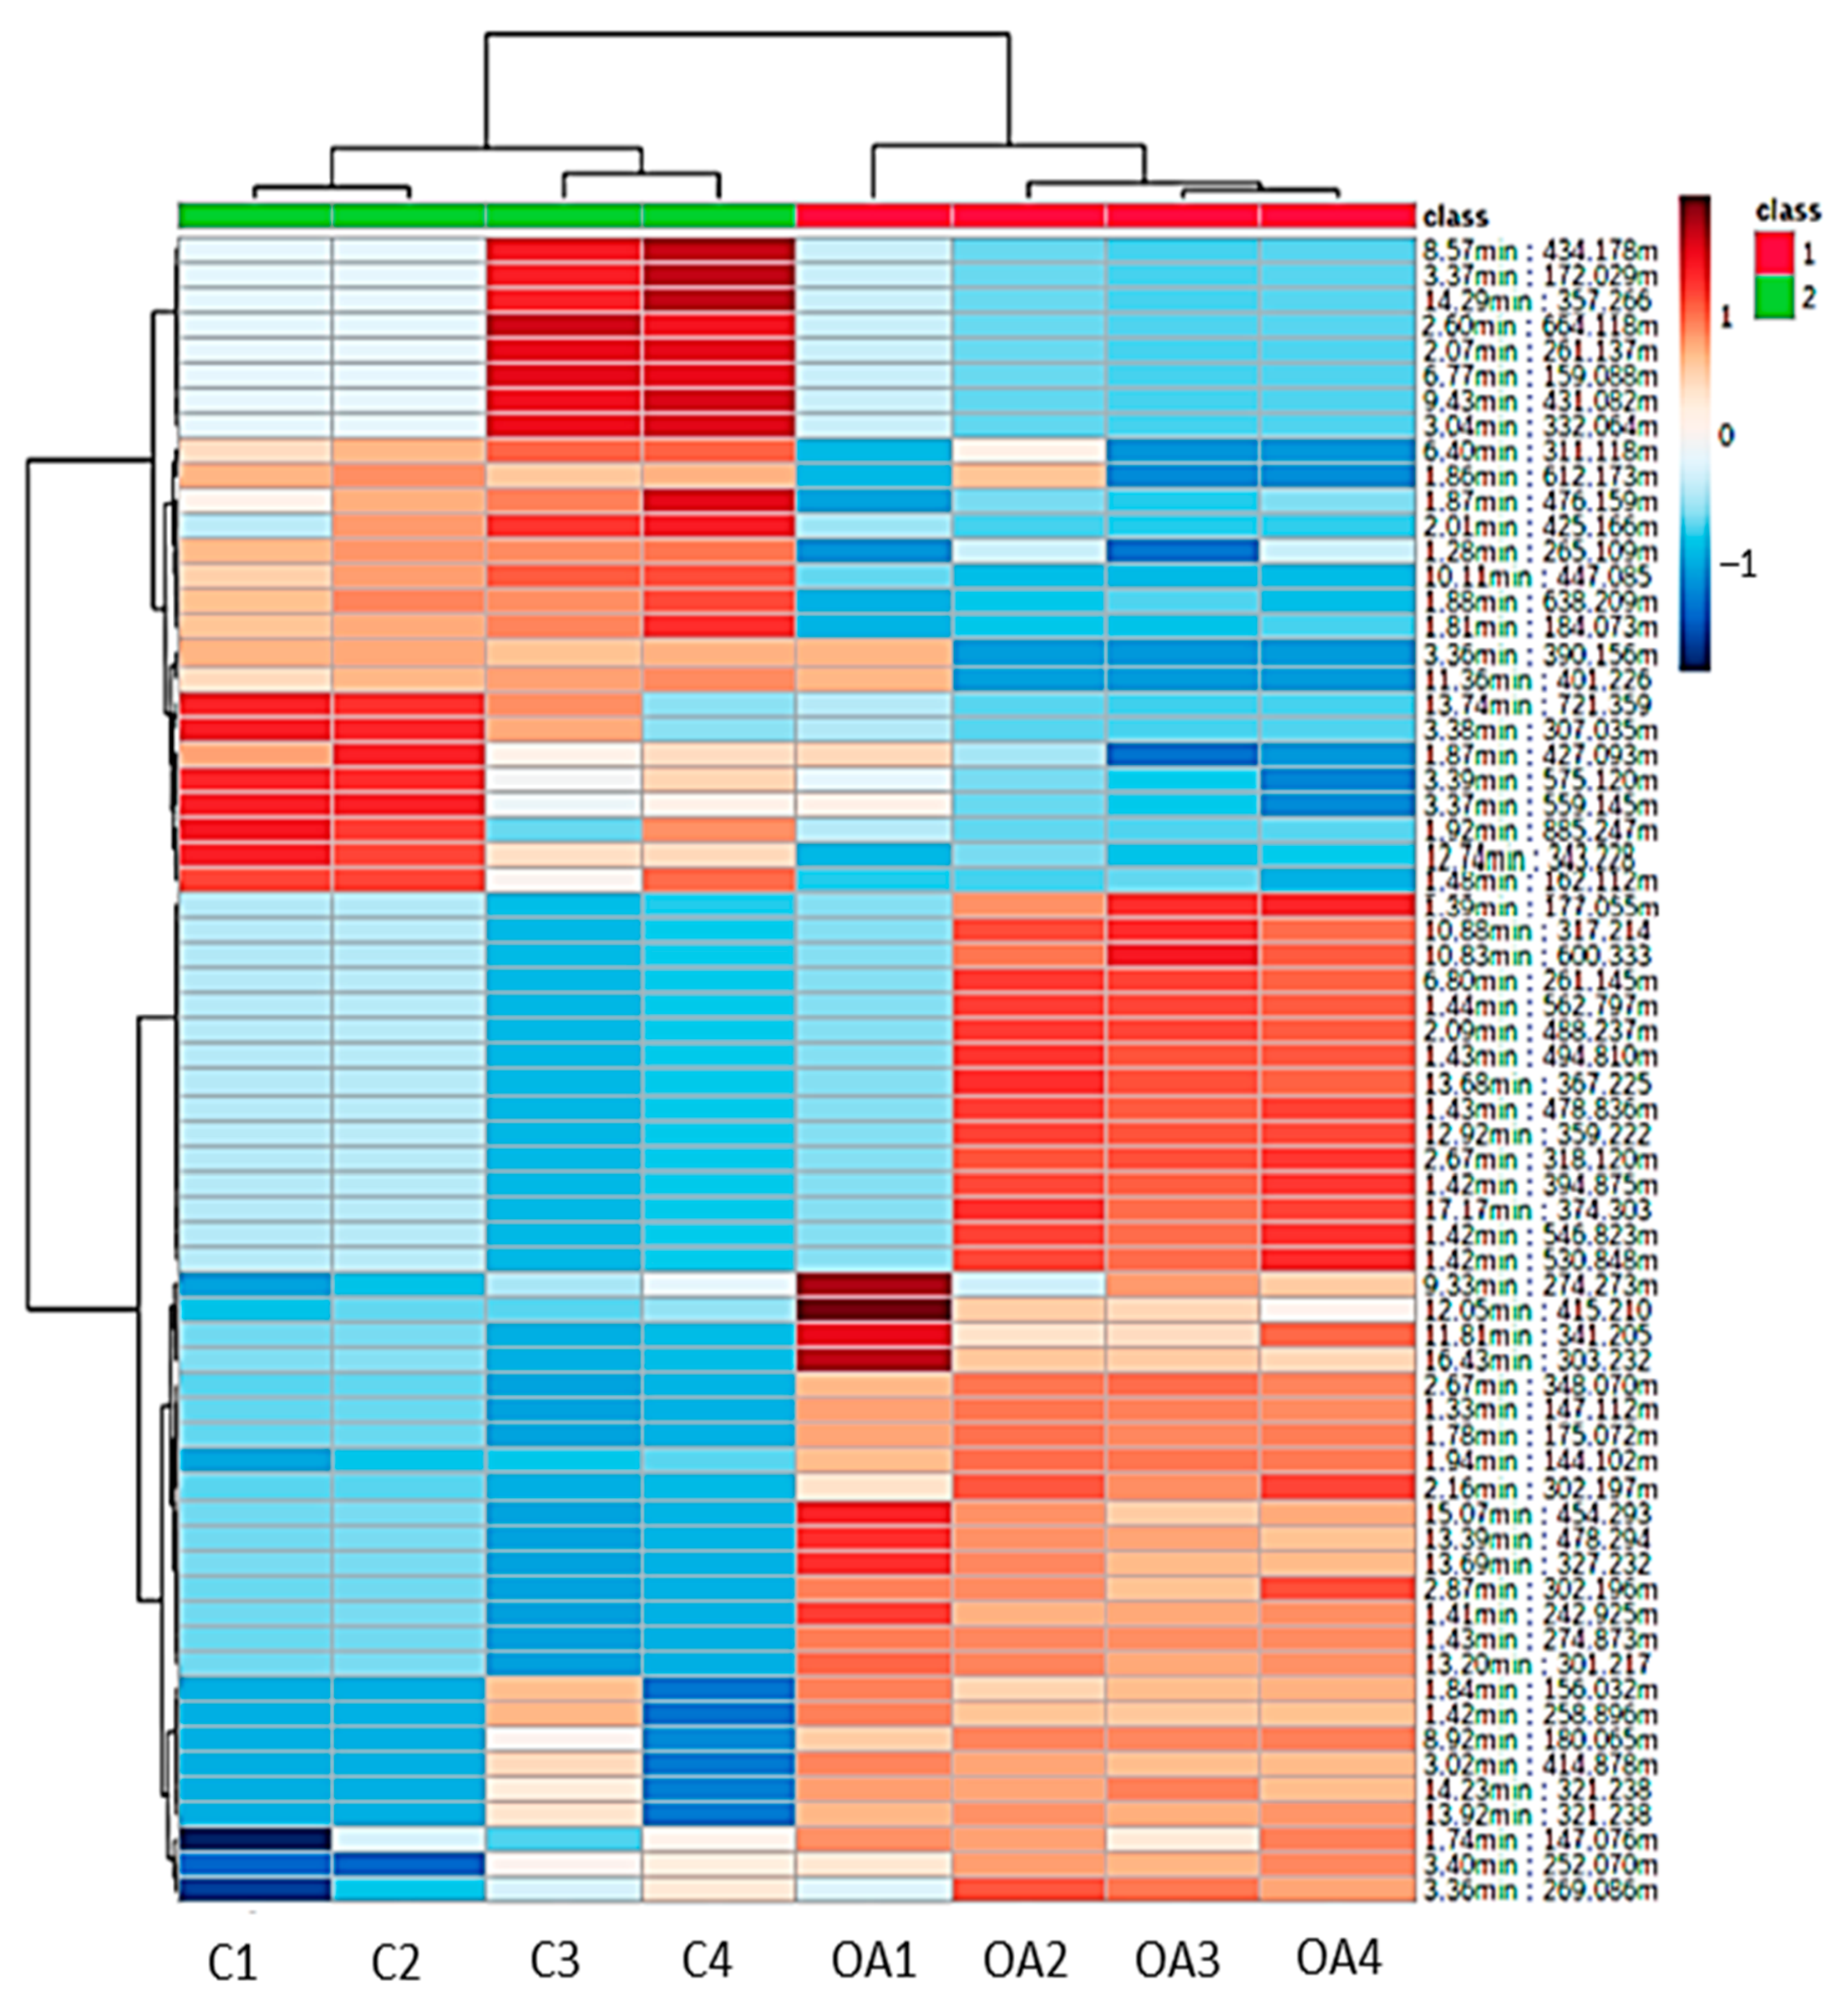
A heatmap was constructed to visualize the significant metabolites found in the liver tissues of surviving infected groupers fed the oleic acid and control diets. Based on Figure 5, a clear difference can be observed between the samples from groupers fed oleic acid and the control diets. The surviving infected groupers fed the oleic acid diet were observed to have a relatively higher intensity of metabolites compared to the surviving infected groupers fed the control diet based on the variation in the color spectrum. The higher intensity of the metabolites consistently contributed to the immune response after bacterial infection, while the low intensity of metabolites indicated that metabolites were not utilized in the metabolic activities of the fish.

3.7. Mapping of Metabolic Pathway Enrichment of Grouper Immunity Infected with Vibriosis

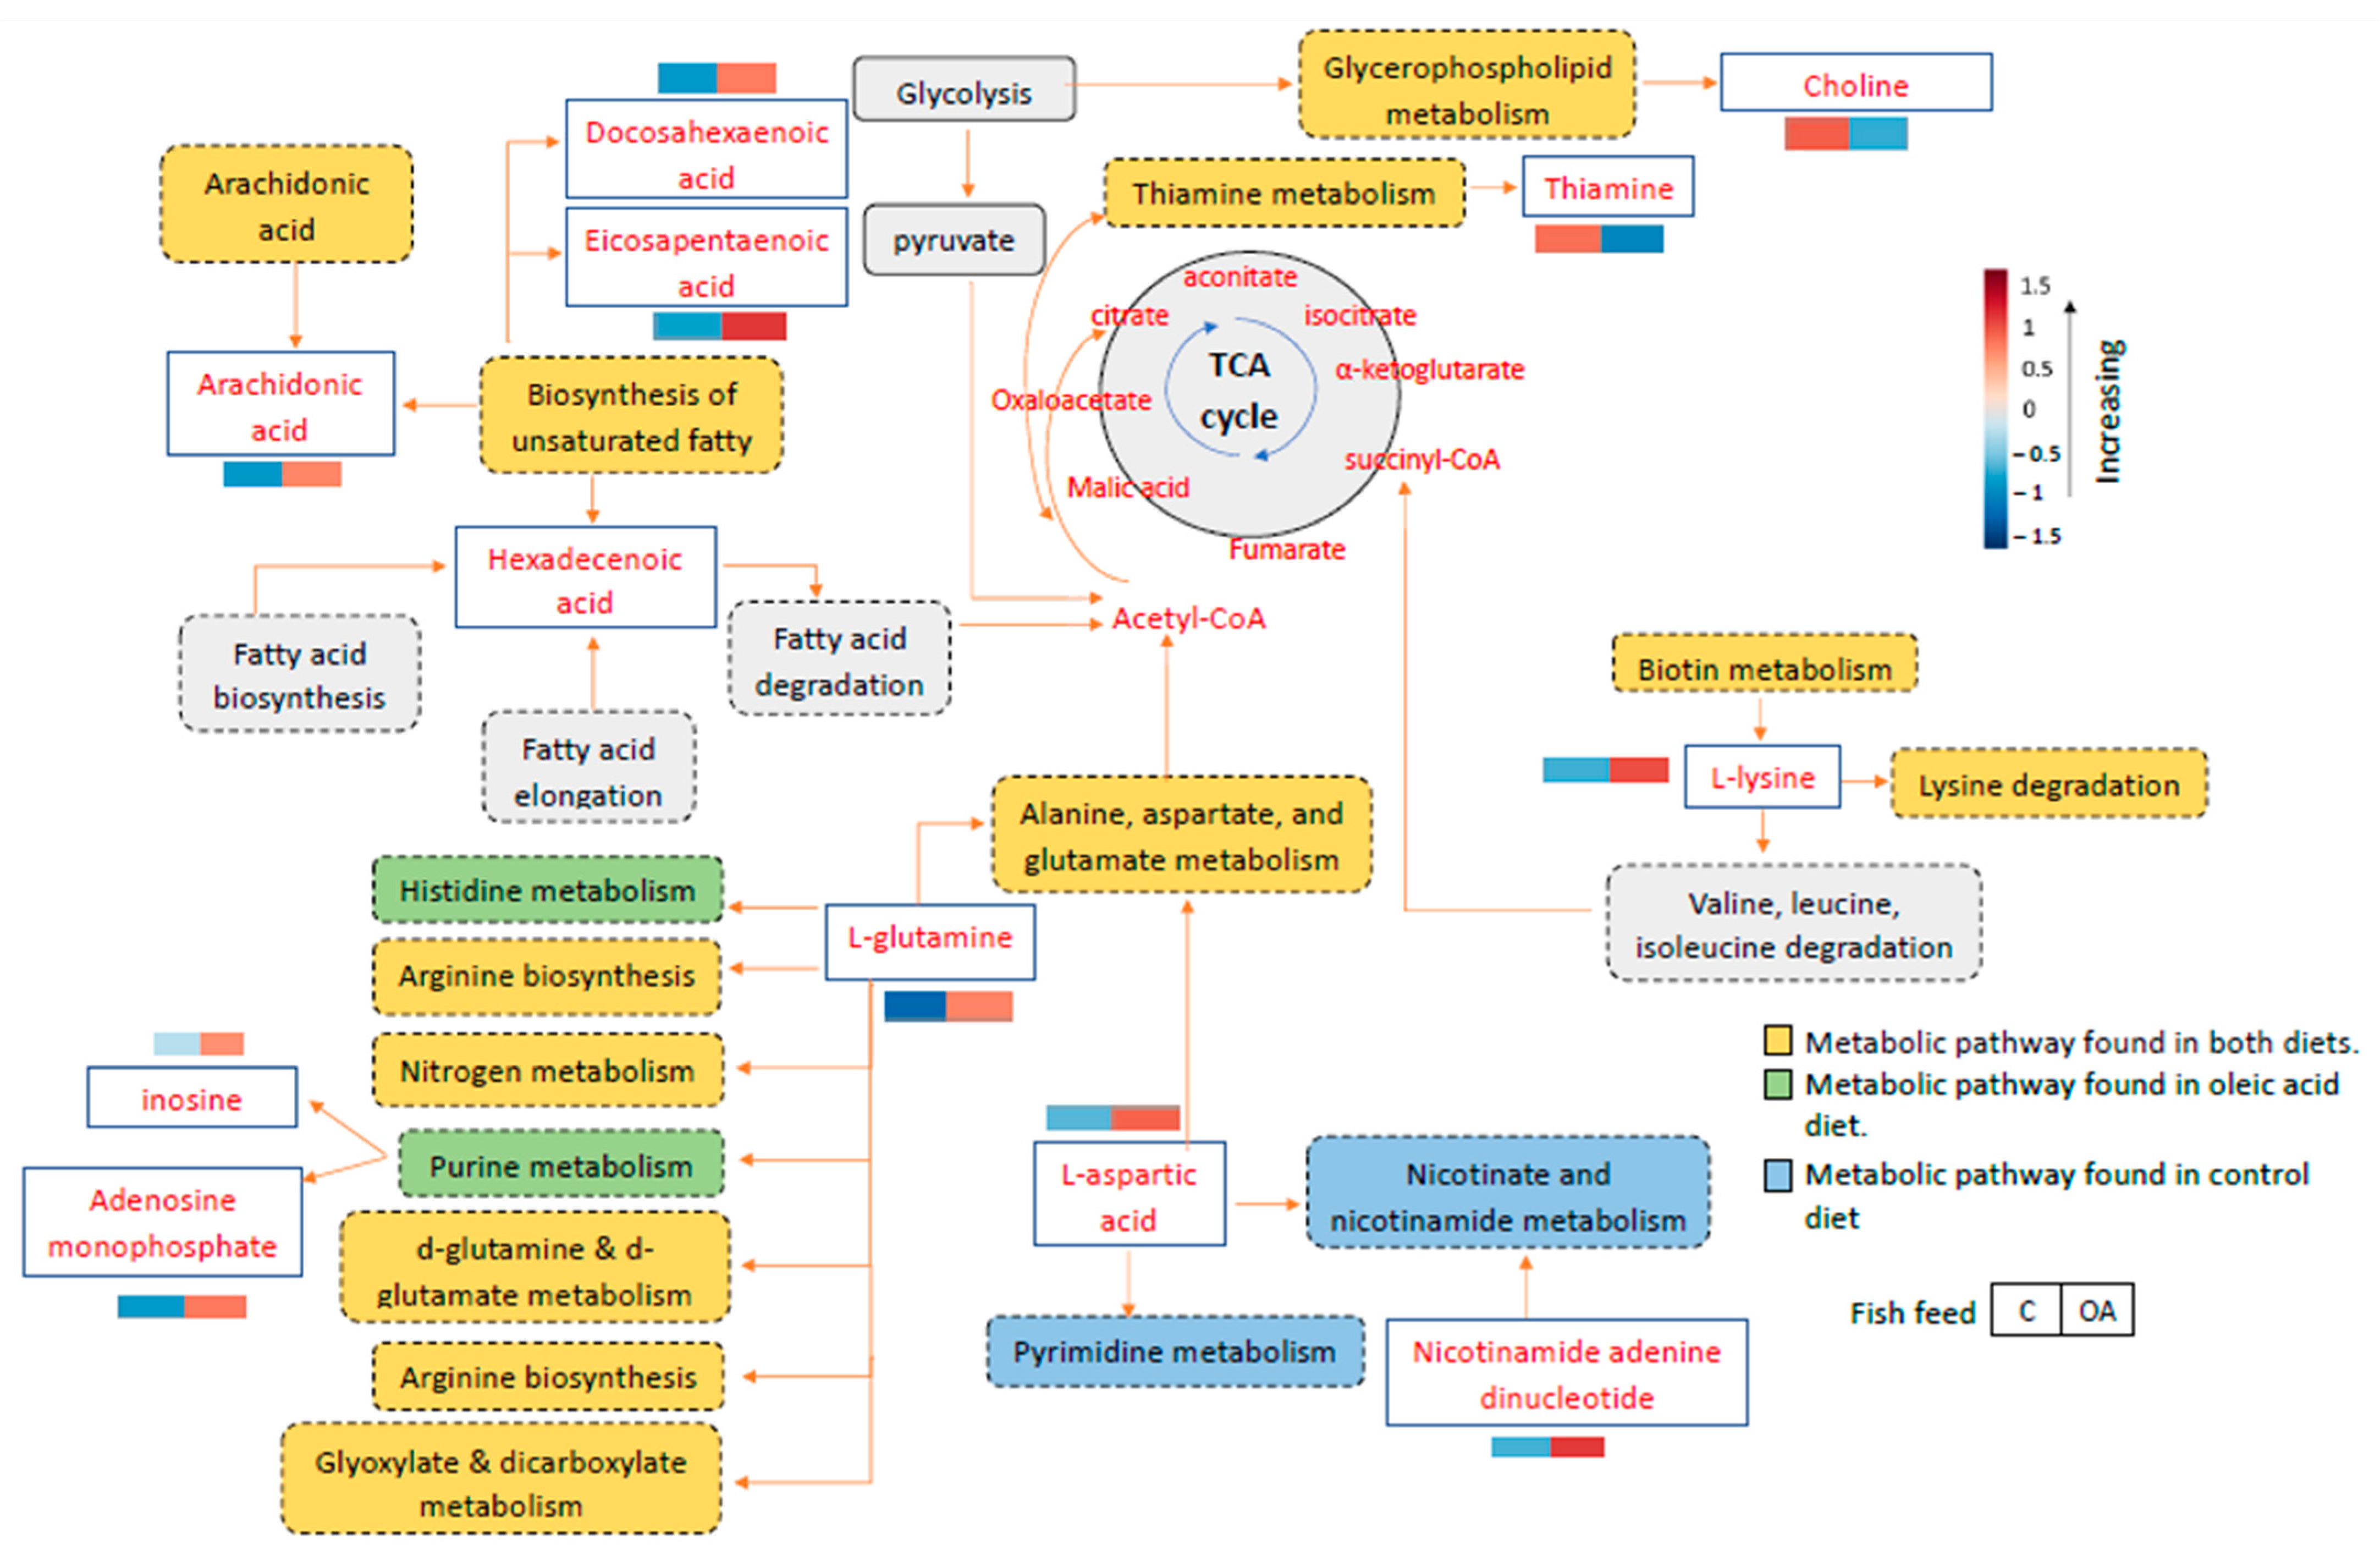
The metabolic pathway networks that contributed to the grouper immune response are shown in Figure 6. The red box represents the high metabolite intensities in the liver, while the blue box represents lower metabolite intensities in the liver sample. After feeding with the control and oleic acid diets and infection with Vibrio, high intensities of metabolites were observed primarily in the liver of the surviving infected groupers fed the oleic acid diet, such as L-glutamine, docosahexaenoic acid, eicosapentaenoic acid, L-lysine, L-aspartic acid, arachidonic acid, inosine, adenosine monophosphate, and nicotinamide adenine dinucleotide (Figure 6). Meanwhile, higher metabolite intensities such as thiamine and choline phosphate can be observed in the surviving infected groupers fed the control diet. The pathway map in Figure 6 showed the relevant metabolic pathway networks corresponding to the differential metabolite intensities of the liver samples from the survived-infected groupers fed oleic acid and control diets.
For the analysis of metabolic pathways, pathway impact values of 0.1 > 1.0 and statistically significant differences of p < 0.05 on the differential metabolites were used. The analysis of the enrichment of metabolic pathways was performed using MetaboAnalyst 5.0 and subjected to the KEGG database. From the 20 pathways identified, only three pathways showed a significant enrichment difference (p < 0.05) based on the differential metabolites, which included biosynthesis of unsaturated fatty acids, purine metabolism and alanine, aspartate, and glutamate metabolism (Table 4). Moreover, among these notable pathways, the alanine, aspartate, and glutamate metabolism pathway was observed to have the highest pathway impact value of 0.13 compared to the other pathways followed by purine metabolism with 0.05 impact value as shown in Table 4 and Figure 7. The results suggest that the alanine, aspartate, and glutamate metabolism pathway seems to play a major role in fish resistance to Vibrio infection. This is also consistent with the high abundance of L-glutamine metabolites found in the liver samples of surviving infected groupers fed an oleic acid diet versus a control diet group.

4. Discussion

In this study, an immunostimulant was used as an alternative strategy to stimulate the fish immune response and change the metabolic pathways to overcome vibriosis disease in groupers. In our experiment, the effects of fish feed diet formulation with oleic acid and non-oleic acid diets (control) were observed. The metabolome changes of surviving infected groupers were investigated to compare the relationship between metabolic changes and immunostimulant administration. Oleic acid is known as the monounsaturated fatty acid (MUFA) from the omega-9 group. It is also the most common MUFA found in daily nutrition vegetable oils such as olive oil (55–80%), grape seed oil (15–20%), and soybean oil and corn oil (10–40%) [26]. Although in our study, the soybean meal proportion might be high for carnivorous fish, previous studies have proven that hybrid groupers could be fed soybean meal in concentrations up to 50% of the total feed formulation without significantly affecting the growth or body condition of the hybrid grouper. Furthermore, increasing the soybean meal content of the diet to 60% had no significant effect on the grouper’s dietary intake [27,28]. Another study showed that partial substitution of fish meal by soybean meal had no negative effect on fish growth and meat quality [29].
In a previous study, oleic acid was reported to have the ability to regulate signaling pathways involving anti-inflammatory responses, immune cells proliferation, and cell differentiation [30,31]. The ability to regulate signaling pathways involving the immune response indicates that oleic acid is suitable as an immunomodulator in groupers infected with Vibrio. Oleic acid was also proven to increase the secretion of interleukin-1beta (IL-1β) which has been identified as an important neutrophil activator that has the function for the destruction of microorganisms or for tissue repairing [30]. The finding is in line with our previous study, where among different types of fatty acids used as immunostimulants in fish feed formulations, groupers fed oleic acid immunostimulant showed the most significant results in elevating the immune responses toward Vibrio infection, including lysozyme, respiratory burst, and phagocytic activities [21]. In another study, oleic acid content in the raw extract of squid ink can directly kill bacteria by penetrating the bacterial membrane known as lipopeptides, a proteic known as lipoglycopeptides or lipidic known as glycopeptides, which will damage and break the bacterial cell wall structure, and simultaneously kill the bacteria [32]. As for Reddy and Naidu [33], they found that oleic acid from olive oil could be partially attributed to hydroxytyrosol, which is considered the most powerful antioxidant compound other than gallic acid [34]. It has been reported that the intake of this compound has several beneficial effects, such as healing ability, anti-inflammation, and protection of the skin and eyes [33,34]. The increase in IL-8 synthesis in intestinal epithelial cells of the rats treated with olive oil content with oleic acid composition also proves that the cytokine secreted by either monocytes or macrophages helps decrease the susceptibility to infection [33]. In a wound healing rat model, the number of neutrophils were increased in the wounded area as oleic acid was administered to speed up wound healing in rats [35]. In another study, a high diet of oleic acid elevated the level of M2 macrophages that function to produce extracellular matrix components, chemotactic factors, and interleukin 10 (IL-10), which participate in tissue repair, resolution of inflammation, and angiogenesis [36]. In summary, oleic acid presents modulatory effects for health and disease resistances in many organisms by inducing their signaling molecules including interleukin (IL-8, IL-10), macrophages, and others involving inflammation and protection from foreign invaders (bacteria, viruses, parasites, and fungi).
In a metabolomics study, Nurdalila et al. [22] identified several fatty acids with high metabolite abundance after Vibrio infection, including oleic acid and other fatty acids, such as palmitic acid, palmitoleic acid, 6,9-octadecenoic acid, stearic acid, arachidic acid, behenic acid, and 8,11-eicosadienoic acid. As dietary oleic acid gives the most promising results in elevated immune response of hybrid grouper in our previous study, in our current study, LC-qTOF-MS analysis was conducted on the liver sample of surviving infected groupers to investigate the metabolite changes between groupers fed a control diet and an oleic acid diet. The score plot of more than 40% [37] as shown in Figure 3a indicates a good separation pattern between surviving groupers fed the control diet and surviving groupers fed the oleic acid diet. This result demonstrates that similar metabolites naturally clustered together, while different groups of metabolites were further distributed. As shown in Figure 2, most of the metabolites profiled from the liver samples were putatively identified as organic compounds, fatty acids, and amino acids. This finding is similar to what has been reported by Baharum et al. [38], who profiled metabolites from groupers that survived Vibrio infection including amino acids, organic compounds, and less lipid content. In another study, different dietary fatty acids, including linseed oil, fish oil, and coconut oil, added to the diet of dusky groupers (Epinephelus marginatus) dramatically changed the gene expression involved in the lipid metabolism pathway to improve the composition of lipid nutrition and increasing the production of this marine fish [39].
In the current study, the metabolites profiled from the hybrid grouper livers infected with Vibrio were putatively identified as organic compounds, fatty acids, and amino acids, which are consistent with the results reported by Baharum et al. [38] and Nurdalila et al. [16] using LC–MS and GC–MS approaches, respectively. In a study by Baharum et al. [38], metabolites from amino acid groups such as L-glutamate, aspartic acid, leucine, and lysine were highly abundant after the grouper was infected with Vibrio. A similar finding was observed in our study, where L-glutamate, aspartic acid, and L-lysine showed higher metabolite intensity in grouper fed oleic acid than in grouper fed the control diet. According to Jia et al. [40], glutamate and glutamine are important metabolite substrates in fish for renal ammoniagenesis to form ammonia and glutarate, which play an important role in regulating the acid–base balance in the body. The acid–base balance in fish is very important to maintain their body fluid homeostasis and normal physiological functions [41]. In another study, glutamine and glutamate modulated immune responses, including increase the production of antibodies and cytokines, and lymphocyte proliferation and macrophage polarization among M1 and M2 cells [42]. In line with our current results, the dietary oleic acid showed abundance of glutamine metabolite which is involved in elevating the levels of M2 macrophage among M1 and M2 cells. It was determined that M2 macrophage cells promote cell proliferation and tissue repairing while M1 cells are involved in inhibiting cell proliferation and cause tissue damage [43]. Furthermore, in our study, the abundance of adenosine monophosphate in oleic acid diet samples compared to the control diet samples is because adenosine was previously reported to be responsible for the anti-inflammatory effect and reduction of skin damage [44].
Similarly, aspartic and lysine were observed to have higher metabolite intensity in groupers fed oleic acid compared to groupers fed the control diet (Figure 6). The findings demonstrate that groupers fed the oleic diet exhibited highly abundant lysine and aspartic acid, which have previously been reported to play an important role in activating various signaling pathways that ultimately trigger the fish immune response that has been affected by bacterial infection [45,46]. Although there have not yet been extensive studies related to the effect of oleic acid on aspartic acid and lysine levels in fish, the existing studies have suggested positive effects of lysine on regulating immune responses in several fish species such as largemouth bass, Micropterus salmoides [47], and rainbow trout, Oncorhynchus mykiss [48]. The study on largemouth bass described the role of a lysine diet in significantly increasing the mRNA expression levels of MyD88-NFκB/RelA pathway which is the vital signaling pathway in activating the pro-inflammatory and anti-inflammatory responses [47]. Meanwhile, an appropriate amount of lysine can be incorporated in the diet of rainbow trout for not only improved growth, but also digestive ability and upregulating the immune response status [48]. These previous reports extend our present results by demonstrating that lysine is an important compound for regulating the immune response. It has been reported that the production of high L-aspartic acid leads to the production of nitrogen oxide, which promotes phagocytosis in zebrafish during V. alginolyticus infection [45]. Similarly, in our study, to maintain the survival of groupers after Vibrio infection, groupers produced higher levels of L-aspartic acid to fight against bacterial invasion. Comparably to L-aspartic acid, the high intensity of lysine has been reported to be involved in the hormone insulin-like growth factor signaling pathway, which in turn regulates lipid metabolism and pro-inflammatory and anti-inflammatory responses in largemouth bass, Micropterus salmoides [47]. Hence, this report is in agreement with our results that amino acid intensity was increased as pathogen infection disturbed the amino acid metabolism and protein biosynthesis of groupers.
Meanwhile, for inosine, this is consistent with the study by Jiang et al. [49], where the increased level of inosine improved the survival of tilapia and mice infected with V. alginolyticus, Edwardsiella tarda, and Escherichia coli. The study revealed that bacterial infection stimulates inosine production to downregulate IL-1β expression and increase the interaction of the complement component with macrophages to promote phagocytosis activity. For adenosine monophosphate (AMP), the increased abundance of this metabolite could be related to inosine, from which AMP and another metabolite called adenosine diphosphate (ADP) were produced, which is mainly important for regulating the innate immune response against bacterial pathogens [49,50].
In our study, the consumption of oleic acid revealed that groupers fed the oleic acid diet had higher arachidonic acid levels (0.65%) in the liver than groupers fed the control diet (0.22%) (Figure 6). This finding is in agreement with Araújo et al. [51], who reported that arachidonic acid has the ability to positively affect the growth performance, stress response, and immune response of juvenile California yellowtail, Seriola dorsalis. In another study, the arachidonic acid-derived eicosanoids known as prostaglandins are also important for the development and protection of epithelial barrier integrity [52], which allows the permeability of nutrients, water, and ions while limiting the invasion of pathogens and toxins in the cells [53]. The effect of arachidonic acid has also been evaluated in the white shrimp Litopenaeus vannamei, where arachidonic acid synthesizes eicosanoids, including prostaglandins and leukotrienes, act as signaling molecules modulating inflammation and the immune response [54]. Eicosapentaenoic acid also has similar biological properties to arachidonic acid, where enzyme binding, such as lipoxygenase and cyclooxygenase, is involved in the biosynthesis of leukotrienes and prostaglandin, respectively [55].
By comparing previous studies mentioned earlier, several metabolites were found to be similar to those in our current study such as L-glutamine, aspartic acid, L-lysine, L-carnitine, and hexadecenoic acid. The few similar metabolites identified may be due to the different approaches used in both studies and the concentration and sample size used, which might produce different metabolites [56]. The decreased number of amino acids in infected groupers also suggests a diverse disruption of amino acid metabolism and protein biosynthesis in other cells, as reported by Nguyen et al. [57], where some branched-chain amino acids, such as leucine, valine, and isoleucine, were needed as essential metabolites for immune response activation.
Apart from investigating the metabolite changes between surviving infected groupers fed oleic acid and control diets, the LC-qTOF-MS results allowed us to propose some pathways involved in the immune response mechanisms during this Vibrio infection. Three metabolic pathways were among the significant (p < 0.05) pathways as in Table 4. The pathways include biosynthesis of unsaturated fatty acids, purine metabolism, and alanine, aspartate, and glutamate metabolism. Figure 6 illustrates the involvement of the metabolites detected and enrichment pathways in this study. Based on the KEGG database, L-glutamine metabolite was detected in higher intensity in the dietary oleic acid group involved in alanine, aspartate, and glutamate metabolism, similar to a previous study that reported that the alanine, aspartate, and glutamine metabolism pathway is critical in increasing ATP production to play a protective role and provide energy for defense mechanisms against infectious diseases [38]. Meanwhile, in another study, it was reported that purine metabolism pathway can be considered one of the relevant pathways for optimizing immunomodulatory responses in white shrimp against V. alginolyticus [58]. Figure 6 also shows how alanine, aspartate, and glutamate metabolism pathway, as well as other metabolism pathways, interact to activate the TCA cycle and glycolysis to activate the inflammatory response that triggers an immune response [59]. In another study, alanine, aspartate, and glutamine metabolism was reported to be associated with the increase of immune response of yellow drum, Nibea albiflora, when infected with Cryptocaryon irritants [60]. From this highly impacted value of metabolic pathways, we identified metabolites including L-glutamine, L-lysine, L-aspartic acid, inosine, and adenosine monophosphate (AMP) as the significant metabolites involved in the grouper’s immune response after infection with V. vulnificus. As mentioned in the previous paragraph, L-glutamine is an important metabolite in modulating the immune system in fish during pathogen invasion [31,37].

5. Conclusions

In summary, this study discovers metabolome-relevant compounds in surviving infected groupers fed oleic acid supplements. Hybrid groupers fed with an oleic acid supplemented diet had significantly increased levels of most of the amino acid metabolites detected compared to hybrid groupers fed with the control diet after being infected with V. vulnificus. The results of this study demonstrated that the high intensities of amino acid metabolites such as L-glutamine, L-lysine, and L-aspartic acid and the characterization of alanine, aspartate, and glutamate metabolism pathway as the most impacted pathway related to the fish immune response. Therefore, from this study, we provide proof of concept on our newly formulated fish diet as a potential novel immunostimulant in improving grouper production and resistance to bacterial infectious disease. Future work will determine the immune-regulation genes in Vibrio-resistant groupers fed with oleic acid supplements through transcriptomics study.

Supplementary Materials

The following supporting information can be downloaded at: https://www.mdpi.com/article/10.3390/jmse11081563/s1, Table S1: List of putative metabolites detected from the survived-infected groupers fed with dietary oleic acid, Table S2: List of putative metabolites detected from the survived-infected groupers fed with the control diet.

Author Contributions

Conceptualization, S.N.B.; methodology, S.N.B., C.-F.L. and C.-M.C.; software and formal analysis, S.N.B. and M.E.N.; validation, M.E.N., S.N.B. and W.R.; investigation, M.E.N.; writing—original draft preparation, M.E.N.; writing—review and editing, M.E.N., S.N.B., C.-F.L., C.-M.C. and W.R.; supervision, S.N.B.; funding acquisition, S.N.B. All authors have read and agreed to the published version of the manuscript.

Funding

This research was funded by the Ministry of Higher Education Fundamental Research Grant, grant number FRGS/1/2022/STG01/UKM/02/2 and Research University Grant, grant number GUP-2017-073 and grant number DIP-2015-024 from Universiti Kebangsaan Malaysia.

Institutional Review Board Statement

The study was conducted in accordance with the Guideline and Regulation for Experimental Animals approved by the Universiti Kebangsaan Malaysia Ethical Committee (UKMAEC) (IBC/Ack/2/2019) on 18 October 2019.

Informed Consent Statement

Not applicable.

Data Availability Statement

All data generated and analyzed during this study are included in this published article.

Acknowledgments

The authors would like to acknowledge the support of all the staff and students of INBIOSIS, UKM throughout this study. We also acknowledge the staff from the Institute of Bioscience, Higher Institution Center of Excellence (HICoE), UPM for providing and setting up the hatchery for the experiment. We also thank the staff from the Department of Aquaculture, Faculty of Agriculture, UPM for providing access to the equipment and facilities for the fish feeding study. We would also like to acknowledge the Center for Research and Instrumentation Management (CRIM), Universiti Kebangsaan Malaysia (UKM) for the LC-TOF facility through the Research Instrumentation Fund (PIP-2013).

Conflicts of Interest

The authors declare no conflict of interest.

References

  1. PEMSEA. Partnerships in Environmental Management for the Seas of East Asia; PEMSEA: Kalakhang Maynila, Philippines, 2017. [Google Scholar]
  2. Food and Agriculture Organization of the United Nations. FAO Statistic; Food and Agriculture Organization of the United Nations: Rome, Italy, 2021. [Google Scholar]
  3. Ina-Salwany, M.Y.; Al-saari, N.; Mohamad, A.; Mursidi, F.; Mohd-Aris, A.; Amal, M.N.A.; Kasai, H.; Mino, S.; Sawabe, T.; Zamri-Saad, M. Vibriosis in Fish: A review on disease development and prevention. J. Aquat. Anim. Health 2019, 31, 3–22. [Google Scholar] [CrossRef]
  4. Chong, R.; Bousfield, B.; Brown, R. Fish disease management. Vet. Bull. Agric. Fish. Conserv. Dep. Newsl. 2011, 1, 8. [Google Scholar]
  5. Abd El-Galil, M.A.A.; Mohamed, M.H. First Isolation of Vibrio alginolyticus from Ornamental Bird Wrasse Fish (Gomphosus caeruleus) of the Red Sea in Egypt. J. Fish. Aquat. Sci. 2012, 7, 461–467. [Google Scholar] [CrossRef] [Green Version]
  6. Liao, J.D.; Leano, I.C. The Aquaculture of Groupers; Asian Fisheries Society: Selangor, Malaysia, 2008. [Google Scholar]
  7. Amalina, N.Z.; Santha, S.; Zulperi, D.; Amal, M.N.A.; Yusof, M.T.; Zamri-Saad, M.; Ina-Salwany, M.Y. Prevalence, antimicrobial susceptibility and plasmid profiling of Vibrio spp. isolated from cultured groupers in Peninsular Malaysia. BMC Microbiol. 2019, 19, 251. [Google Scholar] [CrossRef] [Green Version]
  8. Deng, Y.; Xu, L.; Chen, H.; Liu, S.; Guo, Z.; Cheng, C.; Ma, H.; Feng, J. Prevalence, virulence genes, and antimicrobial resistance of Vibrio species isolated from diseased marine fish in South China. Sci. Rep. 2020, 10, 14329. [Google Scholar] [CrossRef]
  9. Achmad, M.J.; Isnansetyo, A.; Andriani, R.; Samman, A.; Marus, I. The analysis of challenges test of catfish (Clarias sp.) with fatty acid compounds from starfish (Acantaster planci). IOP Conf. Ser. Earth Environ. Sci. 2020, 584, 012014. [Google Scholar] [CrossRef]
  10. Achmad, M.J.; Isnansetyo, A.; Hasanah, N.; Ustadi, U.U. Macrophage Immunomodulatory Activity of Unsaturated Fatty Acid Isolated from the Crown-of-thorns Star Fish (Acanthaster planci). Pharmacogn. J. 2018, 10, 951–957. [Google Scholar] [CrossRef] [Green Version]
  11. Schmitt, P.; Wacyk, J.; Morales-Lange, B.; Rojas, V.; Guzmán, F.; Dixon, B.; Mercado, L. Immunomodulatory effect of cathelicidins in response to a β-glucan in intestinal epithelial cells from rainbow trout. Dev. Comp. Immunol. 2015, 51, 160–169. [Google Scholar] [CrossRef]
  12. Sherif, A.H.; Mahfouz, M.E. Immune status of Oreochromis niloticus experimentally infected with Aeromonas hydrophila following feeding with 1, 3 β-glucan and levamisole immunostimulants. Aquaculture 2019, 509, 40–46. [Google Scholar] [CrossRef]
  13. Guluarte, C.; Reyes-Becerril, M.; Gonzalez-Silvera, D.; Cuesta, A.; Angulo, C.; Esteban, M.Á. Probiotic properties and fatty acid composition of the yeast Kluyveromyces lactis M3. In vivo immunomodulatory activities in gilthead seabream (Sparus aurata). Fish Shellfish Immunol. 2019, 94, 389–397. [Google Scholar] [CrossRef] [PubMed]
  14. Natnan, M.E.; Low, C.-F.; Chong, C.-M.; Bunawan, H.; Baharum, S.N. Integration of Omics Tools for Understanding the Fish Immune Response Due to Microbial Challenge. Front. Mar. Sci. 2021, 8, 668771. [Google Scholar] [CrossRef]
  15. Du, C.; Yang, M.; Li, M.-Y.; Yang, J.; Peng, B.; Li, H.; Peng, X. Metabolic Mechanism for l-Leucine-Induced Metabolome To Eliminate Streptococcus iniae. J. Proteome Res. 2017, 16, 1880–1889. [Google Scholar] [CrossRef]
  16. Nurdalila, A.A.; Natnan, M.E.; Baharum, S.N. The effects of amino acids and fatty acids on the disease resistance of Epinephelus fuscoguttatus in response to Vibrio vulnificus infection. 3 Biotech 2020, 10, 544. [Google Scholar] [CrossRef] [PubMed]
  17. Padra, J.T.; Sundh, H.; Sundell, K.; Venkatakrishnan, V.; Jin, C.; Samuelsson, T.; Karlsson, N.G.; Lindén, S.K. Aeromonas salmonicida Growth in Response to Atlantic Salmon Mucins Differs between Epithelial Sites, Is Governed by Sialylated and N-Acetylhexosamine-Containing O -Glycans, and Is Affected by Ca2+. Infect. Immun. 2017, 85, 10–1128. [Google Scholar] [CrossRef] [Green Version]
  18. Jiang, M.; Gong, Q.; Lai, S.; Cheng, Z.; Chen, Z.; Zheng, J.; Peng, B. Phenylalanine enhances innate immune response to clear ceftazidime-resistant Vibrio alginolyticus in Danio rerio. Fish Shellfish Immunol. 2019, 84, 912–919. [Google Scholar] [CrossRef] [PubMed]
  19. Castro, R.; Jouneau, L.; Tacchi, L.; Macqueen, D.J.; Alzaid, A.; Secombes, C.J.; Martin, S.A.M.; Boudinot, P. Disparate developmental patterns of immune responses to bacterial and viral infections in fish. Sci. Rep. 2015, 5, 15458. [Google Scholar] [CrossRef] [Green Version]
  20. Low, C.-F.; Rozaini, M.Z.H.; Musa, N.; Syarul Nataqain, B. Current knowledge of metabolomic approach in infectious fish disease studies. J. Fish Dis. 2017, 40, 1267–1277. [Google Scholar] [CrossRef]
  21. Natnan, M.E.; Low, C.F.; Chong, C.M.; Daud, N.I.N.A.A.; Om, A.D.; Baharum, S.N. Comparison of Different Dietary Fatty Acids Supplement on the Immune Response of Hybrid Grouper (Epinephelus fuscoguttatus × Epinephelus lanceolatus) Challenged with Vibrio vulnificus. Biology 2022, 11, 1288. [Google Scholar] [CrossRef]
  22. Nurdalila, A.A.; Mayalvanan, Y.; Baharum, S.N. Metabolite profiling of Epinephelus fuscoguttatus infected with vibriosis reveals Omega 9 as potential metabolite biomarker. Fish Physiol. Biochem. 2019, 45, 1203–1215. [Google Scholar] [CrossRef]
  23. Mayalvanan, Y. Metabolomics Study of the Response of Epinephelus Fuscoguttatus towards Vibriosis. Master’s Dissertation, Universiti Kebangsaan Malaysia, Selangor, Malaysia, 2019. [Google Scholar]
  24. Wu, H.; Southam, A.D.; Hines, A.; Viant, M.R. High-throughput tissue extraction protocol for NMR- and MS-based metabolomics. Anal. Biochem. 2008, 372, 204–212. [Google Scholar] [CrossRef]
  25. Ahmad, R.; Lim, C.K.; Marzuki, N.F.; Goh, Y.-K.; Azizan, K.A.; Goh, Y.K.; Goh, K.J.; Ramzi, A.B.; Baharum, S.N. Metabolic Profile of Scytalidium parasiticum-Ganoderma boninense Co-Cultures Revealed the Alkaloids, Flavonoids and Fatty Acids that Contribute to Anti-Ganoderma Activity. Molecules 2020, 25, 5965. [Google Scholar] [CrossRef] [PubMed]
  26. Choi, S.-G.; Won, S.-R.; Rhee, H.-I. Oleic Acid and Inhibition of Glucosyltransferase. In Olives and Olive Oil in Health and Disease Prevention; Elsevier: Amsterdam, The Netherlands, 2010; pp. 1375–1383. [Google Scholar]
  27. Firdaus, R.F.; Lim, L.S.; Kawamura, G.; Shapawi, R. Assessment on the acceptability of hybrid grouper, Epinephelus fuscoguttatus ♀ × Epinephelus lanceolatus ♂ to soybeanmeal-based diets. Aquac. Aquar. Conserv. Legis. Int. J. Bioflux Soc. 2016, 9, 284–290. [Google Scholar]
  28. Mohd Faudzi, N.; Yong, A.S.K.; Shapawi, R.; Senoo, S.; Biswas, A.; Takii, K. Soy protein concentrate as an alternative in replacement of fish meal in the feeds of hybrid grouper, brown-marbled grouper (Epinephelus fuscoguttatus) × giant grouper (E. lanceolatus) juvenile. Aquac. Res. 2018, 49, 431–441. [Google Scholar] [CrossRef]
  29. Adekoya, A.; Porcadilla, M.; Varga, D.; Kucska, B. Replacing fish meal with alternative protein sources in common carp’s feed. Acta Agrar. Kaposváriensis 2018, 22, 18–24. [Google Scholar] [CrossRef]
  30. Hidalgo, M.A.; Carretta, M.D.; Burgos, R.A. Long Chain Fatty Acids as Modulators of Immune Cells Function: Contribution of FFA1 and FFA4 Receptors. Front. Physiol. 2021, 12, 668330. [Google Scholar] [CrossRef]
  31. Ishak, W.M.W.; Katas, H.; Yuen, N.P.; Abdullah, M.A.; Zulfakar, M.H. Topical application of omega-3-, omega-6-, and omega-9-rich oil emulsions for cutaneous wound healing in rats. Drug Deliv. Transl. Res. 2019, 9, 418–433. [Google Scholar] [CrossRef]
  32. Fadjar, M.; Andajani, S.; Zaelani, K. Squid (Loligo edulis) ink raw extract as an anti– vibriosis substance in grouper (Epinephelus fuscoguttatus) juvenile culture infected by Vibrio alginolyticus. AACL Bioflux 2016, 9, 422–428. [Google Scholar]
  33. Reddy, K.V.K.; Naidu, K.A. Oleic acid, hydroxytyrosol and n -3 fatty acids collectively modulate colitis through reduction of oxidative stress and IL-8 synthesis; in vitro and in vivo studies. Int. Immunopharmacol. 2016, 35, 29–42. [Google Scholar] [CrossRef] [PubMed]
  34. Martínez, L.; Ros, G.; Nieto, G. Hydroxytyrosol: Health Benefits and Use as Functional Ingredient in Meat. Medicines 2018, 5, 13. [Google Scholar] [CrossRef] [PubMed] [Green Version]
  35. Pereira, L.M.; Hatanaka, E.; Martins, E.F.; Oliveira, F.; Liberti, E.A.; Farsky, S.H.; Curi, R.; Pithon-Curi, T.C. Effect of oleic and linoleic acids on the inflammatory phase of wound healing in rats. Cell Biochem. Funct. 2008, 26, 197–204. [Google Scholar] [CrossRef]
  36. Bhattacharya, S.; Aggarwal, A. M2 macrophages and their role in rheumatic diseases. Rheumatol. Int. 2019, 39, 769–780. [Google Scholar] [CrossRef]
  37. Chang, X.; Zhang, J.; Li, D.; Zhou, D.; Zhang, Y.; Wang, J.; Hu, B.; Ju, A.; Ye, Z. Nontargeted metabolomics approach for the differentiation of cultivation ages of mountain cultivated ginseng leaves using UHPLC/QTOF-MS. J. Pharm. Biomed. Anal. 2017, 141, 108–122. [Google Scholar] [CrossRef] [PubMed]
  38. Baharum, S.N.; Mayalvanan, Y.; Natnan, M.E.; Azizan, K.A.; Bunawan, H.; Him, N.R.N.; Low, C.-F.; Chong, C.-M. LC–qTOF-MS analysis of fish immune organs reveals the distribution of amino acids in response to metabolic adaptation of the survival phenotype in grouper against Vibrio infection. 3 Biotech 2022, 12, 206. [Google Scholar] [CrossRef] [PubMed]
  39. Araújo, B.C.; Wade, N.M.; de Mello, P.H.; Rodrigues-Filho, J.d.A.; Garcia, C.E.O.; de Campos, M.F.; Botwright, N.A.; Hashimoto, D.T.; Moreira, R.G. Characterization of lipid metabolism genes and the influence of fatty acid supplementation in the hepatic lipid metabolism of dusky grouper (Epinephelus marginatus). Comp. Biochem. Physiol. Part A Mol. Integr. Physiol. 2018, 219–220, 1–9. [Google Scholar] [CrossRef] [Green Version]
  40. Jia, S.; Li, X.; Zheng, S.; Wu, G. Amino acids are major energy substrates for tissues of hybrid striped bass and zebrafish. Amino Acids 2017, 49, 2053–2063. [Google Scholar] [CrossRef] [PubMed]
  41. Hamm, L.L.; Nakhoul, N.; Hering-Smith, K.S. Acid-Base Homeostasis. Clin. J. Am. Soc. Nephrol. 2015, 10, 2232–2242. [Google Scholar] [CrossRef] [PubMed] [Green Version]
  42. Hou, Y.; Yin, Y.; Wu, G. Dietary essentiality of “nutritionally non-essential amino acids” for animals and humans. Exp. Biol. Med. 2015, 240, 997–1007. [Google Scholar] [CrossRef] [Green Version]
  43. Ren, W.; Xia, Y.; Chen, S.; Wu, G.; Bazer, F.W.; Zhou, B.; Tan, B.; Zhu, G.; Deng, J.; Yin, Y. Glutamine Metabolism in Macrophages: A Novel Target for Obesity/Type 2 Diabetes. Adv. Nutr. 2019, 10, 321–330. [Google Scholar] [CrossRef] [Green Version]
  44. Iser, I.C.; Bracco, P.A.; Gonçalves, C.E.I.; Zanin, R.F.; Nardi, N.B.; Lenz, G.; Battastini, A.M.O.; Wink, M.R. Mesenchymal Stem Cells From Different Murine Tissues Have Differential Capacity to Metabolize Extracellular Nucleotides. J. Cell Biochem. 2014, 115, 1673–1682. [Google Scholar] [CrossRef]
  45. Gong, Q.; Yang, D.; Jiang, M.; Zheng, J.; Peng, B. L-aspartic acid promotes fish survival against Vibrio alginolyticus infection through nitric oxide-induced phagocytosis. Fish Shellfish Immunol. 2020, 97, 359–366. [Google Scholar] [CrossRef]
  46. Hu, Y.; Feng, L.; Jiang, W.; Wu, P.; Liu, Y.; Kuang, S.; Tang, L.; Zhou, X. Lysine deficiency impaired growth performance and immune response and aggravated inflammatory response of the skin, spleen and head kidney in grown-up grass carp (Ctenopharyngodon idella). Anim. Nutr. 2021, 7, 556–568. [Google Scholar] [CrossRef] [PubMed]
  47. Yang, P.; Wang, W.; Chi, S.; Mai, K.; Song, F.; Wang, L. Effects of dietary lysine on regulating GH-IGF system, intermediate metabolism and immune response in largemouth bass (Micropterus salmoides). Aquac. Rep. 2020, 17, 100323. [Google Scholar] [CrossRef]
  48. Ahmed, I.; Ahmad, I. Dietary lysine modulates growth performance, haemato-biochemical indices, non-specific immune response, intestinal enzymatic activities and antioxidant properties of rainbow trout, Oncorhynchus mykiss fingerlings. Aquac. Nutr. 2021, 27, 124–139. [Google Scholar] [CrossRef]
  49. Jiang, M.; Chen, Z.; Li, H.; Zhang, T.; Yang, M.; Peng, X.; Peng, B. Succinate and inosine coordinate innate immune response to bacterial infection. PLoS Pathog. 2022, 18, e1010796. [Google Scholar] [CrossRef] [PubMed]
  50. Zhang, S.; Yang, M.; Peng, B.; Peng, X.; Li, H. Reduced ROS-mediated antibiotic resistance and its reverting by glucose in Vibrio alginolyticus. Environ. Microbiol. 2020, 22, 4367–4380. [Google Scholar] [CrossRef] [PubMed]
  51. Araújo, B.C.; Skrzynska, A.K.; Marques, V.H.; Tinajero, A.; Del Rio-Zaragoza, O.B.; Viana, M.T.; Mata-Sotres, J.A. Dietary Arachidonic Acid (20:4n-6) Levels and Its Effect on Growth Performance, Fatty Acid Profile, Gene Expression for Lipid Metabolism, and Health Status of Juvenile California Yellowtail (Seriola dorsalis). Fishes 2022, 7, 185. [Google Scholar] [CrossRef]
  52. Reddy, K.V.K.; Naidu, K.A. Maternal and neonatal dietary intake of balanced n-6/n-3 fatty acids modulates experimental colitis in young adult rats. Eur. J. Nutr. 2016, 55, 1875–1890. [Google Scholar] [CrossRef] [PubMed]
  53. Rescigno, M. The intestinal epithelial barrier in the control of homeostasis and immunity. Trends Immunol. 2011, 32, 256–264. [Google Scholar] [CrossRef]
  54. Araújo, B.C.; Flores-Galvez, K.; Honji, R.M.; Barbosa, V.M.; Viana, M.T.; Tinajero, A.; Mata-Sotres, J.A. Arachidonic acid effects on the overall performance, fatty acid profile, hepatopancreas morphology and lipid-relevant genes in Litopenaeus vannamei juveniles. Aquaculture 2020, 523, 735207. [Google Scholar] [CrossRef]
  55. Salini, M.J.; Wade, N.M.; Araújo, B.C.; Turchini, G.M.; Glencross, B.D. Eicosapentaenoic Acid, Arachidonic Acid and Eicosanoid Metabolism in Juvenile Barramundi Lates calcarifer. Lipids 2016, 51, 973–988. [Google Scholar] [CrossRef]
  56. Allen, F.; Greiner, R.; Wishart, D. Competitive fragmentation modeling of ESI-MS/MS spectra for putative metabolite identification. Metabolomics 2015, 11, 98–110. [Google Scholar] [CrossRef] [Green Version]
  57. Nguyen, T.V.; Alfaro, A.C.; Young, T.; Ravi, S.; Merien, F. Metabolomics Study of Immune Responses of New Zealand GreenshellTM Mussels (Perna canaliculus) Infected with Pathogenic Vibrio sp. Mar. Biotechnol. 2018, 20, 396–409. [Google Scholar] [CrossRef] [PubMed]
  58. Kuo, C.-H.; Ballantyne, R.; Huang, P.-L.; Ding, S.; Hong, M.-C.; Lin, T.-Y.; Wu, F.-C.; Xu, Z.-Y.; Chiu, K.; Chen, B.; et al. Sarcodia suae modulates the immunity and disease resistance of white shrimp Litopenaeus vannamei against Vibrio alginolyticus via the purine metabolism and phenylalanine metabolism. Fish Shellfish Immunol. 2022, 127, 766–777. [Google Scholar] [CrossRef] [PubMed]
  59. Soto-Heredero, G.; Gómez de las Heras, M.M.; Gabandé-Rodríguez, E.; Oller, J.; Mittelbrunn, M. Glycolysis—A key player in the inflammatory response. FEBS J. 2020, 287, 3350–3369. [Google Scholar] [CrossRef] [Green Version]
  60. Maha, I.F.; Xie, X.; Zhou, S.; Yu, Y.; Liu, X.; Zahid, A.; Lei, Y.; Ma, R.; Yin, F.; Qian, D. Skin metabolome reveals immune responses in yellow drum Nibea albiflora to Cryptocaryon irritans infection. Fish Shellfish Immunol. 2019, 94, 661–674. [Google Scholar] [CrossRef]
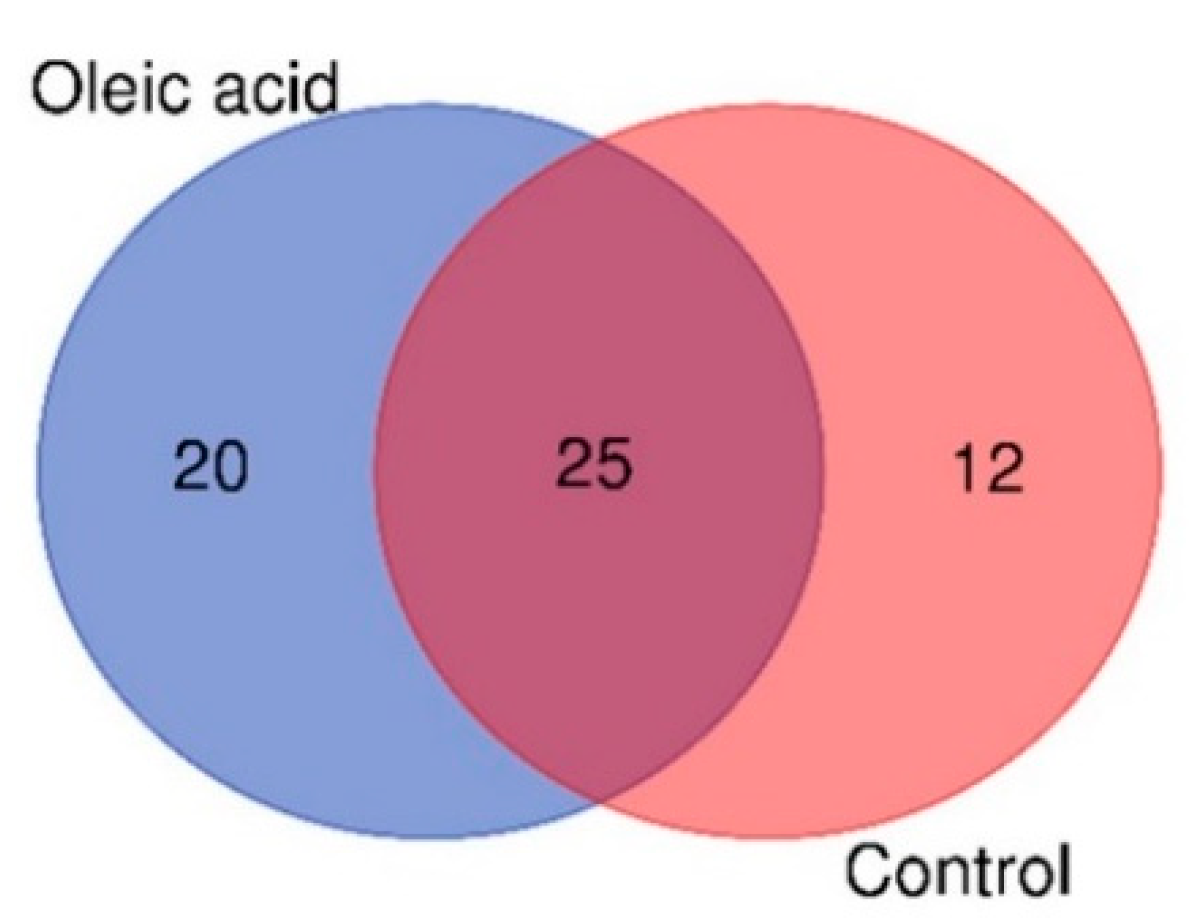
Figure 1. Venn diagram of the distribution of metabolites in the liver of surviving infected groupers fed with oleic acid and non-oleic acid (control) diets.
Jmse 11 01563 g001
Figure 2. Classification of putative metabolites detected from the surviving infected groupers fed with oleic acid and non-oleic acid diets (control) using LC-qTOF-MS.
Jmse 11 01563 g002
Figure 3. PCA score plot (a) and PLS-DA score plot (b) of metabolites depicting the separation pattern for the liver of the surviving infected groupers fed with oleic acid and control diets.
Jmse 11 01563 g003
Figure 4. Permutation test plot for the PLS-DA model to test the validity of the dataset of this study. A total of 100 permutations were generated using 2 components.
Jmse 11 01563 g004
Figure 5. Heatmap of detected metabolites from the liver samples of surviving infected grouper fed with oleic acid (OA) and non-oleic acid (C) diets. The intensity of metabolites was indicated by the dark maroon (high abundance) to blue (low abundance).
Jmse 11 01563 g005
Figure 6. Integrated pathways of groupers toward Vibrio infection after fed with oleic acid (OA) and non-oleic acid (C) formulated diets based on the metabolites present in the liver samples from the surviving infected groupers. Orange indicates pathways involving in the survival groupers fed with control and oleic acid diets, blue indicates pathways involving in the survival of groupers fed with control diet only, and green indicates pathways involving in the survival of groupers fed with oleic acid diet only. The box represents the average replicates corresponding to their intensities.
Jmse 11 01563 g006
Figure 7. Pathway impact and statistical analysis of metabolic pathways enrichment of metabolites in the liver of surviving infected grouper samples. Y-axis shows a negative logarithm of the p-value (p < 0.05), indicates pathways with higher statistical significance are drawn higher in the graph. X-axis shows the pathway impact value, where higher pathway impact values are drawn to the right side in the graph. white < yellow < orange < red indicated higher impact metabolic pathways.
Jmse 11 01563 g007
Table 1. Ingredients for fish diet formulation (%).
Experimental Diets
Ingredients Control Oleic Acid
Fish meal11.511.5
Soybean meal50.550.5
Corn flour24.024.0
Vegetable oil 7.57.5
Mineral mix a2.02.0
Vitamin mix b2.02.0
α-Cellulose c2.50.5
Oleic acid d (immunostimulant)0.02.0 a
Proximate composition e
Crude carbohydrate 45.743.7
Crude protein 31.331.4
Crude lipid 9.411.4
Crude ash 6.96.7
Moisture 6.76.8
Energy (kcl/100 g)392403
a Vitamin mixture per kg: vitamin A, 5,000,000 IU; vitamin B2, 15,000 IU; vitamin D3, 1,000,000 IU; vitamin B6, 12,000 IU; vitamin B1, 15,000 mg; vitamin B12, 25 mg; vitamin C, 300,000 mg; vitamin E, 50,000 mg; vitamin K3, 5000 mg; biotin, 500 mg; folic acid, 2500 mg; pantothenic acid, 25,000 mg; inositol, 125,000 mg; niacin, 50,000 mg (Dexchem Industries Sdn. Bhd., Penang, Malaysia). b Mineral mixture per kg: KCl, 50,000 mg; NaCl, 60,000 mg; MgSO4, 137,000 mg; Fe, 15,000 mg; Zn, 1894 mg; Cu, 785 mg; iodine, 150 mg; Mn, 800 mg; Co, 100 mg; Na, 20 mg; dicalcium phosphate, 723,251 mg; anti caking, 1000 mg (Dexchem Industries Sdn. Bhd., Penang, Malaysia). c α-Cellulose (Sigma-Aldrich Co. C8002, St. Louis, MO, USA). d oleic acid (R&M Chemicals 112801, Shah Alam, Malaysia). e Determined according to the Association of Official Analytical Chemists (AOAC) 20th Edition.
Table 2. Composition profile of fatty acids (mg/100 g on dry matter basis) in fish feed pellet.
Control DietOleic Acid Diet
Saturated fatty acids
C4:00.190.65
C8:00.580.81
C10:00.510.76
C11:00.541.00
C12:03.4115.11
C13:00.001.06
C14:019.4530.39
C15:05.557.61
C16:0947.56877.36
C17:09.1410.34
C18:0204.02221.62
C20:049.4348.15
C22:021.2723.25
C23:014.7023.58
C24:032.1383.99
Total 1308.471345.68
Monounsaturated fatty acids
C14:11.392.77
C15:10.971.69
C16:132.0140.31
C17:17.6713.04
C18:1n9 cis3144.734536.41
C20:1n946.2257.29
C22:1n92.326.63
C24:113.83135.28
Total 3249.154793.43
Polyunsaturated fatty acids
C18:2n6 cis4633.965001.67
C18:3n610.607.23
C18:3n3116.47134.44
C20:23.344.96
C20:3n38.4116.99
C20:4n64.775.67
C20:5n315.1123.45
C22:210.827.62
C22:6n338.8958.86
Total 4842.385260.89
Analysis was determined according to the Association of Official Analytical Chemists (AOAC) 20th Edition.
Table 3. Top 30 Variable Influence on Projection (VIP) list from liver samples of survived-infected groupers.
NorT (min)m/z Valuep-ValueVIP ScorePossible Identity MetabolitesMolecular FormulaClassificationMetabolite Found in C or OA Diets
11.94144.1022.91 × 10−62.12187L-2-Amino-3-methylenehexanoic acidC7H13NO2Organic compoundC and OA
21.88638.2095.01 × 10−62.11906Glu Tyr Cys Met AlaC25H37N5O9S2PeptidesC and OA
312.74343.2283.09 × 10−62.11784Docosahexaenoic AcidC22H30O3Fatty acid OA
41.78175.0723.30 × 10−62.11728Formimino-L-glutamic acidC6H10N2O4Organic compoundOA
51.43274.8733.66 × 10−62.11725gamma-PentachlorocyclohexeneC6H5Cl5Organic compoundOA
62.67348.0705.74 × 10−62.11203Adenosine monophosphateC10H14N5O7PNucleotideOA
713.20301.2178.67 × 10−62.10981Retinoic acidC20H28O2Organic compoundOA
81.81184.0732.36 × 10−52.09841PhosphocholineC5H14NO4POrganic compoundC and OA
910.11447.0852.04 × 10−52.09709Mollicellin EC22H19ClO8Organic acidC
101.41242.9253.01 × 10−52.094272-IodophenolC6H5IOHydrocarbonOA
1113.39478.2945.97 × 10−52.08286Lysophosphatidylethanolamine(18:2)C23H44NO7PGlycerophospholipidOA
1213.69327.2326.64 × 10−52.080664,5-dehydro Docosahexaenoic AcidC22H30O2Fatty acidOA
1315.07454.2930.000102.07141Glycerophospho-N-Palmitoyl EthanolamineC21H44NO7PGlycerophospholipidsOA
141.33147.1120.000512.03694L-LysineC6H14N2O2Amino acidC and OA
151.48162.1120.001132.00266L-CarnitineC7H15NO3Amino acidC and OA
161.28265.1090.000841.99468ThiamineC12H16N4OSPyrimidineC and OA
1711.81341.2050.001071.98498Leukotriene A4C20H30O3Fatty acid OA
188.92180.0650.001501.97575Hippuric acidC9H9NO3Organic compoundC and OA
1916.43303.2320.001501.96799Eicosapentaenoic AcidC20H30O2Fatty acidOA
201.87476.1590.001841.9441L-IsobutanolC21H27NO10Organic compoundC and OA
2114.23321.2380.004881.8981218-hydroxy-arachidonic acidC20H32O3Fatty acidC and OA
226.40311.1180.003941.883281-Pentadecanecarboxylic acidC15H18O7Fatty acidC and OA
2313.92321.2380.006841.8648218-hydroxy-arachidonic acidC20H32O3Fatty acidC and OA
243.02414.8780.010871.82293Bromophos-ethylC10H12BrCl2O3Organic acid C and OA
2512.05415.2100.010741.80898Lys His MetC17H30N6O4S1PeptidesC and OA
262.01425.1660.012681.75605Glu Asn TyrC18H24N4O8PeptidesC
271.84156.0320.023991.7164-NitrocatecholC6H5NO4PhenolC and OA
281.74147.0760.019741.70444L-GlutamineC5H10N2O3Amino acid C and OA
291.86612.1730.018891.70281Cyanidin 3-glucogalactosideC27H31O16Organic compound C and OA
301.92885.2470.029901.67622SalviamalvinC42H44O21polyketidesC
Table 4. List of metabolic pathways based on the differential metabolites present in the samples of survived-infected groupers fed with oleic acid and control diets.
Metabolic PathwayTotalp-Value−log 10 (p)FDRImpact Value
Biosynthesis of unsaturated fatty acids350.000248813.60410.02090
Purine metabolism660.0234241.63030.7540.05452
Alanine, aspartate and glutamate metabolism270.0269281.56980.7540.13296
D-Glutamine and D-glutamate metabolism60.0571471.2430.796450
Nitrogen metabolism60.0571471.2430.796450
Pyrimidine metabolism410.0582041.2350.796450.02446
Thiamine metabolism70.0663711.1780.796450
Aminoacyl-tRNA biosynthesis480.0770211.11340.808720
Biotin metabolism100.0935441.0290.873070
Arginine biosynthesis140.128630.890650.960430
Disclaimer/Publisher’s Note: The statements, opinions and data contained in all publications are solely those of the individual author(s) and contributor(s) and not of MDPI and/or the editor(s). MDPI and/or the editor(s) disclaim responsibility for any injury to people or property resulting from any ideas, methods, instructions or products referred to in the content.