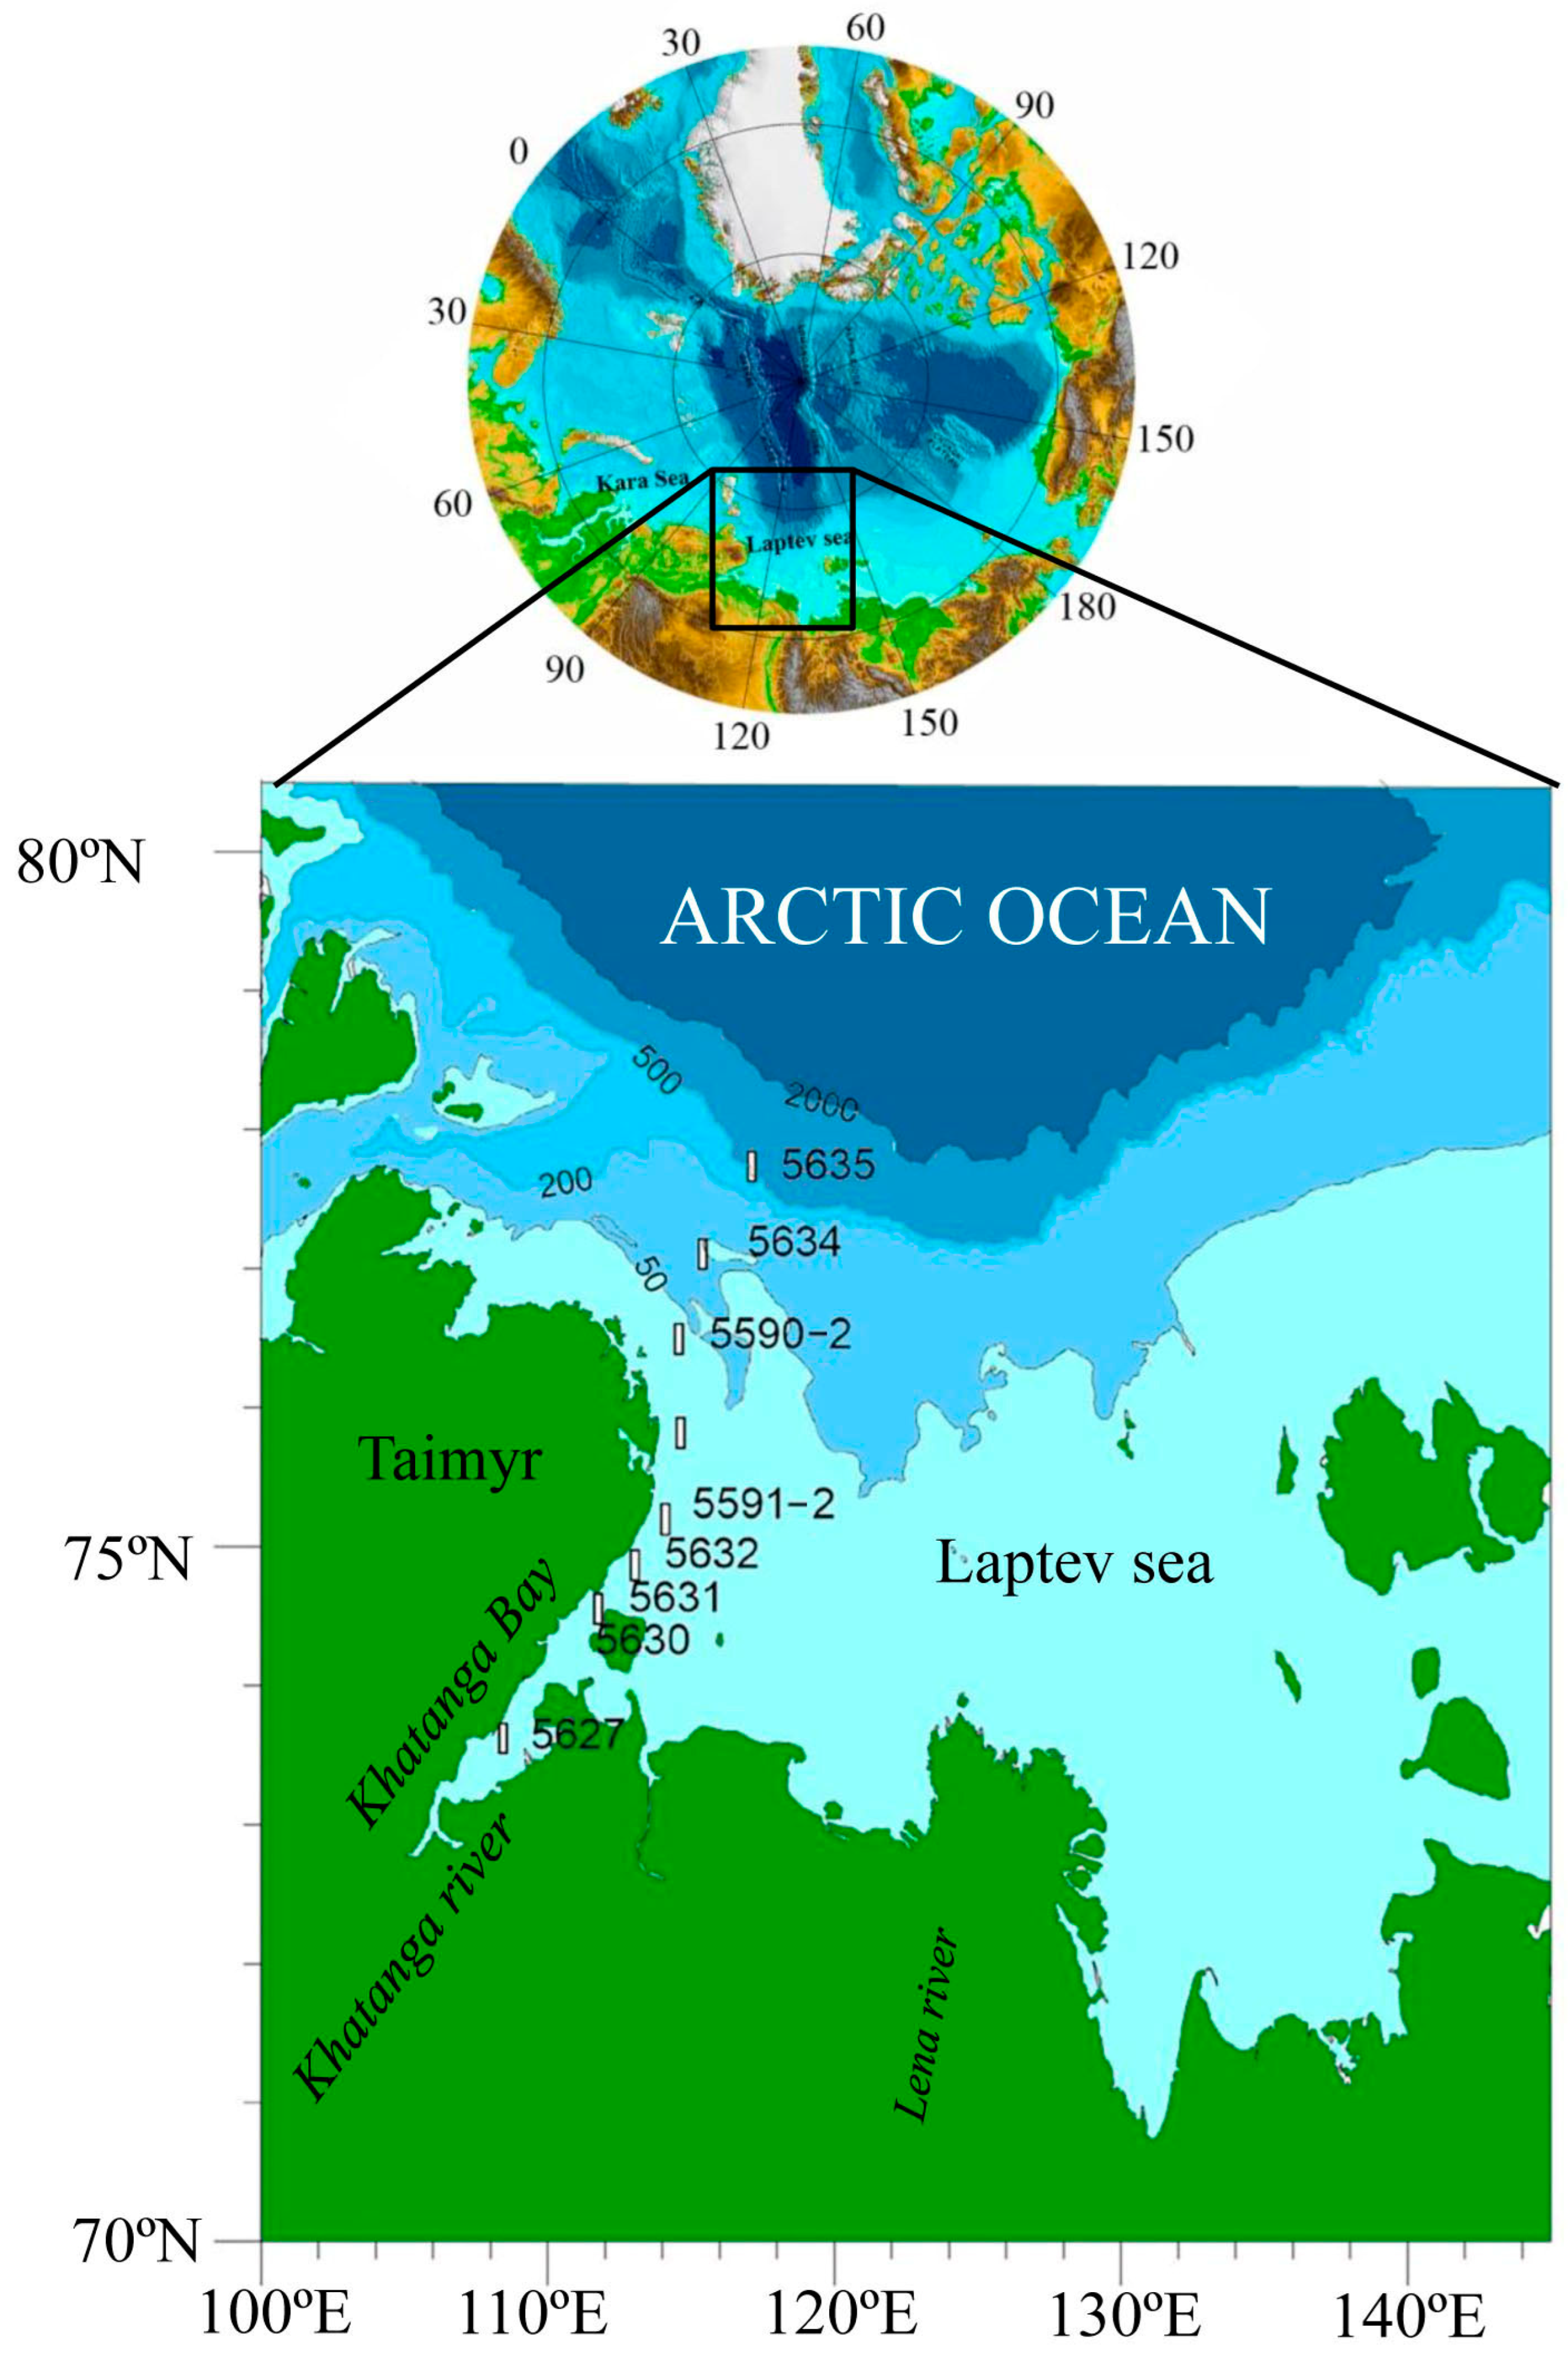
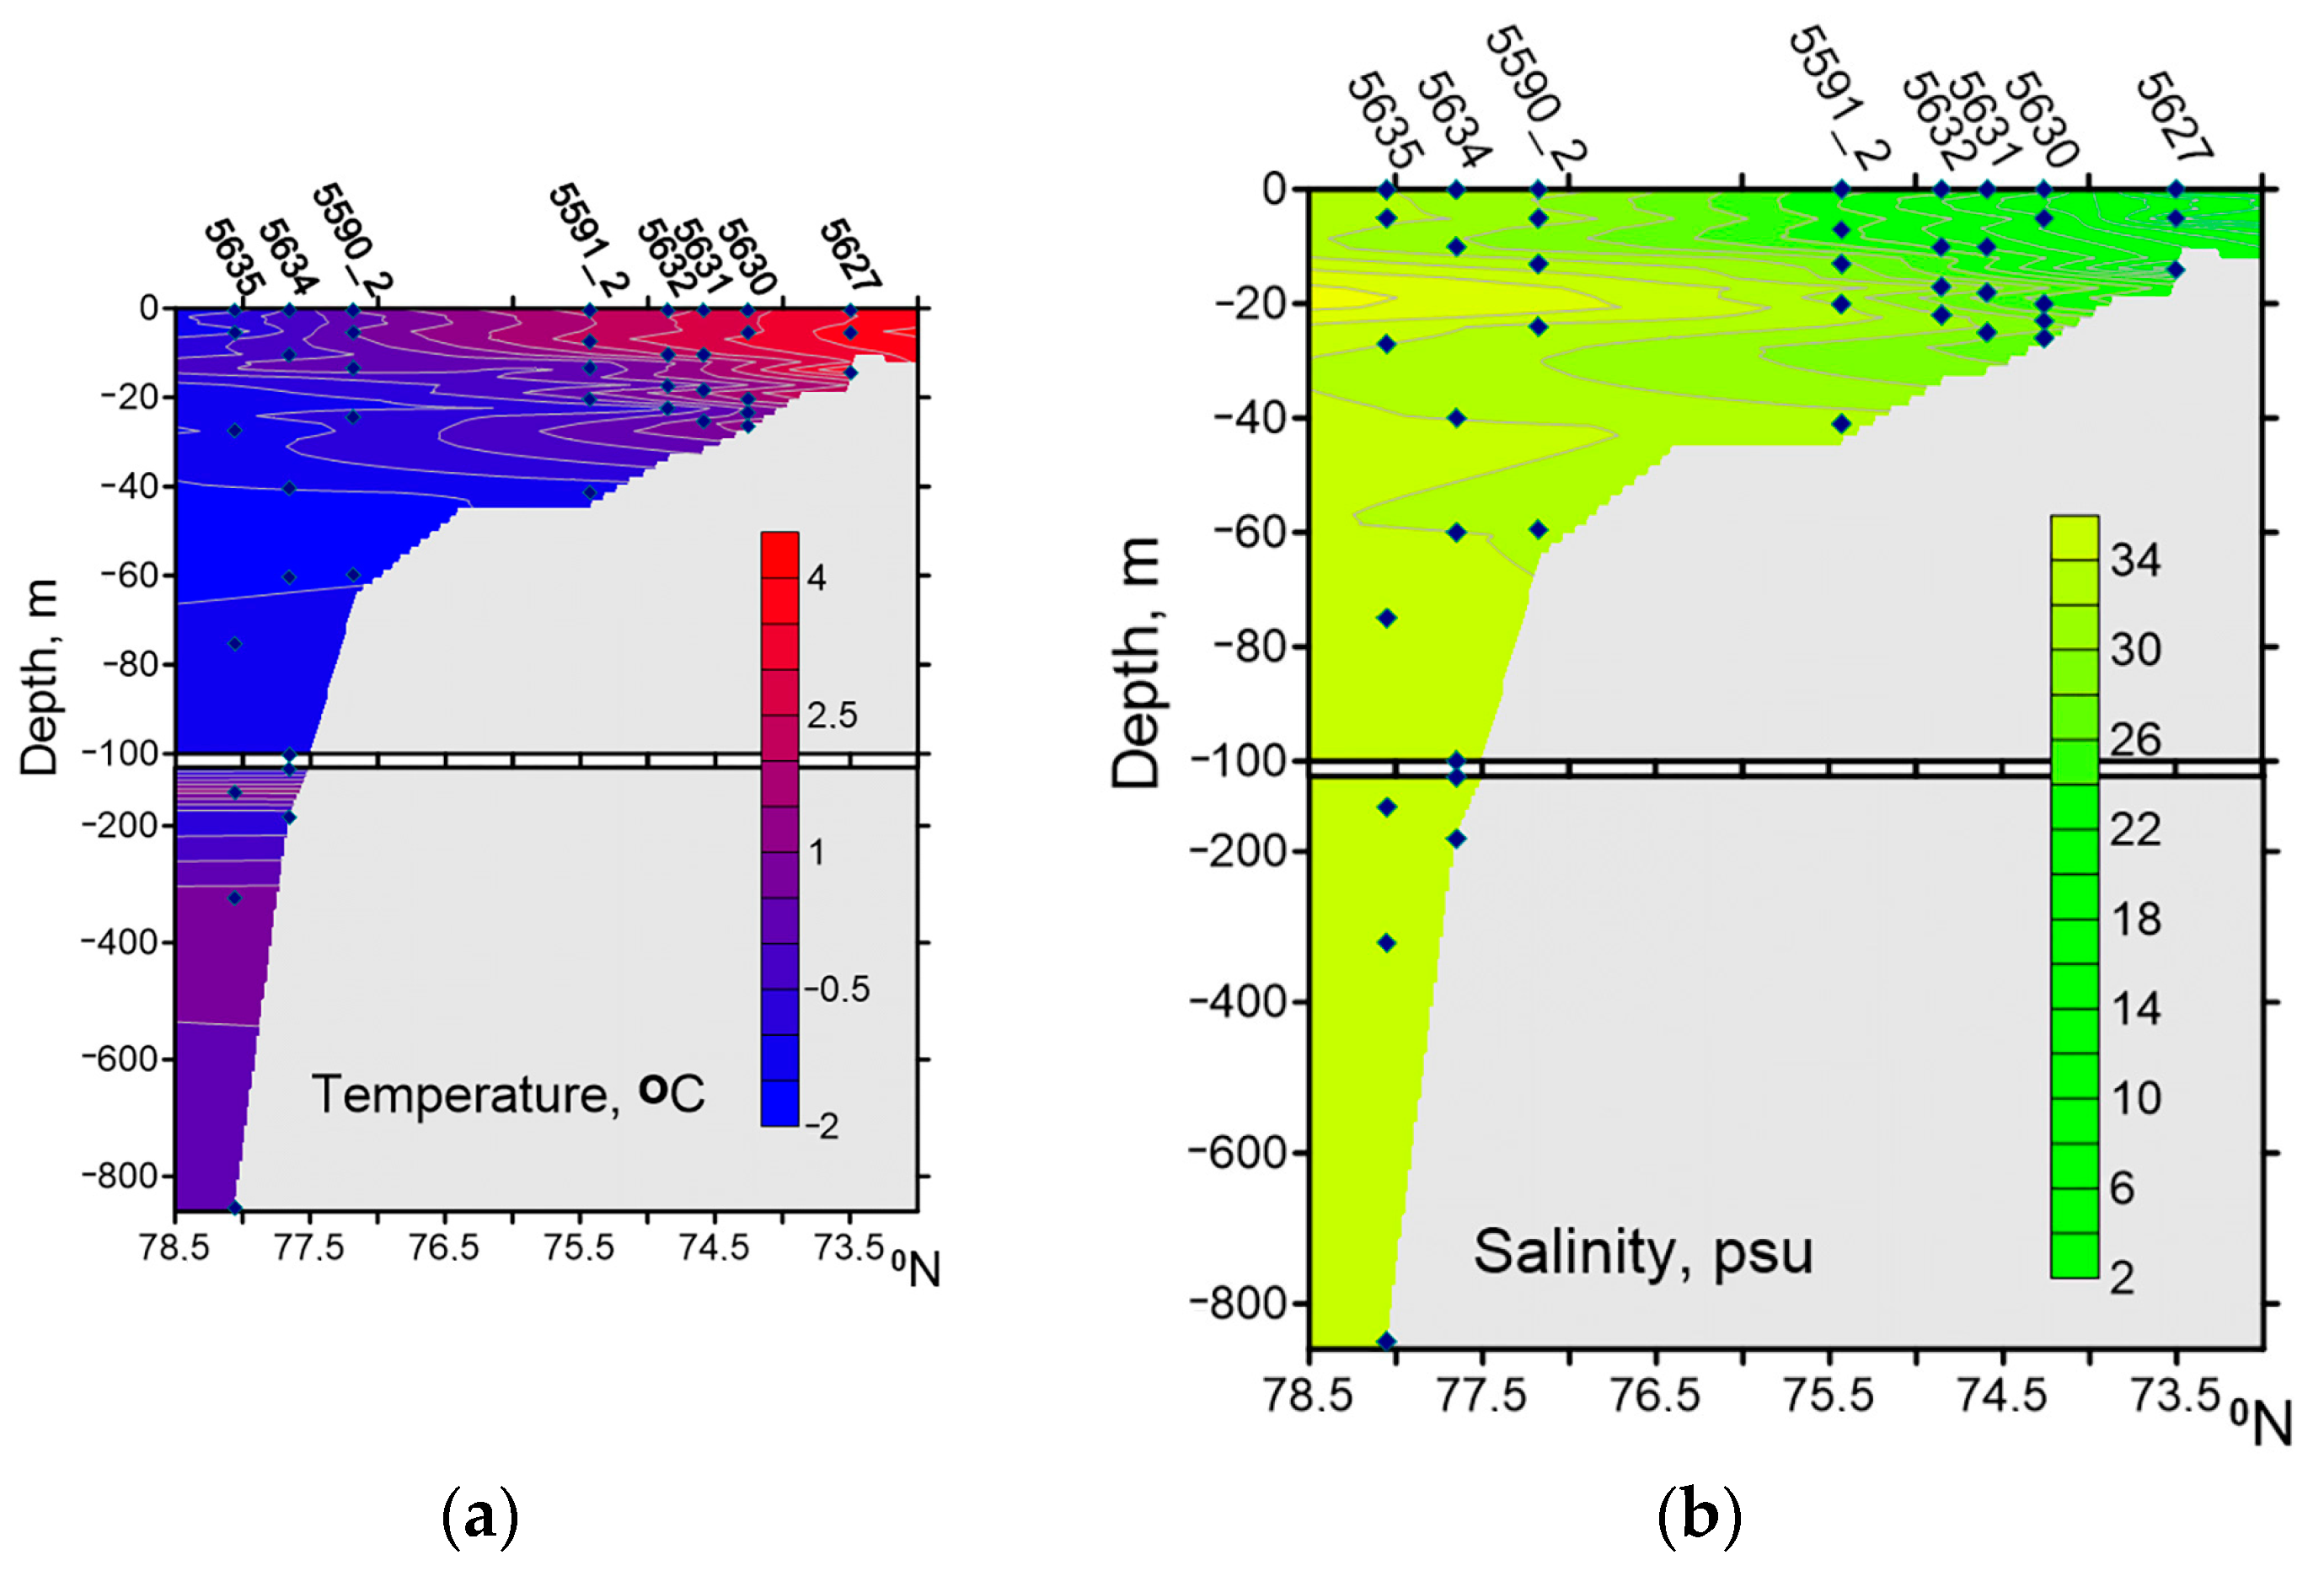
The Western Laptev Sea is impacted by Khatanga River freshwater runoff. The river water reduces the surface salinity in Khatanga Bay to 3.5–5.0 psu and increases the temperature to 3.9–4.2 °C. In September 2017, the primary production values for the water column along the transect from Khatanga Bay to the continental slope were low (
Table 7), which is explained by the low level of incident radiation and low nutrient concentrations [
51,
54]. At the same time, relatively high concentrations of DOC (162–728 μM) were observed in the Western Laptev Sea during this period (
Table 1). The higher DOC concentration measured for the upper water layer in the mixing zone formed under the influence of Katanga River runoff [
36]. Breakdown of dead algae cells, production of marine biota, and reworking of DOM were considered possible autochthonous sources of fluorescent dissolved organic matter in the Siberian shelf seas in September 2017 [
55].
During the study period, a positive correlation (r = 0.75,
p < 0.05,
n = 8) between the chlorophyll a concentration and bacterioplankton biomass in the surface water layer was observed, but no correlation between the integral values of these parameters for the photic zone. Only a weak positive correlation was revealed between the integral values of the phytoplankton (B
PH + B
PPH,
Table 7) and bacterioplankton biomass for the photic zone. In the surface water layer, a strong positive correlation was established between the primary production of phytoplankton and bacterioplankton (r = 0.83,
p < 0.05,
n = 8), but no relationship was found between the integral values of these parameters for the photic zone.
Heterotrophic nanoflagellates (HNF) were observed in all samples (
Table 7). The abundance of HNF varied from 70 cells mL
−1 (continental slope) to 636 cells mL
−1 (Khatanga Bay), averaging 205 ± 25 cells mL
−1. The ratio of bacteria abundance to HNF abundance (1225−9469, 3089 ± 319 on average) indicated favorable trophic conditions for the development of bacterivorous HNF. The HNF biomass was 8.1–53.8 (on average 27.4 ± 1.9) % of the bacterioplankton biomass. Strong positive correlations were found between the abundance of bacteria and the abundance of HNF, as well as between the biomass of bacteria and the biomass of HNF: respectively, r = 0.73,
p < 0.001,
n = 34, and r = 0.82,
p < 0.001,
n = 34. Apparently, at the end of the growing season, HNFs play an essential role as regulators of bacterial abundance in the water column.
4.1. DAPI-Positive Yellow Suspended Particles
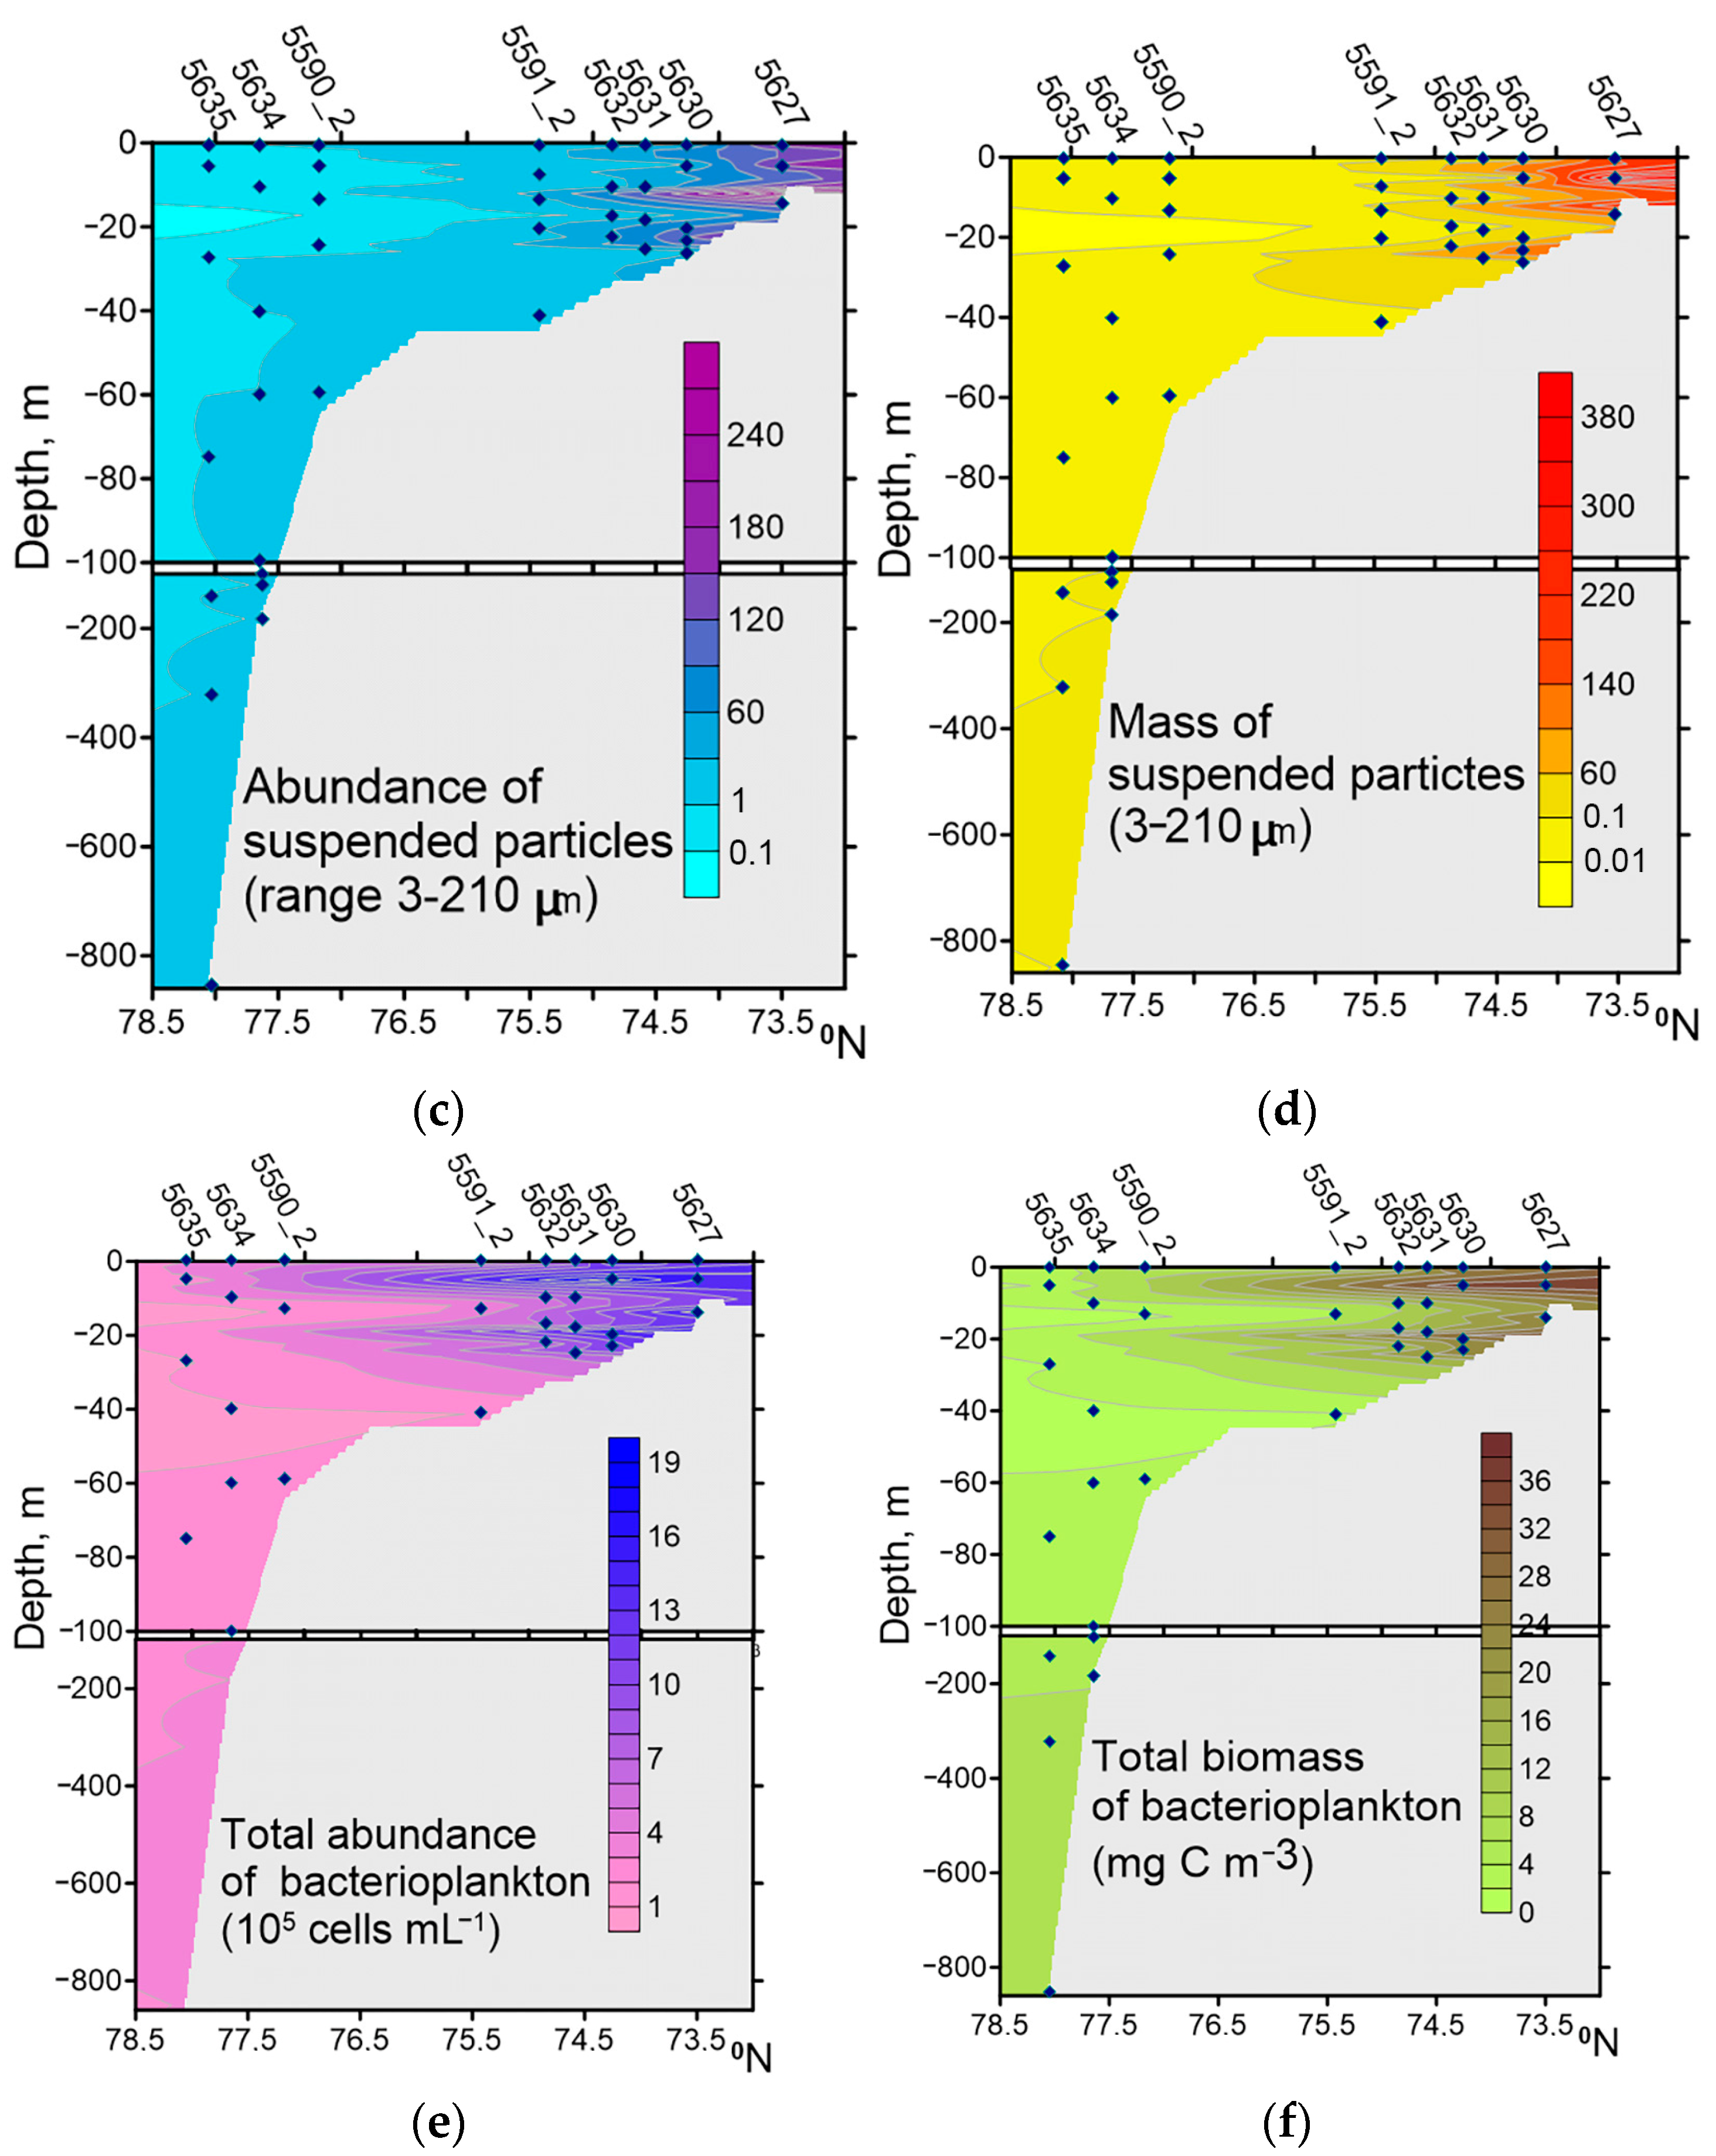
Together with runoff, a large amount of DAPI-positive yellow suspended particles (DYP) enters the sea. On average, the mass of organic suspended particles with attached microorganisms and viruses in Khatanga Bay, the TZ, and on the WS exceeded the plankton biomass in raw matter, respectively, by 300, 89, and 6 times, whereas in the CS area, it was 1.5 times lower. Note that in KHAB, the TZ, and estuaries of other Siberian rivers, viruses and HNF are also attached to suspended particles [
58,
59]. These particle-based microbial communities may likely be a food source for higher trophic levels [
19].
In surface waters from the Humber estuary, the concentration of SPM in September was 138–274 g m
−3. As well, 58–77% of particles were in the 5–14 μm size range; 12–30%, <5 μm; and only 2–13% were >24 μm [
60]. In water samples taken at a station 500 m off the coast of Bilbao, Spain, the number of particles >3 μm reached 39.5 × 10
3 particles mL
−1 [
15]. The share of particles with bacterial cells was 52.0–68.1%. “In particles on which bacteria were observed, the average number of bacteria fluctuated between 2.9 and 6.4 bacteria per particle” [
15]. “Bacteria are a high-quality food source, and when they are attached to particles, they increase the quality of detrital material as food” [
61]. “Particle-attached bacteria can play a very different role in a food web than free-living bacteria, because they may be directly grazed upon by larger metazoans, bypassing consumption by protozoan grazers and short-circuiting the microbial loop” [
62]. “Detritivores metazoans may therefore be the principle consumers of bacterial biomass in estuaries” [
63].
4.2. Bacterial Abundance and Biomass
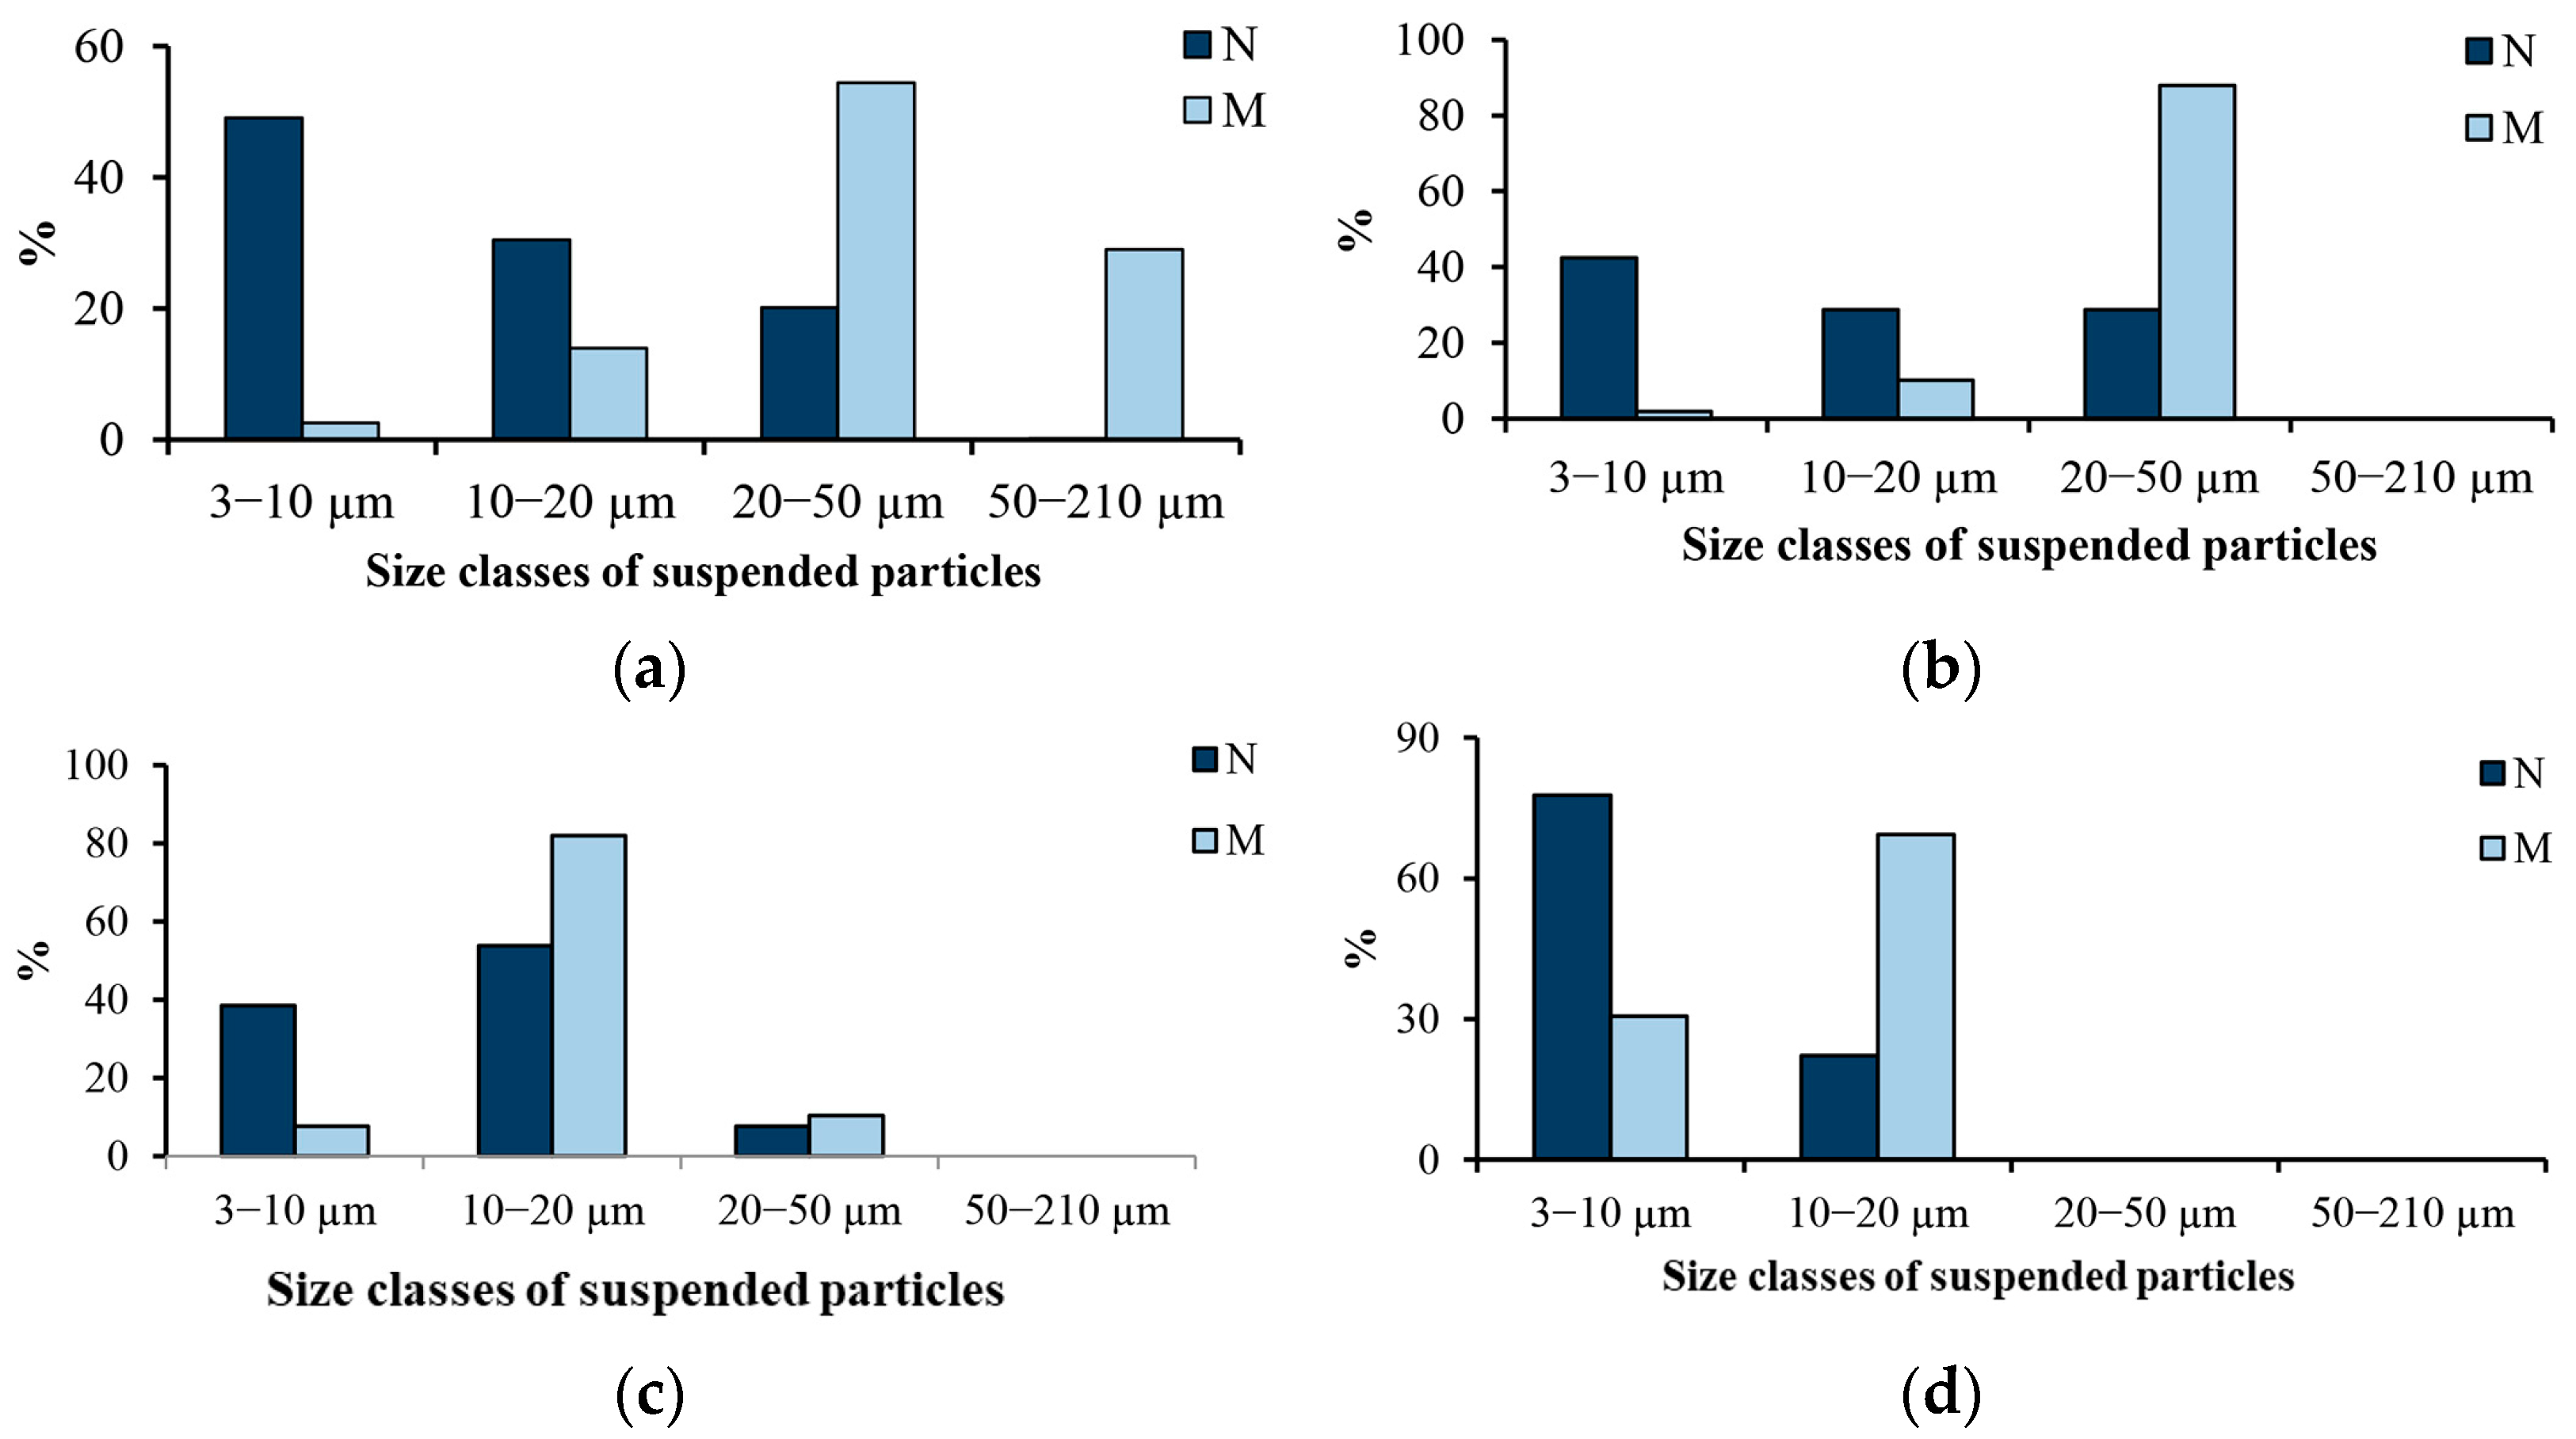
Water masses along our transect from Khatanga Bay to the Western shelf and continental slope of the Laptev Sea differed greatly in composition, abundance, biomass, and production of the bacterial community, which in turn were largely controlled by the availability, temperature, DOC, and abundance of suspended particles. We found large spatial variations in the contribution of particle-attached bacteria to the total bacterial abundance and biomass. The maximum values (79.8% NB and 77.7% BB) were found in the inner part of Khatanga Bay, and the minimum (0.1% NB and 0.1% BB) in the continental slope area at depths of 140–320 m. Particle-attached bacteria are an important structural component of the planktonic community of Khatanga Bay.
According to the literature data, in coastal waters, the abundance of bacteria attached to suspended particles can vary from a few percent to 98% of the total bacterial abundance in various aquatic regions, mainly depending on particle abundance [
15,
62].
As in other Arctic regions [
2,
25,
64], the total bacterial abundance and biomass in the Western Laptev Sea tend to decrease from the coast to the central Arctic Ocean. In our study, the maximum N
B and B
B values were close to those found in Arctic coastal waters (1.1–4.1) × 10
6 cells mL
−1 [
65,
66,
67,
68,
69,
70]; the minimum is typical of deeper regions of the Arctic Ocean (0.7–9.1) × 10
6 cells mL
−1 [
25,
64,
70,
71,
72,
73]. The average volume of a bacterial cell in the Laptev Sea is close to that in other areas of the Arctic (Chukchi Sea and Canada Basin), where it is approximately 0.05−0.09 μm
3 [
74]. In the Arctic Ocean, the bacterioplankton biomass varies from 5 mg C m
−3 in the Central Ocean [
75] to 100 mg C m
−3 in Disko Bay, Western Greenland [
65]. The bacterial biomass from the Western Laptev Sea is within the range of bacterial biomass reported from Arctic marine ecosystems [
65,
73,
75].
The phytoplankton and bacterial biomass in the photic zone of Arctic ecosystems were compared mainly in the spring and summer.
The integrated bacterial biomass in the Northern Barents Sea in the photic zone during the development of the spring bloom corresponded to 1–26% of the phytoplankton biomass [
73]. On the Western coast of Greenland during and after a diatom bloom (June), the bacterial and phytoplankton biomass ratio varied from 45–95% [
65]. At the end of summer, in this region, the integrated bacterioplankton biomass was 26–58% of the integrated phytoplankton biomass [
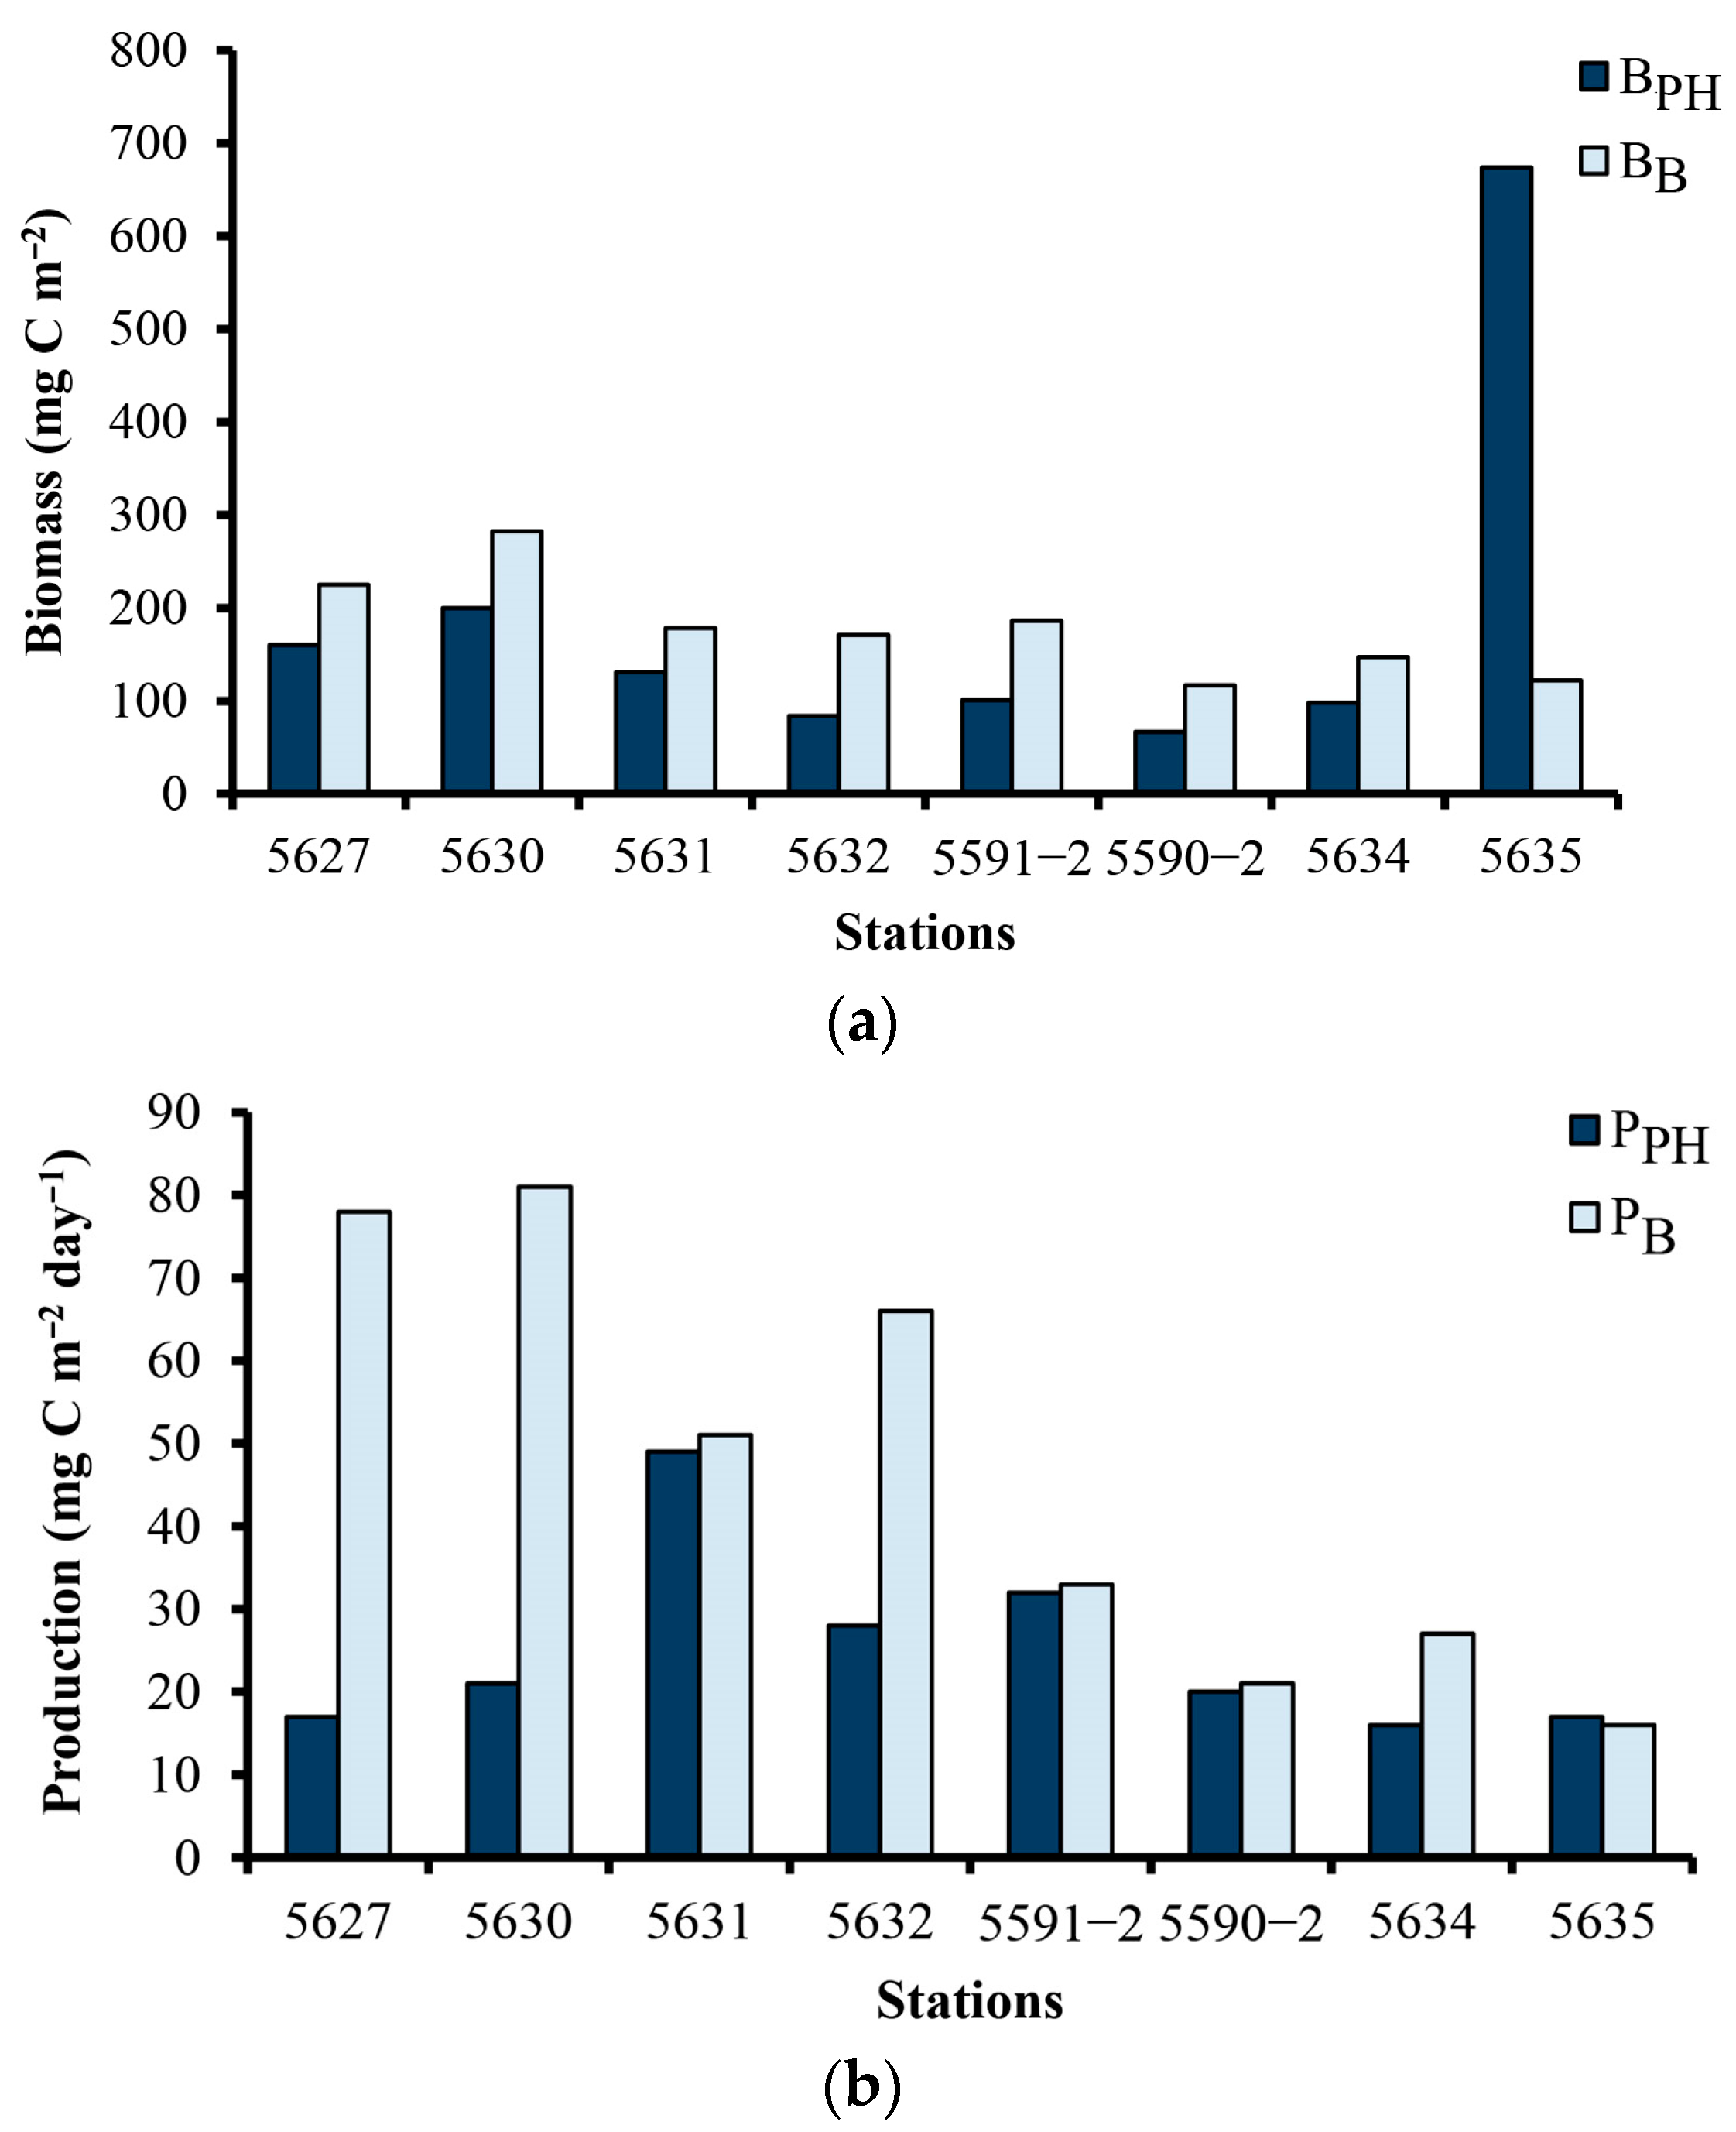
76]. The bacterial and phytoplankton biomass ratios obtained in our study in autumn differ from those found in spring and summer in areas unaffected by river runoff (
Figure 4). In Khatanga Bay and the Southern sector of the transition zone, the integral bacterioplankton biomass in the photic zone exceeded that of phytoplankton by a factor of 1.4; in the Northern sector of the transition zone and the Western shelf, the difference increased to 1.5–2.0 times. However, in the continental slope area, the integral bacterioplankton biomass was only 18.1% of the integral phytoplankton biomass (
Figure 4). These ratios largely depended on the distribution of phytoplankton biomass on the transect. In autumn, the average phytoplankton biomass in the zone of influence of Khatanga River runoff was relatively high (89–160 mg m
−3); on the shelf, they decreased significantly (up to 8–30 mg m
−3), but in the area of the continental slope, they again increased significantly (up to 150 mg m
−3) [
35]. The continental slope area in the Laptev Sea is a specific local biotope where a phytocenosis has developed with the formation of deep maxima, differing from adjacent areas. Deep phytoplankton maxima can occur due to the high water transparency, the large vertical extent of the euphotic layer, the absence of a rigid pycnocline, and the availability of nutrients [
35]. In September 1991, in the ecosystem of the Lena River estuary (Eastern Laptev Sea), during the period of mass development of the symbiotic ciliates
Mesodinium rubrum (Lohmann, 1908), the phytoplankton biomass was 12 times less than that of bacterioplankton, but taking into account the biomass of
M. rubrum, the biomasses of planktonic eukaryotic autotrophic and prokaryotic heterotrophic microorganisms were comparable [
32].
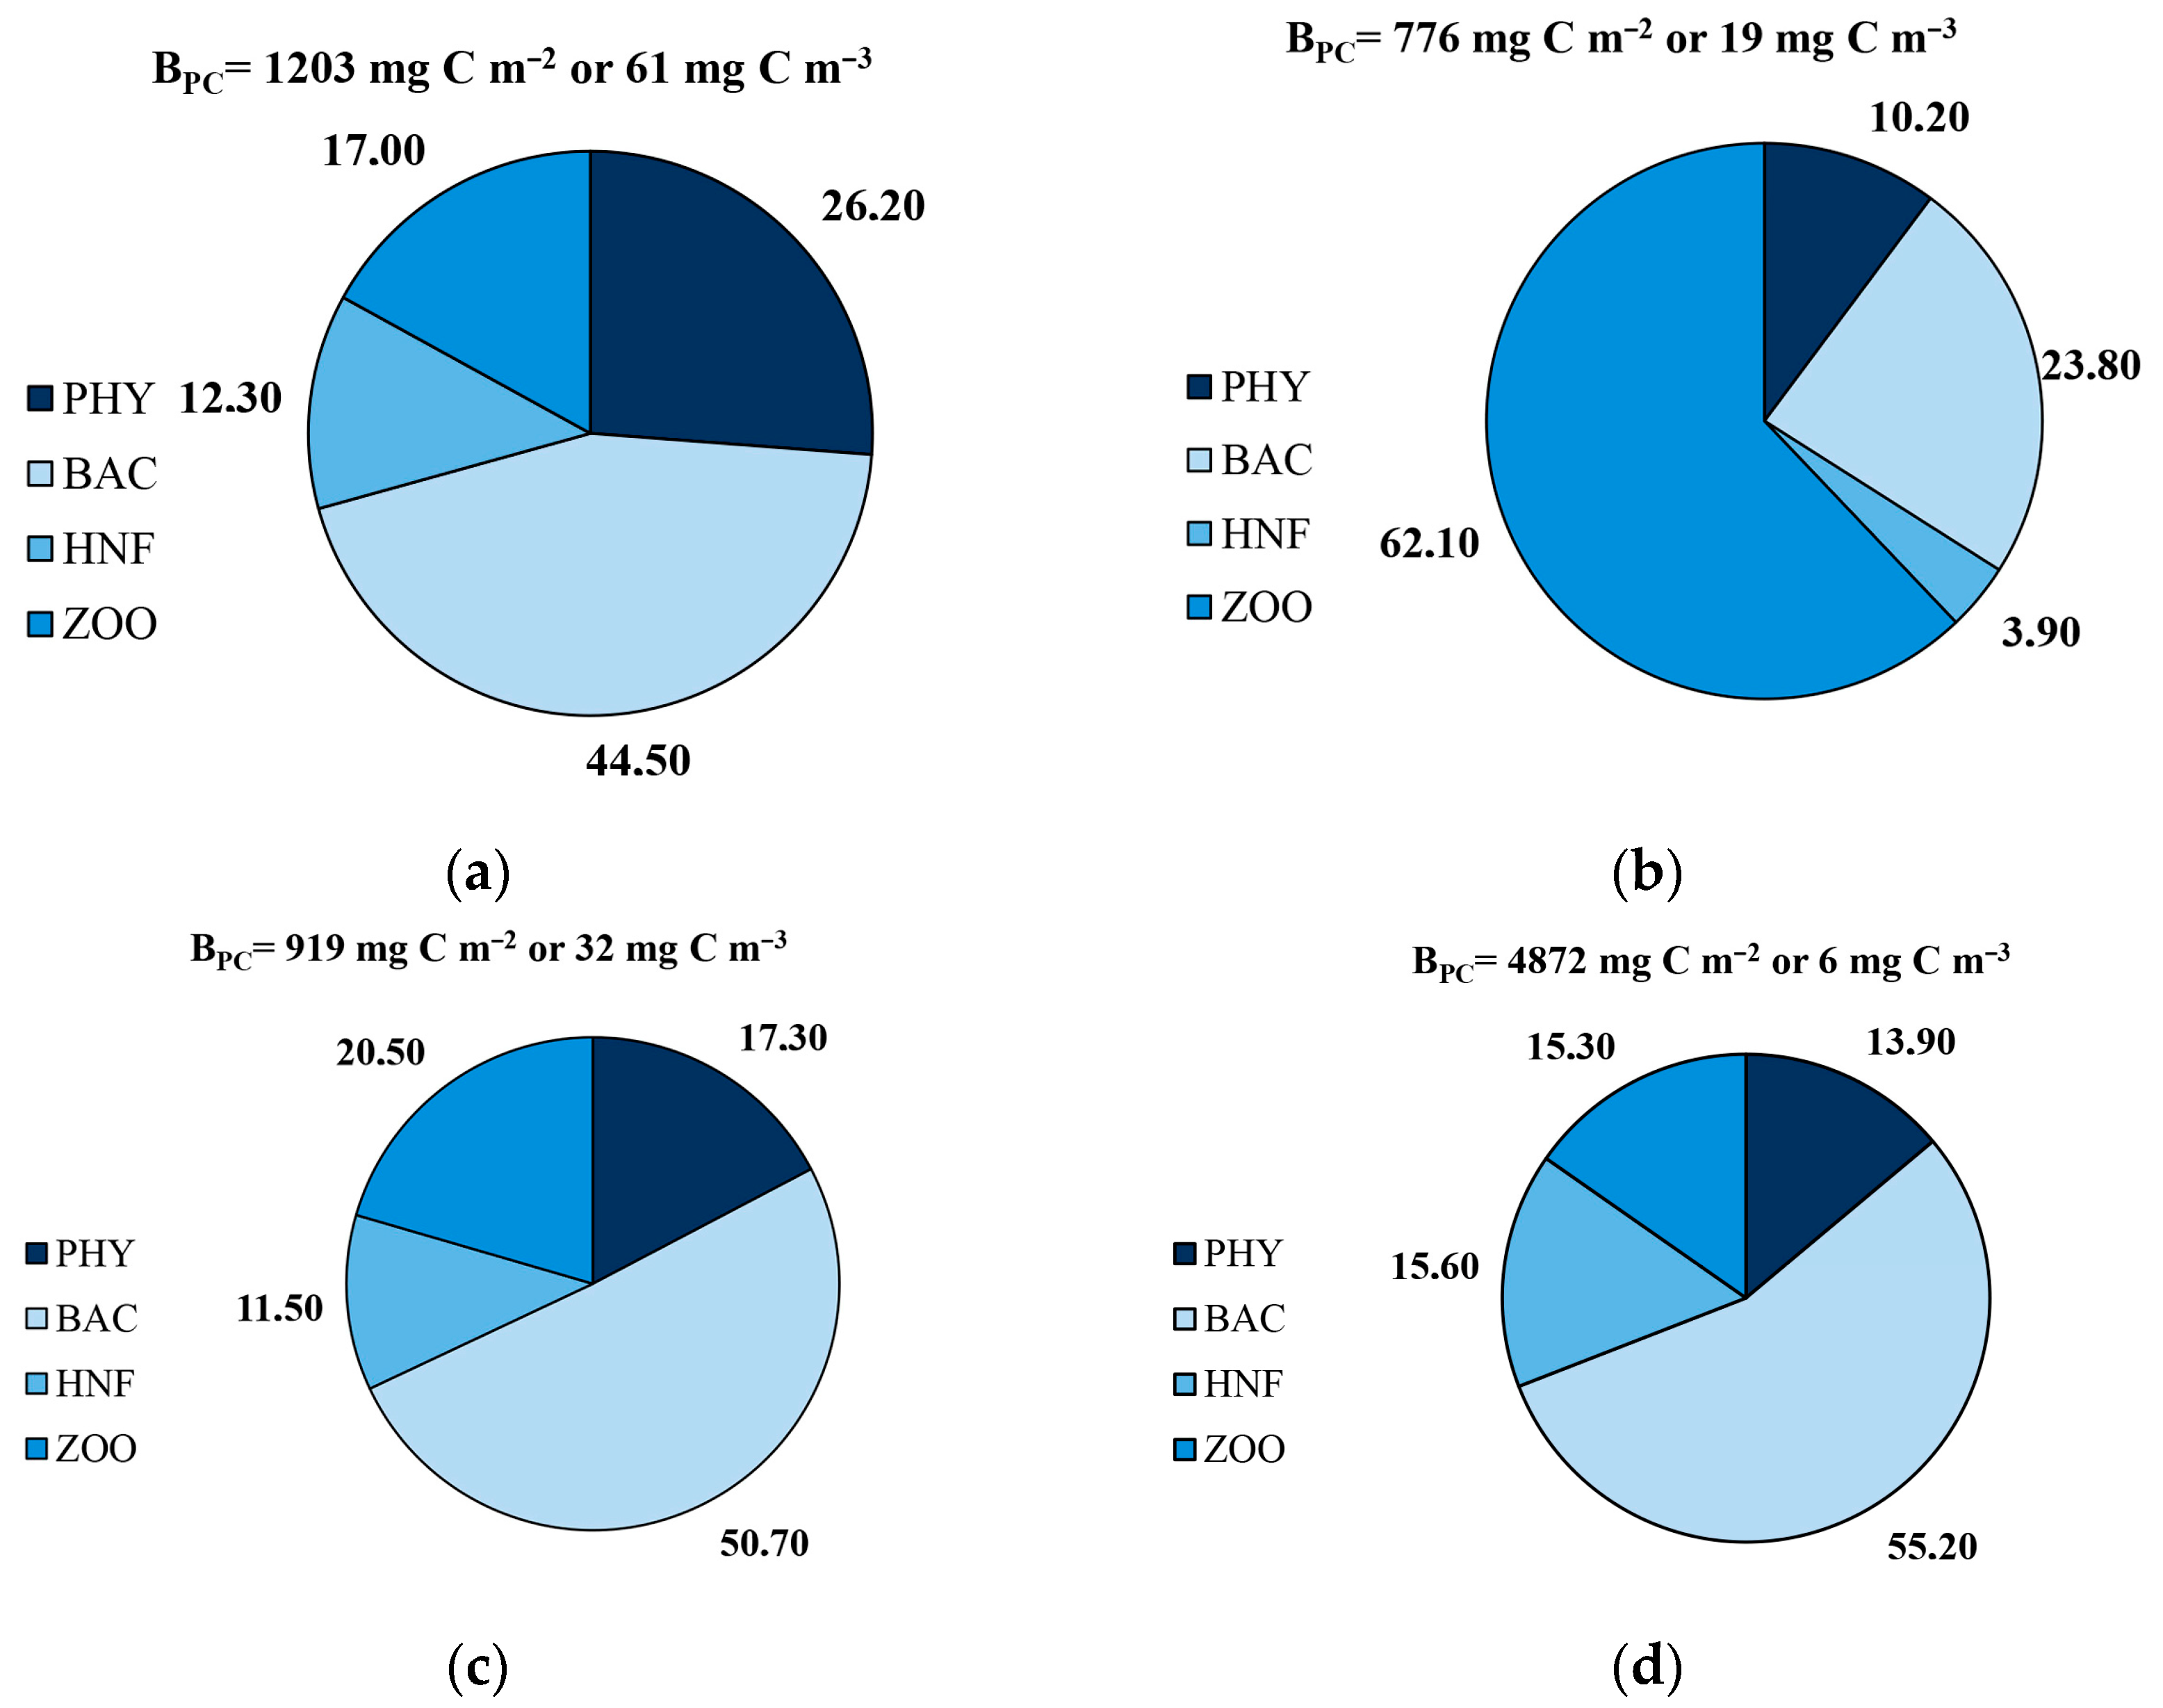
Analysis of the results of our studies and data on assessing the biomass of phytoplankton [
35] and zooplankton [
57] obtained for the Western Laptev Sea in September 2017 showed that the total biomass of the plankton community per unit volume of water on the KHAB–CS transect decreased by an order of magnitude (
Figure 5). At the end of the growing season in the Western Laptev Sea, with the exception of the shelf, bacterioplankton was the main component (44.5–55.2%) of the plankton community biomass. The high biomass of the microbial community (bacteria and HNF) and observed bacterial activity suggested that planktonic microbial communities play a major role in pelagic carbon turnover at the end of the growing season.
In the Eastern Laptev Sea, which receives Lena River runoff, similar data were obtained in September 2015: the share of bacterioplankton in the total biomass of the plankton community on the inner, middle, and outer shelf and in the epipelagic zone of the deep-water area was 54.5, 49.2, 33.5, and 30.0%, respectively [
58]. In Disko Bay, Western Greenland, in June–July 1992, during the diatom bloom, the total biomass of the plankton community varied between 190 and 252 mg C/m
3, and the share of bacterioplankton in the total biomass was 24% [
65].
4.3. Bacterial Production
One of our findings is that mean bacterial production in the water column in Khatanga Bay (10.3 ± 0.6 mg C m
−3 d
−1) was about two times higher than in the TZ and about 12 times higher than on the shelf and near the CS, indicating a direct relationship between bacterial activity and DOC (and temperature), as well as an inverse relationship between bacterial activity and salinity. Earlier, Saliot et al. [
31] and Sorokin and Sorokin [
32] reported higher bacterial production in the Lena River Delta and decreasing production in the adjacent Laptev Sea. The bacterioplankton production documented in the present study is within the range reported for coastal areas and estuaries, 0.3–115.9 mg C m
−3 d
−1 [
19,
27,
69,
77], and for open areas, 0.07–41.1 mg C m
−3 d
−1 [
74,
77] of the Arctic Ocean.
In our study, growth rates were highly variable, although within the range (<0.05–0.6 day
−1) of previously published data [
28,
67,
72,
78,
79]. High rates of bacterial production at the end of the growing season have been found in the Chukchi and Greenland seas [
67,
79]. In the upper 50 m of the water column in the Greenland Sea, bacterial counts averaged 1.1 × 10
6 cells mL
−1, bacterial growth rate averaged 0.68 d
−1, and bacterial production averaged 0.26 μM C d
−1 [
67]. High growth rates were also observed in waters with temperatures below 0 °C; for example, a growth rate of 0.31 corresponds to a generation time of 2 d at −1.3 °C at 50 m. “The high bacterial growth and production rates may be related to fact that at the end of the productive season, considerable amounts of annually produced transient organic matter were present” [
67].
During cruise 69 of the R/V Akademic Mstislav Keldysh, Demidov et al. [
51] measured phytoplankton primary production in parallel with our bacterial production measurements. Thus, we can combine our data to estimate the metabolic balance of the system. In September in the Western Laptev Sea in Khatanga Bay, the integral bacterial production exceeded the integral primary production in the photic zone by 4.3–4.5 times, and the ratio of bacterial production to primary production in other parts of the Western Laptev Sea most often fluctuated around 1 (
Figure 4). During the development of the spring bloom, the bacterial production to primary production ratios in the photic zone varied from 3 to 97% in the Franz Joseph Land archipelago [
80] and from 8 to 143% in the Northern Barents Sea [
73]. In August in the Central Arctic Ocean, the ratio of bacterial production (based on
14C-leucine incorporation) to particulate phytoplankton production increased from 0.1 in open water to 2.43 at ice-covered stations [
79]. In September 1991, in the Lena Estuary ecosystem (Eastern Laptev Sea), bacterioplankton production was twice as high as primary phytoplankton production [
32].
4.4. Role of Bacteria in the Carbon Budget of the Western Laptev Sea
Our results allow a first-order estimate of bacterial carbon fluxes for the Western Laptev Sea in autumn. The values of bacterioplankton production obtained in this study make it possible to estimate bacterial carbon demand (BCD) and bacterial respiration (BR) in different parts of the Western Laptev Sea. Bacterial growth efficiency (BGE), the ratio of biomass produced to substrate assimilated, can be used to estimate the total bacterial carbon demand. BGE is computed as [
81] BGE = BP/(BP + BR), where BP is bacterial production and BR is bacterial respiration. Rearrangement of the equation yields an estimate of bacterial respiration: BR = (BP/BGE) − BP. In our study, we used a BGE of 0.27 [
49]. The integral BCD values in the photic zones of the studied areas of the sea varied from 299 mg C m
−2 day
−1 in Khatanga Bay to 50−58 mg C m
−2 day
−1 on the outer shelf and continental slope. As a result, they exceeded the integral primary production in Khatanga Bay by an order of magnitude; in other areas, by three to five times. Similar results were received in the Ob and Yenisei rivers, estuaries of rivers, and the Kara Sea, where mean rates of areal primary production in the euphotic zone are about two to four times lower than BCD [
49]. Apparently, in the Laptev Sea, just like in the Kara Sea system, in autumn, primary production may be completely consumed by heterotrophic processes with little surplus production remaining for export from the shelf to the Central Arctic Ocean [
49]. According to our estimates, during the study period, the daily consumption of DOC by bacterioplankton, or BCD, was 0.63 ± 0.06% in Khatanga Bay, 0.47 ± 0.05% in the TZ, and 0.09 ± 0.02% of the DOC concentration on the WS. Consequently, in these areas, 0.46 ± 0.05%, 0.34 ± 0.04%, and 0.07 ± 0.01%, respectively, of the DOC content in water per day should be broken down (mineralized) by bacterioplankton for respiration.
Many estuaries are net heterotrophic ecosystems that emit CO
2 into the atmosphere [
82,
83,
84]. The prevalence of heterotrophic metabolism and CO
2 efflux from aquatic ecosystems necessarily requires allochthonous inputs of organic carbon to the aquatic systems [
85]. In our study, the CO
2 production rate (P
CO2) by bacteria in the photic zone averaged 236 mg C m
−2 d
−1 in Khatanga Bay; 158 mg C m
−2 d
−1 in the TZ; 73 mg C m
−2 d
−1 on the WS; and 42 mg C m
−2 d
−1 on the CS. P
CO2 exceeded the integral values of phytoplankton primary production in the photic zone in these areas by 12, 4, 3, and 2 times, respectively. In Summer 2004, in the Mackenzie River estuary (station R4, salinity 1 psu), depth-integrated bacterial respiration was 22 times higher than depth-integrated net algal primary production; in the TZ (station R5d, salinity about 4 psu), by 1.2 times; and in the coastal Beaufort Sea (station R9, salinity >20 psu), by 1.3 times [
86].
The bacterial CO
2 production rate in the surface water layer (0–1 m) was, on average, in Khatanga Bay at 28.6 mg C m
−2 d
−1, and on the Western shelf at 3.7 mg C m
−2 d
−1. The area of Khatanga Bay is approximately 8140 km
2 (length 220 km, average width 37 km). Let us assume that the area of the WS is equal to half the entire area of the CS of the Laptev Sea 460,000 km
2 [
87], i.e., 230,000 km
2. As a result, bacterial CO
2 production calculated for the area of Khatanga Bay (2.33 × 10
3 t C area
−1 day
−1) was equivalent to 27% of that calculated for the entire area of the WS (8.51 × 10
3 t C area
−1 day
−1). Apparently, Khatanga Bay was a significant source of CO
2 in the atmosphere at the time of sampling.
“Microbial processes in polar systems are particularly sensitive to small fluctuations in their environment and have a potentially large impact on the carbon flux and other ecosystemic functions” [
24]. The warming of the Arctic Ocean impacts POM and DOM in the Arctic region, which affect the local bacterial communities. Increased POM and DOM levels may increase the population, production, and metabolic activity of bacteria in Arctic Ocean seawater, thereby releasing a significant amount of CO
2 [
70]. The results of studying bacterioplankton in the Western Laptev Sea may be useful in predicting further changes in bacterial communities should climate change lead to further increases in river discharge and related particle loads.

 ,
, 


