Article

Spatiotemporal Nutrient Patterns, Stoichiometry, and Eutrophication Assessment in the Tieshan Bay Coastal Water, China

1
College of Chemistry and Environmental Science, Guangdong Ocean University, Zhanjiang 524088, China
2
Guangxi Key Laboratory of Marine Environmental Change and Disaster in Beibu Gulf, Beibu Gulf University, Qinzhou 535011, China
3
Marine Environmental Monitoring Center of Guangxi, Beihai 536000, China
*
Author to whom correspondence should be addressed.
J. Mar. Sci. Eng. 2023, 11(8), 1602; https://doi.org/10.3390/jmse11081602
Submission received: 13 July 2023 / Revised: 4 August 2023 / Accepted: 9 August 2023 / Published: 16 August 2023
(This article belongs to the Section Marine Environmental Science)

Abstract

:
Land-source inputs into coastal water have increased remarkably in recent years, resulting in the deterioration of water quality, eutrophication, and algae blooms. However, we have limited understanding of spatiotemporal nutrient patterns, stoichiometry, and eutrophication assessment in Tieshan Bay coastal water at present. To investigate the rapid development of the coastal areas in Tieshan Bay in the South China Sea, nutrients and other physicochemical parameters were observed in Tieshan Bay during the normal season (April), wet season (July), and dry season (October) in 2021. The results showed that the average concentrations of dissolved inorganic nitrogen (DIN), dissolved inorganic phosphorus (DIP), and chemical oxygen demand (COD) in Tieshan Bay are 0.071 ± 0.115 mg/L, 0.008 ± 0.013 mg/L, and 0.71 ± 0.219 mg/L, respectively. DIN/DIP ratio ranges from 9.1–69.3, with an average value of 19.9 ± 19.2, which exceeds the Redfield value, behaving P limitations. In addition, the mean eutrophication index (EI) was low in Tieshan Bay, with an average value of 0.5 ± 1.5. Moreover, the hotspot coastal water with high DIN, DIP, and COD concentrations was located in the upper half of Tieshan Bay in all seasons. In addition to the DIN, DIP, and COD contributions to EI, the average contribution rates of DIN, DIP, and COD are 26.6%, 8.8%, and 64.6%, respectively, which leads to the largest contribution of COD to EI. Furthermore, the average comprehensive index (CI) of organic pollution in Tieshan Bay surface seawater ranged from −1 to 5.6. The seawater near Hepu in S8 station has organic pollution in wet and dry seasons, and Tieshan Bay’s middle region also has slight organic pollution. Additionally, the DIN, DIP, and COD had significant relationships with salinity (p < 0.05), suggesting that coastal water quality is affected by land-based sources input. To achieve the seawater quality target and mitigate regional eutrophication, it is critical to implement land-based source management across the river-bay-coastal water continuum.

1. Introduction

The past few decades have seen a massive increase in eutrophication along the global coastline, which, in turn, due to rapid economic development and weak seawater exchange capacity, has led to an imbalance in ecosystems, a change in the structure of biological communities, a simplification of the biological composition, and an increase in the frequency, spatial extent, and duration of harmful algal blooms, most of which are caused by nutrients [1,2,3,4,5]. Nitrogen and phosphorus in the ocean are essential nutrients for phytoplankton [1,2,3]. Primary producers realize their own growth and reproduction through the absorption of nutrients in water [4]. In recent decades, with the rapid economic development of China’s coastal areas, high-intensity human activities have been the main factors leading to the deterioration of the ecological environment in the Beibu Gulf [5,6,7,8,9]. With the rapid development of science and technology and the influence of various human activities, a large number of land-based pollutants have been imported into the ocean, affecting the eutrophication degree of the waters and changing the biological community structure of Tieshan Bay [5,10,11,12]. However, eutrophication often leads to different adverse reactions by stimulating phytoplankton growth, such as harmful algal blooms resulting from geographic expansion of waters and increased flowering time, coastal acidification, and low dissolved oxygen caused by microbial oxygen consumption [13,14,15,16,17,18].
The waters of Beibu Gulf are located south of the Tropic of Cancer, with a maritime monsoon climate located in the southern subtropics and high temperatures in summer. resources, allowing the development of oyster and various fish farming practices and marine tourism to grow [19,20]. As a coastal and riverside region in the west of China, Guangxi has obvious advantages in terms of location. The problems of the marine environment have been aggravated by the rapid development of marine industries [21,22,23,24]. Tieshan Bay, as one of the important port areas in Guangxi, is positioned as an important sea outlet for the future Great Southwest after the approval of the development plan of Beibu Gulf Economic Zone, which is the main industrial base of Beihai City. The famous Shankou Mangrove National Nature Reserve is located in Tieshan Bay, within the Dan Dou Sea and Ying Luo Sea. In recent years, due to the rapid economic development of Tieshan Bay, pollution from industry, domestic, and aquaculture has been increasing [20,25]. Marine water pollution investigation and analysis are the basis of marine pollution prevention and control, marine ecological protection, and restoration compensation and are often used to evaluate the quality of the marine environment and the effect of ecological protection. The single factor pollution index evaluation method, the organic pollution index evaluation method, and the comprehensive pollution index evaluation method are relatively mature water quality evaluation methods that are commonly used to evaluate the pollution status of water bodies and sediment. The water quality evaluation methods used in this paper are the single-factor pollution index method and the organic pollution index method. Currently, there are few studies on multi-season water quality evaluation in the Beibu Gulf of Guangxi [26,27,28,29,30]. However, we have limited understanding of spatiotemporal nutrient patterns, stoichiometry, and eutrophication assessment in Tieshan Bay coastal water at present.
Therefore, nutrients, physicochemical and biological parameters (Temperature, pH, salinity, dissolved oxygen, and chlorophyll a) were observed in Tieshan Bay in the South China Sea during the normal season (April), wet season (July), and dry season (October) in 2021. The aim is to identify the spatiotemporal variation in nutrient concentration in Tieshan Bay, explore the nutrient stoichiometry in Tieshan Bay, and assess the eutrophication status in Tieshan Bay. The research can help marine managers achieve the seawater quality target and mitigate eutrophication effects, which are critical to implementing land-based source control across the river-bay-coastal water continuum.

2. Materials and Methods

2.1. Study Area and Field Monitoring

The sea area near Tieshan Bay is home to the Shankou Mangrove National Nature Reserve and the Hepu Dugong National Nature Reserve, which are distributed with important ecosystems such as mangroves and seagrass beds and are also breeding grounds for important seafood such as pearl shells. And nutrients, as one of the main influencing factors for the exceedance of water quality standards in our bays, are also an important biogenic element controlling the growth of marine plants and marine primary productivity [31,32,33]. One of the causes of the degradation of seagrass beds is nutrient loading due to aquaculture [34]. Nutrient concentration also affects the uptake of macroalgae [35], while water eutrophication potentially affects important marine organisms in the sea area near Tieshan Bay. Although there have been a few reports of eutrophication and its variability in Tieshan Bay [25,32,36], there have been no reports of continuous variation in nutrient concentrations over time, especially between seasons at fixed stations. This has led to this paper, which explores the variation in concentrations in Tieshan Bay, Guangxi, in different seasons.
Sampling investigations were conducted three times by the marine environmental monitoring center of Guangxi during the corresponding normal water season (February to April), wet water season (June to August), and dry water season (October to November) in 2021 based on seasonal hydrological change. Based on the monitoring stations in the field investigation, eight seawater samples were collected from Tieshan Bay surface water during each season (Figure 1), of which station S8 was located within Tieshan Bay near Hepu waters, S1 near Tieshan Bay, S2 near Shatian Town, S3 at the mouth of Beibu Gulf, and the other stations were located in Beibu Gulf in the waters off Beibu Gulf [37]. The seawater samples were collected from Tieshan Bay seawater monitoring stations, which covered the high, medium, and low salinity gradients. Based on the seasonal rainfall variations in Tieshan Bay, data were collected from eight seawater stations with different salinities in April (normal season), July (wet season), and October (dry season) to estimate the effect of salinity gradients on nutrients. The 5-L Plexiglas water collection bottle was used to collect 2.5 L of surface seawater (0.5 m depth) from Tieshan Bay. Water samples were collected using a portable sampler. All water samples were transported to the laboratory, filtered through a 0.45 μm glass fiber membrane, and then stored in glass bottles cleaned with ultrapure water. Water samples were stored in a refrigerator (−18 °C) prior to analysis.

2.2. Data Processing and Analysis

The map of Beihai monitoring station in Guangxi is drawn by ArcGIS. Pearson correlation analysis (Relationship between DIN in different seasons: p > 0.05) was used to investigate the relationship between nutrients in different seasons in the sea area. p < 0.05 was considered a significant difference, and all statistical analyses were conducted under SPSS17.0 software. Ocean Data View 5.6.5 software is used to draw the spatial distribution map of DIN, DIP, COD concentration, EI, and organic pollution index. The DIN/DIP map, the linear fitting of salinity and nutrients, organic pollution index and pH, and the correlation heat map of nutrients and various environmental factors in the surveyed sea area were also drawn with Origination. 2018 software. Excel 2019 software was used for data processing, and the data in this paper were expressed as arithmetic mean ± standard deviation (Mean ± SD) [38].

2.3. Statistical Method

2.3.1. Assessment of DIN and DIP Pollution Degrees in Tieshan Bay

According to the evaluation method of seawater quality, DIN pollution is usually evaluated by the single factor pollution index ( P i ) method proposed [39]. The calculation formula is as follows:
P i = C i / S i
where C i and S i are DIN measured data and evaluation standard values, respectively. This paper uses our national class I seawater quality standard DIN ≤ 0.20 mg/L, class II seawater quality standard DIN ≤ 0.30 mg/L evaluation, class III seawater quality standard DIN ≤ 0.40 mg/L, and class IV seawater quality standard DIN ≤ 0.50 mg/L evaluation [40]. When P i > 1, it is regarded as exceeding the standard water quality and the water body has been polluted; when P i ≤ 1, it indicates that the water body is not polluted, and the degree of pollution of the water body increases with the increase in C value. Three of the eight study stations are Class I seawater stations, three are Class II seawater stations, and two are Class IV seawater stations.

2.3.2. EI Assessment in Tieshan Bay

In order to comprehensively evaluate the eutrophication level of the coastal water of the North Sea, this paper applies the integrated index method to calculate the EI based on COD, DIN, and DIP survey data [41,42]. The formula is as follows:
EI = C C O D × C D I N × C D I P 4500 × 10 6
where   C C O D , C D I N , and C D I P are the concentrations of COD, DIN, and DIP, respectively, in mg/L. When the index EI ≥ 1, it means that the sea water is eutrophic, and the larger the EI value, the more serious the eutrophication.

2.3.3. Contribution of COD and Nutrients to EI in Tieshan Bay

Since COD and nutrient indicators are multiplied together in the EI calculation, it is difficult to calculate the contribution of COD and nutrients concentrations directly. Therefore, we modified the equation to include both sides of the equation with a base of 10. In order to ensure that the logarithm of the chemical pollutant concentration is positive, the two sides of the equation are multiplied by 1000 to express the resulting logarithm, which can be expressed as [43]:
l o g 4500 , 000 E I = l o g 1000 C C O D + l o g 1000 C D I N + l o g 1000 C D I P
Therefore, the contribution of nutrients (eg. DIN) and COD concentration to EI can be expressed as:
E D I N % = l o g 1000 C D I N l o g 4500 , 000 E I × 100 %
where   C C O D ,   C D I N , and   C D I P are the concentrations of COD, DIN, and DIP, respectively, in mg/L. EI is the eutrphication index.

2.3.4. CI of Organic Pollution Assessment in Tieshan Bay

In order to comprehensively evaluate the degree of organic pollution in Tieshan Bay’s coastal water body, the organic pollution comprehensive evaluation method was used to calculate the organic pollution CI based on DIP, DIN, COD, and DO survey data. The CI is calculated according to the evaluation formula. For CI, if 1 ≤ CI ≤ 3, the seawater is in a condition of slight organic pollution. If CI > 3, the sea water is at a serious pollution level.
CI = C C O D C C O D + C D I N C D I N + C D I P C D I P + C D O C D O
where CI is the organic pollution index,   C C O D ,   C D I N ,   C D I P , and   C D O are the measured concentrations of COD, DIN, DIP, and DO, respectively; and COD’, DIN′, DIP′, and DO′ are the standard values for the class I categories of COD, DIN, DIP, and DO in the Sea Water Quality Standard of China [40], which are 2 mg/L, 0.2 mg/L, 0.015 mg/L, and 6 mg/L, respectively.

3. Results

3.1. Spatiotemporal Nutrient Concentration Variation in Tieshan Bay

3.1.1. Spatiotemporal DIN Concentration Variation in Tieshan Bay

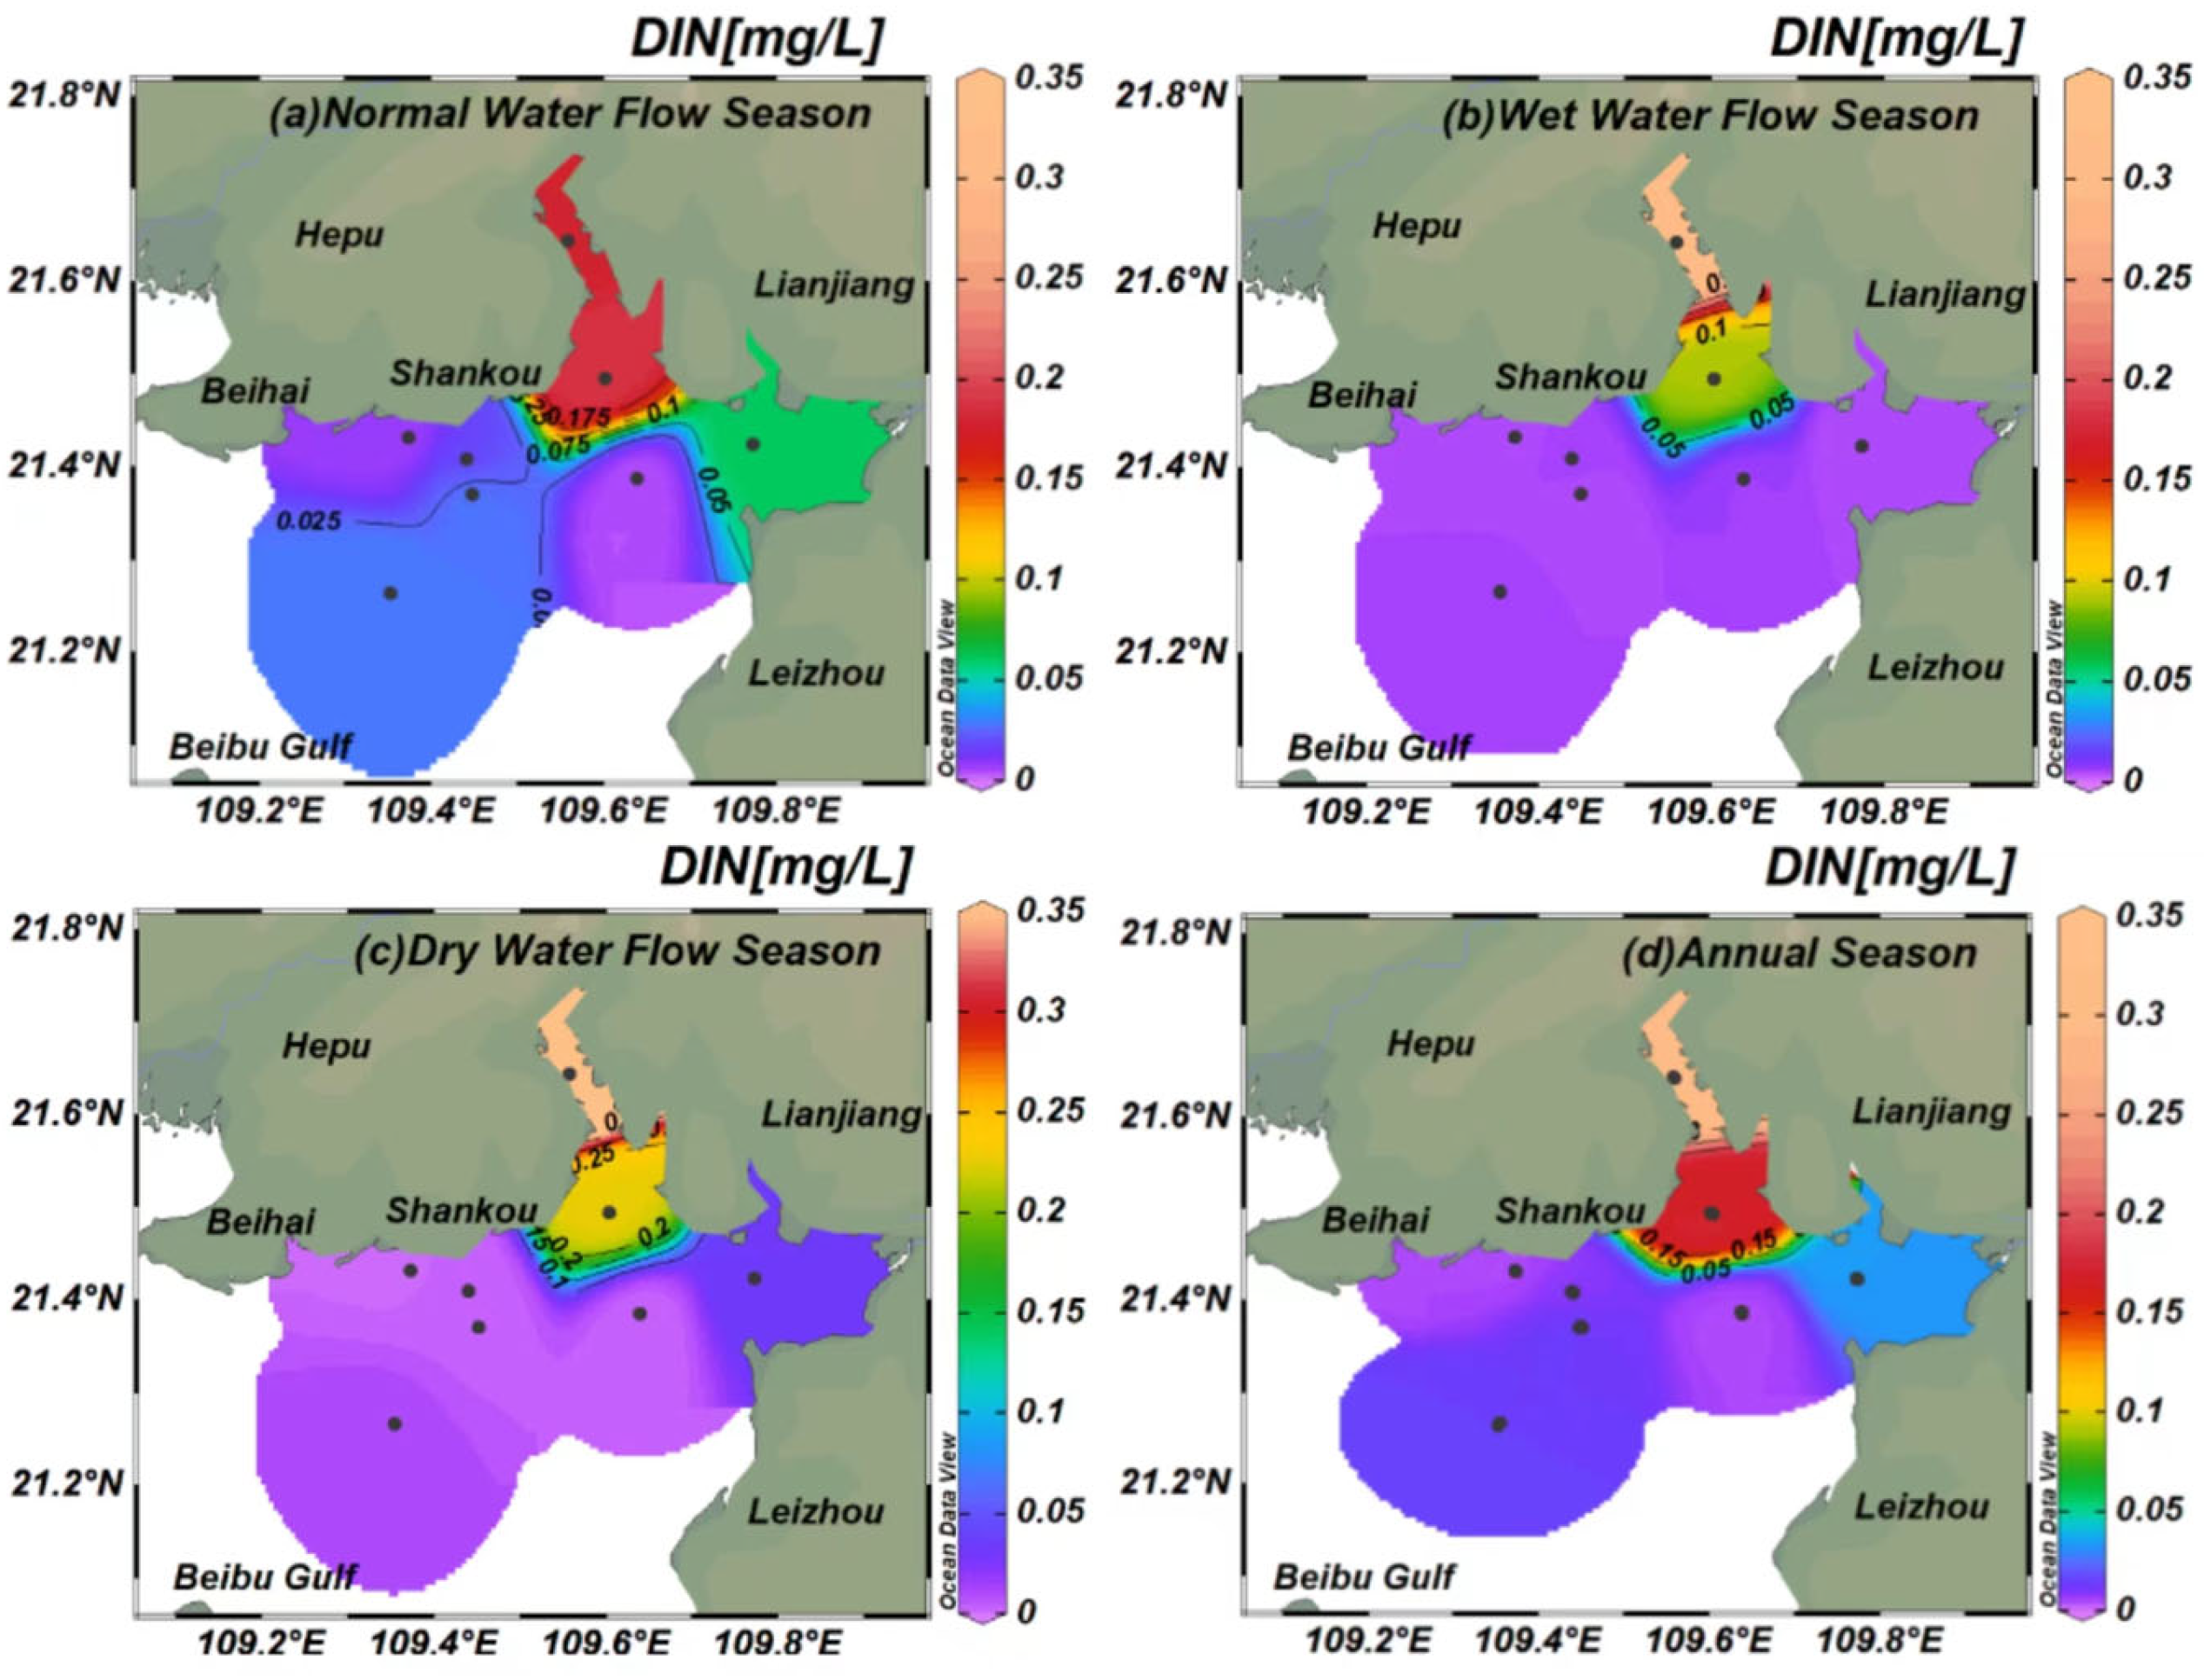
During the survey period in 2021, the average concentration of DIN in the surface layer of Tieshan Bay coastal water was 0.071 ± 0.115 mg/L, with a concentration range of 0.003–0.441 mg/L (Figure 2). The average concentration of DIN in the normal water season was 0.065 ± 0.072 mg/L, with a concentration range of 0.004–0.192 mg/L (Figure 2a), the highest value. The highest values were found in the sea area near Tieshan Bay in Beihai, in the middle region. The average concentration of DIN in the wet water flow season was 0.056 ± 0.106 mg/L, ranging from 0.004 to 0.327 mg/L (Figure 2b), with the horizontal distribution showing a decreasing trend from the near shore to the far shore, and the highest value occurring in the sea area near Hepu at station S8. The average DIN concentration in the dry season was 0.091 ± 0.150 mg/L, ranging from 0.003 to 0.441 mg/L (Figure 2c), and the horizontal distribution showed a decreasing trend from the near shore to the far shore, with the highest value occurring in the sea area near Hepu at station S8. Tieshan Bay in Beihai is one of the important harbors in Guangxi, located at the northeastern end of Beibu Gulf. It is a long and narrow trumpet-shaped bay surrounded by land on three sides, with its mouth facing south, and is adjacent to Yingluo Port at the border between Guangdong and China [44]. Station 8 is located in this trumpet-shaped bay, and in recent years there has been a boom in coastal marine development, mainly shrimp aquaculture, which has led to a significant increase in pollutants from aquaculture itself, which may be an important reason for the highest DIN concentration at Station 8. In general, there was no significant difference in DIN concentration in Tieshan Bay surface seawater between dry, wet, and normal seasons (p > 0.05).

3.1.2. Spatiotemporal DIP Concentration Variation in Tieshan Bay

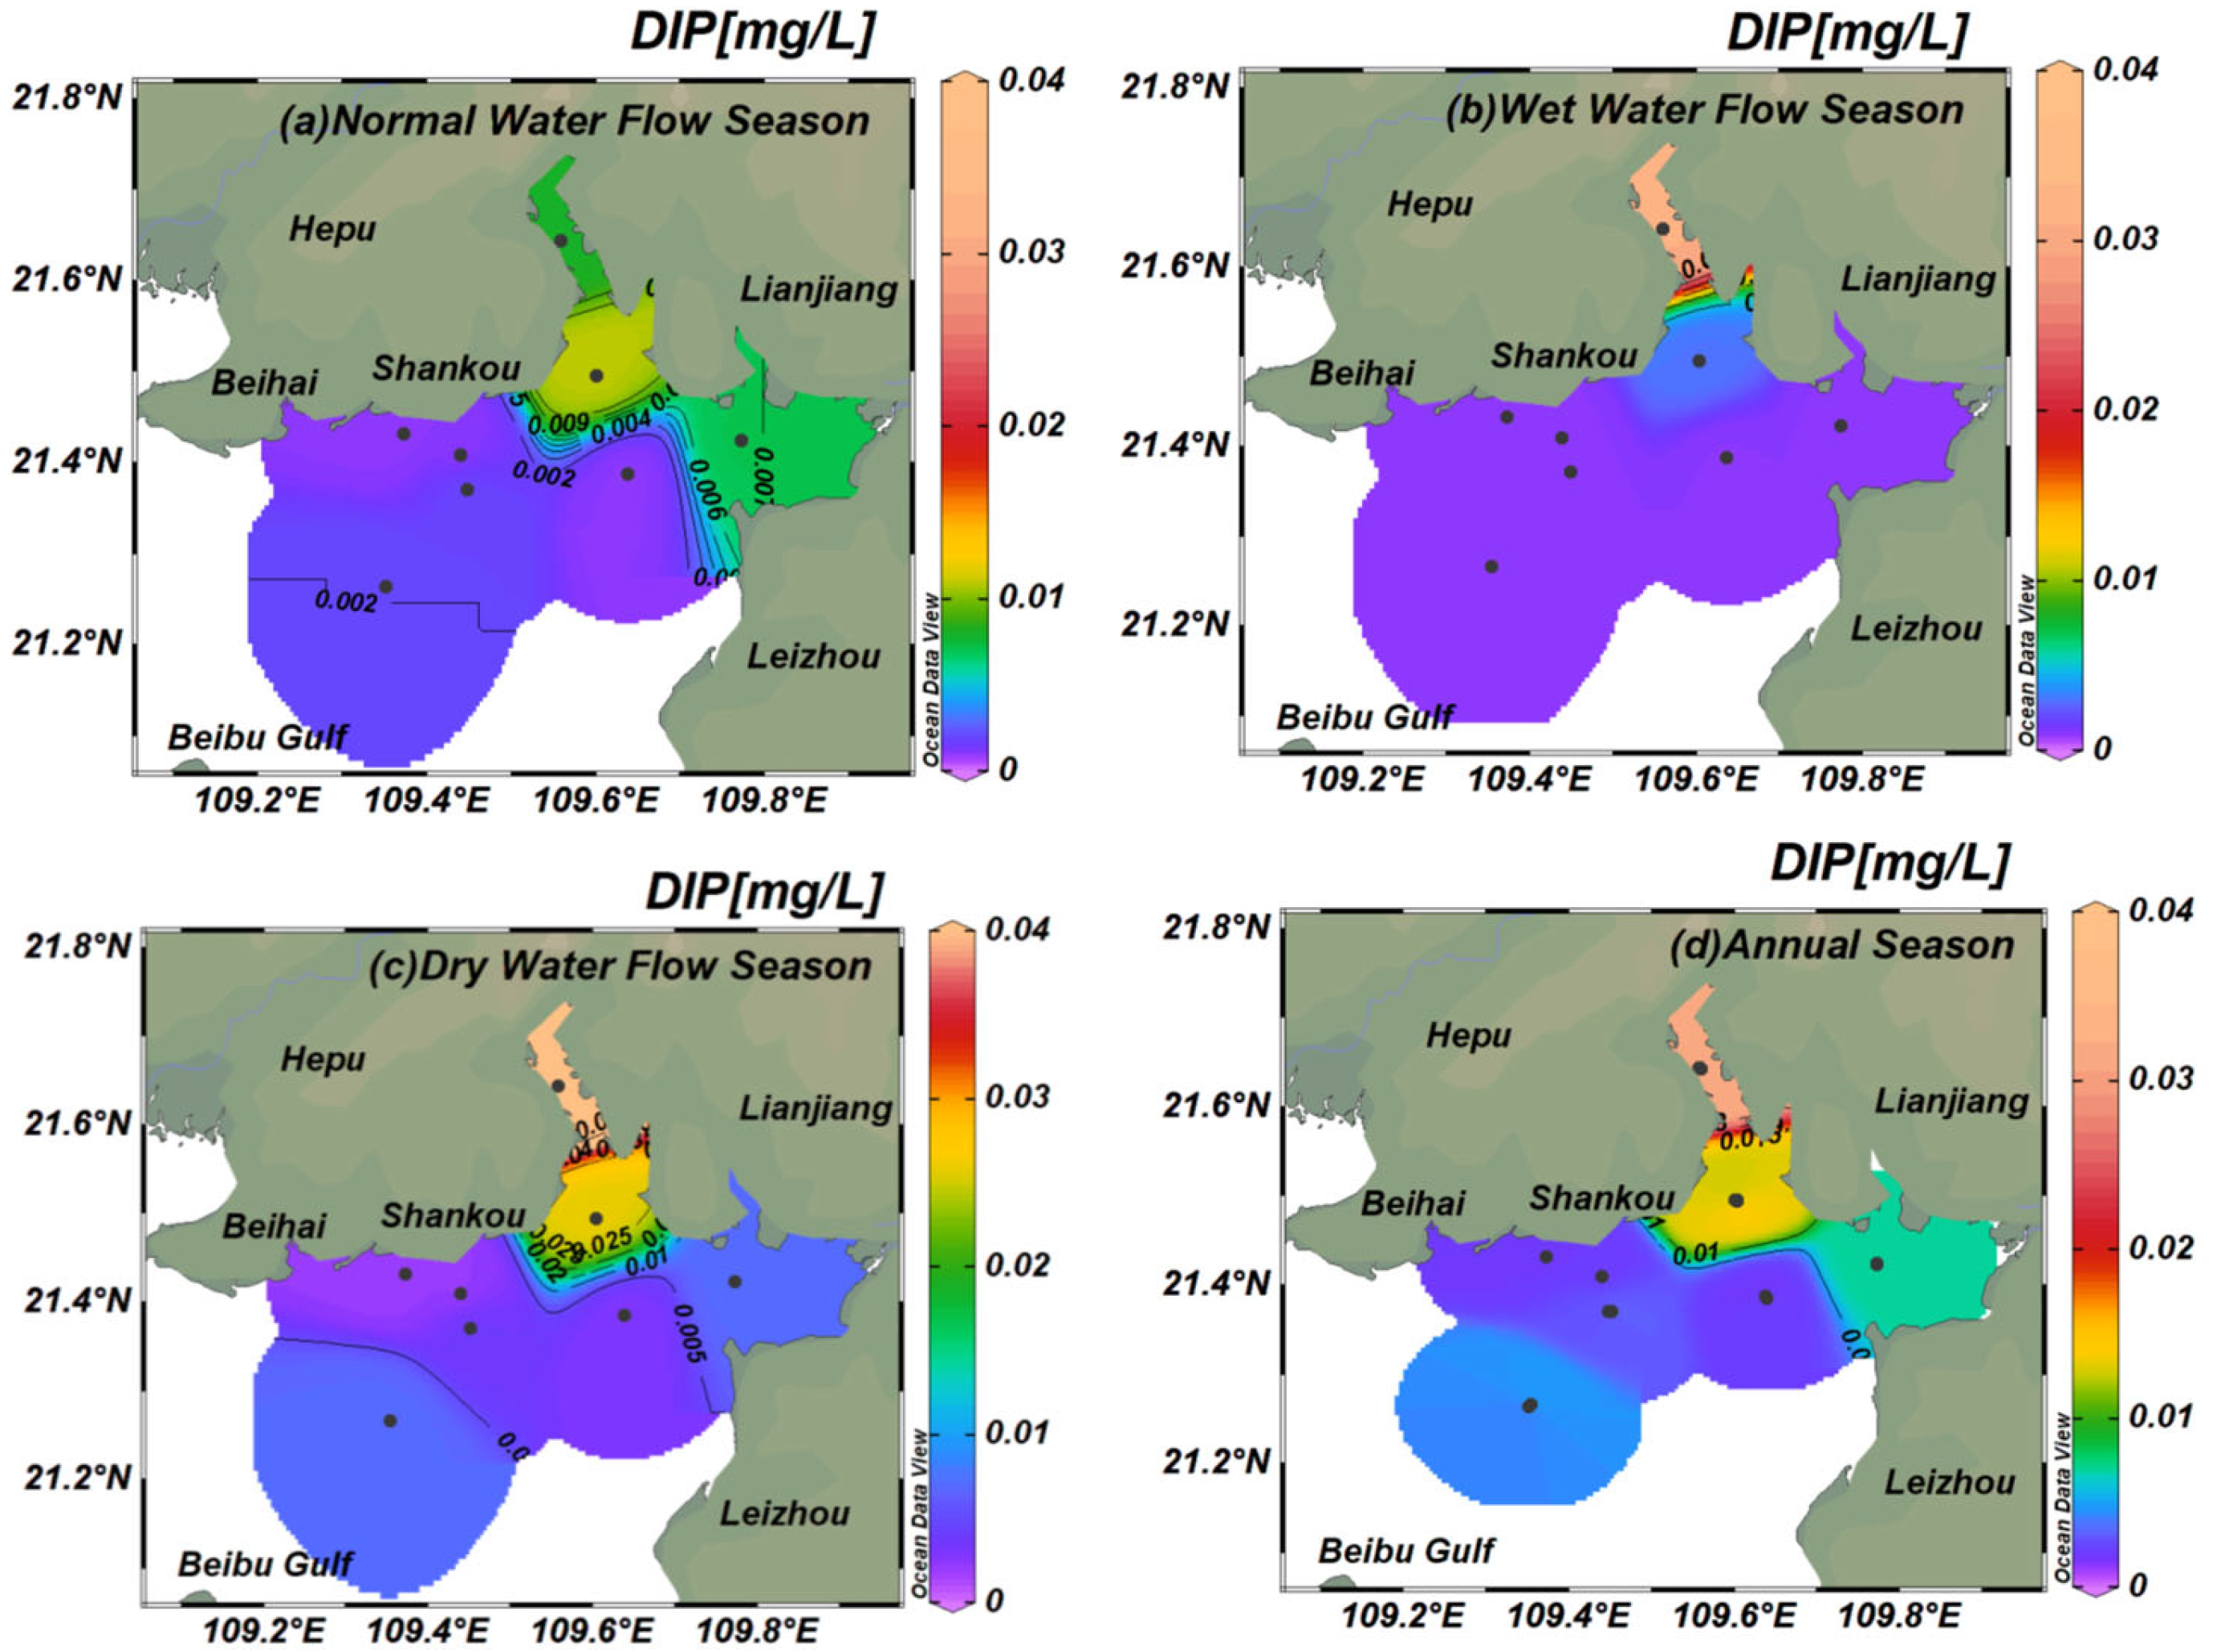
During the survey period in 2021, the mean surface DIP concentration in the North Sea near the sea was 0.008 ± 0.013 mg/L, with a range of 0.001–0.058 mg/L. (Figure 3) The mean DIP concentration during the normal water season was 0.004 ± 0.004 mg/L, with a range of 0.001–0.011 mg/L (Figure 3a), with the highest value occurring in the sea near the North Sea at Tieshan Bay Middle Region. The average concentration of DIP during the wet water season was 0.005 ± 0.010 mg/L, ranging from 0.001 to 0.032 mg/L (Figure 3b), and the horizontal distribution showed a decreasing trend from near shore to far shore, with the highest value occurring in the sea area near Hepu at station S8. The average DIP concentration in the dry water flow season was 0.014 ± 0.018 mg/L, with a range of 0.002–0.058 mg/L (Figure 3c), and the horizontal distribution showed a decreasing and increasing trend from the near shore to the far shore, with the highest value occurring in the sea area near Hepu at station S8. During the investigation period, Tieshan Bay surface seawater was still within the normal range of the national seawater quality standard, but only local waters exceeded the pollution index and the water was polluted, and the polluted waters exceeded the standard more in the dry season than in the normal and wet seasons. On the one hand, this may be due to the decrease in water temperature in autumn, which reduces the absorption of nutrients by phytoplankton in seawater, leading to a gradual increase in DIP content in the water body [45,46]. On the other hand, during the dry season, industrial inputs from inland over a short period of time result in high DIP levels in Ambassador seawater due to reduced precipitation in the North Sea [47,48,49]. In general, DIP concentration in Tieshan Bay surface seawater varies significantly between the dry season, wet season, and normal season (p < 0.05).
As can be seen from Table 1, the range of the DIP pollution index in this investigation area was 0.033–1.289, with a mean value of 0.232 ± 0.294. The mean value of the DIP pollution index was 0.033–0.467 in the normal water season, with a mean value of 0.153 ± 0.138 and a station exceedance rate of 0.0%; the mean value of the DIP pollution index was relatively high in the wet water season, with a range of 0.033–0.711, a mean value of 0.135 ± 0.218, and a station exceedance rate of 0.0%; the DIP pollution index was relatively high in the normal water season and the wet water season. The mean index was 0.409 ± 0.381, and the exceedance rate at the stations was 12.5%. The surface seawater near the coast was generally not polluted by DIP during the normal water season, except for the sea near the bay in front of station 8 Pi >1, which exceeded the national water quality standard of Class IV. Compared with the normal water flow season, there were no stations in the study area that exceeded the standard during the wet season, but the extent of the wet season was larger than that of the normal water flow season, and the maximum extent was also larger than that of the normal water flow season. In the dry water flow season, one station exceeded the standard, of which eight stations exceeded the standard more seriously near Hepu, which is close to the industrial inlet and may be an important reason for the exceedance of the DIP concentration. In general, the degree of surface seawater DIP pollution in this surveyed area was higher in the dry water flow season than in the wet water flow season than in the normal water flow season.

3.1.3. Spatiotemporal COD Concentration Variation in Tieshan Bay

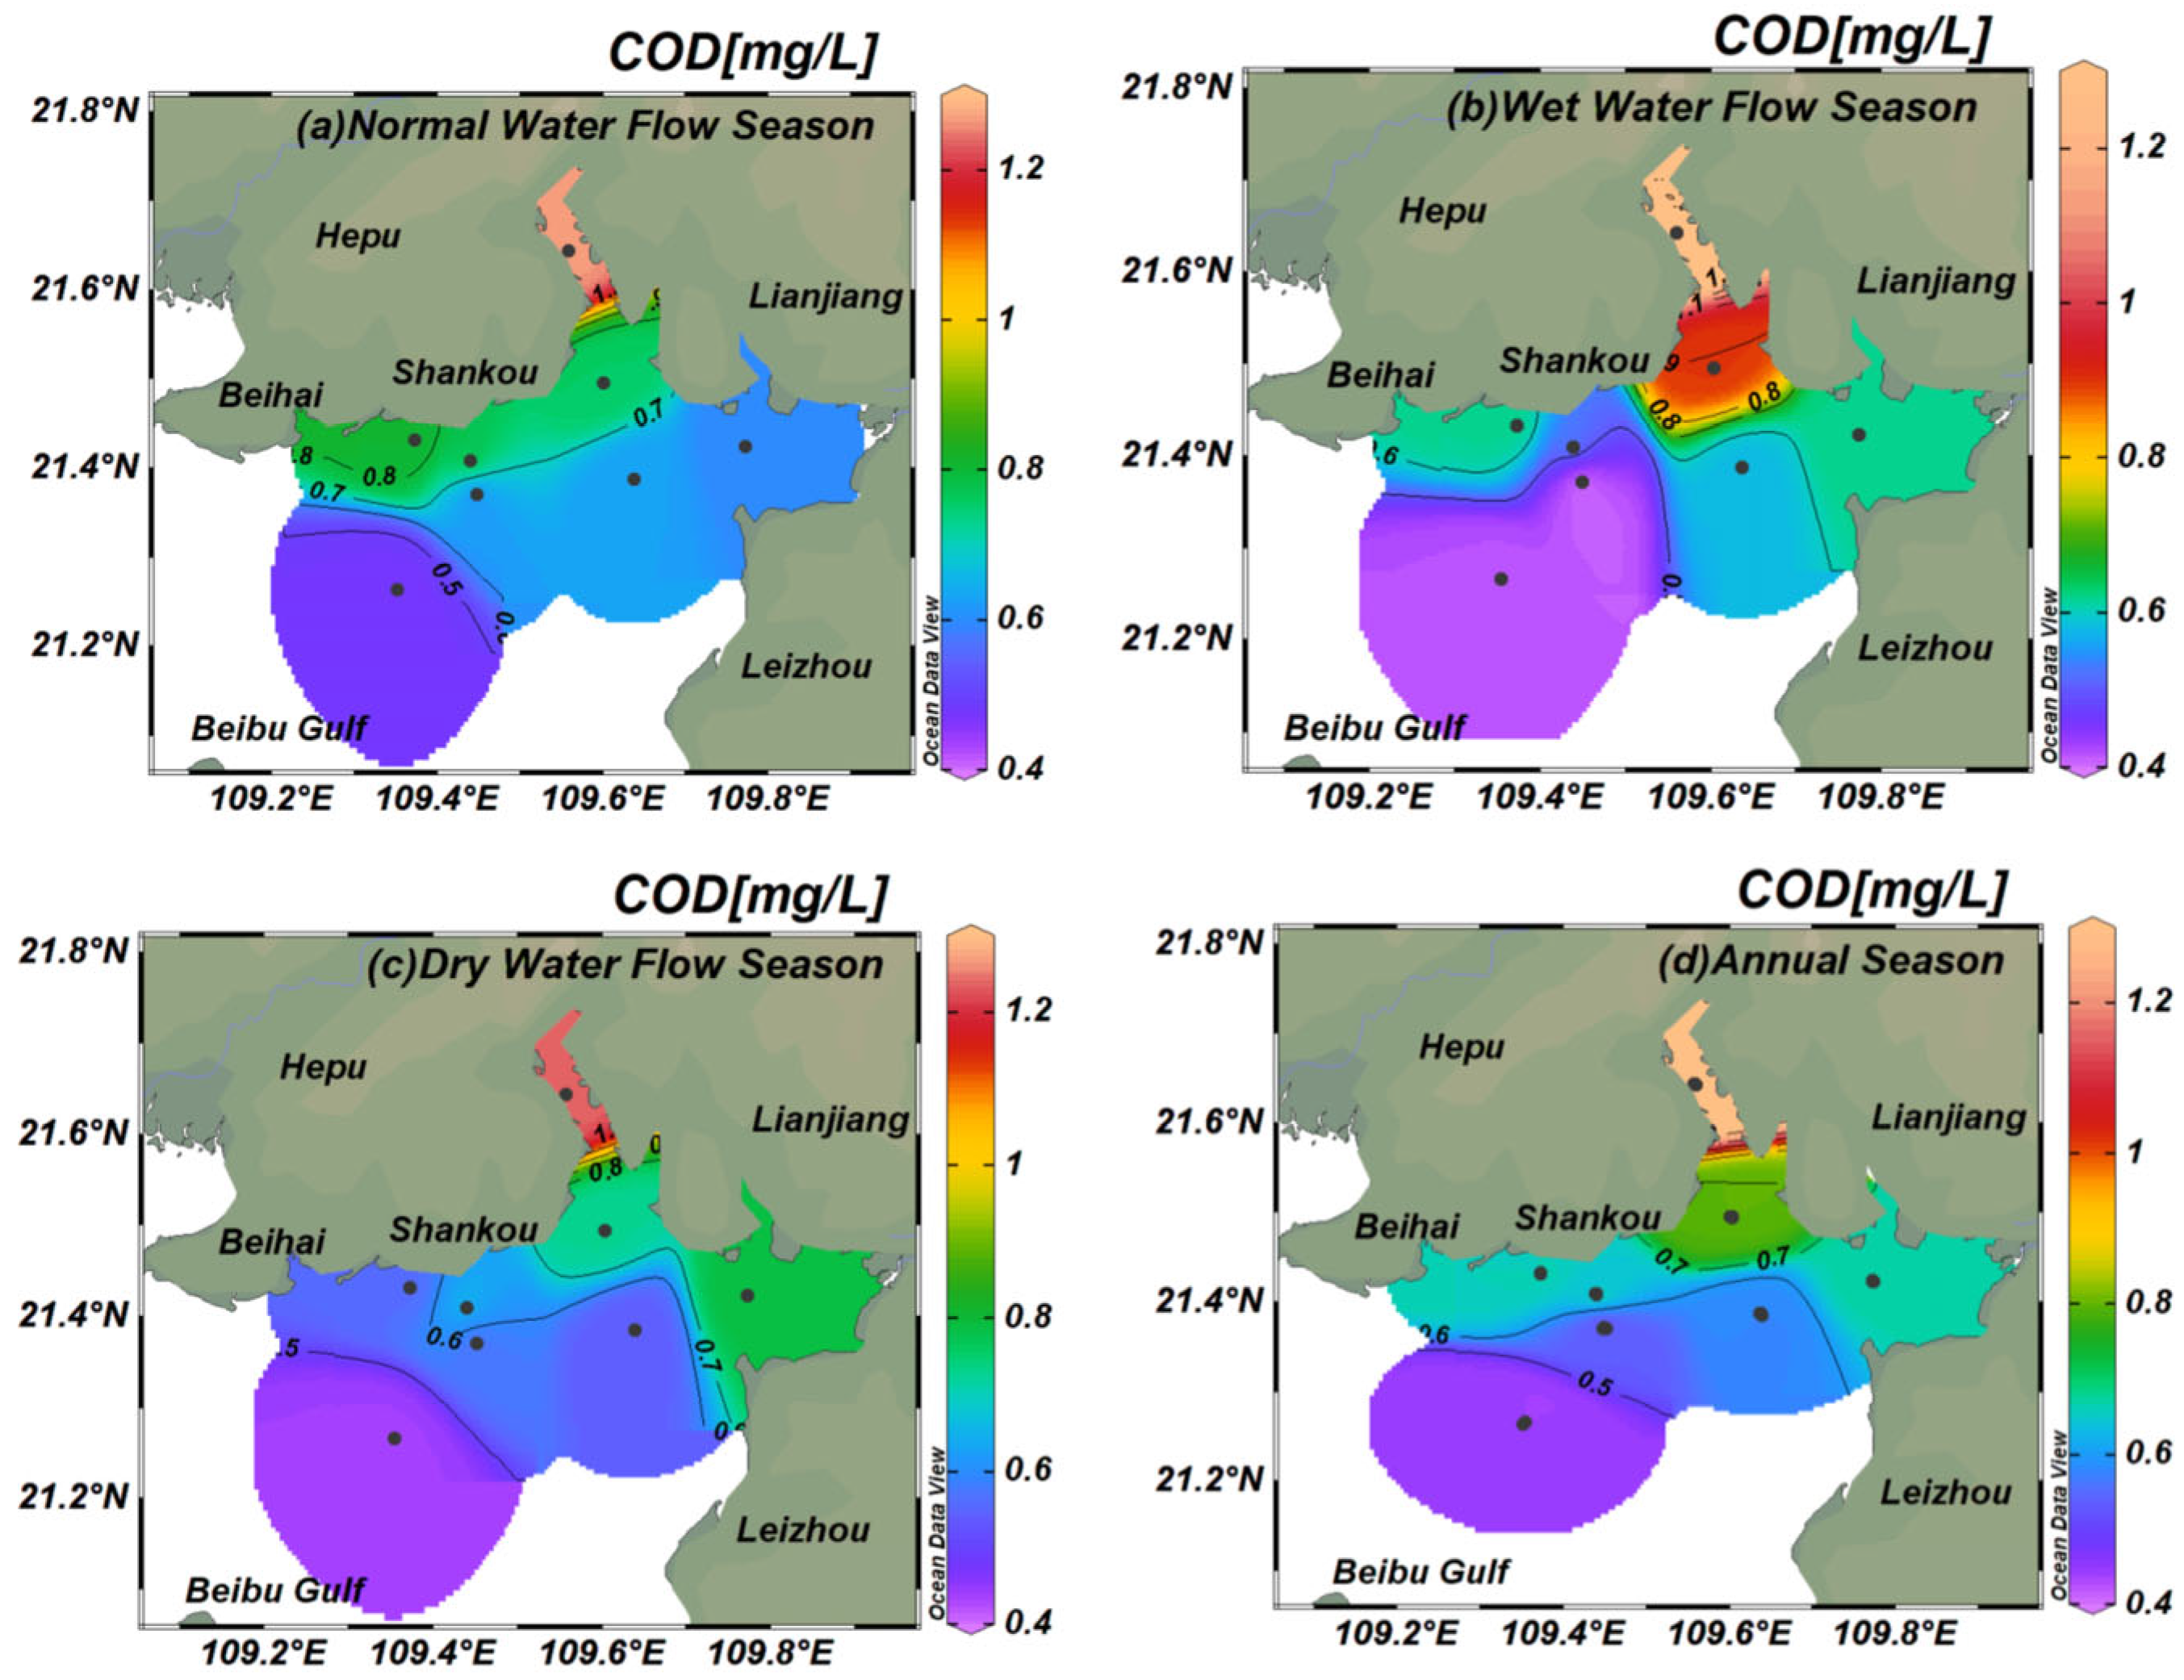
During the survey period in 2021, the average surface COD concentration in the North Sea near coastal waters was 0.71 ± 0.22 mg/L, with a concentration range of 0.40–1.50 mg/L (Figure 4). The average COD concentration in the normal water flow season was 0.74 ± 0.23 mg/L, with a concentration range of 0.48–1.27 mg/L (Figure 4a), and the highest concentration was found in Hepu. The highest concentrations were found in the waters near the Beihai Sea near Hepu. The average COD concentration in the wet water flow season was 0.70 ± 0.34 mg/L, ranging from 0.40 to 1.50 mg/L (Figure 4b), with the horizontal distribution showing a decreasing trend from the near shore to the far shore, with the highest value occurring in the sea area near Hepu. The average COD concentration in the dry water flow season was 0.69 ± 0.23 mg/L, with a range of 0.44–1.24 mg/L (Figure 4c), and the horizontal distribution showed a decreasing trend from the near shore to the far shore, with the highest value occurring near Hepu. In general, there was no significant difference in COD concentration in Tieshan Bay surface seawater between dry, wet, and normal seasons (p > 0.05).

3.2. Spatiotemporal DIN/DIP Variation in Tieshan Bay

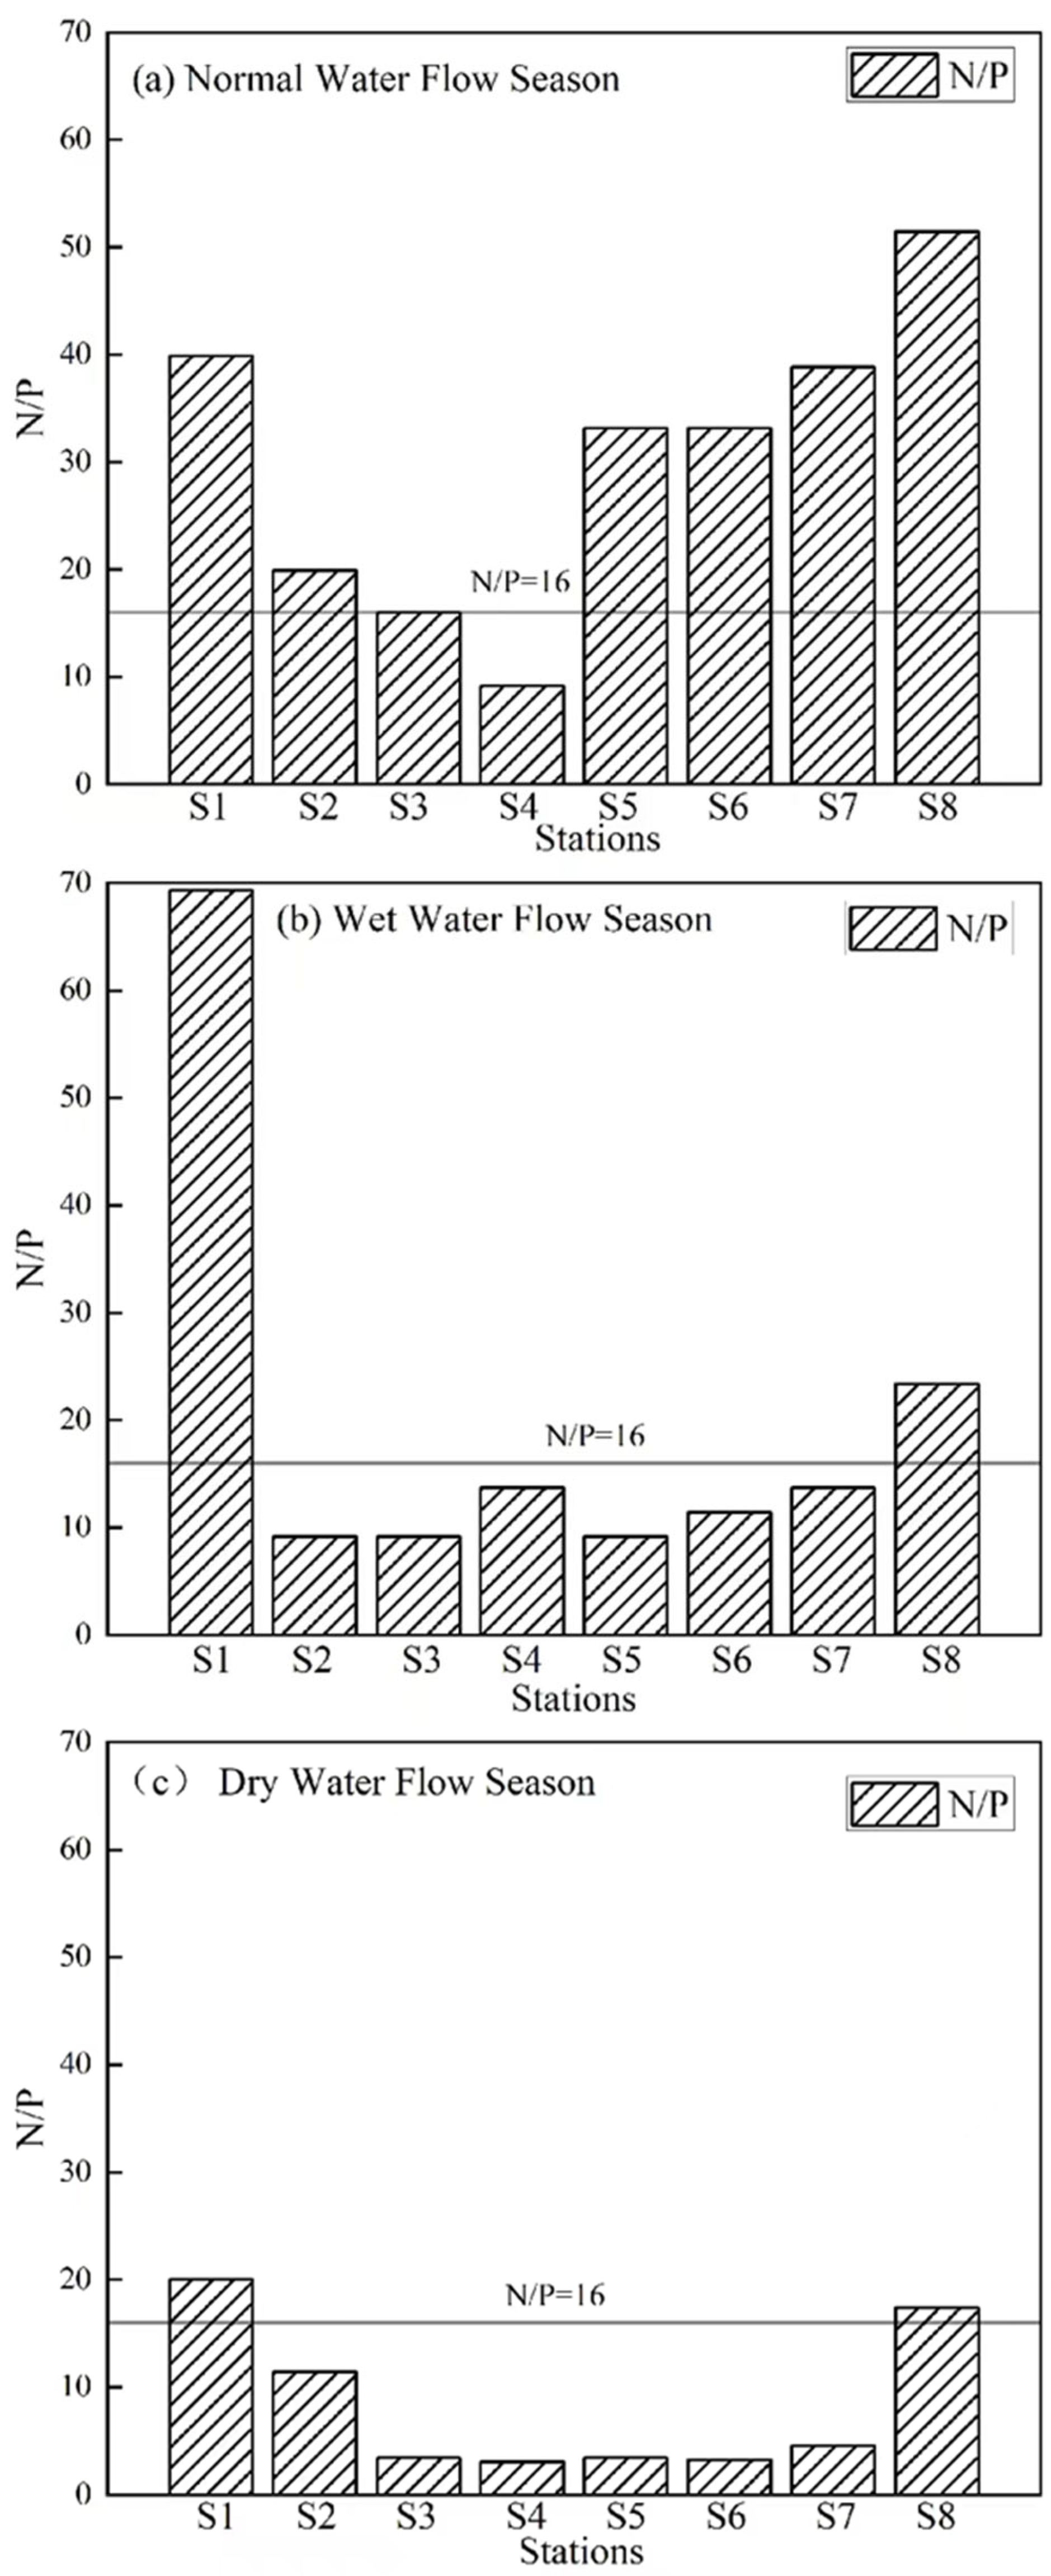
The normal DIN/DIP values of Marine phytoplankton ranged from 12 to 22, with an average Redfield ratio of 16 [50]. The range of nitrogen and phosphorus available in aquatic environments is considered optimal for phytoplankton growth [51,52]. In eutrophic waters, where both nitrogen and phosphorus are wetter, DIN/DIP values are often seen as determining the occurrence of red tides. In the Tieshan Bay offshore water body, some DIN/DIP values are far more prominent than the normal values, showing the characteristics of N limitation. For example, in the rainy season of station 1 (Figure 5), DIN/DIP in the normal period ranges from 9.1 to 51.4, with an average value of 30.2 ± 13.2. Among them, only S3 and S4 had DIN/DIP of less than 16, which is related to the fact that S3 and S4 are far from the river estuary and not affected by land-based pollutants. Compared with other seasons, DIN/DIP in the normal season was higher than normal, showing the characteristics of nitrogen limitation. DIN/DIP varied from 9.1 to 69.3, with an average value of 19.9 ± 19.2. Among them, only Tieshan Bay and Hepu exceeded 16, which was related to the proximity of Tieshan Bay and Hepu to the estuary of the river, resulting in more nutrients in the water than other stations, and the DIN/DIP ratio was within the normal range, showing relatively nitrogen-limited characteristics. In the dry season, DIN/DIP ranged from 3.0 to 20.0, with an average value of 8.3 ± 6.6. Similarly, only Tieshan Bay and Hepu exceeded 16, and DIN/DIP was lower than the normal value, showing the characteristics of phosphorus limitation. On the whole, DIN/DIP ranged from 1.3 to 30.3, with an average of 8.5 ± 7.3. The mean value of DIN/DIP in the Tieshan Bay sea area is within the normal range. On the whole, N is relatively excessive and P is relatively insufficient in the Marine water body, showing the N-limiting characteristics, which may affect the primary productivity, species distribution, and ecosystem structure of phytoplankton in the Tieshan Bay offshore water body [53,54]. In general, there was no significant difference in DIN/DIP concentration in Tieshan Bay surface seawater between dry, wet, and normal seasons (p > 0.05).

3.3. Spatiotemporal EI Variation in Tieshan Bay

The EI of the study area ranged from 0.0 to 7.1, with a wide range of variation and a mean value of 0.5 ± 1.5, indicating that the overall nutrient index of the North Sea coastal water was low. The EI in surface seawater in the dry water flow season ranged from 0.0 to 7.1, with a mean value of 1.0 ± 2.5 (Figure 6). The EI in surface waters in the dry water flow season ranged from 0.0 to 3.5, with a mean value of 0.4 ± 1.2, which was 0.6 lower than that in the dry water flow season. The mean values of EI in the dry water flow season were significantly higher than those in the wet and dry seasons, which indicated that the eutrophication in the whole North Sea coastal area was higher in the wet season than in the dry water flow season, probably due to the influence of rainfall during the wet season, which led to a significant increase in river runoff and a higher flux of pollutants from land-based sources to the sea. Further spatial analysis showed that the EI in surface seawater at eight stations located near the North Sea was 7.1 in the dry water flow season, with higher DIN concentrations than in the wet and normal seasons, probably due to an increase in eutrophication in the dry water flow season as a result of lower precipitation and a decrease in the amount of water entering the sea while the flux of marine pollutants remained unchanged. However, the EI in the surface seawater in the wet and dry seasons showed severe eutrophication, with EI of 3.5 and 7.1, respectively, and the concentrations of DIP, DIN, and COD in the surface seawater at this station were all high in the wet and dry seasons, resulting in high eutrophication in the surface seawater. In dry water flow season, wet season, and normal season, the stations with EI ≥ 1 accounted for 12.5%, 12.5%, and 0.0% of the total surveyed area in the North Sea. This indicates that the eutrophication of surface seawater in the coastal areas of the North Sea is generally low in the normal water flow season, but the eutrophication problem is still prominent in the dry and wet water seasons. In general, there was no significant difference in EI concentration in Tieshan Bay surface seawater between dry, wet, and normal seasons (p > 0.05).

3.4. Contribution of Nutrients to EI

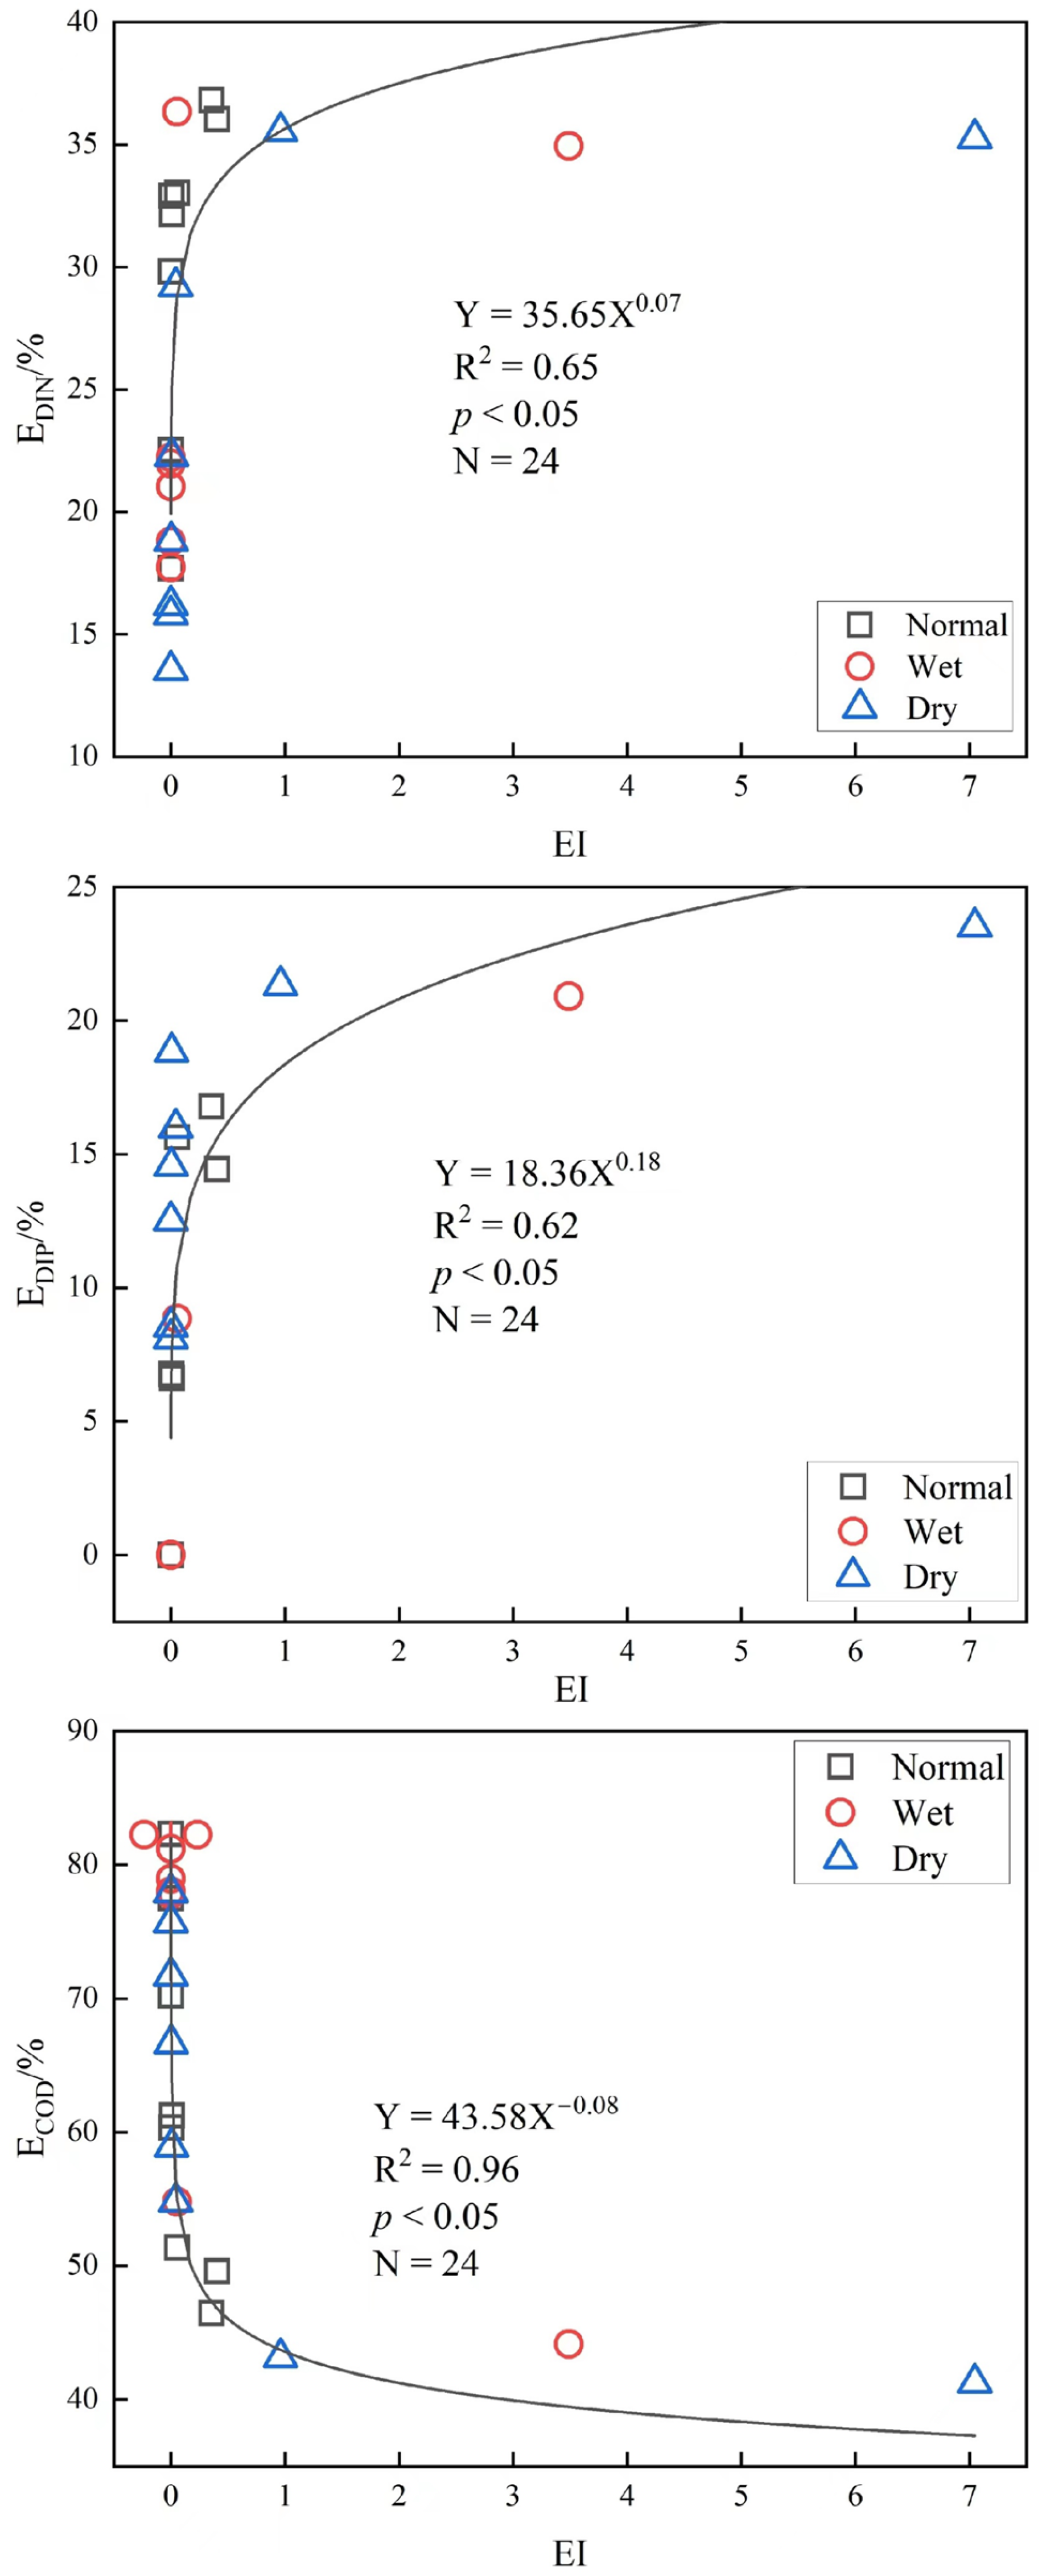
EI in the study area ranged from 0.0 to 7.1, with a wide range of variation (Figure 7). The mean value of EI was 0.5, indicating that the overall EI in the waters of the Northwest China Sea of Guangxi is at a low level. E D I N (%) ranged from 13.5% to 37.5%, with a mean value of 26.6%. E D I P (%) ranged from 0.0% to 23.5%, with a mean value of 8.8%. E C O D (%) ranged from 41.2% to 82.3%, with a mean value of 64.6%. The EI values varied during different periods of water flow. During the normal flow season, E D I N (%) ranged from 17.7% to 36.8%, with a mean value of 30.7%. E D I P (%) ranged from 0.0% to 16.8%, with a mean value of 7.9%. E C O D (%) ranged from 46.4% to 82.3%, with a mean value of 61.3%. During the wet flow season, E D I N (%) ranged from 17.7% to 37.5%, respectively, with a mean value of 25.4%. E D I P (%) ranged from 0.0% to 20.9%, with a mean value of 3.3%. E C O D (%) ranged from 44.1% to 82.3%, with a mean value of 71.3%. During the dry water season, E D I N (%) ranged from 13.5% to 35.5%, with a similar mean value to the wet water season (23.6%). E D I P (%) ranged from 8.1% to 23.5%, with a mean value of 15.2%. E C O D (%) ranged from 41.2% to 77.9%, with a mean value of 61.2%.
The contribution of DIN in normal seasons is greater than that in wet and dry seasons, which may be due to the high DIN in water due to low precipitation, insufficient stream input, weak stream dilution, and high terrigenous pollutant input in normal seasons [47,48,49,55,56]. Is positively correlated with EI nonlinear fitting (p < 0.05). The large difference in the mean values E D I P (%) of the three seasons indicates that the DIP contribution to eutrophication is different in seasons, which may be related to changes in water temperature and salinity. In the dry current season, when low water temperatures and low salinity are not conducive to plankton growth and reproduction, DIP contributes the most [45,46]. Is positively correlated with EI nonlinear fitting (p < 0.05). E C O D (%). The average value is higher in the wet period, and the COD contribution increases in the wet period. When the precipitation is large, the terrigenous pollutants will be brought into the ocean, resulting in an increase in water nutrients [47,48,49,55,57]. Is negatively correlated with EI nonlinear fitting (p < 0.05).

3.5. Spatiotemporal CI Variation in Tieshan Bay

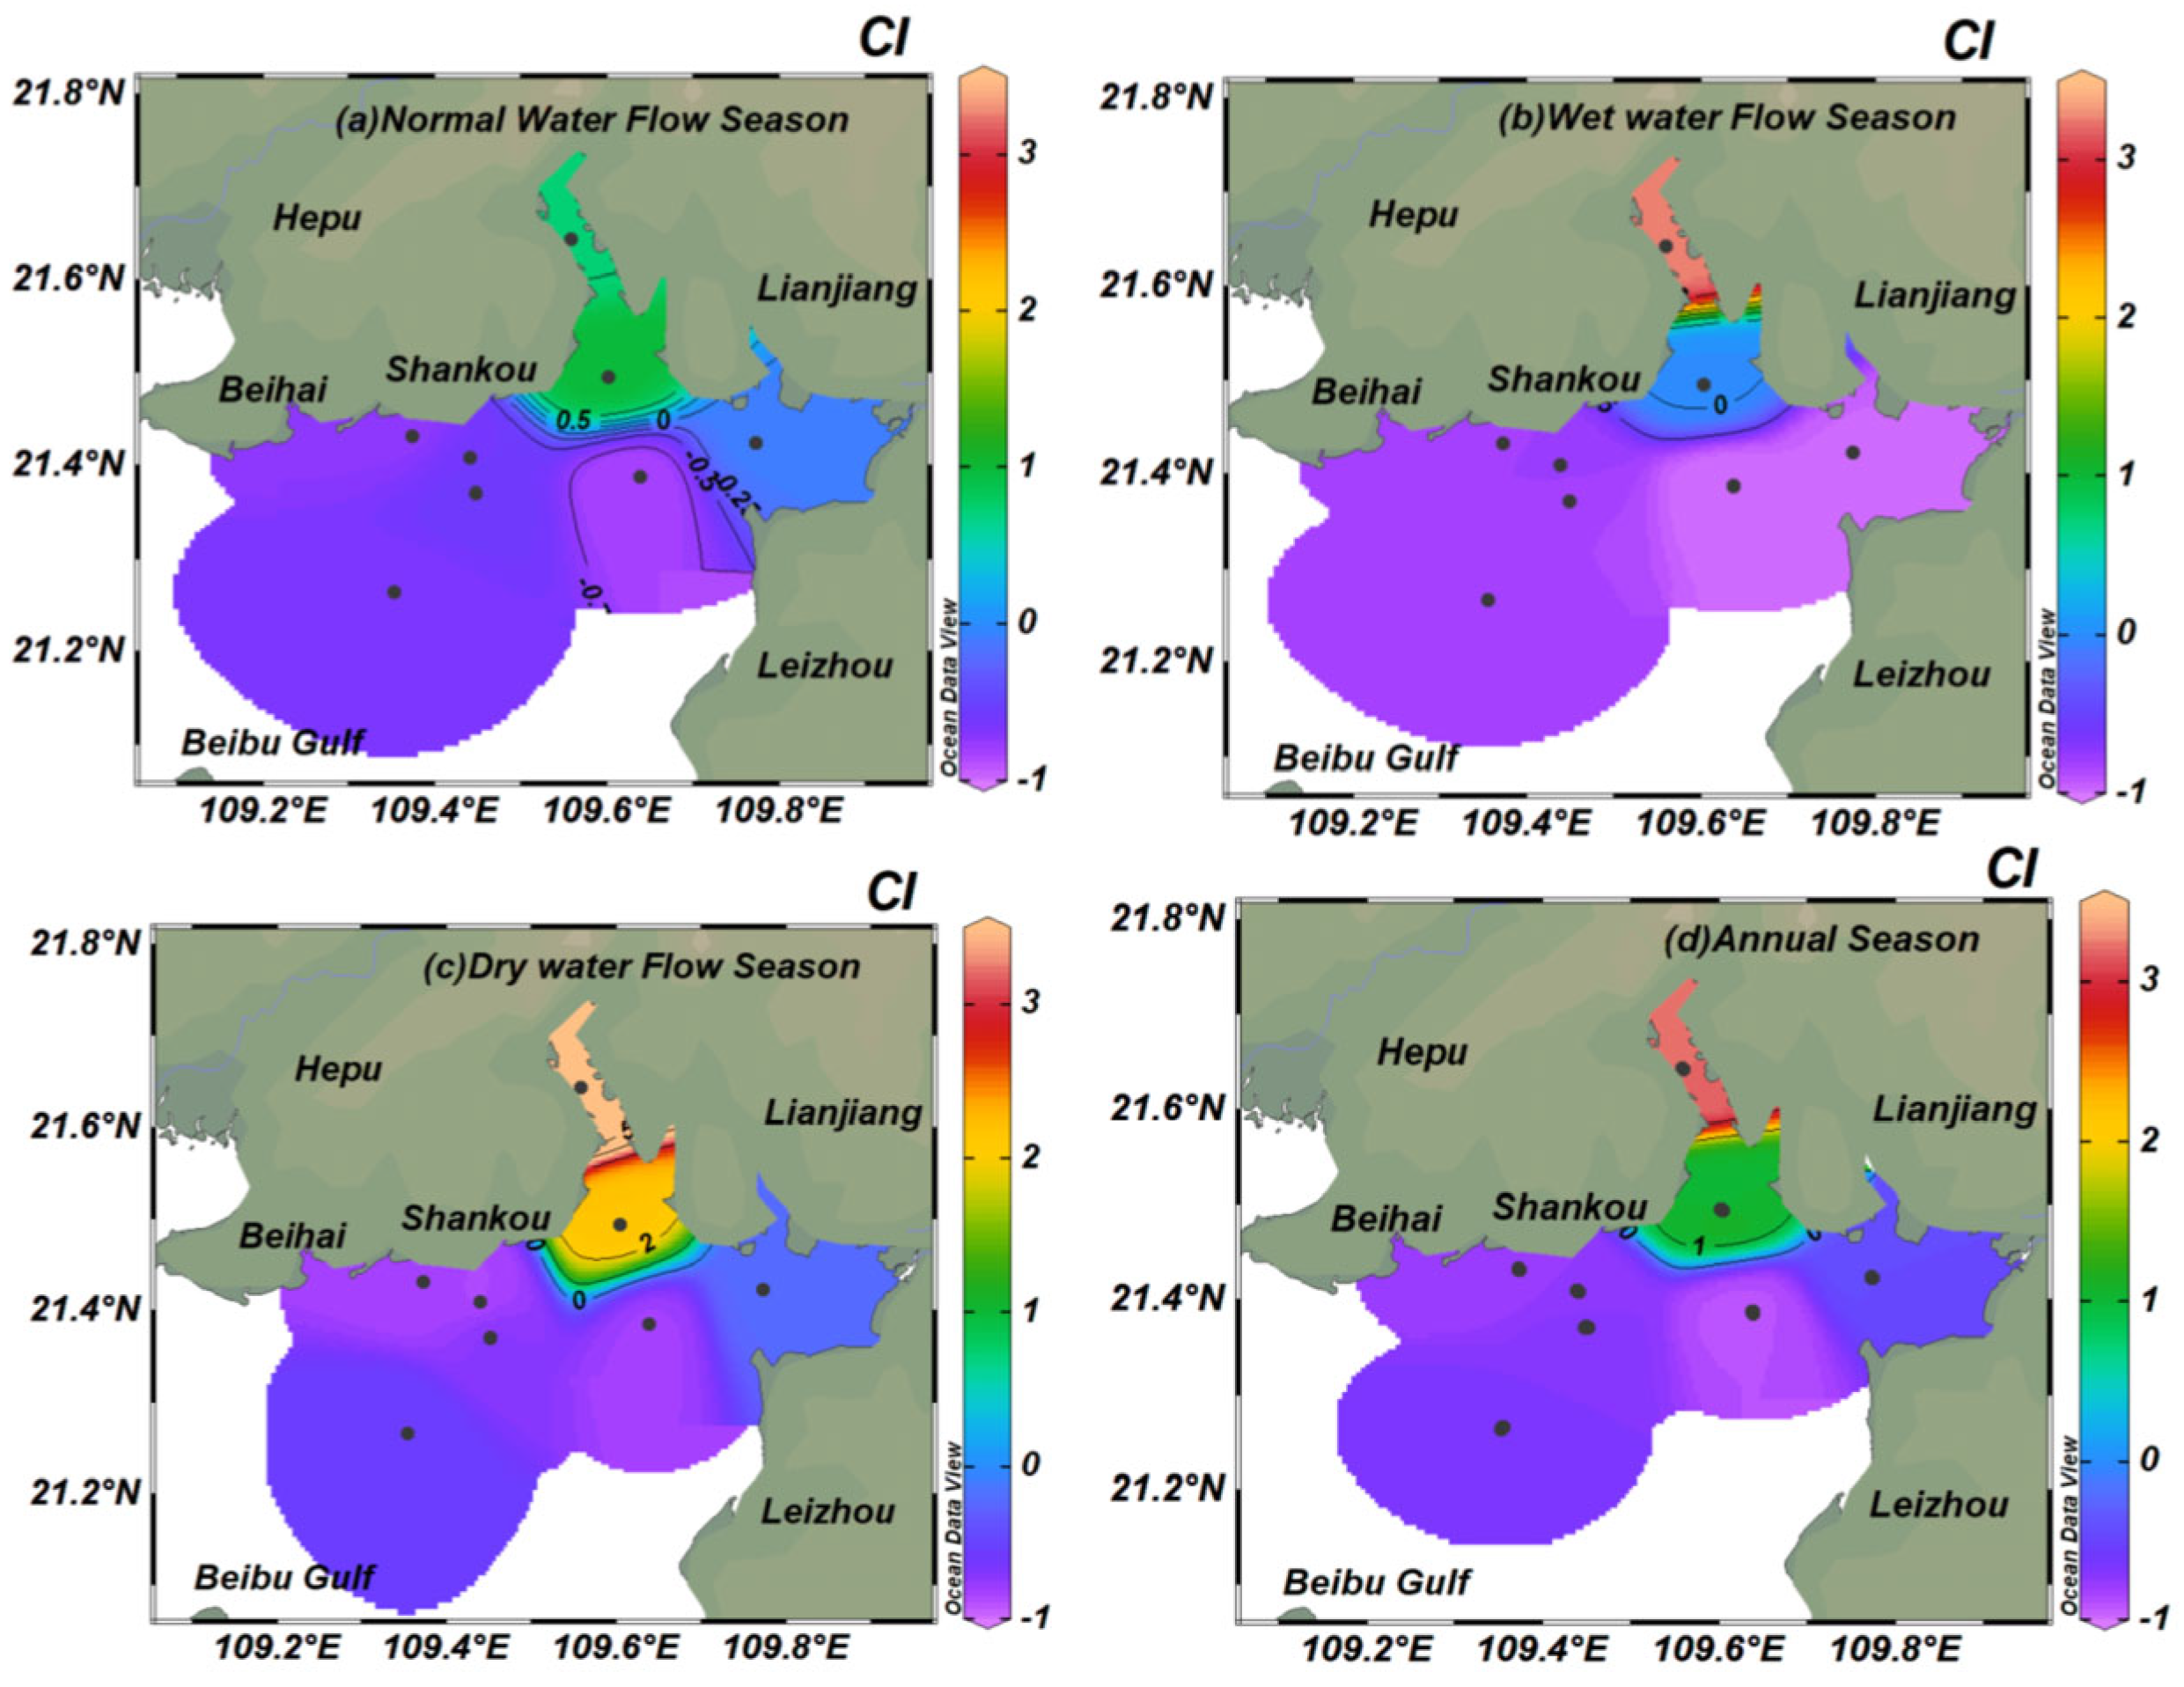
During the 2021 survey period, the mean concentration of CI in Tieshan Bay surface seawater was 0.0 ± 1.6, and the concentration ranged from −1 to 5.6 (Figure 8d). The average CI concentration in the plain water season was −0.2 ± 0.7, and the concentration ranged from −0.8 to 1.0 (Figure 8a), and the organic pollution in the plain water season did not exceed the standard. In the wet season, the average concentration of CI was −0.2 ± 1.5, ranging from −1 to 3.3 (Figure 8b), and the horizontal distribution showed a gradually decreasing trend from nearshore to farshore. In addition, the waters near Hepu showed slight organic pollution. In the dry season, the average concentration of CI was 0.5 ± 2, and the concentration ranged from −0.9 to 5.6 (Figure 8c). Serious organic pollution was located in the sea area near Hepu, and slight organic pollution also occurred in Tieshan Bay [54]. In general, there was no significant difference in CI concentration in Tieshan Bay surface seawater between dry, wet, and normal seasons (p > 0.05).

4. Discussion

4.1. Comparison of DIN, DIP, and COD in Tieshan Bay with Those of Other Chinese and World

In comparison, Tieshan Bay’s DIN, DIP, and COD are comparable with most areas listed in Table 2. The mean DIN concentration was lower than that in Qinzhou Bay, Fangchenggang, Bohai Bay, Daya Bay, Pearl River Estuary, the Rhone River, and the Mississippi River estuaries [58,59,60,61]. In contrast, Tieshan Bay’s DIN, DIP, and COD are comparable with most areas listed in Table 2. The mean DIN concentration was lower than that in Qinzhou Bay, Fangchenggang, Bohai Bay, Daya Bay, Pearl River Estuary, the Rhone River, and the Mississippi River estuaries [4,58,59,60,61,62,63,64,65]. The average DIP concentration of Tieshan Bay is higher than that of Bohai Bay and Daya Bay [4,60,61], while the average DIP value was lower than that in other regions. In terms of COD, Tieshan Bay is smaller than that of Qinzhou Bay, Fangchenggang, Bohai Bay, Daya Bay, Pearl River Estuary, the Rhone River, and the Mississippi River estuaries [4,58,59,60,61,62,63,64,65] (Table 2). The average DIP concentration of Tieshan Bay is higher than that of Bohai Bay and Daya Bay [4,60,61], while the average DIP value was lower than that in other regions. In terms of COD, Tieshan Bay is smaller than that of Qinzhou Bay, Fangchenggang, Bohai Bay, Daya Bay, Pearl River Estuary, the Rhone River, and the Mississippi River estuaries [4,60,61,62,63,64,65] (Table 2).
In contrast, Tieshan Bay’s EI and DIN/DIP are comparable with most of the sea areas listed in Table 2. The average EI concentration was lower than that in Qinzhou Bay, Zhenzhu Bay, Lianzhou Bay, the Yellow River Estuary, Pearl River Estuary, the Rhone Estuary, and the Mississippi Estuary [18,63,64,65,66,67,68]. The DIN/DIP of Tieshan Bay is lower than that of Qinzhou Bay and the Yellow River Estuary, Pearl River Estuary, the Rhone Estuary, and the Mississippi River Estuary [18,63,64,65,66,67,68,69].

4.2. Effects of the Riverine Freshwater Input on DIN, DIP, and COD in Tieshan Bay

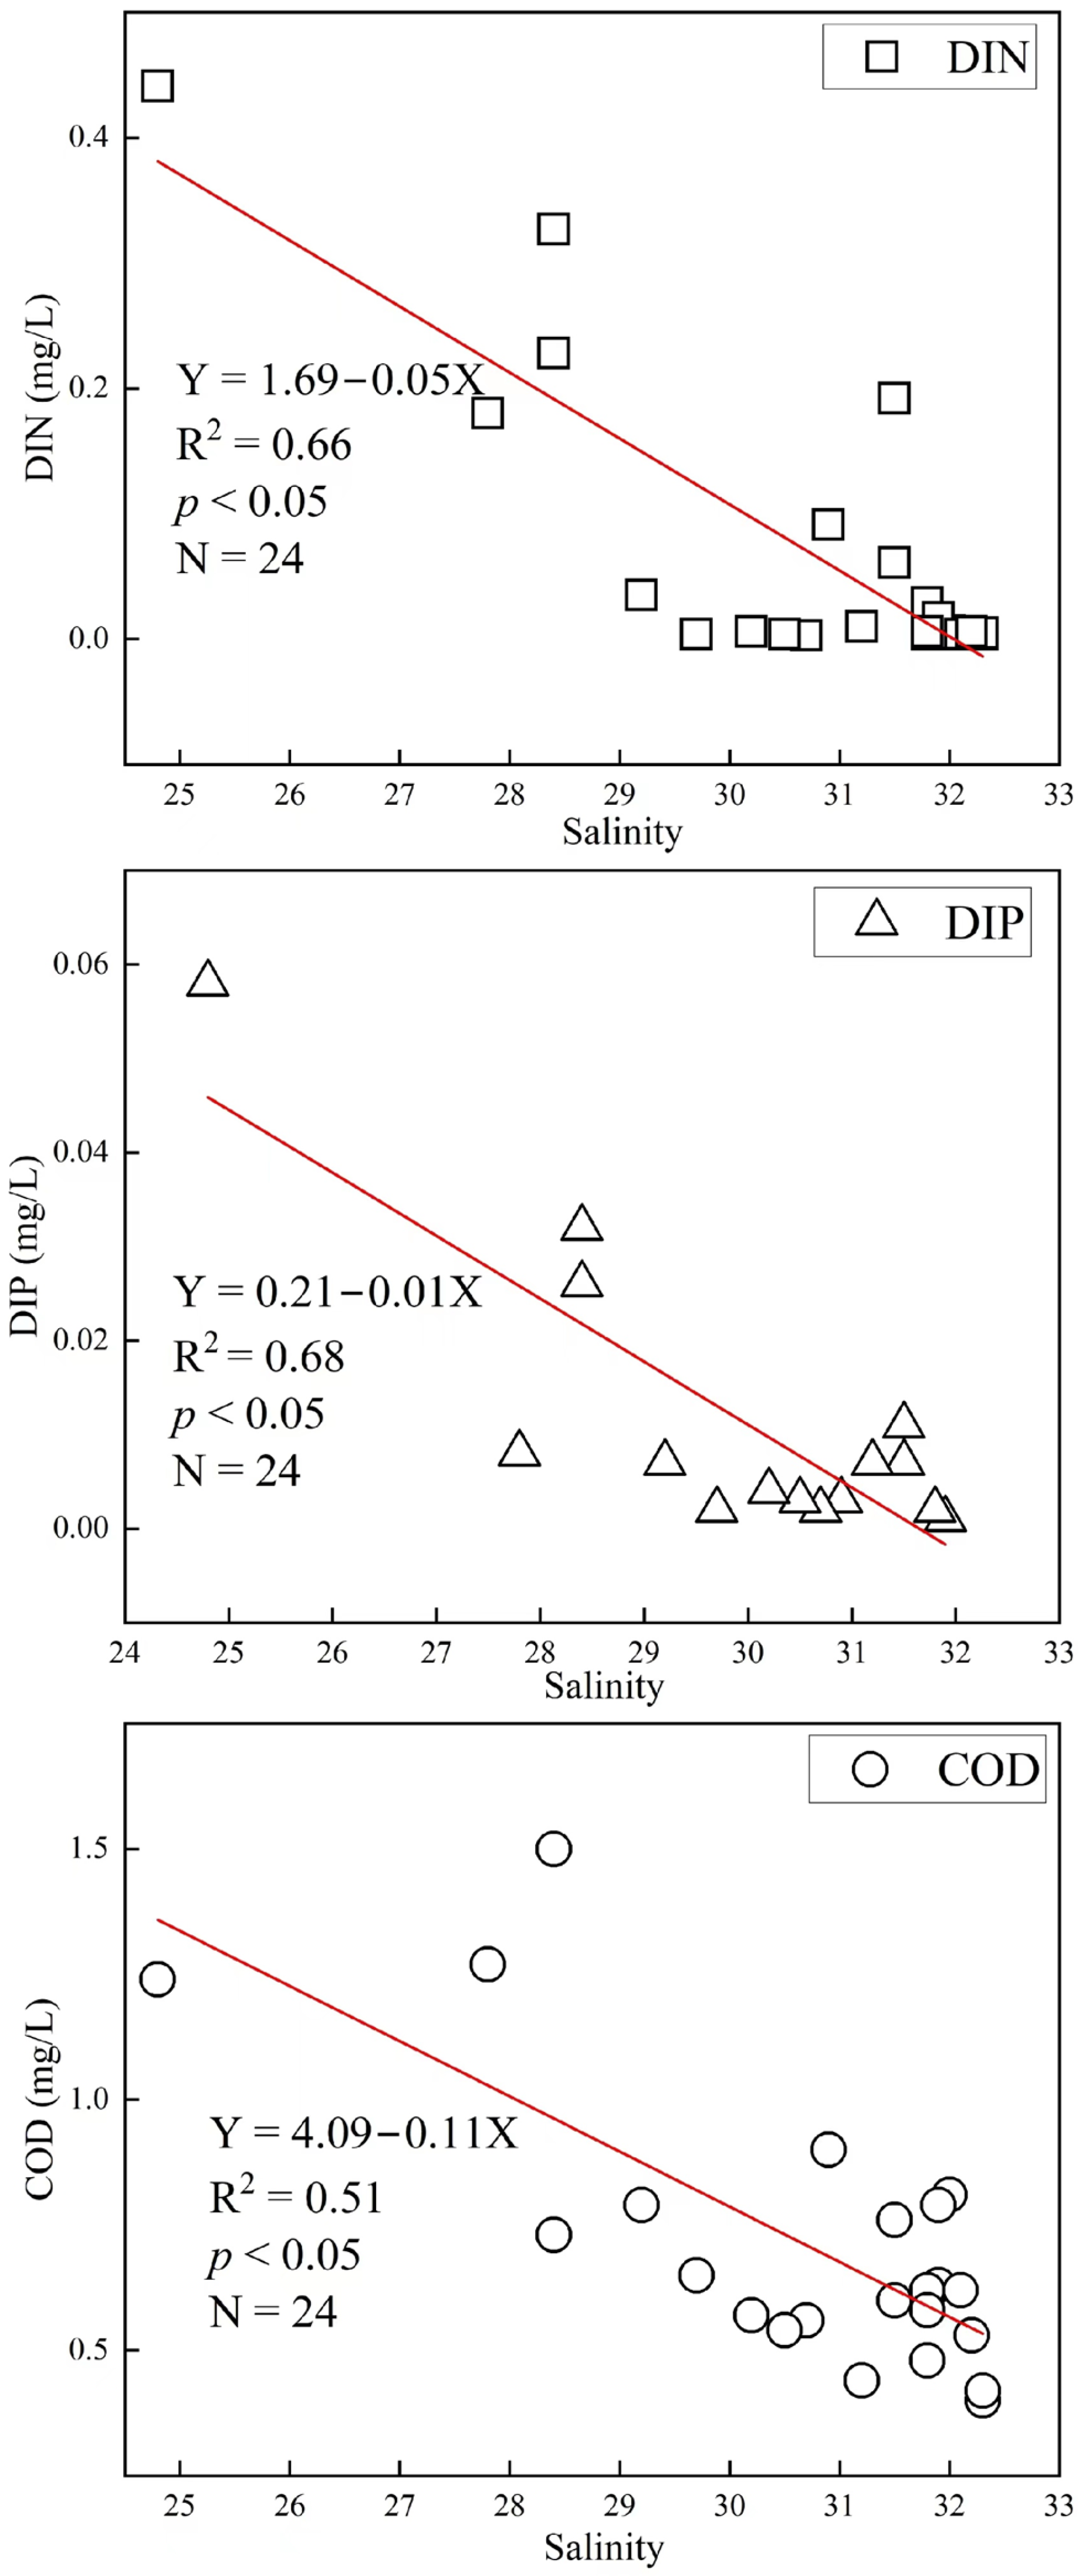
In this paper, based on the DIP, DIN, COD, and salinity survey data of Guangxi Beihai in 2021, origin is applied to carry out linear fitting between each group of data and salinity, aiming to comprehensively evaluate the linear relationship between salinity and nutrients in coastal water in Beihai. The results show that the linear fitting correlation coefficients R between salinity, DIP, DIN, and COD are all above 0.50, and the significant difference p is also less than 0.05 [41]. The slope of the fitting curves of each group of data with the same salinity is very similar, which further indicates that nutrients change with the change of salinity (Figure 9). It can be shown that in 2021, COD, DIN, and DIP of all stations in Beihai, Guangxi, will be affected by salinity and present a significant negative correlation, namely “low salinity and high nutrients, high salinity and low nutrients” [42,70,71].
There is a significant negative linear relationship between DIN, DIP, and COD and salinity in Tieshan Bay coastal water in each season (p < 0.05) (Figure 9), proving that the main controlling factor of DIN, DIP, and COD spatial changes may be the input of fresh water in rivers [12,28,72]. However, the decreasing trend of different environmental factors with salinity may be related to the degree of freshwater input and land-based pollutant input [68,73]. Compared with DIN and DIP, the COD concentration declines more rapidly with more freshwater input. [74,75]

4.3. Seawater Acidification and the Effect of Stream Input on Organic Pollution

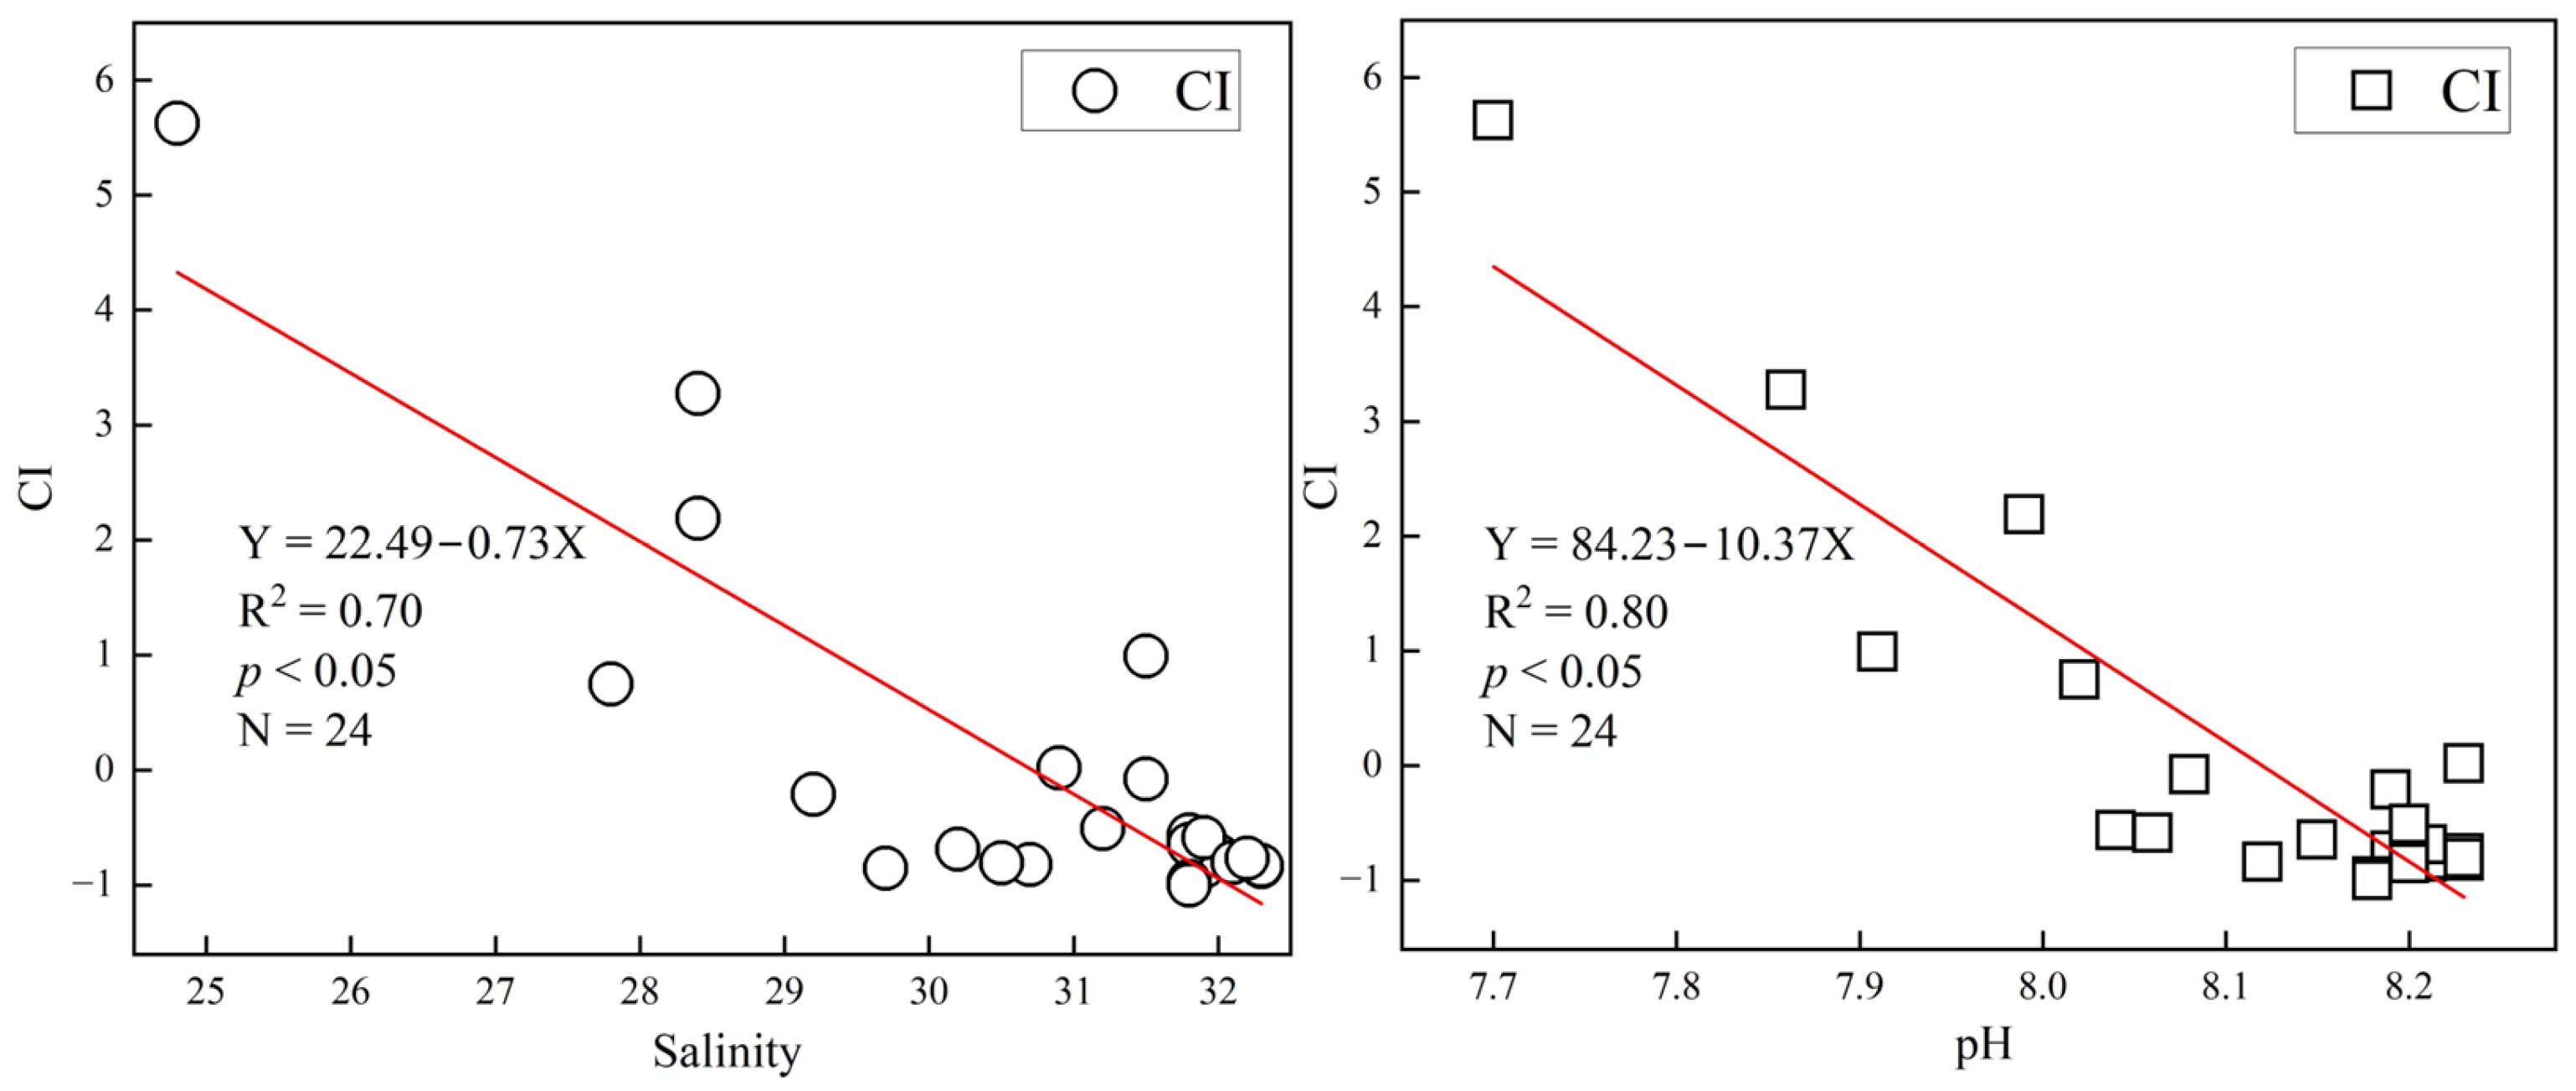
The linear fitting of Tieshan Bay organic pollution index with salinity and pH in 2021 was conducted to comprehensively evaluate the linear relationship between salinity and organic pollution index and pH and organic pollution index in Tieshan Bay coastal waters (Figure 10) [76]. The results show that the linear fitting correlation coefficients R2 of salinity, pH, and organic pollution index are all greater than 0.50, and the significant difference p was also less than 0.05, showing a significant negative correlation. The results show that organic pollution is related to seawater acidification and freshwater input [41,75,77].

4.4. Key Environmental Factors Affecting Nutrients in Tieshan Bay

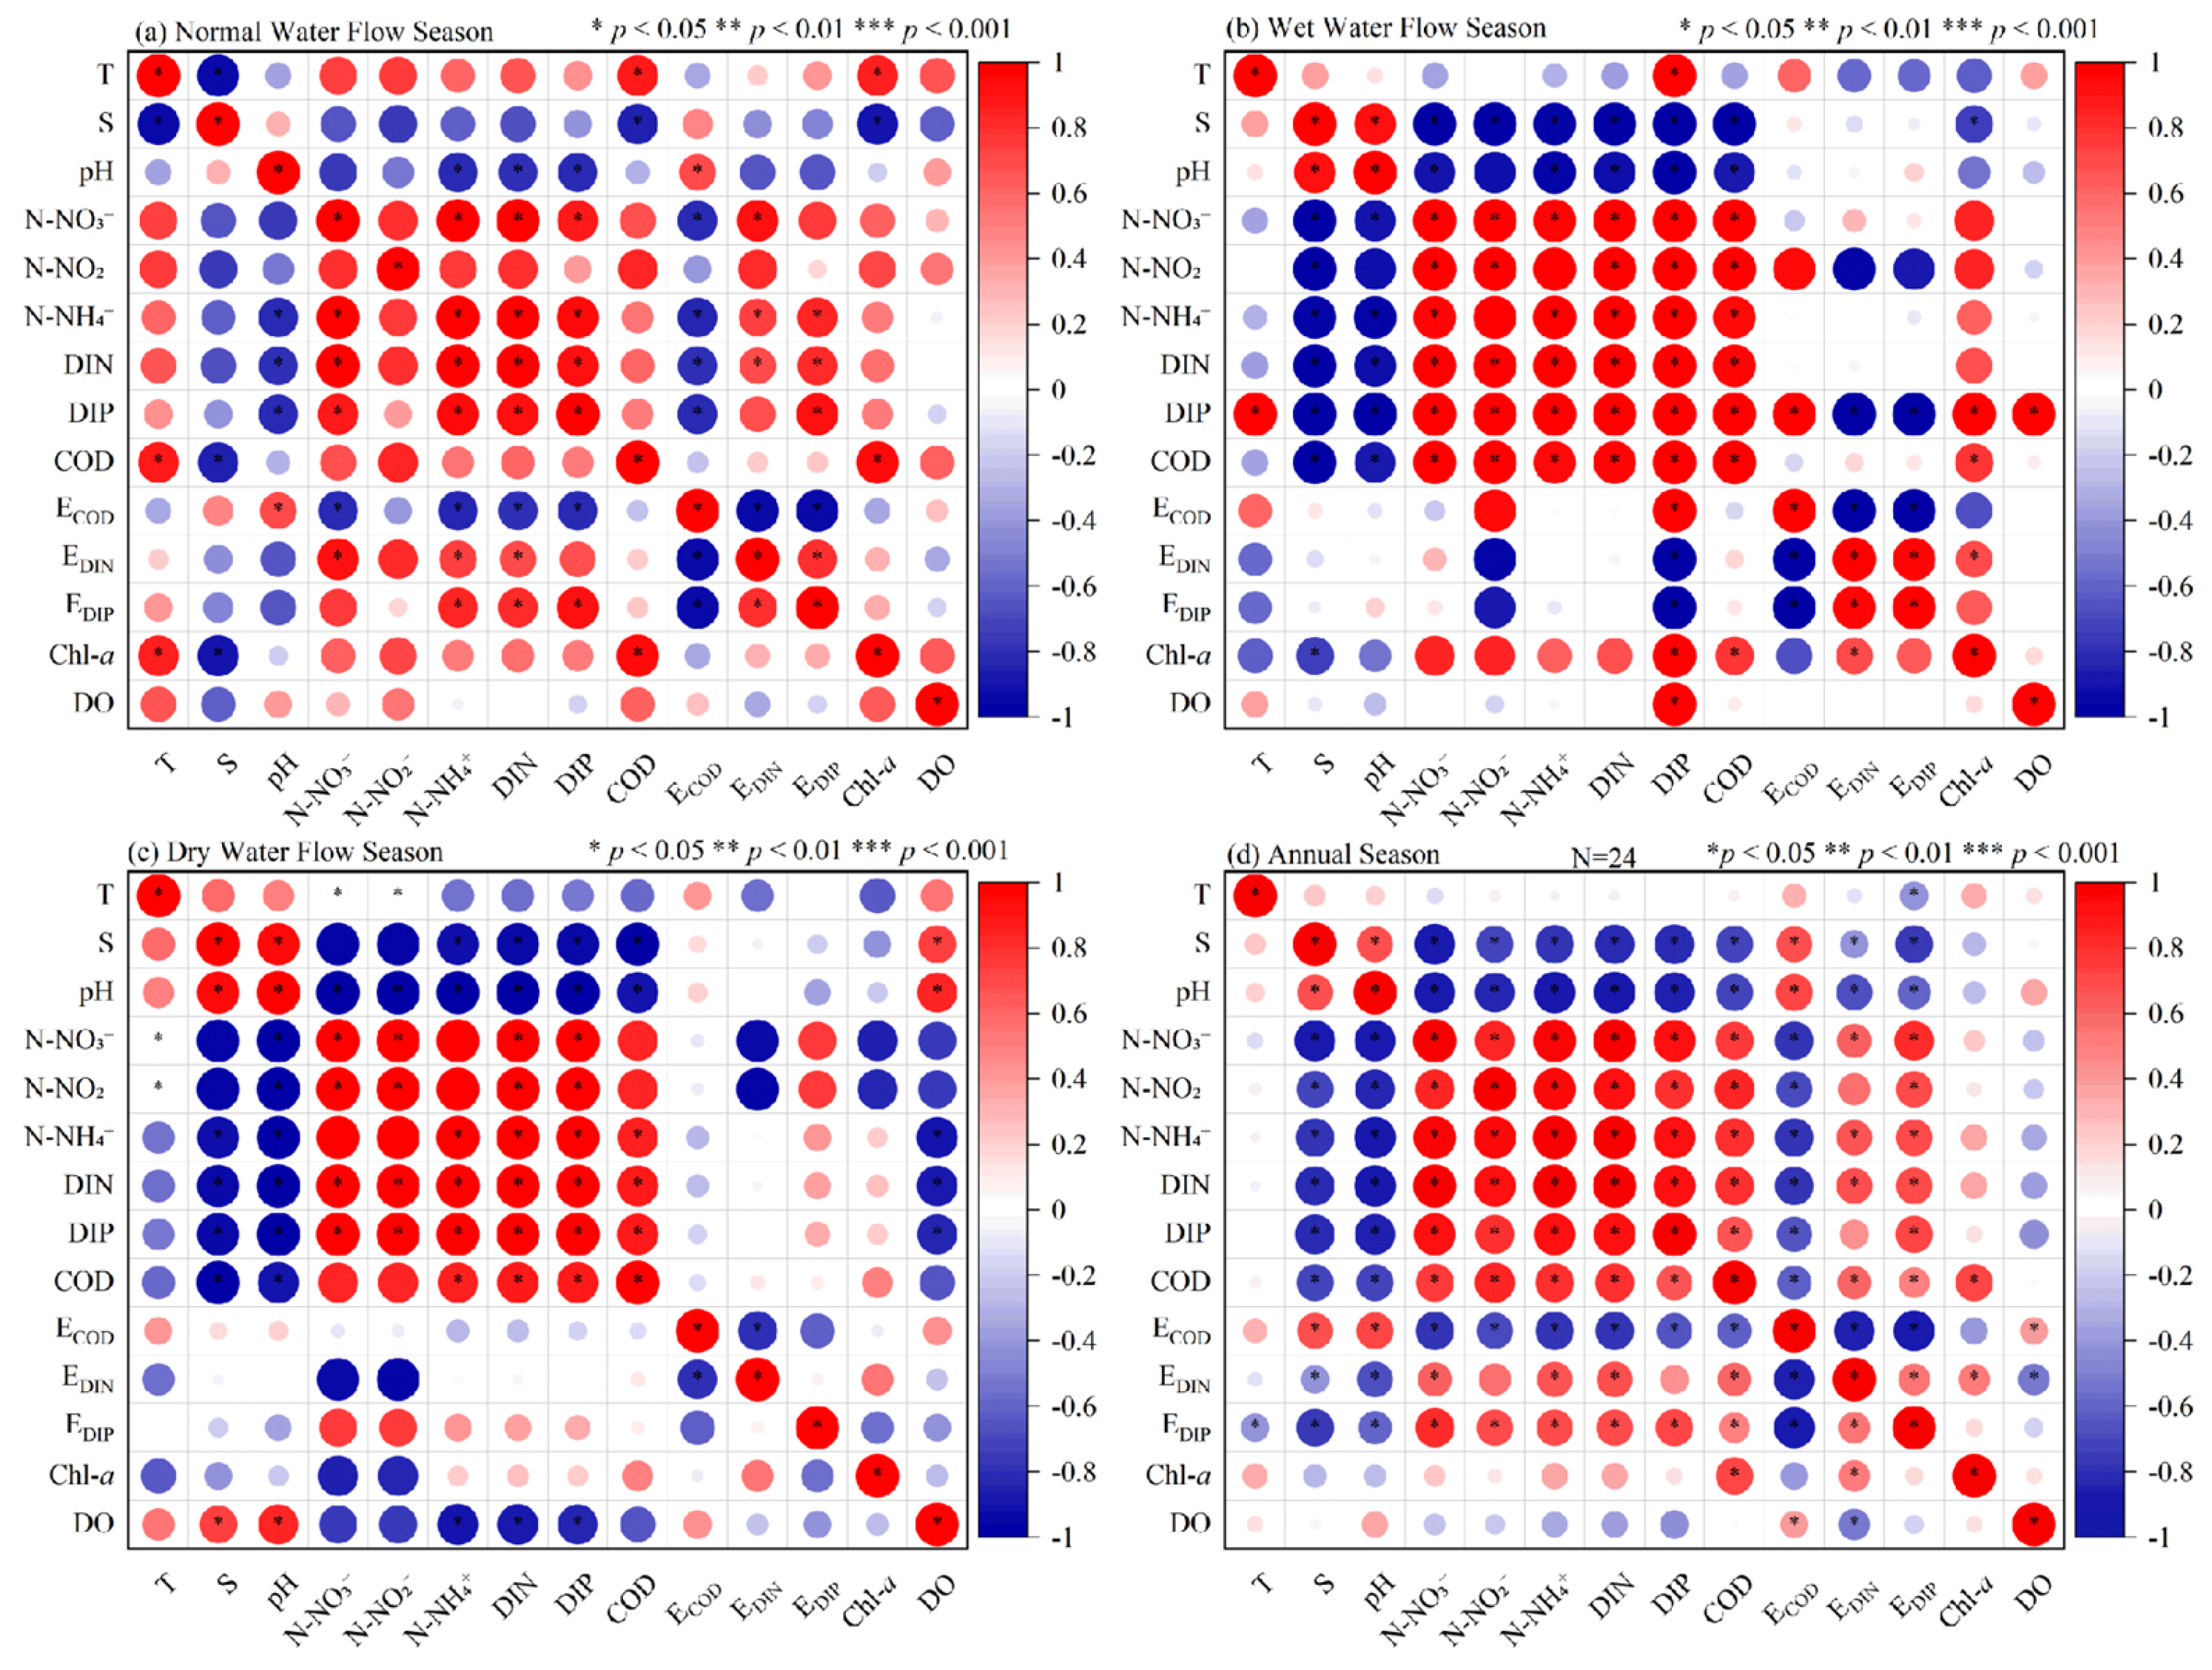
It shows the significant differences between different nutrients and environmental factors in 2021 (Figure 11). The results showed that there were significant differences in salinity and nutrients during 2021 (p < 0.05), N N O 3 (p < 0.05), N N O 2 (p < 0.05), N H 4 + (p < 0.05), DIN (p < 0.05), DIP (p < 0.05), COD (p < 0.05), and E D I P (p > 0.05) that showed a significant negative correlation with salinity. In addition, salinity is positively correlated with E C O D (p < 0.05). But salinity was not significantly different from E D I N (p < 0.05). There was a significant positive correlation between DIN and nitrogen (p < 0.05). DIP was positively correlated with nitrogen and E D I P (p < 0.05) and has a significant negative correlation with E C O D (p < 0.05), but there was no significant difference with E D I N (p > 0.05). The results show that COD, DIN (p < 0.05), and DIP (p < 0.05) showed a significant positive correlation. In addition, it can be concluded that in the relationship discussed in this paper, COD, DIN, and DIP all increase with the increase of nitrogen content in the environment and decrease with the increase of salinity content [78,79]. All kinds of environmental factors are related to nutrients because water affects the reproduction rate of primary producers by changing the water temperature, salinity, and pH, and the number of primary producers determines the amount of nutrients. When primary producers reproduce quickly, nutrients in seawater are rapidly absorbed [45,46,80]. Tieshan Bay coastal eutrophication and organic pollution are affected by water temperature and pH, indicating that acidification of seawater and warming of water temperature in summer will cause nutrient changes [77]. In addition, eutrophication may be related to other factors, such as the period of water level surge (July) in water bodies [81,82,83]. It is worth noting that the water flow retention time (WRT) in marine waters is generally not too long; when rainfall is high, the river flow is fast, resulting in a decrease in the WRT; when rainfall decreases, the river flow is slower, and the WRT increases. The longer the WRT time is, the more suitable the conditions are for algal bloom, colonization, and growth in marine waters [84,85,86,87]. In addition, Chl-a was significantly and positively correlated with DIP and COD during the period of water level surge, i.e., high rainfall (p < 0.05), while Chl-a and nutrients were all differentially and non-significantly correlated with each other when the rainfall was low (p > 0.05) [88,89]. Thus, this study confirmed that the WRT may lead to the accumulation of nutrients and eutrophication conditions in the bay [90].

5. Conclusions

In summary, this study explored spatiotemporal nutrient patterns, stoichiometry, and eutrophication assessment in Tieshan Bay coastal water in 2021. The results showed that nutrient concentrations varied seasonally, with the highest concentrations of COD occurring during the rainy season. This is associated with high rainfall during the wet season, the flushing of land-based pollutants into the sea by rainwater, and increased freshwater input. Overall, the hotspot coastal waters with high DIN, DIP, and COD concentrations were located in the upper region of Tieshan Bay in all seasons. Moreover, DIN concentrations were higher relative to DIP based on Redfield values, indicating the presence of P limitation in Tieshan Bay. In addition, the average contributions of DIN, DIP, and COD to EI were 26.6%, 8.8%, and 64.6%, respectively, indicating that COD is an important factor in the eutrophication process of seawater. Furthermore, DIN and DIP increased with EI, while the opposite was true for COD, with DIN, DIP, and COD negatively correlated with salinity (p < 0.05), suggesting that coastal water quality is affected by land-based source input. Furthermore, organic pollution was most severe in the dry season, and organic pollution affected by freshwater input may lead to seawater acidification. To achieve the seawater quality target and mitigate eutrophication effects, it is critical to implement land-based source management across the river-bay-coastal water continuum.

Author Contributions

Conceptualization, P.Z.; Methodology, P.Z. and J.Z.; Software, S.W.; Validation, M.X., X.L. and X.P.; Form analysis, C.R., S.W. and M.X.; Writing—original draft preparation, P.Z., J.Z. and S.W.; Writing—review and editing, P.Z., J.Z., C.R. and S.W.; Visualization, S.W.; Supervision, P.Z.; Project management, P.Z., J.Z. and C.R.; Funding acquisition, P.Z., J.Z. and C.R. All listed authors made substantial, direct, and intellectual contributions to the work and are approved for publication. All authors have read and agreed to the published version of the manuscript.

Funding

This research was supported by the Guangxi Key Research and Development Program (GuiKeAB22035065), the Guangxi Key Laboratory of Marine Environmental Change and Disaster in Beibu Gulf, Beibu Gulf University (2022KF005), Research and Development Projects in Key Areas of Guangdong Province (2020B1111020004), and the Guangdong Basic and Applied Basic Research Foundation (2020A1515110483); Guangdong Ocean University Fund Project (R18021).

Institutional Review Board Statement

Not applicable.

Informed Consent Statement

Not applicable.

Data Availability Statement

Data sharing is not applicable to this article.

Acknowledgments

Thanks for the reviewers for their careful review and constructive suggestions. Thanks to all members of the research team and others involved in this study.

Conflicts of Interest

The authors declare no conflict of interest.

References

  1. Conley, D.J.; Paerl, H.W.; Howarth, R.W.; Boesch, D.F.; Seitzinger, S.P.; Havens, K.E.; Lancelot, C.; Likens, G.E. Controlling eutrophication on: Nitrogen and phosphorus. Science 2009, 323, 1014–1015. [Google Scholar] [CrossRef] [PubMed]
  2. Howarth, R.W. Coastal nitrogen pollution: A review of sources and trends globally and regionally. Harmful Algae. 2008, 8, 14–20. [Google Scholar] [CrossRef]
  3. Yin, K.D.; Qian, P.Y.; Chen, J.C.; Hsieh, D.P.H.; Harrison, P.J. Dynamics of nutrients and phytoplankton biomass in the Pearl River Estuary and adjacent waters of Hong Kong during summer: Preliminary evidence for phosphorus and silicon limitation. Mar. Ecol. Prog. Ser. 2000, 194, 295–305. [Google Scholar] [CrossRef]
  4. Zhou, C.H.; Zhang, J.P.; Huang, X.P.; Zhao, C.Y.; Wu, Y.C. Distribution, key controlling factors and potential ecological role of particulate nitrogen and phosphorus in Daya bay. Mar. Environ. Sci. 2019, 38, 696–702+711. [Google Scholar] [CrossRef]
  5. Huang, X.P.; Zhang, L.; Zhang, J.P.; Jiang, Z.J. Problems in Development of Chinese Bays and the Protection Strategy. Bull. Chin. Acad. Sci. 2016, 31, 1151–1156. [Google Scholar] [CrossRef]
  6. Greening, H.; Janicki, A.; Sherwood, E.T.; Pribble, R.; Johansson, J.O.R. Ecosystem responses to long-term nutrient management in an urban estuary: Tampa Bay, Florida, USA. Estuar. Coast. Shelf Sci. 2014, 151, A1–A16. [Google Scholar] [CrossRef]
  7. Liu, S.M.; Li, R.H.; Zhang, G.L.; Wang, D.R.; Du, J.Z.; Herbeck, L.S.; Zhang, J.; Ren, J.L. The impact of anthropogenic activities on nutrient dynamics in the tropical Wenchanghe and Wenjiaohe Estuary and lagoon system in East Hainan, China. Mar. Chem. 2011, 125, 49–68. [Google Scholar] [CrossRef]
  8. Liu, S.M.; Qi, X.H.; Li, X.; Ye, H.R.; Wu, Y.; Ren, J.L.; Zhang, J.; Xu, W.Y. Nutrient dynamics from the Changjiang (Yangtze River) estuary to the East China Sea. J. Mar. Syst. 2016, 154, 15–27. [Google Scholar] [CrossRef]
  9. Zhang, X.Y.; Qi, M.; Chen, L.; Wu, T.Y.; Zhang, W.; Wang, X.J.; Tong, Y.D. Recent change in nutrient discharge from municipal wastewater in China’s coastal cities and implication for nutrient balance in the nearshore waters. Estuar. Coast. Shelf Sci. 2020, 242, 106856. [Google Scholar] [CrossRef]
  10. Davidson, K.; Gowen, R.J.; Harrison, P.J.; Fleming, L.E.; Hoagland, P.; Moschonas, G. Anthropogenic nutrients and harmful algae in coastal waters. J. Environ. Manag. 2014, 146, 206–216. [Google Scholar] [CrossRef]
  11. Wu, G.J.; Cao, W.Z.; Wang, F.F.; Su, X.L.; Yan, Y.Y.; Guan, Q.S. Riverine nutrient fluxes and environmental effects on China’s estuaries. Sci. Total Environ. 2019, 661, 130–137. [Google Scholar] [CrossRef]
  12. Zhang, P.; Ruan, H.M.; Dai, P.D.; Zhao, L.R.; Zhang, J.B. Spatiotemporal river flux and composition of nutrients affecting adjacent coastal water quality in Hainan Island, China. J. Hydrol. 2020, 591, 125293. [Google Scholar] [CrossRef]
  13. Cai, W.J.; Hu, X.; Huang, W.J.; Murrell, M.C.; Lehrter, J.C.; Lohrenz, S.E.; Chou, W.C.; Zhai, W.; Hollibaugh, J.T.; Wang, Y. Acidification of subsurface coastal waters enhanced by eutrophication. Nat. Geosci. 2011, 4, 766–770. [Google Scholar] [CrossRef]
  14. Glibert, P.M.; Al-Azri, A.; Icarus Allen, J.; Bouwman, A.F.; Beusen, A.H.; Burford, M.A.; Harrison, P.J.; Zhou, M. Key questions and recent research advances on harmful algal blooms in relation to nutrients and eutrophication. Glob. Ecol. Oceanogr. Harmful Algal Bloom. 2018, 232, 229–259. [Google Scholar]
  15. Li, X.Q.; Lu, C.Q.; Zhang, Y.F.; Zhao, H.D.; Wang, J.Y.; Liu, H.B.; Yin, K.D. Low dissolved oxygen in the Pearl River estuary in summer: Long-term spatio-temporal patterns, trends, and regulating factors. Mar. Pollut. Bull. 2020, 151, 110814. [Google Scholar] [CrossRef] [PubMed]
  16. Liu, G.P.; He, W.H.; Cai, S.Q. Seasonal variation of dissolved oxygen in the southeast of the Pearl River Estuary. Water 2020, 12, 2475. [Google Scholar] [CrossRef]
  17. Zhang, J.B.; Zhang, Y.C.; Zhang, P.; Li, Y.; Li, J.X.; Xu, J.L.; Luo, X.Q.; Zhao, L.R. Seasonal phosphorus variation in coastal water affected by the land-based sources input in the eutrophic Zhanjiang Bay, China. Estuar. Coast. Shelf Sci. 2021, 252, 107277. [Google Scholar] [CrossRef]
  18. Ke, S.; Zhang, P.; Ou, S.J.; Zhang, J.X.; Chen, J.Y.; Zhang, J.B. Spatiotemporal nutrient patterns, composition, and implications for eutrophication mitigation in the Pearl River Estuary, China. Estuar. Coast. Shelf Sci. 2022, 266, 107749. [Google Scholar] [CrossRef]
  19. China Gulf Journal Compilation Committee. Gulf Records of China; The Gulf of Guangxi; Ocean Press: Beijing, China, 1993. [Google Scholar]
  20. Meng, X.W.; Zhang, C.Z. Basic Status of Marine Environmental Resources in Guangxi Zhuang Autonomous Region; Ocean Press: Beijing, China, 2014. [Google Scholar]
  21. Guangxi Zhuang Autonomous Region Oceanic Bureau. Strategic Plan for the Development of Guangxi’s Maritime Economy (2021–2035); Guangxi Zhuang Autonomous Region Oceanic Bureau: Guangxi, China, 2021. Available online: http://hyj.gxzf.gov.cn/zwgk_66846/hyjj_66894/t10969962.shtml (accessed on 12 July 2023).
  22. Zheng, Q.; Zhang, R.J.; Wang, Y.H.; Pan, X.H.; Tang, J.H.; Zhang, G. Occurrence and distribution of antibiotics in the Beibu Gulf, China: Impacts of river discharge and aquaculture Occurrence and distribution of antibiotics in the Beibu Gulf, China: Impacts of river discharge and aquaculture activities. Mar. Environ. Res. 2012, 78, 26–33. [Google Scholar] [CrossRef]
  23. Yang, J.C.; Wang, W.G.; Zhao, M.W.; Chen, B.; Olusegun, A.D.; Chu, Z.H. Spatial distribution and historical trends of heavy metals in the sediments of petroleum producing regions of the Beibu Spatial distribution and historical trends of heavy metals in the sediments of petroleum producing regions of the Beibu Gulf, China. Mar. Pollut. Bull. 2015, 91, 87–95. [Google Scholar] [CrossRef]
  24. Lao, Q.B.; Su, Q.Z.; Liu, G.Q.; Shen, Y.L.; Chen, F.J.; Lei, X.T.; Qing, S.M.; Wei, C.L.; Zhang, C.H.; Gao, J.S. Spatial distribution of and historical changes in heavy metals in the surface seawater and sediments of the Beibu Gulf, China. Mar. Pollut. Bull. 2019, 146, 427–434. [Google Scholar] [CrossRef] [PubMed]
  25. He, B.M.; Wei, M.X. A Preliminary Study of the Relationship between the Self-purifyingability and the Environment Factors of Tieshangang Bay. Trans. Oceanol. Limnol. 2006, 3, 21–26. [Google Scholar] [CrossRef]
  26. Chen, Z.Z.; Cai, W.G.; Xu, S.N.; Huang, Z.R.; Qiu, Y.S. Risk assessment of coastal ecosystem in Beibu Gulf, Guangxi of South China. J. Appl. Ecol. 2011, 22, 2977–2986. [Google Scholar] [CrossRef]
  27. Lei, F.; Chen, X.Y.; Zhang, R.C.; Zhuang, J.L.; Ke, K.; Jiang, F.J.; Xu, M.B. Application the Nemerow lndex to Comprehensive Assessment of Sea Area Environmental Quality of Beibu Gulf Coast in Summer. Guangxi Sci. 2014, 21, 84–88. [Google Scholar] [CrossRef]
  28. Li, P.; Mo, H.L.; Guo, Z. Current Condition and Assessment of Inshore Water Quality in Guangxi. Bull. Sci. Technol. 2018, 34, 274–279. [Google Scholar] [CrossRef]
  29. Li, P.; Mo, H.L.; Guo, Z. Annual Assessment of Seawater Quality of Beibu Gulf in 2016. Trans. Oceanol. Limnol. 2019, 1, 54–64. [Google Scholar] [CrossRef]
  30. Tao, X.P.; Wu, M.; Liu, X.; Lei, F.; He, X.L. Investigation and Analysis of Water Pollution in Beibu Gulf of Guangxi. Guangxi Sci. 2022, 29, 532–540. [Google Scholar] [CrossRef]
  31. Kan, W.J.; Zhang, Q.F.; Shi, H.M.; Xu, Y.S.; Wang, B.; Jiang, H.Y. Study on variation trend of nutrients in Bohai Bay. Mar. Environ. Sci. 2010, 29, 238–241. [Google Scholar]
  32. Zhang, J.; Yang, Y.; Yang, L.; Li, J.R.; Zhang, Y.Q. Relationship between red tide occurrence and environmental factors in offshore waters of East China Sea. J. Guangdong Ocean Univ. 2019, 39, 66–70. [Google Scholar]
  33. Wei, M.X.; Lai, T.H.; He, B.M. Development Trend of the Water Quality Conditions in the Tieshangang Bay. Mar. Sci. Bull. 2001, 21, 69–744. [Google Scholar]
  34. Zhang, J.; Zhang, Y.B.; Zhou, K.; Zhang, J.B.; Sun, S.L. Evaluation on temporal and spatial distribution of nutrients and potential eutrophication in Shenzhen Bay. Ecol. Environ. Sci. 2010, 19, 253–261. [Google Scholar] [CrossRef]
  35. Huang, D.J.; Huang, X.P.; Huang, Z.G. Spatiotemporal variation of TN & TP contents in Enhalus acoroides and responses to nutrient load in Xincun Bay, Hainan. Mar. Environ. Sci. 2010, 29, 40–43. [Google Scholar]
  36. Wang, P.; Gui, F.K.; Wu, C.W. Effects of nutritional factors on uptake of nitrogen and phosphorus by Halymeniafloresia. Mar. Environ. Sci. 2010, 29, 356–359. [Google Scholar] [CrossRef]
  37. Wei, M.X.; Tong, W.P.; Lai, T.H.; He, B.M. the Change Characteristics of Biogenic Elements and Theirinfluencing Factors in Tieshangang Port. Trans. Oceanol. Limnol. 2001, 4, 23–27. [Google Scholar]
  38. Lan, W.L.; Peng, X.Y. Variation Characteristics of Nutrient Concentrations in the Tieshangang Bay. Guangxi Sci. 2011, 18, 380–384+391. [Google Scholar] [CrossRef]
  39. Zhang, J.B.; Zhang, P.; Dai, P.D.; Lai, J.Y.; Chen, Y. Spatiotemporal distributions of DIP and the eutrophication in Hainan Island adjacent coastal water. China Environ. Sci. 2019, 39, 2541–2548. [Google Scholar] [CrossRef]
  40. Zhou, A.G.; Cai, H.S. Theory and Application of Geological Environment Quality Assessment; China University of Geosciences Press: Wuhan, China, 1998; pp. 70–83. [Google Scholar]
  41. GB3097-1997; Standard for Seawater Quality. British Standard Institute: London, UK, 1997.
  42. Zou, J.Z.; Dong, L.P.; Qin, B.P. A preliminary study on eutrophication and red tide in Bohai Bay. Marine Environmental Science. 1983, 2, 41–54. [Google Scholar] [CrossRef]
  43. Guo, Q.; Wang, X.L.; Han, X.R.; Wang, J.T. Analysis of COD distribution and contribution to seawater eutrophication in the Bohai Sea. Mar. Sci. 2005, 9, 73–77. [Google Scholar]
  44. Li, R.H.; Liu, S.M.; Li, Y.W.; Zhang, G.L.; Ren, J.L.; Zhang, J. Nutrient dynamics in tropical rivers, lagoons, and coastal ecosystems of eastern Hainan Island, South China Sea. Biogeosciences 2014, 11, 481. [Google Scholar] [CrossRef]
  45. Lan, W.L.; Li, T.S.; Han, L.J. Distribution and seasonal variation of nutrition in the adjacent waters of Tieshangang bay in Guangxi. Mar. Sci. 2014, 38, 63–69. [Google Scholar] [CrossRef]
  46. Rishworth, G.M.; Elden, S.V.; Perissinotto, R.; Miranda, N.A.F.; Steyn, P.P.; Bornman, T.G. Environmental influences on living marine stromatolites: Insights from benthic microalgal communities. Environ. Microbiol. 2016, 18, 503–513. [Google Scholar] [CrossRef] [PubMed]
  47. Rishworth, G.M.; Perissinotto, R.; Bornman, T.G.; Lemley, D.A. Peritidal stromatolites at the convergence of groundwater seepage and marine incursion: Patterns of salinity, temperature and nutrient variability. J. Mar. Syst. 2017, 167, 68–77. [Google Scholar] [CrossRef]
  48. Menció, A.; Casamitjana, X.; Mas-Pla, J.; Coll, N.; Compte, J.; Martinoy, M.; Pascual, J.; Quintana, X.D. Groundwater dependence of coastal lagoons: The case of La Pletera salt marshes (NE Catalonia). J. Hydrol. 2017, 552, 793–806. [Google Scholar] [CrossRef]
  49. Rodellas, V.; Stieglitz, T.C.; Risoa, A.; Cook, P.G.; Raimbault, P.; Tamborski, J.J.; Beek, P.V.; Radakovitch, O. Groundwater-driven nutrient inputs to coastal lagoons: The relevance of lagoon water recirculation as a conveyor of dissolved nutrients. Sci. Total Environ. 2018, 642, 764–780. [Google Scholar] [CrossRef] [PubMed]
  50. Morel, Y.; Chaigneau, A.; Okpeitcha, V.O.; Stieglitz, T.; Assogba, A.; Duhaut, T.; Rétif, F.; Peugeot, C.; Sohou, Z. Terrestrial or oceanic forcing? Water level variations in coastal lagoons constrained by river inflow and ocean tides. Adv. Water Resour 2022, 169, 104309. [Google Scholar] [CrossRef]
  51. Redfield, A.C.; Ketchum, B.H.; Richards, F.A. The Influence of Organisms on the Composition of Sea-Water. Sea 1963, 2, 26–77. [Google Scholar]
  52. Lin, Y.A.; Su, J.L.; Hu, C.Y.; Zhang, M.; Li, Y.; Guan, W.B.; Chen, J.Z. N and P in waters of the Zhujiang River Estuary in summer. J. Oceanogr. 2004, 5, 63–73. [Google Scholar]
  53. Zhang, P.; Wei, L.R.; Lai, J.Y.; Dai, P.D.; Chen, Y.; Zhang, J.B. Concentration, composition and fluxes of land-based nitrogen and phosphorus source pollutants input into Zhanjiang Bay in Summer. J. Guangdong Ocean Univ. 2019, 39, 63–72. [Google Scholar] [CrossRef]
  54. Zhang, P.; Chen, Y.; Peng, C.H.; Dai, P.D.; Lai, J.Y.; Zhao, L.R.; Zhang, J.B. Spatiotemporal variation, composition of DIN and its contribution to eutrophication in coastal waters adjacent to Hainan Island, China. Reg. Stud. Mar. Sci. 2020, 37, 101332. [Google Scholar] [CrossRef]
  55. Chen, B.H.; Lin, H.; Zhang, C.H.; Ji, W.D.; Zhou, Q.L.; Lin, L.B.; Lu, M.R.; Huang, H.N.; Chen, C.P.; Gao, Y.H. Changing trends of DIN and PO4--P content in Xiamen Seawaters. J. Appl. Oceanogr. 2010, 29, 314–319. [Google Scholar]
  56. Zhang, P.; Ou, S.; Zhang, J.B.; Zhao, L.; Zhang, J. Categorizing numeric nutrients criteria and implications for water quality assessment in the Pearl River Estuary, China. Front. Mar. Sci. 2022, 9, 1004235. [Google Scholar] [CrossRef]
  57. Bricker, S.B.; Longstaff, B.; Dennison, W.; Jones, A.; Boicourt, K.; Wicks, C.; Woerner, J. Effects of nutrient enrichment in the nation’s estuaries: A decade of change. Harmful Algae. 2008, 8, 21–32. [Google Scholar] [CrossRef]
  58. Andrade, V.S.; Gutierrez, M.F.; Regaldo, L.; Paira, A.R.; Repetti, M.R.; Gagneten, A.M. Influence of rainfall and sea-sonal crop practices on nutrient and pesticide runoff from soybean dominated agricultural areas in Pampean streams, Argentina. Sci. Total Environ. 2021, 788, 147676. [Google Scholar] [CrossRef] [PubMed]
  59. Kang, J.H.; Lin, Y.L.; Wang, Y.; Lan, W.L. Assessment of the Eutrophication Level of the Marine Environment and Its Effect on Phytoplankton Chlorophyll a in Oinzhou Bay. Ocean Dev. Manag. 2020, 37, 67–74. [Google Scholar]
  60. Pang, M.Q. Analysis of Seawater Quality Variation and Influencing Factors in Fangchenggang Bay for the Past Ten Years. J. Guangxi Acad. Sci. 2021, 37, 29–36. [Google Scholar] [CrossRef]
  61. Sun, H.; Zhang, Q.F.; Tu, J.B.; Ma, Y.Y.; Yi, C.L.; Wang, B. Distribution and influencing factors of COD, along with the relationship with eutrophication in Tianjin coastal area. Mar. Environ. Sci. 2017, 36, 343–348+371. [Google Scholar] [CrossRef]
  62. Liu, X.H. The Variations of Nutrients and Phytoplankton Assemblages in the Bohai Bay and Their Correlation Analysis; Yantai Institute of Coastal Zone Research, University of Chinese Academy of Sciences: Beijing, China, 2019. [Google Scholar] [CrossRef]
  63. Fu, T.; Niu, L.X.; Dang, H.M.; Yang, Q.S. Effects of seasonal variation of the river discharge input on nitrogen and phosphorus nutrients in Pearl River Estuary. Mar. Environ. Sci. 2023, 42, 122–130. [Google Scholar] [CrossRef]
  64. Madron, X.D.; Denis, L.; Diaz, F.; Garcia, N.; Guieu, C.; Grenz, C.; Loÿe-Pilot, M.D.; Ludwig, W.; Moutin, T.; Raimbault, P.; et al. Nutrients and carbon budgets for the Gulf of Lion during the Moogli cruises. Oceanol. Acta. 2003, 26, 421–433. [Google Scholar] [CrossRef]
  65. Rabouille, C.; Conley, D.J.; Dai, M.H.; Cai, W.J.; Chen, C.T.A.; Lansard, B.; Green, R.; Yin, K.; Harrison, P.J.; Dagg, M.; et al. Comparison of hypoxia among four river-dominated ocean margins: The Changjiang (Yangtze), Mississippi, Pearl, and Rhone rivers. Cont. Shelf Res. 2008, 28, 1527–1537. [Google Scholar] [CrossRef]
  66. Turner, R.E.; Rabalais, N.N.; Alexander, R.B.; Mcisaac, G.; Howarth, R.W. Characterization of nutrient, organic carbon, and sediment loads and concentrations from the Mississippi River into the northern Gulf of Mexico. Estuaries Coasts 2007, 30, 773–790. [Google Scholar] [CrossRef]
  67. He, B.M.; Wei, M.X.; Fan, H.Q.; Pan, L.H.; Cao, Q.X. Spatio-temporal change of inorganic nitrogen content and the evaluation ofeutrophication in the surface seawaters of mangrove areas in Guangxi bays. J. Appl. Oceanogr. 2014, 33, 140–148. [Google Scholar]
  68. Mo, Y.; Lan, C.B.; Xu, M.B.; Lai, J.X.; Ling, H.J. Effects of nitrogen and phosphorus addition on Phaeocystis globosa colon growth in Qinzhou Bay. Mar. Sci. 2022, 46, 30–41. [Google Scholar]
  69. Ke, S.; Cai, Z.M.; Zhang, P.; Zhang, J.B.; Zhang, J.X. Effects of river input flux on spatiotemporal patterns of total nitrogen and phosphorus in the Pearl River Estuary, China. Front. Mar. Sci. 2023, 10, 1129712. [Google Scholar] [CrossRef]
  70. Wang, X.P.; Jia, X.P.; Lin, Q.; Li, C.H.; Gan, J.L.; Cai, W.G.; Wang, Z.H.; Lu, X.Y. Research on the Distributional Features of and Interrelationships Between the Dissolved Oxygen, Salinity, pH Value and nutrients in the Honghai Bay Waters. Mar. Sci. Bull. 2000, 1, 38–44. [Google Scholar]
  71. Zhang, Z.B. Marine Chemistry; China Ocean University Press: Qingdao, China, 2004; p. 175. [Google Scholar]
  72. Ren, C.X.; Peng, D.M.; Shi, X.; Yang, S.Y.; Yang, S.; Zhang, P.; Zhang, J.B. Seasonal Total Nitrogen and Phosphorus Variation, Speciation, and Composition in the Maowei Sea Affected by Riverine Flux Input, South China Sea. Water 2022, 14, 2584. [Google Scholar] [CrossRef]
  73. Geeraert, N.; Archana, A.; Xu, M.N.; Kao, S.J.; Baker, D.M.; Thibodeau, B. Investigating the link between Pearl River-induced eutrophication and hypoxia in Hong Kong shallow coastal waters. Sci. Total Environ. 2021, 772, 145007. [Google Scholar] [CrossRef]
  74. Hasan, J.; Chandra, S.D.; Rani, K.S.; Ahmed, M.; Haque, S.M.; Haque, F.; Ahsan, M.E.; Ahmed, S.; Hossain, M.I.; Salam, M.A. Outwelling of nutrients into the Pasur River estuary from the Sundarbans mangrove creeks. Heliyon 2022, 8, e12270. [Google Scholar] [CrossRef]
  75. Smith, V.H.; Tilman, G.D.; Nekola, J.C. Eutrophication: Impacts of excess nutrient inputs on freshwater, marine, and terrestrial ecosystems. Environ. Pollut. 1999, 100, 179–196. [Google Scholar] [CrossRef]
  76. Herbeck, L.S.; Unger, D.; Wu, Y.; Jennerjahn, T.C. Effluent, nutrient and organic matter export from shrimp and fish ponds causing eutrophication in coastal and back-reef waters of NE Hainan, tropical China. Cont. Shelf Res. 2013, 57, 92–104. [Google Scholar] [CrossRef]
  77. Hu, Q.; Qu, L.; Huang, B.G.; Li, Q.; You, Q.M. Status and evaluation on nutrients for the adjacent sea water of the Yellow River estuary in autumn of 2014. Mar. Environ. Sci. 2016, 35, 732–738. [Google Scholar] [CrossRef]
  78. Wei, Y.Q.; Ding, D.S.; Gu, T.; Xu, Y.; Sun, X.M.; Qu, K.M.; Sun, J.; Cui, Z.G. Ocean acidification and warming significantly affect coastal eutrophication and organic pollution: A case study in the Bohai Sea. Mar. Pollut. Bull. 2023, 186, 114380. [Google Scholar] [CrossRef] [PubMed]
  79. Zhang, J.B.; Fu, M.J.; Zhang, P.; Sun, D.; Peng, D.M. Unravelling Nutrients and Carbon Interactions in an Urban Coastal Water during Algal Bloom Period in Zhanjiang Bay, China. Water 2023, 15, 900. [Google Scholar] [CrossRef]
  80. Zhang, P.; Luo, W.; Fu, M.; Zhang, J.B.; Cheng, M.Y.; Xie, J. Effects of tidal variations on total nitrogen concentration, speciation, and exchange flux in the Shuidong Bay coastal water, South China Sea. Front. Mar. Sci. 2022, 9, 961560. [Google Scholar] [CrossRef]
  81. Njock, P.G.A.; Zhou, A.N.; Yin, Z.Y.; Shen, S.L. Integrated risk assessment approach for eutrophication in coastal waters: Case of Baltic Sea. J. Clean. Prod. 2023, 387, 135673. [Google Scholar] [CrossRef]
  82. Dokulil, M.; Chen, W.; Cai, Q. Anthropogenic impacts to large lakes in China: The Tai Hu example. Aquat. Ecosyst. Health Manag. 2000, 3, 81–94. [Google Scholar] [CrossRef]
  83. Xu, H.; Paerl, H.W.; Qin, B.; Zhu, G.; Gaoa, G. Nitrogen and phosphorus inputs control phytoplankton growth in eutrophic Lake Taihu, China. Limnol. Oceanogr. 2009, 55, 420–432. [Google Scholar] [CrossRef]
  84. Mozafari, Z.; Noori, R.; Siadatmousavi, S.M.; Afzalimehr, H.; Azizpour, J. Satellite-Based Monitoring of Eutrophication in the Earth’s Largest Transboundary Lake. GeoHealth 2023, 7, e2022GH000770. [Google Scholar] [CrossRef]
  85. Wetzel, R.G. Land-water interfaces: Metabolic and limnological regulators. SIL Proc. 1990, 24, 6–24. [Google Scholar] [CrossRef]
  86. Anderson, D.M.; Glibert, P.M.; Burkholder, J.M. Harmful algal blooms and eutrophication: Nutrient sources, composition, and consequences. Estuaries 2002, 25, 704–726. [Google Scholar] [CrossRef]
  87. Soares, M.C.S.; Marinho, M.; Huszar, V.L.M.; Branco, C.W.C.; Azevedo, S.M.F.O. The effects of water retention time and watershed features on the limnology of two tropical reservoirs in Brazil. Lakes Reserv. Res. Manag. 2008, 13, 257–269. [Google Scholar] [CrossRef]
  88. Troell, M.; Halling, C.; Neori, A.; Chopin, T.; Buschmann, A.H.; Kautsky, N.; Yarish, C. Integrated mariculture: Asking the right questions. Aquaculture 2003, 226, 69–90. [Google Scholar] [CrossRef]
  89. Noori, R.; Berndtsson, R.; Adamowski, J.F.; Abyaneh, M.R. Temporal and depth variation of water quality due to thermal stratification in Karkheh Reservoir, Iran. J. Hydrol. Reg. Stud. 2018, 19, 279–286. [Google Scholar] [CrossRef]
  90. Roohollah, N.; Elmira, A.; YongWook, J.; Saber, A.; Mohsen, M.; Majid, H.; Sayed, M.B. Hyper-Nutrient Enrichment Status in the Sabalan Lake, Iran. Water 2021, 13, 2874. [Google Scholar] [CrossRef]
Figure 1. Study area and monitoring stations in Tieshan Bay.
Jmse 11 01602 g001
Figure 2. Spatiotemporal variation of DIN concentration during the normal season (a), wet season (b), dry season (c), and annual season (d) in Tieshan Bay.
Jmse 11 01602 g002
Figure 3. Spatiotemporal variation of DIP concentration during the normal season (a), wet season (b), dry season (c), and annual season (d) in Tieshan Bay.
Jmse 11 01602 g003
Figure 4. Spatiotemporal variation of COD concentration during the normal season (a), wet season (b), dry season (c), and annual season (d) in Tieshan Bay.
Jmse 11 01602 g004
Figure 5. Spatiotemporal variation of DIN/DIP during the normal season (a), wet season (b), and dry season (c) in Tieshan Bay.
Jmse 11 01602 g005
Figure 6. Spatiotemporal variation of EI concentration during the normal season (a), wet season (b), dry season (c), and annual season (d) in Tieshan Bay.
Jmse 11 01602 g006
Figure 7. Contribution of DIN, DIP, and COD to EI for three seasons in the surface waters of the Northwest Guangxi Sea.
Jmse 11 01602 g007
Figure 8. Spatiotemporal variation of CI concentration during the normal season (a), wet season (b), dry season (c) and annual season (d) in Tieshan Bay.
Jmse 11 01602 g008
Figure 9. The linear regression relationships between seasonal nutrients, COD, and salinity in Tieshan Bay.
Jmse 11 01602 g009
Figure 10. The linear regression relationships between CI, Salinity, and pH.
Jmse 11 01602 g010
Figure 11. Significant differences between different nutrients and environmental factors.
Jmse 11 01602 g011
Table 1. Pollution evaluation of DIN and DIP.
ProjectsAverage Single Factor Pollution IndexSingle Factor Pollution Index RangeStation Exceedance Rate (%)
DIN normal water flow Season0.174 ± 0.1430.002~0.3840.0
DIN wet water flow season0.120 ± 0.2090.013~0.6540.0
DIN dry water flow season0.203 ± 0.2940.010~0.8820.0
DIP normal water flow Season0.153 ± 0.1380.033~0.4670.0
DIP wet water flow season0.135 ± 0.2180.033~0.7110.0
DIP dry water flow season0.409 ± 0.3810.067~1.28912.5
Table 2. Comparison of DIN, DIP, COD, EI, and DIN/DIP in Tieshan Bay with those of other Chinese and world estuaries.
AreaDIN
(mg/L)
DIP
(mg/L)
COD
(mg/L)
EIDIN/DIPReferences
Oinzhou Bay0.210.0181.441.7335–154[58,66,67]
Fangchenggang Bay0.1260.019NdNdNd[59]
Bohai Bay0.1250.0021.81NdNd[60,61]
Daya bay0.1280.005NdNdNd[4]
Pearl River Estuary0.688Nd1.028.64 42.6[18,62]
Zhenzhu BayNdNdNd1.52Nd[66]
Lianzhou BayNdNdNd28.48Nd[66]
Yellow River EstuaryNdNdNd0.56 51.1[68]
Rhone River Estuary, France1.8760.017NdNd110.7[63,64]
Mississippi River1.1250.029NdNd38.31[65]
Tieshan Bay0.071 ± 0.1150.008 ± 0.0130.71 ± 0.2190.519 ± 1.53630.2 ± 13.2 This study
Nd: no data.
Disclaimer/Publisher’s Note: The statements, opinions and data contained in all publications are solely those of the individual author(s) and contributor(s) and not of MDPI and/or the editor(s). MDPI and/or the editor(s) disclaim responsibility for any injury to people or property resulting from any ideas, methods, instructions or products referred to in the content.