Abstract
Nowadays, the exponential expansion in human population has resulted in the massification of intensive agricultural practices, with crop yield and sustainability being one of the most pressing challenges. Therefore, there was a need for new and natural fertilizers and pesticides, which has become a popular agricultural trend nowadays. Therefore, there was an increased interest to apply seaweed and bacterial extracts in agriculture to promote new means of sustainability and soil usage. This work aims to test seaweed inclusion in the agricultural field, as a simple or complex foliar biofertilizer solution applied together with a nitrifying bacteria, to verify if there is a potential synergistic effect of these two different types of biofertilizers on economically important vegetables. As a result, experiments were conducted in a greenhouse using an aqueous extract of the brown seaweed Saccharina latissima (1.2% v/v) and a biofertilizer based on BlueN bacteria (0.03% m/v), both simple or in combination, on lettuce (Lactuca sativa L. var. crispa) plants. The seaweed extract (simple or in combination), presented favorable effect on lettuce growth and nutritional properties. The aqueous algal extract, and it in combination with BlueN, produced heavier lettuce leaves (74.25 ± 6.86 and 74.13 ± 3.07 g, respectively) than the controls and enriched leaf micronutrient contents (zinc and manganese). Also, this study demonstrated that a combined seaweed-bacteria fertilizer did not show synergistic behavior, being a non-profitable solution when compared to a simple seaweed extract. In summary, this study demonstrated that simple (crude) seaweed extracts can be considered as an important key for natural plant biofertilizers and growth stimulators concerned with the blue circular economy.
1. Introduction
Crop plants are important sources of macro- and micronutrients for a healthy human diet [1]. However, our world will confront two main challenges in the future: climate change and a global population growth. It was estimated that by 2050, the world would require 60% more food than it does today, with around 80% of this increase coming from land already under cultivation [1]. The significant rise in food demand must be met while reducing agriculture’s global environmental footprint, and this must be done at a time when agriculture is already under pressure due to climate change [2]. To fulfil contemporary food demand, agriculture employs agrochemicals (synthetic fertilizers and pesticides), intensive tillage, and over-irrigation [3,4].
The uncontrolled and excessive use of synthetic chemical inputs to enhance agricultural productivity has been degrading the soil and threatening the environment, with it being estimated that 40% of global arable land undergoes decreasing productiveness [5]. Recently, some eco-friendly alternatives to chemical fertilizers have been applied and seaweed can help in this endeavor [6]. These seaweed extracts contain cytokinins, auxins, betaines, gibberellins, carbohydrates, vitamins, polysaccharides, alginates, amino acids, and trace elements (Fe, Cu, Zn, Co, Mo, Mn, and Ni) that are involved in plant growth and regulation. The mechanisms of action of these seaweed compounds are complex, and it is unknown why they are effective; nonetheless, it was likely that when these molecules are combined, they work synergistically, promoting plant growth and well-nurtured plants [7,8,9]. Seaweeds are marine resources that produce a wide range of primary and secondary metabolites that have a significant positive impact on agricultural crops [10]. Quite a few studies have shown that different seaweed extracts can improve seed germination, plant growth, and development [11,12,13,14,15,16,17]. Furthermore, it has been demonstrated that seaweed extracts can support plants in coping with biotic and abiotic stresses (such as herbivory, deleterious microorganisms such as fungi and bacteria, and drought and salinity), while also improving crop nutritional profile, mainly in mineral and vitamin concentrations [16,18,19,20,21].
Saccharina latissima, known as sugar kelp, was a North Atlantic and North Sea natural seaweed. Numerous successful cases have demonstrated S. latissima’s farming and economic potential for the food and cosmetic industry. Thus, there is a rising number of S. latissima cultivation systems established in Europe [22,23,24,25,26]. S. latissima can be found in some areas which can have problems with excessive nutrients (eutrophication), hydrocarbons and heavy metals, such as fishing ports, because seaweeds are natural bio-accumulators of various compounds which can be dangerous for direct consumption by humans. Thus, this seaweed, when found in or nearby polluted water, cannot be the best supply for the food industry. However, algal biomass that does not meet food-grade standards can be used in agriculture rather than as organic waste (as it is today in some eutrophicated places) [27,28,29,30,31]. Regarding the regulations related with seaweed extract application in agriculture, Spanish regulation was considered an exemplar in Europe. Agricultural product chemical control and security, however, are crucial for assuring safe application. They usually refer to arsenic levels and heavy-metal-compound thresholds [31].
Free-living bacteria can also be employed as an external nitrogen source for the crop, promoting plant growth [32,33]. For example, Methylobacterium was a bacteria genus known for its eco-friendly ability to improve plant growth through atmospheric nitrogen fixation, phosphate solubilization, and the stimulation of plant growth promoters [33,34]. This bacterium contains an enzyme nitrogenase, which converts atmospheric nitrogen (N2) into ammonia (NH3). This bacterium colonizes the plant during its early growth stages, providing it with ammonia without any risk of volatilization or leaching [35,36]. Lettuce (Lactuca sativa L.) is a leafy herbaceous vegetable and one of the most popular salad crops, in both fresh and ready-to-eat markets in the world, with 27 million tons of lettuce and chicory produced globally in 2020 [37].
The purpose of this research was to better understand the biostimulant and fertilizer impact of the aqueous extracts of the brown seaweed Saccharina latissima, alone, and combined with a bacteria-based biofertilizer (Methylobacterium symbioticum), as a foliar spray on lettuce (Lactuca sativa L.) plant growth and its nutritional profile. During this work, it was important to monitory if a bacteria/seaweed-combined extract can show a synergistic potential to enhance lettuce growth and its biochemical affluence. On another hand, the study also aimed to understand if a more economic and simplistic approach applying one of the extracts (seaweed or bacteria), alone to the plant or a combination of both, can be effective as a good biofertilizer.
2. Materials and Methods
2.1. Seaweed Harvesting and Processing
On 24 July 2020, the brown seaweed Saccharina latissima (Figure 1) was gathered near the entrance of Viana do Castelo harbor, Portugal (Lima River mouth, eutrophicated region) (41°41′17.7″ N 8°50′11.4″ W). Following that, seaweeds were carried to the laboratory in plastic bags in an electric cool box (to keep the biomass collected at least 5 °C) and frozen at −20 °C for later use.
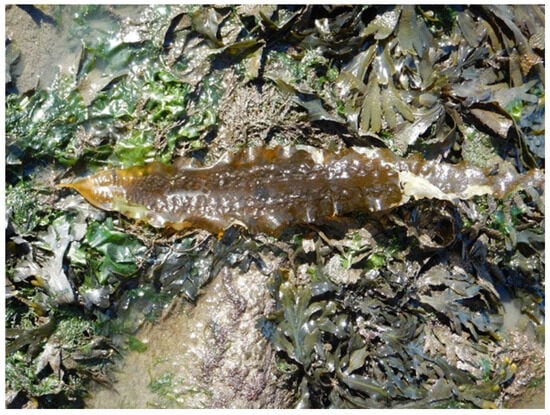
Figure 1.
Photographic record of Saccharina latissima (Phaeophyceae) (central part of the photo) on Viana do Castelo harbor (Lima River mouth) (41°41′17.7″ N 8°50′11.4″ W).
The isolated seaweed specimens were classified according to their morphological characteristics. This classification was carried out through observation of the specimens with the naked eye and later observation with a magnifying glass and microscope, following the keys of the identification guides by Pereira [38] with the support of Pereira [39] for identification until the species name.
Following that, the seaweeds were washed with filtered saltwater obtained from the sample location in order to remove sand, epiphytes, and other debris from the seaweed biomass. The biomass was then quickly rinsed with distilled water to remove the salt content from the seaweed surface. After washing, seaweeds were put on plastic trays and dried for 48 h at 60 °C in an air-forced oven (Raypa DAF-135, R. Espinar S.L., Barcelona, Spain). Following this, the dry biological samples were milled (0.5–1 mm diameter, controlled by sieve to guarantee that all powder is homogeneous) with a commercial grinder (Taurus aromatic, Oliana, Spain) and kept in sterile flasks at room temperature in a dark and dry environment.
2.2. Extract Preparation
The aqueous extracts of S. latissima were prepared using the method described by Sousa et al. [17]. S. latissima aqueous extracts were produced in a Moulinex LM811D11 blender (SEB, Selongey, France) with dried powder algal biomass and distilled water to a concentration of 0.12 g/mL. The liquification time was 5 min at 2500 rpm at room temperature. Following the liquification of the algae, the crude extracts were filtered under vacuum through a cotton crude cloth with a pore size of 0.5 mm using a Buchner filter (Linex, Marinha Grande, Portugal). After the extracts were filtered in a Goosh G2 funnel under vacuum, the crude extract solution was diluted with distilled water in various ratios to achieve the appropriate concentration for the experiment. This concentration solution was developed using prior extract analysis and preliminary research to determine the optimal concentration.
Apart from S. latissima extracts, for this study, commercially available products, “Profertil” (Adubos de Portugal, Alverca, Portugal) and “BlueN” (Hubel Verde, Faro, Portugal), were used.
2.3. Experimental Conditions
A commercial curled lettuce (Lactuca sativa var. crispa L.) variety (Pombal Verde, Leiria, Portugal) was used in this assay. Plants were produced in plastic pots (diameter of 18 and height of 13 cm, with a volume of 3.3 L of soil) in conditioned substrate (SIRO, Coimbra, Portugal) under greenhouse conditions and watered every day with equal doses of ±1.5 L. The temperature (maximum and minimum) and relative air humidity were monitored daily with a thermohydrometer (Meter8 TA298, Shenzhen, China).
As a positive control, a commercially available leaf fertilizer (Profertil) was used at a concentration of 1.5% (v/v), (CP) while tap-water-treated plants were used as a negative control (CN). The treatments with the S. latissima extract were applied 21 days after potting with a sprayer (Isolab BTPTI20500001, Eschau, Germany), and the treatments with BlueN were applied one day after (day 22).
In Table 1, the treatments applied in the experiment are presented. Each treatment was applied in twelve plastic pots organized in a randomized block design; thus, each treatment was represented by a 0.3 m2 field area. The experiment lasted 80 days, from May to July 2021.

Table 1.
Description of the treatments employed in the experimental design. Each treatment was applied in twelve plastic pots, in a randomized block design.
Due to the soil and climatic conditions, all plants per treatment were sprayed with their respective treatment 38 and 45 days after the lettuce potting, and the substrate was fertilized twice, with 1 g per pot of Agriazul (NPK/12-8-16/, Deiba, Setúbal, Portugal), 55 and 62 days after the lettuce potting.
2.4. Abiotic Parameters during the Experiment
Abiotic parameter variation was collected (maximum and minimum temperature, and relative air humidity) (Figure 2), revealing a monthly rising trend in maximum and minimum temperatures since the experiment was conducted in late spring. Even though the relative air humidity varies daily, a similar monthly mean average value was recorded.
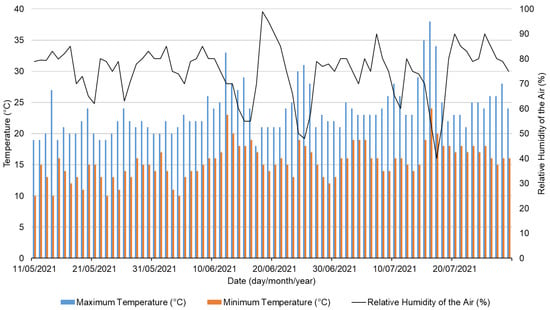
Figure 2.
Register of minimum and maximum temperatures (°C), and relative air humidity (%) recorded in the greenhouse during the bioassay.
Temperatures between 18 to 23° C are ideal for lettuce production, but air temperatures above 23 °C can inhibit plant growth [40]. Furthermore, high humidity promotes diseases such as powdery mildew and Botrytis, negatively affecting lettuce cultivation; hence, greenhouses should be ventilated to reduce humidity [40].
2.5. Algal Biomass and Extract Characterization
In this section, all the analyses were performed in duplicate.
2.5.1. pH, Electrical Conductivity, and TDS Extract Analysis
A pH and electrical conductivity meter was used to test the pH and electrical conductivity of the aqueous extracts (Hanna Instruments, Vöhringen, Germany).
2.5.2. Moisture and Ash Content
The moisture and ash content were determined according to the international standard of Official Methods of Analysis of AOAC International, method 930.04 [41]. The moisture content of the algal samples was determined using the fresh weight of the samples and after 48 h of oven drying (Memmert, Büchenbach, Germany). According to the AOAC method 930.04 [34], dried samples at 105 °C were put in an incineration muffle for 2 h at 550 °C (Induzir, Leiria, Portugal) and then cooled in a desiccator and weighed to determine the ash concentration.
The moisture at 65 °C was calculated according to standard method 930.04 of AOAC [41]:
where P1—weight of the tray (g); P2—weight of the tray + sample (g); and P3—weight of the tray + dried sample (g).
The moisture at 65 to 105 °C was calculated according to standard method 930.04 of AOAC [41]:
where P4—crucible weight (g); P5—crucible weight + sample (g); and P6—crucible weight + dried sample (g).
The moisture content was calculated according to standard method 930.04 of AOAC [41]:
where P1—weight of the tray (g); P2—weight of the tray + sample (g); P3 weight of the tray + dried sample (g); P4—crucible weight (g); P5—crucible weight + sample (g); and P6—crucible weight + dried sample (g).
The ash content was calculated according to standard method 930.05 of AOAC [41]:
where % db—percentage of dried biomass; % fb—percentage of fresh biomass; P4—crucible weight (g); P5—crucible weight + sample (g); P6—crucible weight + ashes (g); and H—moisture (%).
2.5.3. Crude Lipids
Following a continuous extraction procedure with diethyl ether in a Soxhlet apparatus (Behr Labor-Technik GmbH, Düsseldorf, Germany), the total lipids content was gravimetrically measured using the worldwide standard AOAC technique 930.09 [12].
Crude lipids were determined according to the formula presented by the standard method of AOAC 930.09 [41]:
where, % db—percentage of dried biomass; P1—distillation flask weight (g); P2—sample weight (g); P3—distillation flask weight + lipids (g).
2.5.4. Total Protein
The total nitrogen/protein content was determined using the Kjeldhal method (AOAC method 978.04) [41], with a multiplication factor of 5 as a protein conversion factor on the formula for total protein determination [42]. In a Kjeldhal tube, 0.5 g of previously dried algal sample was added, followed by a selenium catalyst (PanReac AppliChem, Darmstadt, Germany) and 12 mL of sulfuric acid (Chem-Lab NV, Zedelgem, Belgium). After that, the tubes were put in the Kjeldhal digester (VELP Scientifica, Usmate Velate, MB, Italy) for 2 h at 400 °C. After cooling in the fume closet, each tube was filled with 50 mL of distilled water and placed in the Kjeldhal distiller. Concurrently, 30 mL of boric acid (Chem-Lab NV, Zedelgem, Belgium) was poured in an Erlenmeyer (one for sample), which was then placed in the Kjeldhal distiller (VELP Scientifica, Usmate Velate, MB, Italy). Amounts of 50 mL of distilled water and 50 mL of 40% (m/v) sodium hydroxide (NaOH) (JMGS—José Manuel Gomes dos Santos, Odivelas Portugal) were added to the Kjeldhal tube. The distilled solution was collected and titrated with 0.1 M HCl (Chem-Lab NV, Zedelgem, Belgium).
Total protein was determined according to the following formula [41]:
where % db—percentage of dried biomass; P1—sample weight (g); [HCl]—hydrochloric acid concentration (M); V—volume of titrant spent in sample titration (mL); and V0—volume of titrant spent in control sample titration (mL).
2.5.5. Crude Fiber and Total Carbohydrates/Nitrogen-Free Extractives
According to the standard method 930.10 of AOAC [41], the crude fiber was determined by weighing 2 g (Sartorix, Göttingen, Germany) of algal samples that had previously been oven dried (Memmert, Büchenbach, Germany) at 105 °C for 2 h and put in a 600 mL goblet. After that, 200 mL of 12.5 g/L sulfuric acid (H2SO4) (Chem-Lab NV, Zedelgem, Belgium) was added, and the samples were placed in a fiber analyzer (Labconco Corporation, Kansas City, MO, USA) for 30 min. Following this, the samples were filtered using a filter crucible G2 (Robu, Hattert, Germany) under vacuum (General Electric, Boston, MA, USA). The residue was then poured in a goblet with 250 mL of 12.5 g/L sodium hydroxide (NaOH) (JMGS—José Manuel Gomes dos Santos, Odivelas Portugal) and placed in the fiber analyzer for another 30 min. The samples were vacuum filtered and dried at 130 °C for 2 h using the same filter crucible G2. After cooling in a desiccator, the samples were weighed on an analytical scale (Sartorix, Göttingen, Germany) and put in an incinerator muffle at 550 °C (Induzir, Leiria, Portugal) for 2 h. Finally, the samples were allowed to cool before being weighed to determine the crude fiber. Nitrogen-free extractives are the difference between 100 and the sum of the remaining constituents (moisture, lipids, protein, crude fiber, and ash), whereas total carbohydrates are the difference between 100 and the sum of moisture, ash, lipids, and protein.
Total fiber was determined according to the following formula [43]:
where % db—percentage of dried biomass; P1—sample weight (g); P2—crucible weight + sample dried at 130 °C (g); and P3—crucible weight + sample dried at 550 °C (g).
2.5.6. Energy
The total energy was calculated by adding together the energy provided by the protein, total fat, carbohydrate, and dietary fiber. Hereby, energy was calculated according to the following equation [43]:
Energy (KCal) = 4 × (protein (g) + carbohydrate (g)) + 9 × (crude lipids (g)).
2.5.7. Mineral and Trace Element Characterization
The mineral content of the ashes was determined using dry mineralization and flame atomic absorption spectrometry (PerkinElmer PinAAcle 900 T, Waltham, MA, USA) [44]. An acid digestion with nitric acid 65% (m/v) (Chem-Lab NV, Zedelgem, Belgium) in a water bath at 100 °C for roughly 30 min was conducted for this study. Finally, the samples were transferred to a volumetric flask and the volume was adjusted using distilled water. The analysis was carried out on the atomic absorption spectrophotometer fitted with the cathode corresponding to each element after the requisite dilutions (1:10, 1:100, and 1:500), except for the phosphorus analysis, which was conducted using spectrophotometry (PG Instruments T80+ UV/VIS spectrophotometer, Leicestershire, UK) [45].
2.5.8. Total Phenolic Compounds Quantification
The Folin–Ciocalteu technique was employed to quantify total phenolic compounds, and gallic acid was utilized as a reference (GAE—gallic acid equivalent units). Amounts of 450 μL of crude extract, 50 μL of Folin–Ciocalteu reagent (Panreac, Barcelona, Spain), 1000 μL of aqueous sodium carbonate solution (75 g/L m:v) (Chem-Lab NV, Zedelgem, Belgium), and 1000 L of distilled water were added to tubes for analysis. The samples were immediately vortexed for 30 s and incubated at room temperature for 30 min in the dark. The supernatant’s absorbance was measured at 750 nm using a Hitachi 2000 (Hitachi 2000, Tokyo, Japan). The crude extracts’ total phenolic content (TPC) was evaluated in triplicate. A standard curve (y = 0.0168x + 0.0159; r2 = 0.9998) with varied concentrations of gallic acid (0, 4, 6, 8, 10, 20, 40, 60 mg GAE/L) was conducted to measure the total phenolic content.
2.5.9. Alginate Extraction
The seaweed alginate quantification was performed using the technique described by Pacheco et al. [6].
The milled seaweed was added to a 1.23% (1:30 v/v) HCl solution (Fisher Chemicals, Porto Salvo, Portugal) (3 mL of HCl: 87 mL of distilled water for 3 g of dry seaweed) and stored at room temperature (23 °C) for 48 h. After 48 h, the solution was filtered out using a Goosh 2 silica funnel under vacuum. The residue was rinsed twice or three times with distilled water. The residue was then alkali extracted for 48 h in a 2% sodium carbonate (Fisher Chemicals, Portugal) solution (90 mL for the initial weight of the dried biomass; 1:30 m:v) and the extract was filtered through a cloth filter supported in a Goosh 2 silica funnel under vacuum to remove the residues from the alginate solution. The filtrate was then treated with 37% HCl (Fisher Chemicals, Portugal) to precipitate sodium alginate (1 mL of 37% HCl: 30 mL of final solution). Centrifugation (Christ Universal Junior II, Christ, Osterode/Harz, Germany) (4000 rpm, for 15 min) separated the precipitate, and the alginate was dried in an air-force oven (60 °C, 48 h) (Raypa DAF-135, R. Espinar S.L., Barcelona, Spain).
2.6. Biometric and Biochemical Lettuce’s Characterization
2.6.1. Growth Parameters, Moisture and Ashes Content
Lettuces (twelve plants per treatment) were harvested, roots and leaves were separated, and root length and aerial portion average diameter were measured using a ruler. The leaf and root fresh weights (FW) were measured independently in each plant sample, and the dry weights (DW) were acquired after plants were dried in an oven (60 °C for 3 days) until a constant weight was attained. After cooling each sample, the dry leaf and root weights were measured separately. Following that, the leaves were milled (<1 mm) and roughly 2 g of each sample was put in crucibles and dried for 2 h at 105 °C. The samples were then placed in a desiccator until a constant weight was obtained, after which they were weighed again to calculate the plant moisture content. This methodology was employed according to the AOAC method (930.05) [41] (Section 2.5.2).
2.6.2. Total Nitrogen/Protein
The total nitrogen/protein content of each treatment was measured as described in Section 2.5.4.
2.6.3. Mineral and Trace element Characterization
The lettuce’s mineral and trace element characterization of each treatment was performed as described in Section 2.5.7.
2.7. Substrate Characterization
The initial and final substrate used for lettuce potting was dried in an air-forced oven at 38 °C for 3 days, until it reached a constant weight. Then, the sample was milled in a soil deagglomerator (FRITSCH GmbH Pulverisette 8, Midland, ON, Canada), through a sieve of 2 mm, separating the thin (<2 mm diameter) and rough (>2 mm) material [46,47].
Then, the soil sample (<2 mm) was extracted with demineralized water at 22 °C in a proportion of 1:5 (m/v) for 2 h in an agitator at 200 rpm (P Select Rotabit, Lisbon, Portugal). Following this procedure, with the help of a magnetic stirrer (P Select, Agimatic-N, Lisbon, Portugal), the pH was measured in a potentiometer (pH meter 3310 Jenway, Staffordshire, SC, USA) and the electric conductivity in a conductometer (WTW 3110, Porto, Portugal) [48].
For the extraction of phosphorus, sodium, potassium, calcium and magnesium of the soil sample, the previously aqueous extract was filtrated with paper filter (Whatman nº4, Portugal) to volumetric flasks. Then, the phosphorus (P2O5) was quantified through the colorimetric method of ammonium molybdate in acidic medium and ascorbic acid (final volume: 1000 mL; 800 mL of distilled water: 25 mL of ammonium molybdate in acidic medium: 10 mL of ascorbic acid) in a molecular absorption spectrophotometer (PG instruments T80+ UV/VIS spectrophotometer, Leicestershire, UK) at a wavelength of 650 nm. Meanwhile, for the sodium, potassium, calcium, and magnesium measurements, 2.5 mL lanthanum chloride (5%) was added to the previously filtrated samples (2.5 mL) and the elements were quantified through atomic absorption spectrophotometry. The total nitrogen content was calculated using the Kjeldahl technique (as described in Section 2.5.4). In a Kjeldhal tube, 0.5 g of previously dried soil sample (2 mm diameter) was added, followed by a selenium catalyst (PanReac AppliChem, Darmstadt, Germany) and 10 mL of sulfuric acid (ChemLab NV, Zedelgem, Belgium) [47,49]. For the organic carbon (CO) quantification, 0.5 g of the soil sample (<2 mm) was weighed onto a ceramic plate. Then, the sample goes through an oxidative-reduction process in the Carbon/Sulfur analyzer (Leco SC 144 DR, Madrid, Spain) in order to be quantified, measuring the resulting CO2 and SO2 in infra-red cells, which provide organic carbon and sulfur content [50,51].
2.8. Statistical Analysis
The statistical analysis was carried out using the Sigma Plot v.14 software. The data were tested for normality (Shapiro–Wilk test) and homogeneity (Brown–Forsythe equal variance test). The lettuce’s treatment with seaweed/bacteria was then subjected to a one-way analysis of variance (ANOVA) in randomized blocks to see whether there were statistically significant variations in growth and elemental characterization. The statistical analysis was carried out to compare the different treatments, which were considered significantly different when the p-value was less than 0.05. Following the rejection of the one-way ANOVA null hypothesis (Holm–Sidak technique), the Tukey multiple comparison t-test was utilized.
3. Results
3.1. Algal Biomass and Extract Characterization
The brown seaweed S. latissima (dry algal biomass) used for the aqueous extracts’ preparation (Table 2) showed itself to be a rich source of carbohydrates, representing 60.64 g 100 g−1 of its dried biomass. Moreover, a significant part of its biomass (17.81 g 100 g−1) was composed by nitrogen and other minerals, with the most representative being the nitrogen (2.31 g 100 g−1) and sodium (1.26 g 100 g−1). From another perspective, manganese (0.01 g 100 g−1) and copper (0.01 g 100 g−1) were the less-abundant minerals (Table 2, the literature values are from the respective references).
Table 2.
Chemical characterization of the dry seaweed S. latissima biomass and the respective data obtained from the literature. The results are shown as mean values ± SD (n = 2; dry weight (DW) basis). NA—not available.
3.2. Extracts’ Physical-Chemical Characterization
The extracts’ physical–chemical characterization (Table 3) was performed on the lettuce plants, since characteristics such as pH and electric conductivity can condition plant development and growth [58,59,60,61]. Overall, the extracts had similar pH values ranging from 6.70 to 6.93. Despite this, the algal extract (331 μS/cm) had a higher electric conductivity value than BlueN and the positive control (103 and 117 μS/cm, respectively). The algal extract had a greater concentration of total dissolved solids (165 mg/L), but BlueN and the positive control had comparable results (54 and 59 mg/L, accordingly). The pH, electrical conductivity, and total dissolved solids (TDS) of both tap and distilled water, both having a neutral pH, were also measured for quality control (7.45 and 7.00, respectively). Nevertheless, as it was expected, tap water (106 μS/cm; 54 mg/L) presented a higher electrical conductivity and total dissolved solids than distilled water (1.90 μS/cm; 1 mg/L).
Table 3.
The extracts’ physical–chemical characterization used in the assay.
3.3. Substrate Characterization
The composition of the substrate has a direct impact on plant biomass output since it can satisfy the species’ needs [62]. At the end of the experiment, each treatment’s original substrate was physically and chemically characterized and analyzed (Table 4). When comparing the initial substrate with the final substrate of each treatment, the overall pH slightly decreased and an increase in electrical conductivity was observed.
Table 4.
Physical–chemical characterization of the initial and final substrate of each treatment. The results are shown as mean values ± SD (n = 2). SI—initial substrate; CP—positive control; CN—negative control; E—algal extract; B—BlueN; EB—algal extract + BlueN. Statistically significant differences (p < 0.05) are expressed by letter a.
3.4. Biometric Lettuce’s Characterization
Both the extracts physical–chemical properties and the abiotic parameter variation had an impact on lettuce development and nutritional characterization, resulting in distinct growth patterns among treatments. Hence, through the photographic record (Figure 3), and physiological (Figure 4 and Table 5) and biochemical (Table 6) parameter evaluation in lettuce, it was possible to observe differences among the treatments.
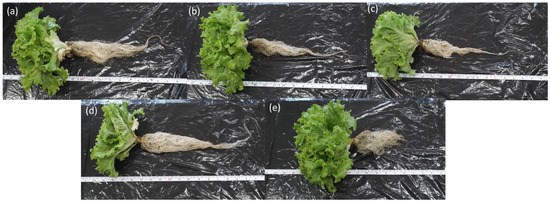
Figure 3.
Photographic record of the lettuce plants in each treatment at the end of the growth experiment: (a) CP—positive control; (b) CN—negative control; (c) E—algal extract; (d) B—BlueN; (e) EB—algal extract + BlueN.
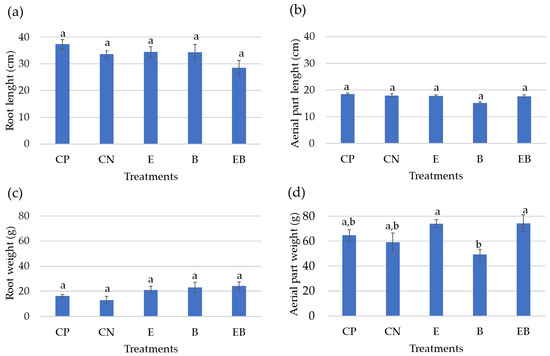
Figure 4.
(a) Root length and (b) aerial-part diameter; (c) root and (d) aerial-part fresh weight of the lettuces on each treatment. The graphs are shown as average values and SE (n = 12). CP—positive control; CN—negative control; E—algal extract; B—BlueN; EB—algal extract + BlueN. Statistically significant differences (p < 0.05) are expressed by different letters a,b.
Table 5.
Length and weight ratio between the root and the aerial part among the different treatments. CP—positive control; CN—negative control; E—algal extract; B—BlueN; EB—algal extract + BlueN.
Table 6.
Mineral and trace element characterization of the lettuce leaves within each treatment. The results are shown as mean values ± SD (n = 3, dry weight basis). CP—positive control; CN—negative control; E—algal extract; B—BlueN; EB—algal extract + BlueN. NA—not available. Statistically significant differences (p < 0.05) are expressed by different letters a,b.
The most-developed roots were achieved within the positive control (CP) (Figure 3a), while the less-developed roots were registered with the negative control (Figure 3b) and with algal extract + BlueN (Figure 3e). Regarding the leaves’ (or aerial part’s) development, an increased plant growth in the positive control was noted (Figure 3a), while the least developed were observed with the BlueN treatment (Figure 3d).
Regarding root length and root fresh weight (Figure 4a,c), no statistically significant differences were found between the treatments. Despite this, the positive control (CP) stands out with the higher root length (37.35 ± 1.73 cm), whereas the treatment with the algal extract (E) and the one with BlueN (B) attained similar root length values (34.49 ± 1.91 and 34.37 ± 2.84 cm, respectively), while the application of both (EB) resulted in the less-developed root (28.53 ± 2.83 cm). Herein, it was observed that a longer root has a lower fresh weight, but a shorter root has a higher fresh weight. For instance, lettuces treated with EB attained the highest root fresh biomass (24.35 ± 3.09 g), but quite like the value achieved with BlueN treatment (23.19 ± 3.96 g) and with the algal extract (21.12 ± 2.71 g), the lowest value was registered on the positive control (16.43 ± 0.89 g).
Also, no statistical differences were found among the different treatments regarding the aerial part diameter (Figure 4b). Still, the positive control was the treatment that resulted in a longer aerial part (18.42 ± 0.50 cm), whereas the negative control (CN), the algal extract treatment (E), and the algal Extract + BlueN treatment (EB) all had similar aerial-part diameter values (17.91 ± 0.72, 17.73 ± 0.42, and 17.68 ± 0.52 cm, respectively), and the BlueN (B) treatment had the lower aerial-part diameter (15.08 ± 0.39 cm).
However, the leaves’ weight statistically differed between treatments (Figure 4d), particularly the one with BlueN (B: 49.28 ± 4.07 g), which stands out negatively when compared with the algal extract (E) treatment and both applied together (EB). In fact, the latter achieved the highest fresh leaf biomass (74.25 ± 6.86 and 74.13 ± 3.07 g, respectively).
3.5. Biochemical Lettuce’s Characterization
More than the growth characteristics, it was key to identify whether the different treatments nutritionally improved the edible portion of the lettuces (Table 6). Even though the differences in mean values between treatment groups are not large enough to rule out the possibility that the differences are due to random sampling, and thus no statistically significant differences exist, some treatments revealed an enrichment on specific elements. For instance, the algal aqueous extract treatment (E) revealed an enrichment on manganese (80.28 mg/kg), magnesium (0.19%, the same value as the positive control), but the lowest content of sodium (0.20%). The treatment with BlueN (B) reflected the highest mineral (ash) content (85.30%), but the lowest moisture and zinc amount (5.08% and 47.70 mg/kg, respectively). However, the effect of the application of both treatments (EB) resulted in an enrichment of phosphorus (0.41%), sodium (0.28%), copper (6.49 mg/kg) and zinc (58.58 mg/kg)—but the lowest content of calcium (1.09%) and magnesium (0.17%). The positive control (CP) stands out critically due to the lowest nitrogen, potassium, and iron values (1.44, 4.61% and 1035.86 mg/kg, correspondingly). From a different perspective, the negative control (CN) had the least mineral content (83.80%), which was reflected in the lowest phosphorus (0.38%, the same as the BlueN (B) treatment), copper and manganese tissue accumulation (4.05% and 57.48 mg/kg, respectively). Nonetheless, this treatment resulted in the highest moisture (6.52%), nitrogen (1.77%), calcium (1.25%), potassium (5.09%), and iron (1451.66 mg/kg) content.
4. Discussion
The S. latissima was collected from an eutrophicated area, although, there was a need to observe and search for information about other problematics in the regions where the seaweeds were collected from. Nevertheless, Lima river estuary was obviously a focus of great vigilance, and the environmental protection agency has a huge number of findings of analyses performed on this river; it was certified that there are no heavy metals or excess hydrocarbons present in the location [65,66,67,68].
The nutritional, macro-, and microelement analyses of an algal biomass can vary depending of the harvesting season and geographic region [52,53,54]. Still, this biochemical characterization might differ considerably based on biotic and abiotic components, which can have direct or indirect impacts, such as seashore and the period of the year when the biomass is harvested. Thus, there is a need to perform biochemical characterization of the seaweed biomass for each assay batch. For example, S. latissima harvested in April 2015, that was produced in a seaweed aquaculture in Northern France (Brittany), when compared with our results, presented increased concentrations of sodium (3.0483 g 100 g−1), potassium (3.87 g 100 g−1), calcium (0.92 g 100 g−1), magnesium (0.61 g 100 g−1), iron (0.19 g 100 g−1), manganese (<0.01 g 100 g−1), and zinc (0.00386 g 100 g−1) [53]. In contrast, lower concentrations of copper (<0.01 g 100 g−1), total protein (0.01 g 100 g−1) and lipids (0.01 g 100 g−1) were registered [53]. Meanwhile, S. latissima wild harvested in the intertidal region of Fink Cove, (Nova Scotia, Canada) in April 2010, exhibited higher mineral content, representing 24.50 g 100 g−1 of this seaweed dry biomass, but a lower amount of total protein (8.10 g 100 g−1), fat (5.50 g 100 g−1), carbohydrate (59.80 g 100 g−1) and phenolic compounds (1.11 × 10⁻⁴ g GAE 100 g−1) [54].
This heterogeneity in algal chemical characterization was caused by the fact that algae metabolic activity changes according to the season and geographical [69]. Based on these findings and the literature reviewed, this brown seaweed appears to be a promising source of alginic acid (the majority of the carbohydrates present in this seaweed are alginic acid), which plays an important role in plant nutrition by lowering water surface tension, forming a polymeric (alginic acid, primarily) film on the plant’s surface, increasing contact area, and making it easier for water-soluble substances to enter the plant cell through the cell membrane [70,71]. The economic potential of this brown seaweed is highlighted by its alginic acid concentration, which may reach up to 20% of the algal dry weight and is now being investigated by a range of sectors, including agriculture [55,56]. In fact, alginic acid was recognized by the International Federation of Organic Agriculture Movements (IFOAM) as an approved additive [72]. However, we compared dry seaweed biomass values, the study of Sangu [73] and other preliminary small-scale studies demonstrated that the main difference between the seaweed biomass and the liquid extract was only the water content. Moreover, liquid extract analysis faces some technical–operational challenges and the dehydration of the extract can increase chemical oxidation, hindering further analysis.
The nutrition solution used as a foliar spray treatment in our study can have a significant impact on plant development and growth [74,75,76], and for this reason, extracts’ physical–chemical characterization was crucial to attain good results. Thus, the electrical conductivity of the tested extracts was revealed to be suitable for lettuce growth, because previous research has found that using nutrient solutions with an electric conductivity higher than 1300 μS/cm in lettuce cultivation may cause nutrient imbalance, resulting in decreased leaf number, area, and plant weight [77,78]. Furthermore, high electrical conductivity values (>1700 μS/cm) in the nutrient solution can lead to early bolting, and chlorotic and necrotic spots on lettuce’s lower leaves [40]. Another critical factor for plant development was pH; hence, for lettuce development, nutrient solutions with values around 6 are recommended [75,76,79,80,81]. On the other hand, researchers found that at pH 5, the shoot and root weight was excellent, but with higher pH (above 7) these values were lower [82]. Moreover, total dissolved solids should also be monitored because high levels (above 1000 mg/L) can impair plant growth [83].
However, bacteria can be absorbed by the seaweed polymer and not be as efficient as expected. Observing the results, the nitrogen in the seaweed was mainly in organic form (amino acids and protein), which was not the preferable nitrogen source for nitrifying bacteria. This can explain the negative stimulant effect results of algal extracts on lettuce growth. The seaweed extract can also have an anti-microbial effect [11,12,13,14,15,16,17], but in our case, the lettuce plants were grown in separated pots. There was no antimicrobial effect observed in the S. latissima extract used in our experiment [84].
The algal extract (E) alone and the combination of the algal extract and BlueN (EB) had a positive effect on lettuce leaf development and weight (Figure 4), while the BlueN (B) alone was found to be ineffective for lettuce development (Figure 4). The length and weight ratio between the root and the aerial parts showed that there was a dependent connection amongst these variables. Herein, it was possible to observe that the positive control (CP), the algal extract (E) and BlueN (B) treatments alone exhibited higher ratios (2.04, 1.95 and 2.07, respectively) than the remaining treatments, resulting in a more developed root, whereas the plant focused on the leaf growth development. In contrast, when compared with the other treatments, the one with BlueN (B) and the combination between BlueN and the algal extract (EB) led to a higher root vs. aerial part weight ratio (0.47 and 0.37, respectively), indicating that the plant spent more energy on root biomass looking for nutrients in the substrate, and thus not promoting foliar part development, which is the economic part of the lettuce. Thus, the seaweed extract demonstrated an enhancement of the lettuce aerial part development that results in less root development. This algal extract resulted in an improvement of the plant foliar metabolism and an enhancement of the lettuce root efficiency to absorb more nutrients to support better aerial part development.
As water and nutrients are not evenly distributed in the soil, the spatial organization of the root system was critical for regulating the most efficient use of the available resources [85]. Herein, White [86] showed that higher-crop-yielding cultivars are often grown at optimal nutrient concentrations, resulting in the selection of smaller and less plastic roots (less developed, lower specific root length, root demography, and biomass allocation within the patch zone) [87,88]. In fact, based on the prior literature, when root architecture contains a high number of nodal and lateral roots, the plant yields more and produces a higher biomass because a significant investment in lateral root growth results in the establishment of a shallow root system [89]. This happens because roots often proliferate when they come upon a nutrient-rich zone, improving their physiological ion uptake capacity [88]. According to the literature, a reduction in soil pH values could be caused by the use of a nitrogen-based fertilizer, which results in plant absorption of available nutrients, leaving others in the soil to be oxidized [46]. Similarly, the electrical conductivity values could have also been increased due to the application of the fertilizers which added nutrients/minerals in the soil [46]. The soil substrate exhibited an electrical conductivity lower than 0.50 mS/cm, except for the treatment with BlueN (B: 0.52 mS/cm), which was suitable for lettuce growth, because this species was sensitive to a high salt concentration [46]. The root system’s plasticity or flexibility responses have been suggested as the main system by which plants handle with soil’s innately arising nutrient heterogeneity [88]. So, if the plant root was longer and had more biomass than the aerial portion, it means that the plant was not efficient in its use of nutrients to develop the aerial part and to realize photosynthesis, which is very important for crops [86].
When compared with other studies where the nutritional characterization of lettuces grown under greenhouse conditions was evaluated [63,64], it was possible to observe that, in general, the other values were lower when compared to the present research, mostly in calcium, potassium, zinc, iron, and manganese. This demonstrates that extract treatment promotes a better nutrient uptake for the plants. Mainly, there was an enhancement of manganese absorption in the lettuce treated with seaweed extract only.
Nonetheless, genetic differences and environmental factors had a direct influence on the phenotypic differences between treatments influencing the nutritional composition of the edible portion of the lettuce [63].
When applied as a foliar spray alone or in conjunction with the biofertilizer BlueN, S. latissima aqueous extract improved the bulk of lettuce leaves while also enhancing their nutrition, particularly in micronutrients such as zinc and manganese, which are important in the human diet. A part of 100 g can fulfil the zinc threshold value (10–11 mg, daily intake for an average adult) according to the European Parliament and Council of the UE’s daily recommended intakes of minerals and trace elements, while 35 g of lettuce per day is enough to fulfil an average adult’s manganese dietary requirements (2–2.3 mg). Furthermore, zinc and manganese are micronutrients that play important catalytic, structural, and regulatory functions in human metabolism, and are especially important for the brain and cardiovascular systems [90,91,92]. Zinc is an essential trace element that controls and physically maintains cell membrane stability [93]. Manganese is required for enzymes such as manganese superoxide dismutase, arginase, and pyruvate carboxylase [94,95]. Furthermore, this mineral participates in a variety of metabolic functions, including the metabolism of amino acids, cholesterol, glucose, and carbohydrates. Manganese is also involved in the scavenging of reactive oxygen species, bone formation, reproduction, and immunological response [96,97,98].
Lettuce is a cool-season crop that grows best at daytime temperatures of 15–20 °C [99]. Because of the plant’s shallow root structure, it may be cultivated in a variety of soils as long as they are fertile and moisture retaining [99]. It prefers neutral soil (pH values between 6.5 and 7.2) and will not grow in acidic soil. Heat-resistant cultivars can be cultivated during the summer months; however, care should be taken to protect the leaves from direct sunlight by shading or covering the plants to prevent bolting [29,31].
There are currently no restrictions on the use of seaweeds in agriculture; nevertheless, due to the high-salt seaweed content, long-term or excessive use of row and not treated seaweeds may contribute to an increase in salt content in a soil [100]. When analyzing the soil, only the BlueN treatment was higher than 0.5 mS/cm, which indicates a rise of 0.3 mS/cm. This can be a dangerous rise if using more cultivars without revolving or adding more healthy soil; this problem can be due a bigger root system which can shift the soil structure and available nutrients.
BlueN, a commercially accessible product, was composed by Methylobacterium symbioticum, an endophyte bacterium that naturally provides nitrogen to plants [101]. Several experiments with this product have shown that it was beneficial to crops, increasing yield and lowering the use of conventional nitrogen fertilization [101]. For example, only one application of BlueN led to a yield increase of 56% in maize crop culture, 40% in grape, and 9% in raspberry [101]. Furthermore, the use of BlueN reduced 40% of the application of conventional nitrogen fertilizer on wheat crop culture and resulted in a 60% reduction in chicory cultivation [101]. Even though there have been no reports of this product (BlueN) being used on lettuces, earlier research has demonstrated that Methylobacterium spp. can improve the growth and productivity of several important crop cultures, including sugarcane, wheat, corn, peanut, and tomato [102,103,104].
A patent study showed that the foliar application of a bacteria from the genus Methylobacterium (1 × 10⁶ CFU/mL to 1 × 10¹¹ CFU/mL) can improve the rate of root and leaf lettuce growth, as well as overall biomass production [105]. However, because lettuce was a fast-growing crop, BlueN may have a greater impact on annual crops, as it persists longer in soil.
Brown seaweeds, such as Alaria esculenta, Ascophyllum nodosum, Fucus serratus, F. spiralis, F. vesiculosus, Laminaria digitata and Ecklonia maxima have been shown to enhance plant growth, and based on these findings, various authors state that a continuous application of seaweed-based fertilizers has more potential than plant-based or organic and synthetic fertilizers in agriculture and horticulture [106,107,108,109,110]. For instance, the brown seaweed Ecklonia maxima has shown a positive effect on lettuce growth, increasing the potassium (46%), magnesium (37%) and calcium (52%) concentration in plant leaves [111]. Another example is the A. nodosum extract, which has also been shown to improve lettuce seedling performance when exposed to high temperatures [112]. Moreover, previous research using Profertil (in the same concentration) on lettuce presented slightly higher results, when compared with the results obtained in this study, achieving an average aerial-part diameter of 20 cm and an aerial-part weight of 80 g, as well as a higher root weight (24 g) [113].
Nutrients are absorbed by plants, depending on where they are applied, through their roots or on the surface of their leaves. Thus, the biochemical components of seaweed extract can significantly affect the plant’s nutrient profile [106]. Furthermore, seaweed extracts can modify the physical, biochemical, and biological aspects of soil, as well as the architecture of plant roots, resulting in increased nutrient absorption efficiency [114]. In this context, extensive research regarding the chemical composition of several seaweed extracts indicated that the extracts’ nutrient content (usually macronutrients such as nitrogen, phosphorus, and potassium) can affect plant growth and yield [115,116,117]. Furthermore, temperature, humidity, light intensity and leaf age all influence the stomatal opening and the permeability of the cuticle and cell wall, influencing nutrition absorption from the leaf surface [106,115,118].
In addition, brown seaweeds contain polysaccharides including alginates and fucoidans, which are beneficial to crop plants, promoting their growth [6]. Alginic acid, for example, has soil-conditioning capabilities as well as the capacity to bind metal ions and produce high-molecular-weight polymers [114,119]. In this setting, the presence of a substantially cross-linked polymeric network improves soil water retention and root development [120,121,122]. From another standpoint, alginate can compete with plants for cation uptake, limiting the growth-promoting effect [120]. In this experiment, the brown seaweed A. nodosum had nearly twice the alginate concentration of Laminaria species, which could explain why the positive control had lower development in terms of leaf weight, when compared with the aqueous algal extract of S. latissima (previously known as Laminaria saccharina). Moreover, phenolic compounds have chelating properties, which may explain why seaweed extracts can release soil components that are otherwise unavailable [108,123,124].
However, not all seaweeds, and hence not all seaweed extracts, are the same; even the same raw material extracted using different procedures yields extracts of varying quality [107]. Thus, S. latissima ever-changing biomolecular profile was one of the major bottlenecks that hinders this species large-scale seaweed-based biostimulant production [125].
Furthermore, the concentration of seaweed extract is a crucial issue for good plant growth that deserves additional investigation, as was the timing and frequency of its application to achieve the desired results [106,107]. Moreover, the interaction of the brown algal extract with the bacteria present in the BlueN was investigated to determine whether or not both products used had synergistic effects that stimulated plant development. Previous research has demonstrated that the application of a product composed by plant-growth-boosting bacteria (Bacillus licheniformis, Bacillus megatherium, Azotobacter sp., Azospirillum sp., and Herbaspirillum sp.) and by the green microalgae Chlorella vulgaris substantially affected the plant weight of romaine (18.9% at spring) and leaf lettuce (22.7% at summer) [126].
Murugan et al. [33] investigated the effect of bacterial–algal interaction on plant growth. In this context, the bacteria Methylobacterium oryzae and a methanolic extract of the brown seaweed Sargassum wightii collected on the Palladam coast (India) were utilized in the investigation. As a result, the extract with the best yield in both crop cultures (tomato/Lycopersicon esculentum L. and red pepper/Capsicum annum L.) had a seaweed:methanol ratio of 40:2500, and it outperformed the algal extract and the bacteria alone.
Still, there is little information regarding the interaction of Methylobacterium sp. with seaweed-based liquid fertilizers on plant growth; therefore, more research is need.
5. Conclusions
The brown seaweed Saccharina latissima proved to be a good source of not only important minerals like nitrogen, phosphorus, and potassium, but also of sulphated polysaccharides like alginate and fucoidan, as well as other bioactive compounds like phenolic compounds. As an outcome, results demonstrated that S. latissima aqueous extract employed as a foliar spray alone, and when combined with the biofertilizer BlueN, can increase the lettuce leaves’ mass while also enhancing them nutritionally, particularly in the micronutrients zinc and manganese, important for a human diet. The obtained results demonstrated that seaweed-based biofertilizer, resulting from a feasible extraction technique, produced a more economic, diet-attractive, and low-cost lettuce.
BlueN, on the other hand, may have a higher influence on annual crops because lettuce is a fast-growing crop. It was also proved that if the biofertilizer was seaweed-based, only one basic biofertilizer was required for this type of crop. As it was a natural fertilizer, it is both economically and environmentally beneficial to farmers. However, further research is needed to fully understand the extract–bacteria mode of action in plants. Moreover, additional biochemical characterizations of those seaweed extracts that improved outcomes are needed to fully unveil their potential as crop plant biostimulants. Additionally, agronomic characteristics, such as cultivar selection and biostimulant management, including concentration and volume of the treatment, when and how many applications are can be applied, and the administration approach (foliar, drench, seed treatment, and nutrient solution) can make or break the crops’ complete potential and should be prudently engaged in consideration.
Author Contributions
D.P., J.C., L.P. and K.B. conceived and designed the research. D.P. and J.C. conducted the experiments. D.P. conducted the agronomy and biochemical work. D.P. and J.C. analyzed the data. D.P. and J.C. prepared the original draft. L.P. and K.B. reviewed and supervised the manuscript preparation. All authors have read and agreed to the published version of the manuscript.
Funding
This research was funded by the FCT-Foundation for Science and Technology, I.P., as part of the projects UIDB/04292/2020-MARE-Marine and Environmental Sciences Centre. This research was funded by the Fundação para a Ciência e Tecnologia (FCT) through the project LA/P/0069/2020, which was awarded to the Associate Laboratory ARNET. João Cotas was grateful to the European Regional Development Fund for funding the project NASPA (EAPA_451/2016) under the Interreg Atlantic Area Programme.
Institutional Review Board Statement
Not applicable.
Informed Consent Statement
Not applicable.
Data Availability Statement
Data are available from the authors.
Conflicts of Interest
The authors declare no conflict of interest.
References
- Schreinemachers, P.; Simmons, E.B.; Wopereis, M.C.S. Tapping the economic and nutritional power of vegetables. Glob. Food Sec. 2018, 16, 36–45. [Google Scholar] [CrossRef]
- FAO. The Future of Food and Agriculture–Alternative Pathways to 2050; FAO: Rome, Italy, 2018. [Google Scholar]
- Kopittke, P.M.; Menzies, N.W.; Wang, P.; McKenna, B.A.; Lombi, E. Soil and the intensification of agriculture for global food security. Environ. Int. 2019, 132, 105078. [Google Scholar] [CrossRef] [PubMed]
- Petersen, B.; Snapp, S. What was sustainable intensification? Views from experts. Land Use Policy 2015, 46, 1–10. [Google Scholar] [CrossRef]
- Foley, J.A.; Ramankutty, N.; Brauman, K.A.; Cassidy, E.S.; Gerber, J.S.; Johnston, M.; Mueller, N.D.; O’Connell, C.; Ray, D.K.; West, P.C.; et al. Solutions for a cultivated planet. Nature 2011, 478, 337–342. [Google Scholar] [CrossRef]
- Pacheco, D.; Cotas, J.; Rocha, C.P.; Araújo, G.S.; Figueirinha, A.; Gonçalves, A.M.M.; Bahcevandziev, K.; Pereira, L. Seaweeds’ carbohydrate polymers as plant growth promoters. Carbohydr. Polym. Technol. Appl. 2021, 2, 100097. [Google Scholar] [CrossRef]
- Ammaturo, C.; Pacheco, D.; Cotas, J.; Formisano, L.; Ciriello, M.; Pereira, L.; Bahcevandziev, K. Use of Chlorella vulgaris and Ulva lactuca as Biostimulant on Lettuce. Appl. Sci. 2023, 13, 9046. [Google Scholar] [CrossRef]
- Sousa, T.; Nunes, J.P.; Lopes, J.; Cotas, J.; Gonçalves, A.M.M.; Bahcevandziev, K.; Pereira, L. Seaweed as Plant Biostimulants. In Seaweed Biotechnology; Apple Academic Press: Boca Raton, FL, USA, 2022; pp. 183–200. [Google Scholar]
- Melo, P.C.; Sousa, T.; Teixeira, R.; Cotas, J.; Pacheco, D.; Gonçalves, A.M.M.; Bahcevandziev, K.; Pereira, L. Seaweeds and Their Derivates as a Multirole Tool in Agriculture. In Seaweed Biotechnology; Apple Academic Press: Boca Raton, FL, USA, 2022; pp. 201–227. [Google Scholar]
- Mzibra, A.; Aasfar, A.; El Arroussi, H.; Khouloud, M.; Dhiba, D.; Kadmiri, I.M.; Bamouh, A. Polysaccharides extracted from Moroccan seaweed: A promising source of tomato plant growth promoters. J. Appl. Phycol. 2018, 30, 2953–2962. [Google Scholar] [CrossRef]
- Demir, N.; Dural, B.; Yildirim, K. Effect of Seaweed Suspensions on Seed Germination of Tomato, Pepper and Aubergine. J. Biol. Sci. 2006, 6, 1130–1133. [Google Scholar] [CrossRef]
- Di Filippo-Herrera, D.A.; Muñoz-Ochoa, M.; Hernández-Herrera, R.M.; Hernández-Carmona, G. Biostimulant activity of individual and blended seaweed extracts on the germination and growth of the mung bean. J. Appl. Phycol. 2019, 31, 2025–2037. [Google Scholar] [CrossRef]
- Hernández-Herrera, R.M.; Santacruz-Ruvalcaba, F.; Ruiz-López, M.A.; Norrie, J.; Hernández-Carmona, G. Effect of liquid seaweed extracts on growth of tomato seedlings (Solanum lycopersicum L.). J. Appl. Phycol. 2014, 26, 619–628. [Google Scholar] [CrossRef]
- Hernández-Herrera, R.M.; Santacruz-Ruvalcaba, F.; Zañudo-Hernández, J.; Hernández-Carmona, G. Activity of seaweed extracts and polysaccharide-enriched extracts from Ulva lactuca and Padina gymnospora as growth promoters of tomato and mung bean plants. J. Appl. Phycol. 2016, 28, 2549–2560. [Google Scholar] [CrossRef]
- Hernández Carmona, G. Seaweed as potential plant growth stimulants for agriculture in Mexico. Hidrobiológica 2018, 28, 129–140. [Google Scholar] [CrossRef]
- Khan, W.; Rayirath, U.P.; Subramanian, S.; Jithesh, M.N.; Rayorath, P.; Hodges, D.M.; Critchley, A.T.; Craigie, J.S.; Norrie, J.; Prithiviraj, B. Seaweed Extracts as Biostimulants of Plant Growth and Development. J. Plant Growth Regul. 2009, 28, 386–399. [Google Scholar] [CrossRef]
- Sousa, T.; Cotas, J.; Bahcevandziev, K.; Pereira, L. Effects of “sargaço” extraction residues on seed germination. Millenium 2020, 2, 29–37. [Google Scholar] [CrossRef]
- Martynenko, A.; Shotton, K.; Astatkie, T.; Petrash, G.; Fowler, C.; Neily, W.; Critchley, A.T. Thermal imaging of soybean response to drought stress: The effect of Ascophyllum nodosum seaweed extract. Springerplus 2016, 5, 1393. [Google Scholar] [CrossRef] [PubMed]
- Michalak, I.; Dmytryk, A.; Schroeder, G.; Chojnacka, K. The Application of Homogenate and Filtrate from Baltic Seaweeds in Seedling Growth Tests. Appl. Sci. 2017, 7, 230. [Google Scholar] [CrossRef]
- Bonomelli, C.; Celis, V.; Lombardi, G.; Mártiz, J. Salt Stress Effects on Avocado (Persea americana Mill.) Plants with and without Seaweed Extract (Ascophyllum nodosum) Application. Agronomy 2018, 8, 64. [Google Scholar] [CrossRef]
- Bharath, B.; Nirmalraj, S.; Mahendrakumar, M.; Perinbam, K. Biofertilizing efficiency of Sargassum polycystum extract on growth and biochemical composition of Vigna radiata and Vigna mungo. Asian Pacific J. Reprod. 2018, 7, 27. [Google Scholar] [CrossRef]
- van den Burg, S.; Selnes, T.; Alves, L.; Giesbers, E.; Daniel, A. Prospects for upgrading by the European kelp sector. J. Appl. Phycol. 2021, 33, 557–566. [Google Scholar] [CrossRef]
- Araújo, R.; Vázquez Calderón, F.; Sánchez López, J.; Azevedo, I.C.; Bruhn, A.; Fluch, S.; Garcia Tasende, M.; Ghaderiardakani, F.; Ilmjärv, T.; Laurans, M.; et al. Current Status of the Algae Production Industry in Europe: An Emerging Sector of the Blue Bioeconomy. Front. Mar. Sci. 2021, 7, 626389. [Google Scholar] [CrossRef]
- Zhang, X.; Boderskov, T.; Bruhn, A.; Thomsen, M. Blue growth and bioextraction potentials of Danish Saccharina latissima aquaculture—A model of eco-industrial production systems mitigating marine eutrophication and climate change. Algal Res. 2022, 64, 102686. [Google Scholar] [CrossRef]
- Marinho, G.S.; Holdt, S.L.; Birkeland, M.J.; Angelidaki, I. Commercial cultivation and bioremediation potential of sugar kelp, Saccharina latissima, in Danish waters. J. Appl. Phycol. 2015, 27, 1963–1973. [Google Scholar] [CrossRef]
- Fossberg, J.; Forbord, S.; Broch, O.J.; Malzahn, A.M.; Jansen, H.; Handå, A.; Førde, H.; Bergvik, M.; Fleddum, A.L.; Skjermo, J.; et al. The Potential for Upscaling Kelp (Saccharina latissima) Cultivation in Salmon-Driven Integrated Multi-Trophic Aquaculture (IMTA). Front. Mar. Sci. 2018, 5, 418. [Google Scholar] [CrossRef]
- Araújo, G.S.; Morais, T.; Cotas, J.; García-Poza, S.; Silva, J.W.A.; Gonçalves, A.M.M.; Pereira, L. A Road to the Sustainable Seaweed Aquaculture. In Sustainable Global Resources of Seaweeds Volume 1; Springer International Publishing: Cham, Switzerland, 2022; pp. 63–73. [Google Scholar]
- Monteiro, P.; Cotas, J.; Pacheco, D.; Figueirinha, A.; da Silva, G.J.; Pereira, L.; Gonçalves, A.M.M. Seaweed as Food: How to Guarantee Their Quality? In Sustainable Global Resources of Seaweeds Volume 2; Springer International Publishing: Cham, Switzerland, 2022; pp. 309–321. [Google Scholar]
- Pardilhó, S.; Cotas, J.; Pereira, L.; Oliveira, M.B.; Dias, J.M. Marine macroalgae in a circular economy context: A comprehensive analysis focused on residual biomass. Biotechnol. Adv. 2022, 60, 107987. [Google Scholar] [CrossRef] [PubMed]
- Pacheco, D.; Miranda, G.; Rocha, C.P.; Pato, R.L.; Cotas, J.; Gonçalves, A.M.M.; Santos, S.M.D.; Bahcevandziev, K.; Pereira, L. Portuguese Kelps: Feedstock Assessment for the Food Industry. Appl. Sci. 2021, 11, 10681. [Google Scholar] [CrossRef]
- Pardilhó, S.; Cotas, J.; Gonçalves, A.M.M.; Dias, J.M.; Pereira, L. Seaweeds Used in Wastewater Treatment: Steps to Industrial Commercialization. In Phycology-Based Approaches for Wastewater Treatment and Resource Recovery; Verma, P., Shah, M.P., Eds.; CRC Press: Boca Raton, FL, USA, 2021; pp. 247–262. [Google Scholar]
- Lugtenberg, B.; Kamilova, F. Plant-Growth-Promoting Rhizobacteria. Annu. Rev. Microbiol. 2009, 63, 541–556. [Google Scholar] [CrossRef]
- Murugan, A.; Rubavathi, A.; Visal, K.; Neginah, V. Efficacy of Methylobacterium oryzae Supplemented Sargassum wightii Seaweed Liquid Fertilizer on Chilly and Tomato Plant Growth. BioRxiv 2020. [Google Scholar] [CrossRef]
- Kennedy, I. Non-symbiotic bacterial diazotrophs in crop-farming systems: Can their potential for plant growth promotion be better exploited? Soil Biol. Biochem. 2004, 36, 1229–1244. [Google Scholar] [CrossRef]
- Palberg, D.; Kisiała, A.; Jorge, G.L.; Emery, R.J.N. A survey of Methylobacterium species and strains reveals widespread production and varying profiles of cytokinin phytohormones. BMC Microbiol. 2022, 22, 49. [Google Scholar] [CrossRef] [PubMed]
- Kumar, S.; Diksha; Sindhu, S.S.; Kumar, R. Biofertilizers: An ecofriendly technology for nutrient recycling and environmental sustainability. Curr. Res. Microb. Sci. 2022, 3, 100094. [Google Scholar] [CrossRef]
- Corteva. BlueN. Available online: https://www.corteva.pt/produtos-e-solucoes/protecao-de-cultivos/bluen.html#t3 (accessed on 21 July 2021).
- Pereira, L. MACOI. Available online: http://www.flordeutopia.pt/macoi/ (accessed on 21 July 2021).
- Pereira, L. Guia Ilustrado das Macroalgas: Conhecer e Reconhecer Algumas Espécies da Flora Portuguesa; Imprensa da Universidade de Coimbra: Coimbra, Portugal, 2009; ISBN 9789892603971. [Google Scholar]
- Currey, C.J. Lettuce and leafy greens 101: A production guide. Available online: https://www.producegrower.com/article/lettuce-and-leafy-greens-101-a-production-guide/ (accessed on 21 July 2021).
- Cunniff, P. Official Methods of Analysis; AOAC International: Gaithersburg, MD, USA, 1997. [Google Scholar]
- Angell, A.R.; Mata, L.; de Nys, R.; Paul, N.A. The protein content of seaweeds: A universal nitrogen-to-protein conversion factor of five. J. Appl. Phycol. 2016, 28, 511–524. [Google Scholar] [CrossRef]
- FAO. Methods of food analysis. In Food Energy—Methods of Analysis and Conversion Factors; FAO: Rome, Italy, 2003; pp. 7–17. [Google Scholar]
- Lucas, M.D.; Sequeira, E.M. Determinação do Cu, Zn, Mn, Fe, Ca, Mg, K, e Na totais das plantas por espectrofotometria de absorção atómica e fotometria de chama. Pedologia 1976, 11, 163–169. [Google Scholar]
- Ribas, M.C.; Veiga, M.E.; Curto, A.; Oliveira, E.; Barbeitos, M.M.; Ferreira, M.; Pacheco, C.; Peralta, M.F.; Duarte, M. Métodos de análise de material vegetal e terras. Pedologia 1988, 11, 163–169. [Google Scholar]
- Laboratório Químico Agrícola Rebelo da Silva. Sector de Fertilidade do Solo; DGSA-Ministério da Agricultura: Lisbon, Portugal, 1977. [Google Scholar]
- Póvoas, I.; Barral, M.F. Métodos de Análise de Solos; Instituto de Investigação Científica Tropical: Lisbon, Portuga, 1992. [Google Scholar]
- Chapman, H.D. Soluble salts. In Methods of Soil Analyses Part 2 Chemical and Microbiological Properties; Black, C.A., Evans, D.D., White, J.L., Ensminger, L.E., Clarck, F., Eds.; American Society of Agronomy, Inc.: Madison, WI, USA, 1965; pp. 933–951. [Google Scholar]
- Bremner, J.M. Total Nitrogen. In Methods of Soil Analysis Chemical and Microbiological Properies. Part 2; Black, A., Evans, D.D., White, J.L., Ensmingert, L.E., Clark, F.E., Eds.; American Society of Agronomy, Inc.: Madison, WI, USA, 1979; pp. 1149–1176. [Google Scholar]
- Sleutel, S.; De Neve, S.; Singier, B.; Hofman, G. Quantification of Organic Carbon in Soils: A Comparison of Methodologies and Assessment of the Carbon Content of Organic Matter. Commun. Soil Sci. Plant Anal. 2007, 38, 2647–2657. [Google Scholar] [CrossRef]
- Verardo, D.J.; Froelich, P.N.; McIntyre, A. Determination of organic carbon and nitrogen in marine sediments using the Carlo Erba NA-1500 analyzer. Deep Sea Res. Part A. Oceanogr. Res. Pap. 1990, 37, 157–165. [Google Scholar] [CrossRef]
- Bikker, P.; Stokvis, L.; van Krimpen, M.M.; van Wikselaar, P.G.; Cone, J.W. Evaluation of seaweeds from marine waters in Northwestern Europe for application in animal nutrition. Anim. Feed Sci. Technol. 2020, 263, 114460. [Google Scholar] [CrossRef]
- Neto, R.; Marçal, C.; Queirós, A.; Abreu, H.; Silva, A.; Cardoso, S. Screening of Ulva rigida, Gracilaria sp., Fucus vesiculosus and Saccharina latissima as Functional Ingredients. Int. J. Mol. Sci. 2018, 19, 2987. [Google Scholar] [CrossRef]
- Tibbetts, S.M.; Milley, J.E.; Lall, S.P. Nutritional quality of some wild and cultivated seaweeds: Nutrient composition, total phenolic content and in vitro digestibility. J. Appl. Phycol. 2016, 28, 3575–3585. [Google Scholar] [CrossRef]
- Sterner, M.; Edlund, U. Multicomponent fractionation of Saccharina latissima brown algae using chelating salt solutions. J. Appl. Phycol. 2016, 28, 2561–2574. [Google Scholar] [CrossRef] [PubMed]
- Bixler, H.J.; Porse, H. A decade of change in the seaweed hydrocolloids industry. J. Appl. Phycol. 2011, 23, 321–335. [Google Scholar] [CrossRef]
- Cebrián-Lloret, V.; Metz, M.; Martínez-Abad, A.; Knutsen, S.H.; Ballance, S.; López-Rubio, A.; Martínez-Sanz, M. Valorization of alginate-extracted seaweed biomass for the development of cellulose-based packaging films. Algal Res. 2022, 61, 102576. [Google Scholar] [CrossRef]
- Kaya, M.D.; Okçu, G.; Atak, M.; Çıkılı, Y.; Kolsarıcı, Ö. Seed treatments to overcome salt and drought stress during germination in sunflower (Helianthus annuus L.). Eur. J. Agron. 2006, 24, 291–295. [Google Scholar] [CrossRef]
- Laghmouchi, Y.; Belmehdi, O.; Bouyahya, A.; Skali Senhaji, N.; Abrini, J. Effect of temperature, salt stress and pH on seed germination of medicinal plant Origanum compactum. Biocatal. Agric. Biotechnol. 2017, 10, 156–160. [Google Scholar] [CrossRef]
- Shoemaker, C.A.; Carlson, W.H. pH Affects Seed Germination of Eight Bedding Plant Species. HortScience 1990, 25, 762–764. [Google Scholar] [CrossRef]
- Uçarlı, C. Effects of Salinity on Seed Germination and Early Seedling Stage. In Abiotic Stress in Plants; Fahad, S., Saud, S., Wu, C., Chen, Y., Wang, D., Eds.; IntechOpen: London, UK, 2021. [Google Scholar]
- Schneider, J.; Thiesen, L.; Engroff, T.; Holz, E.; Altíssimo, B. Growth analysis of lettuce under different substrate compositions. Adv. Hortic. Sci. 2018, 32, 221–227. [Google Scholar] [CrossRef]
- Kim, M.J.; Moon, Y.; Kopsell, D.A.; Park, S.; Tou, J.C.; Waterland, N.L. Nutritional value of crisphead ‘iceberg’ and romaine lettuces (Lactuca sativa L.). J. Agric. Sci. 2016, 8, 1–10. [Google Scholar] [CrossRef]
- Koudela, M.; Petříková, K. Nutrients content and yield in selected cultivars of leaf lettuce (Lactuca sativa L. var. crispa). Hortic. Sci. 2008, 35, 99–106. [Google Scholar] [CrossRef]
- Apdl-Administração dos Portos do Douro, Leixões e Viana do Castelo. Dragagem do Canal de Acesso aos Estaleiros Navais de Viana do Castelo; Apdl-Administração dos Portos do Douro, Leixões e Viana do Castelo: Lisboa, Portugal, 2017. [Google Scholar]
- Gusmão, A.G. Caraterização Química e Biológica de Lamas de Estações de Tratamento de Águas Residuais (ETAR´s); Escola Superior Agrária de Bragança: Bragança, Portugal, 2023. [Google Scholar]
- Rocha, A.C.S.; Teixeira, C.; Almeida, C.M.R.; Basto, M.C.P.; Reis-Henriques, M.A.; Guimarães, L.; Ferreira, M. Assessing contamination from maritime trade and transportation on Iberian waters: Impact on Platichthys flesus. Environ. Sustain. Indic. 2021, 9, 100098. [Google Scholar] [CrossRef]
- Ferreira, L.M.A. PRojeto de Unidade de Produção de Bivalves no Estuário do rio Lima Viana do Castelo. Direção Geral de Recursos Naturais Segurança e Serviços Maritimos: Viana do Castelo, Portugal, 2018. [Google Scholar]
- Samanta, P.; Jang, S.; Shin, S.; Kim, J.K. Effects of pH on growth and biochemical responses in Agarophyton vermiculophyllum under different temperature conditions. J. Appl. Phycol. 2020, 32, 499–509. [Google Scholar] [CrossRef]
- Guo, X.; Wang, Y.; Qin, Y.; Shen, P.; Peng, Q. Structures, properties and application of alginic acid: A review. Int. J. Biol. Macromol. 2020, 162, 618–628. [Google Scholar] [CrossRef]
- Wang, H.; Wang, L.; Yong, M.; Wang, S.; Cheng, F.; Li, Q.; Hu, J. Effects of alginic acid on radish growth and osmotic adjustment substance content under cadmium stress. IOP Conf. Ser. Earth Environ. Sci. 2020, 480, 012006. [Google Scholar] [CrossRef]
- USDA. Technical Evaluation Report of Alginic Acid Handling/ Processin; USDA: Washington DC, USA, 2015.
- Sangu, T.A.C. Potencial da Ulva rigida na Alimentação Humana e Animal. Bachelor’s Thesis, Escaola Agrária de Coimbra, Coimbra, Portugal, 2020. [Google Scholar]
- Rusu, T.; Moraru, P.I.; Mintas, O.S. Influence of environmental and nutritional factors on the development of lettuce (Lactuca sativa L.) microgreens grown in a hydroponic system: A review. Not. Bot. Horti Agrobot. Cluj-Napoca 2021, 49, 12427. [Google Scholar] [CrossRef]
- Hooks, T.; Masabni, J.; Sun, L.; Niu, G. Effect of Pre-Harvest Supplemental UV-A/Blue and Red/Blue LED Lighting on Lettuce Growth and Nutritional Quality. Horticulturae 2021, 7, 80. [Google Scholar] [CrossRef]
- Ferrón-Carrillo, F.; Guil-Guerrero, J.L.; González-Fernández, M.J.; Lyashenko, S.; Battafarano, F.; da Cunha-Chiamolera, T.P.L.; Urrestarazu, M. LED Enhances Plant Performance and Both Carotenoids and Nitrates Profiles in Lettuce. Plant Foods Hum. Nutr. 2021, 76, 210–218. [Google Scholar] [CrossRef] [PubMed]
- Huett, D. Growth, nutrient uptake and tipburn severity of hydroponic lettuce in response to electrical conductivity and K:Ca ratio in solution. Aust. J. Agric. Res. 1994, 45, 251. [Google Scholar] [CrossRef]
- Samarakoon, U.C.; Weerasinghe, P.A.; Weerakkody, W.A.P. Effect of eletric conductivity [EC] of the nutrient solution on nutrient uptake, growth and yield of leaf lettuce (Lactuca sativa L.) in stationary culture. Trop. Agric. Res. 2006, 18, 13–21. [Google Scholar]
- El-Nakhel, C.; Pannico, A.; Graziani, G.; Kyriacou, M.C.; Giordano, M.; Ritieni, A.; De Pascale, S.; Rouphael, Y. Variation in Macronutrient Content, Phytochemical Constitution and In Vitro Antioxidant Capacity of Green and Red Butterhead Lettuce Dictated by Different Developmental Stages of Harvest Maturity. Antioxidants 2020, 9, 300. [Google Scholar] [CrossRef]
- Paradiso, V.M.; Castellino, M.; Renna, M.; Gattullo, C.E.; Calasso, M.; Terzano, R.; Allegretta, I.; Leoni, B.; Caponio, F.; Santamaria, P. Nutritional characterization and shelf-life of packaged microgreens. Food Funct. 2018, 9, 5629–5640. [Google Scholar] [CrossRef]
- Renna, M.; Castellino, M.; Leoni, B.; Paradiso, V.; Santamaria, P. Microgreens Production with Low Potassium Content for Patients with Impaired Kidney Function. Nutrients 2018, 10, 675. [Google Scholar] [CrossRef]
- Roosta, H.R. Interaction between water alkalinity and nutrient solution ph on the vegetative growth, chlorophyll fluorescence and leaf magnesium, iron, manganese, and zinc concentrations in lettuce. J. Plant Nutr. 2011, 34, 717–731. [Google Scholar] [CrossRef]
- Sefer, B.; Guuml lsuuml, S.M. The effects of drip line depths and irrigation levels on yield, quality and water use characteristics of lettuce under greenhouse condition. Afr. J. Biotechnol. 2011, 10, 3370–3379. [Google Scholar] [CrossRef]
- Pacheco, D. Seaweeds as Plant Health Promoters. Master’s Thesis, University of Coimbra, Coimbra, Portugal, 2022; p. 121.
- Koevoets, I.T.; Venema, J.H.; Elzenga, J.T.M.; Testerink, C. Roots Withstanding their Environment: Exploiting Root System Architecture Responses to Abiotic Stress to Improve Crop Tolerance. Front. Plant Sci. 2016, 07. [Google Scholar] [CrossRef] [PubMed]
- White, P.J. Improving potassium acquisition and utilisation by crop plants. J. Plant Nutr. Soil Sci. 2013, 176, 305–316. [Google Scholar] [CrossRef]
- White, P.J.; George, T.S.; Gregory, P.J.; Bengough, A.G.; Hallett, P.D.; McKenzie, B.M. Matching roots to their environment. Ann. Bot. 2013, 112, 207–222. [Google Scholar] [CrossRef] [PubMed]
- Hodge, A. The plastic plant: Root responses to heterogeneous supplies of nutrients. New Phytol. 2004, 162, 9–24. [Google Scholar] [CrossRef]
- Bayuelo-Jiménez, J.S.; Gallardo-Valdéz, M.; Pérez-Decelis, V.A.; Magdaleno-Armas, L.; Ochoa, I.; Lynch, J.P. Genotypic variation for root traits of maize (Zea mays L.) from the Purhepecha Plateau under contrasting phosphorus availability. Field Crops Res. 2011, 121, 350–362. [Google Scholar] [CrossRef]
- Fitton, H.; Meyers, S.; Brooks, L.; Mulder, A.; Rolfe, M.; Baker, D.; Robinson, S. Effects of fucoidan from Fucus vesiculosus in reducing symptoms of osteoarthritis: A randomized placebo-controlled trial. Biol. Targets Ther. 2016, 2016, 81–88. [Google Scholar] [CrossRef]
- Klevay, L.M. Coronary heart disease: The zinc/copper hypothesis. Am. J. Clin. Nutr. 1975, 28, 764–774. [Google Scholar] [CrossRef]
- Pathak, P.; Kapil, U. Role of trace elements zinc, copper and magnesium during pregnancy and its outcome. Indian J. Pediatr. 2004, 71, 1003–1005. [Google Scholar] [CrossRef]
- Krishnaiah, D.; Sarbatly, R.; Prasad, D.M.R.; Bono, A. Mineral Content of Some Seaweeds from Sabah’s South China Sea. Asian J. Sci. Res. 2008, 1, 166–170. [Google Scholar] [CrossRef]
- Manganese-Health Professional Fact Sheet. Available online: https://ods.od.nih.gov/factsheets/Manganese-HealthProfessional/#en1 (accessed on 21 July 2021).
- Marriott, B.P.; Birt, D.F.; Stallings, V.A.; Yates, A. Present Knowledge in Nutrition. Volume 1, Basic Nutrition and Metabolism; Academic Press: Cambridge, MA, USA, 2020. [Google Scholar]
- Li, L.; Yang, X. The Essential Element Manganese, Oxidative Stress, and Metabolic Diseases: Links and Interactions. Oxid. Med. Cell. Longev. 2018, 2018, 7580707. [Google Scholar] [CrossRef]
- Aschner, J.L.; Aschner, M. Nutritional aspects of manganese homeostasis. Mol. Asp. Med. 2005, 26, 353–362. [Google Scholar] [CrossRef]
- Chen, P. Manganese metabolism in humans. Front. Biosci. 2018, 23, 4665. [Google Scholar] [CrossRef]
- PlantVillage Lettuce. Available online: https://plantvillage.psu.edu/topics/lettuce/infos (accessed on 21 July 2021).
- Nabti, E.; Jha, B.; Hartmann, A. Impact of seaweeds on agricultural crop production as biofertilizer. Int. J. Environ. Sci. Technol. 2017, 14, 1119–1134. [Google Scholar] [CrossRef]
- Symborg. BlueN. Available online: https://symborg.com/es/biofertilizantes/bluen/ (accessed on 21 July 2021).
- Rafique, M.; Naveed, M.; Mustafa, A.; Akhtar, S.; Munawar, M.; Kaukab, S.; Ali, H.M.; Siddiqui, M.H.; Salem, M.Z.M. The Combined Effects of Gibberellic Acid and Rhizobium on Growth, Yield and Nutritional Status in Chickpea (Cicer arietinum L.). Agronomy 2021, 11, 105. [Google Scholar] [CrossRef]
- Schauer, S.; Kutschera, U. A novel growth-promoting microbe, Methylobacterium funariae sp. nov., isolated from the leaf surface of a common moss. Plant Signal. Behav. 2011, 6, 510–515. [Google Scholar] [CrossRef] [PubMed]
- Zhang, C.; Wang, M.-Y.; Khan, N.; Tan, L.-L.; Yang, S. Potentials, Utilization, and Bioengineering of Plant Growth-Promoting Methylobacterium for Sustainable Agriculture. Sustainability 2021, 13, 3941. [Google Scholar] [CrossRef]
- Floro, R.D.; Lee, J.; Bogosian, G.; Bryant, D. Compositions and Methods for Improving Lettuce Production. Patent AU 2014360414 B2, 26 July 2016. [Google Scholar]
- Battacharyya, D.; Babgohari, M.Z.; Rathor, P.; Prithiviraj, B. Seaweed extracts as biostimulants in horticulture. Sci. Hortic. 2015, 196, 39–48. [Google Scholar] [CrossRef]
- Craigie, J.S. Seaweed extract stimuli in plant science and agriculture. J. Appl. Phycol. 2011, 23, 371–393. [Google Scholar] [CrossRef]
- Reed, R.H.; Davison, I.R.; Chudek, J.A.; Foster, R. The osmotic role of mannitol in the Phaeophyta: An appraisal. Phycologia 1985, 24, 35–47. [Google Scholar] [CrossRef]
- Carvalho, M.E.A.; Castro, P.R.C.; Novembre, A.D.C.; Chamma, H.M.C.P. Seaweed extract improves the vigor and provides the rapid emergence of dry bean seeds. Am. J. Agric. Environ. Sci. 2013, 13, 1104–1107. [Google Scholar] [CrossRef]
- Abd El-Gawad, H.G.; Osman, H.S. Effect of exogenous application of boric acid and seaweed extract on growth, biochemical content and yield of eggplant. J. Hortic. Sci. Ornam. Plants 2014, 6, 133–143. [Google Scholar] [CrossRef]
- Crouch, I.J.; Beckett, R.P.; van Staden, J. Effect of seaweed concentrate on the growth and mineral nutrition of nutrient-stressed lettuce. J. Appl. Phycol. 1990, 2, 269–272. [Google Scholar] [CrossRef]
- Möller, M.; Smith, M.L. The significance of the mineral component of seaweed suspensions on lettuce (Lactuca sativa L.) seedling growth. J. Plant Physiol. 1998, 153, 658–663. [Google Scholar] [CrossRef]
- Sousa, T. Uso Do “Sargaço” Como Bioestimulante e Biofertilizante Natural. Master’s Thesis, University of Coimbra, Coimbra, Portugal, 2020. [Google Scholar]
- Anderson, G. The Australian & New Zealand Grapegrower and Winemaker. Winetitles media: Broadview, Australia, 2009; pp. 17–22. [Google Scholar]
- Blunden, G.; Morse, P.F.; Mathe, I.; Hohmann, J.; Critchleye, A.T.; Morrell, S. Betaine yields from marine algal species utilized in the preparation of seaweed extracts used in agriculture. Nat. Prod. Commun. 2010, 5, 581–585. [Google Scholar] [CrossRef]
- Blunden, G.; Jenkins, T.; Liu, Y.-W. Enhanced leaf chlorophyll levels in plants treated with seaweed extract. J. Appl. Phycol. 1996, 8, 535–543. [Google Scholar] [CrossRef]
- Calvo, P.; Nelson, L.; Kloepper, J.W. Agricultural uses of plant biostimulants. Plant Soil 2014, 383, 3–41. [Google Scholar] [CrossRef]
- Deshmukh, R.; Bélanger, R.R. Molecular evolution of aquaporins and silicon influx in plants. Funct. Ecol. 2016, 30, 1277–1285. [Google Scholar] [CrossRef]
- Hegazy, E.A.; Abdel-Rehim, H.; Diaa, D.A.; El-Barbary, A. Controlling of Degradation Effects in Radiation Processing of Polymers; International Atomic Energy Agency: Austria, Vienna, 2009. [Google Scholar]
- Chen, S.-K.; Edwards, C.A.; Subler, S. The influence of two agricultural biostimulants on nitrogen transformations, microbial activity, and plant growth in soil microcosms. Soil Biol. Biochem. 2003, 35, 9–19. [Google Scholar] [CrossRef]
- Lattner, D.; Flemming, H.-C.; Mayer, C. 13C-NMR study of the interaction of bacterial alginate with bivalent cations. Int. J. Biol. Macromol. 2003, 33, 81–88. [Google Scholar] [CrossRef]
- Verkleij, F.N. Seaweed Extracts in Agriculture and Horticulture: A Review. Biol. Agric. Hortic. 1992, 8, 309–324. [Google Scholar] [CrossRef]
- Shibata, T.; Nagayama, K.; Tanaka, R.; Yamaguchi, K.; Nakamura, T. Inhibitory effects of brown algal phlorotannins on secretory phospholipase A2s, lipoxygenases and cyclooxygenases. J. Appl. Phycol. 2003, 15, 61–66. [Google Scholar] [CrossRef]
- Balboa, E.M.; Conde, E.; Moure, A.; Falqué, E.; Domínguez, H. In vitro antioxidant properties of crude extracts and compounds from brown algae. Food Chem. 2013, 138, 1764–1785. [Google Scholar] [CrossRef]
- Zhang, X.; Thomsen, M. Biomolecular Composition and Revenue Explained by Interactions between Extrinsic Factors and Endogenous Rhythms of Saccharina latissima. Mar. Drugs 2019, 17, 107. [Google Scholar] [CrossRef] [PubMed]
- Kopta, T.; Pavlíková, M.; Sękara, A.; Pokluda, R.; Maršálek, B. Effect of Bacterial-algal Biostimulant on the Yield and Internal Quality of Lettuce (Lactuca sativa L.) Produced for Spring and Summer Crop. Not. Bot. Horti Agrobot. Cluj-Napoca 2018, 46, 615–621. [Google Scholar] [CrossRef]

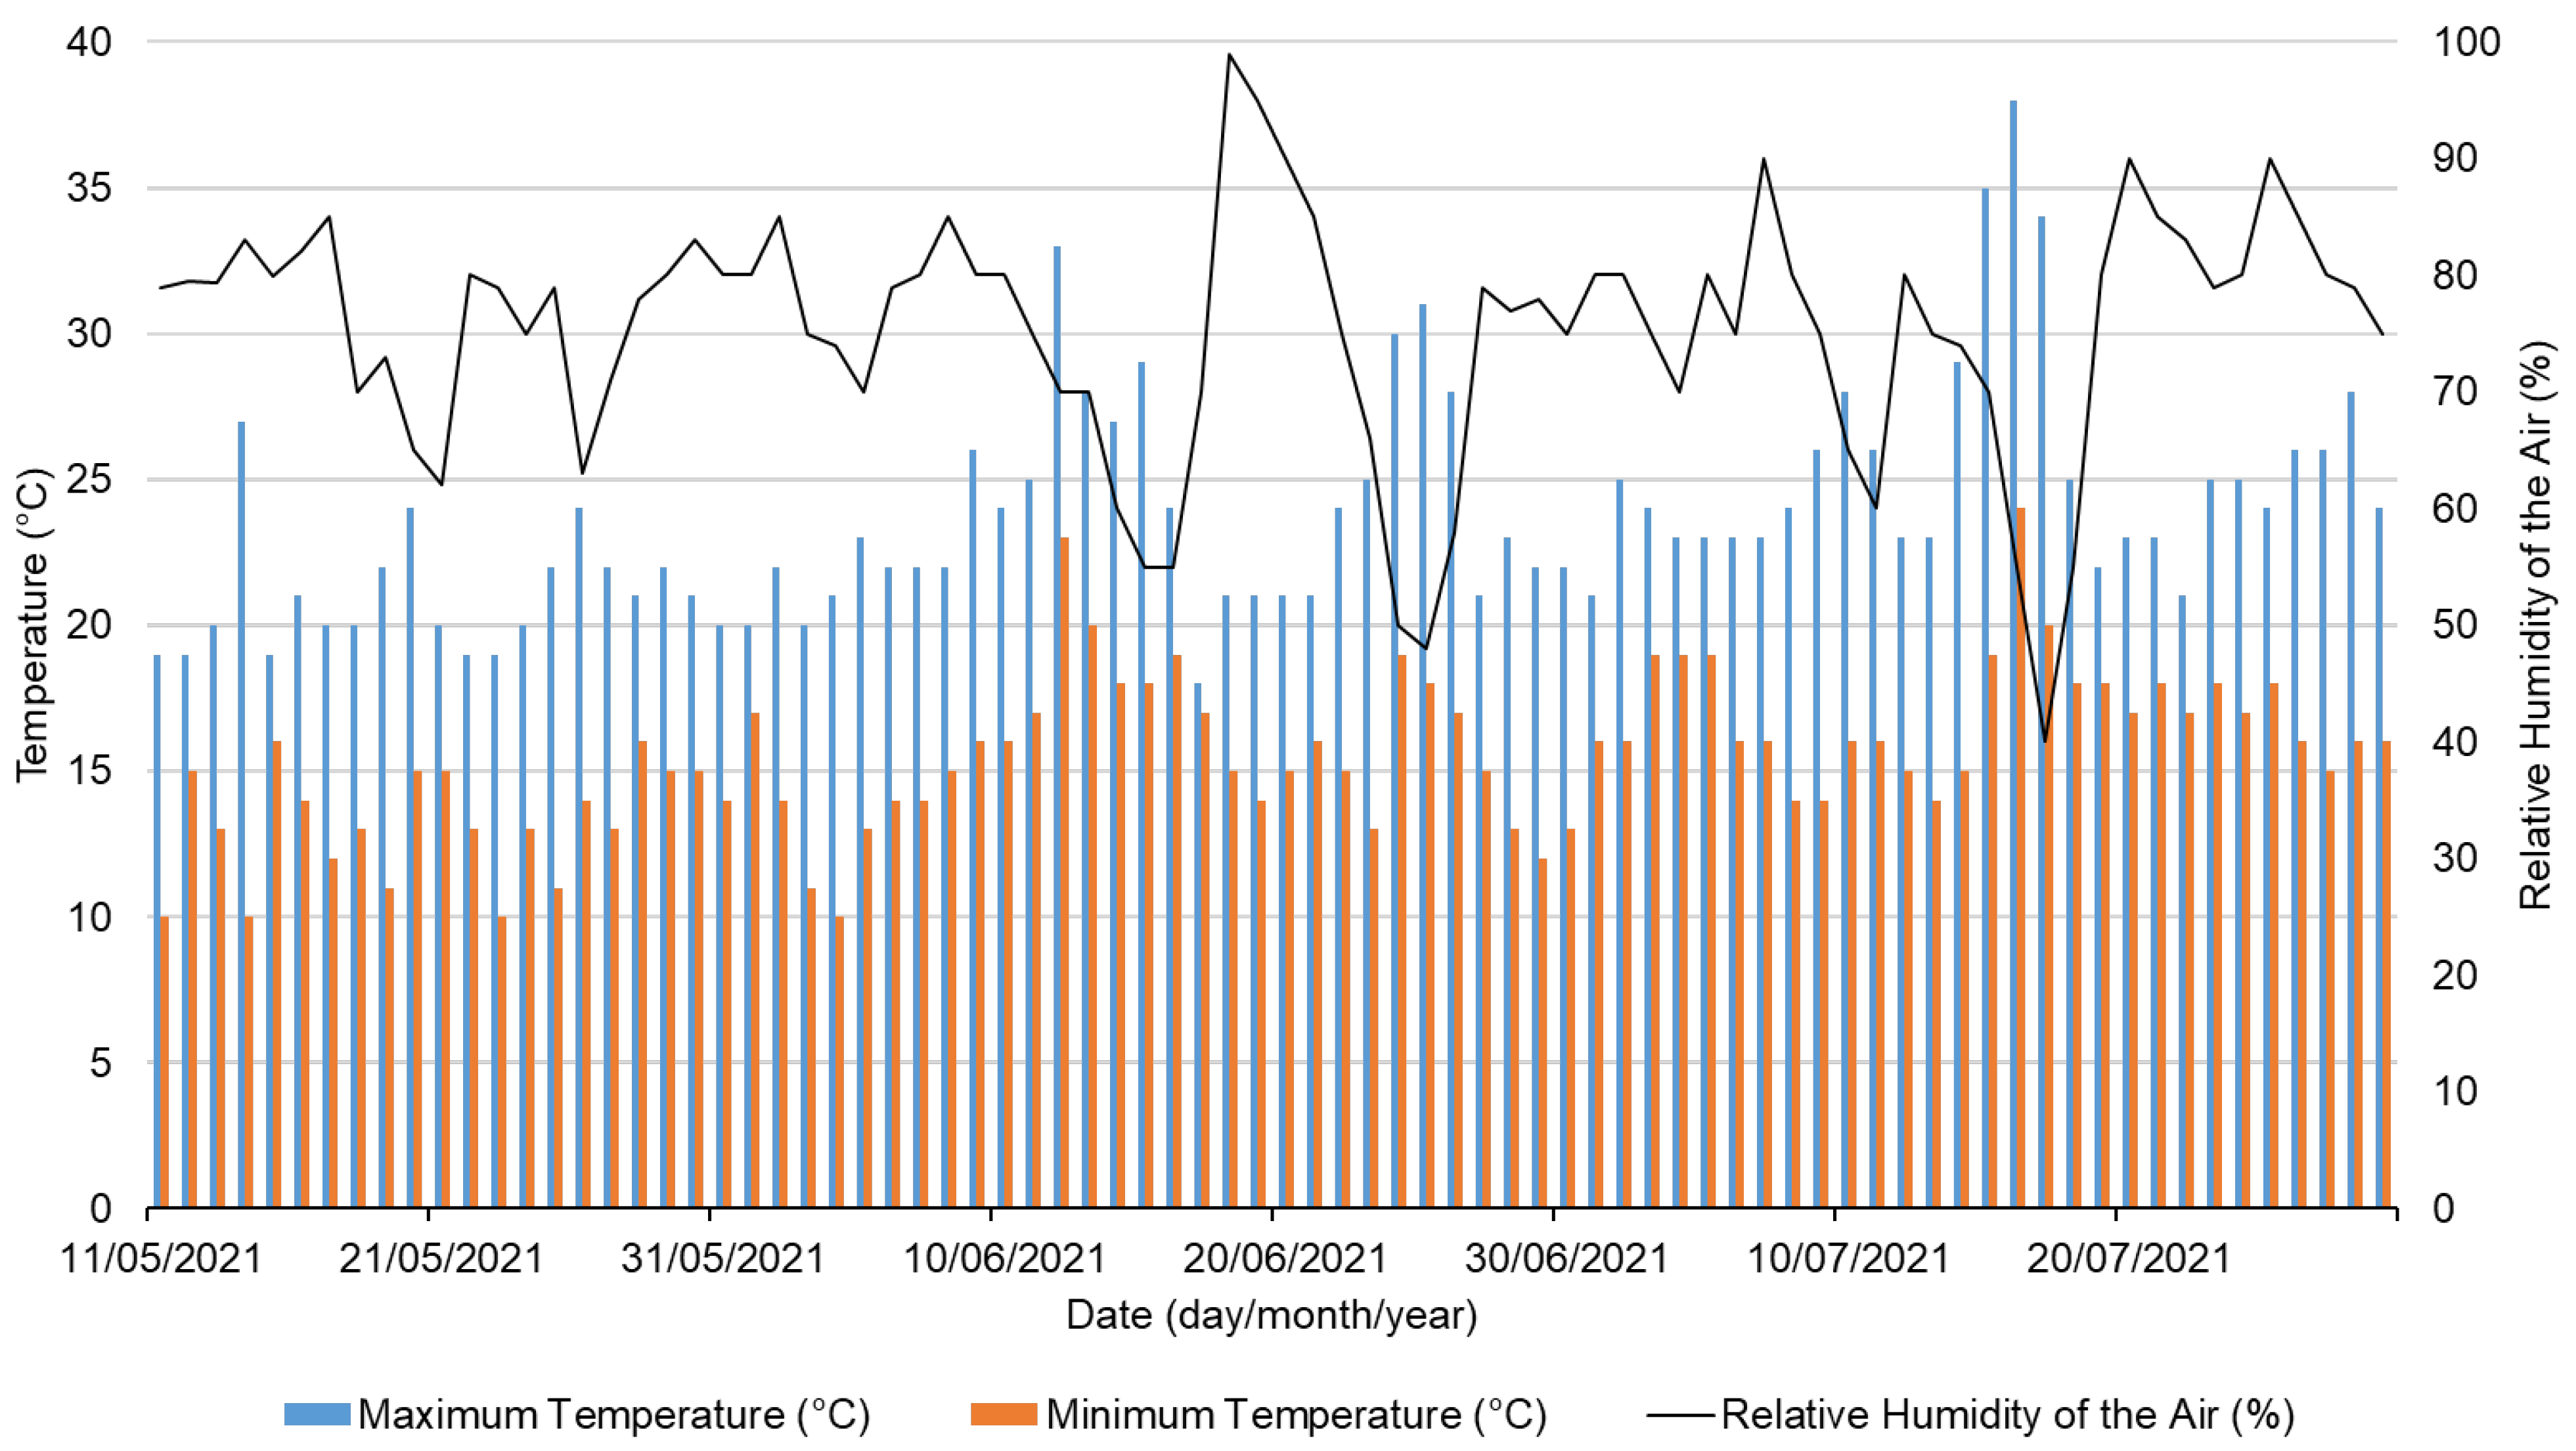

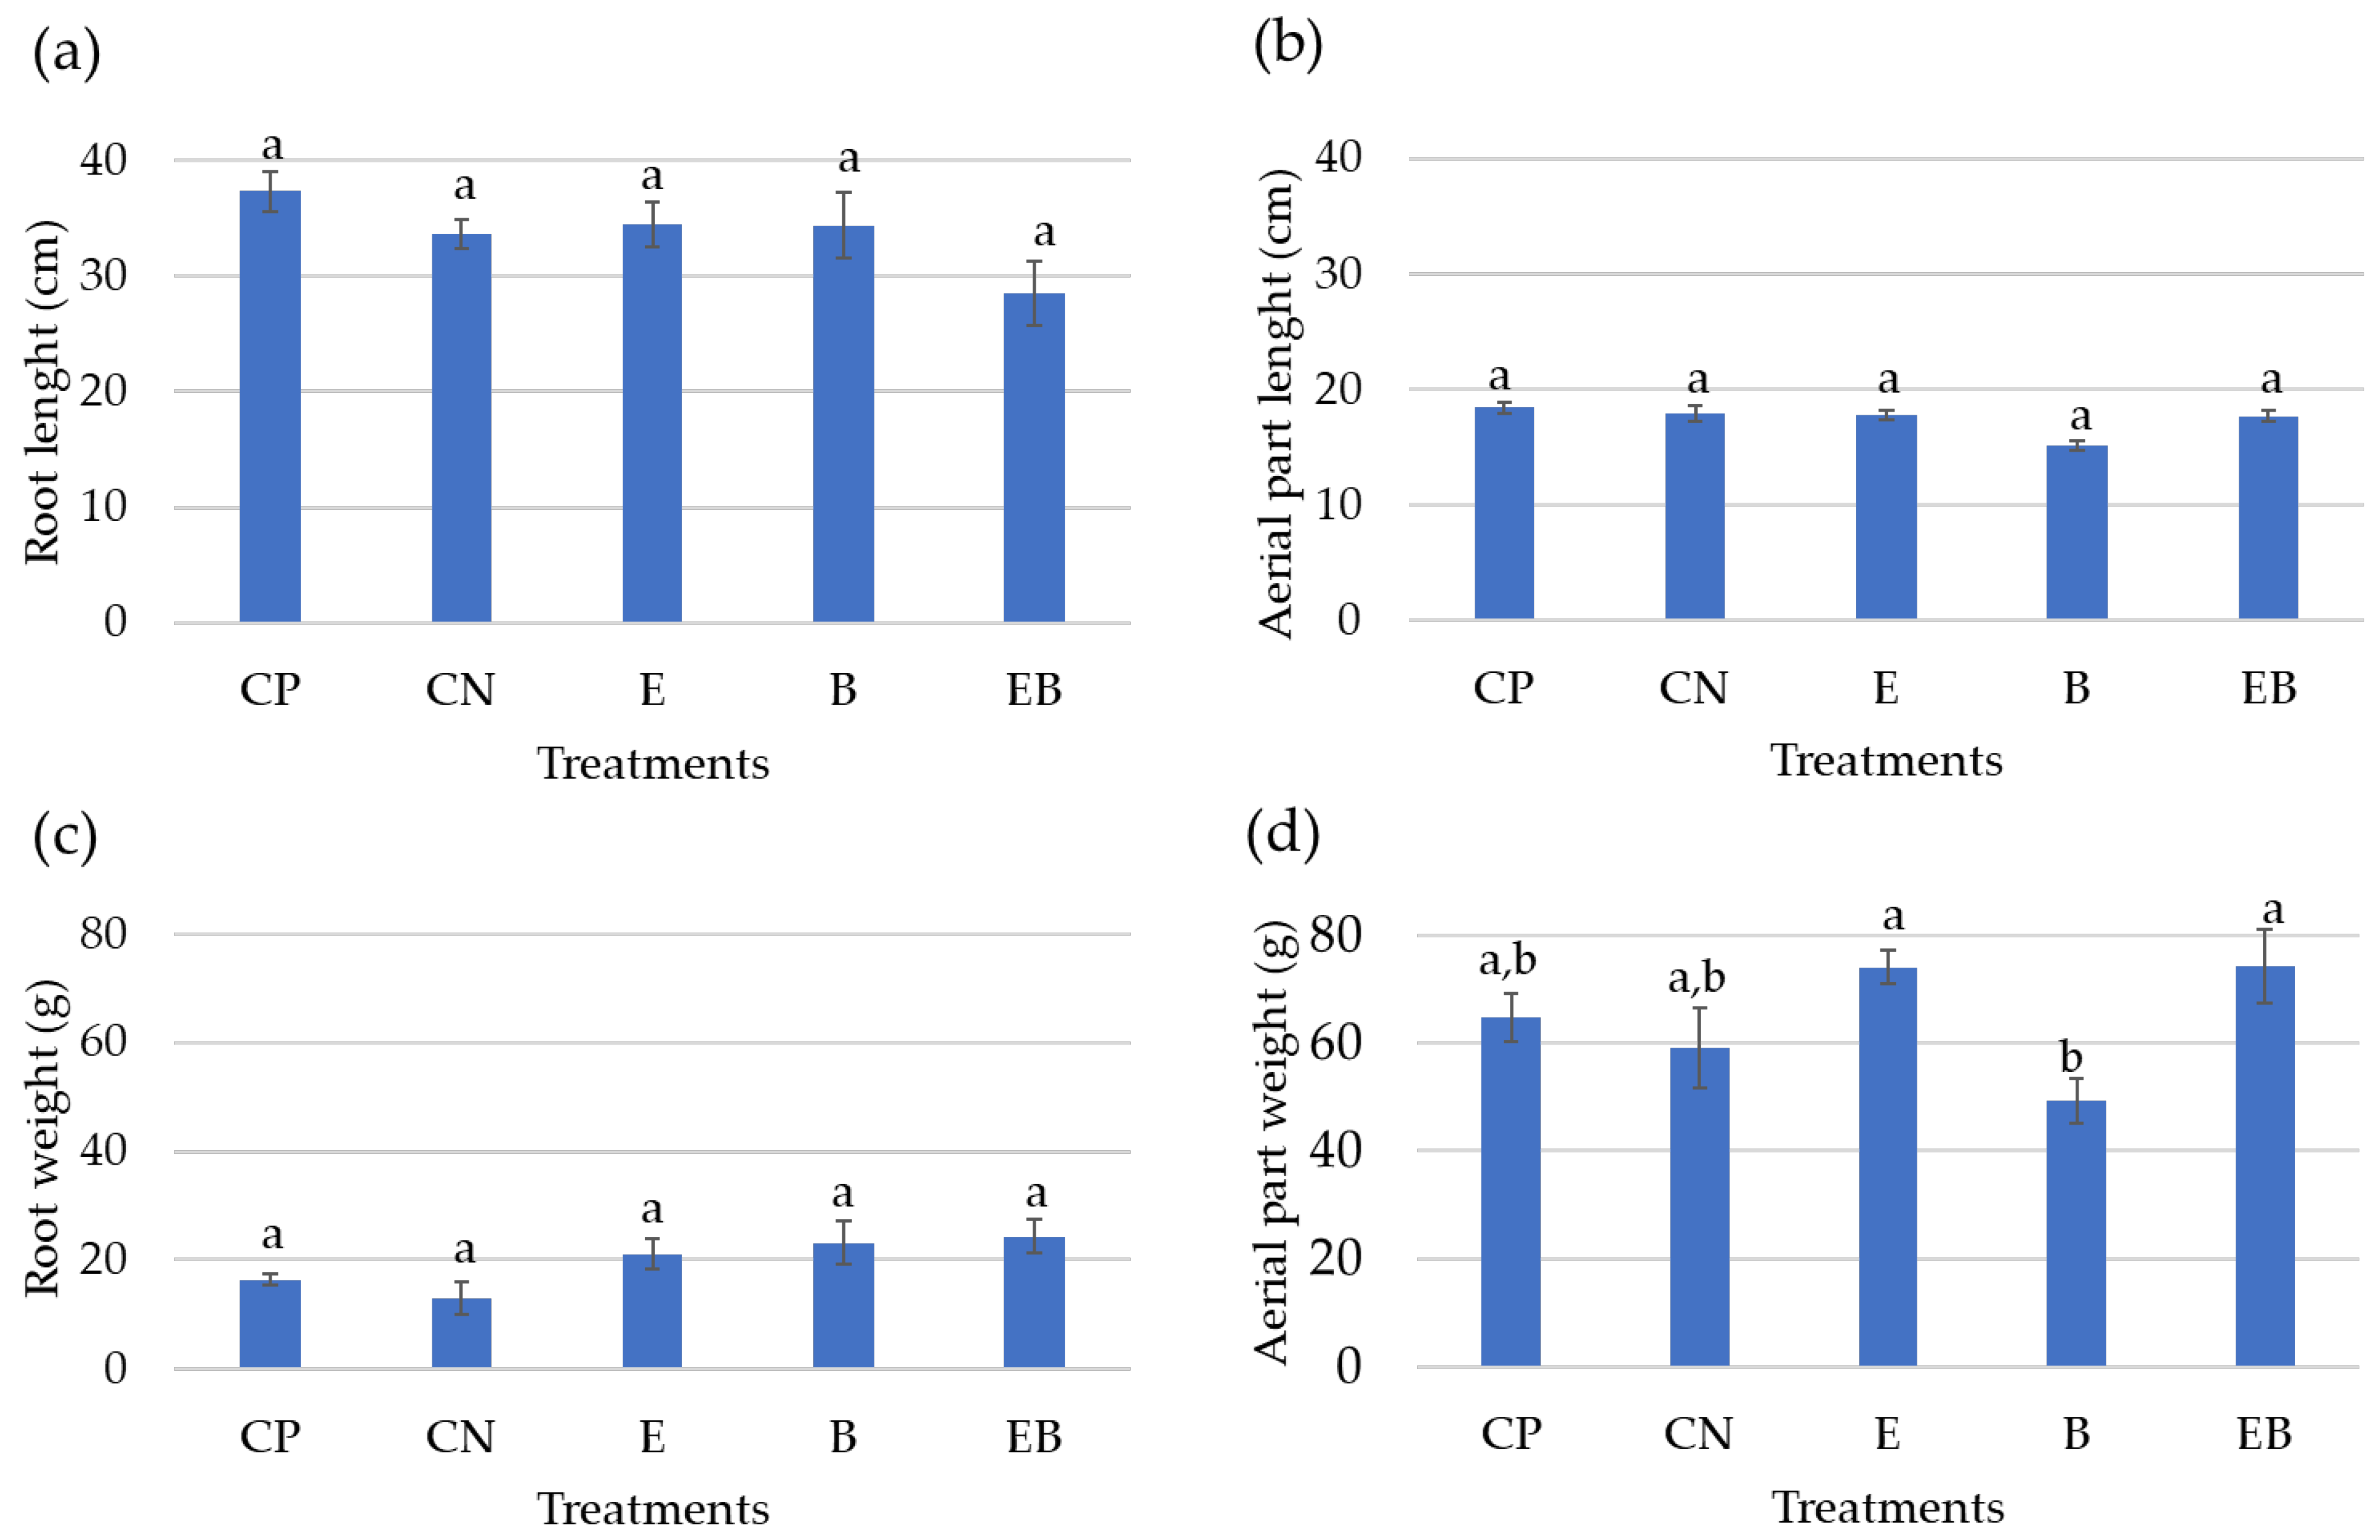
Disclaimer/Publisher’s Note: The statements, opinions and data contained in all publications are solely those of the individual author(s) and contributor(s) and not of MDPI and/or the editor(s). MDPI and/or the editor(s) disclaim responsibility for any injury to people or property resulting from any ideas, methods, instructions or products referred to in the content. |
© 2023 by the authors. Licensee MDPI, Basel, Switzerland. This article is an open access article distributed under the terms and conditions of the Creative Commons Attribution (CC BY) license (https://creativecommons.org/licenses/by/4.0/).