Article

Ecological Assessment of Fishery Communities in an Otter-Trawl-Restricted, Semi-Enclosed Gulf in Greece

by
Dimitris Klaoudatos
1,*,
Sofia Vardali
1,
Chrisoula Apostologamvrou
1,
Alexios Lolas
1,
Nikolaos Neofitou
1,
Alexios Conides
2,
Georgios A. Gkafas
1,
Joanne Sarantopoulou
1,
Dorothea Kolindrini
3,
Kyriakoula Roditi
1,
Athanasios Exadactylos
1 and
Dimitris Vafidis
1
1
Department of Ichthyology and Aquatic Environment, School of Agricultural Sciences, University of Thessaly, 38446 Volos, Greece
2
Hellenic Centre for Marine Research, Institute of Marine Biological Resources & Inland Waters, 19013 Attika, Greece
3
Regional Government of Magnesia and Sporades Islands, El. Venizelou & Analipseos Str., 38001 Volos, Greece
*
Author to whom correspondence should be addressed.
J. Mar. Sci. Eng. 2023, 11(9), 1668; https://doi.org/10.3390/jmse11091668
Submission received: 18 July 2023 / Revised: 14 August 2023 / Accepted: 21 August 2023 / Published: 25 August 2023
(This article belongs to the Section Marine Biology)

Abstract

:
A fishery-independent survey with a commercial bottom otter trawl was conducted in the Pagasitikos Gulf, a semi-enclosed, trawl-restricted gulf in Greece. The study aimed to ecologically assess the fishery communities that are experiencing a decline in fishery landings. Twelve hauls of 30 min duration each were conducted in the eastern, western, and central parts of the gulf at depths between 62 and 97 m. In total, 57 species were captured, with the highest species number recorded in the west (35 species), followed by the center (32 species) and east (29 species). The highest numerical abundance was recorded at the center, followed by the east and west, with an opposing trend exhibited for biomass; however, GLM detected no significant spatial differences (in area or depth) or interaction. Ecological indices exhibited significantly lower values in the west–east area comparison. Linear Discriminant Analysis, mMDS, and hierarchical clustering indicated the presence of two main groups (east and west), with PERMANOVA showing a significant difference in the demersal communities among the identified groups. The results indicated moderately disturbed demersal communities and an increasing level of disturbance from east to west. Considering the economic value of Pagasitikos to the local fishing community, additional fishery management measures are deemed necessary to protect the fishery resources and mitigate the potential risks of overexploitation.

1. Introduction

Coastal waters are delicate environments that sustain high levels of biodiversity and offer a variety of marine raw materials and services [1]. Excessive human use of marine ecosystems has resulted in varying degrees of local environmental disturbance, including habitat loss, altered nutrient cycling and status, decreased food supplies, erosion, reduced sediment supply, sea level change and ensuing inundations, and increased exposure to natural disturbances [2,3,4].
The most important stocks in the Aegean Sea are in a decline from overexploitation [5], while at the same time the ecosystem faces numerus threats from anthropogenic disturbances (urban, agricultural, and industrial pollution) impacting its ecological quality, with further biomass reduction in high trophic level predators further impacting an already sensitive ecosystem [6].
The Hellenic trawl fishery is a multispecies, multigear fishery that has demonstrated a decline for over a decade from landings over 27,000 t (2007) to 13,800 t (2021) according to the National Statistical Service of Greece [7] (constituting about 25% of the total landings [8]) despite the enforcement of management measures (mesh size, closed seasons, closed areas, and minimum landing size), indicating overfishing of the demersal stocks.
The principal managerial measure for demersal fishing in Greece is a closed season in the summer (1st June to 30th September). The Pagasitikos Gulf is considered a unique case for Greek fisheries, since it is one of the few areas where fishing with commercial bottom otter trawls is prohibited throughout the year due to an official ban established in 1966 as a conservational measure (No. 1 Royal Decree 50/67) [9]. However, artisanal fishing with bottoms nets and baited creels is still allowed, with seasonal closures in June–August for bottom nets and May–July for baited creels [10].
It is now widely accepted that since the late 19th century, commercial fisheries have reduced the abundance of target populations, affected life-history parameters such as growth rate and age at maturity, and resulted in the local extirpation of species [11]. However, it has proved difficult to quantify changes in community structure that may have been caused by fishing [12].
The Pagasitikos Gulf is a semi-enclosed, landlocked gulf located in the northwestern part of the Aegean Sea (Figure 1) in central Greece. The gulf is a shallow (average depth of 69 m), semi-enclosed basin with total area of 520 km2 connected to the Aegean Sea and North Evoikos through a narrow (5.5 km) and relatively deep (80 m) channel (the Trikeri Channel) with a mean water renewal time of 105 days [13]. Water masses are homogeneous in winter (12.6 °C) and highly stratified in the summer (27.5 °C). The largest part of the gulf is covered by silt with abundant biogenic constituents, while sand, silty sand, and sandy silt occur only locally [14]. The gulf is highly influenced both by anthropogenic activities (inflow of nutrients at the northern and western parts) and water exchange between the gulf and the Aegean Sea at its southern part, resulting in the development of sub-areas within the gulf. Thus, the inner part (in the north and adjacent to the city of Volos) is characterized by eutrophic conditions with sporadic formation of harmful algal blooms, while the central part acts as a buffer with mesotrophic characteristics influenced by the oligotrophic outer area in the south [15].
The existence of a nearly permanent gyre dipole with an anticyclone in the east and a cyclone in the central–west portions of the basin is one of the gulf’s key characteristics. Since it serves as a mechanism for delivering organic matter to the benthos while also preventing the upward flow of nutrients and dissolved organic carbon, the dominating anticyclonic circulation is crucial to the ecosystem’s ability to function. Contrarily, the cyclonic action raises water masses, carrying water nutrients to the ocean’s uppermost layers [16].
The closed nature of the gulf further exacerbates the pressure on the commercial fish resources due to the ecosystem sensitivity to agricultural, industrial, and anthropogenic pollutants. However, purse seines (artisanal fishing with bottom nets and baited creels) operate in the gulf, with seasonal closures in June–August for bottom nets, May–July for baited creels [10], and December–February for purse seining [17]. According to [18], about 90 fish species are present in the Pagasitikos Gulf, many of which are of high commercial importance. Total landings in the gulf have exhibited a declining trend over the past 20 years [7] from a peak of 2500 metric tons in 2010 to 59 metric tons in 2021. Despite this declining trend in fishery landings, limited and outdated work has been published on the state of the gulf’s fisheries [19,20], with no study so far available on the ecological condition of its demersal assemblages.
The aim of the study was to ecologically assess (niche overlap and levels of disturbance) in the Pagasitikos Gulf, which is exhibiting a declining trend in fishery landings, using data acquired from fishery-independent experimental bottom otter trawl surveys.

2. Materials and Methods
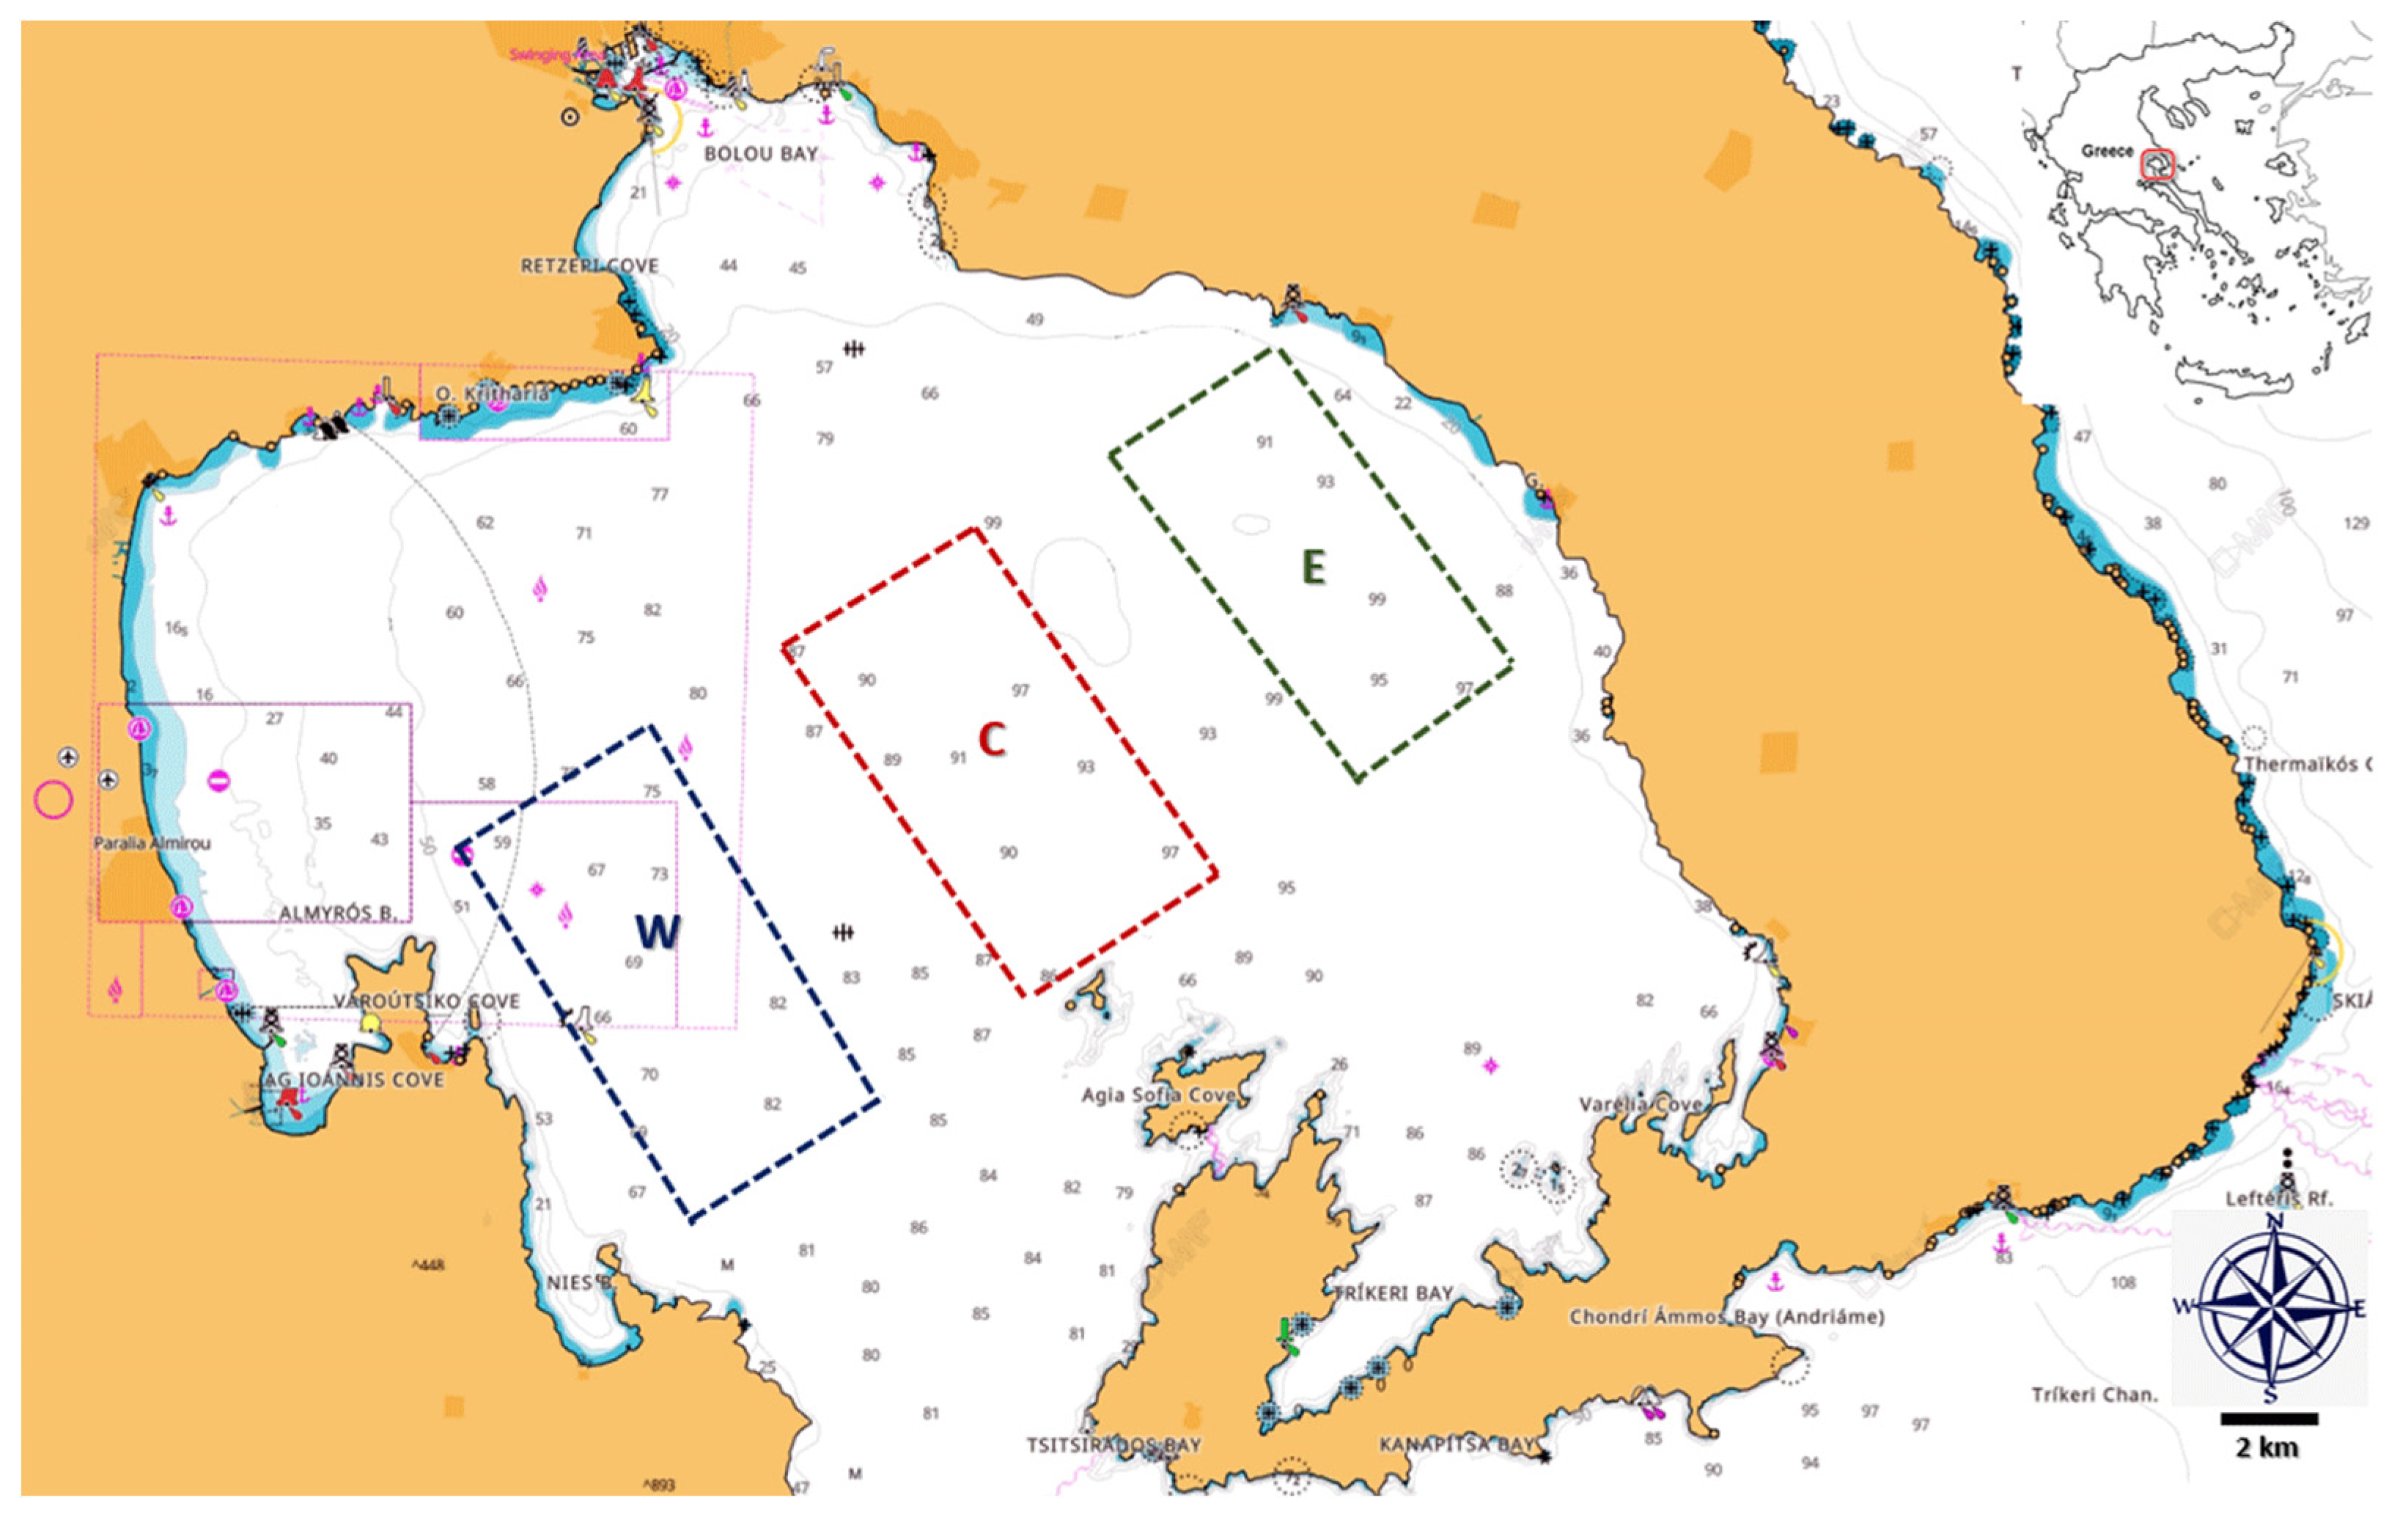
2.1. Sampling

Two fishery-independent surveys took place on two consecutive days during May 2021 and 2022 using the same commercial bottom otter trawl vessel and trawling gear at depths ranging between 62 and 97 m. In total, twelve hauls of 30 min duration each were conducted in the eastern, western, and central part of the Pagasitikos Gulf (Figure 1). The bottom trawl used was a traditional Greek commercial trawl with a square mesh codend with a mesh size (bar length) of 28 mm (stretched). For each trawl, each species was identified, its total weight was recorded, and 100 individuals were measured in length and weight. The trawling speed was approximately 3 knots. During each haul, the geographic position and depth at the start and finish were recorded. Numerical abundance for each species was expressed as the number of individuals and the biomass in kilograms of individuals in a one-hour trawl.

2.2. Univariate Statistical Analysis

Data for statistical analysis were evaluated for normal distribution by employing the Shapiro–Wilk test for normality and for homogeneity of variance by employing Levene’s test. The null hypothesis of no significant differences between samples was tested with a one-way analysis of variance (ANOVA) [21] when data did not violate the assumptions of the test (normality and homoscedasticity). Welch’s ANOVA was employed for comparisons when data were normally distributed but violated the assumption of homoscedasticity [22]. Statistical analysis was performed with Jamovi software (2.3.26) [23] at an alpha level of 0.05. Minitab 20 software (Minitab, State College, PA, USA) was used to assess the main effects of abundance and biomass between sampling areas. The null hypothesis of no significant spatial differences (depth and site) or their interaction was tested with an ANOVA general linear model (GLM) using a least squares regression approach [24].

2.3. Multivariate Statistical Analysis

Metric Multidimensional Scaling (mMDS) using the Euclidean distance matrix was performed using the Orange data-mining software (3.34.0) [25]. Hierarchical agglomerative clustering with the Unweighted Pair Group Method with Arithmetic Mean (UPGMA) [26] group average linkage method algorithm was used with the PRIMER package [27] (PRIMER-e, Auckland, New Zealand). To normalize data and to avoid skewness, a square root transformation was applied on the data prior to calculating similarities. The spatial pattern of community composition was assessed by using the Bray–Curtis similarity index [28] as a resemblance measure. Differences between cluster groups were tested using permutation analysis of variance (PERMANOVA). Linear Discriminant Analysis (LDA), a supervised classification technique, was employed as a dimensionality-reduction technique to identify area separability [29]. The similarity percentage procedure SIMPER [30] was used to investigate the contributions of the factors most responsible for similarities and dissimilarities within and between clusters.

2.4. Ecological Assessment

Assessment of the community structure was based on univariate analysis with the use of diversity indices. Diversity was calculated by means of the Shannon–Wiener index [31], and species richness (R) was calculated following [32] and species evenness (E) following [33].
The Shannon–Weaver index was calculated as:
H′ = −∑(pi * log2(pi))
where H′ is the Shannon–Weaver index, pi is the proportion of individuals belonging to the i-th species in the community, and the summation is taken over all species present in the community.
The Margalef species richness index, a measure of species richness or diversity in a community that provides a measure of the efficiency of resource use in the community, was calculated as:
d = (S − 1)/ln(N)
where d is the Margalef index, S is the total number of species in the community, and N is the total number of individuals in the community.
The Pielou index was calculated as:
J = H′/ln(S)
where J is the Pielou evenness index, H′ is the Shannon–Weaver index, and S is the total number of species in the community.
The Abundance/Biomass Comparison (ABC) method [34] was used as a technique for monitoring disturbance (pollution-induced or otherwise) of community structure by comparing dominance in terms of abundance with dominance in terms of biomass.
Univariate analysis via the Pearson correlation coefficient (PCC) was employed as a measure of strength of the linear association between ecological disturbance and depth, which was calculated as:
r = [ n ( x y ) x y ] / n ( x 2 ) ( x ) 2 ] [ n ( y 2 ) ( y ) 2
where n is the sample size, and Σ is the summation of all values.

2.5. Species Association and Niche Overlap

Species association and niche overlap assessment were performed with the estimation of several ecological indices, namely Levins’ niche breadth index [35,36,37], Schoener’s D index [38], the Petraitis index of niche breadth [36,39], Pianka’s niche overlap index [40,41], the Czekanowski niche overlap index [35] and Morisita’s overlap index [42,43]. These were calculated using the open-source programming environment R 4.2.2 [44] with the use of the R-package “spaa” (version 0.2.2) [45] (downloaded from https://cran.r-project.org/package=spaa) (accessed on 10 May 2023).

3. Results

In total 57 species were sampled, including 48 fish species (44 teleostei and 4 chondrichtyes), 5 cephalopods, and 4 crustaceans. The highest species numbers were recorded in the western and central sampling sites (35 and 32 species, respectively), followed by the eastern sampling site (29 species).

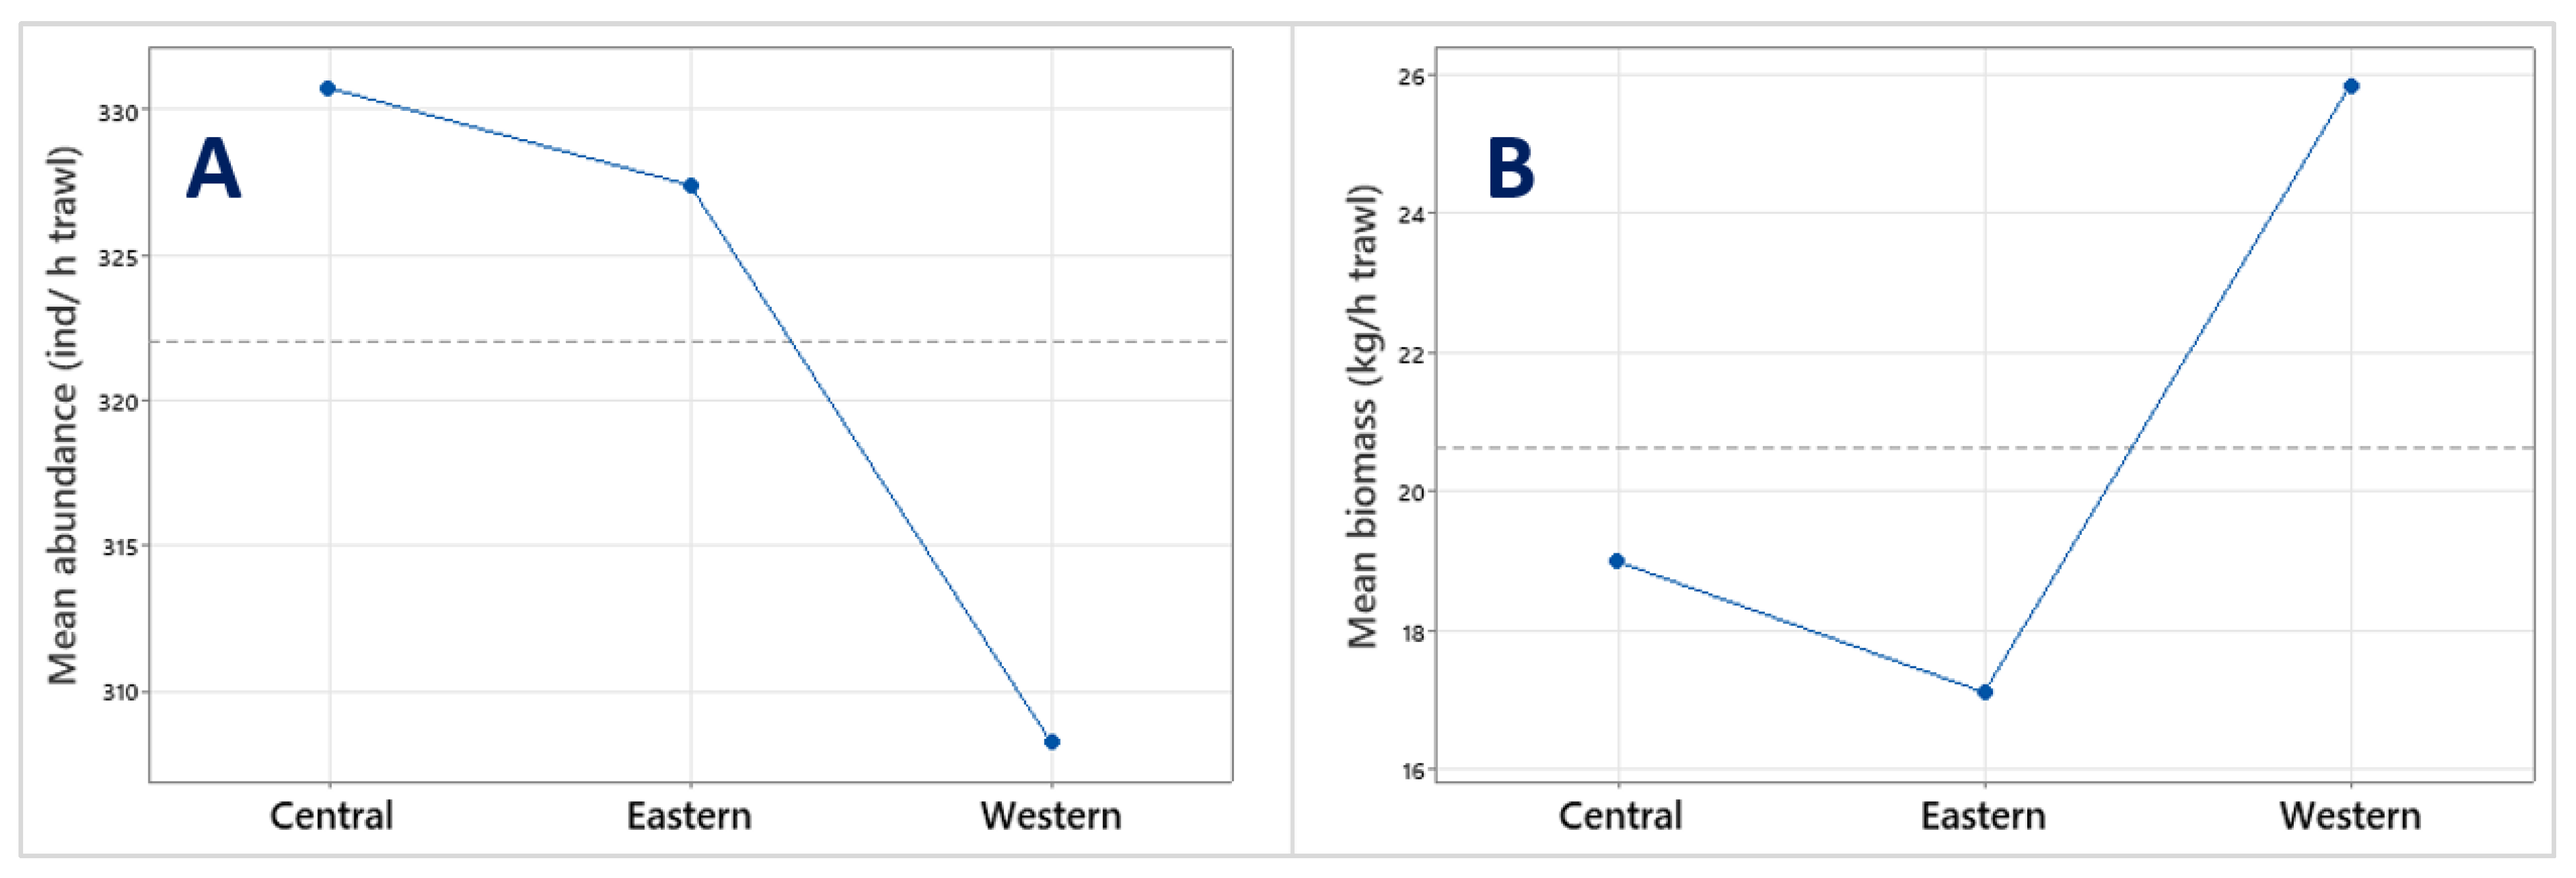
3.1. Abundance and Biomass of Major Taxa
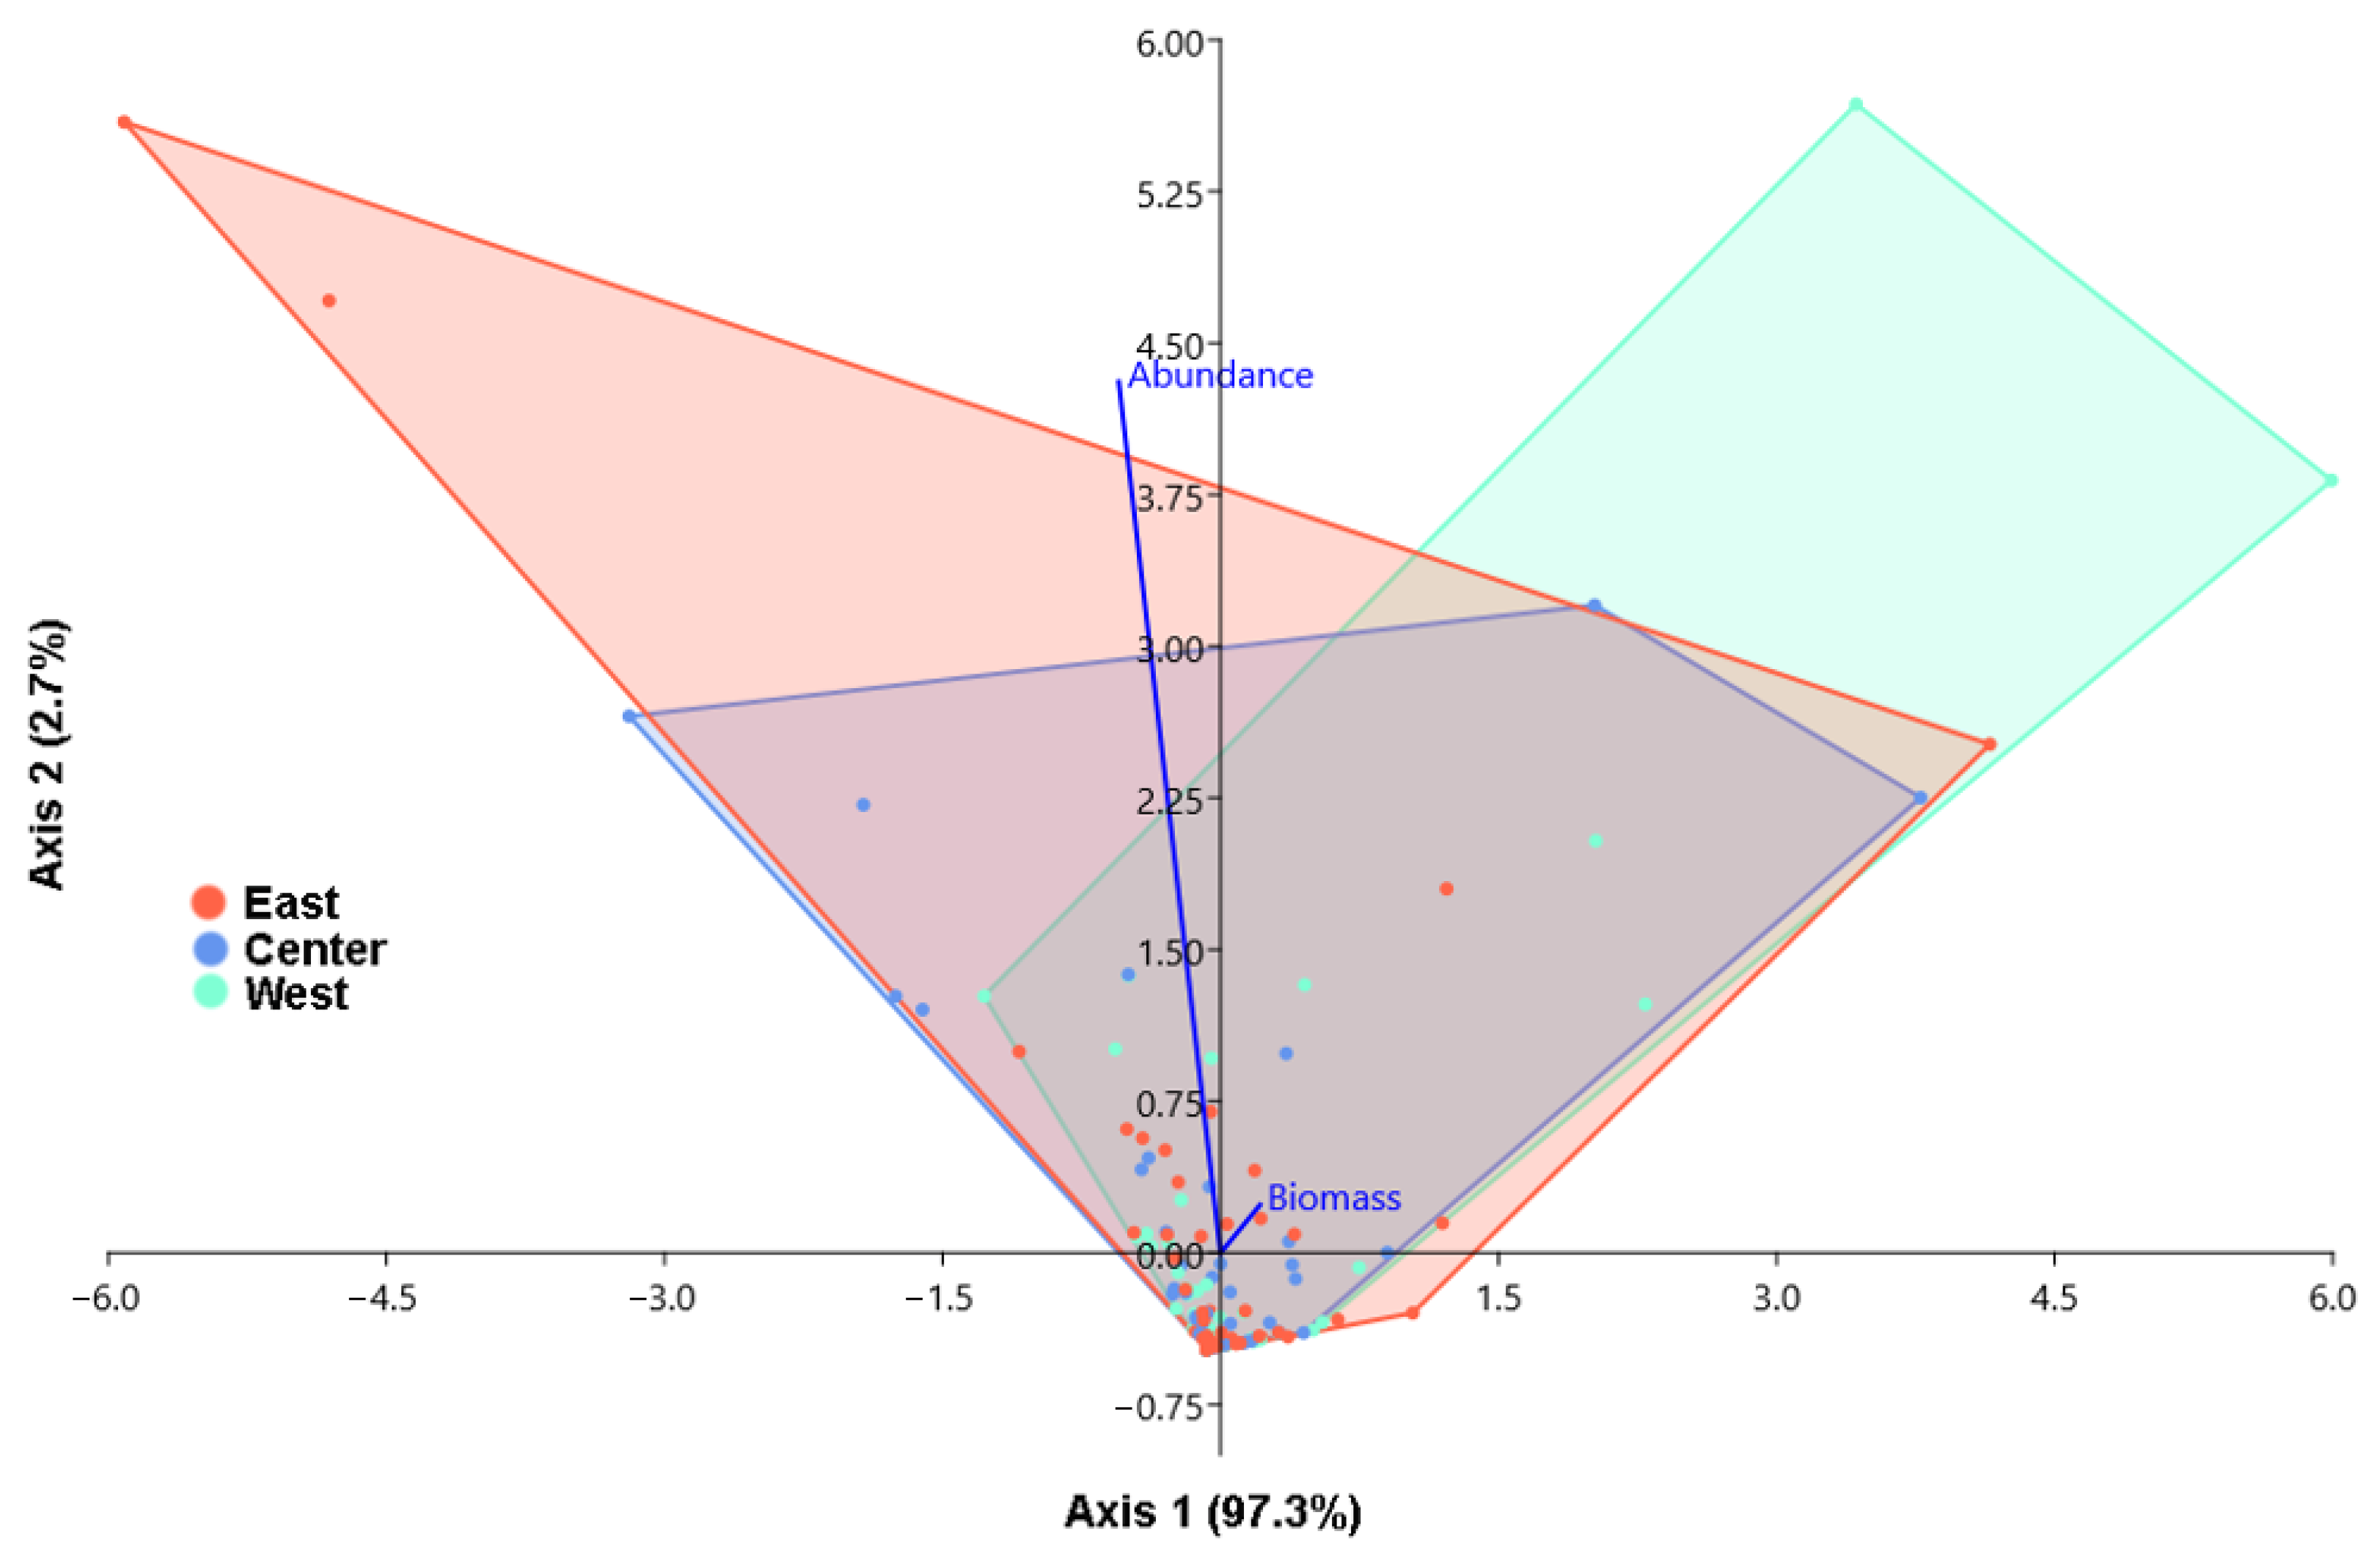
The most abundant species in the west area, with more than 56% of the total abundance, were Pagellus bogaraveo and Trachurus mediterraneus. P. bogaraveo and Parapenaeus longirostris were the most abundant species in the center, with more than 51% of the total abundance. Similarly, P. longirostris and P. bogaraveo were the most abundant species in the east, with more than 66% of the total abundance (Table 1).
The highest biomass in the west, with more than 74% of the total biomass, was exhibited by P. bogaraveo and Pagellus erythrinus. P. bogaraveo exhibited the highest biomass in the center, with more than 56% of the total biomass. P. bogaraveo, M. barbatus, P. longirostris, and Illex coindetii exhibited the highest biomass in the east, with more than 65% of the total biomass (Table 1).
To highlight the areas that exhibited highest numerical abundance and biomass, main effect plots were employed; these indicated higher numerical abundance in the central area, followed by the eastern and western areas (Figure 2A). An opposing trend in the biomass compared to the numerical abundance among areas was further exhibited (Figure 2B), with the highest biomass in the western area, followed by the central and eastern areas.
No significant difference was indicated in the effect of each treatment (area and depth) and their interaction on abundance or biomass using the general linear model (GLM) analysis of variance.

3.2. Niche Overlap

The ecological overlap among sampling areas was assessed with several ecological indices (Table 2) using both biomass and abundance data.
To aid in the ecological comparison among sampling areas, numerous ecological indices were calculated based on both abundance and biomass, and these were included in comparative boxplots (Figure 3). Comparative boxplots of the ecological indices calculated using abundance and biomass among sampling sites (Figure 3) indicated lower value of the indices in the west–east area comparison. The comparison of indices using the numerical abundance from each area exhibited a mean index between the west and east that was significantly lower (F = 6.79, p < 0.01) compared to the other area comparisons, indicating a significantly lower ecological overlap between those two opposing areas of the gulf. A similar lower index between the west and east was observed using the biomass data from each area, but it was not statistically significant (F = 1.03, p > 0.05).

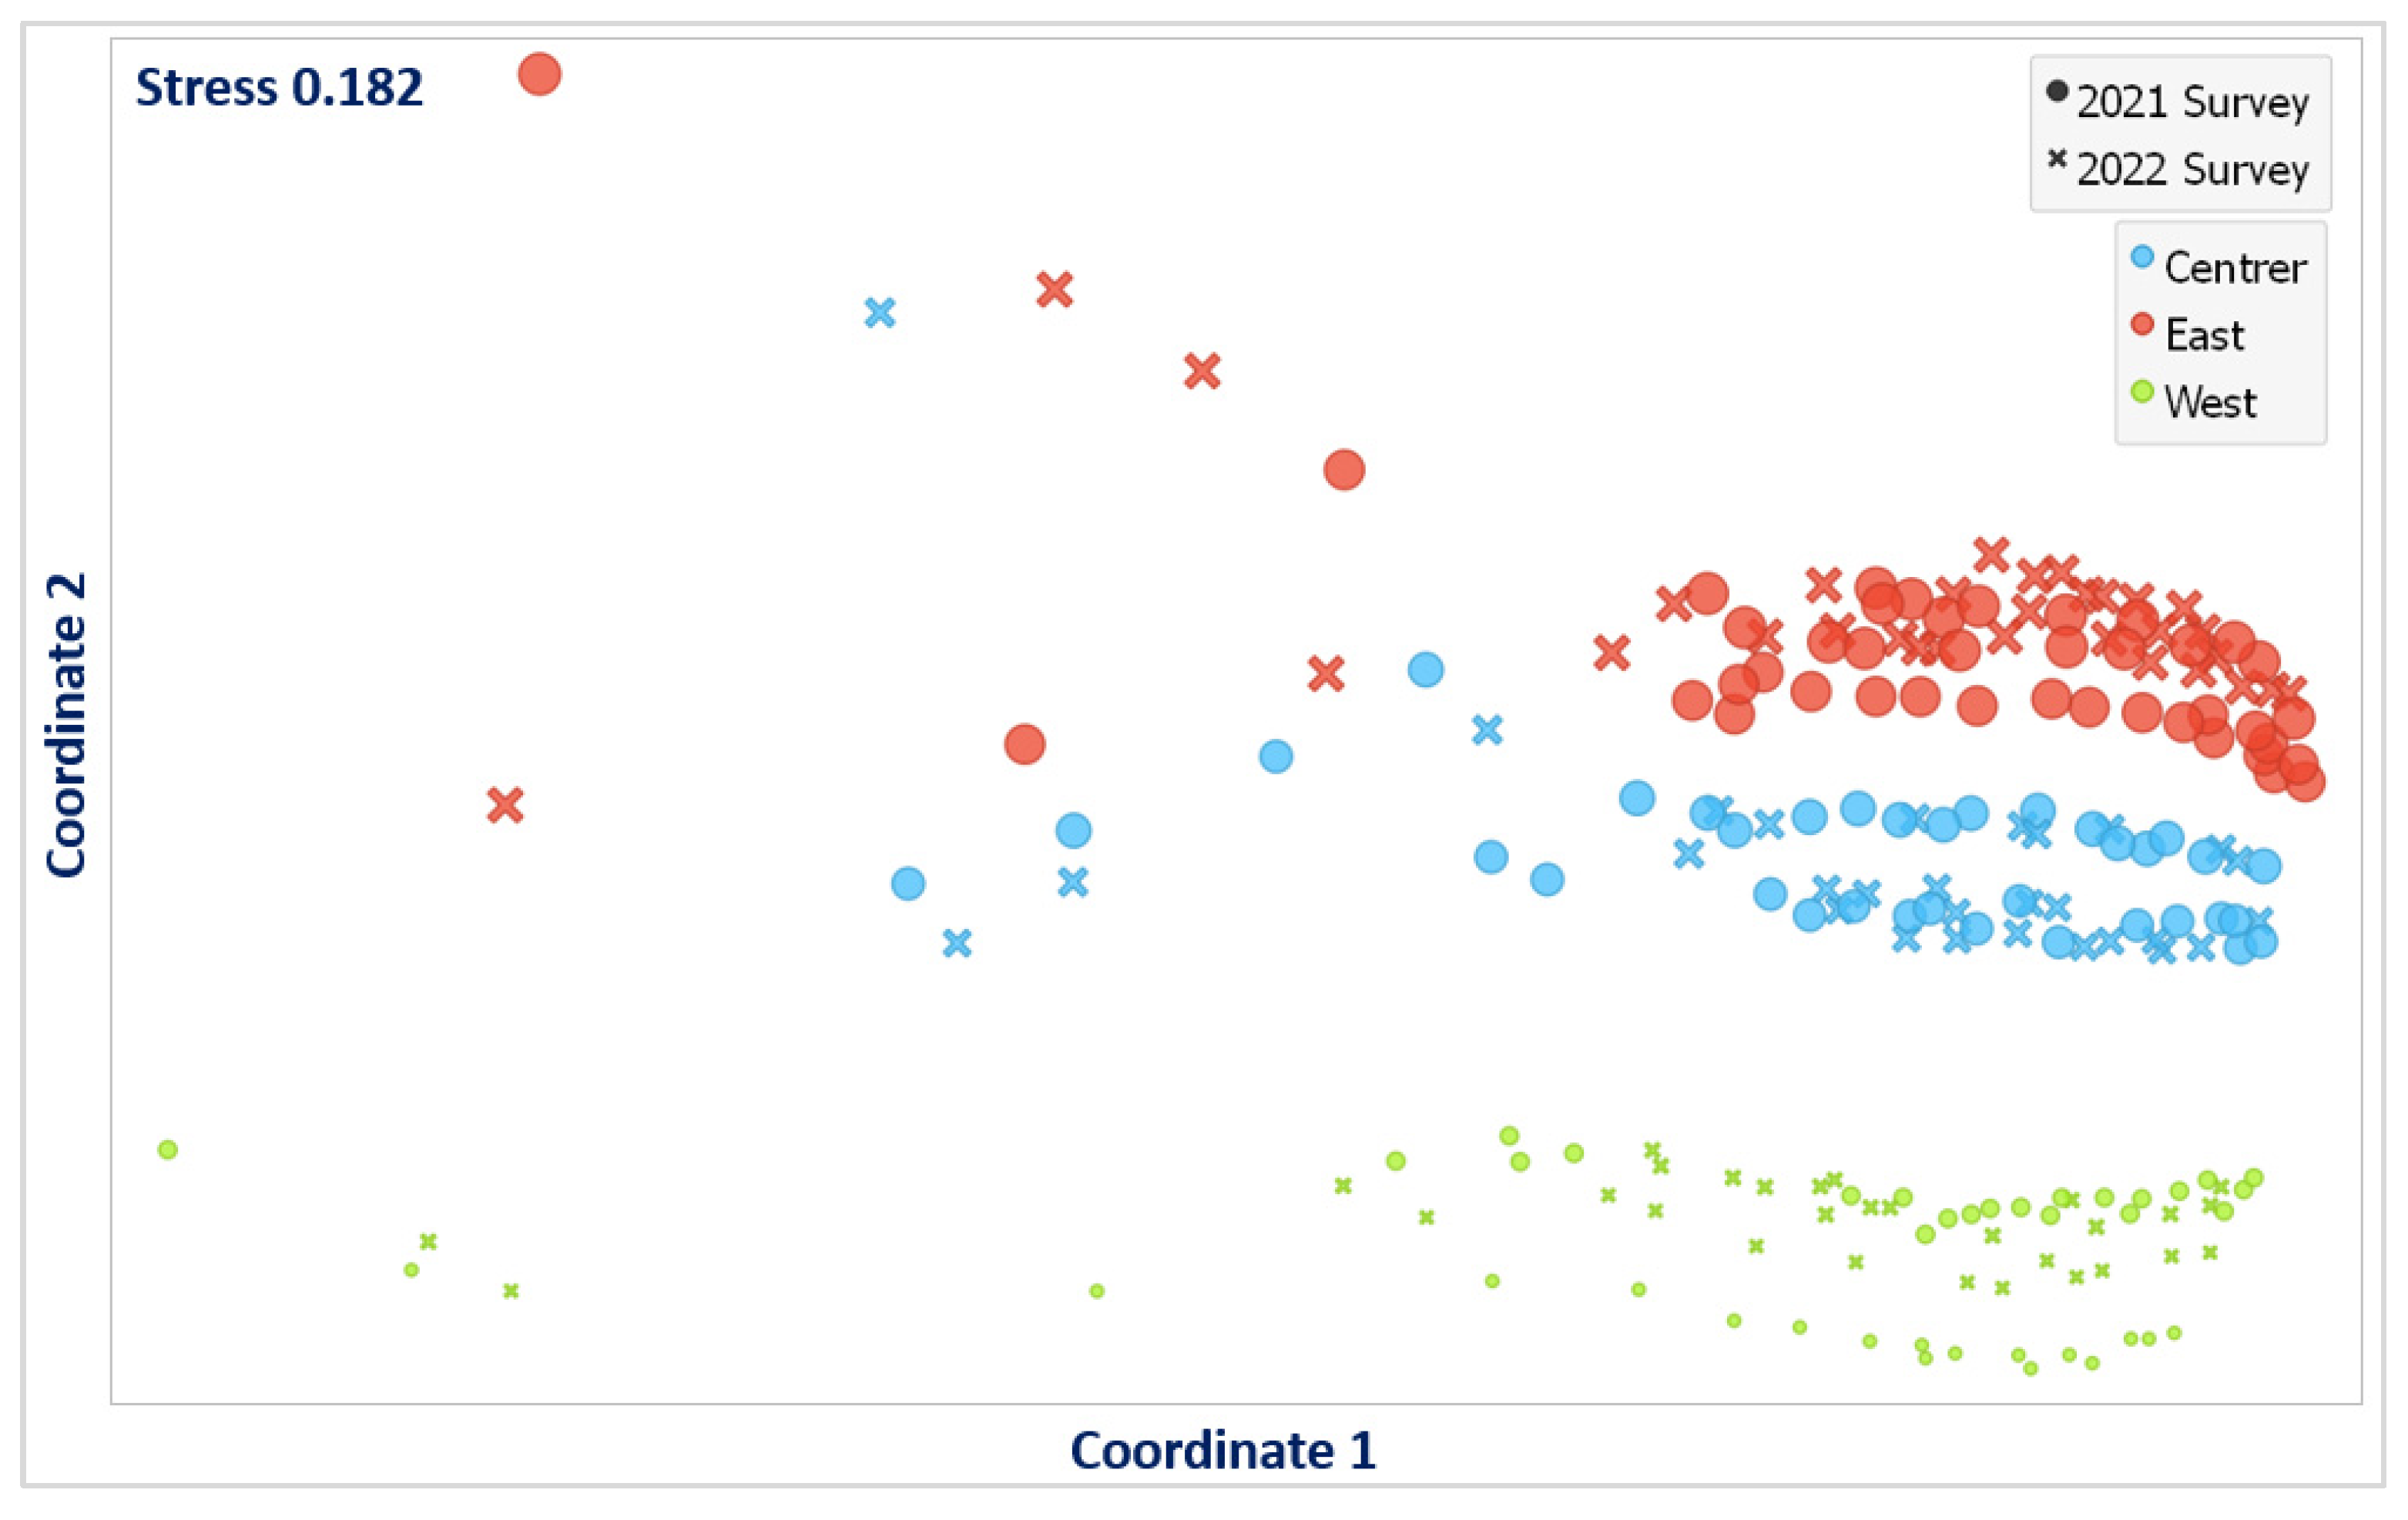
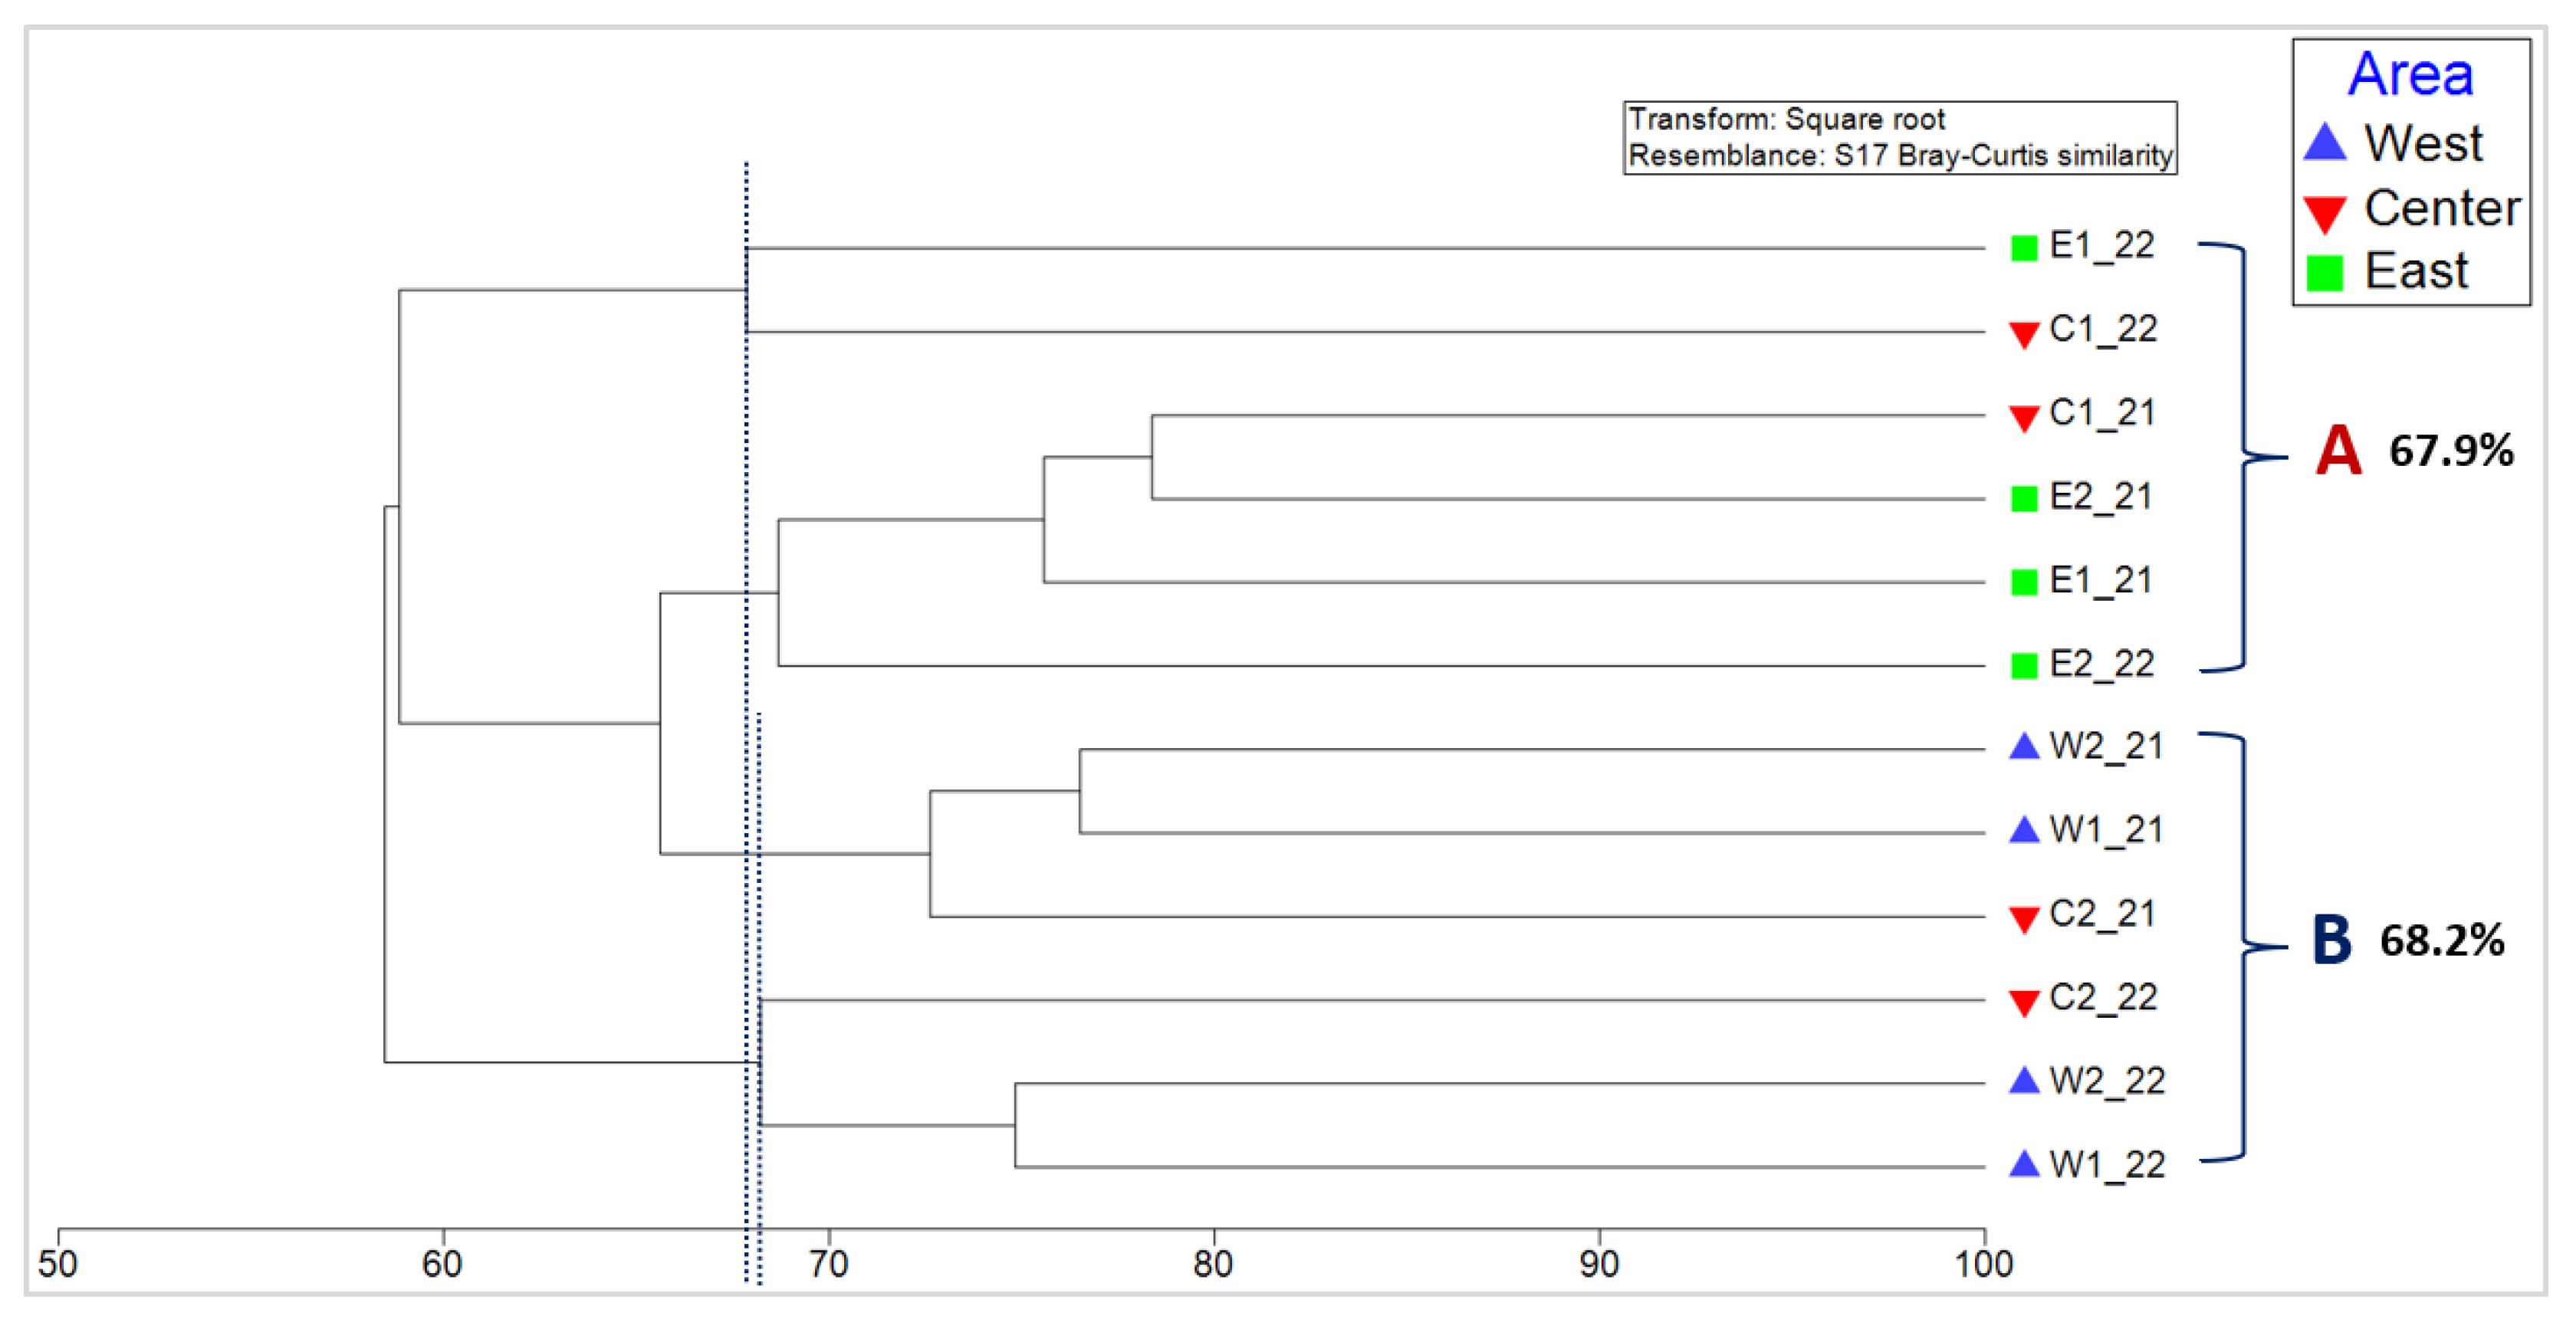
3.3. Analysis of Similarities

Data projection using Metric Multidimensional Scaling (mMDS) was used to visualize both abundance and biomass (Figure 4) in relation to sampling areas and surveys.
Metric Multidimensional Scaling provided a spatial representation of the abundance and exhibited the presence of three groups (Figure 4). The mMDS further indicated that the central group was closer to the eastern group compared to the western and that the eastern and western groups were the furthest apart.
Linear Discriminant Analysis (Figure 5) was further employed as a dimensionality-reduction technique to identify area separability with a classification accuracy of 65.6%. A high degree of overlap between all areas was indicated, with a high degree of overlap between the eastern and central areas and a lower degree of overlap of the western area. The main contributing factor to the extent of overlap among sampling areas was the recorded biomass, and numerical abundance was secondary.
PERMANOVA evidenced no significant differences in the demersal communities between sampling areas, with higher differences observed between the west and east and the lowest differences between the east and center.
Hierarchical clustering based on the Bray–Curtis similarity index of the biomass (Figure 6) indicated the presence of two main groups: group A in the eastern part of the gulf (with 67.9% similarity) and group B in the western part of the gulf (with 68.2% similarity). PERMANOVA further indicated a significant difference in the demersal communities among the identified east and west groups.
The similarity percentage program SIMPER was employed as a multivariate analytical technique to identify the most important species contributing to the observed differences in community composition among the groups. The top-ranked species responsible for the observed dissimilarities in numerical abundance between the eastern (group A) and western (group B) groups, their average abundances, and their contributions are shown in Table 3.
The top-ranked species responsible for the observed dissimilarities in biomass among the western and eastern groups, their average biomasses, and their contributions are shown in Table 4.
A higher average dissimilarity between east and west was exhibited in the numerical abundance (55.42 dissimilarity %) compared to the biomass (43.01%).

3.4. Diversity Indices

Individual univariate diversity indices were employed to compare the sampling areas and identified groups (groups A and B). The species number was higher in the western group, and the numerical abundance was higher in the eastern group. Univariate diversity indices (species richness, Shannon diversity, and Simpson index) exhibited higher values in the western group except for Pielou’s evenness index, which was higher in the eastern group (Table 5).
No significant difference in any of the indices was indicated between areas (west, center, and east) or groups (east and west) (p > 0.05).

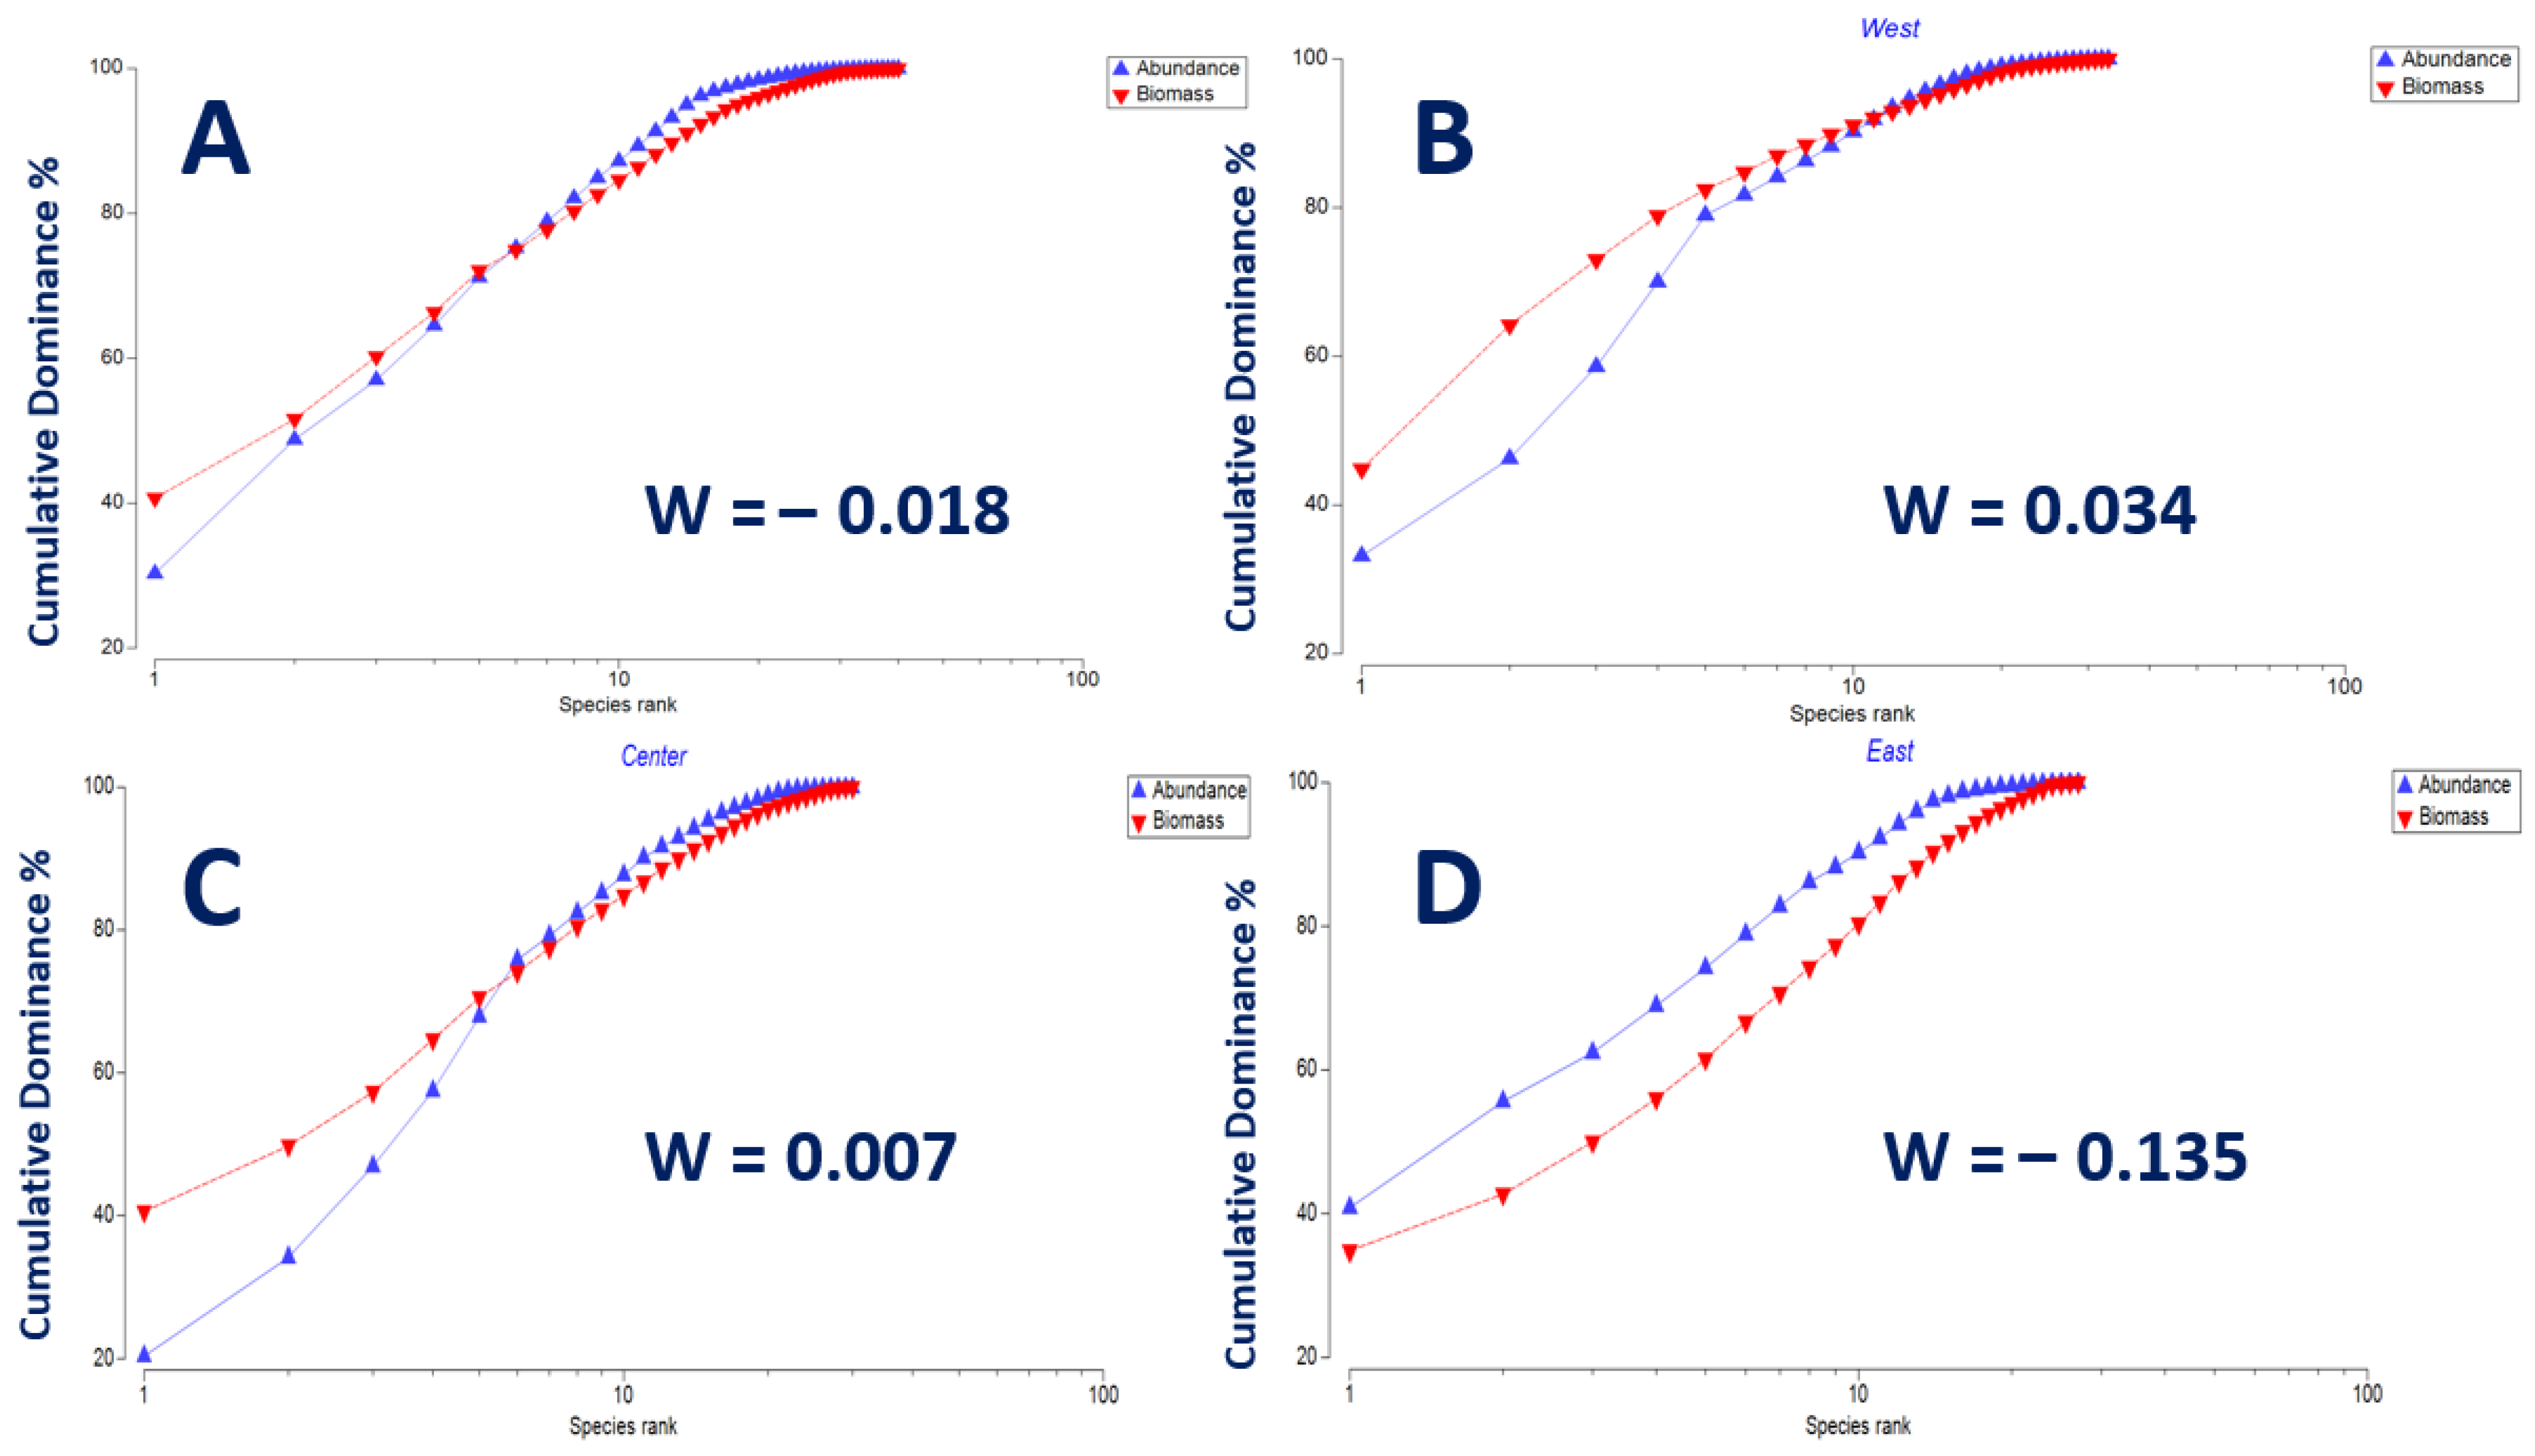
3.5. Ecological Condition

The Abundance/Biomass Comparison (ABC) method was used to determine the levels of disturbance (pollution-induced or otherwise) of community structure (Figure 7). The ABC method involves the plotting of separate k-dominance curves [46] and takes into account the number of species included in the analysis [47]. It has been applied to marine soft-sediment macrobenthic communities in different regions, and in most cases showed the expected changes in response to disturbance [48,49]. The difference between the two curves is given by the W statistic, which represents the area between them. Whilst described in terms of benthic macrofauna, the method is likely to apply much more generally [27].
The ABC plots indicated a gradual increase in disturbance of the demersal communities in the gulf from west to east with the western part of the Pagasitikos Gulf moderately disturbed and an increasing level of disturbance as we progressed toward the eastern part of the gulf (Figure 7). No statistically significant relationship was indicated between the W statistic and water depth using the Pearson correlation coefficient.

4. Discussion

The Mediterranean food webs are characterized by an impoverished state, with communities dominated by small species and the absence of large predators due to over-fishing [50,51], leading to ecosystem shifts. The diversity of species within each trophic level is a type of insurance against the disruption of the ecological functions that species assemblages perform [52]. To effectively assess the ecological state, application of a multidisciplinary approach due to the complexity of ecological systems that are impacted by human activity is suggested.
Ecological assessment of fishery communities can help identify and mitigate the impacts of fishing on the environment and on the people who depend on fisheries for their livelihoods. One of the main goals of scientific fishery-independent surveys is to provide information about status of and trends in fish populations [53]. They assume that repeating the same sampling effort over time will lead to the observation of the same proportion of the population [54]. Surveys are also important because they provide indicators for establishing the ecological health of ecosystems [55]. The ecological assessment of the Pagasitikos Gulf indicated a disturbed demersal community, with the eastern part exhibiting a higher level of disturbance compared to the western part.
Species environmental preferences depend on a plethora of biotic and abiotic parameters, namely prey abundance, predator avoidance, temperature, salinity, depth, and bottom substrate [56,57,58], with important implications for fishery management. The geographical distribution of a species can further depend on the population density and may exhibit considerable annual variation [59,60]; in addition, fish density may vary within a specified area due to the occurrence of gradients in oceanographic parameters [53]. It is well known that natural environmental variables act jointly with anthropogenic ones and that it is difficult to dissociate the different sources of stress on fished communities. Although local hydrological processes cannot be excluded, the observed differences in species composition indicate effects of fishing rather than environmental processes. A decrease in the largest species in exploited fishing grounds supports the hypothesis that fishing is the major factor shaping fish communities [61]. This is a crucial point from a strictly management point of view since fishing effort is the only parameter that can be regulated.
Numerical abundance was higher in the central area, followed by the eastern and western areas; there was an opposing trend exhibited for the biomass, which was highest in the west, followed by the center and east. The most abundant species in the west, with more than 56% of the total abundance, were P. bogaraveo and T. mediterraneus. P. bogaraveo and P. longirostris were the most abundant species in the center and east, with more than 51% and 66% of the total abundance, respectively. The highest biomass in the west, with more than 74% of the total biomass, was exhibited by P. bogaraveo and P. erythrinus. P. bogaraveo exhibited the highest biomass in the center, with more than 56% of the total biomass. P. bogaraveo, M. barbatus, P. longirostris, and I. coindetii exhibited the highest biomass in the east, with more than 65% of the total biomass.
An important and worrisome preliminary finding of the present study was the absence of the Norway lobster (Nephrops norvegicus), an overexploited and important commercial resource in the study area [62,63]. According to [64], Nephrops density was estimated at 0.64 individuals m−2 in May in the Pagasitikos Gulf. Past surveys between 2008 and 2014 indicated the highest Nephrops biomass in the eastern part, the location of its most important fishing area in the gulf, and a gradual reduction in the biomass from east to west [62].
Ecological indices for the assessment of species association and niche overlap among sampling areas, namely Levins’ niche breadth index, Schoener’s index of spatial niche overlap, the Petraitis index of niche breadth, Pianka’s niche overlap index, the Czekanowski niche overlap index, and Morisita’s overlap index, indicated a lower ecological overlap between the west and east, especially when using numerical abundance data. Furthermore, most univariate diversity indices and the species richness exhibited higher values in the west compared to the east except for Pielou’s evenness index, which was higher in the east.
Data projection using Metric Multidimensional Scaling (mMDS) to visualize both abundance and biomass in relation to sampling areas indicated that the central group exhibited a higher degree of similarity with the eastern group and a lower degree with the western group. Additionally, the east and west groups were the furthest apart and exhibited the most dissimilarity. Linear Discriminant Analysis further demonstrated the divergence between the eastern and western groups. Hierarchical clustering indicated the presence of two main groups: one in the east and a second in the west. The presence of the two main groups was further indicated by PERMANOVA, which exhibited a significant difference in the demersal communities among the identified east–west groups.
The Abundance/Biomass Comparison (ABC) method used to determine the levels of disturbance of community structure indicated a gradual increase in disturbance of the demersal communities from west to east, with the western area moderately disturbed and an increasing level of disturbance toward the eastern part of the gulf. In undisturbed systems with high evenness and several large-bodied species, the biomass curve will fall well above that for abundance, with the reverse being true for heavily disturbed situations dominated by high numbers of small species [65].
In undisturbed communities, the biomass is dominated by one or a few large species (K-selected (conservative) species), leading to an elevated biomass curve. Each of these species is represented by rather few individuals, so they do not dominate the abundance curve. Thus, the k-dominance curve for biomass lies above the curve for abundance for its entire length. Under moderate pollution (or disturbance), the large competitive dominants are eliminated, and the inequality in size between the numerical and biomass dominants is reduced so that the biomass and abundance curves are closely coincident and may cross each other one or more times [27]. As disturbance becomes more severe, conservative species are less favored in comparison with smaller r-selected (opportunistic) species, and benthic communities become increasingly dominated by one or a few opportunistic species that, while they dominate the numbers, do not dominate the biomass because they are small bodied. It has been suggested that wherever high-level predators have been extirpated, ecosystems have consequently become degraded and simplified [66].
In certain circumstances, the ABC method has been deemed not to “work” because a false impression of disturbance has been given by the occurrence of large numbers of small individuals (usually of only one or a very few species) in apparently unperturbed situations [67]. This problem with the method is due to the overdependence of the elevation of the curves on the dominance of the first-ranked species and can be mitigated by the use of “partial dominance” curves [68]. The ABC method is not necessarily more sensitive than diversity indices at detecting disturbance and is certainly less sensitive than multivariate methods in discriminating differences in community structure [69]. It does, however, have the advantage of providing an absolute rather than a comparative measure of disturbance [70].
It is therefore evident that the eastern area of the gulf exhibits signals of higher anthropogenic impact due to higher fishing pressure because this part of the gulf is more heavily fished by small-scale purse seiner fishermen and sport fishermen. The lower fishing pressure in the west is attributed to the proximity of a military airport in the western part of the gulf, where a fishing ban has been implemented in an area spanning approximately one third of the gulf [71].
One disadvantage of fish quantitative sampling is that equal representation of all the species in the community is difficult [72]. In addition, overall catching efficiency of the fishing gear is often unknown, as are the differing abilities of species to evade capture. Considering the economic value of Pagasitikos to the fishing community, the necessity of a management system becomes evident. Such a system will constitute an essential tool in guiding marine resources management and will form an early warning system of potentially harmful ecological events, helping in the formulation of cost-effective preventive and remedial measures. Predicting the behavior of the marine environment and understanding its variability is an essential part of the management of marine resources.

5. Conclusions

An ecological assessment was conducted in the Pagasitikos Gulf, a semi-enclosed, trawl-restricted gulf in central Greece exhibiting declining fishery landings. The assessment was carried out through a fishery-independent survey with a commercial bottom otter trawl. The results indicated that demersal communities are moderately disturbed, with an increasing level of disturbance exhibited from east to west that was attributed to higher fishing pressure in the eastern part of the gulf. Additional fishery-management measures are deemed necessary to protect the fisheries’ resources, mitigate potential overexploitation, and ensure the long-term viability of both the marine ecosystem and the livelihoods of the local fishery community.

Author Contributions

Conceptualization, D.K. (Dimitris Klaoudatos), A.C. and D.V.; methodology, D.K. (Dimitris Klaoudatos) and A.C.; software, D.K. (Dimitris Klaoudatos); validation, A.L., N.N. and A.C.; formal analysis, D.K. (Dimitris Klaoudatos), S.V. and A.C.; investigation, D.K. (Dimitris Klaoudatos), C.A., A.L., N.N., G.A.G., J.S., K.R., A.E. and D.V.; resources, C.A. and D.K. (Dimitris Klaoudatos); data curation, S.V., A.L., N.N. and A.C.; writing—original draft preparation, D.K. (Dimitris Klaoudatos), S.V. and A.C.; writing—review and editing, D.K. (Dimitris Klaoudatos), S.V., C.A., A.L., N.N., A.C., G.A.G., J.S., K.R., A.E. and D.V.; visualization, D.K. (Dimitris Klaoudatos) and A.C.; supervision, D.K. (Dimitris Klaoudatos), C.A. and D.V.; project administration, D.K. (Dimitris Klaoudatos), D.K. (Dorothea Kolindrini) and D.V.; funding acquisition, D.K. (Dorothea Kolindrini) and D.V. All authors have read and agreed to the published version of the manuscript.

Funding

This work was supported by the regional government of Magnesia and the Sporades Islands (KA2014EP51700026 sub-project 67).

Institutional Review Board Statement

Not applicable.

Informed Consent Statement

Not applicable.

Data Availability Statement

The datasets analyzed in the current study are available from the corresponding author upon reasonable request.

Conflicts of Interest

The authors declare no conflict of interest. The funders had no role in the design of the study; in the collection, analyses, or interpretation of data; in the writing of the manuscript; or in the decision to publish the results.

References

  1. Beaumont, N.J.; Austen, M.C.; Mangi, S.C.; Townsend, M. Economic Valuation for the Conservation of Marine Biodiversity. Mar. Pollut. Bull. 2008, 56, 386–396. [Google Scholar] [CrossRef] [PubMed]
  2. Matthiessen, P.; Law, R.J. Contaminants and Their Effects on Estuarine and Coastal Organisms in the United Kingdom in the Late Twentieth Century. Environ. Pollut. 2002, 120, 739–757. [Google Scholar] [CrossRef]
  3. Lotze, H.K.; Reise, K.; Worm, B.; van Beusekom, J.; Busch, M.; Ehlers, A.; Heinrich, D.; Hoffmann, R.C.; Holm, P.; Jensen, C. Human Transformations of the Wadden Sea Ecosystem through Time: A Synthesis. Helgol. Mar. Res. 2005, 59, 84–95. [Google Scholar] [CrossRef]
  4. McCauley, D.J.; Pinsky, M.L.; Palumbi, S.R.; Estes, J.A.; Joyce, F.H.; Warner, R.R. Marine Defaunation: Animal Loss in the Global Ocean. Science 2015, 347, 1255641. [Google Scholar] [CrossRef] [PubMed]
  5. Froese, R.; Winker, H.; Coro, G.; Demirel, N.; Tsikliras, A.C.; Dimarchopoulou, D.; Scarcella, G.; Quaas, M.; Matz-Lück, N. Status and Rebuilding of European Fisheries. Mar. Policy 2018, 93, 159–170. [Google Scholar] [CrossRef]
  6. Prato, G.; Guidetti, P.; Bartolini, F.; Mangialajo, L.; Francour, P. The Importance of High-Level Predators in Marine Protected Area Management: Consequences of Their Decline and Their Potential Recovery in the Mediterranean Context. Adv. Oceanogr. Limnol. 2013, 4, 176–193. [Google Scholar] [CrossRef]
  7. Statistics—ELSTAT. Available online: https://www.statistics.gr/en/statistics/-/publication/SPA03/ (accessed on 10 February 2023).
  8. Directorate General of Fisheries, Hellenic Ministry of Rural Development. Annual Fleet Report 2022. Available online: http://www.alieia.minagric.gr/node/8 (accessed on 10 July 2023).
  9. Moutopoulos, D.K.; Koutsikopoulos, C. Fishing Strange Data in National Fisheries Statistics of Greece. Mar. Policy 2014, 48, 114–122. [Google Scholar] [CrossRef]
  10. Stathopoulou, E.; Apostologamvrou, C.; Vafidis, D.; Mente, E.; Berillis, P.; Katselis, G. Sex Differentiation in the Histology of the Digestive Gland of Nephrops Norvegicus from Pagasitikos Gulf during Spring. Aquat. Living Resour. 2017, 30, 28. [Google Scholar] [CrossRef]
  11. Jennings, S.; Kaiser, M.J. The Effects of Fishing on Marine Ecosystems. In Advances in Marine Biology; Blaxter, J.H.S., Southward, A.J., Tyler, P.A., Eds.; Academic Press: Cambridge, MA, USA, 1998; Volume 34, pp. 201–352. [Google Scholar] [CrossRef]
  12. Rogers, S.I.; Maxwell, D.; Rijnsdorp, A.D.; Damm, U.; Vanhee, W. Fishing Effects in Northeast Atlantic Shelf Seas: Patterns in Fishing Effort, Diversity and Community Structure. IV. Can Comparisons of Species Diversity Be Used to Assess Human Impacts on Demersal Fish Faunas? Fish. Res. 1999, 40, 135–152. [Google Scholar] [CrossRef]
  13. Petihakis, G.; Triantafyllou, G.; Pollani, A.; Koliou, A.; Theodorou, A. Field Data Analysis and Application of a Complex Water Column Biogeochemical Model in Different Areas of a Semi-Enclosed Basin: Towards the Development of an Ecosystem Management Tool. Mar. Environ. Res. 2005, 59, 493–518. [Google Scholar] [CrossRef]
  14. Perissoratis, C.; Zacharaki, P.; Andrianopoulos, A. Sedimentology of Surface Sediments of Pagasitikos Gulf and Trikeri Strait w. Aegean Sea, Greece. Thalassographica 1990, 13, 35–45. [Google Scholar]
  15. Petihakis, G.; Triantafyllou, G.; Korres, G.; Tsiaras, K.; Theodorou, A. Ecosystem Modelling: Towards the Development of a Management Tool for a Marine Coastal System Part-II, Ecosystem Processes and Biogeochemical Fluxes. J. Mar. Syst. 2012, 94, S49–S64. [Google Scholar] [CrossRef]
  16. Petihakis, G.; Triantafyllou, G.; Korres, G.; Pollani, A.; Theodorou, A. Ecosystem Modeling: Towards the Development of a Management Tool for a Marine Coastal System. Part I: General Circulation, Hydrological and Dynamical Structure. J. Mar. Syst. 2012, 94, S34–S48. [Google Scholar] [CrossRef]
  17. Maravelias, C.D. Factors Affecting Purse Seine Catches: An Observer-Based Analysis. Mediterr. Mar. Sci. 2006, 7, 27–40. [Google Scholar]
  18. Caragitsou, E.; Siapatis, A.; Anastasopoulou, A. Seasonal Structure of Fish Larvae Assemblages in the Pagasitikos Gulf (Greece). Rapp. Comm. Int. Mer Mediterr. 2001, 36, 250. [Google Scholar]
  19. Dimarchopoulou, D.; Keramidas, I.; Tsagarakis, K.; Tsikliras, A.C. Ecosystem Models and Effort Simulations of an Untrawled Gulf in the Central Aegean Sea. Front. Mar. Sci. 2019, 6, 648. [Google Scholar] [CrossRef]
  20. Papaconstantinou, C.; Zenetos, A.; Vassilopoulou, V.; Tserpes, G. SoHelFI. In State of Hellenic Fisheries; HCMR: Gournes, Greece, 2007; p. 466. [Google Scholar]
  21. Underwood, A.J. Experiments in Ecology: Their Logical Design and Interpretation Using Analysis of Variance; Cambridge University Press: Cambridge, UK, 1997. [Google Scholar]
  22. Krishnamoorthy, K.; Lu, F.; Mathew, T. A Parametric Bootstrap Approach for ANOVA with Unequal Variances: Fixed and Random Models. Comput. Stat. Data Anal. 2007, 51, 5731–5742. [Google Scholar] [CrossRef]
  23. Şahin, M.; Aybek, E. Jamovi: An Easy to Use Statistical Software for the Social Scientists. Int. J. Assess. Tools Educ. 2019, 6, 670–692. [Google Scholar] [CrossRef]
  24. Rutherford, A. Introducing ANOVA and ANCOVA: A GLM Approach; SAGE: Thousand Oaks, CA, USA, 2001; ISBN 9780761951612. [Google Scholar]
  25. Demsar, J.; Curk, T.; Erjavec, A.; Gorup, C.; Hocevar, T.; Milutinovic, M.; Mozina, M.; Polajnar, M.; Toplak, M.; Staric, A.; et al. Orange: Data Mining Toolbox in Python. J. Mach. Learn. Res. 2013, 14, 2349–2353. [Google Scholar]
  26. Sneath, P.H.; Sokal, R.R. Numerical Taxonomy. The Principles and Practice of Numerical Classification; W.H. Freeman and Company: San Francisco, CA, USA, 1973. [Google Scholar]
  27. Clarke, K.R.; Gorley, R.; Sommerfield, P.J.; Warwick, R.M. Change in Marine Communities—Statistical Analysis; PRIMER-E Ltd.: Plymouth, UK, 2014. [Google Scholar]
  28. Bray, J.R.; Curtis, J.T. An Ordination of the Upland Forest Communities of Southern Wisconsin. Ecol. Monogr. 1957, 27, 326–349. [Google Scholar] [CrossRef]
  29. Scholkopft, B.; Mullert, K.-R. Fisher Discriminant Analysis with Kernels. In Proceedings of the Neural Networks for Signal Processing IX Society Workshop (Cat. No.98TH8468), Madison, WI, USA, 25 August 1999. [Google Scholar]
  30. Clarke, K.R. Non-parametric Multivariate Analyses of Changes in Community Structure. Aust. J. Ecol. 1993, 18, 117–143. [Google Scholar] [CrossRef]
  31. Shannon, C.E.; Weaver, W. The Mathematical Theory of Communication; Urbana University: Urbana, OH, USA, 1949. [Google Scholar]
  32. Margalef, D.R. Information Theory in Ecology. Gen. Syst. Yearb. 1958, 3, 36–71. [Google Scholar]
  33. Pielou, E.C. Mathematical Ecology; Wiley: Hoboken, NJ, USA, 1977. [Google Scholar]
  34. Warwick, R.M. A New Method for Detecting Pollution Effects on Marine Macrobenthic Communities. Mar. Biol. 1986, 92, 557–562. [Google Scholar] [CrossRef]
  35. Feinsinger, P.; Spears, E.E.; Poole, R.W. A Simple Measure of Niche Breadth. Ecology 1981, 62, 27–32. [Google Scholar] [CrossRef]
  36. Ludwig, J.A.; Reynolds, J.F. Statistical Ecology: A Primer in Methods and Computing; John Wiley & Sons: Hoboken, NJ, USA, 1988; Volume 1, ISBN 0471832359. [Google Scholar]
  37. MacArthur, R.; Levins, R. The Limiting Similarity, Convergence, and Divergence of Coexisting Species. Am. Nat. 1967, 101, 377–385. [Google Scholar] [CrossRef]
  38. Schoener, T.W. The Anolis Lizards of Bimini: Resource Partitioning in a Complex Fauna. Ecology 1968, 49, 704–726. [Google Scholar] [CrossRef]
  39. Petraitis, P.S. Likelihood Measures of Niche Breadth and Overlap. Ecology 1979, 60, 703–710. [Google Scholar] [CrossRef]
  40. Pianka, E.R. The Structure of Lizard Communities. Annu. Rev. Ecol. Syst. 1973, 4, 53–74. [Google Scholar] [CrossRef]
  41. Winemiller, K.O.; Pianka, E.R. Organization in Natural Assemblages of Desert Lizards and Tropical Fishes. Ecol. Monogr. 1990, 60, 27–55. [Google Scholar] [CrossRef]
  42. Morisita, M. Measuring of Interspecific Association and Similarity between Assemblages. Mem. Fac. Sci. Kyushu Univ. Ser. E Biol. 1959, 3, 65–80. [Google Scholar]
  43. Garratt, M.W.; Steinhorst, R.K. Testing for Significance of Morisita’s, Horn’s and Related Measures of Overlap. Am. Midl. Nat. 1976, 96, 245–251. [Google Scholar] [CrossRef]
  44. R Core Team. R: A Language and Environment for Statistical Computing; R Foundation for Statistical Computing: Vienna, Austria, 2021. [Google Scholar]
  45. Zhang, J.L.; Ma, K.P. Spaa: An R Package for Computing Species Association and Niche Overlap. Res. Prog. Biodivers. Conserv. China 2014, 10, 165–174. [Google Scholar]
  46. Lambshead, P.J.D.; Platt, H.M.; Shawj, K.M. The Detection of Differences among Assemblages of Marine Benthic Species Based on an Assessment of Dominance and Diversity. J. Nat. Hist. 1983, 17, 859–874. [Google Scholar] [CrossRef]
  47. Warwick, R.M.; Clarke, K.R. Relearning the ABC: Taxonomic Changes and Abundance/Biomass Relationships in Disturbed Benthic Communities. Mar. Biol. 1994, 118, 739–744. [Google Scholar] [CrossRef]
  48. Warwick, R.M.; Pearson, T.H. Ruswahyuni Detection of Pollution Effects on Marine Macrobenthos: Further Evaluation of the Species Abundance/Biomass Method. Mar. Biol. 1987, 95, 193–200. [Google Scholar] [CrossRef]
  49. Agard, J.B.R.; Gobin, J.; Warwick, R.M. Analysis of Marine Macrobenthic Community Structure in Relation to Pollution, Natural Oil Seepage and Seasonal Disturbance in a Tropical Environment (Trinidad, West Indies). Mar. Ecol. Prog. Ser. 1993, 92, 233–243. [Google Scholar] [CrossRef]
  50. Jackson, J.B.C.; Kirby, M.X.; Berger, W.H.; Bjorndal, K.A.; Botsford, L.W.; Bourque, B.J.; Bradbury, R.H.; Cooke, R.; Erlandson, J.; Estes, J.A. Historical Overfishing and the Recent Collapse of Coastal Ecosystems. Science 2001, 293, 629–637. [Google Scholar] [CrossRef]
  51. Shurin, J.B.; Borer, E.T.; Seabloom, E.W.; Anderson, K.; Blanchette, C.A.; Broitman, B.; Cooper, S.D.; Halpern, B.S. A Cross-ecosystem Comparison of the Strength of Trophic Cascades. Ecol. Lett. 2002, 5, 785–791. [Google Scholar] [CrossRef]
  52. Hughes, T.P.; Baird, A.H.; Bellwood, D.R.; Card, M.; Connolly, S.R.; Folke, C.; Grosberg, R.; Hoegh-Guldberg, O.; Jackson, J.B.C.; Kleypas, J. Climate Change, Human Impacts, and the Resilience of Coral Reefs. Science 2003, 301, 929–933. [Google Scholar] [CrossRef]
  53. Gunderson, D.R. Surveys of Fisheries Resources; John Wiley: Hoboken, NJ, USA, 1993. [Google Scholar]
  54. Schwarz, C.J.; Seber, G.A.F. Estimating Animal Abundance: Review III. Stat. Sci. 1999, 14, 427–456. [Google Scholar] [CrossRef]
  55. Nicholson, M.D.; Jennings, S. Testing Candidate Indicators to Support Ecosystem-Based Management: The Power of Monitoring Surveys to Detect Temporal Trends in Fish Community Metrics. ICES J. Mar. Sci. 2004, 61, 35–42. [Google Scholar] [CrossRef]
  56. Smith, C.J.; Papadopoulou, K.N.; Diliberto, S. Impact of Otter Trawling on an Eastern Mediterranean Commercial Trawl Fishing Ground. ICES J. Mar. Sci. 2000, 57, 1340–1351. [Google Scholar] [CrossRef]
  57. Rose, G.A.; Leggett, W.C. Interactive Effects of Geophysically-Forced Sea Temperatures and Prey Abundance on Mesoscale Coastal Distributions of a Marine Predator, Atlantic Cod (Gadus morhua). Can. J. Fish. Aquat. Sci. 1989, 46, 1904–1913. [Google Scholar] [CrossRef]
  58. Swain, D.P. Age- and Density-Dependent Bathymetric Pattern of Atlantic Cod (Gadus morhua) in the Southern Gulf of St Lawrence. Can. J. Fish. Aquat. Sci. 1993, 50, 1255–1264. [Google Scholar] [CrossRef]
  59. MacCall, A.D. Dynamic Geography of Marine Fish Populations; Washington Sea Grant Program: Seattle, WA, USA, 1990. [Google Scholar]
  60. Swain, D.P.; Wade, E.J. Density-Dependent Geographic Distribution of Atlantic Cod (Gadus morhua) in the Southern Gulf of St. Lawrence. Can. J. Fish. Aquat. Sci. 1993, 50, 725–733. [Google Scholar] [CrossRef]
  61. Daan, N. Introduction: Changes in the North Sea Ecosystem and Their Causes: Århus 1975 Revisted. ICES J. Mar. Sci. 1996, 53, 879–883. [Google Scholar] [CrossRef]
  62. Lolas, A.; Vafidis, D. Population Dynamics, Fishery, and Exploitation Status of Norway Lobster (Nephrops norvegicus) in Eastern Mediterranean. Water 2021, 13, 289. [Google Scholar] [CrossRef]
  63. Gkafas, G.A.; Hatziioannou, M.; Malandrakis, E.E.; Tsigenopoulos, C.S.; Karapanagiotidis, I.T.; Mente, E.; Vafidis, D.; Exadactylos, A. Heterozygosity Fitness Correlations and Generation Interval of the Norway Lobster in the Aegean Sea, Eastern Mediterranean. J. Biol. Res. 2019, 26, 14. [Google Scholar] [CrossRef]
  64. Smith, C.J.; Papadopoulou, K.N. Burrow Density and Stock Size Fluctuations of Nephrops Norvegicus in a Semi-Enclosed Bay. ICES J. Mar. Sci. 2003, 60, 798–805. [Google Scholar] [CrossRef]
  65. Adams, S.M. Biological Indicators of Aquatic Ecosystem Stress; American Fisheries Society: Bethesda, MD, USA, 2002. [Google Scholar]
  66. Noss, R.F.; Dinerstein, E.; Gilbert, B.; Gilpin, M.; Miller, B.J.; Terborgh, J.; Trombuk, S. Continental Conservation: Scientific Foundations of Regional Reserve Networks; Island Press: Washington, DC, USA, 1999. [Google Scholar]
  67. Beukema, J.J. An Evaluation of the ABC-Method (Abundance/Biomass Comparison) as Applied to Macrozoobenthic Communities Living on Tidal Flats in the Dutch Wadden Sea. Mar. Biol. 1988, 99, 425–433. [Google Scholar] [CrossRef]
  68. Clarke, K.R. Comparisons of Dominance Curves. J. Exp. Mar. Biol. Ecol. 1990, 138, 143–157. [Google Scholar] [CrossRef]
  69. Warwick, R.M.; Clarke, K.R. A Comparison of Some Methods for Analysing Changes in Benthic Community Structure. J. Mar. Biol. Assoc. U. K. 1991, 71, 225–244. [Google Scholar] [CrossRef]
  70. Warwick, R.M. Environmental Impact Studies on Marine Communities: Pragmatical Considerations. Aust. J. Ecol. 1993, 18, 63–80. [Google Scholar] [CrossRef]
  71. Klaoudatos, D.; Tziantziou, L.; Lolas, A.; Neofitou, N.; Vafidis, D. Population Characteristics of the Upper Infralittoral Sea Urchin Arbacia Lixula (Linnaeus, 1758) in Eastern Mediterranean (Central Greece): An Indicator Species for Coastal Water Quality. J. Mar. Sci. Eng. 2022, 10, 395. [Google Scholar] [CrossRef]
  72. Conides, A.; Klaoudatos, D.; Kalamaras, M.; Neophytou, N.; Exadaktylos, A.; Papaconstantinou, C.; Klaoudatos, S. Capture Fisheries and Aquaculture Exploitation in the Aegean Sea Archipelago; Springer: Berlin/Heidelberg, Germany, 2020; pp. 1–26. [Google Scholar]
Figure 1. Map of Pagasitikos Gulf indicating the sampling areas (W, west; C, center; E, east).
Jmse 11 01668 g001
Figure 2. Main effect plots of the (A) abundance and (B) biomass between sampling areas (dotted lines indicate mean values).
Jmse 11 01668 g002
Figure 3. Comparative boxplots of ecological indices of species association and niche overlap from abundance and biomass data for each comparison among areas (EC: east–center; WC: west–center; WE: west–east). Values are means (squares), medians (lines), standard deviation (interquartile range box), minimal and maximal value (whiskers), and outliers (dots).
Jmse 11 01668 g003
Figure 4. Metric Multidimensional Scaling (mMDS) of normalized data using the Euclidean distance matrix (each point represents abundance and biomass for one species; a larger-diameter circle indicates a greater depth).
Jmse 11 01668 g004
Figure 5. Linear Discriminant Analysis between sampling areas.
Jmse 11 01668 g005
Figure 6. Dendrogram for hierarchical clustering of square-root-transformed faunal biomass using group-average clustering of Bray–Curtis similarities.
Jmse 11 01668 g006
Figure 7. ABC plots of the entire area (A) and each of the sub-areas sampled: west (B), center (C), and east (D). The W statistic indicates the difference between the curves.
Jmse 11 01668 g007
Table 1. Abundance and biomass (%) of major taxa at each sampling site comprising more than 85% of the total abundance (O: Osteichthyes; Ce: Cephalopods; Cr: Crustacea).
SpeciesSampling Area
AbundancePhylumWestCenterEast
Pagellus bogaraveoO40.2535.7715.92
Parapenaeus longirostrisCr 15.3750.65
Trachurus mediterraneusO16.6014.218.10
Mullus barbatusO15.3811.876.82
Pagellus erythrinusO15.284.54
Illex coindetiiCe 4.145.75
Cumulative abundance (%) 87.5185.9087.24
Biomass
Pagellus bogaraveoO53.8556.4837.26
Pagellus erythrinusO21.077.95
Merluccius merlucciusO 7.065.69
Mullus barbatusO9.068.829.79
Trachurus mediterraneusO6.286.906.81
Parapenaeus longirostrisCr 9.13
Illex coindetiiCe 9.04
Trigla lucernaO 4.08
Arnoglossus laternaO 3.09
Trisopterus minutus capelanusO 2.72
Cumulative biomass (%) 90.2687.2187.61
Table 2. Ecological indices for the assessment of species association and niche overlap among sampling areas (Levins’ niche breadth index, Schoener’s D index, the Petraitis index of niche breadth, Pianka’s niche overlap index, the Czekanowski niche overlap index, and Morisita’s overlap index) based on biomass and abundance data.
Biomass Abundance
CenterEast CenterEast
LevinsWest0.0830.071LevinsWest0.6390.453
Center 0.862 Center 0.992
SchoenerWest0.7860.692SchoenerWest0.6440.493
Center 0.793 Center 0.634
PetraitisWest0.8350.747PetraitisWest0.7470.785
Center 0.884 Center 0.795
PiankaWest0.9540.919PiankaWest0.7860.407
Center 0.978 Center 0.724
CzechWest0.7860.692CzechWest0.6450.493
Center 0.793 Center 0.634
MorisitaWest0.9460.889MorisitaWest0.7690.404
Center 0.97 Center 0.689
Table 3. Top-ranked species responsible for the observed dissimilarities between groups and their average abundances (numbers/h trawling), individual contributions (%), and cumulative contributions to the average similarity.
West GroupEast GroupAverage Dissimilarity: 55.42
SpeciesAverage AbundanceAverage AbundanceContribution %Cumulative Contribution%
Parapenaeus longirostris89.692001.3231.5931.59
Pagellus bogaraveo1560.55914.1711.0342.62
Trigla lucerna570.97327.568.2650.87
Engraulis encrasicolus27.78448.727.6658.53
Pagellus erythrinus513.09115.246.7665.29
Trachurus mediterraneus633.99438.684.2269.52
Mullus barbatus555.58384.933.9473.45
Table 4. Top-ranked species responsible for the observed dissimilarities within sample groups and their average biomasses (kg/h trawling), individual contributions (%), and cumulative contributions to the average similarity.
West GroupEast GroupAverage Dissimilarity: 43.01
SpeciesAverage BiomassAverage BiomassContribution %Cumulative Contribution%
Pagellus bogaraveo177.17109.7125.2425.24
Pagellus erythrinus63.4813.3816.1241.37
Mullus barbatus36.5224.375.6747.04
Merluccius merluccius15.3425.355.2152.25
Parapenaeus longirostris0.7215.424.9557.20
Trachurus mediterraneus25.6417.413.8661.06
Raja montagui5.848.223.3064.36
Trigla lucerna11.488.493.2367.6
Illex coindetii5.1314.703.1370.73
Table 5. Species number, numerical abundance, species richness (d), evenness (J), and diversity index (H′) for each sampling.
GroupSpecies NumberNumerical AbundanceSpecies Richness Margalef (d)Evenness (J)Shannon Diversity Index (H′)Simpson 1-Lambda’
A (East)3336363.2930.72532.4180.877
B (West)4130034.4960.70542.5470.879
Disclaimer/Publisher’s Note: The statements, opinions and data contained in all publications are solely those of the individual author(s) and contributor(s) and not of MDPI and/or the editor(s). MDPI and/or the editor(s) disclaim responsibility for any injury to people or property resulting from any ideas, methods, instructions or products referred to in the content.

