Abstract
Floating caissons can oscillate owing to ocean waves when towed to an installation site. To reduce these oscillations, free-surface anti-oscillation tanks mounted on floating caissons have been proposed. However, no coupled numerical model exists between the motion of the floating caisson and fluid flow in the tanks based on computational fluid dynamics (CFD). In this study, a coupled model is developed and compared to existing physical experiments for validation. In the coupled model, the vertical and rotational motion of the floating caisson are computed as a rigid body, and the motion of the free water in the tank is computed using a CFD model. Numerical results show the predictive capability of the coupled model in terms of the rotational motion (pitch) of the floating caisson within ±20% of experimental data, regardless of the absence or presence of water in the tank. The numerical results also show that the fluid flow with complex air–water interface motion in the tank can be analyzed in detail using the coupled model. This suggests that the coupled model developed in this study is a useful tool for quantitatively assessing the effectiveness of an anti-oscillation tank for reducing the pitch of a floating caisson.
1. Introduction
Caissons are large reinforced concrete boxes used in ports and coastal structures such as quay walls and breakwaters. Generally, the construction procedure for such caissons comprises manufacturing, towing, and installation processes. During the towing process, a manufactured caisson floats on the sea and is pulled to the installation site by towboats. During this process, the floating caisson is easily oscillated by waves even under calm wave conditions. To increase the safety and efficiency of the construction procedure, it is important to minimize the oscillations of the floating caisson.
Eguchi et al. [1] proposed installing free-surface anti-oscillation tanks on a floating caisson to reduce the oscillations. The anti-oscillation tank has an elongated rectangular shape and contains sufficient free water. An anti-oscillation tank is a type of tuned liquid damper characterized by a large free surface area in the tank. Nakamura et al. [2] conducted physical experiments using a floating caisson model mounted on the rectangular anti-oscillation tank models. From their experiments, they found that the sloshing of free water in the anti-oscillation tanks could suppress the rotational motion of the caisson model. Dynamic interaction between a floating caisson and free water in anti-oscillation tanks is difficult to solve numerically because of one of the complex fluid–structure interaction (FSI) problems. To address this issue, Kurahara et al. [3] developed a coupled numerical model between the motion of a floating caisson and that of free water in the anti-oscillation tanks using the potential theory. However, they observed that the coupled model tended to overestimate the reduction in the rotational motion of the caisson. Additionally, the coupled model is limited because it cannot be applied to anti-oscillation tanks with complex geometries. Hence, to the best of our knowledge, there is currently no coupled model for a floating caisson mounted with anti-oscillation tanks that can address these issues and serve as a useful tool for quantitatively assessing the effectiveness of the tanks in reducing caisson oscillation.
Contrarily, numerous studies have been conducted on the coupled effects of ship and free water motions in free-surface anti-oscillation tanks. Moaleji and Greig [4] conducted a systematic review regarding the development, characteristics, and basic principles of the different types of anti-oscillation tanks. They pointed out that anti-oscillation tanks can be analyzed as dynamic dampers that affect the natural period and damping of the rotational motion of the ship. Lee and Vassalos [5] conducted physical experiments to investigate the effects of the anti-oscillation tanks on the rotational motions of the ships. Armenio et al. [6,7] and Li et al. [8] independently developed coupled numerical models based on computational fluid dynamics (CFD) for the coupled effects. After Li et al. [8], many studies have been conducted on this topic in recent years (e.g., Huang et al. [9], Taskar et al. [10], Jiang et al. [11], Cercos-Pita et al. [12], Ghamari et al. [13], Saripilli and Sen [14], Bulian and Cercos–Pita [15], Diebold et al. [16], Alujević et al. [17], Lyu et al. [18], Zhuang and Wan [19], Alujević et al. [20], Subramanian et al. [21], Wei et al. [22], Bernal-Colio et al. [23], Liu et al. [24], Yao et al. [25], He et al. [26], Lin et al. [27], Liu et al. [28], Lyu et al. [29], Sun et al. [30], Wen et al. [31], Yu et al. [32], Chen et al. [33], Chen et al. [34], Ge et al. [35], Kapsenberg and Carette [36], Lee et al. [37], Lin et al. [38], and Wang et al. [39]). However, the dynamics of the ships and floating caissons are different. Hence, it is not clear whether the knowledge of the coupled motions of the ships and free water in anti-oscillation tanks can be applied to the coupled motions of a floating caisson and free water in anti-oscillation tanks.
In this study, a coupled numerical model is developed. In the coupled model, the vertical and rotational motions of a floating caisson are computed as a rigid body, and the motion of free water in the free-surface anti-oscillation tank is computed using a CFD model. The predictive capability of the coupled model is demonstrated through a comparison with existing physical experiments [2]. Provided that the validity of the coupled model is verified through this study, it can be a useful tool for quantitatively assessing the effectiveness of anti-oscillation tanks with complex geometries. Section 2 describes the governing equations and computational conditions of the coupled model. Section 3 compares the numerical results computed using the coupled model to the measurement data obtained from the physical experiments. Finally, the conclusions are summarized in Section 4.
2. Coupled Numerical Model
Figure 1 shows a schematic of the floating caisson model mounted with two free-surface anti-oscillation tank models, where L, B, and d are the length and width of the caisson, and caisson draft, respectively. Figure 2 shows the definition of the caisson motion. As shown in Figure 1 and Figure 2, a fixed spatial coordinate system with horizontal x and y-axes and a vertical z-axis was defined, and the origin of the system was set at the initial position of the center of flotation of the caisson (point O in Figure 1 and Figure 2). Regular unidirectional waves were generated in the negative x direction. Two anti-oscillation tanks were placed parallel in a similar direction to the waves at the top of the caisson. This study focused on the rotational motion around the y-axis relative to the center of flotation, pitch , and the vertical motion, heave . The coupled model proposed herein comprises a flow model in the anti-oscillation tank and a motion model of the floating caisson, respectively. Each model and the coupling procedure are explained.
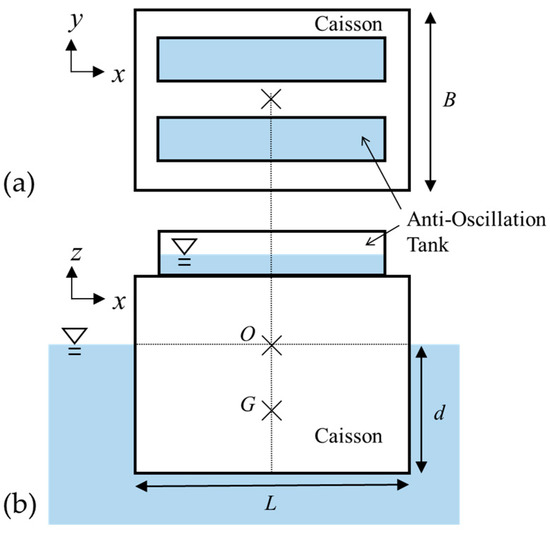
Figure 1.
Floating caisson and anti-oscillation tanks: (a) top view and (b) cross-sectional view.
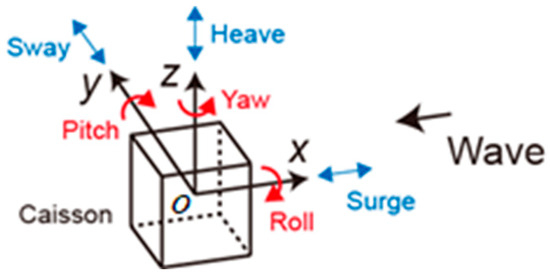
Figure 2.
Definition of the motion of the floating caisson.
2.1. Flow Model in Anti-Oscillation Tank
The fluid flow in the anti-oscillation tank was analyzed using the free open-source CFD software OpenFOAM v2012, released by OpenCFD [40]. Rectangular anti-oscillation tanks were used in the physical experiments [2] for comparison. As such, a rectangular computational domain of Figure 3 was used for the fluid flow. It is noteworthy that only half of the tank was analyzed, assuming the symmetry to reduce the computational cost. In Figure 3, Lt is the total inner length of the tank, Bt the total inner width of the tank, Ht the total inner height, and ht the water depth of the tank, respectively. The tank had a lid. Hence, there was neither inflow nor outflow from the outside. The fluid in the tank was treated as a transient, incompressible, isothermal, two-immiscible-phase (water and air) Newtonian fluid. From visual observation in the physical experiments, the flow in the tank was judged to be turbulent. As a turbulence model, the Smagorinsky model [41] of the large-eddy simulation (LES) was used following Kajishima and Taira [42], who recommend using it for this kind of complex flow. An interFoam solver based on the volume-of-fluid (VOF) method was used to track the complex motion of the air–water interface. The governing equations are expressed as follows:
where and are the grid-scale velocity vector and dynamic pressure of the fluid, respectively, the volume fraction of water (the VOF function; : water; : air; : air–water interface), xi the position vector, t the time, and the density and viscosity of the fluid, respectively, the gravitational acceleration vector, the strain rate tensor, the surface tension coefficient, the local surface curvature, the relative velocity vector used to compress the air–water interface, which includes a user-defined parameter that determines the strength of the compression, and the subscript i and j based on the Einstein summation convention.
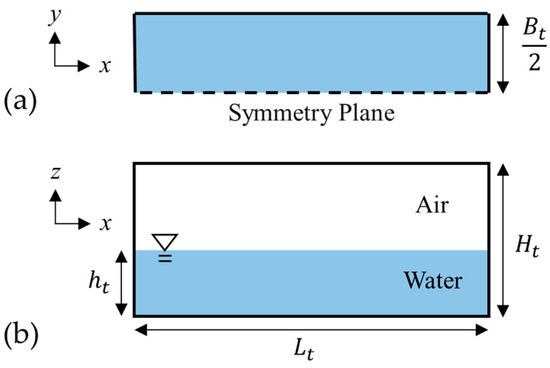
Figure 3.
Computational domain for the fluid flow in the anti-oscillation tank: (a) top view and (b) cross-sectional view.
Parallel computation was performed to further reduce the computational time. Figure 4 shows numerical mesh for the flow model. The cross-section at the front of the figure shows the center cross-section of the tank, which corresponds to the symmetry plane in Figure 3. The mesh spacing was set to 3.0 and 0.8 mm in the horizontal (x and y directions) and vertical directions (z direction), respectively. Additionally, as shown in Figure 4, the mesh near the wall was refined. The pressure-implicit with splitting of operators (PISO) algorithm was used for pressure–velocity coupling. The explicit Euler method was used for the time discretization. The time increment was set at 0.0005 s initially and automatically adjusted to a maximum Courant number of 0.5. A second-order total variation diminishing (TVD) scheme by Van Leer was used to discretize the divergence of the flow velocity and VOF function. Table 1 shows the wall boundary conditions used in the flow model. A no-slip condition was used as the boundary condition for the tank walls to match the flow velocity with the moving velocity of the walls. The wettability of the walls was determined by specifying the contact angle as the wall boundary condition for the VOF function. As shown in Table 2, common values for water and air were used as parameters of the flow model.

Figure 4.
Numerical mesh for the fluid flow in the anti-oscillation tank.

Table 1.
Wall boundary conditions used in the flow model.

Table 2.
Parameter values used in the flow model.
2.2. Motion Model of Floating Caisson
The equations of motion for the floating caisson with internal fluid in the anti-oscillation tanks are expressed as follows:
where is the sum of the inertia and added inertia of the caisson including the empty tanks, and the linear and nonlinear damping coefficients, respectively, the restoring coefficient, the sum of the mass and added mass of the caisson including the empty tanks, the damping coefficient, the hydrostatic coefficient, and the static buoyancy force. These values were determined from free-oscillation tests conducted by Nakamura et al. [2], which are briefly explained in the next section. In Equations (4) and (5), the temporal changes in the wave exciting moment and force were computed by integrating the Froude–Krylov force acting on the submerged surfaces of the caisson, which was calculated based on the second-order Stokes wave theory. The temporal changes in the internal fluid moment and force acting on the walls of the tanks were calculated by integrating the pressure and shear stress computed in the flow model. Equations (4) and (5) are integrated using the Newmark method.
2.3. Coupling between Flow and Motion Models
Figure 5 shows the coupling procedure between the flow and motion models, which is implemented as follows:
- As an initialization, the coefficients of the equations of motion (4) and (5) for the floating caisson, wave exciting moment , and wave exciting force were calculated for all the time steps.
- The pitch and heave of the caisson at the current time step were calculated using the motion model from the internal fluid moment and internal fluid force acting on the walls of the tanks computed at the previous time step.
- The displacement and velocity of the tank walls were set as the boundary conditions for computing the fluid flow in the tanks. The fluid flow in the tanks at the current time step was computed using the flow model.
- Steps 2 and 3 were repeated until the final time step.
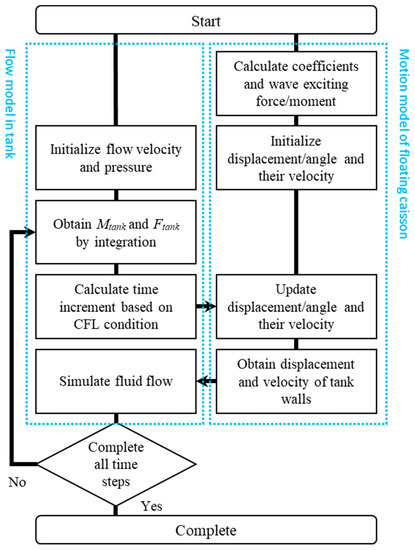
Figure 5.
Flowchart of coupling between the flow model in the anti-oscillation tank and motion model of the floating caisson.
3. Predictive Capability of Coupled Numerical Model
To verify the validity of the coupled numerical model, numerical simulations were performed under similar conditions to the existing physical experiments [2], and the results were compared to the experimental data measured in these experiments [2]. Nakamura et al. [2] conducted (i) free-oscillation tests and (ii) forced-oscillation tests under regular waves using floating caisson and rectangular free-surface anti-oscillation tank models with a length scale of 1/50 based on the Froude similarity law. Table 3 presents the caisson model dimensions. As presented herein, the three caisson models with different specifications were used. Table 4 presents the dimensions of the rectangular anti-oscillation tank. In the caisson model, two anti-oscillation tanks were installed parallel to each other with their long sides in the x direction (see Figure 1).

Table 3.
Dimensions of the floating caisson models without anti-oscillation tank models.

Table 4.
Dimensions of the anti-oscillation tank model without free water.
- (i)
- In the free-oscillation tests, one side of the caisson model A (see Table 3) floating at a still water depth of 300 mm was lifted by a few centimeters in still water and released to oscillate in the heave and pitch directions. The water depth ht in the anti-oscillation tanks was changed to 0, 2.6, and 5.2 mm.
- (ii)
- In the forced-oscillation tests, a caisson model floating at a still water depth of 300 mm was oscillated by regular waves with a generated incident wave height Hi of 30 mm. The generated incident wave period Ti changed to 19 patterns ranging from 0.71 to 4.24 s. The water depths ht in the anti-oscillation tanks were set to 0 and 2.6 mm. The caisson model B (Table 3) was used for ht = 0 mm and the caisson model C (Table 3) for ht = 2.6 mm.
In all the experimental runs, the time series of the pitch and heave of the caisson model were measured. In the forced-oscillation tests, the time series of the water-surface fluctuation was measured at the same x position as that of the caisson model. Details of these physical experiments can be found in Nakamura et al. [2].
3.1. Applicability to Free-Oscillation Tests
Figure 6 compares the calculated and experimental results in terms of the time series of the pitch of the caisson. The calculated results for the heave (orange line) are also presented in the aforementioned figure. Figure 6 shows that the time series of the pitch calculated in the coupled model (blue line) corresponded with those obtained in the physical experiments (green line) for all the tank water depths, including the case of no tank water (Figure 6a). Figure 7 shows the calculated water surface profile and x-directional flow velocity for ht = 5.2 mm, which corresponds to Figure 6c. The cross-section at the front of the figure shows the center cross-section of the tank. As shown in Figure 7a, the thin tip of the water propagated leftward to the exposed bottom (red circle in Figure 7a). As shown in Figure 7b, a complex water surface shape was formed by the vertical upward motion of the water impinging on the edge of the tank and moving along the lid of the tank (red circle in Figure 7b). At this moment, although not presented here, the turbulent viscosity increases near the edges of the tank, thereby suggesting the generation of vortices.
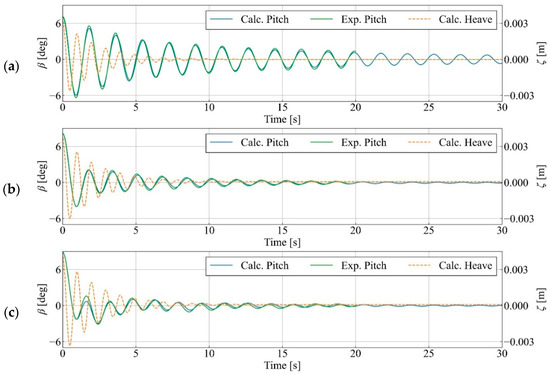
Figure 6.
Comparison of the pitch β and heave ζ of the floating caisson using different water depths ht in the anti-oscillation tanks in the free-oscillation tests: (a) ht = 0 mm, (b) ht = 2.6 mm, and (c) ht = 5.2 mm.
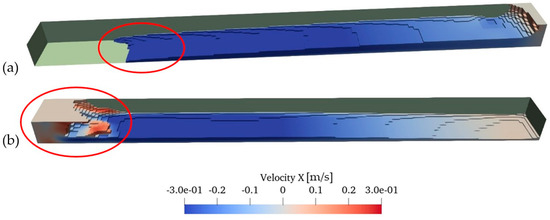
Figure 7.
Water surface profile and x-directional flow velocity in the backward half side of the anti-oscillation tank for ht = 5.2 mm: (a) 0.96 s after the oscillation start and (b) 1.40 s after the oscillation start.
From these results, it was revealed that the coupled model could accurately predict the time series of the pitch of the caisson in the free-oscillation tests. Furthermore, it was suggested that the fluid flow with complex air–water interface motion in an anti-oscillation tank could be analyzed in detail using the coupled model.
3.2. Applicability to Forced-Oscillation Tests
In the physical experiments, the actual values of the wave height and period were determined from the water surface fluctuation measured at the similar x position as the caisson model. In the numerical simulations, these values were used to calculate the wave exciting moment and force for the motion model.
Figure 8 and Table 5 and Table 6 show a comparison of the total amplitudes of the pitch of the caisson, where L is the length of the caisson (Figure 1 and Table 3). As shown herein, the total amplitude of the pitch calculated using the coupled model corresponds with the experimental data regardless of the presence or absence of the tank water. Furthermore, we can observe from the calculated and measured results that pouring water into the tanks can reduce the total amplitude of the pitch , particularly around the peaks. However, for no tank water (ht = 0.0 mm; black lines in Figure 8), the total amplitude of the pitch was slightly underestimated around the maximum. This is probably because the wave exciting moment cannot be estimated by integrating the Froude–Krylov force with sufficient accuracy when the caisson pitch is large. Contrarily, in the presence of the tank water (ht = 2.6 mm; red lines in Figure 8), the total amplitude of the pitch was slightly overestimated around the maximum. This is presumably owing to the underestimation of the damping induced by the tank water. Figure 8 illustrates that there is a slight difference in the total amplitude of the pitch for longer-period waves than Ti = 3.2 s regardless of the presence or absence of the tank water. This is because the incident waves possibly contained high-frequency components owing to the limitation of the wave generator in the physical experiments, while the incident waves with high-frequency components could not be approximated using the second-order Stokes wave theory. Figure 9 shows the relationship between the experimental and calculated values of the non-dimensional total amplitude of the pitch . For long-period waves of Ti > 3.2 s, as mentioned earlier, the calculated results slightly overestimated the experimental data. However, the coupled model can predict the experimental data within ±20% for Ti < 3.2 s.
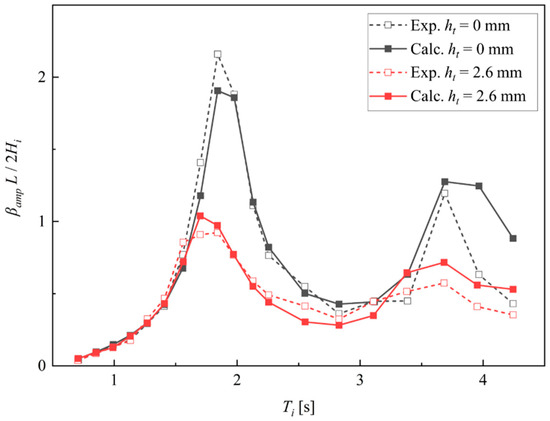
Figure 8.
Comparison of the total amplitude of the pitch of the floating caisson in the forced-oscillation tests.

Table 5.
Comparison of the total amplitude of the pitch of the floating caisson for ht = 0 mm in the forced-oscillation tests.

Table 6.
Comparison of the total amplitude of the pitch of the floating caisson for ht = 2.6 mm in the forced-oscillation tests.
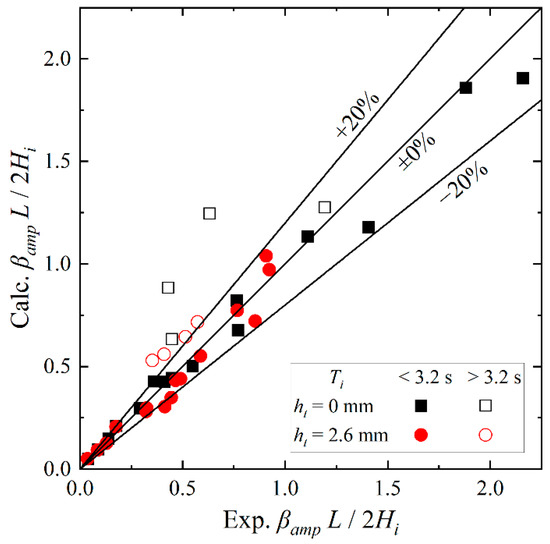
Figure 9.
Relationship between the experimental and calculated values of the non-dimensional total amplitude of the pitch in the forced-oscillation test.
Figure 10 and Table 7 and Table 8 show a comparison of the total amplitudes of the heave of the caisson. Here, the coupled model and physical experiments have a similar tendency in that the heave is not affected by the tank water. However, the results obtained from the coupled model slightly overestimated the experimental data. This is because the damping term, proportional to the squared velocity of the heave, is neglected in Equation (5), thereby resulting in an underestimation of the heave damping. Figure 11 shows the relationship between the experimental and calculated values of the non-dimensional total amplitude of the heave . As mentioned earlier, the calculated results are slightly larger than the experimental data regardless of the presence or absence of the tank water.
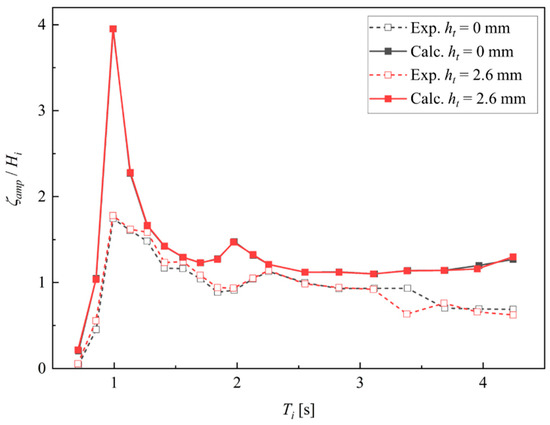
Figure 10.
Comparison of the total amplitude of the heave of the floating caisson in the forced-oscillation tests.

Table 7.
Comparison of the total amplitude of the heave of the floating caisson for ht = 0 mm in the forced-oscillation tests.

Table 8.
Comparison of the total amplitude of the heave of the floating caisson for ht = 2.6 mm in the forced-oscillation tests.
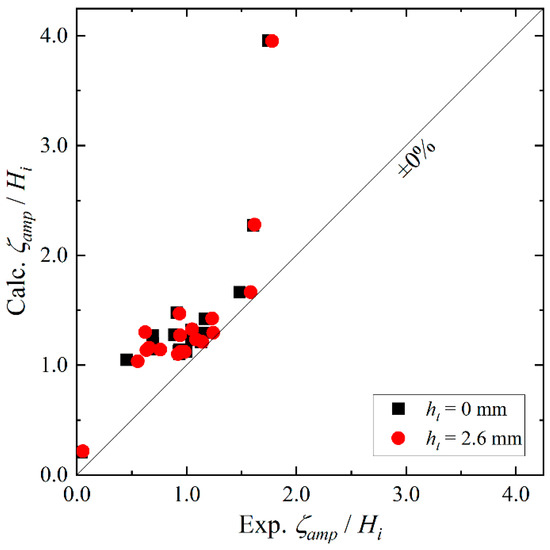
Figure 11.
Relationship between the experimental and calculated values of the non-dimensional total amplitude of the heave in the forced-oscillation test.
Figure 12 shows the time series of the pitch , wave exciting moment , and internal fluid moment obtained from the coupled model, where t is time. The experimental data of the pitch is also shown in the figure. From the comparison between the coupled model and physical experiments, it was found that the amplitude and phase of the pitch generally correspond with the calculated result (black line) and the experimental data (red line), regardless of the presence or absence of the tank water. In the presence of the tank water, the internal fluid moment (green line) has almost opposite phase against the wave exciting moment (blue line). Here, is the driving moment for the pitch, and thus the effect of with this characteristic can reduce the pitch . Furthermore, the peak time of (green line) was delayed by approximately one-quarter of the wave period Ti against the pitch (black line). This characteristic satisfies the requirements for an effective anti-oscillation tank, as demonstrated by Moaleji and Greig [4].
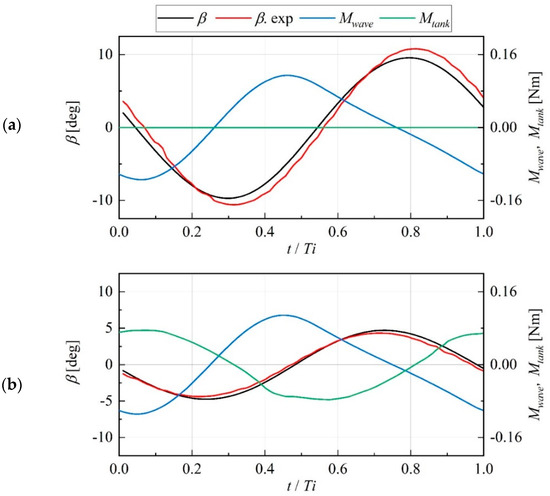
Figure 12.
Time series of the pitch β, wave exciting moment , and internal fluid moment for Ti = 1.84 s: (a) ht = 0 mm and (b) ht = 2.6 mm.
Figure 13 shows the calculated water surface profile and x-directional flow velocity when the angular velocity in the pitch direction reaches its maximum (when the tank rotates clockwise). The cross-section at the front of the figure shows the center cross-section of the tank. For comparison, Figure 14 shows the water surface profiles observed in the physical experiments [2]. Here, the water was yellow. This figure shows a side view of the tank, wherein the blue line represents the water surface. As shown in Figure 13 and Figure 14, the coupled model and physical experiments exhibit a similar trend: the tank water is concentrated at the left end of the tank (red circles in Figure 13 and Figure 14), whereas the bottom is exposed on the opposite side (green circles in Figure 13 and Figure 14). Although the mass of the tank water is relatively small (50 g in each tank), Figure 12 shows that the tank water motion can generate a large internal fluid moment, (green line), which is almost equal to the wave excitation moment, (blue line). Figure 15 shows the distribution of the turbulent viscosity calculated from the Smagorinsky model at a similar time to that shown in Figure 14. As shown in Figure 15, the turbulent viscosity increases by more than five times the kinematic viscosity of the water (1.0 × 10⁻⁶ m2/s) around the left end of the tank (red circle in Figure 15), thereby suggesting a large energy dissipation in this area. Figure 15 shows that the turbulent viscosity becomes relatively high in the thin tail of the water as well (green circle in Figure 15). In this manner, the flow in the tank can be simulated, analyzed, and evaluated in detail using the coupled model. This reveals that it is essential to use a CFD model such as the proposed coupled model to consider this type of energy dissipation.

Figure 13.
Calculated water surface profile and x-directional flow velocity (color contour) in the backward half side of the anti-oscillation tank when the angular velocity of the pitch reaches its maximum for ht = 2.6 mm.

Figure 14.
Observed water surface profile (blue line) viewed from the side of the tank when the angular velocity of the pitch reaches its maximum (similar moment as Figure 13) for ht = 2.6 mm.

Figure 15.
Calculated water surface profile and turbulent viscosity (color contour) in the backward half side of the anti-oscillation tank when the angular velocity of the pitch reaches its maximum (similar moment as Figure 13) for ht = 2.6 mm.
These results reveal the sufficient predictive capability of the coupled model in terms of not only the total amplitude of the pitch but also the time series of the pitch to evaluate the effect of the tank water on the pitch.
4. Conclusions
In this study, a coupled numerical model comprising a flow model in an anti-oscillation tank and a motion model of a floating caisson was developed and applied to free- and forced-oscillation tests conducted in existing physical experiments for validation. The main conclusions of this study are summarized as follows:
- By comparing the pitch of the caisson in free- and forced-oscillation tests, the coupled model corresponded with the physical experiments regardless of the absence or presence of water in the tanks. In the forced-oscillation test, the coupled model predicted the non-dimensional total amplitude of the pitch within ±20% of the experimental data. Hence, the coupled model could accurately predict the pitch to evaluate the effect of water in the tanks on the pitch.
- In the forced-oscillation tests, the calculated and experimental results showed a similar tendency in that the heave of the caisson was slightly affected by the amount of tank water. Furthermore, the comparison showed that the coupled model slightly overestimated the heave compared to the physical experiments. To address this issue, a damping term proportional to the squared velocity of the heave must be considered in the motion equation to improve the coupled model.
- From the visualization of the water surface profile and flow velocity magnitude in the tank, it was suggested that the fluid flow with complex air–water interface motion in the tank could be analyzed in detail using the coupled model.
However, the quantitative evaluation of the accuracy of the coupled model and the investigation of flow characteristics in the tank in terms of other turbulence criteria were done unsatisfactorily. To address these issues, it is recommended that further studies be conducted in the future. To reduce the pitch of the floating caisson more effectively, optimizing the geometry of the anti-oscillation tanks and the amount of tank water using the coupled model developed is needed as well.
Author Contributions
Conceptualization, Y.K. and M.T.; methodology, K.S.; software, K.S.; validation, K.S.; formal analysis, K.S.; investigation, K.S. and T.N.; resources, K.S.; data curation, K.S.; writing—original draft preparation, K.S.; writing—review and editing, T.N., Y.-H.C., N.M., Y.K. and M.T.; visualization, K.S.; supervision, N.M.; project administration, N.M.; funding acquisition, N.M. All authors have read and agreed to the published version of the manuscript.
Funding
Part of this study is the project “Research and Development of Motion Reduction Technology for Floating Caissons” in “Research and Development Promotion Project for Innovative Infrastructure” that was commissioned by the Port and Airport Research Institute (PARI), National Institute of Maritime, Port and Aviation Technology (MPAT), Japan.
Institutional Review Board Statement
Not applicable.
Informed Consent Statement
Not applicable.
Data Availability Statement
Not applicable.
Conflicts of Interest
The authors declare no conflict of interest. The funders had no role in the study design; collection, analyses, or interpretation of data; writing of the manuscript; or decision to publish the results.
Nomenclature
| B | Width of the floating caisson |
| Bt | Inner width of the anti-oscillation tank |
| Strength of the compression | |
| Damping coefficient | |
| d | Draft of the floating caisson |
| Static buoyancy force | |
| Internal fluid force | |
| Wave exciting force | |
| Gravitational acceleration vector | |
| Ht | Inner height of the anti-oscillation tank |
| ht | Water depth of the anti-oscillation tank |
| Inertia of the floating caisson | |
| Added inertia of the floating caisson | |
| Hydrostatic coefficient | |
| L | Length of the floating caisson |
| Lt | Inner length of the anti-oscillation tank |
| Mass of the floating caisson | |
| Internal fluid moment | |
| Wave exciting moment | |
| Added mass of the floating caisson | |
| Linear damping coefficients | |
| Nonlinear damping coefficients | |
| Grid-scale pressure | |
| Restoring coefficient | |
| Strain rate tensor | |
| t | Time |
| Ti | Wave period |
| Grid-scale velocity vector | |
| Relative velocity vector | |
| x | Horizontal axis parallel to the wave direction |
| xi | Position vector |
| y | Horizontal axis normal to the wave direction |
| z | Vertical axis |
| Volume fraction of water (the VOF function) | |
| β | Pitch of the floating caisson |
| βamp | Total amplitude of the pitch of the floating caisson |
| Local surface curvature | |
| Viscosity of the fluid | |
| Density of the fluid | |
| Surface tension coefficient | |
| ζ | Heave of the floating caisson |
| ζamp | Total amplitude of the heave of the floating caisson |
| List of abbreviations | |
| CFD | Computational fluid dynamics |
| FSI | Fluid–structure interaction |
| LES | Large-eddy simulation |
| PISO | Pressure-implicit with splitting of operators |
| TVD | Total variation diminishing |
| VOF | Volume of fluid |
References
- Eguchi, M.; Takeda, M.; Iwamoto, H.; Matsuda, N. Free rolling tests for a floating caisson with a anti-rolling tank. J. JSCE Ser. B2 2017, 73, I_979–I_984. (In Japanese) [Google Scholar] [CrossRef]
- Nakamura, T.; Shirai, K.; Cho, Y.; Mizutani, N.; Kurahara, Y.; Takeda, M. Experimental study on effectiveness and mechanism of anti-oscillation tanks against motion of floating caisson. J. JSCE Ser. B3 2021, 77, I_619–I_624. (In Japanese) [Google Scholar] [CrossRef] [PubMed]
- Kurahara, Y.; Takeda, M.; Hara, C.; Balqis, A.N.; Nakamura, T.; Mizutani, N. Development of a numerical analysis method for motion reduction of a floating caisson with anti oscillation tank. J. JSCE Ser. B3 2022, 78, I_259–I_264. (In Japanese) [Google Scholar] [CrossRef]
- Moaleji, R.; Greig, A.R. On the development of ship anti-roll tanks. Ocean Eng. 2007, 34, 103–121. [Google Scholar] [CrossRef]
- Lee, B.S.; Vassalos, D. An investigation into the stabilization effects of antiroll tanks with flow obstructions. Int. Shipbuild. Prog. 1996, 43, 70–88. [Google Scholar]
- Armenio, V.; Francescutto, A.; Rocca, M.L. On the roll motion of a ship with partially filled unbaffled and baffled tanks—Part 1: Mathematical model and experimental setup. Int. J. Offshore Polar Eng. 1996, 6, 278–282. [Google Scholar]
- Armenio, V.; Francescutto, A.; Rocca, M.L. On the roll motion of a ship with partially filled unbaffled and baffled tanks—Part 2: Numerical and experimental analysis. Int. J. Offshore Polar Eng. 1996, 6, 283–290. [Google Scholar]
- Li, Y.; Zhu, R.; Miao, G.; Fan, J. Simulation of tank sloshing based on OpenFOAM and coupling with ship motions in time domain. J. Hydrodyn. 2012, 24, 450–457. [Google Scholar] [CrossRef]
- Huang, F.; Yang, C.; Zhu, R.; Noblesse, F. Numerical studies of coupling effects between liquid sloshing and ship motions. In Proceedings of the 23rd International Offshore and Polar Engineering Conference, Anchorage, AK, USA, 30 June–5 July 2013. [Google Scholar]
- Taskar, B.U.; DasGupta, D.; Nagarajan, V.; Chakraborty, S.; Chatterjee, A.; Sha, O.P. CFD aided modelling of anti-rolling tanks towards more accurate ship dynamics. Ocean Eng. 2014, 92, 296–303. [Google Scholar] [CrossRef]
- Jiang, S.C.; Teng, B.; Bai, W.; Gou, Y. Numerical simulation of coupling effect between ship motion and liquid sloshing under wave action. Ocean Eng. 2015, 108, 140–154. [Google Scholar] [CrossRef]
- Cercos-Pita, J.L.; Bulian, G.; Pérez-Rojas, L.; Francescutto, A. Coupled simulation of nonlinear ship motions and a free surface tank. Ocean Eng. 2016, 120, 281–288. [Google Scholar] [CrossRef]
- Ghamari, I.; Faltinsen, O.M.; Greco, M.; Lugni, C. Parametric resonance of a fishing vessel with and without anti-roll tank: An experimental and numerical study. In Proceedings of the 36th International Conference on Ocean, Offshore & Arctic Engineering, Trondheim, Norway, 25–30 June 2017. [Google Scholar]
- Saripilli, J.R.; Sen, D. Numerical studies of coupling effect of sloshing on 3D ship motions. Int. J. Offshore Polar Eng. 2017, 27, 27–35. [Google Scholar] [CrossRef]
- Bulian, G.; Cercos-Pita, J.L. Co-simulation of ship motions and sloshing in tanks. Ocean Eng. 2018, 152, 353–376. [Google Scholar] [CrossRef]
- Diebold, L.; Moon, J.S.; Chung, Y.S. Experimental and numerical study of anti-roll tanks. In Proceedings of the International Ocean and Polar Engineering Conference, Sapporo, Japan, 10–15 June 2018. [Google Scholar]
- Alujević, N.; Ćatipović, I.; Malenica, Š.; Senjanović, I.; Vladimir, N. Ship roll control and power absorption using a U-tube anti-roll tank. Ocean Eng. 2019, 172, 857–870. [Google Scholar] [CrossRef]
- Lyu, W.; Riesner, M.; Peters, A.; Moctar, O. A hybrid method for ship response coupled with sloshing in partially filled tanks. Mar. Struct. 2019, 67, 102643. [Google Scholar] [CrossRef]
- Zhuang, Y.; Wan, D. Numerical study on ship motion fully coupled with LNG tank sloshing in CFD method. Int. J. Comput. Methods 2019, 16, 1840022. [Google Scholar] [CrossRef]
- Alujević, N.; Ćatipović, I.; Malenica, Š.; Senjanović, I.; Vladimir, N. Stability, performance and power flow of active U-tube anti-roll tank. Eng. Struct. 2020, 211, 110267. [Google Scholar] [CrossRef]
- Subramanian, R.; Jyothish, P.V.; Subramanian, A.V. Genetic algorithm based design optimization of a passive anti-roll tank in a sea going vessel. Ocean Eng. 2020, 203, 107216. [Google Scholar] [CrossRef]
- Wei, Y.; Yang, Y.; Fan, S.; Liu, Z.; Feng, P. Model test study on anti-rolling of ship at zero speed. In Proceedings of the 39th International Conference on Ocean, Offshore & Arctic Engineering, Online, 3–7 August 2020. [Google Scholar] [CrossRef]
- Bernal-Colio, V.R.; Gómez-Goñi, J.; Cercos-Pita, J.L. CFD computation of the hydrodynamic torque due to free-surface antiroll tanks with 3D dynamics. Ships Offshore Struct. 2021, 16, 879–891. [Google Scholar] [CrossRef]
- Liu, X.; Zhao, W.; Wan, D. Optimization of the roll motion of box-shaped hull section with anti-rolling sloshing tanks and fins in beam waves. J. Hydrodyn. 2021, 33, 688–697. [Google Scholar] [CrossRef]
- Yao, K.; Zhang, K.; Zhang, Y.; You, F.; Wang, C.; Xiao, J. Damping characteristic study of ship bionic anti-rolling device. Ships Offshore Struct. 2021, 16, 1067–1077. [Google Scholar] [CrossRef]
- He, T.; Feng, D.; Liu, L.; Wang, X.; Jiang, H. CFD simulation and experimental study on coupled motion response of ship with tank in beam waves. J. Mar. Sci. Eng. 2022, 10, 113. [Google Scholar] [CrossRef]
- Lin, J.F.; Guo, C.Y.; Zhao, D.G.; Han, Y.; Su, Y.M. Hydrodynamic simulation for evaluating Magnus anti-rolling devices with varying angles of attack. Ocean Eng. 2022, 260, 111949. [Google Scholar] [CrossRef]
- Liu, L.; Feng, D.; Wang, X.; Zhang, Z.; Yu, J.; Chen, M. Numerical study on the effect of sloshing on ship parametric roll. Ocean Eng. 2022, 247, 110612. [Google Scholar] [CrossRef]
- Lyu, W.; Moctar, O.; Schellin, T.E. Ship motion-sloshing interaction with forward speed in oblique waves. Ocean Eng. 2022, 250, 110999. [Google Scholar] [CrossRef]
- Sun, X.; Zhong, Y.; Bian, F.; Liu, C.; Yin, Y. Numerical computation of sloshing-induced force in complex ship tanks under the excitation of ship rolling motion based on the MPS method. Appl. Sci. 2022, 12, 5130. [Google Scholar] [CrossRef]
- Wen, X.; Zhao, W.; Wan, D. Multi-phase moving particle semi-implicit method for violent sloshing flows. Eur. J. Mech. B/Fluids 2022, 95, 1–22. [Google Scholar] [CrossRef]
- Yu, C.H.; Wu, T.C.; An, R.D.; Li, Y.L. Numerical simulation for liquid sloshing with baffle by the CLSVOF/IB method. Ocean Eng. 2022, 258, 111732. [Google Scholar] [CrossRef]
- Chen, C.; Liu, Y.D.; Zhang, W.; He, Y.P.; Tang, Y.Y. Free roll decay simulation of a polar research vessel with an anti-roll tank based on CFD. Ocean Eng. 2023, 285, 115429. [Google Scholar] [CrossRef]
- Chen, J.; Ge, M.; Li, L. The effect of the aeration condition on the liquid–solid material mixing in a stirred tank with a single-layer impeller. Appl. Sci. 2023, 13, 9021. [Google Scholar] [CrossRef]
- Ge, M.; Chen, J.; Zhao, L.; Zheng, G. Mixing transport mechanism of three-phase particle flow based on CFD-DEM coupling. Processes 2023, 11, 1619. [Google Scholar] [CrossRef]
- Kapsenberg, G.; Carette, N. A consistent method to design and evaluate the performance of anti-roll tanks for ships. Ship Tech. Res. 2023, 117–145. [Google Scholar] [CrossRef]
- Lee, D.Y.; Kim, S.P.; Jung, J.H.; Kim, D.S. An application of anti-roll tank to reduce roll motion of containership. In Proceedings of the 33rd International Ocean Polar and Engineering Conference, Ottawa, ON, Canada, 19–23 June 2023. [Google Scholar]
- Lin, J.; Yao, H.D.; Han, Y.; Su, Y.; Zhang, C. Shape optimization and hydrodynamic simulation of a Magnus anti-rolling device based on fully parametric modeling. Phys. Fluids 2023, 35, 055136. [Google Scholar] [CrossRef]
- Wang, T.; Wang, C.; Yin, Y.; Zhang, Y.; Li, L.; Tan, D. Analytical approach for nonlinear vibration response of the thin cylindrical shell with a straight crack. Nonlinear Dyn. 2023, 111, 10957–10980. [Google Scholar] [CrossRef]
- OpenCFD OpenFOAM User Guide v2012. Available online: https://www.openfoam.com/documentation/guides/v2012/doc/ (accessed on 13 July 2023).
- Smagorinsky, J. General circulation experiments with the primitive equations. Mon. Weath. Rev. 1963, 91, 99–164. [Google Scholar] [CrossRef]
- Kajishima, T.; Taira, K. Computational Fluid Dynamics: Incompressible Turbulent Flows, 1st ed.; Springer: Cham, Switzerland, 2016; 358p. [Google Scholar] [CrossRef]
Disclaimer/Publisher’s Note: The statements, opinions and data contained in all publications are solely those of the individual author(s) and contributor(s) and not of MDPI and/or the editor(s). MDPI and/or the editor(s) disclaim responsibility for any injury to people or property resulting from any ideas, methods, instructions or products referred to in the content. |
© 2023 by the authors. Licensee MDPI, Basel, Switzerland. This article is an open access article distributed under the terms and conditions of the Creative Commons Attribution (CC BY) license (https://creativecommons.org/licenses/by/4.0/).