1. Introduction
Wind energy is widely used as a renewable energy and has become a vital component of sustainable development [
1]. As the global population’s energy demands continue to increase [
2], the utilization and implementation of wind energy is also growing [
3]. It is estimated that by 2030, wind energy will provide 22% of the world’s electricity [
4]. As a clean and low-carbon energy source, wind energy not only reduces greenhouse gas emissions and environmental impact but also enhances energy supply reliability and security [
5]. However, the intermittence and variability of wind speed will lead to an additional production cost to the wind turbine industry [
6,
7]. Although wind speed forecasting models have been developed to address these challenges [
8,
9,
10], their reliability and performance may vary due to differences in climatic conditions and underlying surface characteristics. Studying the variability of local surface wind can provide valuable insights for regulating wind turbine operational strategies.
Sri Lanka is located at the southern end of the Indian subcontinent and boasts one of the world’s busiest shipping routes in the southern region. Positioned in the central North Indian Ocean north of the Equator, Sri Lanka is bordered by the Bay of Bengal to the east and the Arabian Sea to the west. An abundance of wind resources can be found in the region due to the notable difference in temperature between the Asian continent and the Indian Ocean [
11]. The dominant surface wind and precipitation patterns in the region are influenced by the South Asian and northeast monsoons, with the main rainfall season occurring from October through November to December (OND) [
12,
13]. In the spring and summer of the Northern Hemisphere, the Asian continent experiences stronger solar radiation, which leads to increased temperatures and a reverse temperature gradient from the poles to the equator. This alteration in temperature gradient changes the prevailing circulation patterns, causing airflows from the Southern Hemisphere to cross the equator and bring India and Sri Lanka strong westerly winds and moisture [
14]. The onset and precipitation characteristics of monsoons are influenced by various factors. According to Joseph and Porathur (2014) [
15], the onset of the Indian summer monsoon is closely linked to sea surface temperature (SST) anomalies in the equatorial Indian Ocean. Variations in SSTs cause a southward shift of low-level westerly winds, which is the primary trigger for the intermittent periods of Indian summer winds [
16]. In addition, Sreekala et al. (2018) [
17] analyzed the impacts of the Madden–Julian Oscillation (MJO), El Niño-Southern Oscillation (ENSO), and Indian Ocean Dipole (IOD) on the Indian northeast monsoon rainfall in the southern Indian peninsula. The prediction of active and break periods in the South Asian monsoon has been a major research focus over the years, given the substantial influence of monsoon onset and precipitation on the agriculture in the region [
18]. The duration of the monsoon season in Sri Lanka is longer than other areas, usually beginning in mid-May and lasting until the end of October. The monsoon season affects the distribution of wind resources on a seasonal scale in the region, and the apparent temperature difference between the land and the ocean can trigger wind oscillations at other scales, including diurnal variations [
19]. Diurnal convective activity over the Maritime Continent generates a large amount of heat, which is regarded as a significant source of energy that drives large-scale atmospheric circulation [
20]. To develop effective operational strategies for wind turbines, it is essential to account for both seasonal and local-scale wind variations.
Many studies have evaluated wind resources around the world [
21,
22,
23]; however, there have been relatively few reports on Sri Lanka and the North Indian Ocean. According to Zheng’s analysis [
24] using ERA-Interim and CMIP5 data, there have been significant changes in wind energy density in the waters of Sri Lanka over the past 40 years and the projected next 40 years. The findings suggest that the scale and availability of wind energy have been increasing steadily over time. Additionally, the stability of wind energy resources has shown a positive trend, indicating an improved reliability for wind power generation in the region. However, it should be noted that some reanalysis datasets tend to overestimate low wind speeds [
25]. Luo [
26] conducted observations of waves and wind fields in southern Sri Lanka. The study primarily focused on the seasonal characteristics of waves in the region and shared data from buoys and meteorological stations for the period of 2012–2016. Considering the prevalence of ocean surfaces in low-latitude regions, there is a limited availability of observations regarding wind fields in these areas. However, such data hold significant value. In this research, surface wind speeds at 10 m above ground level along the southern coast of Sri Lanka from 2017 to 2018 were analyzed using in situ observations. The objective was to provide insights into wind resource evaluation in the region and understand seasonal variations in wind speed for effective wind turbine management. The study also discussed the characteristics of wind oscillations to enhance understanding of daily wind speed fluctuations, which offshore wind turbines may encounter. This analysis contributes to improving the reliability and accuracy of wind energy resource assessment and wind power system operation, which are crucial for energy planning and the stability of the electricity system.
3. Results
Located in the middle of the equatorial Indian Ocean, the Ruhuna observation site’s wind speed reflects the influence of the Indian monsoon on the ocean surrounding Sri Lanka and the Bay of Bengal. As the southernmost point of the South Asian subcontinent, the Sri Lankan region is usually the first area to be affected by the Indian monsoon every year. Therefore, the start and end dates of the Indian monsoon in this region can also be considered as the beginning and end dates of the monsoon for the entire East Asia region.
Figure 2a presents the wind speed observations from 1 May 2017 to 1 June 2018. The horizontal axis represents the date, and the vertical axis represents the time of the corresponding date. Different colors indicate the magnitude of the horizontal wind speed, and the wind direction corresponding to different wind speeds may vary.
Figure 2b shows the seasonal average diurnal variation in horizontal wind speed. The time series of horizontal wind speed data were averaged for the same time each day within a specific seasonal range to obtain the average value at a specific time of the season. However, due to unstable power supply at the observation site from 21 January to 24 February 2018, the observation data during the night were not available, as the observation site could only rely on solar power during this period. According to the characteristics of the available time series data, the seasons were defined as follows: (1) winter (December 2017, January 2018, and February 2018); (2) spring (March 2018, April 2018, and May 2018); (3) summer (June 2017, July 2017, and August 2017); and (4) fall (September 2017, October 2017, and November 2017).
Figure 2 displays the wind speed observations at 30 min intervals from May 2017 to May 2018. The annual average wind speed was 3.45 m/s, with a maximum of 17.0 m/s.
Figure 2a showcases the impact of the monsoon on the area, with higher wind speeds observed during the rainy season from mid-May to mid-October 2017 compared to the dry season from November to May. The summer monsoon typically starts on 13 May, with a visible increase in daytime wind speeds. Daytime wind speeds usually remain relatively high thereafter, with changes during weather events. A heavy rainfall event with 370.6 mm of precipitation occurred from 28 May to 29 May, which was not supported by a strong wind field, unlike tropical cyclone precipitation. During the monsoon season, the high wind speed areas in the daytime are not continuous, but rather exhibit a certain periodic oscillation. Within these oscillations, there are maximum wind speed areas at the end of May and the beginning of August, when the wind speed exceeds 8 m/s. The higher daytime wind speeds persist until late October, which marks the end of the summer monsoon period. Consequently, cloud cover decreases, net radiation increases, and temperatures rise, resulting in a relatively dry season in Ruhuna. On 26 November, high wind speeds were observed due to the influence of tropical cyclone “Ochi”, with maximum surface wind speeds reaching 17.0 m/s. Over the previous decade, three tropical cyclones made landfall in Sri Lanka, with two occurring between November and December.
Figure 2b illustrates the seasonal average daily variation, with daytime wind speeds higher than nighttime wind speeds. The average daily variation in wind speed is unimodal, reaching a maximum of 6.25 m/s at 15:30 during summer. Summer has the highest average wind speed throughout the year among all seasons, at 4.2 m/s. The maximum value in the daily variation sequence occurs at 15:30, reaching 6.3 m/s, whereas the minimum value appears at 22:00, at 2.9 m/s. Spring follows, with an average wind speed of 3.2 m/s, a maximum value of 5.4 m/s, and a minimum value of 2.5 m/s. Winter is the season with the lowest wind speed, with an average of 2.3 m/s, an average maximum of 4.0 m/s, and a minimum of 1.4 m/s. The unimodal pattern of daily variation characteristics indicates that thermal differences between land and sea dominate coastal surface wind. There are differences in the magnitude of wind speed and its daily variation among different seasons, but they share the same daily variation pattern.
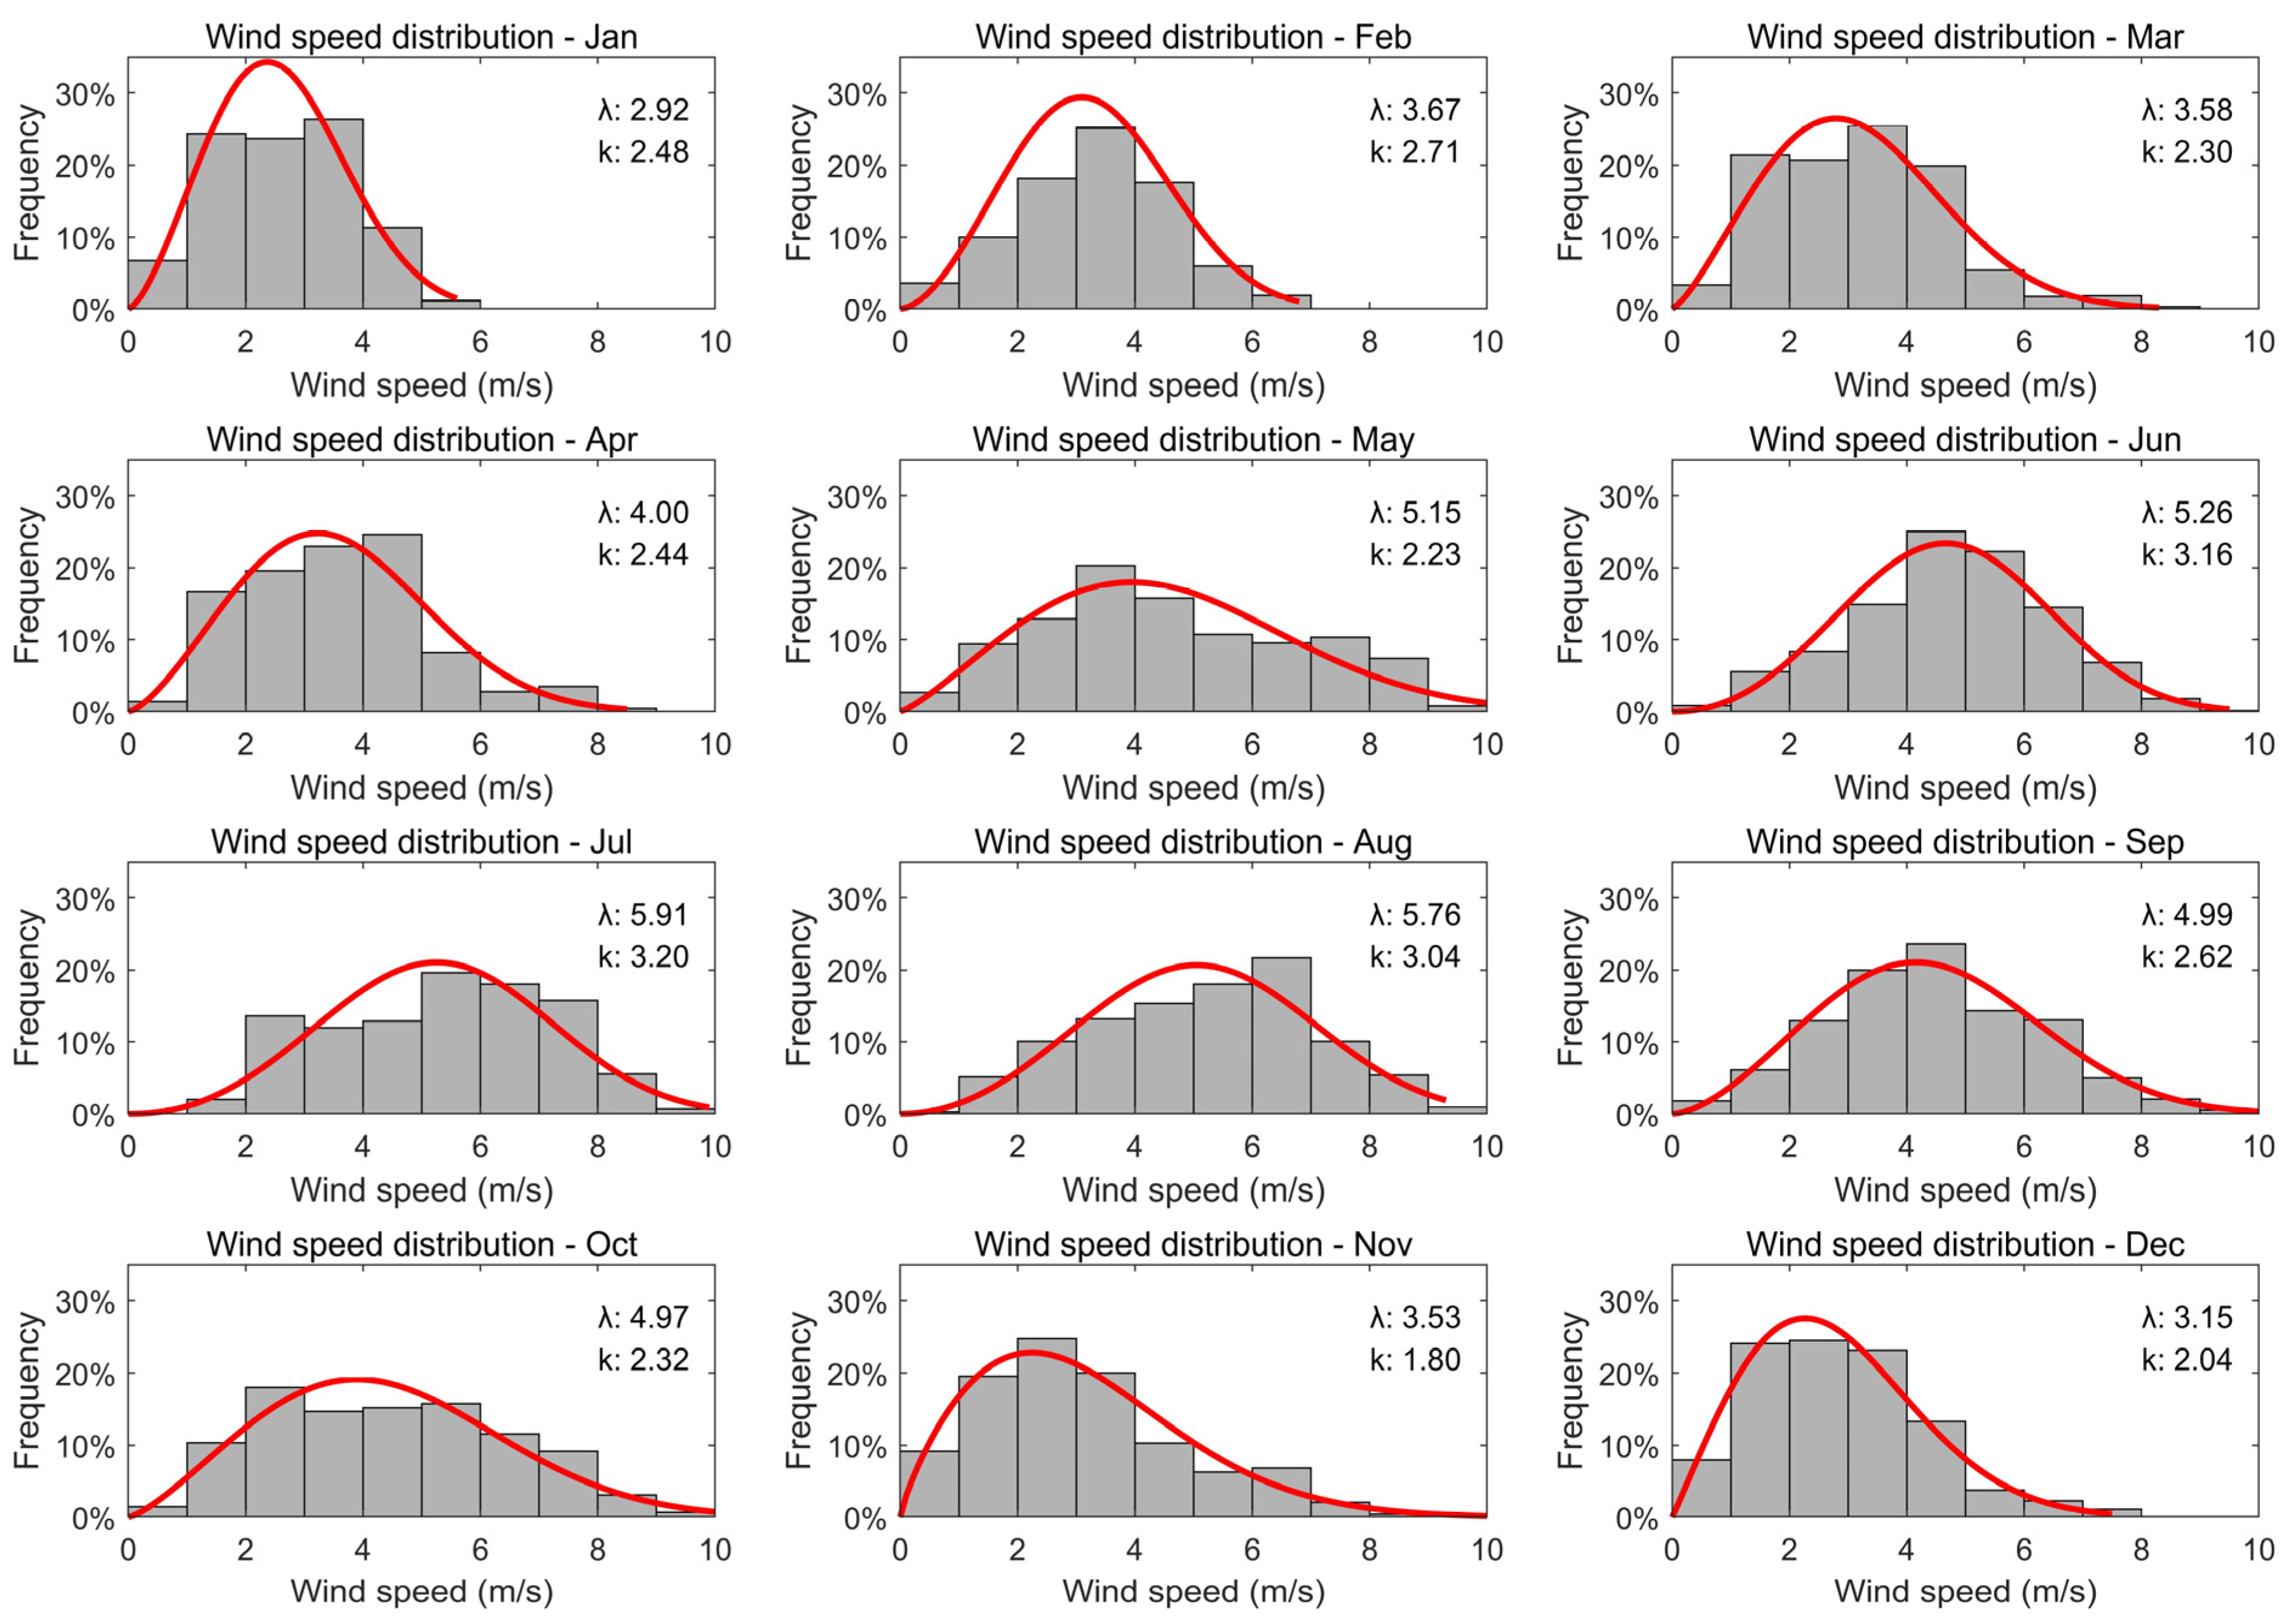
To better illustrate the seasonal variations in wind speed distribution along the southern coast of Sri Lanka, the wind speed data were grouped into 10 intervals with 1 m/s intervals, and the frequency of wind speeds in each group was calculated to draw wind speed frequency graphs for different months (
Figure 3). The bar chart represents the frequency of wind speeds, and the red solid line is the Weibull distribution fit curve of wind speed frequency, with λ as the scale parameter and k as the shape parameter. To better capture the seasonal variations in wind speed characteristics and account for the missing data in February 2018, wind speeds during the day were analyzed uniformly. From
Figure 3, it can be observed that there are significant inter-monthly changes in wind speed frequency and its distribution curve. During January to April, high-frequency wind speeds (greater than 20%) are usually distributed in the range of 2–4 m/s, and the peak of the fitting curve is also between 2 and 3 m/s. This corresponds to low and unstable wind speeds during the non-monsoon period, resulting in less available wind energy. Although May enters the monsoon season, there is no significant change in wind speed distribution compared to May, except for a slight increase in frequency of wind speeds greater than 6 m/s. Starting from June, there is a significant difference in wind speed distribution compared to before. The frequency of wind speeds greater than 4 m/s increased significantly, and the wind speed corresponding to the maximum value of the fitting curve was close to 5 m/s. At this time, it corresponds to the typical wind speed characteristics of the monsoon season, with stable wind direction and high wind speeds, as well as a great potential for wind energy utilization. During the summer monsoon period (July to October), there is no significant change in wind speed frequency distribution. The most frequent wind speeds are around 5 m/s. After November, the wind speed distribution shifts significantly to the left, and the wind speed corresponding to the peak of the fitting function also decreases significantly, indicating a significant weakening of wind speed. Comparing the wind speed distribution during the monsoon and non-monsoon periods, wind speeds greater than 6 m/s show significant seasonal differences.
Figure 4a–d displays the wind direction and speed of the surface wind in different seasons at the Ruhuna site, where the horizontal coordinates indicate wind direction, and the vertical coordinates indicate wind speed [
31]. The results show distinct seasonal variations in surface winds due to the influence of the summer monsoon. During summer and autumn, a prevailing southwesterly wind is observed, which is associated with the southwest monsoon and brings moisture and rainfall to the area. The wind direction is concentrated between 240° and 270°, and the average maximum wind speed exceeds 9.0 m/s. The airflow is relatively stable. In contrast, multiple prevailing winds are observed during winter and spring, which are linked to the northeast monsoon that is less intense compared to the southwest monsoon. The wind direction is distributed uniformly between 0° and 360°, and the wind speed is relatively moderate. The airflow is relatively unstable. Observation time constraints limited the data available for spring 2017, and hence, the results are biased towards spring features. However, the images for spring 2018 provide a better representation of the Ruhuna surface wind characteristics during that season. Overall, the seasonal variations in surface winds at the Ruhuna site are mainly driven by the summer monsoon that affects the Indian Ocean region. The monsoon season is characterized by stable southwestern winds.
Figure 4e,f highlights the differences in surface wind characteristics during the summer monsoon and non-summer monsoon periods.
Figure 4e presents the wind speed direction frequency graph during the non-monsoon period, where prevailing winds are from the northwest direction. However, the frequency of the dominant wind direction is not significantly different from that of other wind directions. In addition, the probability of north winds exceeding 3 m/s is relatively low. During the monsoon period (
Figure 4f), the frequency of the dominant wind direction accounts for 46.0% of the total frequency, which is much higher than that of other wind directions. The stable southwest wind during the summer monsoon period is attributed to the persistent low-pressure system over the Indian subcontinent, which drives the monsoon. In contrast, the wind direction is more scattered during non-summer monsoon periods due to the weaker pressure gradient and less organized weather patterns. These results suggest that the Indian summer monsoon plays a critical role in shaping the surface wind characteristics at the Ruhuna site, emphasizing the need to consider regional-scale climate patterns when analyzing local wind data.
4. Discussion
The results describe the seasonal and diurnal variations in wind fields along the southern coast of Sri Lanka. It is evident that monsoons dominate the surface wind fields in the region, with apparent differences between monsoon and non-monsoon periods. During the monsoon period, the wind fields exhibit highly organized wind directions and speeds, with stronger wind force. In contrast, the wind fields during the non-monsoon period are more scattered and unstable, with less available wind energy. However, this differs from the findings of Zheng [
24]. Zheng analyzed the variations in wind energy in the Sri Lankan waters for the past 40 years and the next 40 years using ERA-Interim and CMIP5 data. The study found that the seasonal wind energy density exhibited an M-shaped distribution, with peaks and sub-peaks in June and December, respectively. Meanwhile, in the observational results of this study, no peak in December was observed. As seen in
Figure 3, the monthly variations in wind speed in southern Sri Lanka almost exhibit a unimodal pattern. The maximum wind speed occurs in July, and the minimum wind speed occurs in January, and there are no other significant peaks between these months. Extreme weather events such as tropical cyclones tend to occur more often around November, which falls within the non-monsoon period. These seasonal variations affect the local climate, agricultural production, and wind energy resources. Many factors can influence the monsoon characteristics, such as the Indian Ocean Dipole, El Niño, and Southern Oscillation. On the other hand, the land–sea thermal contrast evidently influences the diurnal variations in wind fields in the region. Although there are differences in wind speed between seasons, the diurnal variation processes exhibit similar trends during each season, displaying a single-peak process similar to the diurnal variation in solar radiation. Typically, wind speed starts to increase after sunrise, reaching its maximum value around 14:00 local time, and then remaining low after sunset. This feature is not commonly observed in inland areas at middle and high latitudes. Due to the lower latitude and stronger net radiation input, the equatorial Indian Ocean highlights the effect of heterogeneous underlying surfaces on the wind field. Therefore, in low-latitude offshore areas, wind fields may exhibit oscillations dominated by daily cycles, which become a factor affecting the load of offshore wind turbines.
To investigate the relationship between wind field variation periods and wind energy,
Figure 5a presents a statistical analysis of wind speed from a spectral analysis perspective. The analysis used observed wind speed data from the surface at a height of 10 m between 1 June 2017 and 1 June 2018. Outliers greater than two standard deviations were removed, and linear interpolation was applied to the removed points. The data from each season were detrended and normalized. The observed data were analyzed using the Welch method for frequency spectrum analysis with a Hanning window, 50% overlap, and a sampling frequency of 2/h. To better observe the relationship between wind speed periods and power spectral density, the default frequency axis was reversed to represent the period in hours. To facilitate observation, the real power spectral density was converted to
. From
Figure 5a, it can be observed that there is a spectral peak in the 24 h wind speed oscillation, consistent with the apparent diurnal variation in wind speed observed earlier. The power spectra of each season exhibit peaks at almost the same periods, indicating that wind speed oscillations dominated by daily cycles are widespread in each season. However, since data of each season were detrended and normalized, the strength of the power spectra in different seasons cannot reflect the true magnitude relationship. The peak value of the power spectra of each season occurs in autumn, with a value of 26.4 (m/s)
2/h. Local peaks in the power spectral density at periods of 12 h, 6 h, and 3 h are also observed, indicating that wind speeds at these periods occupy the main part of the wind energy. Due to periodic functions exhibiting harmonic behavior, this means that the power spectral density of a periodic function generates energy components at integer multiples of its fundamental frequency. Therefore, for daily periodic oscillations, power spectral peaks appear at intervals such as one half and one quarter of the period (12 and 6 h). Due to the influence of background noise, the characteristics of power spectral densities with periods ranging from 1 h to 6 h are not obvious, and further filtering of wind speed data may be required to extract the corresponding phenomena with smaller-scale fluctuation periods. By analyzing the power spectral density of wind speed signals, control strategies and parameter settings for wind turbines can be optimized to improve their power generation efficiency and reliability.
Figure 5b displays the power spectral density distribution of wind speed throughout the year. In comparison with the independent power spectra of each season, it exhibits more distinct periodic features. Notably, there is a prominent peak in the power spectral density line with a period of 8 h, which is absent in other seasons. This suggests the existence of a vibration that is prone to being masked by high-frequency noise but persists throughout the year. Further discussion is needed to elucidate the mechanism underlying this variation.
Due to the predominance of ocean surfaces in low-latitude regions, observations of wind fields in low-latitude regions are scarce but valuable. They can be used for evaluating wind power resources, understanding seasonal variations in wind speed for effective wind turbine management, and analyzing reanalysis data for error evaluation. This information is crucial for preparing energy sources and ensuring the stability of the electricity system. However, in wind resource analysis studies, it is common to use wind speed data at a height of 80 m as the basis for evaluation. This differs from the height of 10 m used in this study, suggesting that further processing of the observational data may be necessary.
5. Conclusions
This study mainly investigates the wind energy resource characteristics in the southern coast of Sri Lanka. The monsoon is the main influencing factor on the wind field in this area. During the monsoon period, the wind field presents a highly ordered wind direction and stronger wind power, whereas during the non-monsoon period, the wind field is more scattered and unstable, resulting in less available wind energy. Wind speed exhibits significant diurnal variations, showing a single peak curve similar to the diurnal radiation variation. This diurnal variation is more common in low-latitude coastal areas and may affect the load of offshore wind energy utilization.
Through the spectral analysis of wind speed data, it is found that there is a spectral peak with a 24 h period in the wind speed oscillation, and the spectral peaks of different seasons are all at similar periods. Moreover, local peaks with periods of 12, 6, and 3 h appear in the wind speed spectra of different seasons, indicating that wind speeds with these periods occupy the main part of the wind energy. The power spectral density distribution of wind speed signals exhibits a peak with an 8 h period throughout the year, which does not exist in single season. This indicates the presence of a vibration that is easily masked by high-frequency noise but persists throughout the year, and its variation mechanism needs to be further studied.
The southern coastal region of Sri Lanka boasts abundant wind energy resources. During the monsoon period, there is a stable supply of wind from the southwest direction. This consistent monsoonal wind supply creates favorable conditions for wind energy generation. Additionally, the region exhibits noticeable diurnal oscillations, with higher wind speeds typically observed during daylight hours, correlating with surface solar radiation changes. This characteristic helps to determine optimal electricity generation periods and to optimize wind turbine operation strategies. Harnessing the rich wind energy resources along the southern coast of Sri Lanka can reduce greenhouse gas emissions and provide sustainability and stability to the country’s energy supply.


 ,
, 


