Article

The Interaction between Storm Surge and Concomitant Waves in Shandong Peninsula

1
Key Laboratory of Ocean Circulation and Waves, Institute of Oceanology, Chinese Academy of Sciences, Nanhai Road, 7, Qingdao 266071, China
2
Laboratory for Ocean Dynamics and Climate, Pilot National Laboratory for Marine Science and Technology (Qingdao), Wenhai Road, 1, Qingdao 266237, China
3
Center for Ocean Mega-Science, Chinese Academy of Sciences, Nanhai Road, 7, Qingdao 266071, China
4
Century Marine Information Technology, Yangfan Road, 999, Ningbo 345100, China
*
Authors to whom correspondence should be addressed.
J. Mar. Sci. Eng. 2023, 11(9), 1759; https://doi.org/10.3390/jmse11091759
Submission received: 14 August 2023 / Revised: 4 September 2023 / Accepted: 6 September 2023 / Published: 8 September 2023
(This article belongs to the Section Coastal Engineering)

Abstract

:
Storm surge and concomitant waves induced by extreme weather systems can significantly modulate the marine dynamic environment. In this study, we used the Advanced Circulation-Simulating Waves Nearshore (ADCIRC-SWAN) coupled model to analyze spatiotemporal variation in dynamic processes during two types of weather systems, i.e., typhoons and extratropical storms, in the sea area near the Shandong Peninsula. The effects of waves on water level, water level change on wave height, and currents on wave height were investigated and quantified separately by performing sensitivity experiments. Our results showed that the interaction between water level change and waves occurred mainly in the nearshore zone. The wave-induced surge accounted for about 10–15% of the total storm surge. The water level change-induced significant wave height reached up to 0.9–1.3 m. Wave–current interaction occurred mainly in the offshore zone and was related to the relative angle between wave and current directions. The modulations of water level and wave height were strongly dependent on not only storm track and intensity but also topography and coastline shapes.

1. Introduction

Storm surge is an abnormal rise and fall of seawater due to violent atmospheric disturbances, usually referred to as typhoons, cold waves, and extratropical cyclones. It is a very serious catastrophic natural phenomenon occurring in coastal sea areas [1,2]. Storm surge is generally divided into storm surge induced by typhoons and storm surge induced by extratropical storms (extratropical cyclones or cold waves). Storm surges induced by typhoons are among the world’s deadliest and most destructive natural disasters due to their high intensity and rapid occurrence [3]. Storm surges induced by extratropical storms develop relatively slowly but can result in larger areas of high water levels with longer duration than storm surges induced by typhoons. Storm surges induced by typhoons occur mostly in the western Pacific Ocean, the Bay of Bengal, and the Caribbean Sea, while storm surges induced by extratropical storms occur mostly in the Bohai and Yellow Sea, the North Sea, and the Baltic Sea. Waves with significant height over 4 m caused by strong atmospheric disturbances are referred to as catastrophic waves. When storm surge disasters occur, they are often accompanied by serious wave disasters.
Storm surge and waves are not independent of each other. In fact, there is a strong interaction between them. Changes in water level and current field affect wave propagation, wave breaking, and other wave characteristics. In turn, the surface and bottom stresses modulated by waves and the radiation stress generated by waves affect the water level and current field [4]. Waves can cause an increase in water level of 30–40% in steep slope areas and 10–20% in continental shelf areas [5,6,7]. Zhao et al. [8] found that the effect of storm surge on wave height was about 10%, and that the effect of tide and terrain on wave height could reach 25%. The accuracy of storm surge and concomitant wave simulations is strongly affected by their coupling [9,10]. A number of researchers have reviewed the current status of storm surge forecasting methods and proposed comprehensive studies on the surge–wave coupling effect in marine disasters to improve the accuracy of forecasting [2,11].
In recent years, coupled numerical models have been developed to study the interaction between storm surges and concomitant waves. Wave–current coupling models range from simple to complex, from structured grid to unstructured grid, and from one-wave coupling to two-way coupling. Dietrich et al. [12] coupled the Advanced Circulation (ADCIRC) model and the Simulating Waves Nearshore (SWAN) model, which can exchange data in the same computational grid, and achieved good results. Currently, the ADCIRC-SWAN coupled model is widely used by researchers and institutions worldwide. Xu et al. [13] combined ADCIRC and SWAN models to establish a coupled model in the East China Sea, analyzed the water level and wave characteristics, and pointed out that radiation stress had a significant impact on storm surge. Marsooli and Lin [14] conducted a quantitative study on wave-induced surge and its spatial distribution during tropical cyclones from 1988 to 2015 in the northwestern Atlantic with the ADCIRC-SWAN coupled model. Li et al. [15] studied the impact of typhoon size and intensity on the interaction between storm surge and waves in the South China Sea using a coupled ADCIRC-SWAN model, emphasizing the importance of wave effect in the simulation of typhoon-induced storm surge. Ji et al. [16] discussed the various parameter terms of the SWAN model and analyzed the impact of tidal current on wave simulation.
Shandong Peninsula, located in the eastern coast of China, has a long and winding coastline and rich marine resources (Figure 1). It is one of the few regions in the world that are strongly affected by both storm surge induced by typhoons and storm surge induced by extratropical storms. Early researchers analyzed the type, quantity, intensity, characteristics, and spatial–temporal distribution of storm surges along the coast of Shandong through historical records and observation data [17,18,19,20]. With the development of computer technology and various ocean models, coupled models were used to simulate marine dynamic processes during strong winds off Shandong Peninsula. These simulation results were more consistent with the measured data when the wave–current interaction was included than when it was not [21,22,23,24]. Liu et al. [25] conducted numerical simulations for the Bohai and Yellow Seas using a three-dimensional coupled numerical model to systematically study the effects of waves on storm surge from three aspects: changing surface stress, changing bottom stress, and inducing radiation stress. Fu et al. [26] used two numerical models to simulate the storm surge induced by extratropical storms and compared the accuracy of different models. Feng et al. [27] used ADCIRC to study the storm surge generated by typhoons in Qingdao, Shandong Province, and analyzed the impact of sea level rise on storm surge. Using data from the Bohai Sea, Fan et al. [28] obtained a good simulation of the storm surge generated by an extratropical storm by modifying the wind field in the NCEP reanalysis.
In recent years, research on the characteristic patterns and mechanisms of the interaction between storm surge and waves has been well developed, but there is a lack of comparison of the similarities and differences under different kinds of weather systems. In this study, we selected the coastal area in the Shandong Peninsula as the key research area and conducted a systematic and comparative study on the interaction between storm surge and waves caused by typhoons and extratropical storms. We aim to quantitatively summarize the commonalities and differences of interaction between storm surge and concomitant waves during different extreme weather systems. The rest of this article is organized as follows. Section 2 presents the model description and configuration, introduces the representative storm events, and explains the model experiments. In Section 3, we estimate and discuss the interactions among waves, current, and water level. The conclusions are summarized in Section 4.

2. Coupled Wave–Current Model

2.1. Model Description

We used the ADCIRC-SWAN coupled model in this study. The ADCIRC model, jointly developed by the University of North Carolina and University of Notre Dame, is an advanced three-dimensional finite element numerical model specifically for generating long-term hydrodynamic circulation along the continental shelf, along the coast, and within estuaries [29]. The use of triangular grids with different resolutions improves computational efficiency. The ADCIRC has good applicability in numerical simulation and is currently widely used internationally. Many researchers have applied the ADCIRC model to simulate storm surge and study the impact of storm track, radius, and intensity on storm surge distribution [30,31,32].
The SWAN model is developed and maintained by Delft University, based on the spectral action balance equation. The SWAN can simulate wave deformation in shallow nearshore areas, wave refraction caused by water level change and currents, wave breaking caused by bottom friction, whitecapping and shoaling, and wave diffraction and reflection caused by obstacles. Researchers have applied the SWAN model to study the characteristics and growth relationships of wind waves and wave effect on storm surge during typhoons, hurricanes, and cold waves [33,34].
In the coupled model, SWAN is driven by the wind speed, water level, and current field calculated by the ADCIRC, and ADCIRC is driven by the wave radiation stress gradient calculated by the SWAN at the nodes. Both models can operate on the same unstructured grid, which is very conducive to dealing with wave–current interactions.

2.2. Model Configuration and Validation

The coupled model was configured based on settings used by Wang et al. [35]. The ADCIRC was used in two-dimensional mode. The model domain covered the Shandong Peninsula from 28° N to 41° N and from 118° E to 129° E. The grid was an unstructured triangular grid. The grid resolution was set below 500 m along the coast of Shandong Peninsula and below 10 km at the open boundaries. The bathymetry was from the General Bathymetric Chart of the Oceans (GEBCO). The meteorological forcings (wind and air pressure) were derived from the fifth-generation ECMWF reanalysis for global climate and weather (ERA5) data. The astronomical tide was added using the harmonic constants of eight main components, namely M2, S2, N2, K2, K1, O1, P1, and Q1, based on the Oregon State University Tidal Prediction Software (OTPS). The ADCIRC, SWAN, and coupling time steps were set to 1 s, 1800 s, and 1800 s, respectively. Each CPU core ran the ADCIRC or the SWAN alternately, which maximizes the efficiency in parallel computing environments [12].
The accuracy of the coupled ADCIRC-SWAN model simulations of astronomical tide, storm surge, and waves was verified in Wang et al. [35] and will not be repeated in this paper.

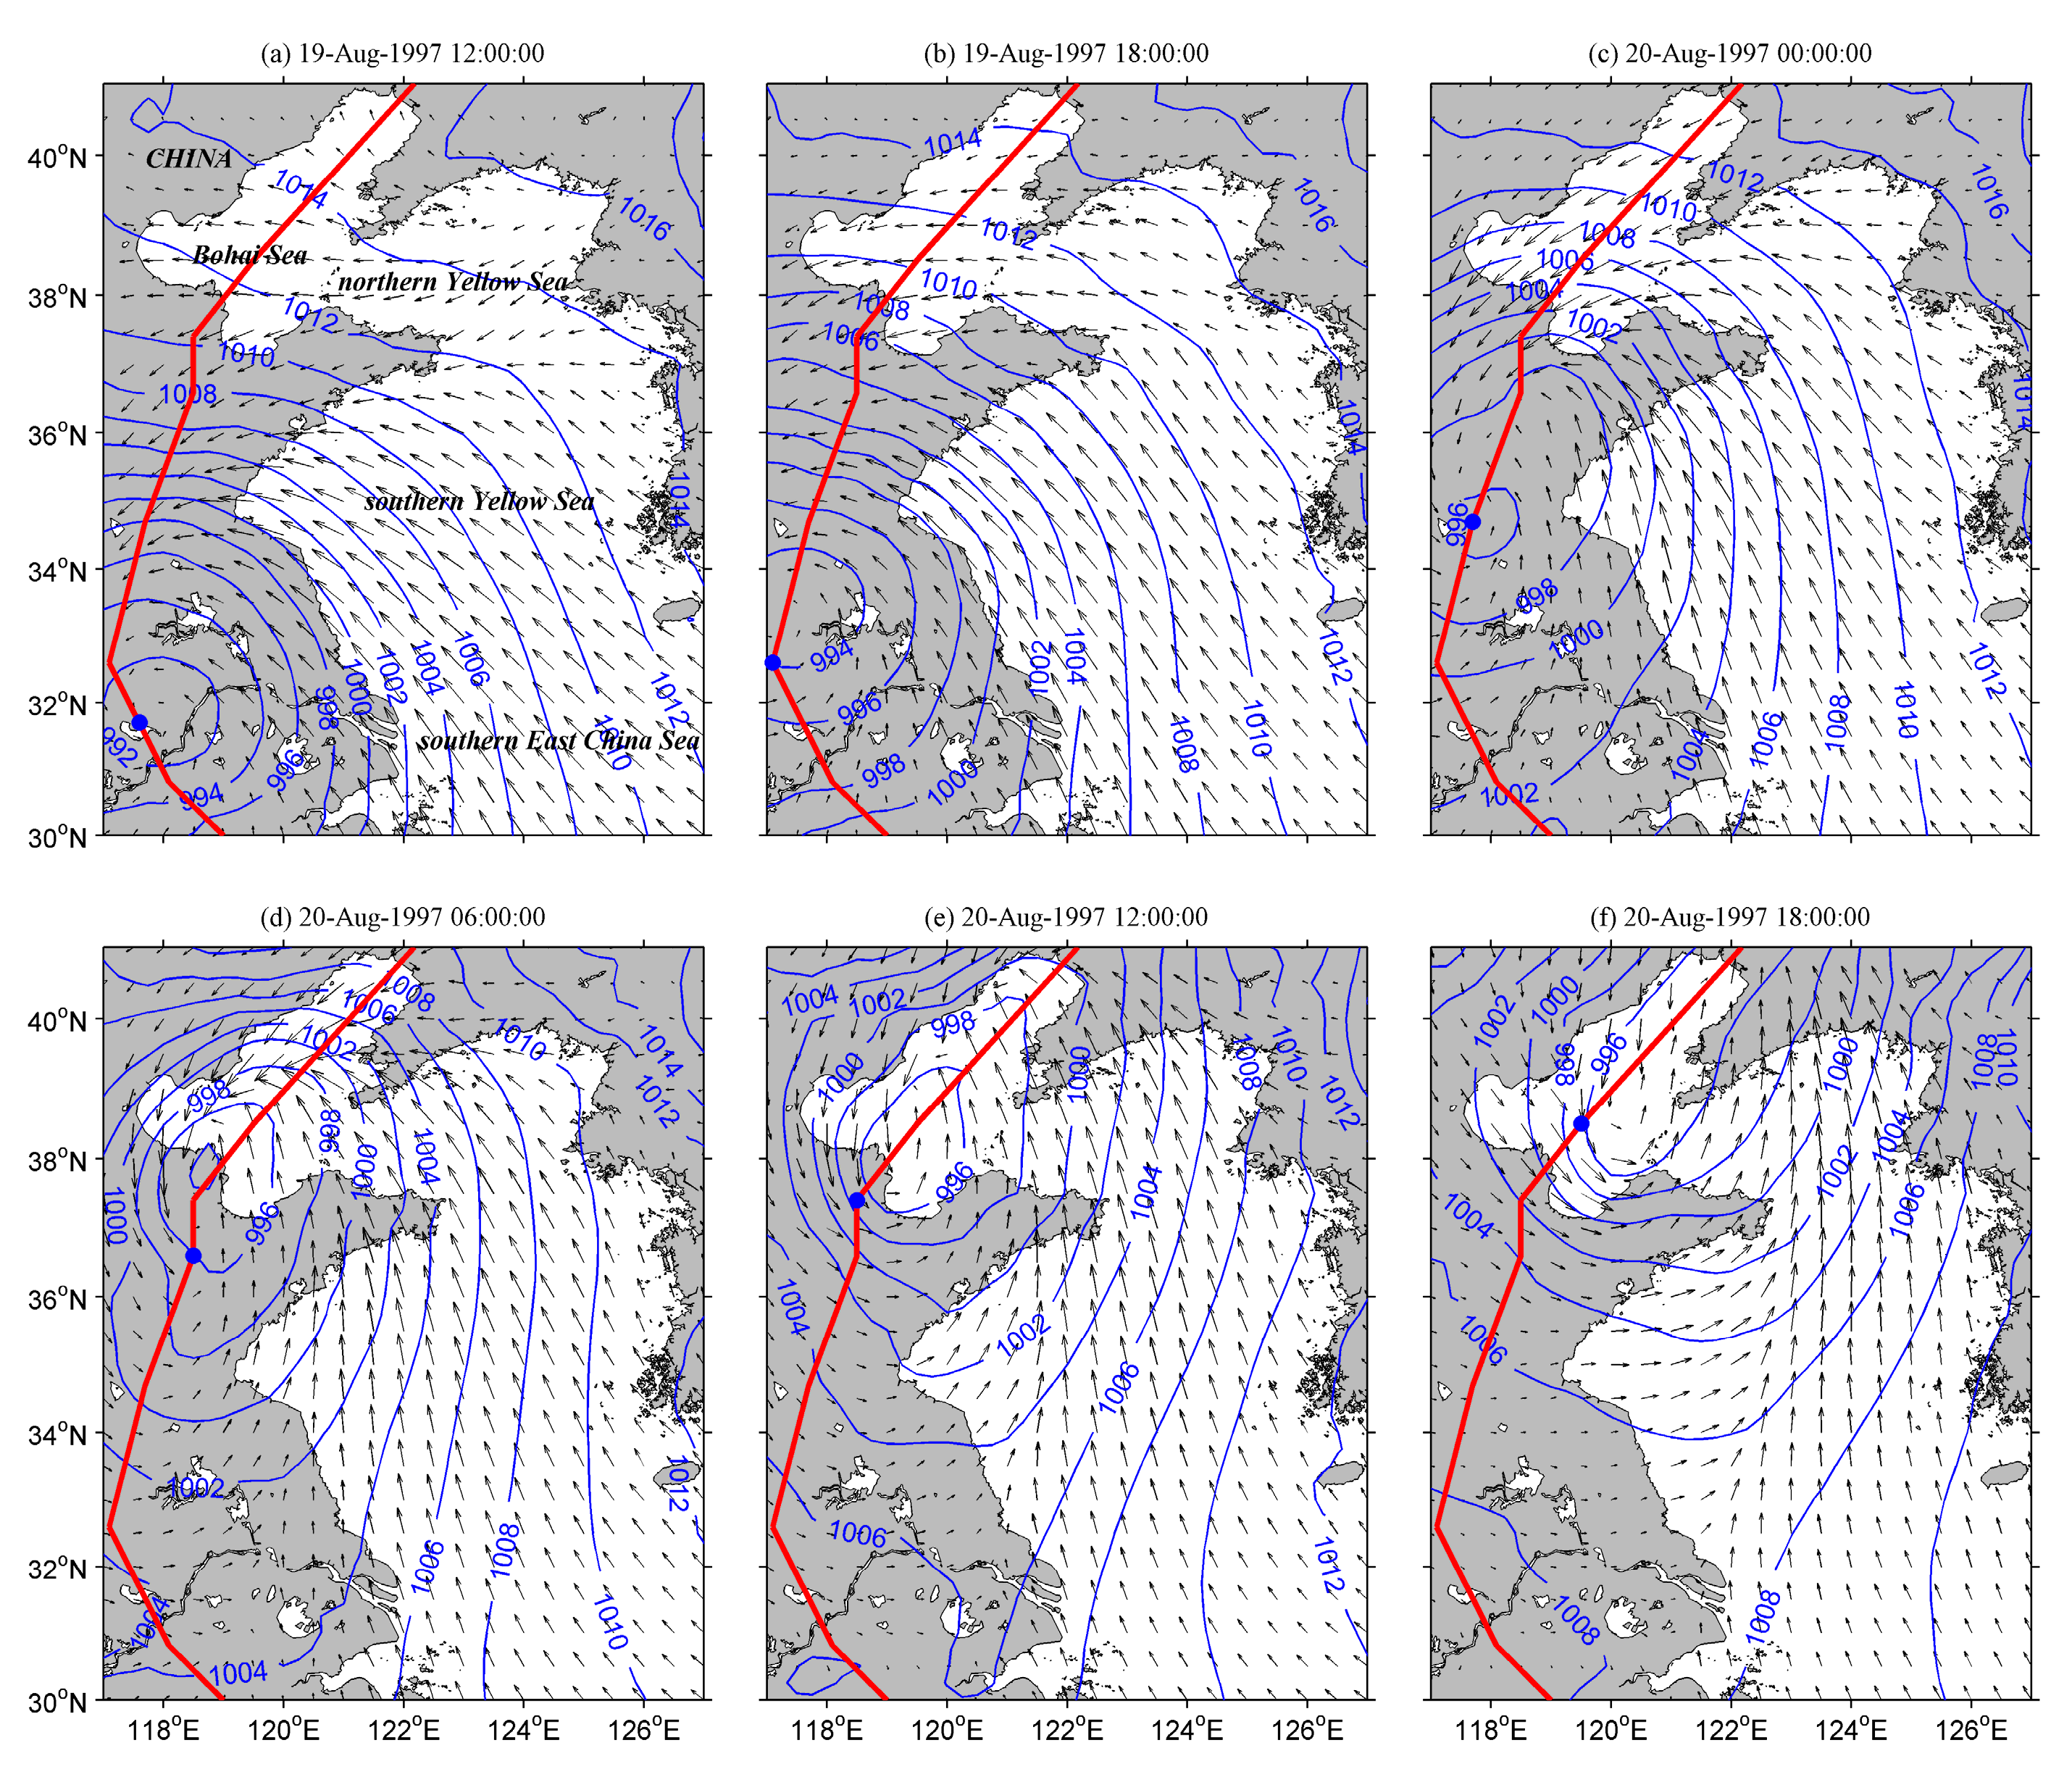
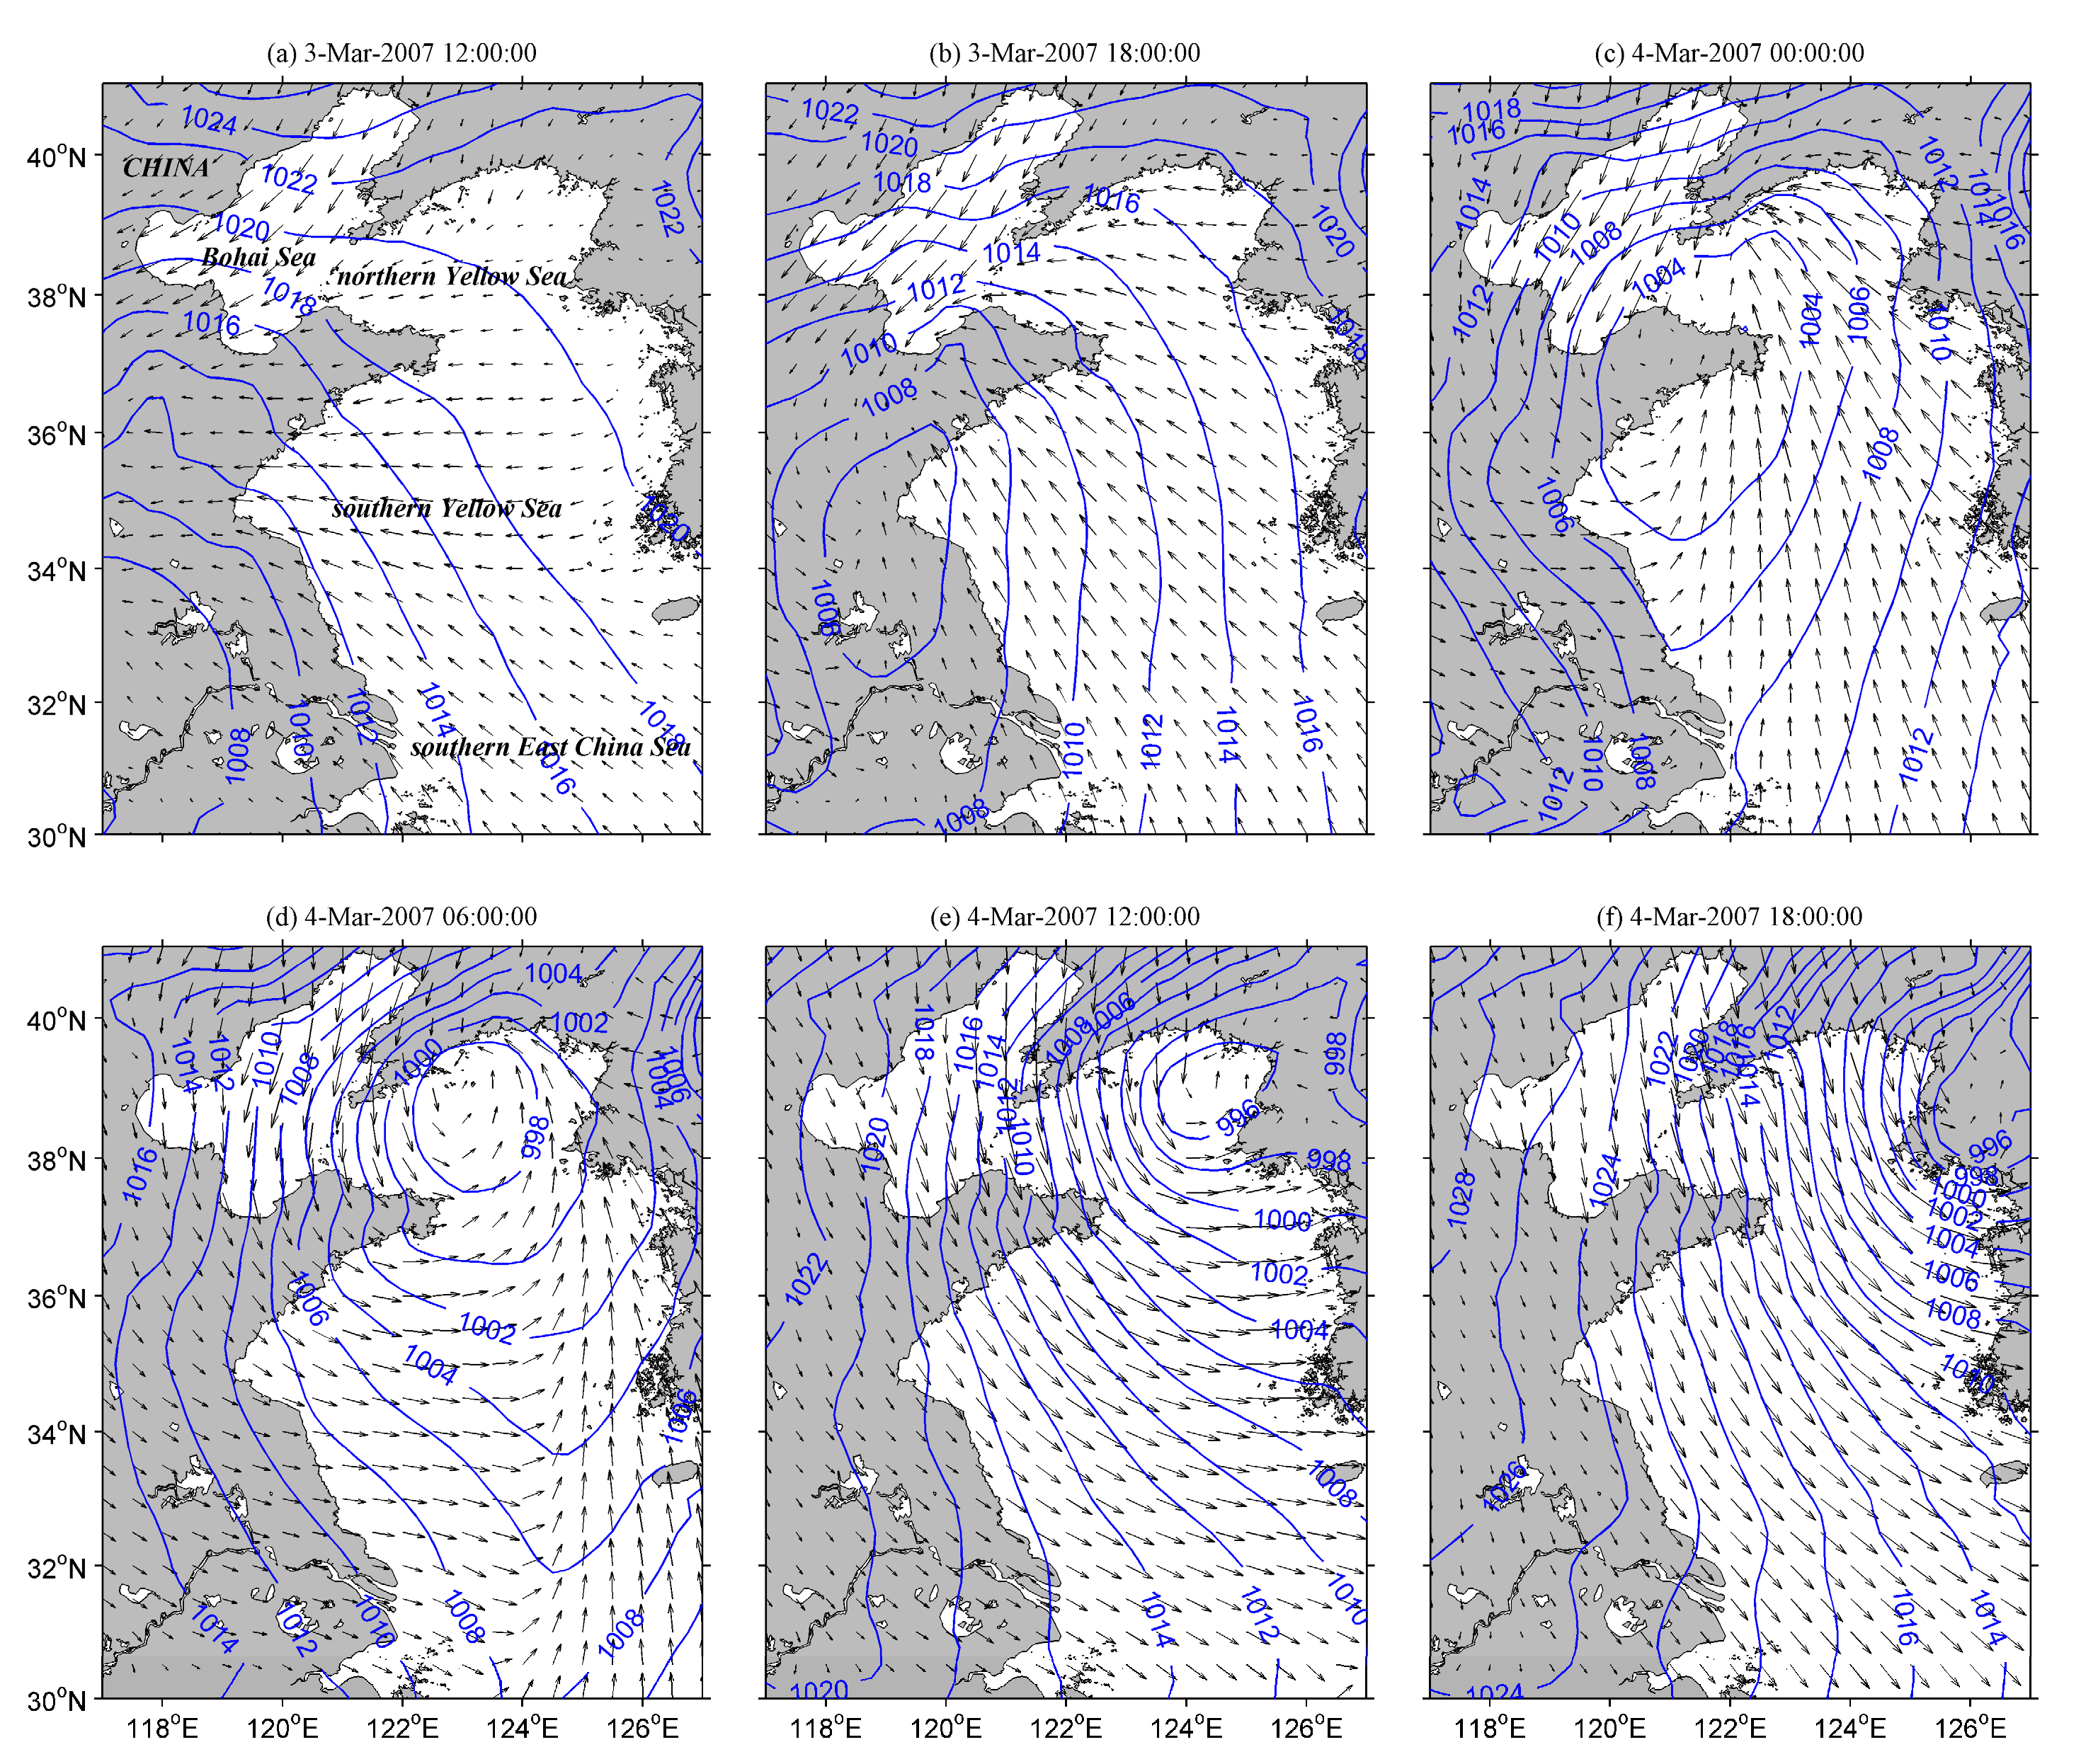
2.3. Storm Events and Model Experiments

In this study, the two severe weather events included a tropical and extratropical storm. According to the Western North Pacific tropical cyclone database created by the China Meteorological Administration (tcdata.typhoon.org.cn) and the ERA5 database, the evolution of the mean sea level pressure and wind vector distributions during the two storm events are shown in Figure 2 and Figure 3. The typhoon track is also shown in Figure 2.
Typhoon 9711 formed on 8 August 1997 (UTC, the same hereinafter) in the Western Pacific and developed into a typhoon on 10 August. It reached peak intensity with a maximum wind speed of 60 m/s on 12 August and formed a super typhoon. Typhoon 9711 moved northwest and entered the southern East China Sea on 17 August. It made landfall on the southeast coast of China on 18 August with wind speeds exceeding 40 m/s. After landfall, Typhoon 9711 moved northward across eastern China as the intensity gradually decreased to tropical storm level. It entered the Bohai Sea and made a second landfall on the coast on 20 August, dissipating after that.
From 3 to 5 March 2007, the coastal area of Shandong Peninsula was hit by a historically rare strong extratropical storm surge due to the combined influence of an extratropical cyclone and a cold air outbreak (cold wave). The south-central Bohai Sea and the Yellow Sea were at the southern edge of the northern cold high pressure and at the northern edge of the southern extratropical cyclone. Most of the extratropical storm surge disasters in the northern East China Sea (including the Bohai Sea and the Yellow Sea) belong to this category, which was named “coupled weather storm surge” by Mo et al. [36]. The strong northeast wind over the Bohai Sea deflected counterclockwise toward the strong northwest wind, while the strong southeast wind blowing over the Yellow Sea deflected clockwise toward the strong northwest wind.
Sensitivity experiments were conducted for these two extreme weather events, as shown in Table 1. Two numerical experiments were run using the ADCIRC model driven by tidal forcing only (EXP1) and by wind, pressure, and tidal forcing (EXP2). Three numerical experiments were run using the ADCIRC-SWAN coupled model driven by wind, pressure, and tidal forcing, one considering the impact of both water level change and current field on waves (EXP3), another considering only the impact of current field on waves (EXP4), and the third considering only the impact of water level change on waves (EXP5). The storm surge was obtained by subtracting the astronomical tide in EXP1 from the simulated water level in EXP2 and EXP3.

3. Results and Discussion

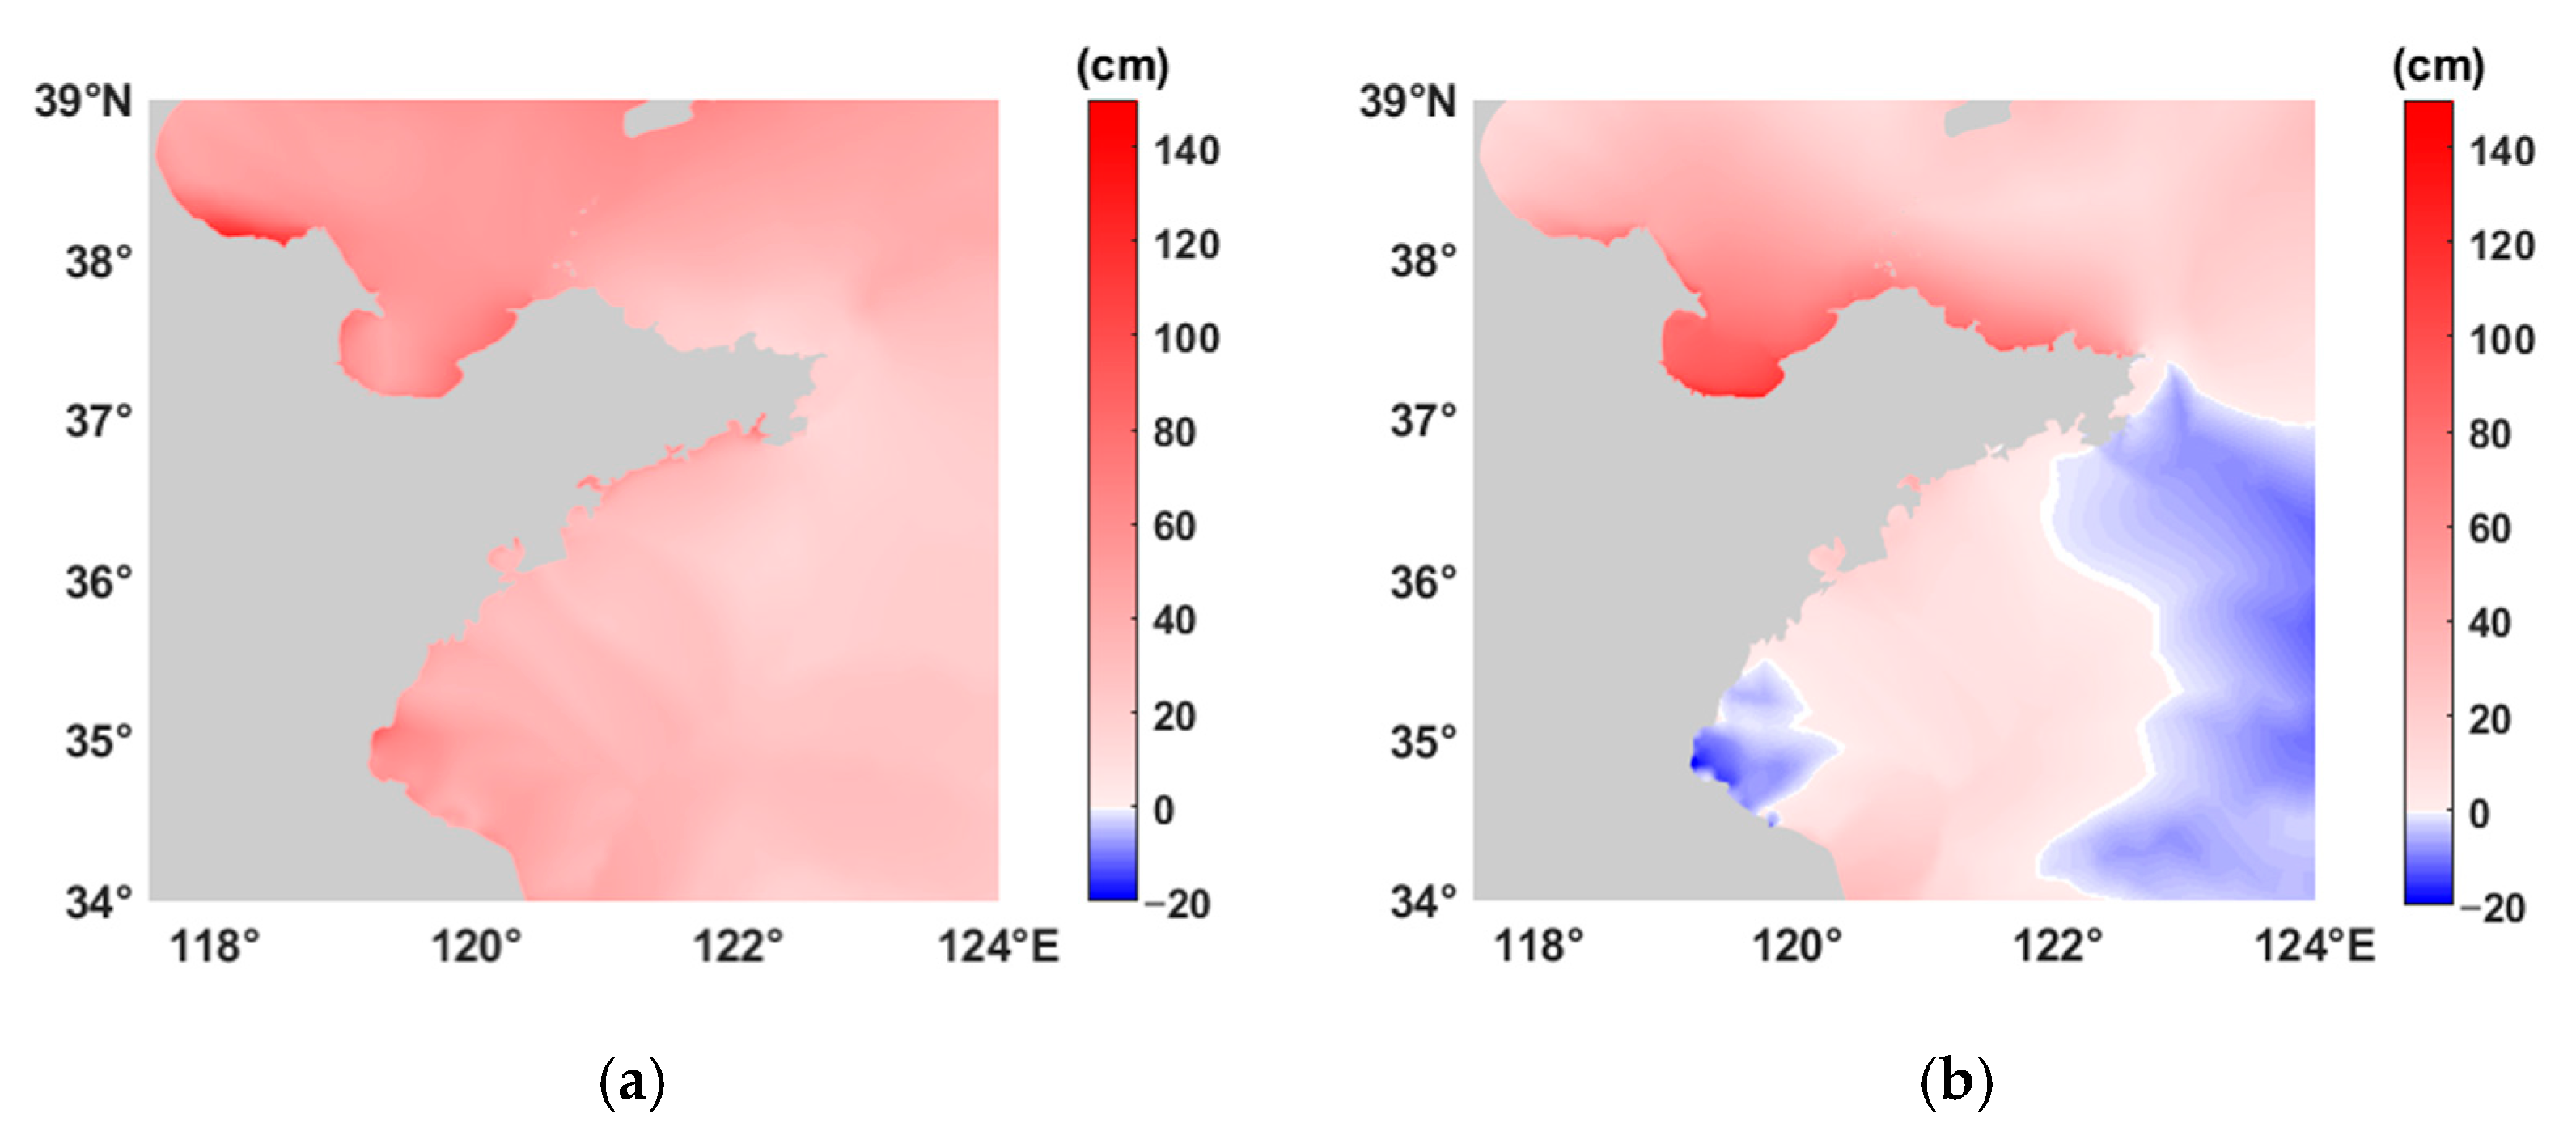
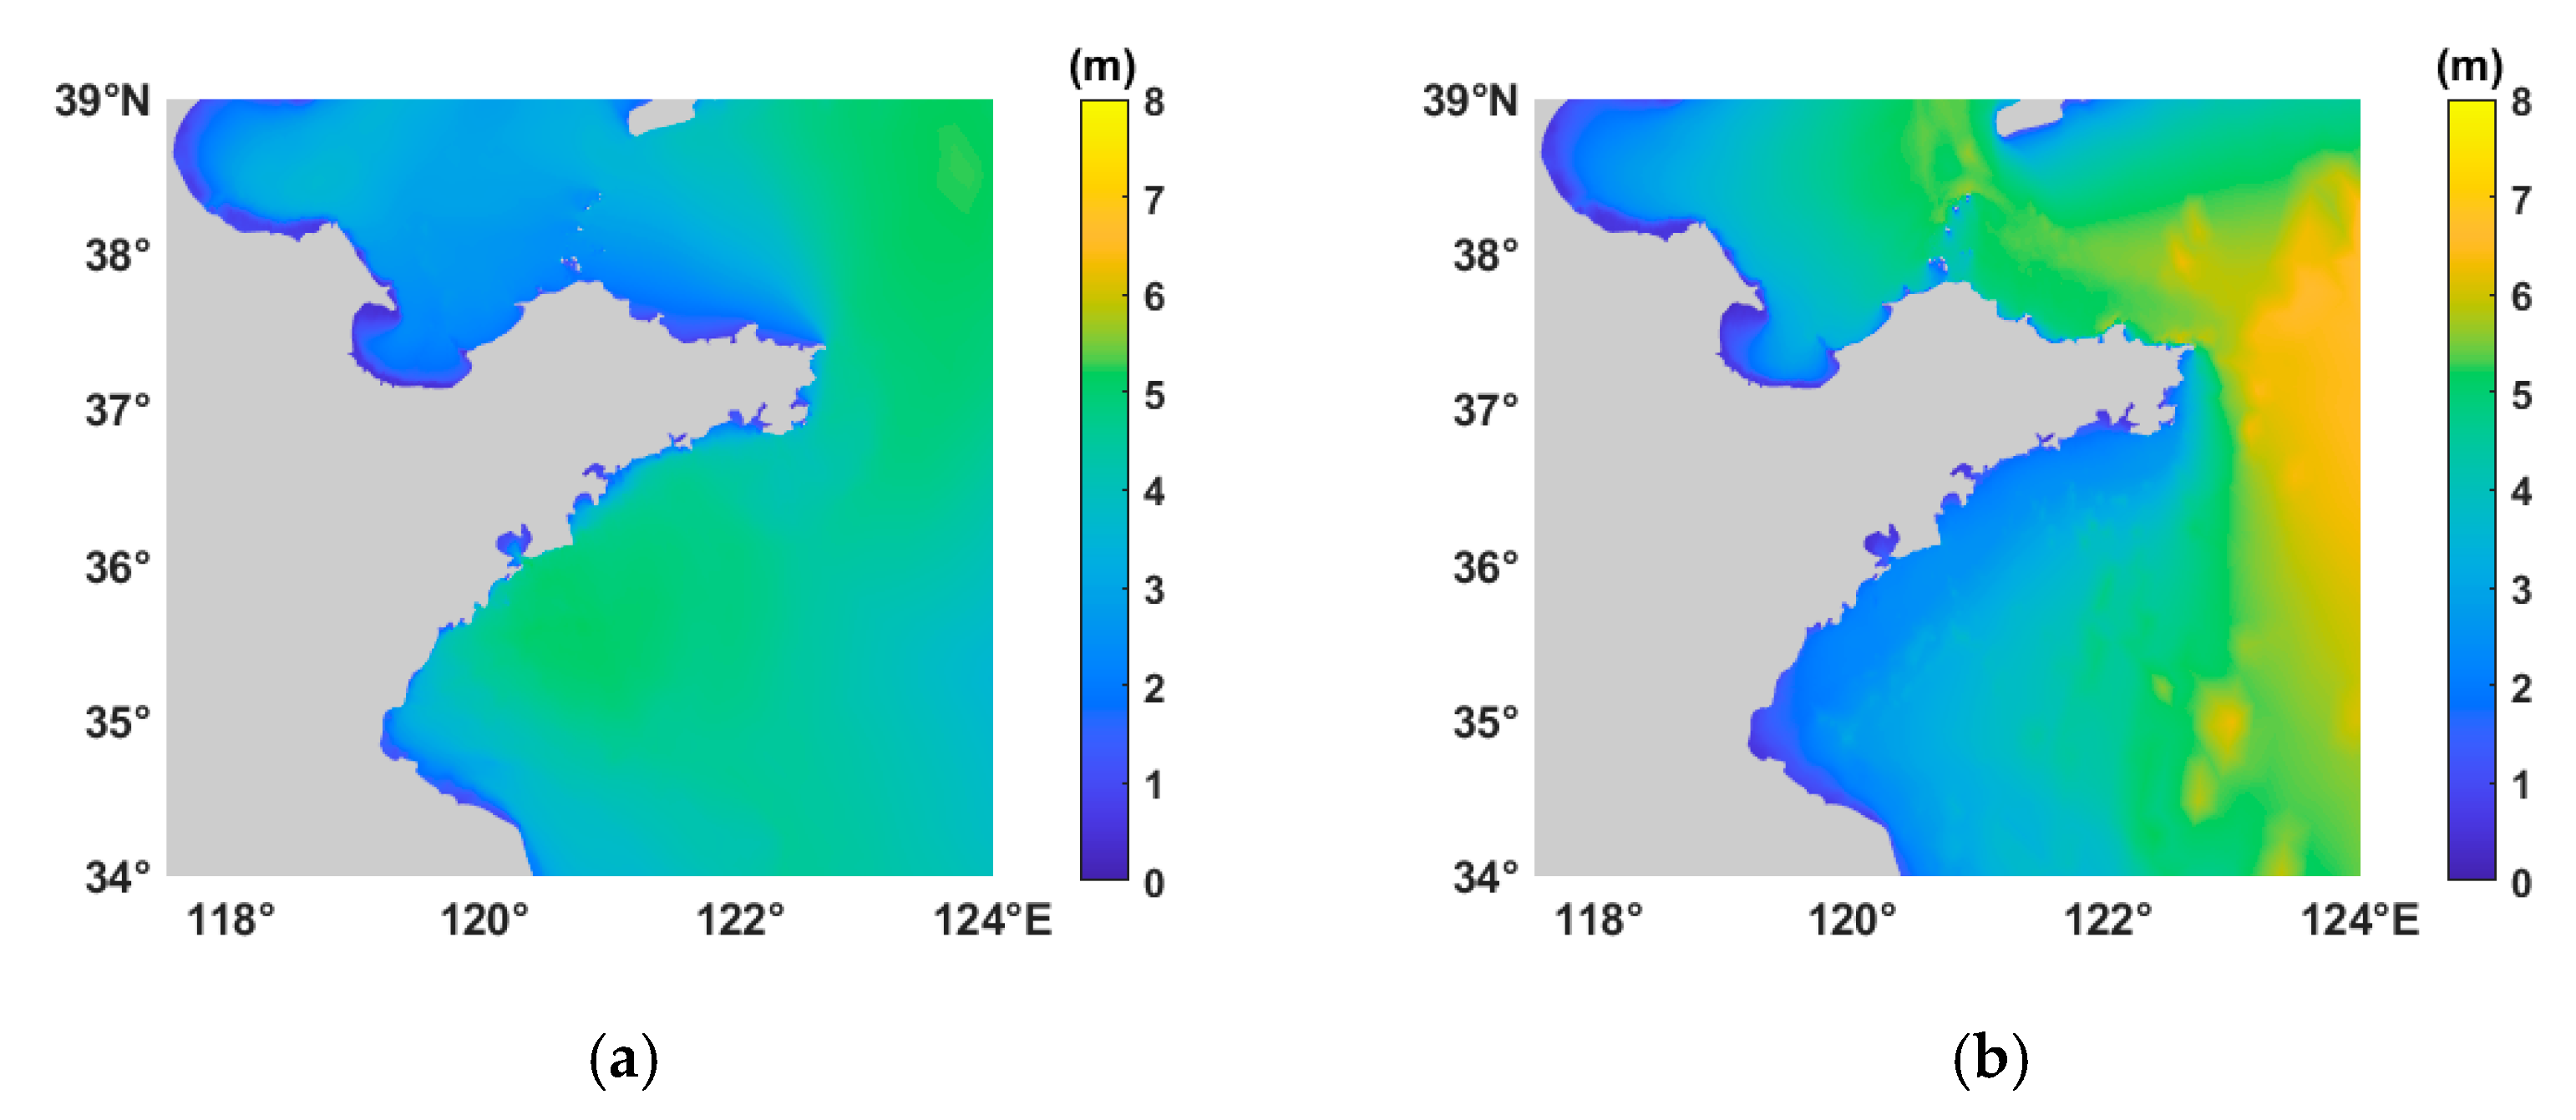
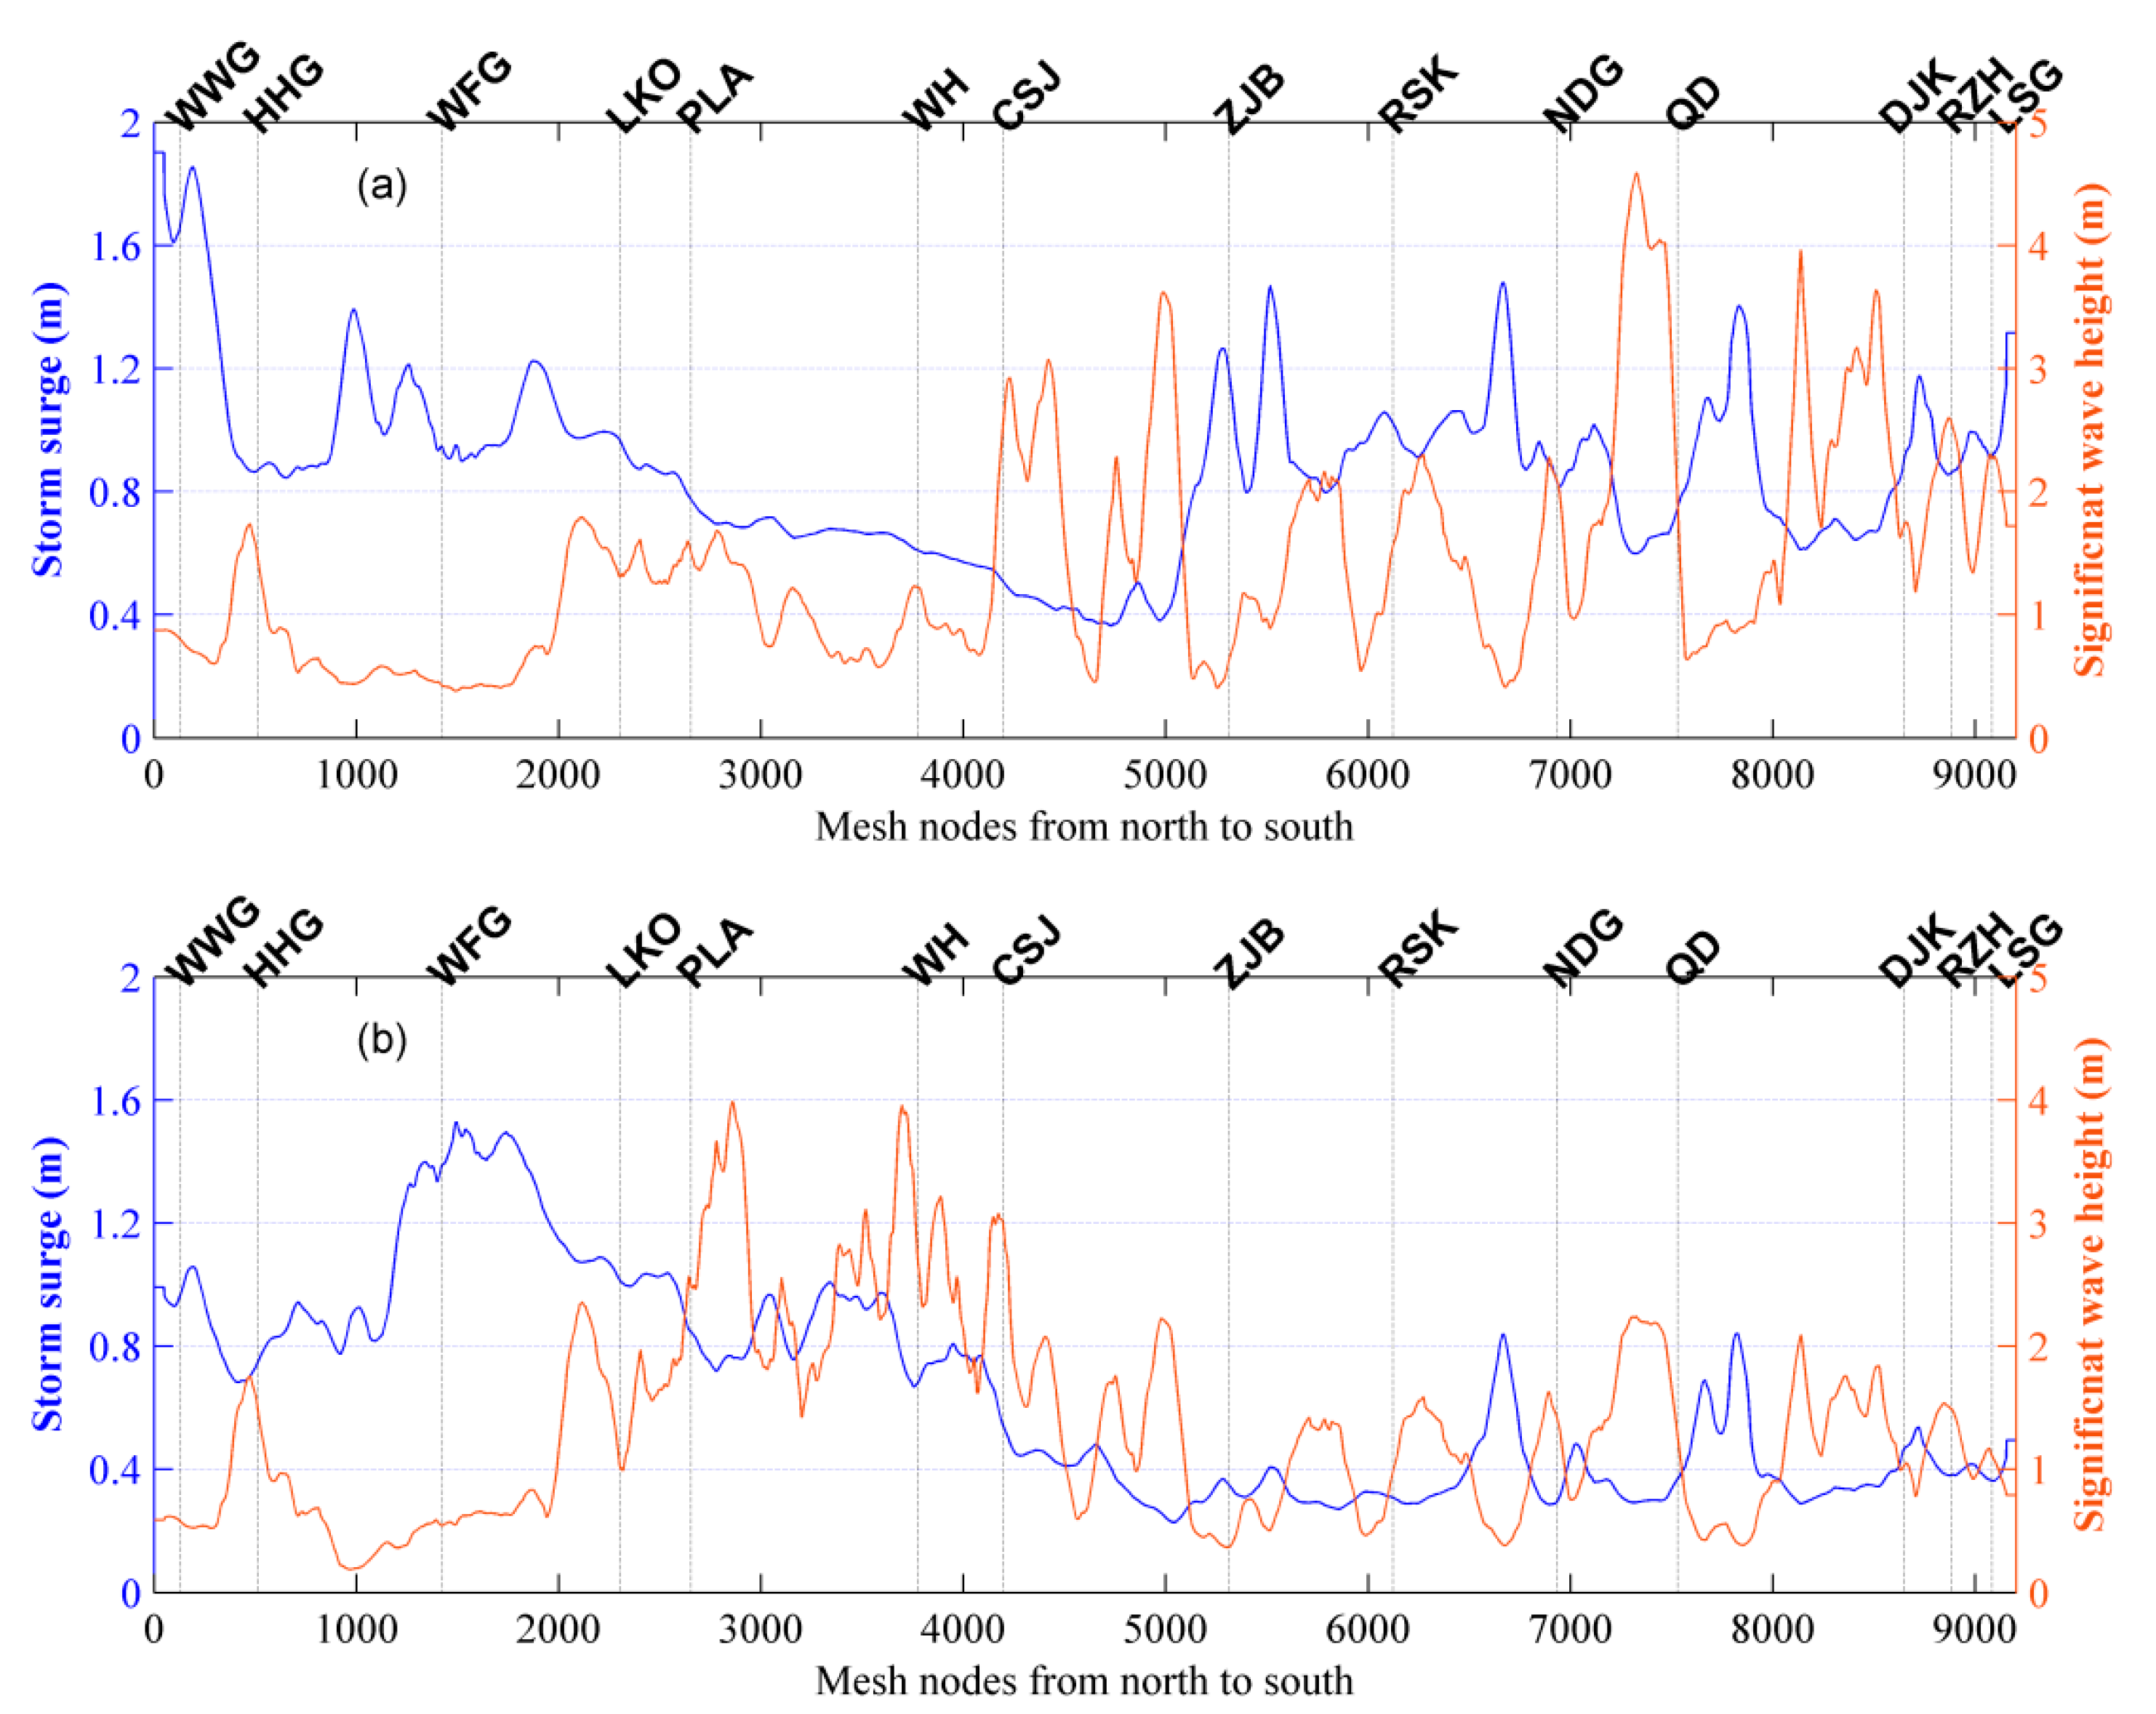
3.1. Distribution of Storm Surges and Waves

The maximum envelopes of the storm surge and the significant wave height during the two storm events as simulated in EXP3 are shown in Figure 4 and Figure 5. As shown in Figure 4, both extreme weather systems produced significant storm surge. The storm surge during Typhoon 9711 was located primarily in the southern end of Bohai Bay, in the southeastern end of Laizhou Bay, and along the southern coast of the Shandong Peninsula. The spatial distribution of storm surge during Extratropical Storm 0703 was obviously different from that of Typhoon 9711. The storm surge during Extratropical Storm 0703 occurred mainly along the northern coast of the Shandong Peninsula, particularly in Laizhou Bay. The significant wave height in the nearshore area was smaller than that of the central area (Figure 5). The waves during Typhoon 9711 were most severe on the east and south sides of the Shandong Peninsula, while the waves during Extratropical Storm 0703 were most severe on the east and north sides of the Shandong Peninsula.
The maximum values of storm surge and significant wave height at each grid point along the Shandong Peninsula from north to south (green points in Figure 1) for the two storm events are shown in Figure 6. For the convenience of analysis, we performed spatial smoothing on the results (and for those below). The storm surge during Typhoon 9711 reached up to 1.0 m in most coastal areas, except the nearshore areas from LKO station to ZJB station. The maximum storm surge during Typhoon 9711, close to 2.0 m, occurred near WWG station. The storm surge during Extratropical Storm 0703 was weaker than that during Typhoon 9711, barely reaching 1.0 m at most stations. The maximum storm surge during Extratropical Storm 0703 was 1.5 m and occurred near WFG station. The significant wave height during Typhoon 9711 was highest south of CSJ station, reaching a maximum of 4.6 m. The significant wave height during Extratropical Storm 0703 was highest in the coastal areas from PLA station to CSJ station, reaching a maximum of 4.0 m. As shown in Figure 6, the wave height fluctuated more along the coast than the storm surge did. The wave height maxima occurred at capes or on landward-depression coasts, while the wave height minima occurred in bays or on seaward-depression coasts. When waves propagate to the nearshore, the wave steepness increases and waves break in patterns determined by topography, water depth, and coastal currents. Wave height in shallow water depends on the energy dissipation caused by topography rather than wind energy input [37].
When the typhoon track was perpendicular to the shoreline, the most destructive storm surge appeared in areas under onshore winds to the right of the typhoon track [38,39,40]. A large proportion of typhoons passing through the East China Sea, including Typhoon 9711, move northward over land and make landfall at the Shandong Peninsula. During Typhoon 9711, the maximum storm surge appeared to the left of the typhoon track. It was produced by local winds forcing seawater to accumulate onshore as well as by shoreline constraints. When a typhoon transits the open sea, the strongest winds and waves are located to the right front of the typhoon center. However, the asymmetry of wave heights on either side of the typhoon track is almost negligible in shallow water areas. This is because wind waves in shallow water are controlled mainly by wave breaking due to shallowing water depth and wave refraction caused by topography. The influence of wind in these circumstances is relatively weak [37,41].

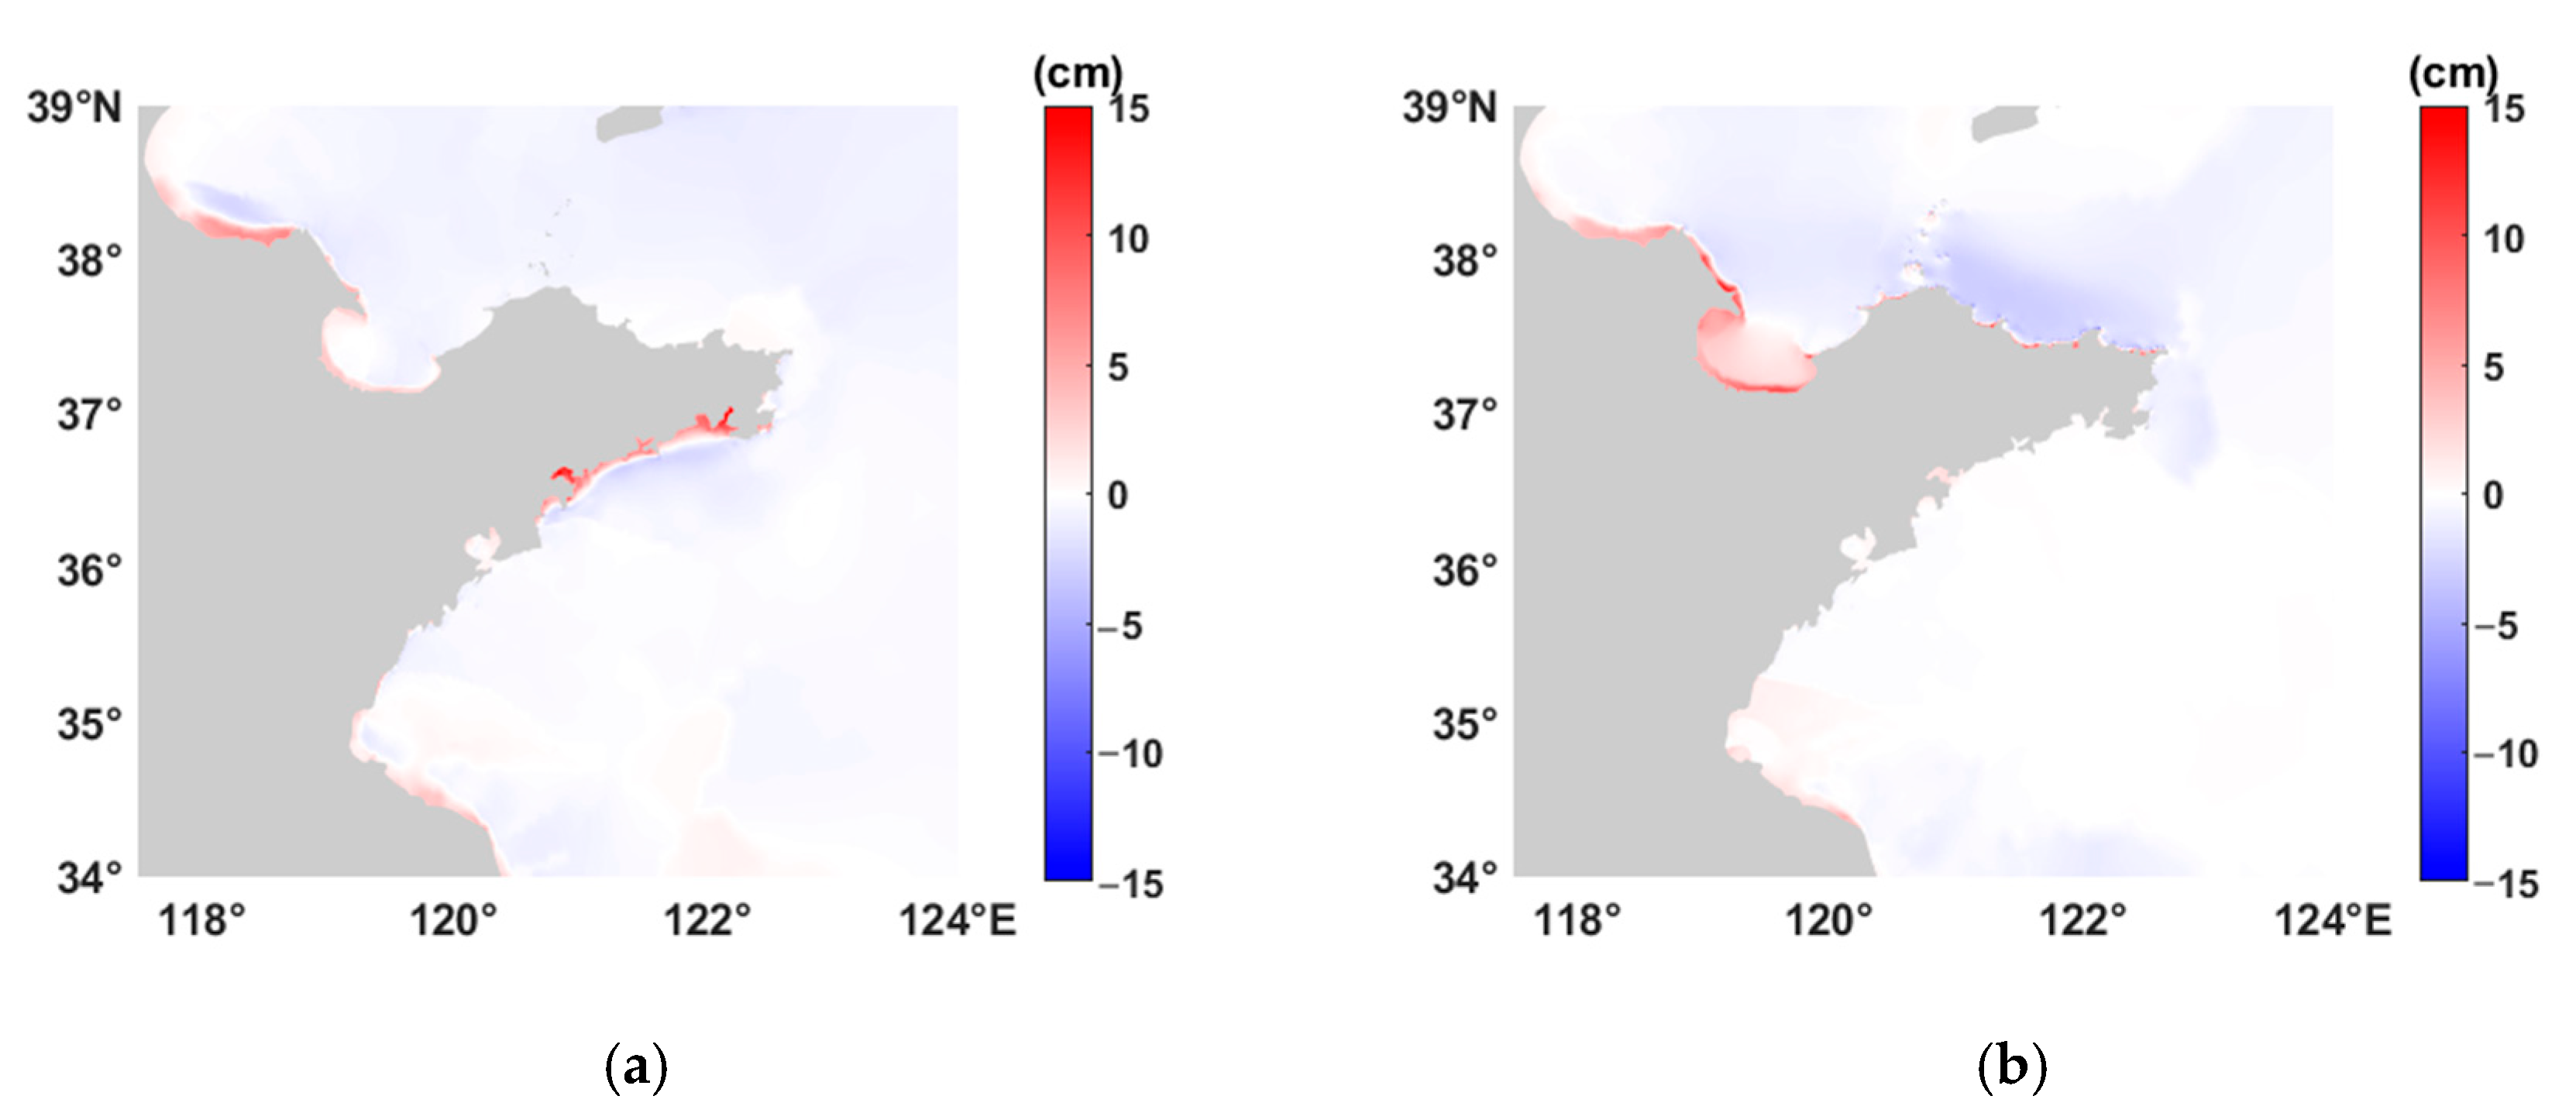
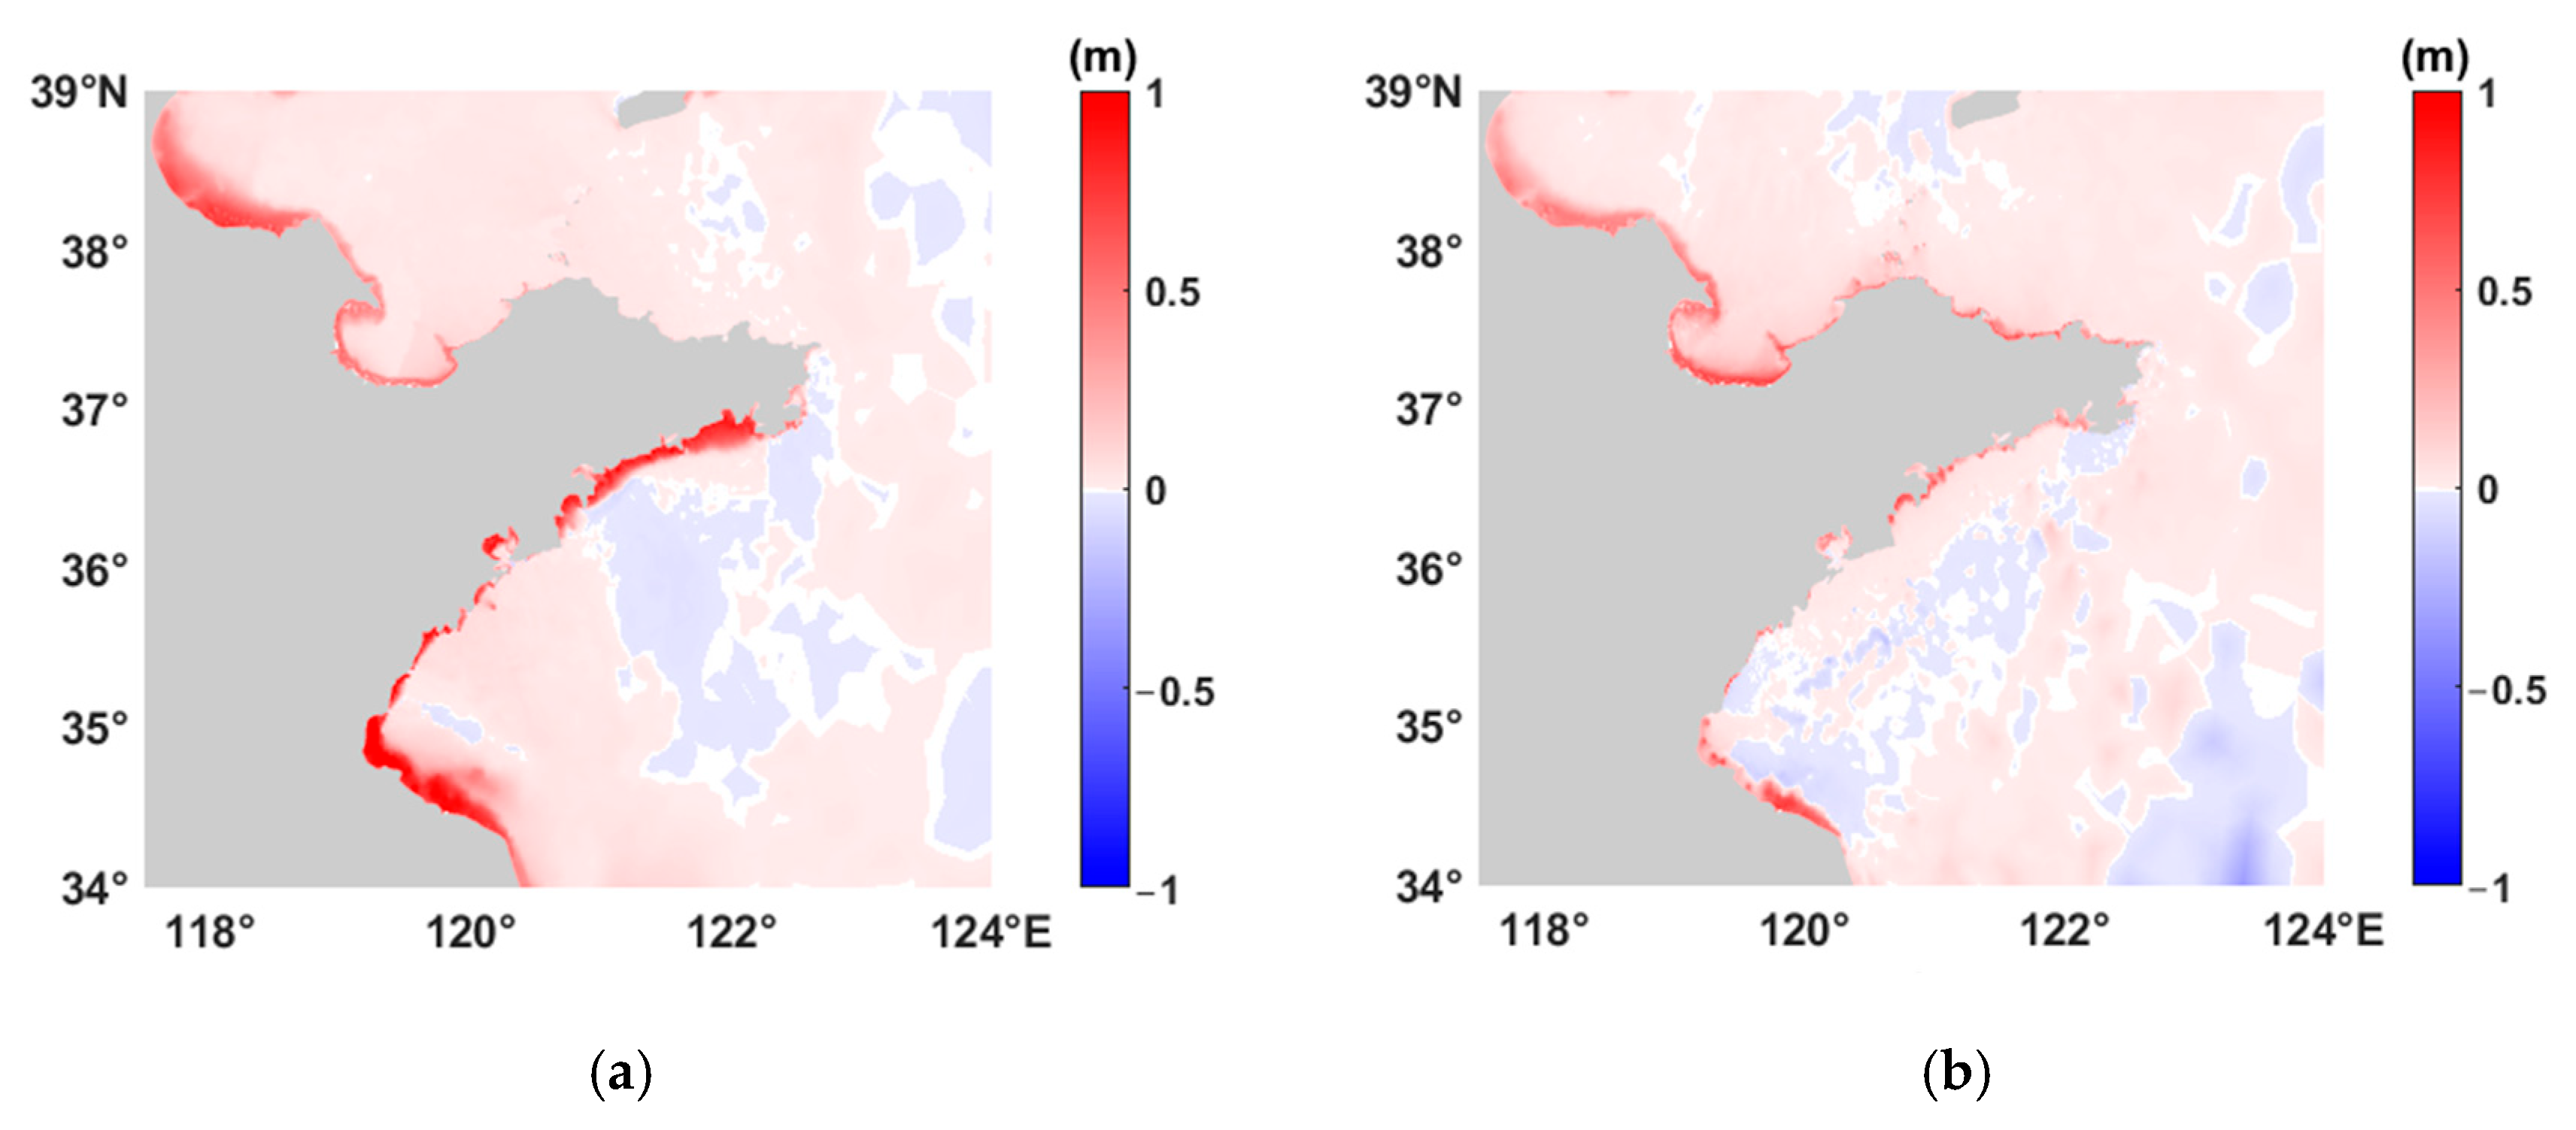
3.2. Impact of Waves on Storm Surge

To examine the wave effect on storm surge, we compared the maximum storm surge difference between EXP2 and EXP3 during the two storm events (Figure 7). The wave-induced surge occurred primarily in the nearshore areas. The spatial distribution of wave-induced surge varied with different weather systems. The wave-induced surge during Typhoon 9711 occurred mainly near the southern coast of Shandong Peninsula and the southern end of Bohai Bay and was similar to the spatial distribution of maximum storm surge. The wave effect increased the storm surge onshore while it decreased the storm surge offshore. During Extratropical Storm 0703, the positive wave-induced surge occurred mainly in Laizhou Bay and near the southern end of Bohai Bay. The negative wave-induced surge occurred near the northeast coast of Shandong Peninsula. The maximum storm surge changed by 10–20 cm due to the wave effect.
The wave information in the SWAN model was transmitted to the ADCIRC model in the form of a radiation stress gradient. The radiation stress gradient was small far from the coast. When waves propagate to the nearshore, they break, enhance upper-ocean mixing, and promote momentum and mass exchange between waves and currents. Subsequently, with the rapid reduction of wave height, wave pressure changes rapidly and increases the radiation stress. In addition, when strong waves propagate to shallow nearshore areas, they strengthen the sea surface and increase bottom roughness.
We compared the distribution of wave-induced surge with the distribution of wind field, wave height, and wave direction during the two storm events (Figure 8 and Figure 9). Due to the terrain limitations of the semi-enclosed sea area, the wind fetch was restricted and waves could not fully develop. Waves in coastal areas of Shandong Peninsula during the two storm events were mainly wind waves. The distribution of extreme wave height was basically consistent with extreme wind speed, so the wave direction and wind direction were basically the same. Wave-induced surge occurred mainly in the nearshore area where strong waves propagated shoreward. When the wave height was small or when it decreased, the wave effect on storm surge was small, regardless of whether waves propagated shoreward. We also noted that the wave effect was stronger in the bay than along the shoreline area, because the bay mouth had a gathering effect on waves and was not conducive to water outflow.
Figure 10 shows the maximum wave-induced surge and its proportion of the total storm surge at each grid point during the two storm events along the coast of Shandong Peninsula. For Typhoon 9711, the wave-induced surge was most significant near the coast from ZJB to NDG station, with a maximum of 16 cm. It was relatively small (less than 5 cm) along other sections of the coast. By contrast, the wave-induced surge from Extratropical Storm 0703 was larger on the northern coast of Shandong Peninsula than on the southern coast of Shandong Peninsula, with a maximum of 12 cm near HHG station. The proportion of wave-induced surge to the total storm surge was up to 10–15%. The proportion distribution along the coast was basically consistent with the wave-induced surge. High and low wave-induced surges alternated along the coast. In contrast to wave height, the wave-induced surge was significant in the bay area, such as at ZJB. The wave-induced surge could be ignored in the cape area, such as at WH.

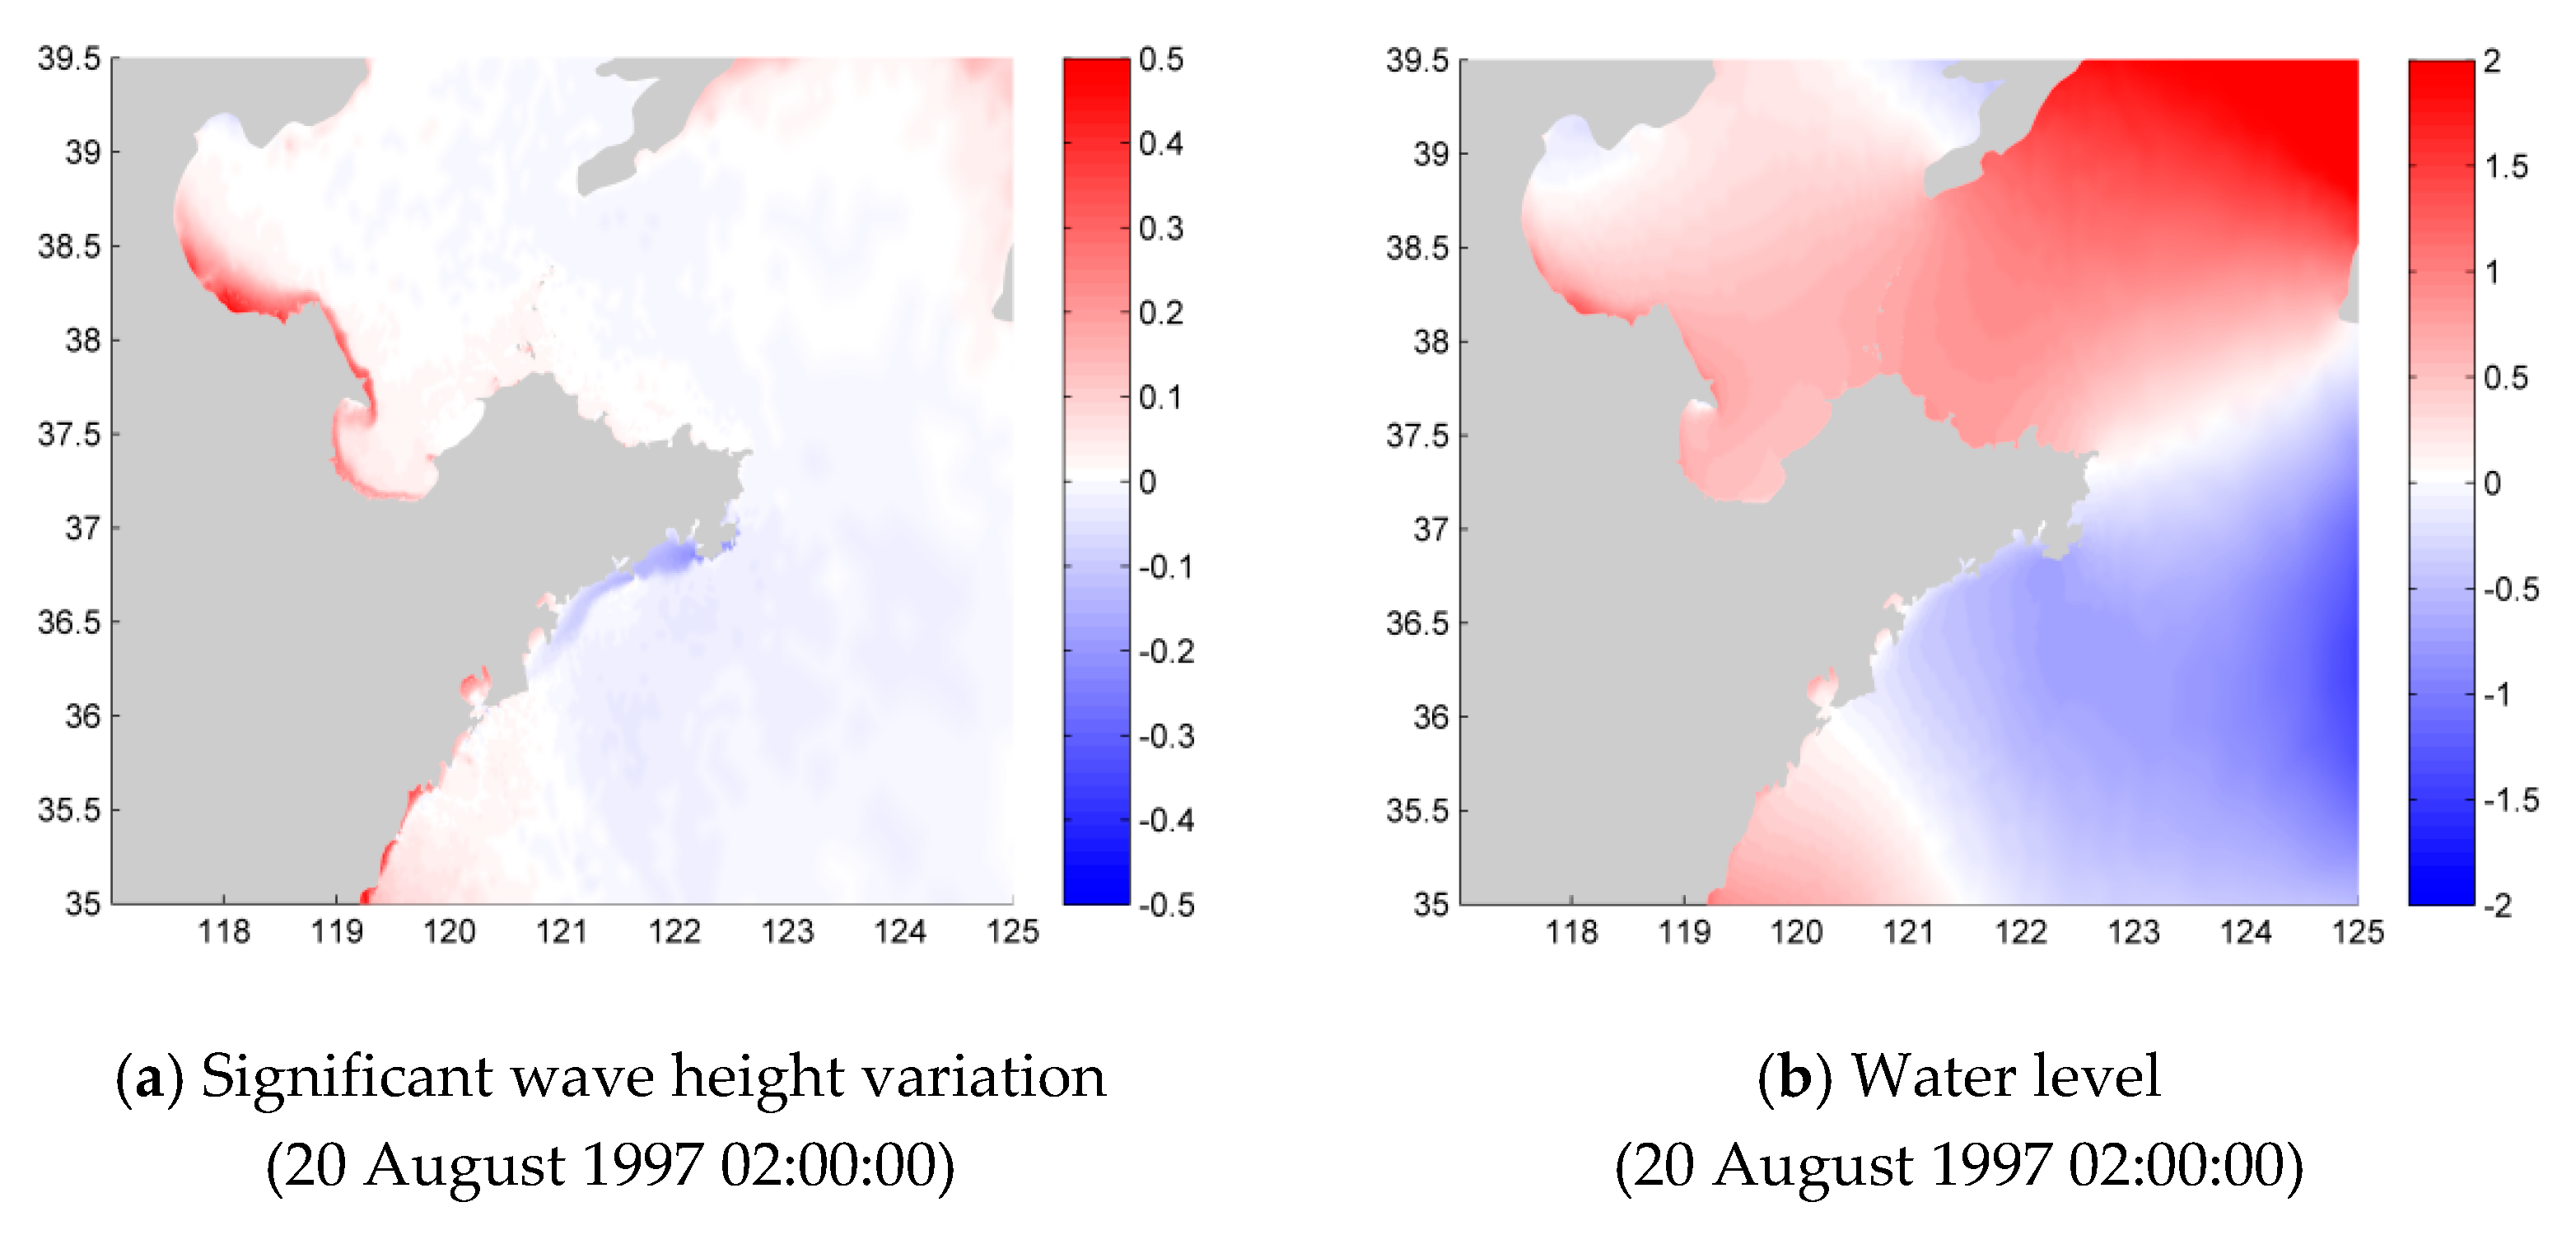
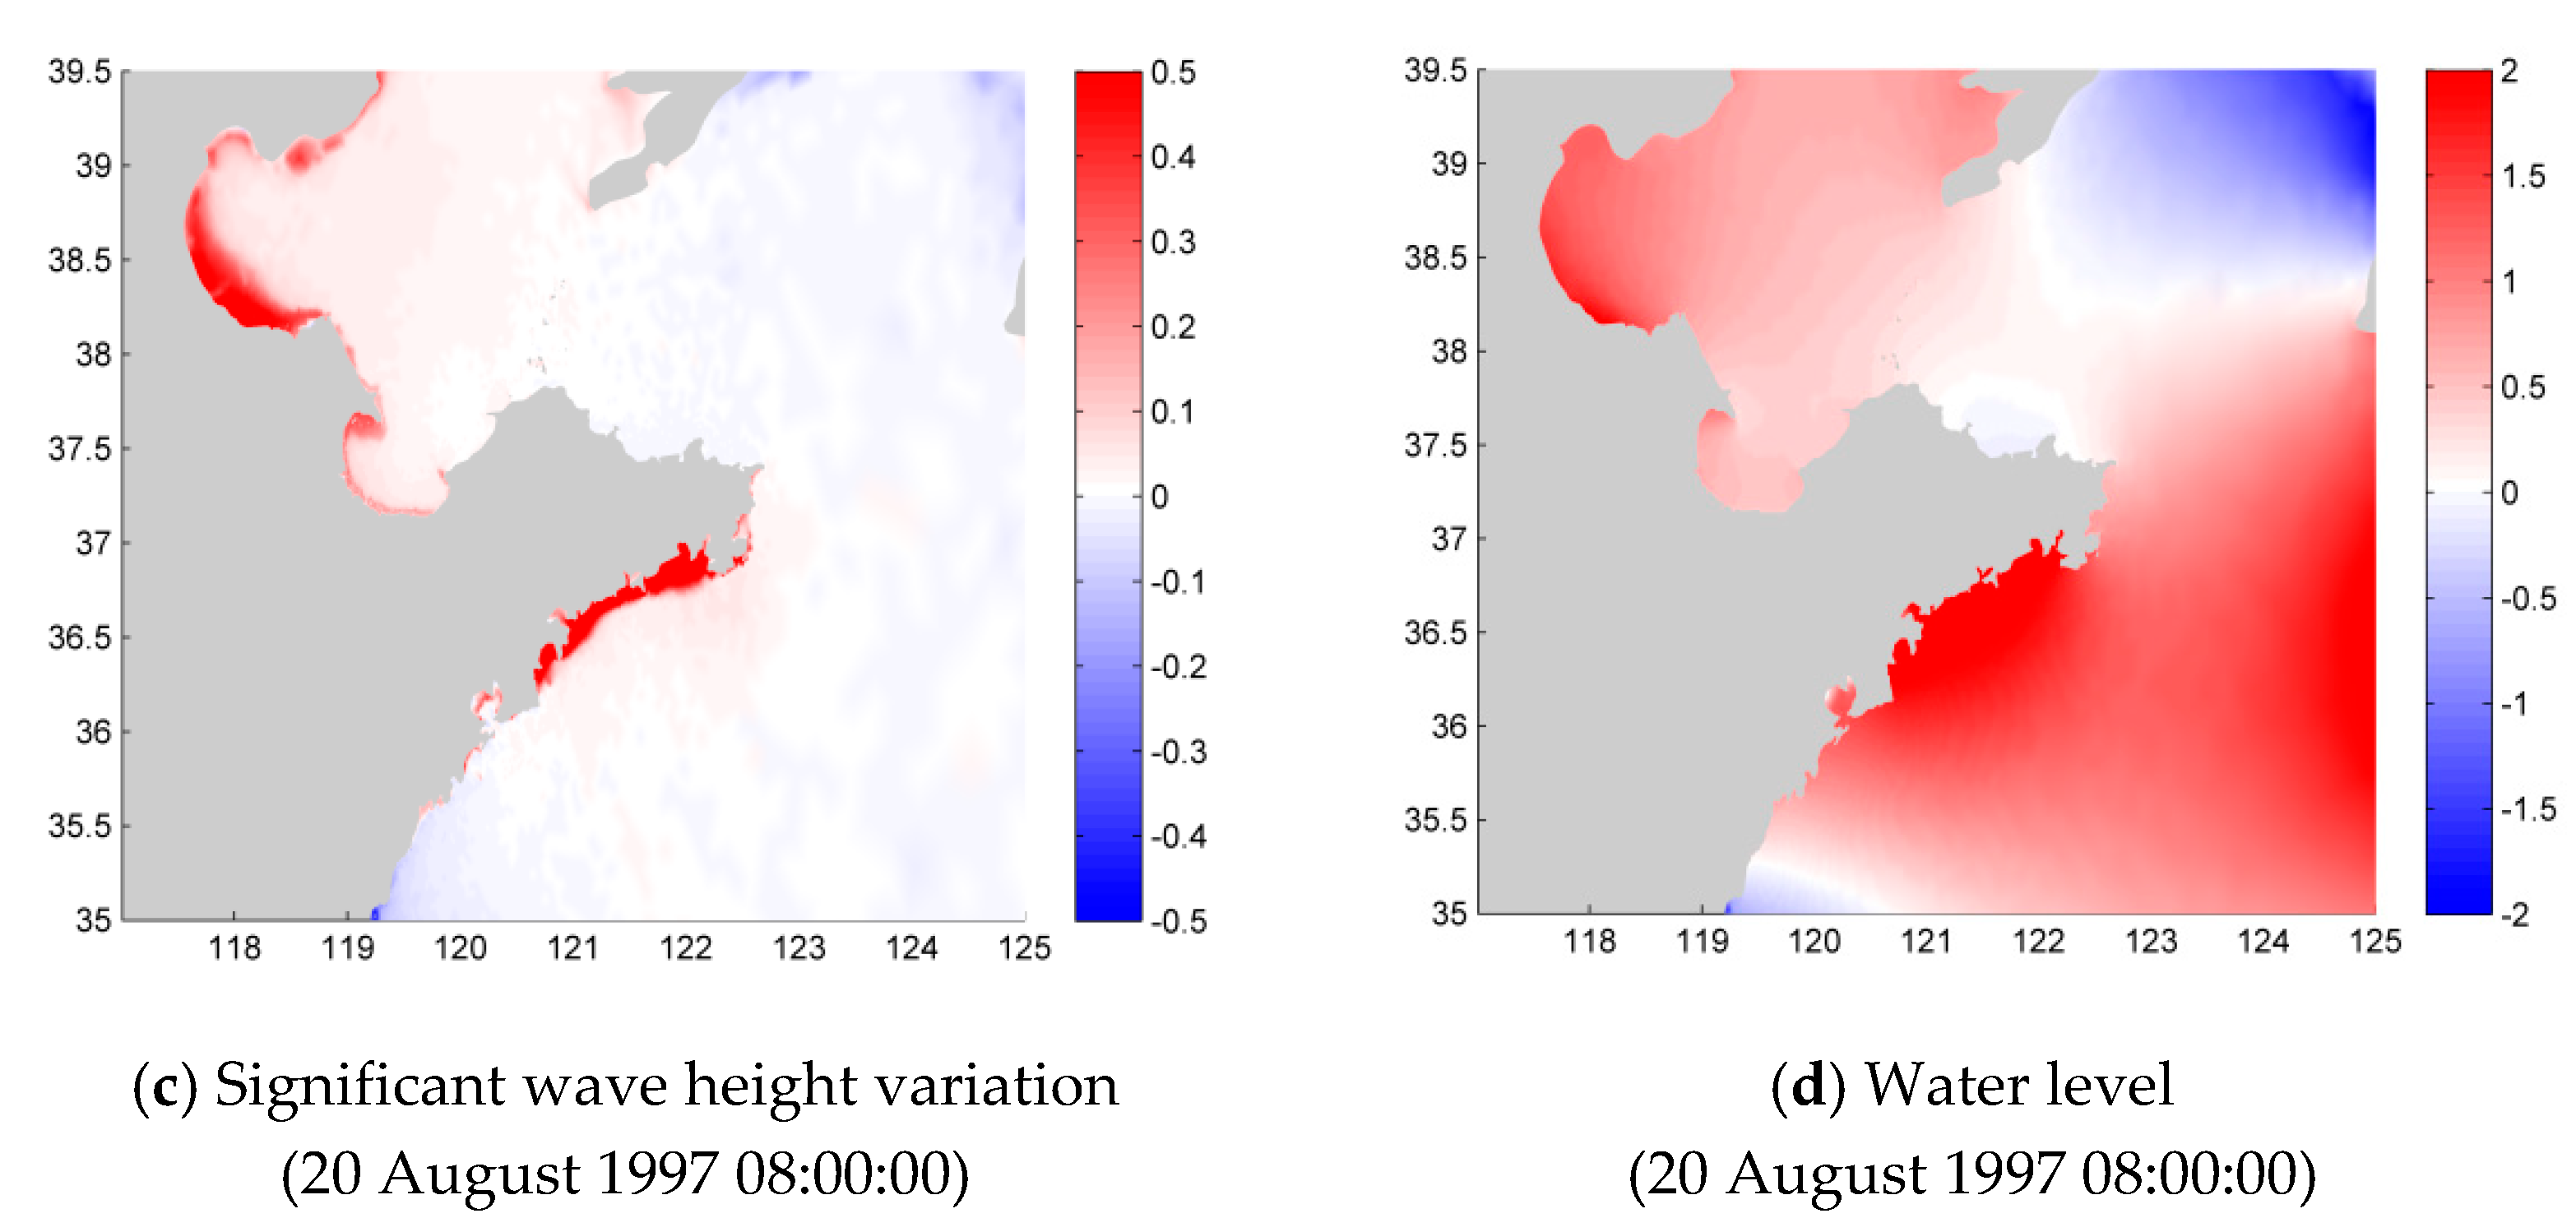
3.3. Impact of Water Level Change on Wave Height

To examine the impact of water level change on wave height, we compared the wave height difference between EXP3 and EXP4 during the two storm events. Figure 11 shows the distribution of maximum significant wave height difference due to water level change. Changes in water level have a significant effect on wave height in shallow nearshore areas. During Typhoon 9711, the significant wave height increased up to 1.25 m near the southern coast of Shandong Peninsula and the southwest coast of Bohai Sea due to the combined influences of astronomical tide and storm surge. The significant wave height increased up to 0.95 m on both northern and southern coasts of Shandong Peninsula during Extratropical Storm 0703. There was a slight decrease in significant wave height, less than 0.3 m, in the offshore areas of the southern Yellow Sea, which could be ignored.
Figure 12 and Figure 13 compare the spatial distributions of significant wave height variation caused by water level change and water level. It can be seen that changes in water level had little impact on wave height in areas with deep water, while the wave height changed substantially in nearshore areas with shallow water. The wave height increase or decrease generated by water level change was basically the same as the water level increase or decrease. This is because astronomical tide and storm surge have significant impacts on the water depth in nearshore areas and change wave energy dissipation in the bottom boundary layer.
Figure 14 shows the maximum significant wave height variation caused by water level change and its proportion of the maximum significant wave height at each grid point along the coast of Shandong Peninsula during the two storm events. For Typhoon 9711, the significant wave height variation caused by water level change was largest on the south coast of Shandong Peninsula, exceeding a maximum of 1.0 m, followed by Bohai and Laizhou Bays. The significant wave height on the coast from PLA to CSJ was almost unaffected by water level changes. For Extratropical Storm 0703, the significant wave height variation was concentrated at the heads of large and small bays, exceeding a maximum of 0.6 m. We found that the significant wave height variation fluctuated substantially along the coast during both events, with troughs occurring on seaward-depression coasts and peaks occurring on landward-depression coasts. Therefore, the effect of water level on wave height was constrained by topography. The average change in significant wave height was 30%. Some abnormally large proportions (more than 50%) coincided with troughs of significant wave height (basically less than 0.5 m).

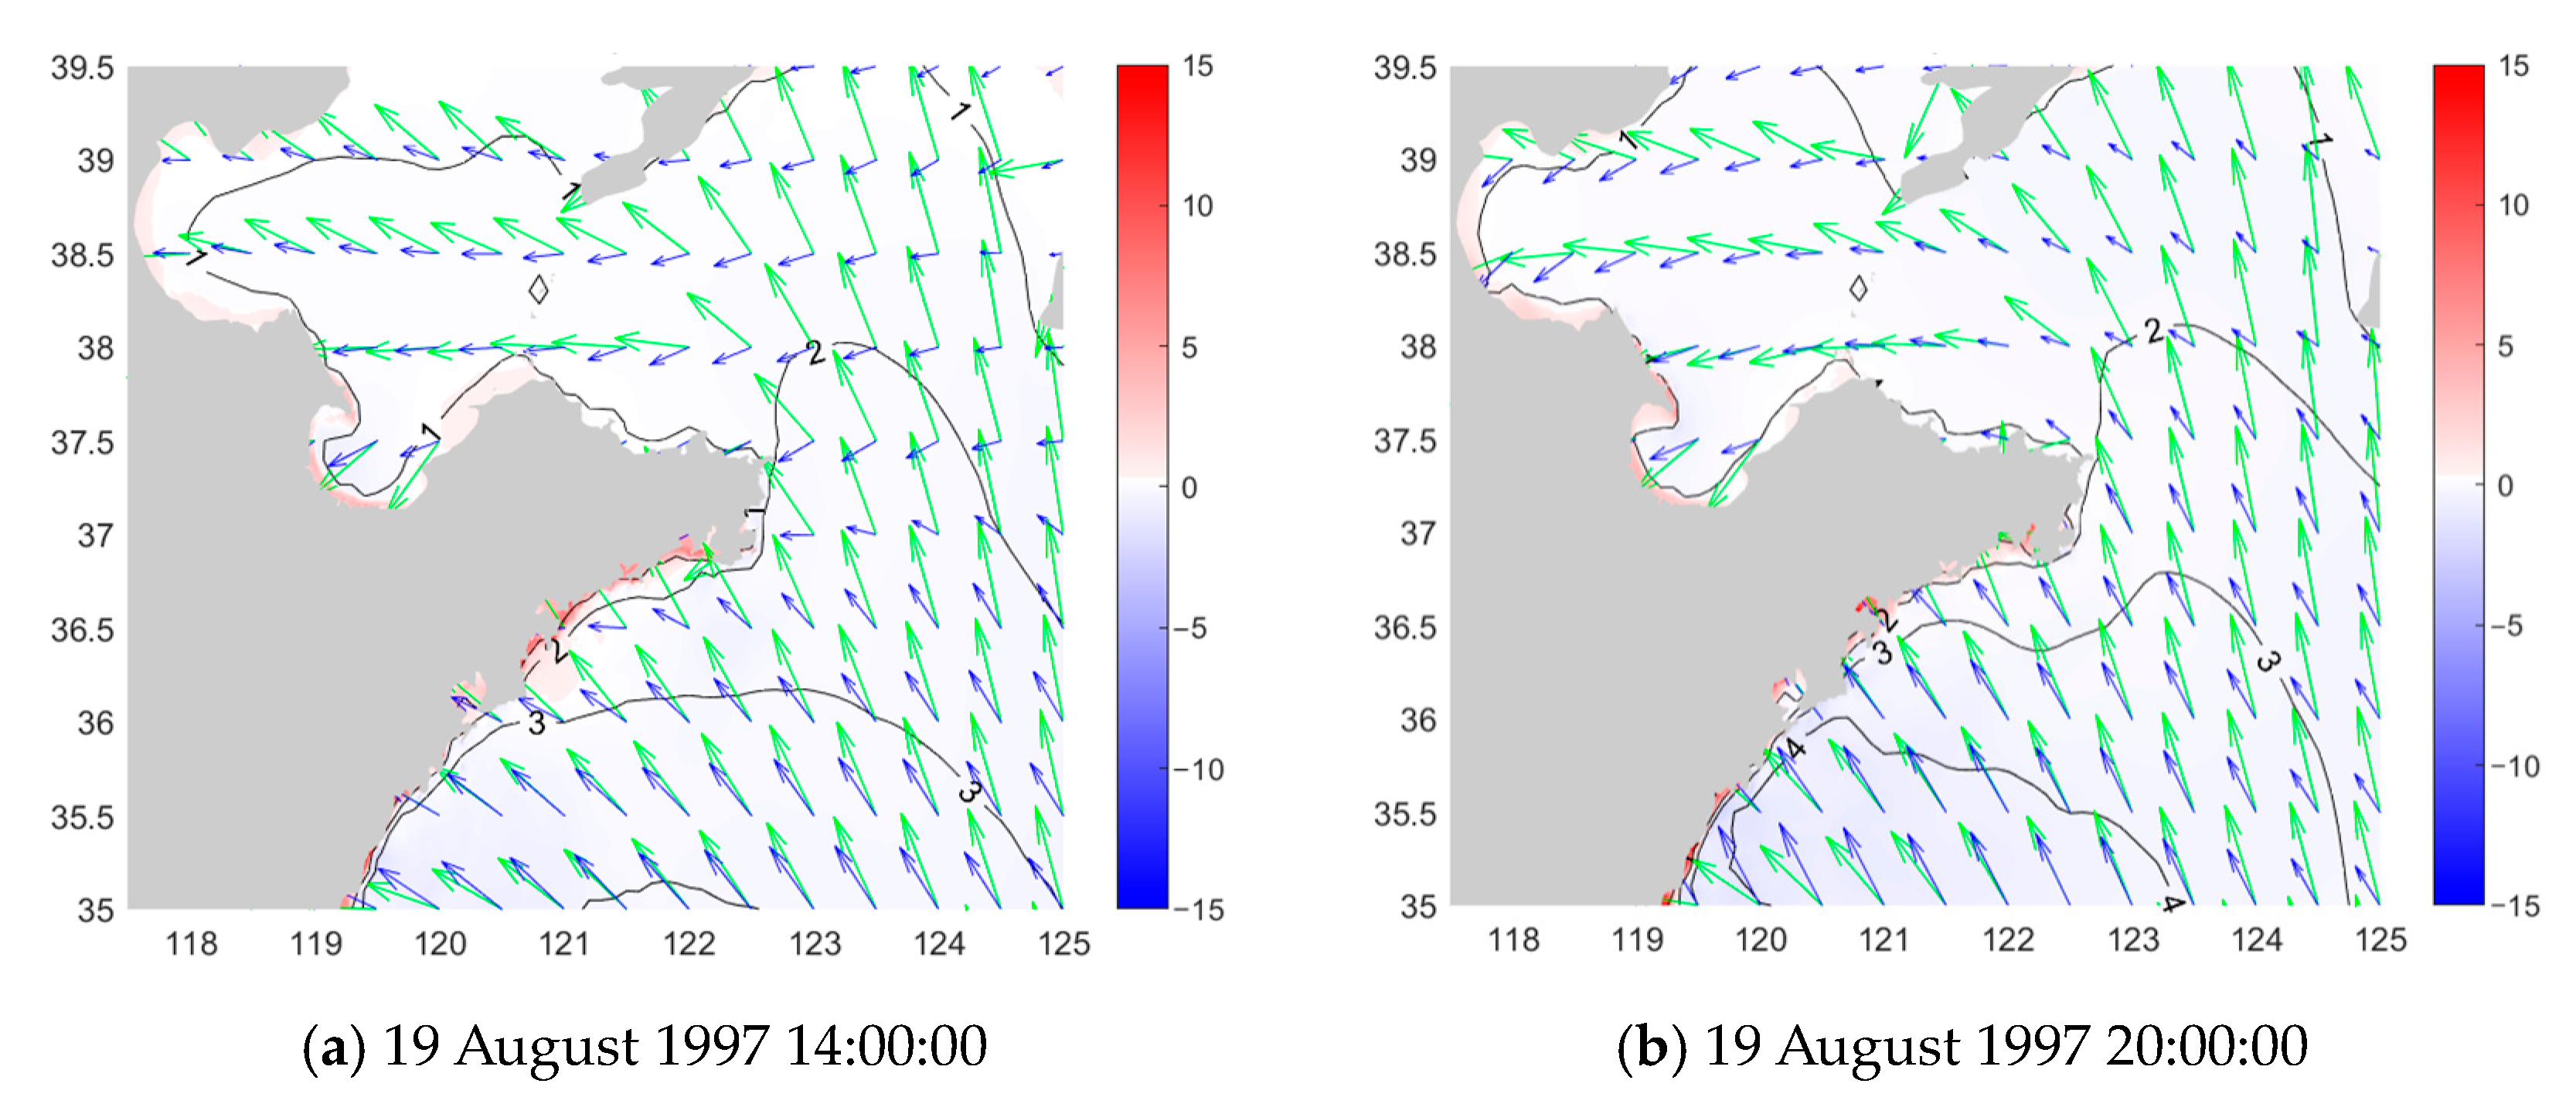
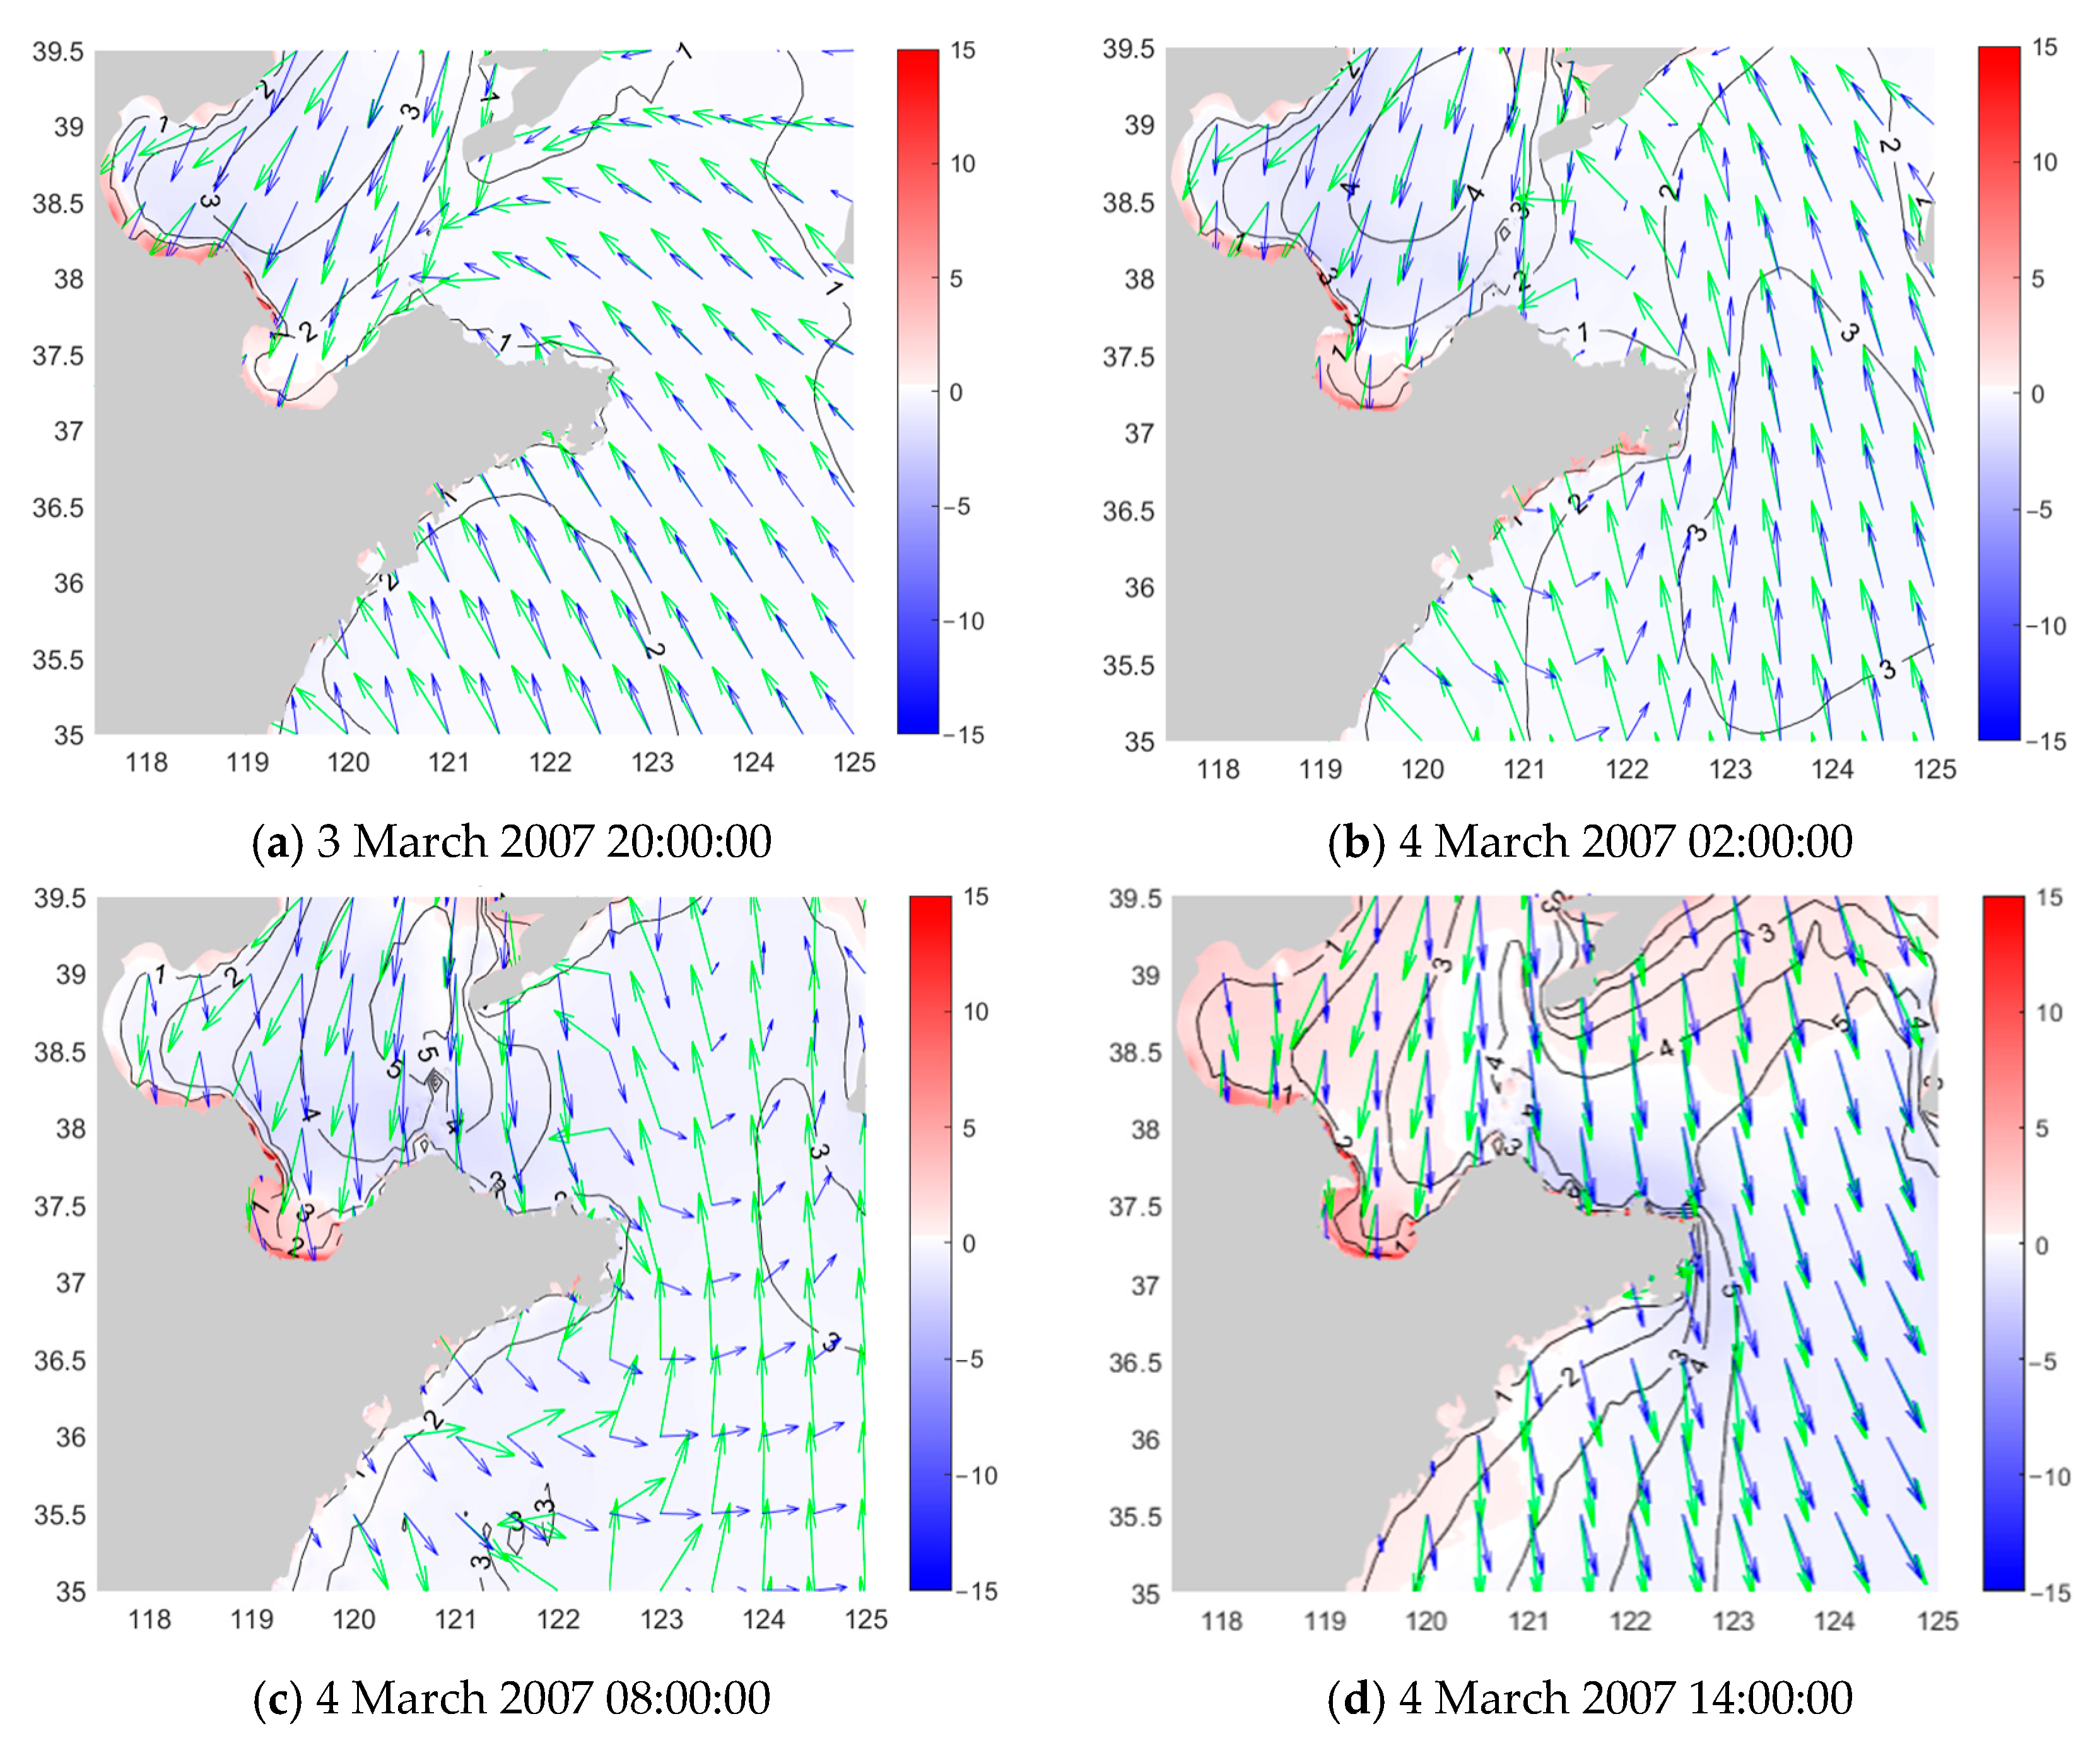
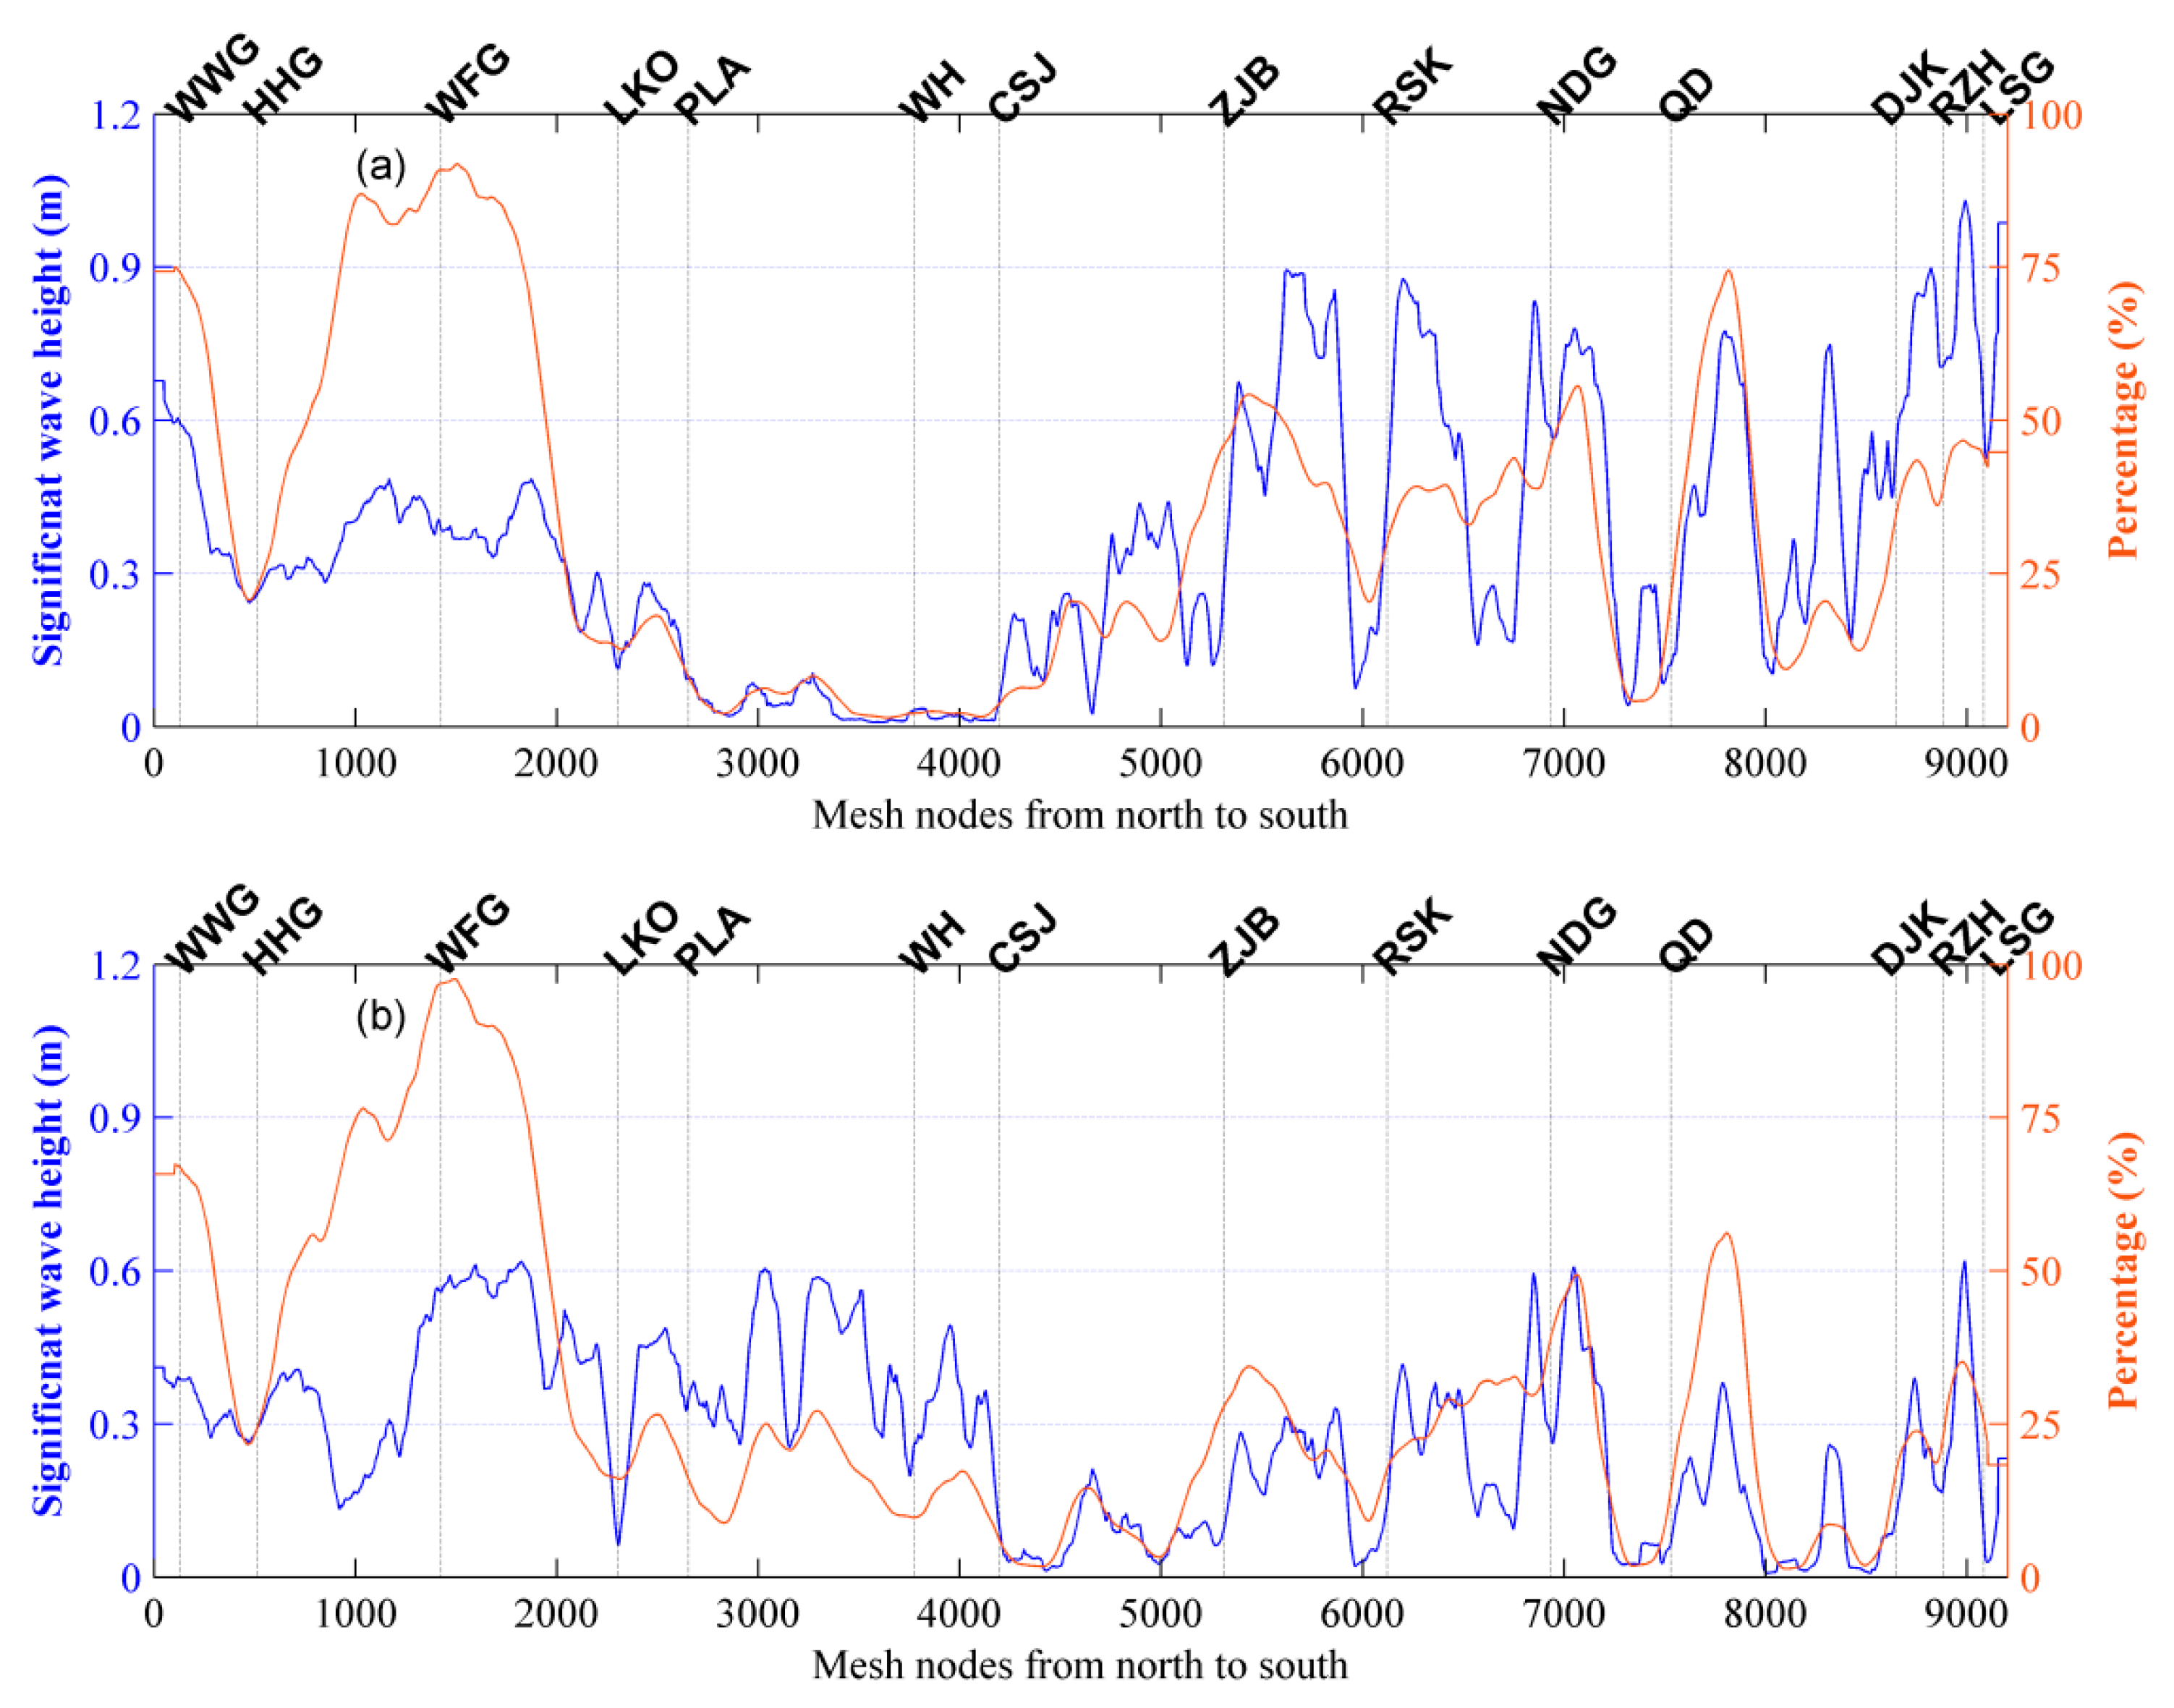
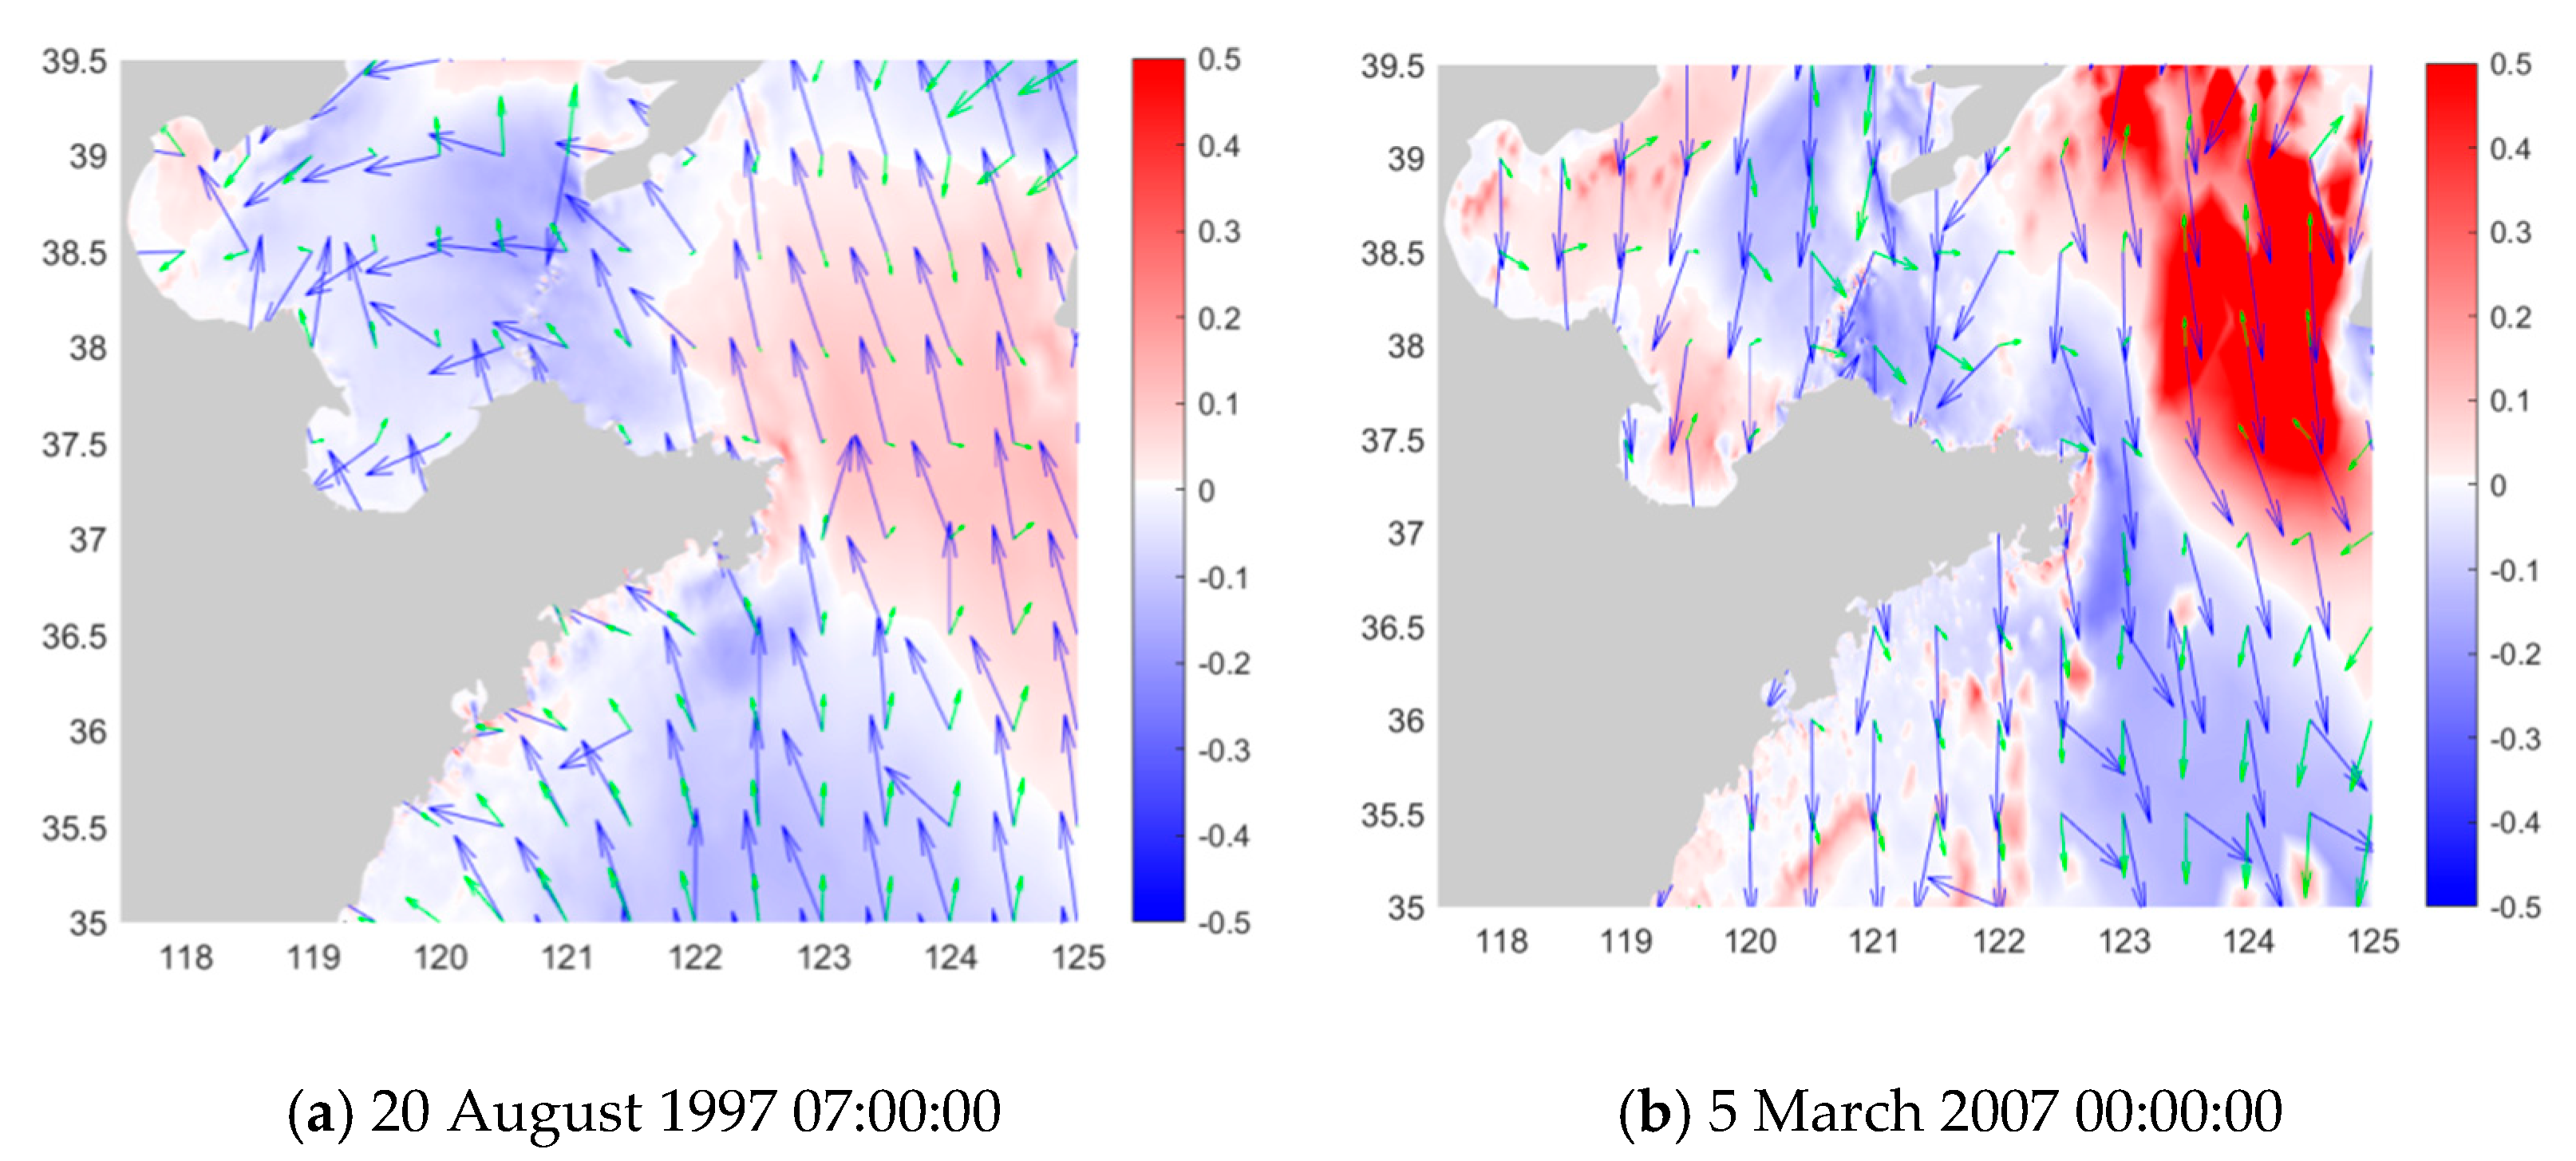
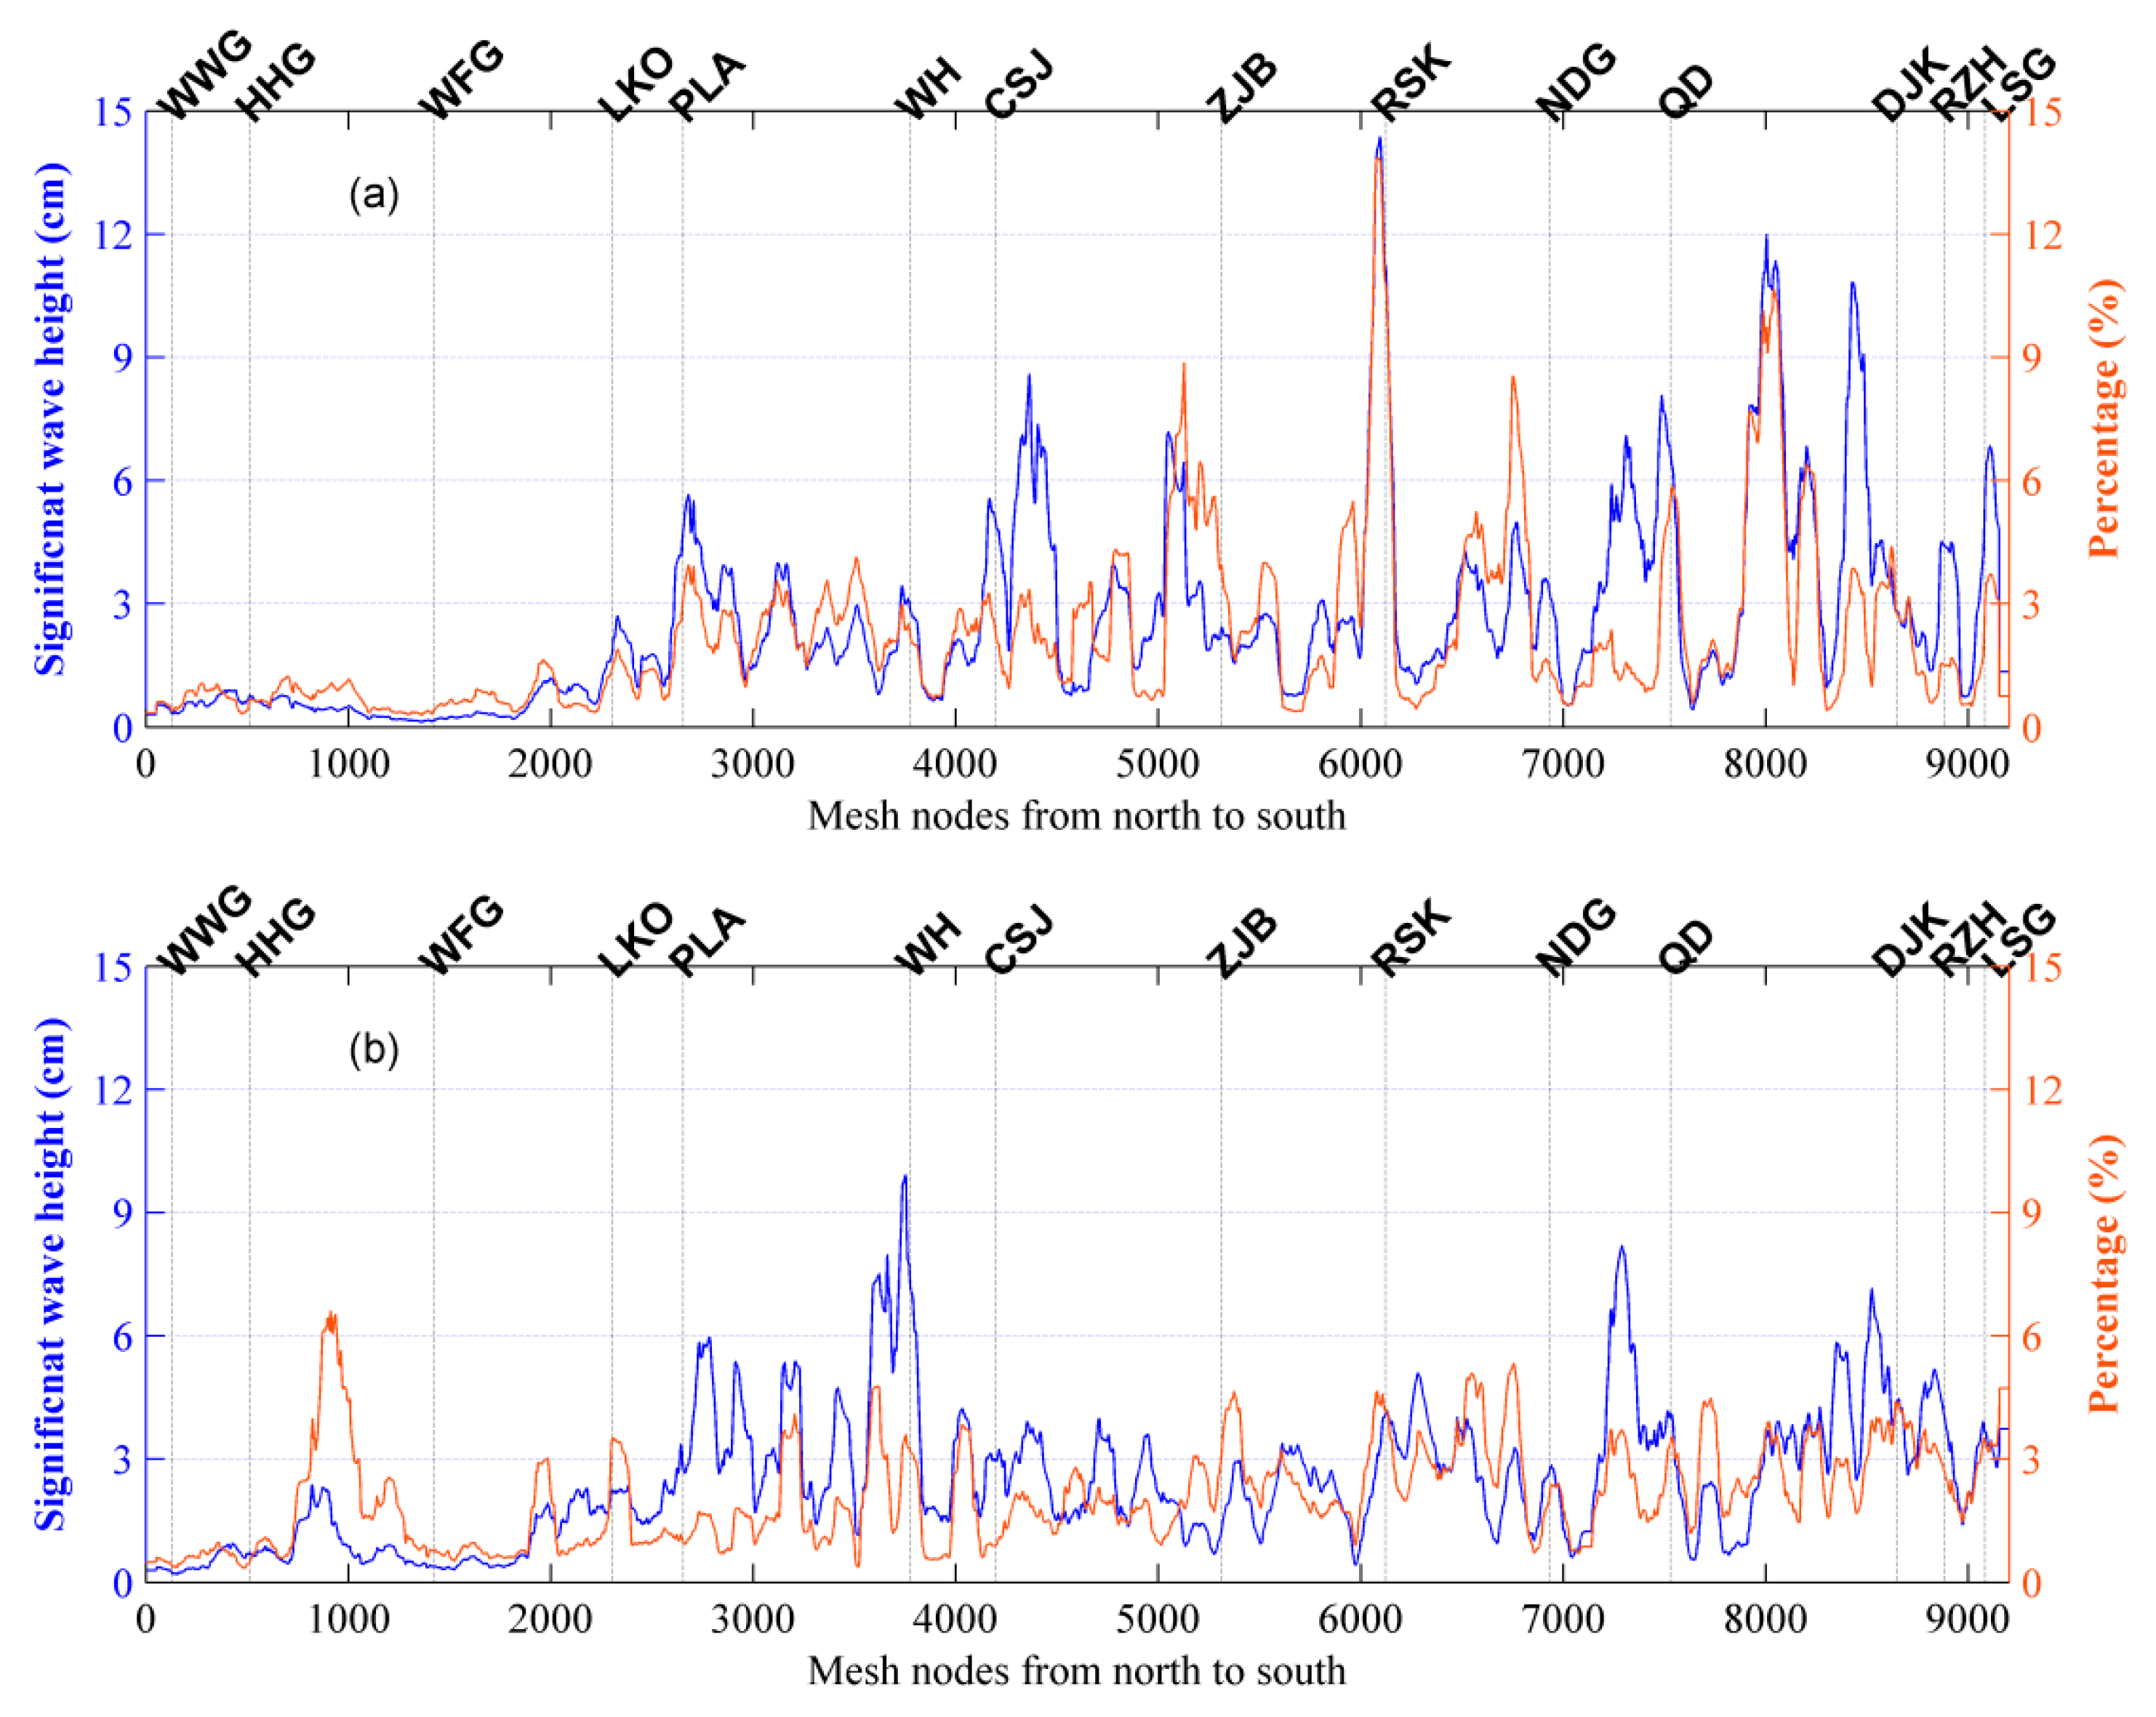
3.4. Impact of Current Field on Wave Height

To examine the impact of current field on wave height, we compared the significant wave height difference between EXP3 and EXP5 during the two storm events. Figure 15 shows the distribution of maximum significant wave height difference due to the current field. The effect of current on wave height was small in most coastal areas, but the maximum significant wave height at the mouth of the semi-enclosed bay near the QD station increased by 0.9 m during Typhoon 9711. The positive and negative changes in wave height (less than 0.4 m) alternated in offshore areas. For Extratropical Storm 0703, the current field increased the maximum significant wave height by 1.1 m in offshore areas and reduced it up to 0.65 m in the coastal areas near CSJ station.
We compared the significant wave height variation caused by current field with the wave direction and current direction at one moment during the two storm events (Figure 16). In offshore areas, the interaction between waves and currents was greater than the interaction between waves and water level change. When wave propagation encounters currents, physical processes such as wave advection, wave refraction, and wave frequency shift significantly affect the wave energy transfer and result in changes in wave characteristics [42,43]. When the wave direction and current direction were the same or the angle between them was acute, waves propagated along the currents. The relative wind effect on waves is the difference between surface current and surface wind velocity vectors [44]. The current field reduced the wave height because the wave phase velocity increased and led to the reduction of wind energy input and the suppression of wave growth. When the wave and current directions were opposite or the angle between them was obtuse, waves propagated against the currents. The relative wind effect increased and the current field increased the wave height. In addition, waves propagating along or against the currents caused changes in wave length [45]. When the wave direction and current direction were perpendicular, waves were least affected by the current field.
Figure 17 shows the maximum significant wave height variation caused by the current field and its proportion of the maximum significant wave height at each grid point along the coast of Shandong Peninsula during the two storm events. The current field changed the significant wave height on the coast east of Bohai Strait, with a maximum change of no more than 15 cm. The maximum significant wave height varied by an average of approximately 2% along the coast of Shandong Peninsula. Therefore, the impact of the current field on wave height at the shoreline was relatively small.

4. Summary and Concluding Remarks

In this study, the ADCIRC-SWAN coupled model was used to study typical extreme weather systems in the coastal waters of Shandong Peninsula by simulating marine dynamic processes and the interactions between them. Based on the measured data from tidal stations and buoys, the simulations of water level and significant wave height were highly consistent with the observations. Therefore, the reliability of the coupled model was verified.
The Shandong offshore area is a semi-enclosed sea where typhoons and extratropical storms both easily induce significant storm surge and waves. Although Typhoon 9711 and Extratropical Storm 0703 both entered the sea north of Shandong Peninsula, the spatial distribution of their impacts on the nearshore ocean dynamic environment varied considerably. In general, Typhoon 9711 had a more significant impact on the southern coast, while Extratropical Storm 0703 had a more significant impact on the northern coast. The marine dynamic disasters caused by Extratropical Storm 0703 were less severe those caused by Typhoon 9711. Therefore, the moving track and intensity of storms played important roles in the ocean dynamic environment.
The interactions among marine dynamic factors have commonalities under different types of catastrophic weather systems. Along the coast of Shandong Peninsula, the interaction between storm surges and concomitant waves was mainly positive. The wave-induced surge accounted for about 10–15% of the total storm surge, occurring mainly in the nearshore area where strong waves propagated shoreward. Water level change (including astronomical tide and storm surge) had a strong modulation effect on waves and increased the nearshore wave height by an average of 30%. The wave height variation induced by water level change was consistent with the water level change. The interaction between storm surges and waves was also constrained by topography. The wave-induced surge was strong on landward-depression coasts, especially in bays, while the wave-induced surge was weak on seaward-depression coasts, especially at capes. By contrast, the wave height variation induced by water level change was strong on seaward-depression coasts, while the wave height variation induced by water level change was weak on landward-depression coasts. Current effects on waves in offshore areas were substantial and were found to be related to the relative direction between current and wave.

Author Contributions

Conceptualization, D.M. and N.W.; methodology, D.M. and N.W.; software, N.W.; validation, N.W.; formal analysis, D.M.; investigation, P.H.; resources, P.H.; data curation, P.H.; writing—original draft preparation, D.M. and N.W.; writing—review and editing, D.M. and N.W.; visualization, D.M. and N.W.; supervision, Y.H.; project administration, Y.H.; funding acquisition, D.M. and P.H. All authors have read and agreed to the published version of the manuscript.

Funding

This study was jointly funded by the National Natural Science Foundation of China, grant number 42006027 and 42076214; the Key Deployment Project of Center for Ocean Mega-Science, Chinese Academy of Sciences, grant number COMS2019J02.

Institutional Review Board Statement

Not applicable.

Informed Consent Statement

Not applicable.

Data Availability Statement

The data presented in this study are available on request from the corresponding author.

Conflicts of Interest

The authors declare no conflict of interest.

References

  1. Feng, S. Introduction to Storm Surge; Science Press: Beijing, China, 1982. (In Chinese) [Google Scholar]
  2. Li, J.; Nie, B. Storm surge prediction: Present status and future challenges. Procedia IUTAM 2017, 25, 3–9. [Google Scholar] [CrossRef]
  3. Needham, H.F.; Keim, B.D.; Sathiaraj, D. A review of tropical cyclone-generated storm surges: Global data sources, observations, and impacts. Rev. Geophys. 2015, 53, 545–591. [Google Scholar] [CrossRef]
  4. Dietrich, J.C.; Zijlema, M.; Westerink, J.J.; Holthuijsen, L.H.; Dawson, C.; Luettich, R.A., Jr.; Jensen, R.E.; Smith, J.M.; Stelling, G.S.; Stone, G.W. Modeling hurricane waves and storm surge using integrally-coupled, scalable computations. Coast. Eng. 2011, 58, 45–65. [Google Scholar] [CrossRef]
  5. Funakoshi, Y.; Hagen, S.C.; Bacopoulos, P. Coupling of Hydrodynamic and Wave Models: Case Study for Hurricane Floyd (1999) Hindcast. J. Waterw. Port Coast. Ocean. Eng. 2008, 134, 321–335. [Google Scholar] [CrossRef]
  6. Dietrich, J.C.; Bunya, S.; Westerink, J.J.; Ebersole, B.A.; Smith, J.M.; Atkinson, J.H.; Jensen, R.; Resio, D.T.; Luettich, R.A.; Dawson, C.; et al. A High-Resolution Coupled Riverine Flow, Tide, Wind, Wind Wave, and Storm Surge Model for Southern Louisiana and Mississippi. Part II: Synoptic Description and Analysis of Hurricanes Katrina and Rita. Mon. Weather Rev. 2010, 138, 378–404. [Google Scholar] [CrossRef]
  7. Kim, S.Y.; Yasuda, T.; Mase, H. Wave set-up in the storm surge along open coasts during Typhoon Anita. Coast. Eng. 2010, 57, 631–642. [Google Scholar] [CrossRef]
  8. Zhao, H.C.; Yin, B.S.; Feng, X.R.; Yang, D.Z. Numerical study of influence of surge and wave interaction on waves in Waters surrounding Taiwan. Mar. Sci. 2015, 39, 127–134, (In Chinese with English Abstract). [Google Scholar]
  9. Sun, Y.; Perrie, W.; Toulany, B. Simulation of Wave-Current Interactions Under Hurricane Conditions Using an Unstructured-Grid Model: Impacts on Ocean Waves. J. Geophys. Res. Ocean. 2018, 123, 3739–3760. [Google Scholar] [CrossRef]
  10. Wuxi, Q.; Li, J.; Nie, B. Effects of tide-surge interaction and wave set-up/set-down on surge: Case studies of tropical cyclones landing China’s Zhe-Min coast. Theor. Appl. Mech. Lett. 2018, 8, 153–159. [Google Scholar] [CrossRef]
  11. Xie, L.; Pietrafesa, L.J.; Wu, K. A numerical study of wave-current interaction through surface and bottom stresses: Coastal ocean response to Hurricane Fran of 1996. J. Geophys. Res. Ocean. 2003, 108, 3049. [Google Scholar] [CrossRef]
  12. Dietrich, J.C.; Tanaka, S.; Westerink, J.J.; Dawson, C.N.; Luettich, R.A., Jr.; Zijlema, M.; Holthuijsen, L.H.; Smith, J.M.; Westerink, L.G.; Westerink, H.J. Performance of the Unstructured-Mesh, SWAN+ADCIRC Model in Computing Hurricane Waves and Surge. J. Sci. Comput. 2011, 52, 468–497. [Google Scholar] [CrossRef]
  13. Xu, S.; Yin, K.; Huang, W.; Zheng, W. Numerical simulation of typhoon-induced storm surge on the coast of Jiangsu Province, China, based on coupled hydrodynamic and wave models. J. Southeast Univ. 2014, 30, 489–494. [Google Scholar] [CrossRef]
  14. Marsooli, R.; Lin, N. Numerical Modeling of Historical Storm Tides and Waves and Their Interactions Along the U.S. East and Gulf Coasts. J. Geophys. Res. Ocean. 2018, 123, 3844–3874. [Google Scholar] [CrossRef]
  15. Li, A.; Guan, S.; Mo, D.; Hou, Y.; Hong, X.; Liu, Z. Modeling wave effects on storm surge from different typhoon intensities and sizes in the South China Sea. Estuar. Coast. Shelf Sci. 2020, 235, 106551. [Google Scholar] [CrossRef]
  16. Ji, H.; Lan, Y.; Tu, Z.; Lin, Y.; Xiao, Z. Influence analysis of various parameters of SWAN model under extreme wind conditions. China Harb. Eng. 2021, 41, 1–5, (In Chinese with English Abstract). [Google Scholar]
  17. Li, W. Overview of historical storm surge disasters in the Shandong Peninsula and its northern coastal areas. Mar. Sci. 1991, 15, 24–26. (In Chinese) [Google Scholar]
  18. Yang, Y.; Cao, Y. Study on storm tide on Bohai coast, Peninsula of Shandong and Liaodong since 500 years BP. Yantai Teach. Coll. J. 1992, 8, 46–51, (In Chinese with English Abstract). [Google Scholar]
  19. Lin, Z.; Zhao, L. Typhoon surge disasters along the coast of Qingdao. Shandong Meteorol. 2000, 20, 19–21. (In Chinese) [Google Scholar]
  20. Chen, X.; Zhang, S.; Cui, Z.; Ding, J.; Qi, X.; Chen, J. Analysis of the “10.11” extratropical storm surge in Laizhou Bay. Mar. Forecast. 2004, 21, 88–92. (In Chinese) [Google Scholar]
  21. Gui, Q.; Sha, W. Numerical simulation of coupling wave-current in Huang-hai and Bo-hai Sea in spring. J. PLA Univ. Sci. Technol. 2005, 6, 71–75, (In Chinese with English Abstract). [Google Scholar]
  22. Lin, X.; Yin, B. Influence of interaction of waves in tide-surge on surface wind stress coefficient. J. Hohai Univ. 2007, 35, 714–717, (In Chinese with English Abstract). [Google Scholar]
  23. Xia, B.; Zhang, Q.; Jiang, C. A coupled wave-current numerical model on unstructured grids. Oceanol. Et Limnol. Sin. 2013, 44, 1451–1456, (In Chinese with English Abstract). [Google Scholar]
  24. Dalledonne, G.L.; Mayerle, R. Modelling of storm impacts on the Shandong Peninsula coast. J. Coast. Res. 2016, 74, 70–82. [Google Scholar] [CrossRef]
  25. Liu, Y.; Wang, X.; Wang, S. A numerical study of the influence of waves on storm surges. Trans. Oceanol. Limnol. 2007, S1, 1–7, (In Chinese with English Abstract). [Google Scholar]
  26. Fu, C.; Dong, J.; Wu, S.; Liu, Q. Numerical simulation on typical extratropical storm surge in the Bohai Sea. Mar. Forecast. 2011, 28, 1–8, (In Chinese with English Abstract). [Google Scholar]
  27. Feng, J.; Jiang, W.; Bian, C. Numerical prediction of storm surge in the Qingdao area under the impact of climate change. J. Ocean. Univ. China 2014, 13, 539–551. [Google Scholar] [CrossRef]
  28. Fan, S.; Chu, A.; Jiang, Q. Optimization of reanalysis wind field and its application in the simulation of extratropical storm surge in the Bohai Bay. Mar. Forecast. 2021, 38, 61–68, (In Chinese with English Abstract). [Google Scholar]
  29. Luettich, J.R.; Westerink, J.; Scheffner, N. ADCIRC: An Advanced Three-Dimensional Circulation Model for Shelves, Coasts, and Estuaries. Report 1; Theory and Methodology of ADCIRC-2DDI and ADCIRC-3DL.; DRP-92-6; US Army Corps of Engineers: Washington, DC, USA, 1992; p. 143.
  30. Irish, J.L.; Resio, D.T.; Ratcliff, J.J. The influence of storm size on hurricane surge. J. Phys. Oceanogr. 2008, 38, 2003–2013. [Google Scholar] [CrossRef]
  31. Fritz, H.M.; Blount, C.D.; Albusaidi, F.B.; Al-Harthy, A.H.M. Cyclone Gonu storm surge in Oman. Estuar. Coast. Shelf Sci. 2010, 86, 102–106. [Google Scholar] [CrossRef]
  32. Feng, X.; Yin, B.; Yang, D. Development of an unstructured-grid wave-current coupled model and its application. Ocean. Model. 2016, 104, 213–225. [Google Scholar] [CrossRef]
  33. Feng, X.; Yin, B.; Yang, D.; Perrie, W. The effect of wave-induced radiation stress on storm surge during Typhoon Saomai (2006). Acta Oceanol. Sin. 2011, 30, 20–26. [Google Scholar] [CrossRef]
  34. Holthuijsen, L.H.; Powell, M.D.; Pietrzak, J.D. Wind and waves in extreme hurricanes. J. Geophys. Res. Ocean. 2012, 117, C09003. [Google Scholar] [CrossRef]
  35. Wang, N.; Hou, Y.; Mo, D.; Li, J. Hazard assessment of storm surges and concomitant waves in Shandong Peninsula based on long-term numerical simulations. Ocean. Coast. Manag. 2021, 213, 105888. [Google Scholar] [CrossRef]
  36. Mo, D.; Hou, Y.; Li, J.; Liu, Y. Study on the storm surges induced by cold waves in the Northern East China Sea. J. Mar. Syst. 2016, 160, 26–39. [Google Scholar] [CrossRef]
  37. Chen, Y.; Yu, X. Sensitivity of storm wave modeling to wind stress evaluation methods. J. Adv. Model. Earth Syst. 2017, 9, 893–907. [Google Scholar] [CrossRef]
  38. Mcinnes, K.L.; Walsh, K.J.E.; Hubbert, G.D.; Beer, T. Impact of sea-level rise and storm surges on a coastal community. Nat. Hazards 2003, 30, 187–207. [Google Scholar] [CrossRef]
  39. Weisberg, R.H.; Zheng, L. Hurricane storm surge simulations comparing three-dimensional with two-dimensional formulations based on an Ivan-like storm over the Tampa Bay, Florida region. J. Geophys. Res. Ocean. 2008, 113, C12001. [Google Scholar] [CrossRef]
  40. Feng, X.; Yin, B.; Yang, D. Effect of hurricane paths on storm surge response at Tianjin, China. Estuar. Coast. Shelf Sci. 2012, 106, 58–68. [Google Scholar] [CrossRef]
  41. Huang, Y.; Weisberg, R.H.; Zheng, L.; Zijlema, M. Gulf of Mexico hurricane wave simulations using SWAN: Bulk formula-based drag coefficient sensitivity for Hurricane Ike. J. Geophys. Res. Ocean. 2013, 118, 3916–3938. [Google Scholar] [CrossRef]
  42. Fan, Y.; Ginis, I.; Hara, T.; Wright, C.W.; Walsh, E.J. Numerical simulations and observations of surface wave fields under an extreme tropical cyclone. J. Phys. Oceanogr. 2009, 39, 2097–2116. [Google Scholar] [CrossRef]
  43. Wang, P.; Sheng, J. A comparative study of wave-current interactions over the eastern Canadian shelf under severe weather conditions using a coupled wave-circulation model. J. Geophys. Res. Ocean. 2016, 121, 5252–5281. [Google Scholar] [CrossRef]
  44. Ardhuin, F.; Rascle, N.; Belibassakis, K.A. Explicit wave-averaged primitive equations using a generalized Lagrangian mean. Ocean. Model. 2008, 20, 35–60. [Google Scholar] [CrossRef]
  45. Wolf, J.; Prandle, D. Some observations of wave-current interaction. Coast. Eng. 1999, 37, 471–485. [Google Scholar] [CrossRef]
Figure 1. Schematic diagram of the Shandong Peninsula region, including the topography, the locations of tidal stations (red dots), the coastal computing grid points (9202 green dots), and the city boundary (black line).
Jmse 11 01759 g001
Figure 2. Evolution of mean sea level pressure (hPa; blue lines) and wind vector (black arrows) distributions during Typhoon 9711. The red line represents the typhoon track, and the blue solid circle marks the location of the typhoon’s center.
Jmse 11 01759 g002
Figure 3. Evolution of mean sea level pressure (hPa; blue lines) and wind vector (black arrows) distributions during Extratropical Storm 0703.
Jmse 11 01759 g003
Figure 4. Spatial distribution of maximum storm surge in EXP3 during (a) Typhoon 9711 and (b) Extratropical Storm 0703.
Jmse 11 01759 g004
Figure 5. Spatial distribution of maximum significant wave height in EXP3 during (a) Typhoon 9711 and (b) Extratropical Storm 0703.
Jmse 11 01759 g005
Figure 6. The maximum storm surge and significant wave height during (a) Typhoon 9711 and (b) Extratropical Storm 0703 at each grid point along the coast of Shandong Peninsula.
Jmse 11 01759 g006
Figure 7. The maximum storm surge difference between EXP2 and EXP3 during (a) Typhoon 9711 and (b) Extratropical Storm 0703.
Jmse 11 01759 g007
Figure 8. Spatial distributions of wind vectors (blue arrows), wave direction (green arrows), significant wave height (m; black isolines), and wave-induced surge (cm; filled contours) for Typhoon 9711 in coastal areas of Shandong Peninsula.
Jmse 11 01759 g008aJmse 11 01759 g008b
Figure 9. Spatial distributions of wind direction (blue arrows), wave direction (green arrows), significant wave height (m; black isolines), and wave-induced surge (cm; filled contours) for Extratropical Storm 0703 in coastal areas of Shandong Peninsula.
Jmse 11 01759 g009
Figure 10. The maximum wave-induced surge and its proportion of the total storm surge during (a) Typhoon 9711 and (b) Extratropical Storm 0703 at each grid point along the coast of Shandong Peninsula.
Jmse 11 01759 g010
Figure 11. The maximum significant wave height difference between EXP3 and EXP4 during (a) Typhoon 9711 and (b) Extratropical Storm 0703.
Jmse 11 01759 g011
Figure 12. Spatial distributions of significant wave height variation caused by water level change and water level at 02:00 and 08:00, 20 August 1997, during Typhoon 9711.
Jmse 11 01759 g012aJmse 11 01759 g012b
Figure 13. Spatial distributions of significant wave height variation caused by water level change and water level at 08:00 and 14:00, 4 March 2007 during Extratropical Storm 0703.
Jmse 11 01759 g013
Figure 14. The maximum significant wave height variation caused by water level change and its proportion of the maximum significant wave height during (a) Typhoon 9711 and (b) Extratropical Storm 0703 at each grid point along the coast of Shandong Peninsula.
Jmse 11 01759 g014
Figure 15. The maximum significant wave height difference between EXP3 and EXP5 during (a) Typhoon 9711 and (b) Extratropical Storm 0703.
Jmse 11 01759 g015
Figure 16. Spatial distributions of wave direction (blue arrows), current vectors (green arrows), and significant wave height variation caused by the current field (m; filled contours) at 07:00, 20 August 1997 (typhoon) and 00:00, 5 March 2007 (extratropical cyclone).
Jmse 11 01759 g016
Figure 17. The maximum significant wave height variation caused by the current field and its proportion of the maximum significant wave height during (a) Typhoon 9711 and (b) Extratropical Storm 0703 at each grid point along the coast of Shandong Peninsula.
Jmse 11 01759 g017
Table 1. Designs of the numerical experiments.
EXPModelTideWind and PressureWater LevelCurrent
EXP1ADCIRC×--
EXP2ADCIRC--
EXP3ADCIRC-SWAN
EXP4ADCIRC-SWAN×
EXP5ADCIRC-SWAN×
Disclaimer/Publisher’s Note: The statements, opinions and data contained in all publications are solely those of the individual author(s) and contributor(s) and not of MDPI and/or the editor(s). MDPI and/or the editor(s) disclaim responsibility for any injury to people or property resulting from any ideas, methods, instructions or products referred to in the content.

