Article

Experimental Evaluation and Validation of Pressure Distributions in Ice–Structure Collisions Using a Pendulum Apparatus

1
Extreme Technology Research Center for Ship and Offshore Platform, Inha University, 100, Inha-Ro, Michuhol-Gu, Incheon 22212, Republic of Korea
2
Department of Naval Architecture and Ocean Engineering, Inha University, 100, Inha-Ro, Michuhol-Gu, Incheon 22212, Republic of Korea
*
Author to whom correspondence should be addressed.
J. Mar. Sci. Eng. 2023, 11(9), 1761; https://doi.org/10.3390/jmse11091761
Submission received: 24 July 2023 / Revised: 4 September 2023 / Accepted: 4 September 2023 / Published: 8 September 2023
(This article belongs to the Section Ocean Engineering)

Abstract

:
This study introduced an experimental setup designed to predict collision pressure exerted on a structure due to ice impacts. The primary aim was to forecast the pressure distribution and structural behavior following an ice collision on a laboratory scale. The apparatus comprises a double-pendulum system situated within a cold chamber, facilitating the prediction of collision forces by varying both the collision energy and velocity. Experiments were conducted at collision velocities of 5, 7, and 10 knots, representative of conditions in Arctic regions. By altering these velocities, we measured both the strain experienced by a steel plate and the pressure due to the ice collision. The pressure distribution on the steel plate surface was also recorded by using pressure-sensitive film. This setup effectively captured the pressure distribution across the collision contact area. The measured pressure and force were compared with that of previous studies to determine the validity of the ice collision force measurement. This methodology successfully captures the relationship between the increasing collision speed and force, providing valuable insights into ice-induced forces and structural strain. It offers an effective measurement technique beneficial for designing ice-resistant structures. In conclusion, this paper enhances our understanding of ice–structure interactions, particularly in the domains of collision force and strain metrics.

1. Introduction

With the growing interest in offshore oil exploration in Arctic regions and the increasing ship traffic in the same region, potential collisions between ice and offshore structures have become a critical concern. According to the Finnish–Swedish Ice and Coastal Rules (FSICR) [1], ice collisions in the Arctic region account for approximately 30% of all cases of structural damage to ships, while Hill [2] reported that 35% of ice collisions in the Arctic lead to severe hull damage and deformation. Thus, there is a pressing need for accurate methods to estimate ice collision loads in the design of ice-resistant structures. Given the potential severe consequences of ice collisions on a ship’s structure, shipping classification societies have proposed that collision force from ice collisions be considered in the structural design rules for ships operating in polar regions. However, current design guidelines are limited by the statistical characteristics of environmental parameters and cannot account for the wide range of individual collision situations that a ship may encounter. Predicting ice collision forces remains a challenge because the properties of ice materials, the dynamic behavior of ice, and the interaction of ice with structures are highly complex. To address this issue, researchers have emphasized the need for load estimation methods that take into account factors such as the ice type, geometry, and material properties, because these factors can significantly affect the mechanics of ice collisions.
Both numerical analysis and experiments have been used to simulate the ice collision force on marine structures [3]. Experimental approaches are useful for studying the ice collision force under controlled conditions, allowing for the simulation and better understanding of the complex mechanics of ice collisions. To obtain the actual ice collision experienced by a ship, several experimental methods have been proposed in previous studies. One approach involves attaching pressure sensors or strain gauges to the hull surface of an icebreaker and measuring the ice-induced collision forces while traveling at 5–10 knots [4,5,6,7]. This method is effective in determining the magnitude and type of ice collision pressure in different sailing areas of a ship. Another method involves measuring the ice collision force of a small-scale model ship in an ice basin [8,9,10]. A thin layer of ice is formed on the water surface in a large cryogenic basin, using a towing trolley, and the model ship is towed at a speed of approximately 0.5 to 1.5 knots based on the similarity law. However, these experiments are more appropriate for the measurement of the propulsion resistance exerted on a ship by the continuous collision of ice fragments. A third method employs the direct collision of ice and steel plate specimens in a laboratory setting to measure pressure and structural deformation, which has the advantage of simulating various collision speeds and ice shapes. Researchers have employed different experimental setups for this method. For example, Choi et al. [10], Yu et al. [11], and Quinton [12] used the free-drop collision method by dropping an ice specimen onto a steel plate to measure the force transferred to the plate. They varied the collision velocity from 1.5 to 10 knots and the angle of the ice wedge from 0 to 45°. Quinton [12] also performed experiments by dropping a cone-shaped ice specimen onto a steel plate to measure the deformation and strain. Zhu et al. [13,14] and Cai et al. [15] used the trolley collision method to collide wedge ice and steel plates at 5 knots to measure deformation and pressure on the plate. Glen and Comfort [16], Gagnon et al. [17,18], Clarke [19], and Andrade [20] also developed a double collision pendulum to measure collision pressure while varying the plate thickness and the ice size, shape, and collision velocity.
Ice collision experiments have the advantage of being able to accurately measure force under a variety of controlled test conditions. However, they have the disadvantage that the ice specimens used in the tests must be scaled down from their actual shape. It is still unclear whether the collision forces measured in these scaled-down experiments are representative of the pressure loads on a real ship, despite several studies that have focused on observing ice collision force on a laboratory scale. Moreover, factors such as ice geometry and impact energy, which influence the impact pressure, continue to be of significant interest for study. Therefore, this study aimed to develop an experimental configuration within a cold room that can be used to understand the physical and material characteristics of ice collision force and to compare the measured force with previous studies or empirical equations to determine their validity and reproducibility. This study used a collision pendulum, a setup that has been used in several studies, to investigate collisions between ice and steel. The collision pressure measured in the collision experiment was compared to the forces reported in other studies to investigate the expandability of the collision velocity and energy of this device. Although several researchers have proposed ice colliders, in this study, the collision velocity and energy and the size of the device are different, so it would be useful to explore the relative differences. Therefore, the results of this study are expected to serve as a comparison and reference for other studies dealing with ice–structure interaction. In addition, this study is a preliminary work to obtain experimental data necessary for finite element analysis to simulate ice–structure interaction and collision. It was initiated as a preliminary work to validate the results of numerical analysis for predicting ice collision force.

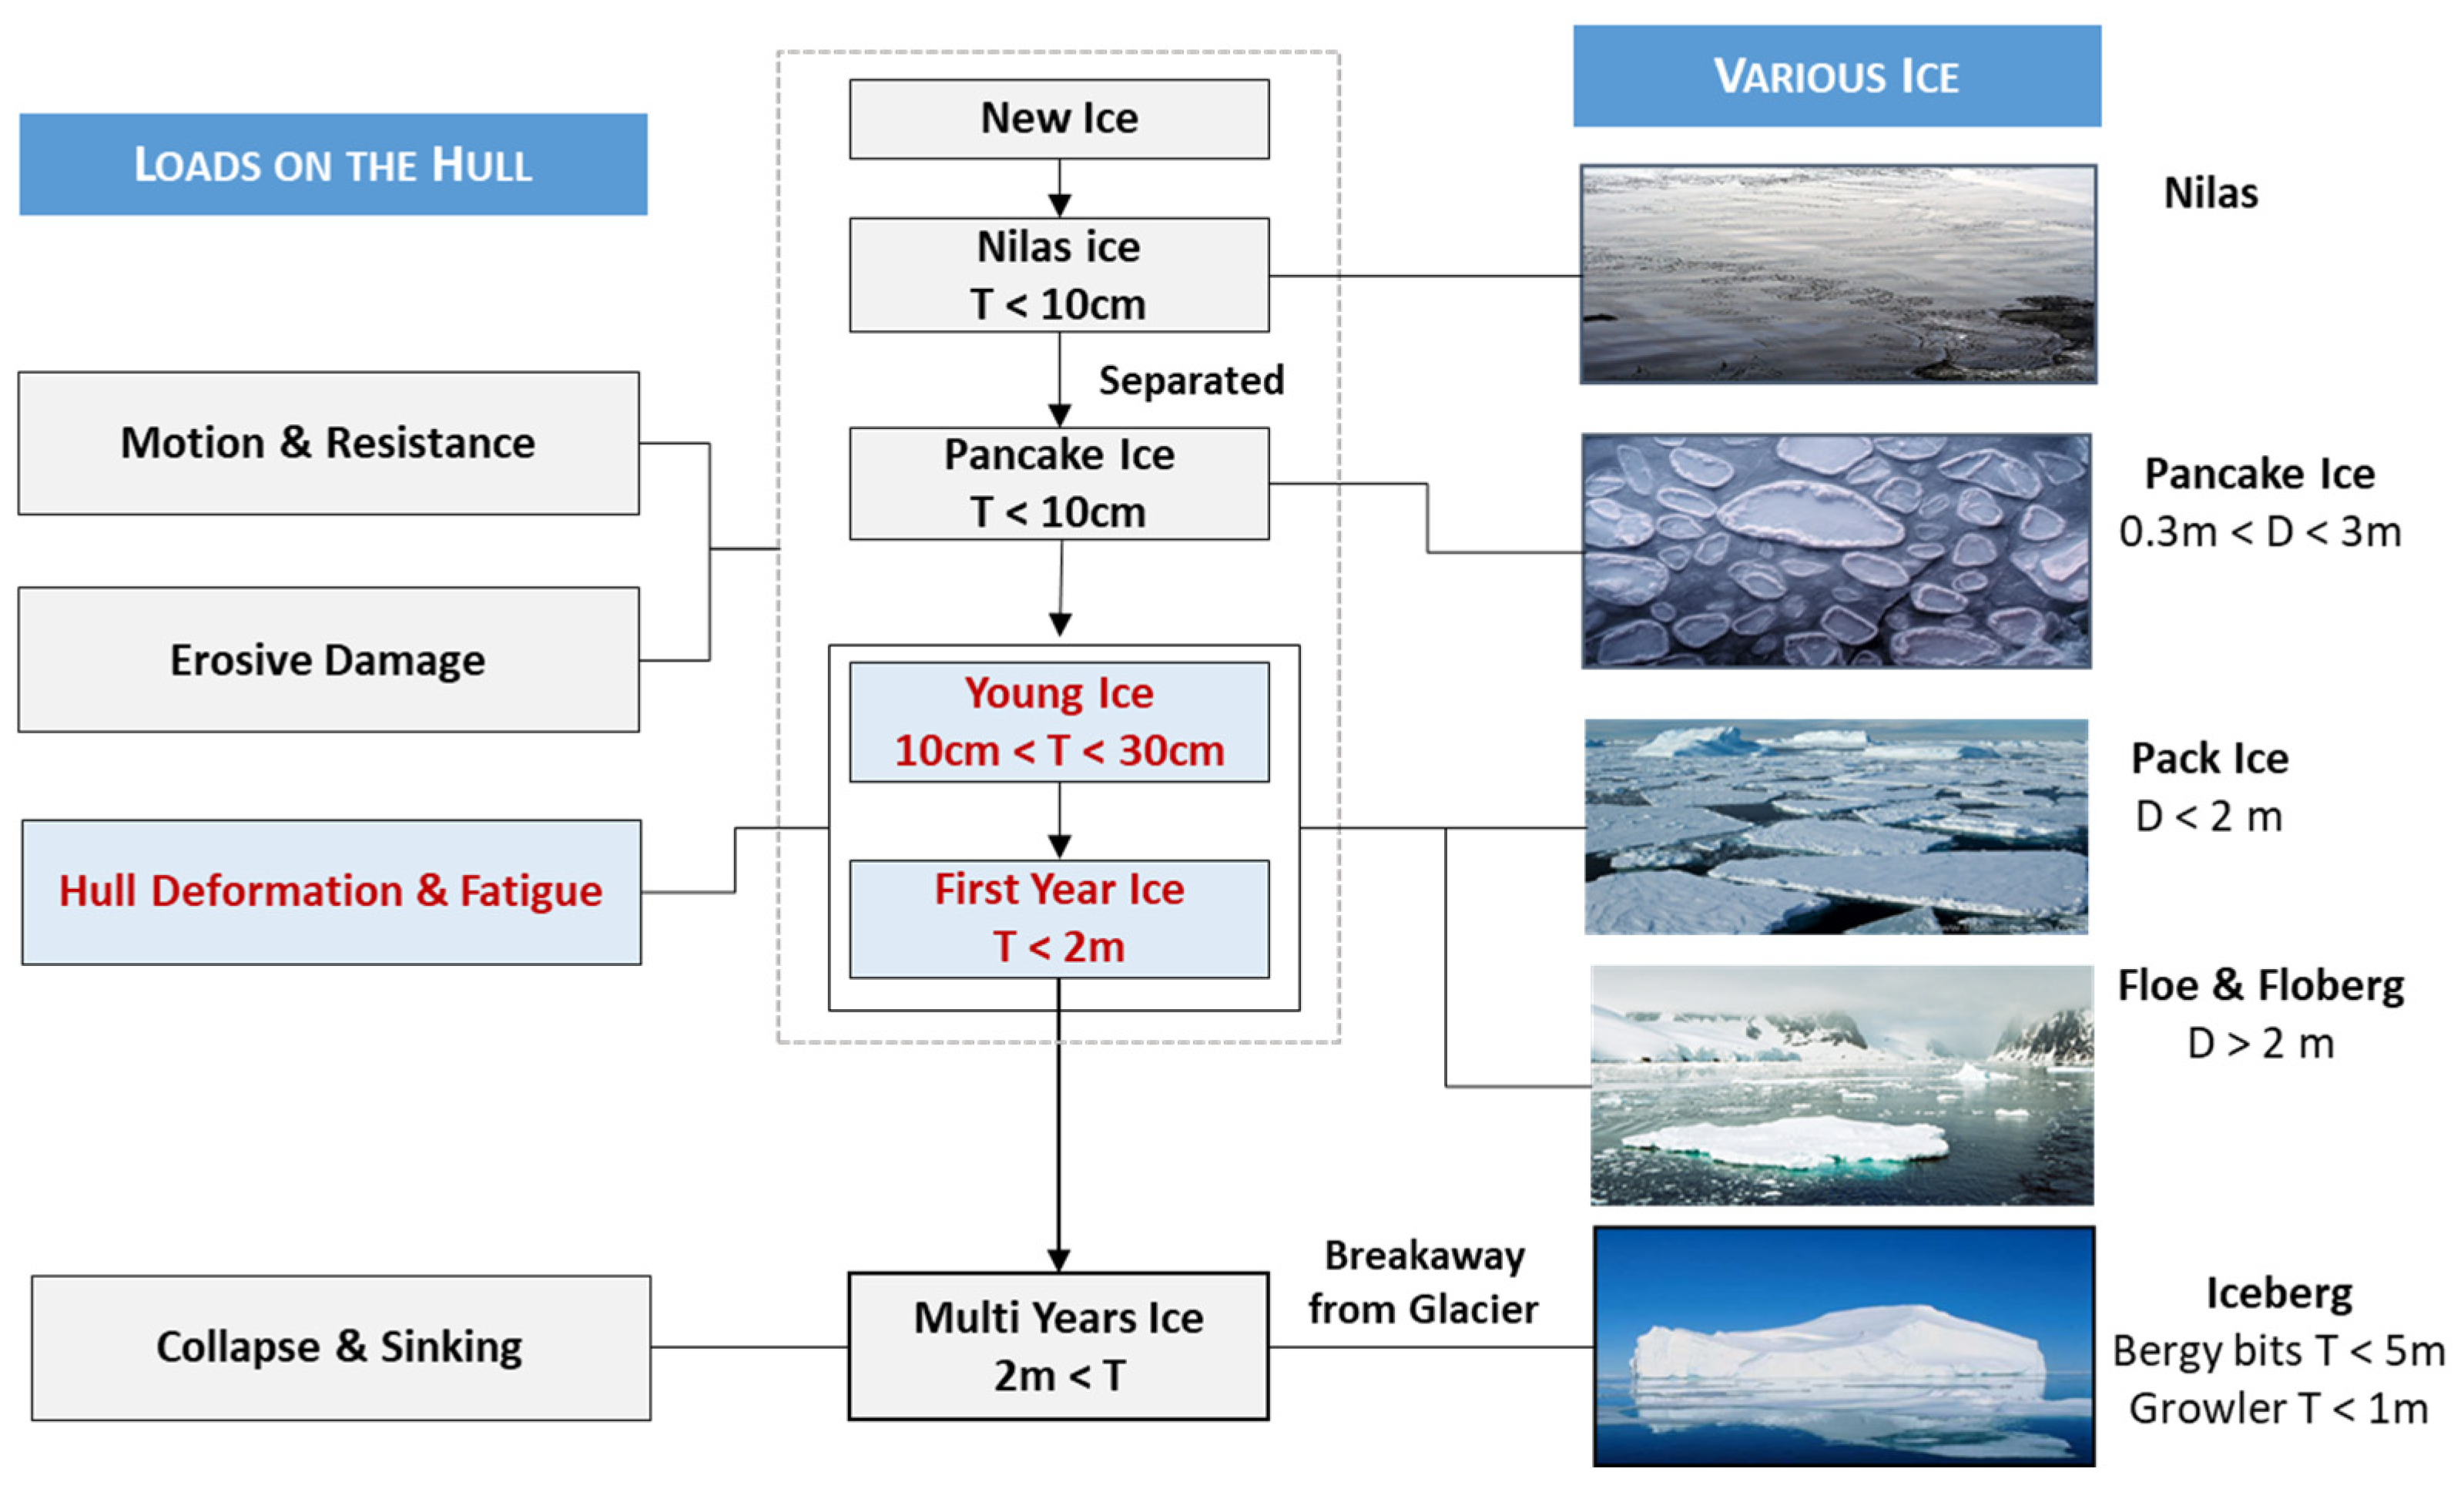
2. Ice Collision Interactions and Problem Definition

According to Zhang [21], ice collision forces on a structure can be categorized into global and local loads, which have different effects on the hull. Specifically, global loads lead to rigid body motion and ice resistance, while local loads can cause hull deformation, collapse, sinking, fatigue, and abrasive damage (e.g., erosion and abrasion). These effects and loads on ships also depend on the year and size of the ice involved in the collision. A number of researchers, such as Zhang et al. [21], Zhang et al. [22], and Gao et al. [23], have classified ice types and shapes and investigated their relationship with the impact load on structures, and a summary is provided in Figure 1. Ice can be categorized as new/young, first-year, or multi-year ice. New ice types, such as nilas or pancakes, primarily cause surface wear on the hull in low-velocity collisions and do not have enough energy to deform the hull. In contrast, large multi-year ice causes structural fractures and large-scale collapse. Furthermore, Kubat and Timko [24] conducted an analysis of ship damage occurring over a 34-year period in the Canadian Arctic. Their investigations revealed that 73% of the 125 incidents were caused by multi-year ice, while the remaining cases were attributed to first-year ice. In a separate study, Zhou et al. [25] concluded that first-year ice ridges are frequently important for consideration from an engineering perspective. This conclusion arises due to their potential to induce substantial loads on structures. Regardless of the size of the ice, this means that most ice collisions pose a threat to shipping and navigation activities. Therefore, this study focuses on first-year ice, which causes local hull deformation. By measuring the contact pressure between ice and the hull and integrating it over the contact area, it is possible to identify the local ice load, which is the primary cause of hull deformation and fatigue.

3. Configuration of the Ice-Collision-Pendulum Tests

This section outlines the types of ice collisions that are the primary focus of this study and describes the experimental environment that was simulated. First, the test rig, which is equipped with two pendulums designed to measure structural collisions with ice, is detailed. The methodology for assessing the compressive strength of an ice specimen, used as a collision object, through compression tests is also outlined. Subsequently, the results of the collision experiments, conducted in a chamber at −20 °C and with collision velocities of 5, 7, and 10 knots, are presented. Finally, the measured strain and two-dimensional pressure distribution on the steel-plate specimens during the tests are introduced.

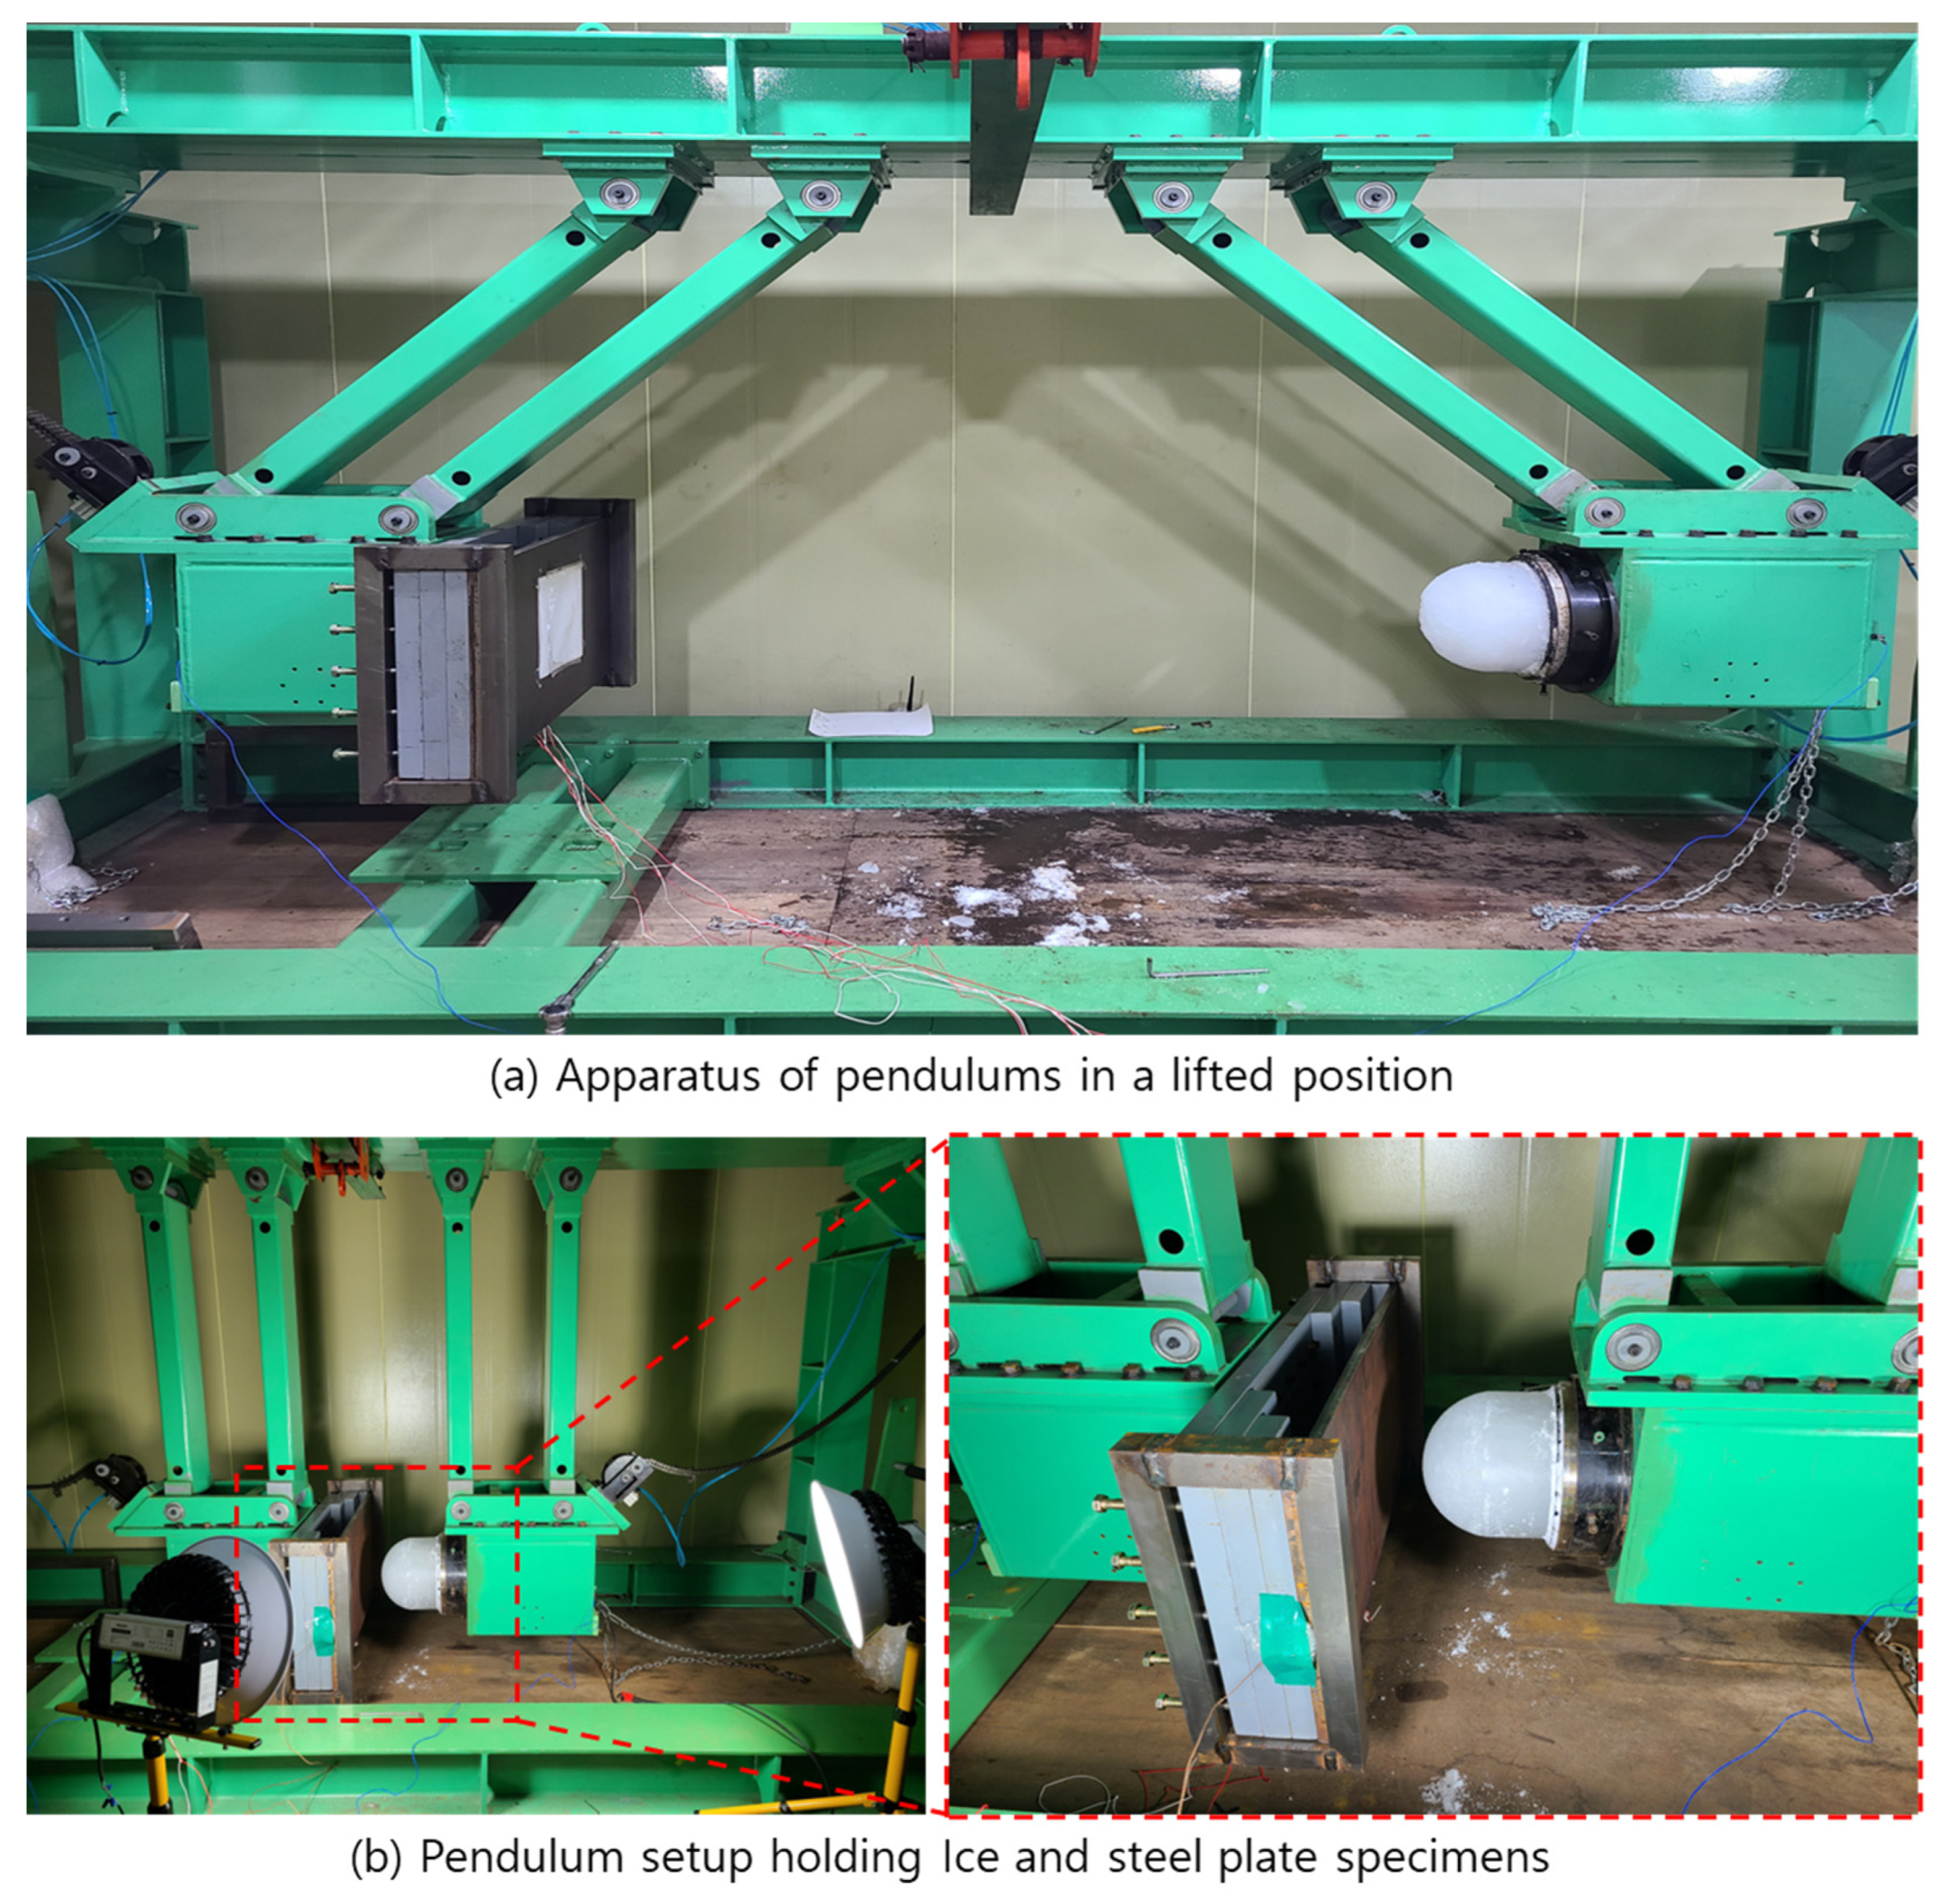
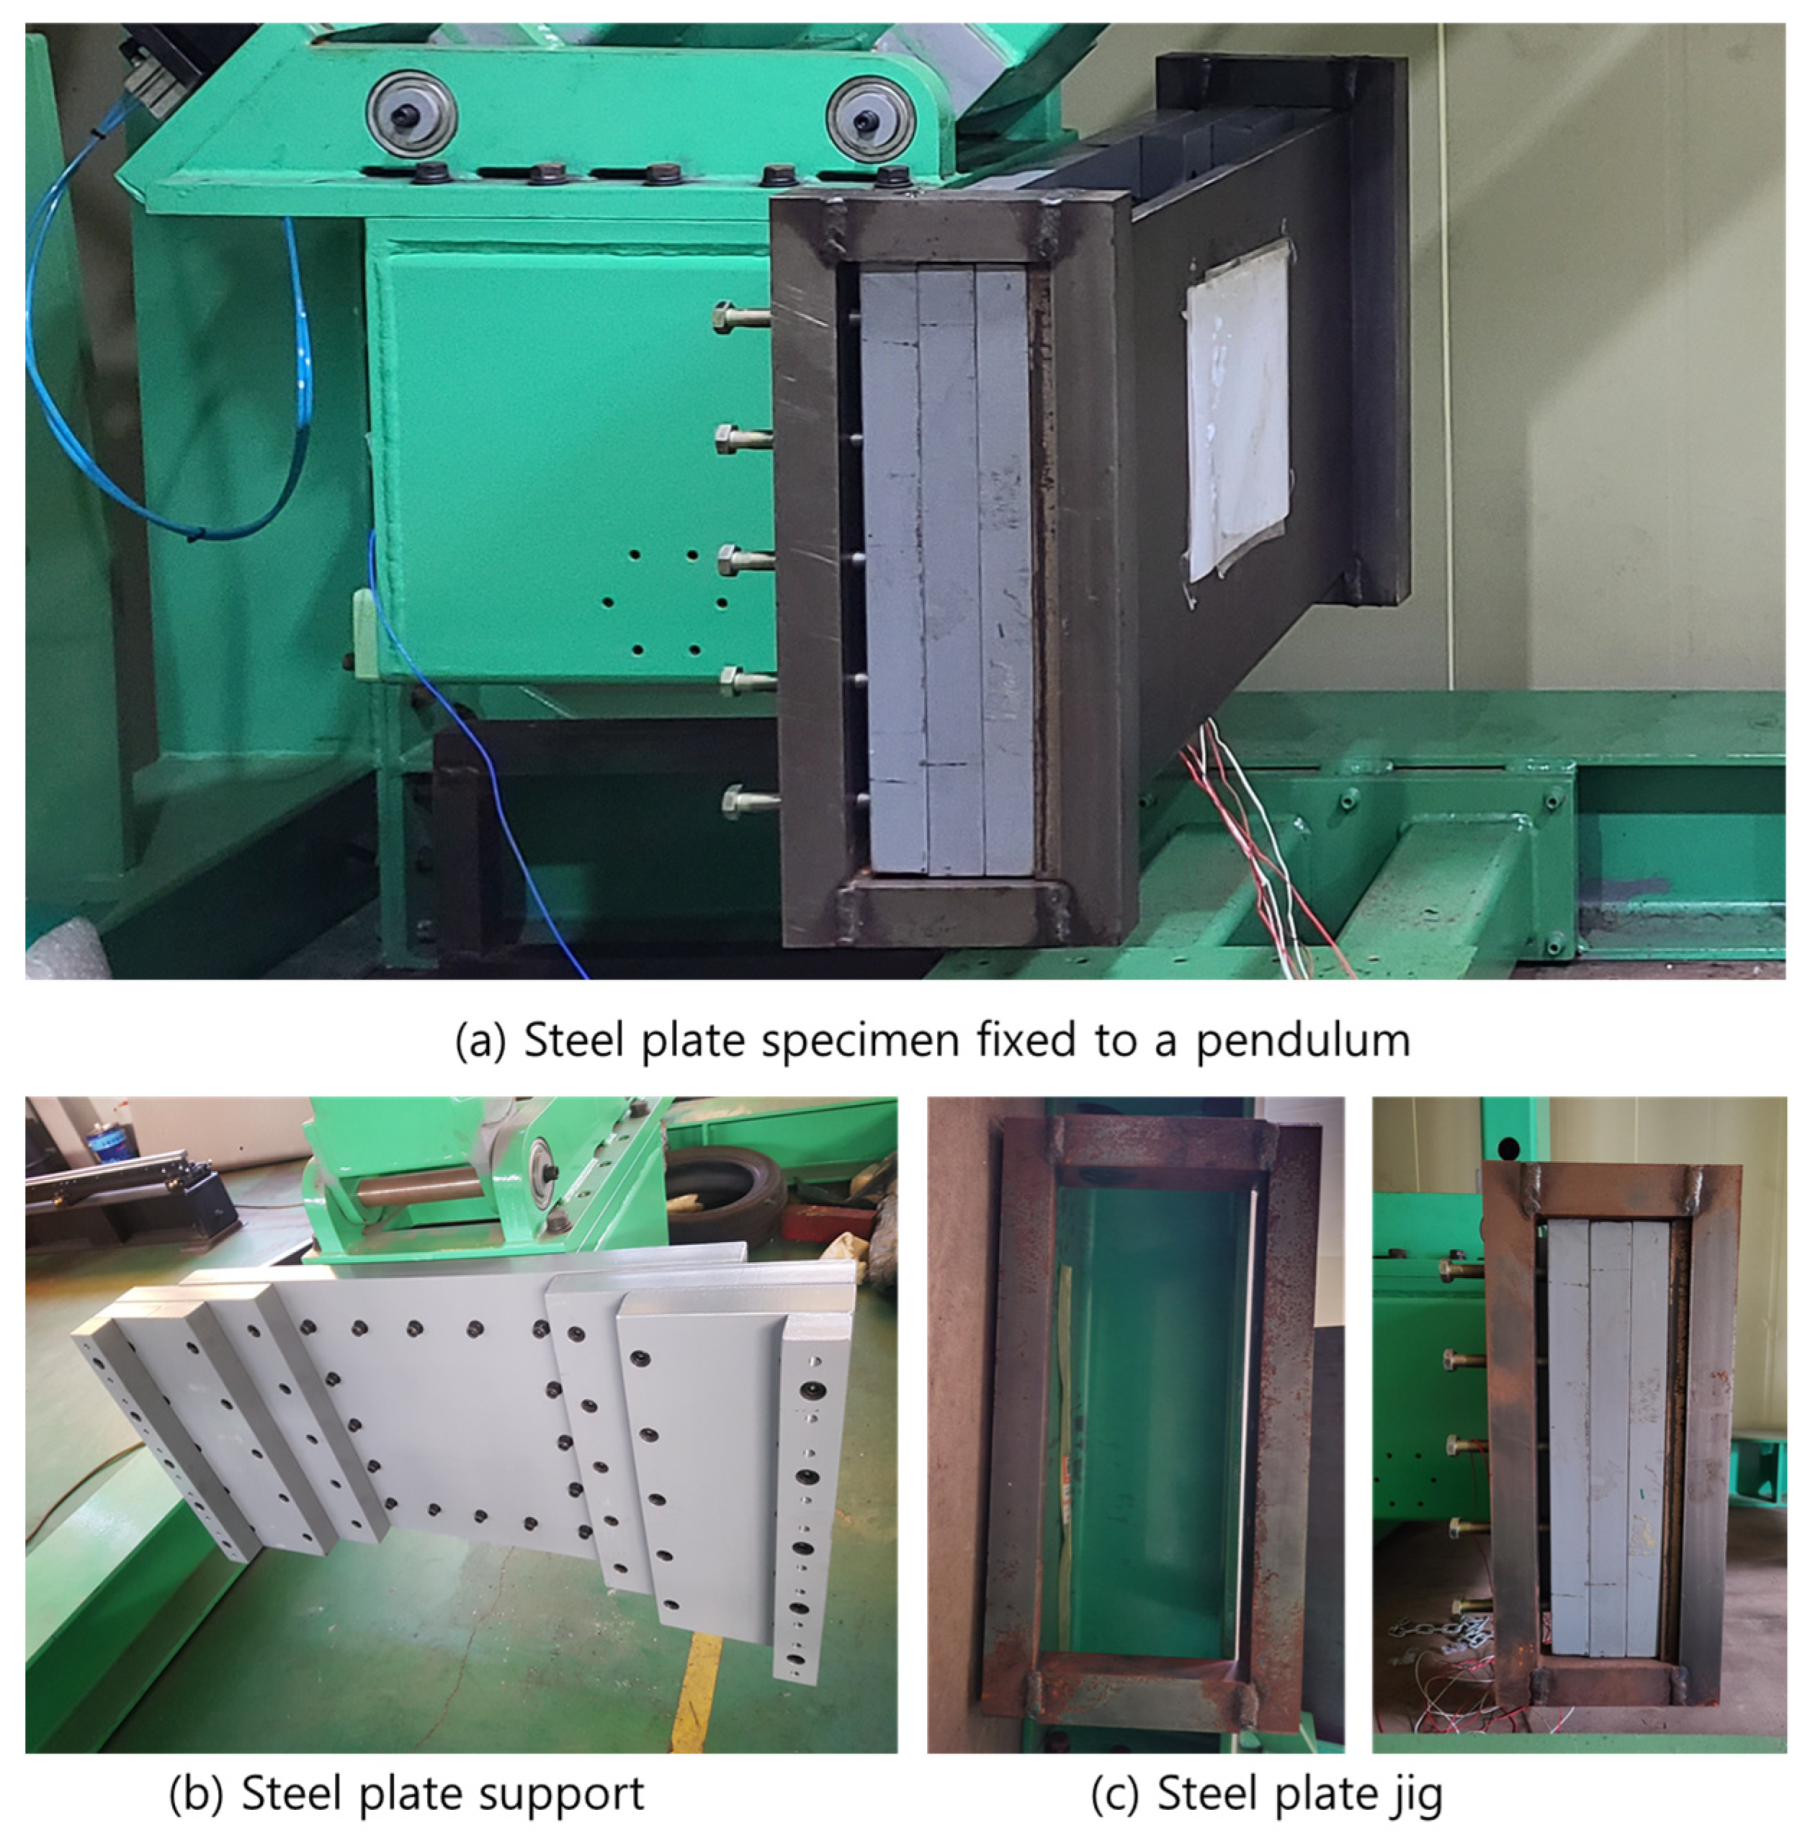
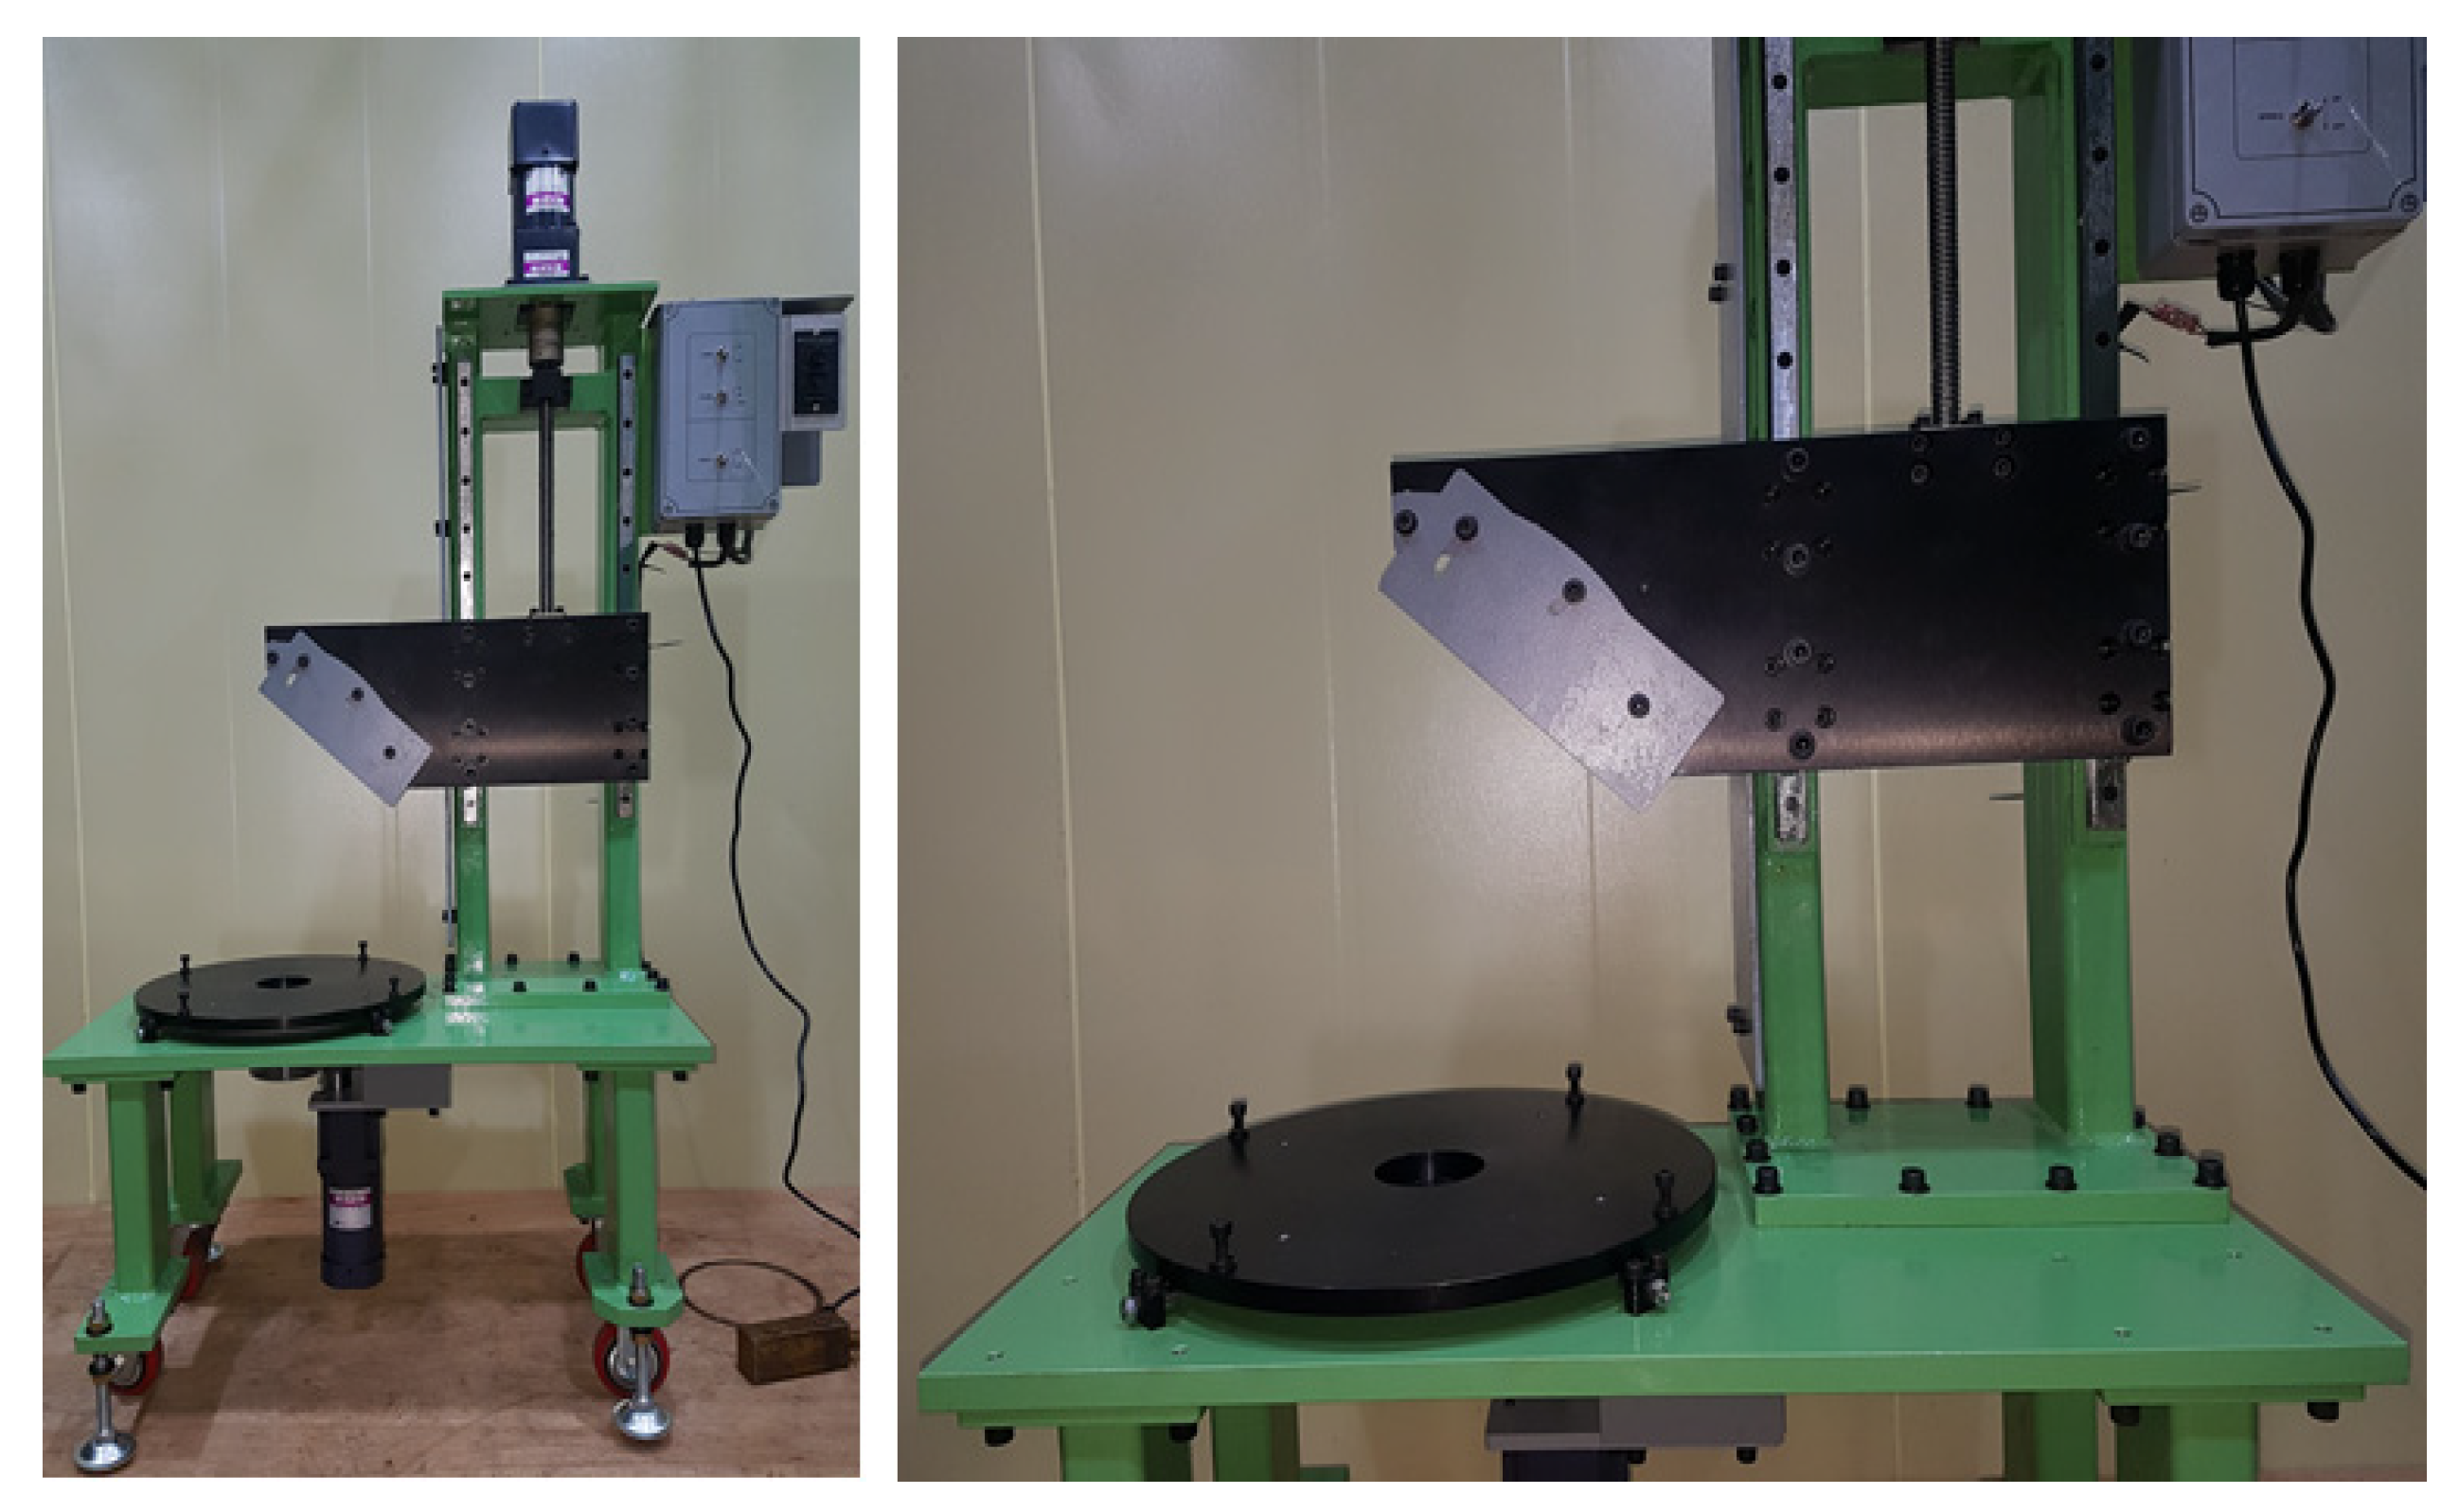
3.1. Overview of Ice-Collision-Pendulum Apparatus

In designing the ice-collision-measurement method for the current study, we reviewed experimental setups from previous studies, as summarized in Table 1. Apparatuses for measuring ice–structure collisions can generally be categorized into those designed for high-speed collisions and those for medium-to-low-speed collisions. High-speed setups are most commonly used to analyze low-energy but high-velocity collisions, such as those between aircraft and hail; these setups often use high-speed projectiles to simulate the motion of ice. In contrast, the ice collision environment involving ships requires the ability to assess both low-to-medium speed and high-energy collisions. Various methods have been employed for this purpose, including free-drop, pendulum, and trolley designs. For low-to-medium-speed ice collisions, free-drop and trolley designs are commonly used to measure unidirectional collisions, while pendulum designs are employed for bidirectional collisions.
In the present study, we opted for a bidirectional pendulum design to generate low-to-medium-speed collisions. The speed of the collision was determined by the initial height from which the pendulum was released, according to the conservation-of-energy principle expressed by the equation 1 / 2 m v 2 = m g h , where m is mass, v is velocity, and h is height. Specifically, the relationship between the pendulum velocity ( v ), height ( h ), arm length ( l ) , and angle ( θ ) can be expressed as v = 2 g h = 2 g l ( 1 c o s θ ) . The target collision speeds were set at 5, 7, and 10 knots, with the maximum achievable speed of the experimental setup being around 11 knots. Based on these requirements and the dimensions of our collision apparatus, a pendulum arm length of 1.2 m was employed to reach the maximum target speed. The experimental setup was assembled in a low-temperature chamber, measuring 4.5 m in length, 2.5 m in width, and 2.3 m in height. The specifications for the pendulum apparatus are detailed in Table 2, and images of the setup can be found in Figure 2.
In the experimental setup, a support structure and a jig were fabricated to secure the steel-plate specimen to the pendulum. The support structure serves as a linkage between the pendulum and the steel plate specimen, while the jig attaches the support structure to the specimen itself (as illustrated in Figure 3). Bolts on the back of the steel-plate specimen can be tightened to attach it to the jig and support structure, allowing for the use of steel plates with various thicknesses. Initially, the steel-plate specimen was fastened to the support structure by drilling holes around its edges and securing it with bolts. However, this method led to inconsistencies in the positioning of the holes during fabrication. To overcome this issue, the setup using a square frame was redesigned. The specimen is now fixed in place by tightening bolts into this frame, which is situated on the back of the plate. The support for the plate specimen was constructed from thick steel plates arranged in a staircase shape and affixed to the pendulum. This was performed to accommodate the plate’s deformation during the collision. Due to this fixed condition, the steel plate is free to deform in the width direction but is restricted in the height direction by the jig.

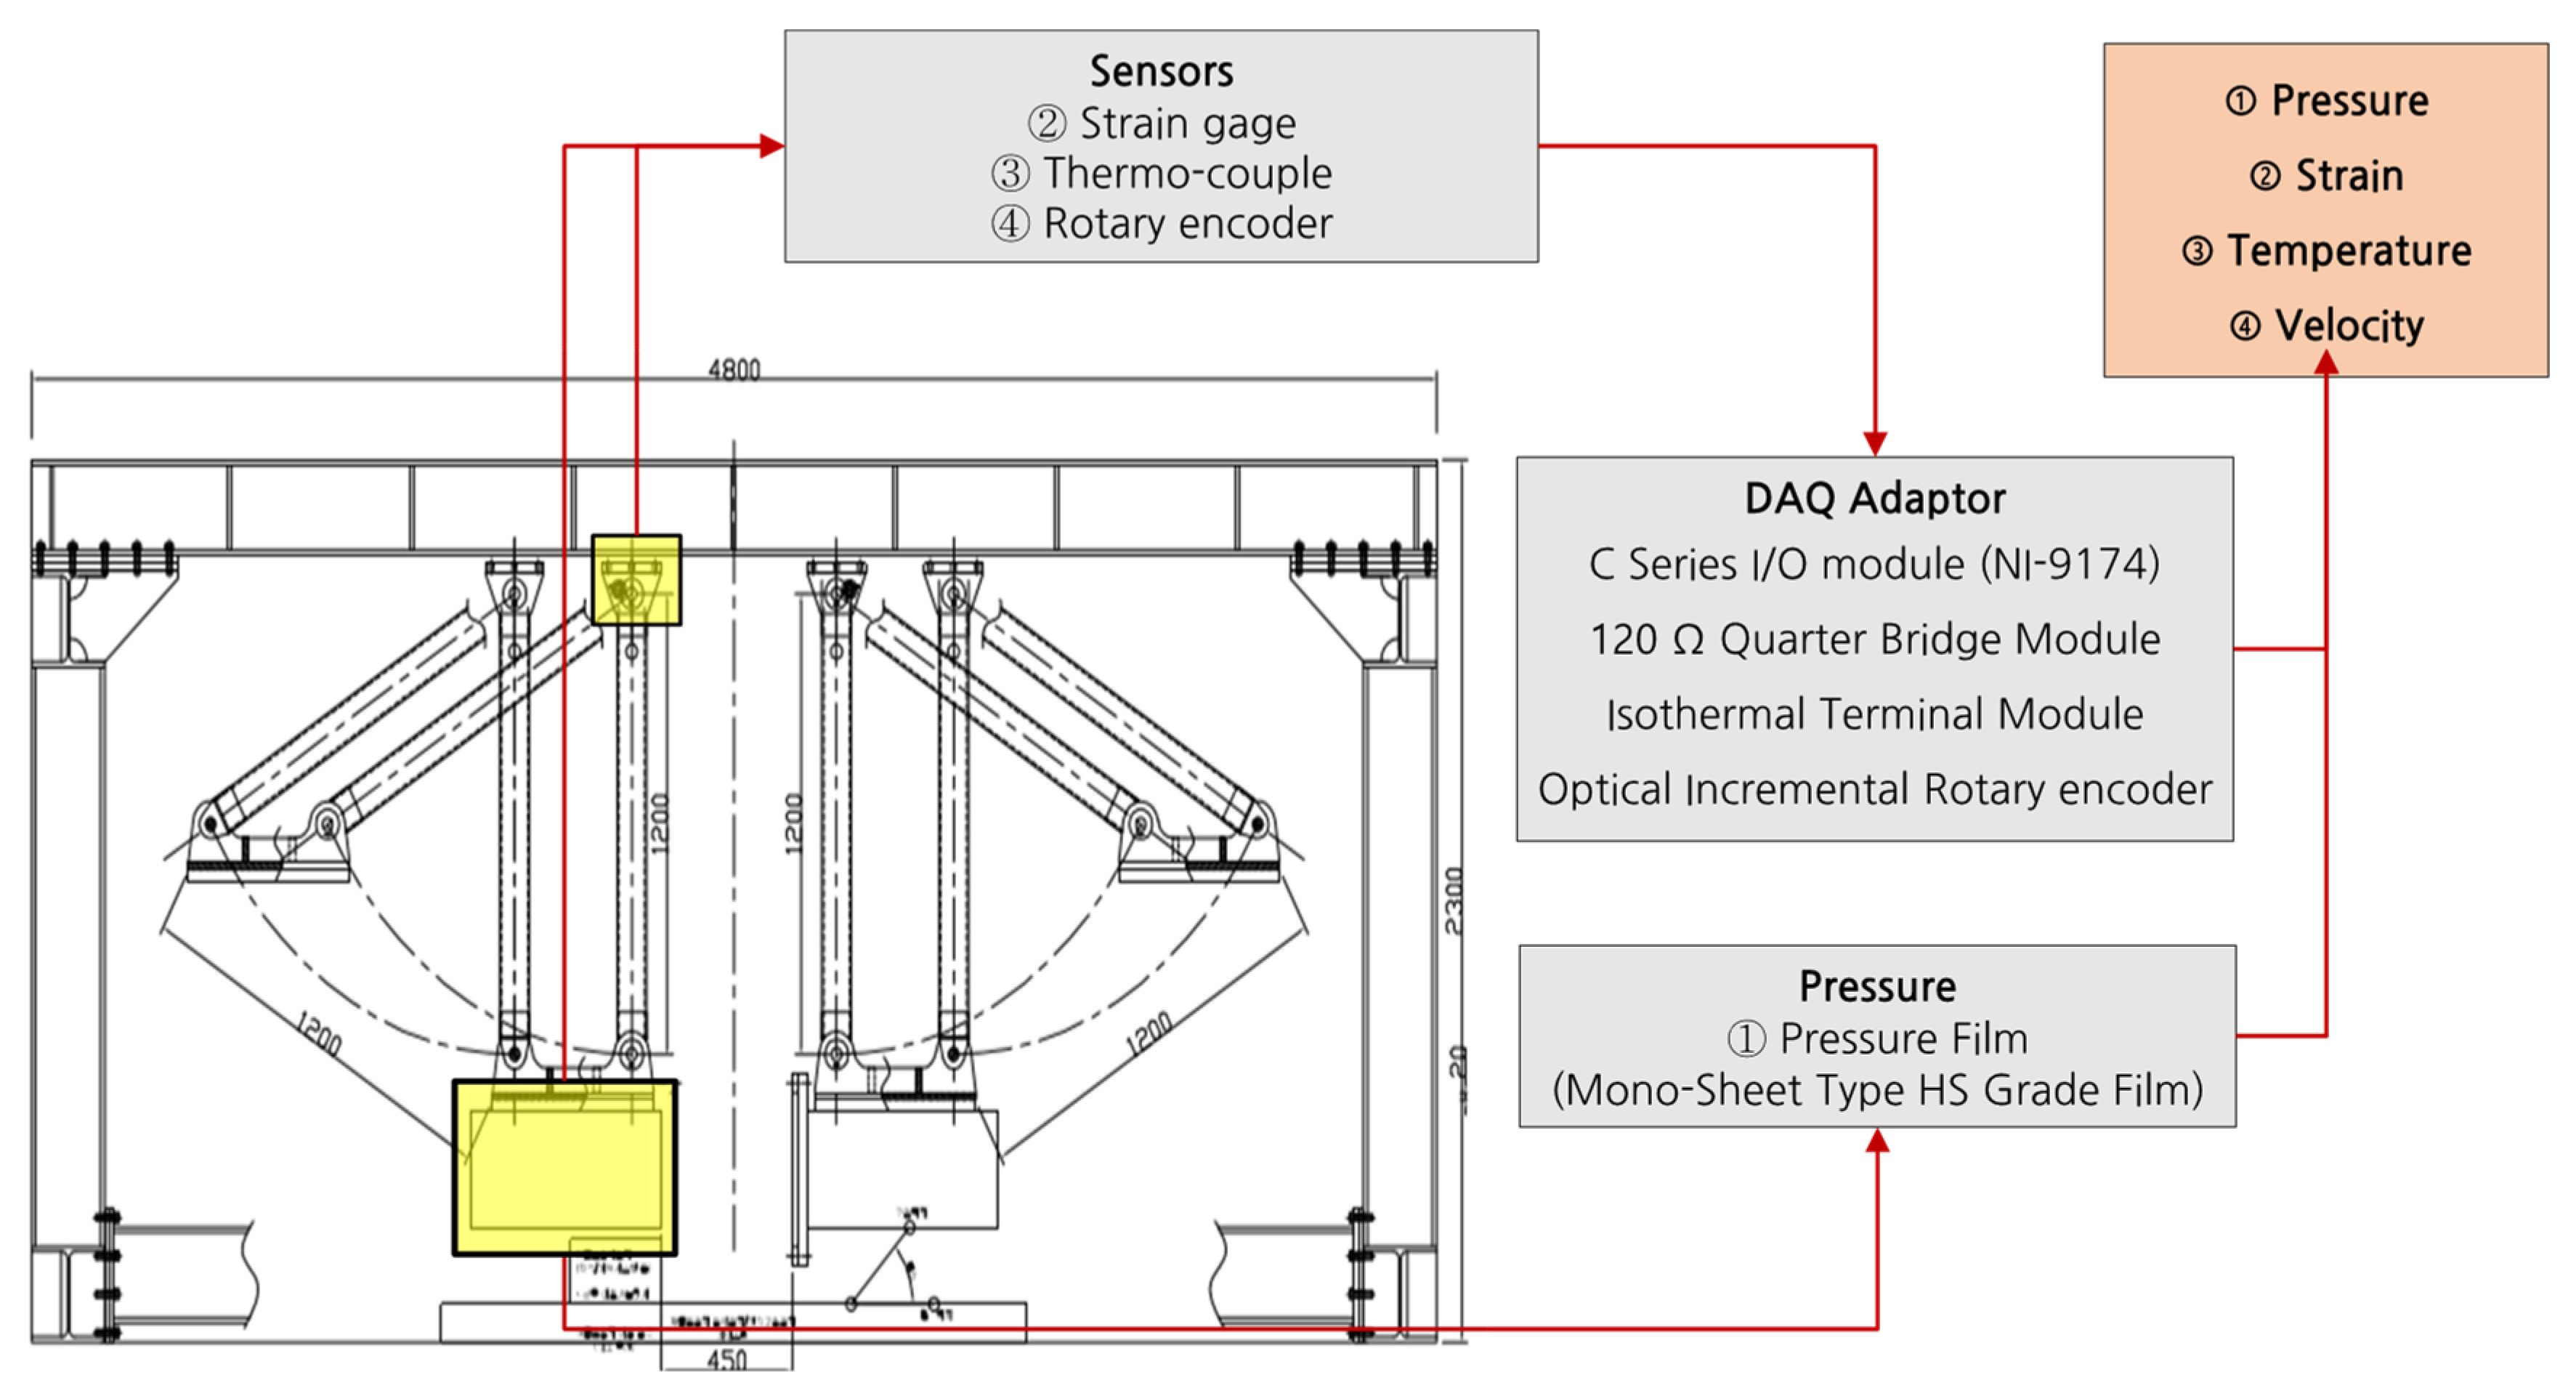
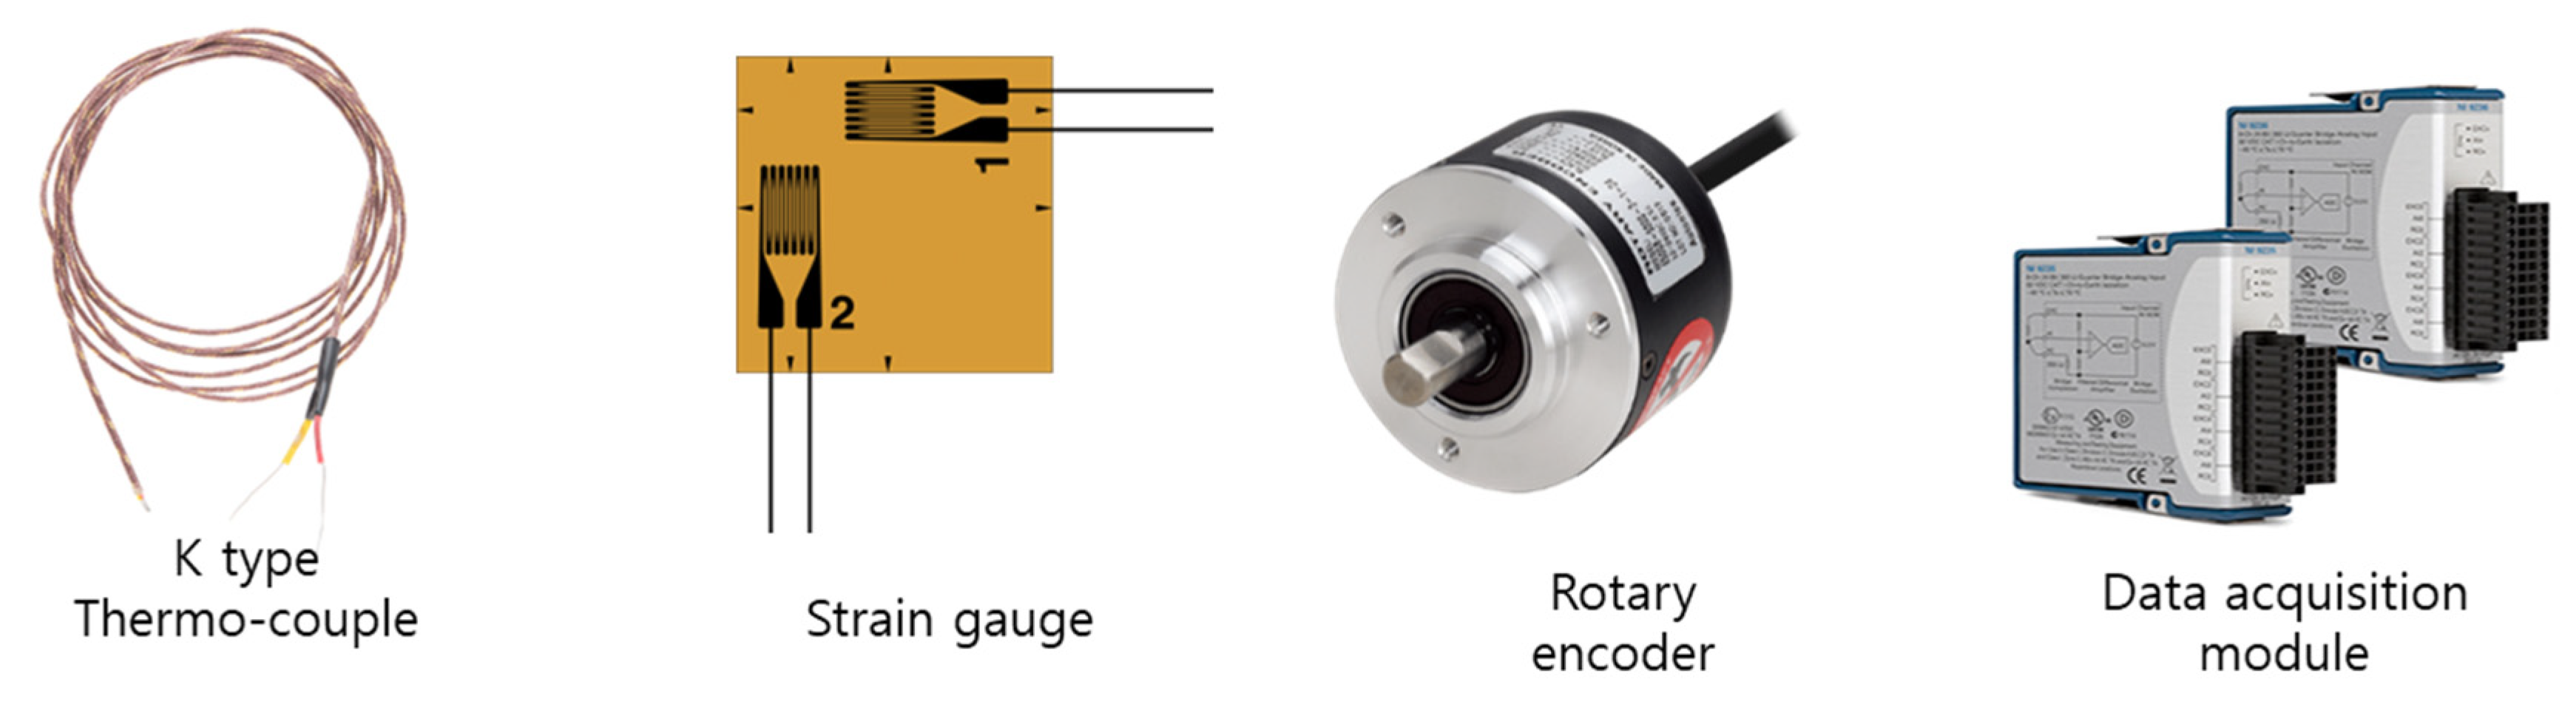
3.2. Experimental Measurement System Configuration

The configuration of the experimental equipment utilized in this study is depicted in Figure 4. Three types of measurement sensors were installed on the rig for analytical purposes:
  • The time-dependent strain on the plate specimen was measured by a strain gauge.
  • The angular velocity of the pendulum was captured by a rotary encoder.
  • The ambient temperature in the laboratory was recorded by a K-type thermocouple.
A sampling rate of 1000 samples per second was set for the time-series data. Data from each sensor were collected and stored by LabVIEW software. To measure the collision pressure and contact force accurately, a high-pressure pre-scale film (HS grade, manufactured by Fujifilm) was affixed to the collision surface of the plate, as shown in Figure 5. This film is a mono-sheet type and has a pressure sensitivity range of 50–150 MPa. The rupturing of microcapsules within the film’s colorant layer during a collision causes a color-developing material to be released, which is then absorbed by a developer layer. A red hue, whose intensity is indicative of the magnitude of the pressure, is thereby produced. The intensity of this color was quantified by using an Epson Perfection V370 scanner and FPD-8010E software. From this, variables such as the pressure distribution, contact area, and collision force could be calculated. A resolution of 200 dpi was captured by the scanner, and the information was saved as an image file, such as a JPG. While the time history of collision reaction forces is commonly recorded by load cells, pressure film was used in this study. This choice enables the spatial distribution of the maximum instantaneous ice collision pressure to be measured.
Figure 4. Configuration of the sensors attached to the ice-collision-pendulum apparatus.
Jmse 11 01761 g004
Figure 5. Configuration of the pressure film and measurement of the collision pressure distribution.
Jmse 11 01761 g005
To measure the strain in the plate specimen, a biaxial rosette strain gauge was employed, given that it is not subjected to shear deformation due to ice collision. To capture the angular velocity of the pendulum arms, digital rotary encoders (Autonix e50S8-1024-6-L-5; Figure 6) were utilized. These encoders, which are integrated into the bearings of both pendulum arms, came with built-in analog converters. They offer a performance of 1024 pulses per 360° rotation and function within an operating temperature range from −30 to 85 °C. The temperature inside the chamber, as well as that of the steel plate specimen, was monitored using two K-type thermocouples from National Instruments (See Figure 6). These thermocouples operate within a range of −29 to 480 °C. To ensure optimal thermal contact between the thermocouple tip and the steel plate’s surface, thermal grease that is used to ensure high thermal conductivity was applied to the steel-plate specimen.

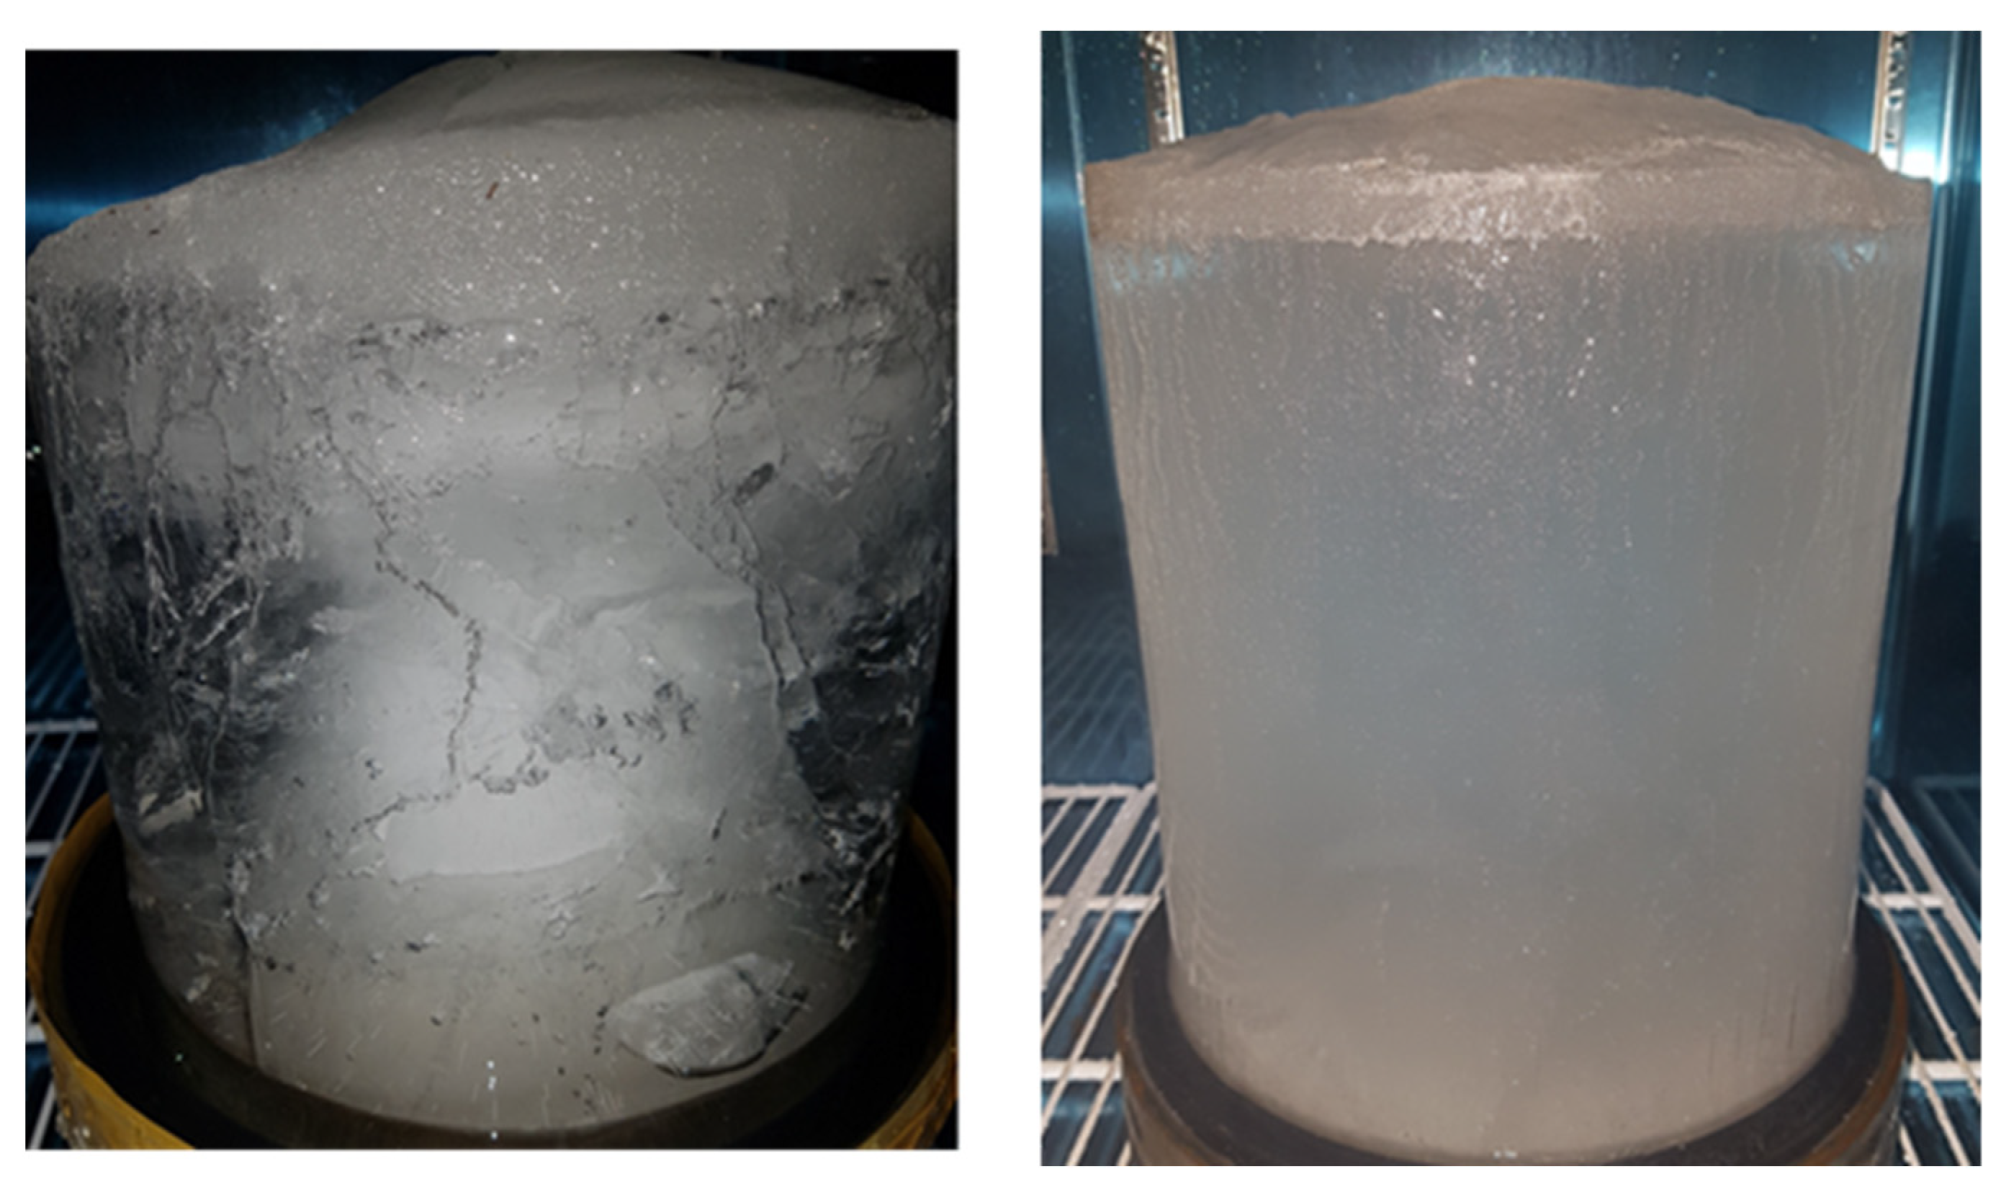
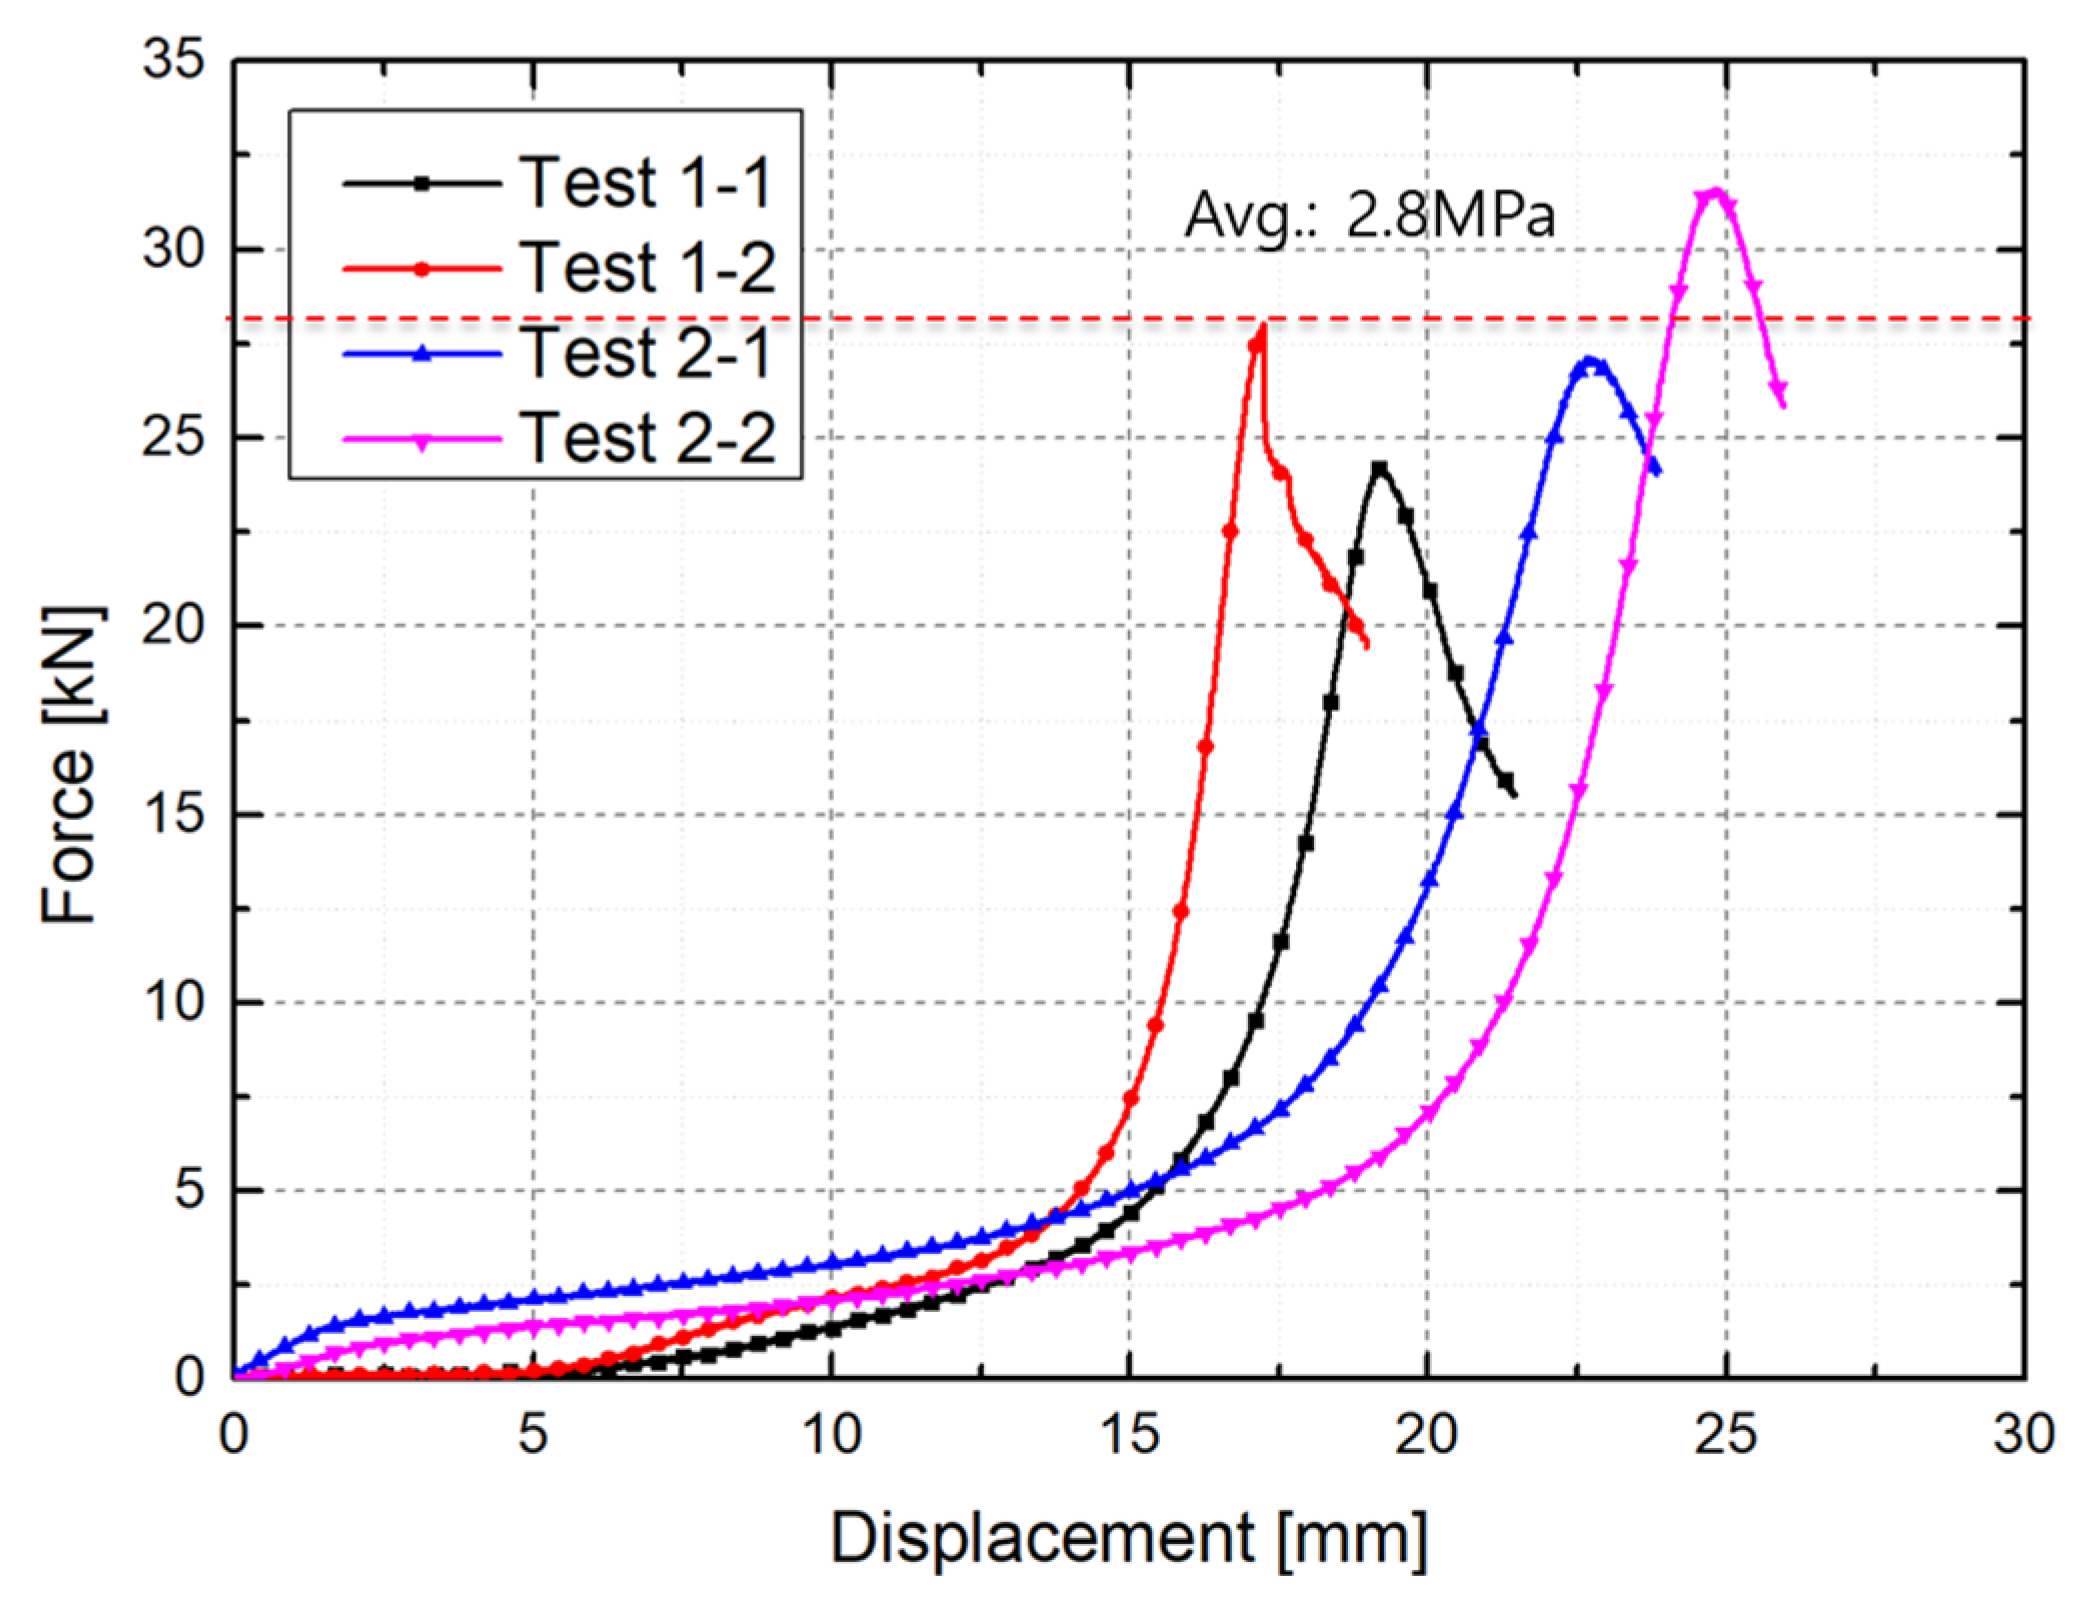
3.3. Ice Specimen Fabrication and Strength Measurement

The crushing strength of ice significantly influences the force outcomes in ice–structure collisions. As outlined by Chai et al. [31], various factors, such as strain, particle size, temperature, crystal structure, salinity, and porosity, play a role in determining the strength of ice. To mitigate experimental uncertainties, the present study used ice specimens manufactured to have uniform strength, following established methods in earlier studies [32,33,34,35,36,37,38,39]. In particular, the methodology by Do and Kim [39] involved the purification of tap water to yield pure water for ice specimens. Kim and Choi [34] suggested that a mixture of EG/AD/S could simulate the mechanical properties of columnar sea ice effectively. However, concerns regarding maintenance issues from organic bacteria due to the sugar component in the EG/AD/S solution led to the use of a modified ice specimen model with a minimal EG/AD concentration in this study. Ultrapure water was employed to craft the ice specimens, to which a 0.5% concentration of organic compounds and antifreeze was added. As shown in Figure 7, visual comparisons indicated that ice specimens generated from groundwater contained pores and cracks. In contrast, specimens made from purified water appeared to be more transparent and exhibited fewer pores.
A hemispherical extrusion was assumed for the collision experiments. To achieve ice specimens with a hemispherical shape of 300 mm in diameter ( D ) and 250 mm in height ( h ), a specialized specimen-processing machine was designed and fabricated (Figure 8). This methodology ensured the production of specimens with uniform mechanical properties, an essential consideration for ensuring the reliability and accuracy of experiments in the fields of ice mechanics and their numerical study.
Before collision tests were conducted, it was deemed essential to verify that the ice specimens possessed constant mechanical strength, as variability in ice strength introduces uncertainties into the results of collision experiments. A series of quasi-static compression tests were performed on rectangular parallelepiped ice specimens with a cross-section of 100 mm × 100 mm to measure the strength of ice specimen, as shown in Figure 9. The compression tests were conducted on four ice specimens, using a tensile testing machine, and the details for these test specimens are provided in Table 3. To facilitate uniform load transfer on the nonuniform compression contact surface, a 10 mm sponge was placed between the jig and the specimen to serve as a damper. Compression was applied to the ice specimen at a rate of 0.1 mm/s. The resultant shape of the specimen following the compression test is depicted in Figure 9. The displacement–force history, characterized by a rapid increase in slope, was subsequently corrected by accounting for the effects of the jig and the sponge. The compressive strength curve was then derived, representing the compressive force as a function of compressive displacement (Figure 10).
In the quasi-static conditions under which the compressive load was applied, the compressive deformation of the ice specimens was characterized as exhibiting ductile behavior. Compressive strengths ranging from 2.5 to 3.2 MPa were recorded for the four specimens, yielding an average compressive strength of approximately 2.8 MPa, with a standard deviation of around 10%. Due to the inherent irregularities in the contact surface of the ice specimens during compressive deformation, a constant measured strength could not be assured. However, given the minimal deviation observed in the measured values, the compressive strength of the ice specimens was considered to be acceptably uniform.
It is widely known that the behavior of ice under collision conditions is influenced by the strain rate. In general, ice exhibits ductile behavior at low strain rates and brittle behavior at high strain rates. As has been discussed in the previous literature by Batto and Schulson [40], Schulson [41], and Carney et al. [42], ice behavior can range from ductile to brittle depending on the applied strain rate in compression (refer to Figure 11). It has been suggested by Schulson [41] that a transition from ductile to brittle behavior occurs at a strain rate on the order of 10−3/s under uniaxial compression at −10 °C. Although the measurement of dynamic material properties across different strain rates would have been ideal, the present study was restricted by the unavailability of the required equipment, resulting in the performance of only quasi-static compression tests. The unexamined strain-rate dependence of ice is identified as an area for future investigation.

4. Ice-Collision-Experiment Results

4.1. Experimental Conditions

The experimental conditions for the ice–structure collision tests are summarized in Table 4. The tests were conducted in a low-temperature chamber maintained at −20 °C. Hemispherical ice specimens with a diameter ( D ) of 300 mm and a height ( h ) of 250 mm were employed, along with steel-plate specimens of 1000 × 500 × 20 mm. Collision velocities of 5, 7, and 10 knots were investigated, as these speeds represent those most associated with ice impacts on marine vessels. To ensure data robustness, three replicate experiments were conducted for each collision velocity. The mass of each specimen and its corresponding pendulum was accurately measured to compute the collision energy for each experiment. The aggregate mass of the ice specimen and its associated pendulum was approximately 163 kg; individual component masses were measured as follows: pendulum at 120 kg, ice specimen at 35 kg, and jig at 8 kg. Likewise, the combined mass of the steel-plate specimen and its pendulum amounted to 406 kg, subdivided as follows: jig at 20 kg, steel-plate specimen at 78 kg, and support stand at 188 kg (refer to Table 4 for details).

4.2. Measurement of Collision Velocity

The collision velocity served as the primary variable in the experiments and was measured using a rotary encoder. The velocities of the pendulums carrying the ice and steel-plate specimens are detailed in Table 5. Figure 12 compares the pendulum velocities immediately preceding each collision against the predefined target collision velocities. The experimental data affirmed that the deviation between the relative collision velocity for the ice and steel pendulums and the target collision velocity remained within an acceptable tolerance of 0.5–1.5%.

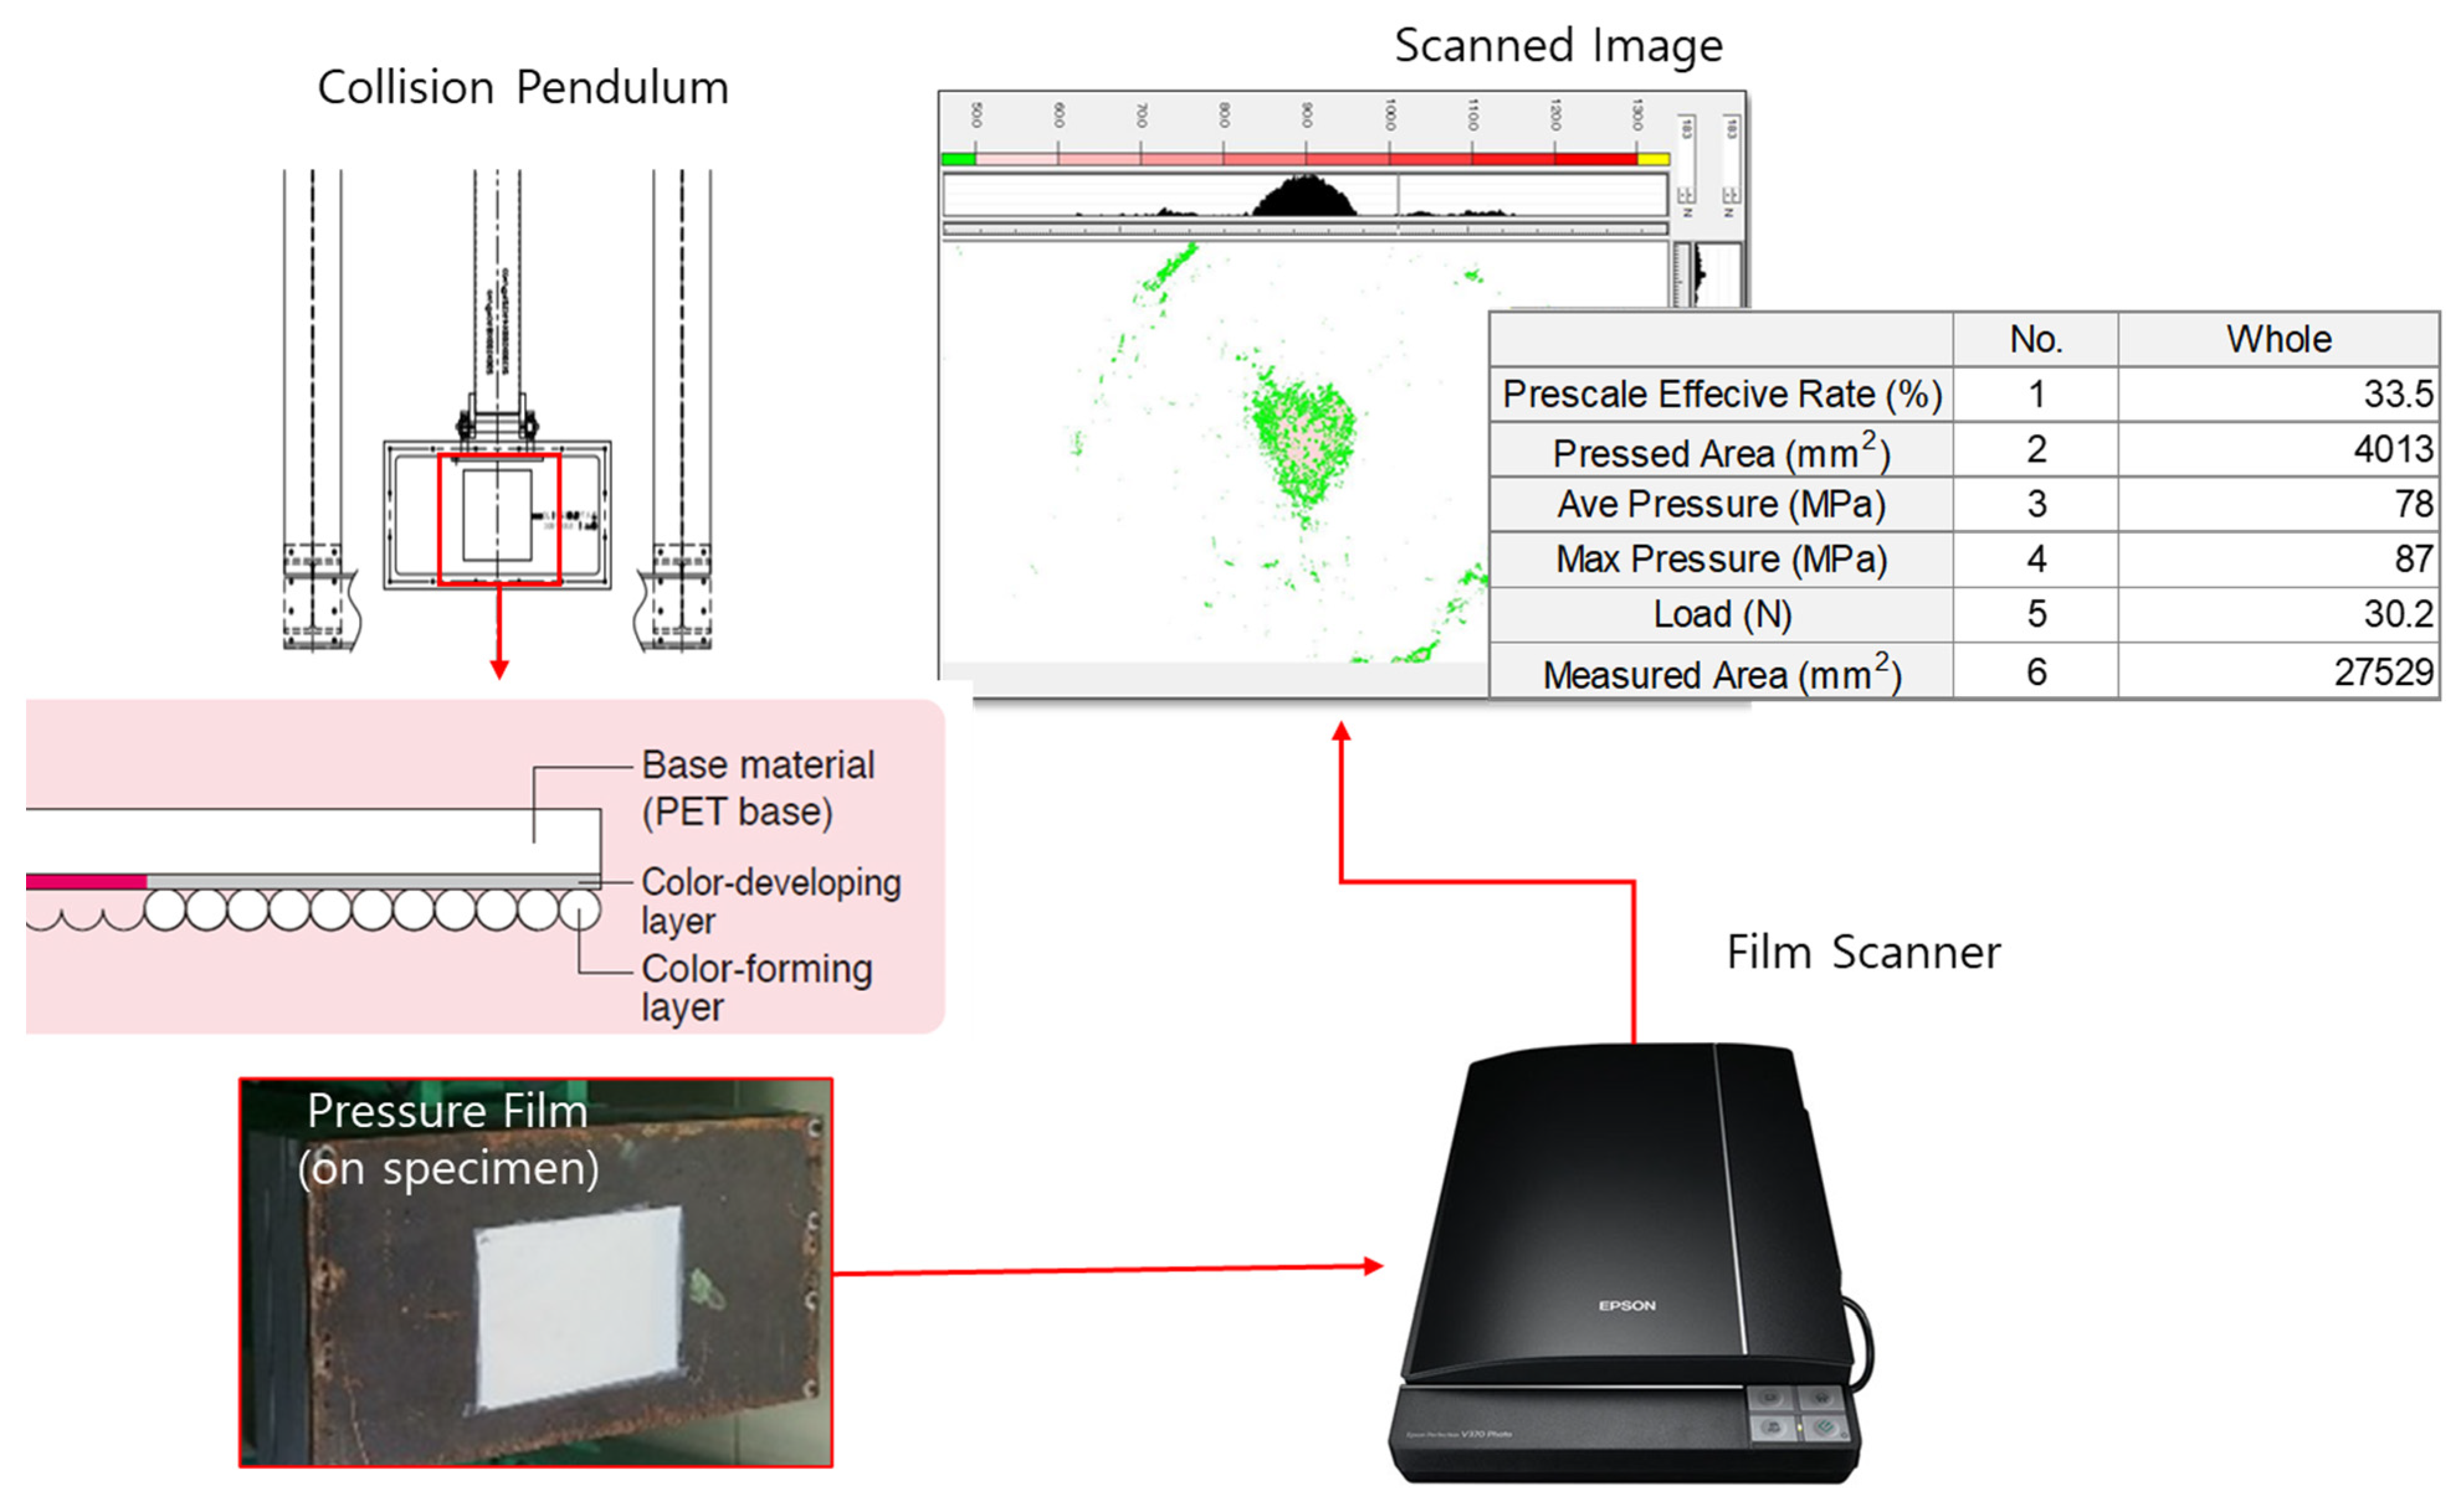
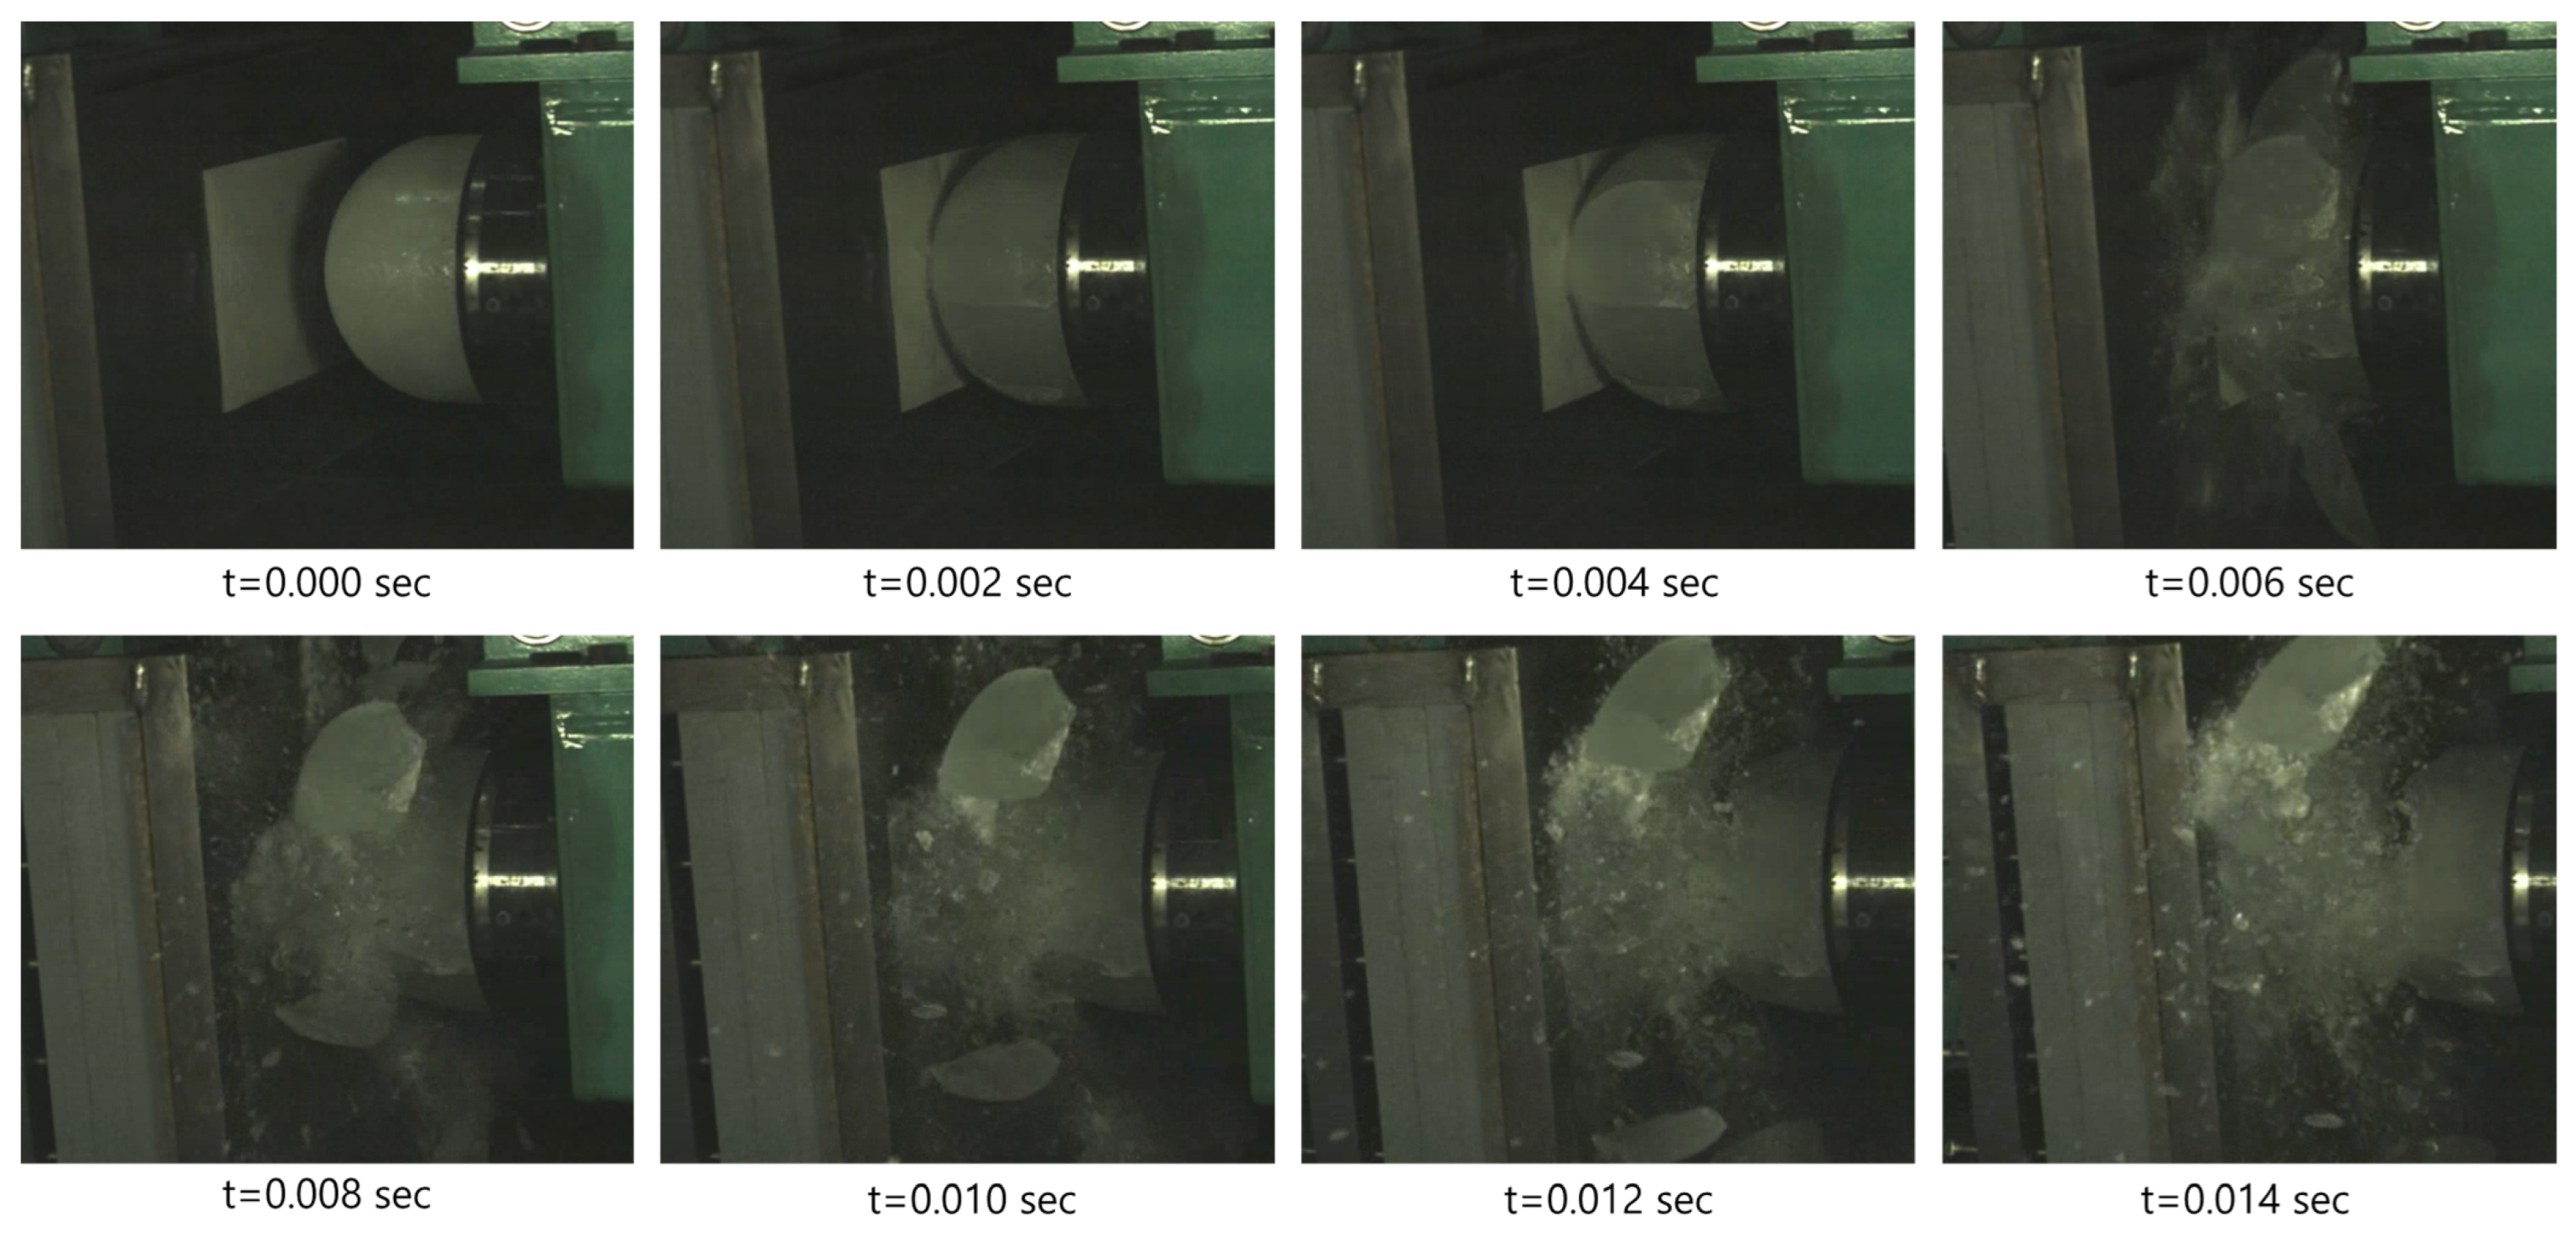
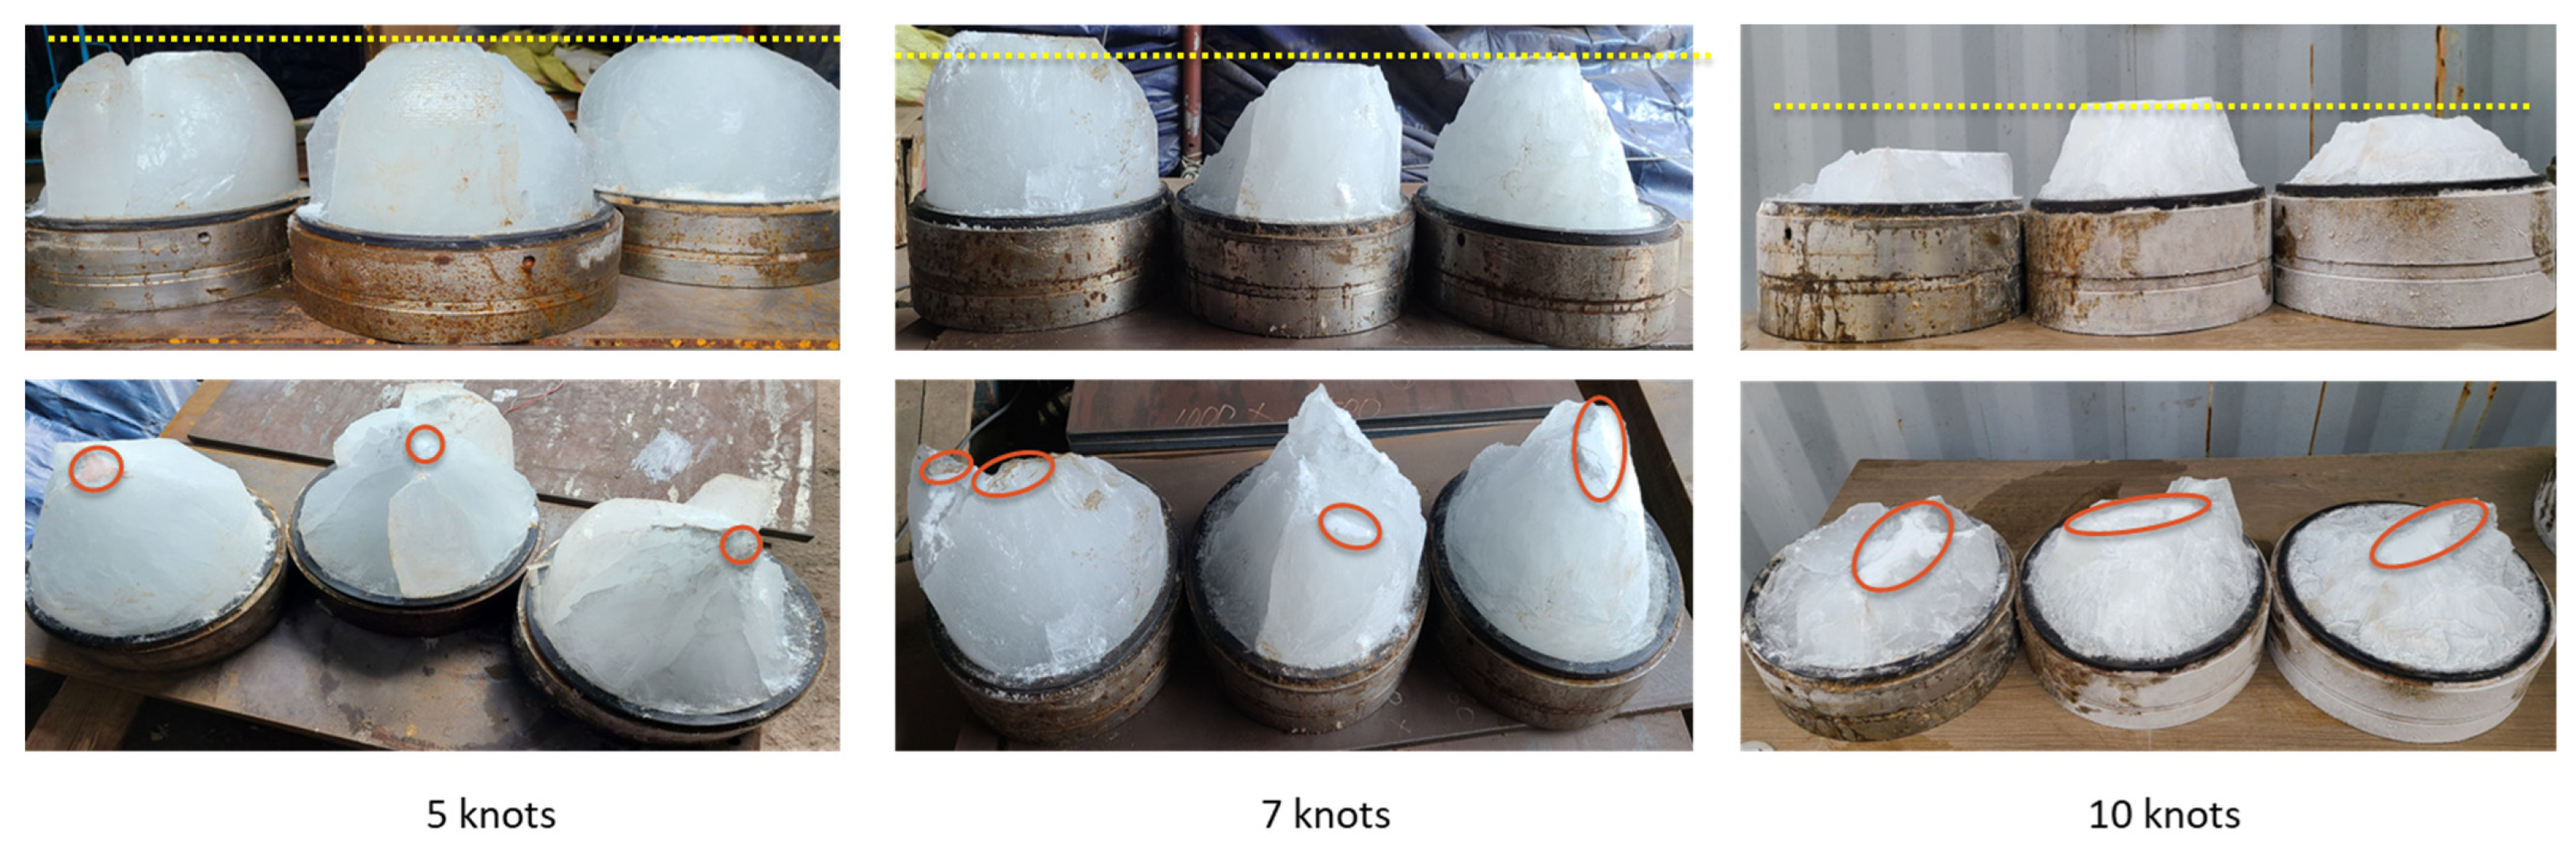
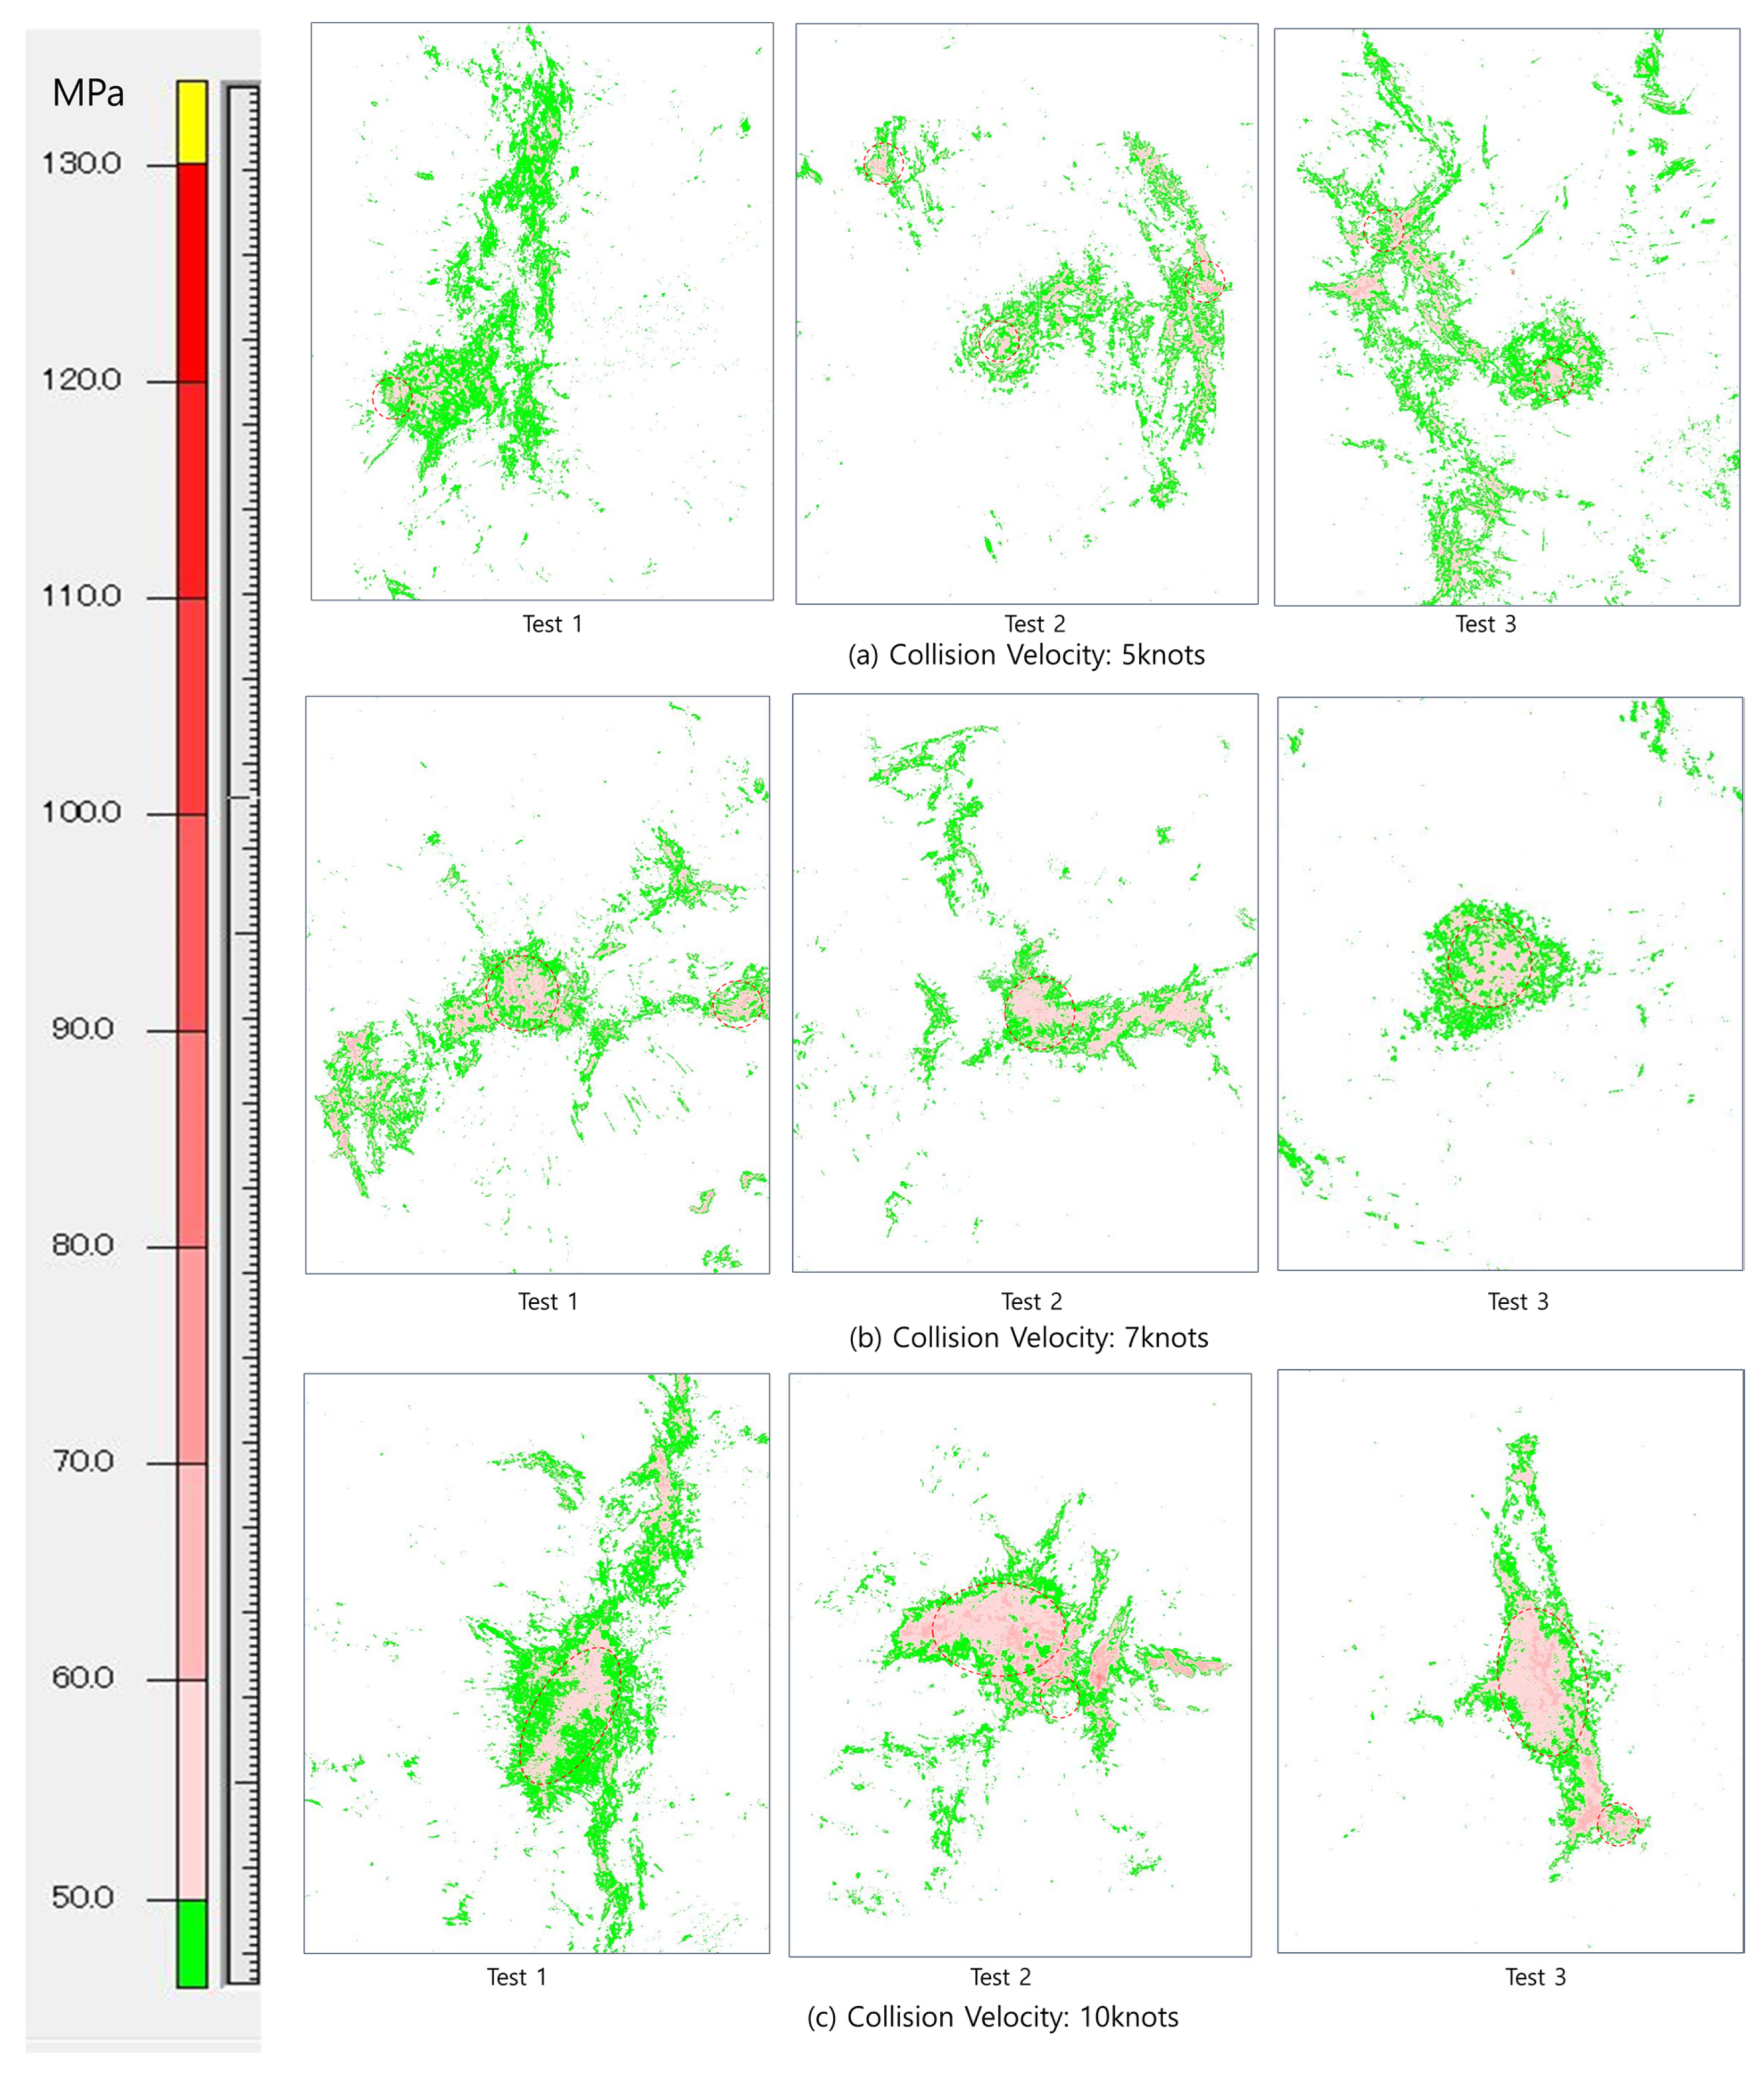
4.3. Fracture Patterns and Pressure Distribution in the Ice Specimens Post-Collision

As highlighted by Zhang et al. [21], ice displays various types of fractures during collisions, including circumferential, radial, bending, buckling, and crushing fractures. To capture these dynamic events, high-speed cameras were employed, operating at 500 frames per second. Figure 13 captures the dynamic changes in the ice specimen’s fracture geometry as the collision event progresses. A subsequent analysis of the post-collision shapes shown in Figure 14 indicated that crushing fractures were the most prevalent. The collision process is initially characterized by a high strain, which leads to spalling and consequently reduces the overall collision energy. As the collision continues, spalling occurs with diminishing strain, facilitating the emergence of both high-pressure and low-pressure zones (HPZ and LPZ, respectively). It is noteworthy that research on HPZs in ice-crushing scenarios has been conducted by Kim and Daily [43], Kim et al. [44], and Kim and Quinton [45]. These studies found that the observation of HPZs leads to a decline in impact force, attributed primarily to spalling. In line with these findings, the present study observed that the material composition of the specimen underwent irregular deformation subsequent to spalling. Moreover, HPZs were generated during the impact as the specimen experienced crushing and deceleration-induced deformation, further reducing the impact energy. The pressure-sensitive film successfully captured the events of spalling and fracturing that occurred post-collision. Notably, ice specimens that collided with the steel plate at 5 knots demonstrated minor variability in penetration length, whereas those tested at 10 knots exhibited considerable differences across tests. These inconsistencies in collision area and penetration length can be attributed to the nonuniform material properties of the ice and the occurrence of microcracks.
However, an increase in the collision velocity led to a corresponding increase in both the penetration depth and the area indicated by the red line. This demarcated area is associated with the formation of a High-Pressure Zone (HPZ), consistent with crushing failure mechanisms identified in other studies. In summary, localized ice failure during collisions was principally characterized by two dominant fracture modes: spalling and crushing. These modes were observed consistently across all experimental conditions, irrespective of the collision velocity.
As noted by Wells et al. [46], the behavior of ice during collisions—including crushing and spalling—is significantly influenced by the impact velocity and a complex interplay of additional parameters. In particular, a High-Pressure Zone (HPZ) commonly forms in the regions directly encountering the extruded ice. Adjacent areas typically manifest a Low-Pressure Zone (LPZ), characterized by finely crushed ice. The geometry and characteristics of the HPZ can vary based on several factors, including the shape and velocity of the impacting object, as well as the material properties of the ice being impacted. The HPZ is a critical parameter in ice collision studies; it provides valuable insights into the ice’s structural behavior and potential risks of damage to maritime vessels or other structures. To facilitate this study, we utilized ice specimens configured with hemispherical extrusion geometry. During the initial stages of collision, the HPZ forms near the hemisphere’s center and expands outward, effectively minimizing the LPZ.
Upon completing the collision tests, the pressure film recordings were carefully cleaned to remove any smudges, scratches, or other data distortions. These films captured the dynamic pressure changes, as presented in Figure 15. Subsequent analyses of these films allowed us to construct spatial pressure-area curves and corresponding pressure maps. It should be noted that due to the limitations of the pressure films, the measurement of pressure time histories was not possible; only the maximal pressure values were visualized. Areas marked in red indicate where the HPZ forms and where the crushing load concentrates, while areas highlighted in green represent the LPZ, characterized by a weaker crushing load. The pressure and force distributions exerted on the plate specimens at collision velocities of 5, 7, and 10 knots are summarized in Table 6.
In summary, both the size of the HPZ and the area over which fractures occur were found to be proportional to the impact velocity, confirming expectations based on previous research.
At a collision velocity of 5 knots, the maximum pressure and force observed were 94 MPa and 36.4 kN, respectively, with an average of 90.3 MPa and 32.4 kN. Similarly, the maximum pressure and force generated at a collision velocity of 7 knots were 98 MPa and 48.1 kN, respectively (average = 95.7 MPa and 44.9 kN), while the maximum pressure and force generated at a collision velocity of 10 knots were 101 MPa and 74.2 kN, respectively (average = 98.3 MPa and 71.4 kN). These data are summarized in Figure 16 and Table 7, which illustrate the average ice collision pressure and force as functions of the collision velocity. Notably, while the maximum and average pressures showed minimal variation with collision velocity, the corresponding reaction forces displayed an increasing trend. This rise in force is attributed to the expansion of the pressure area at higher collision velocities, a phenomenon that occurs when the ice specimen reaches its failure strength and fractures.

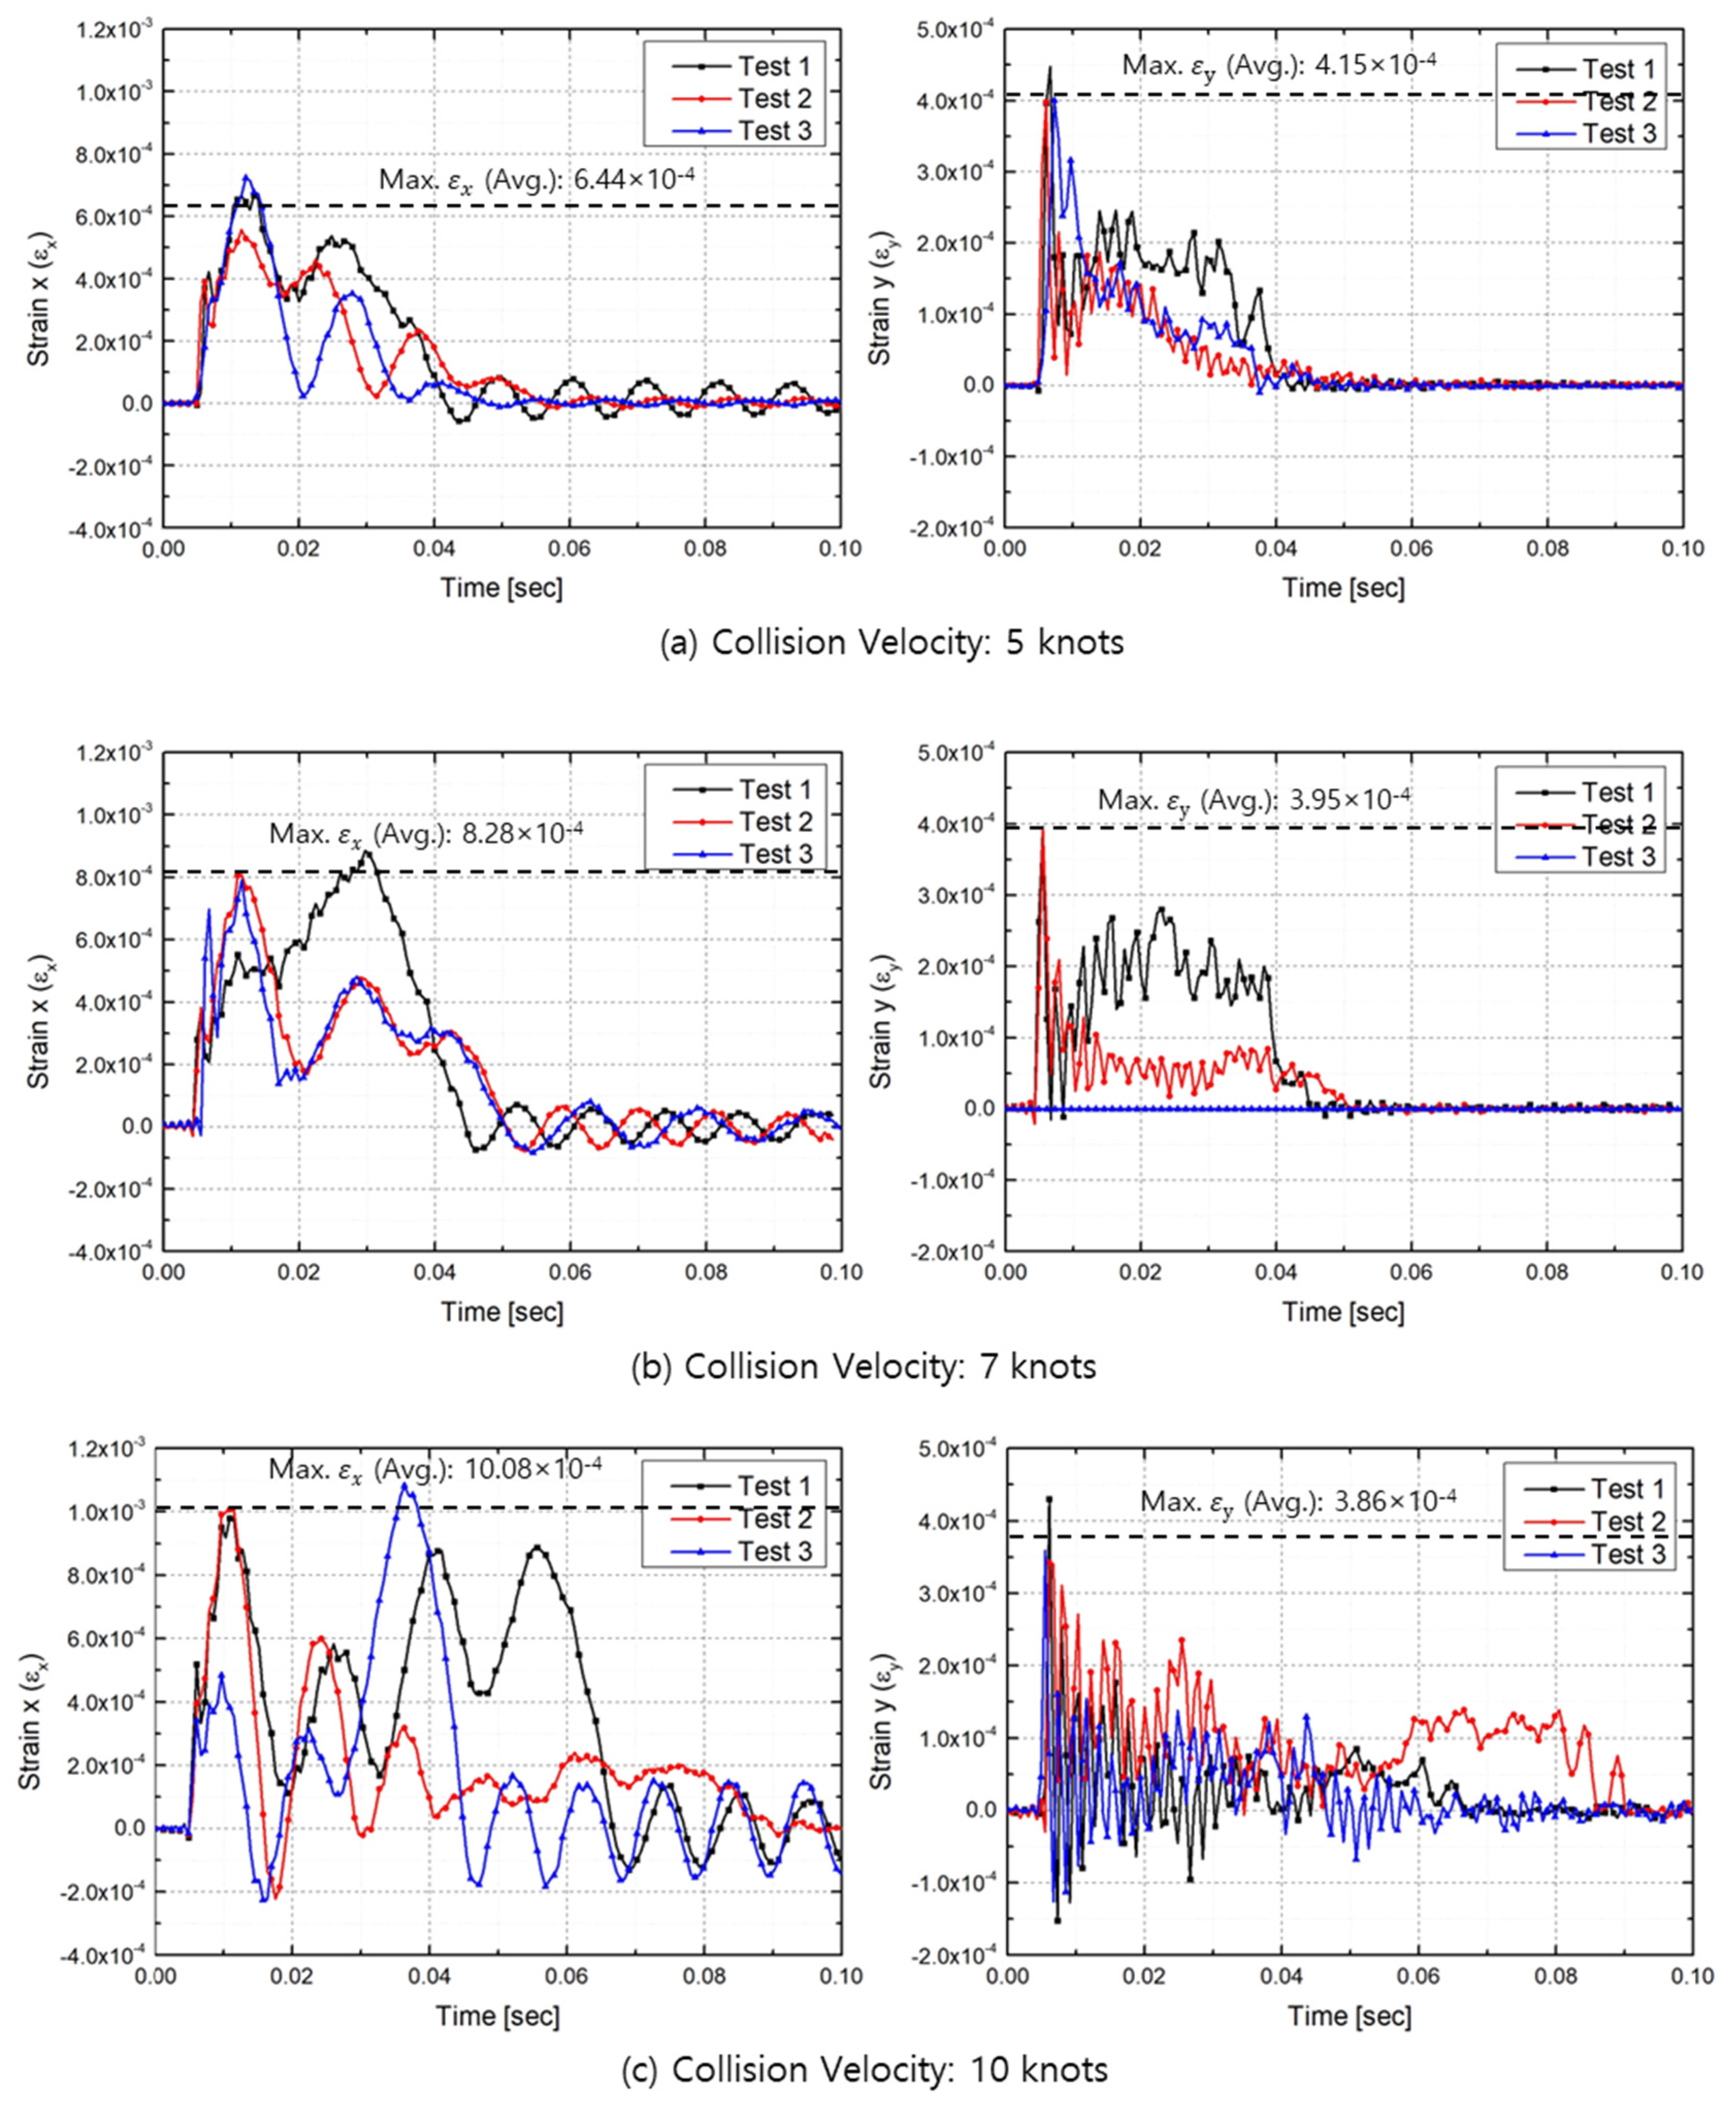
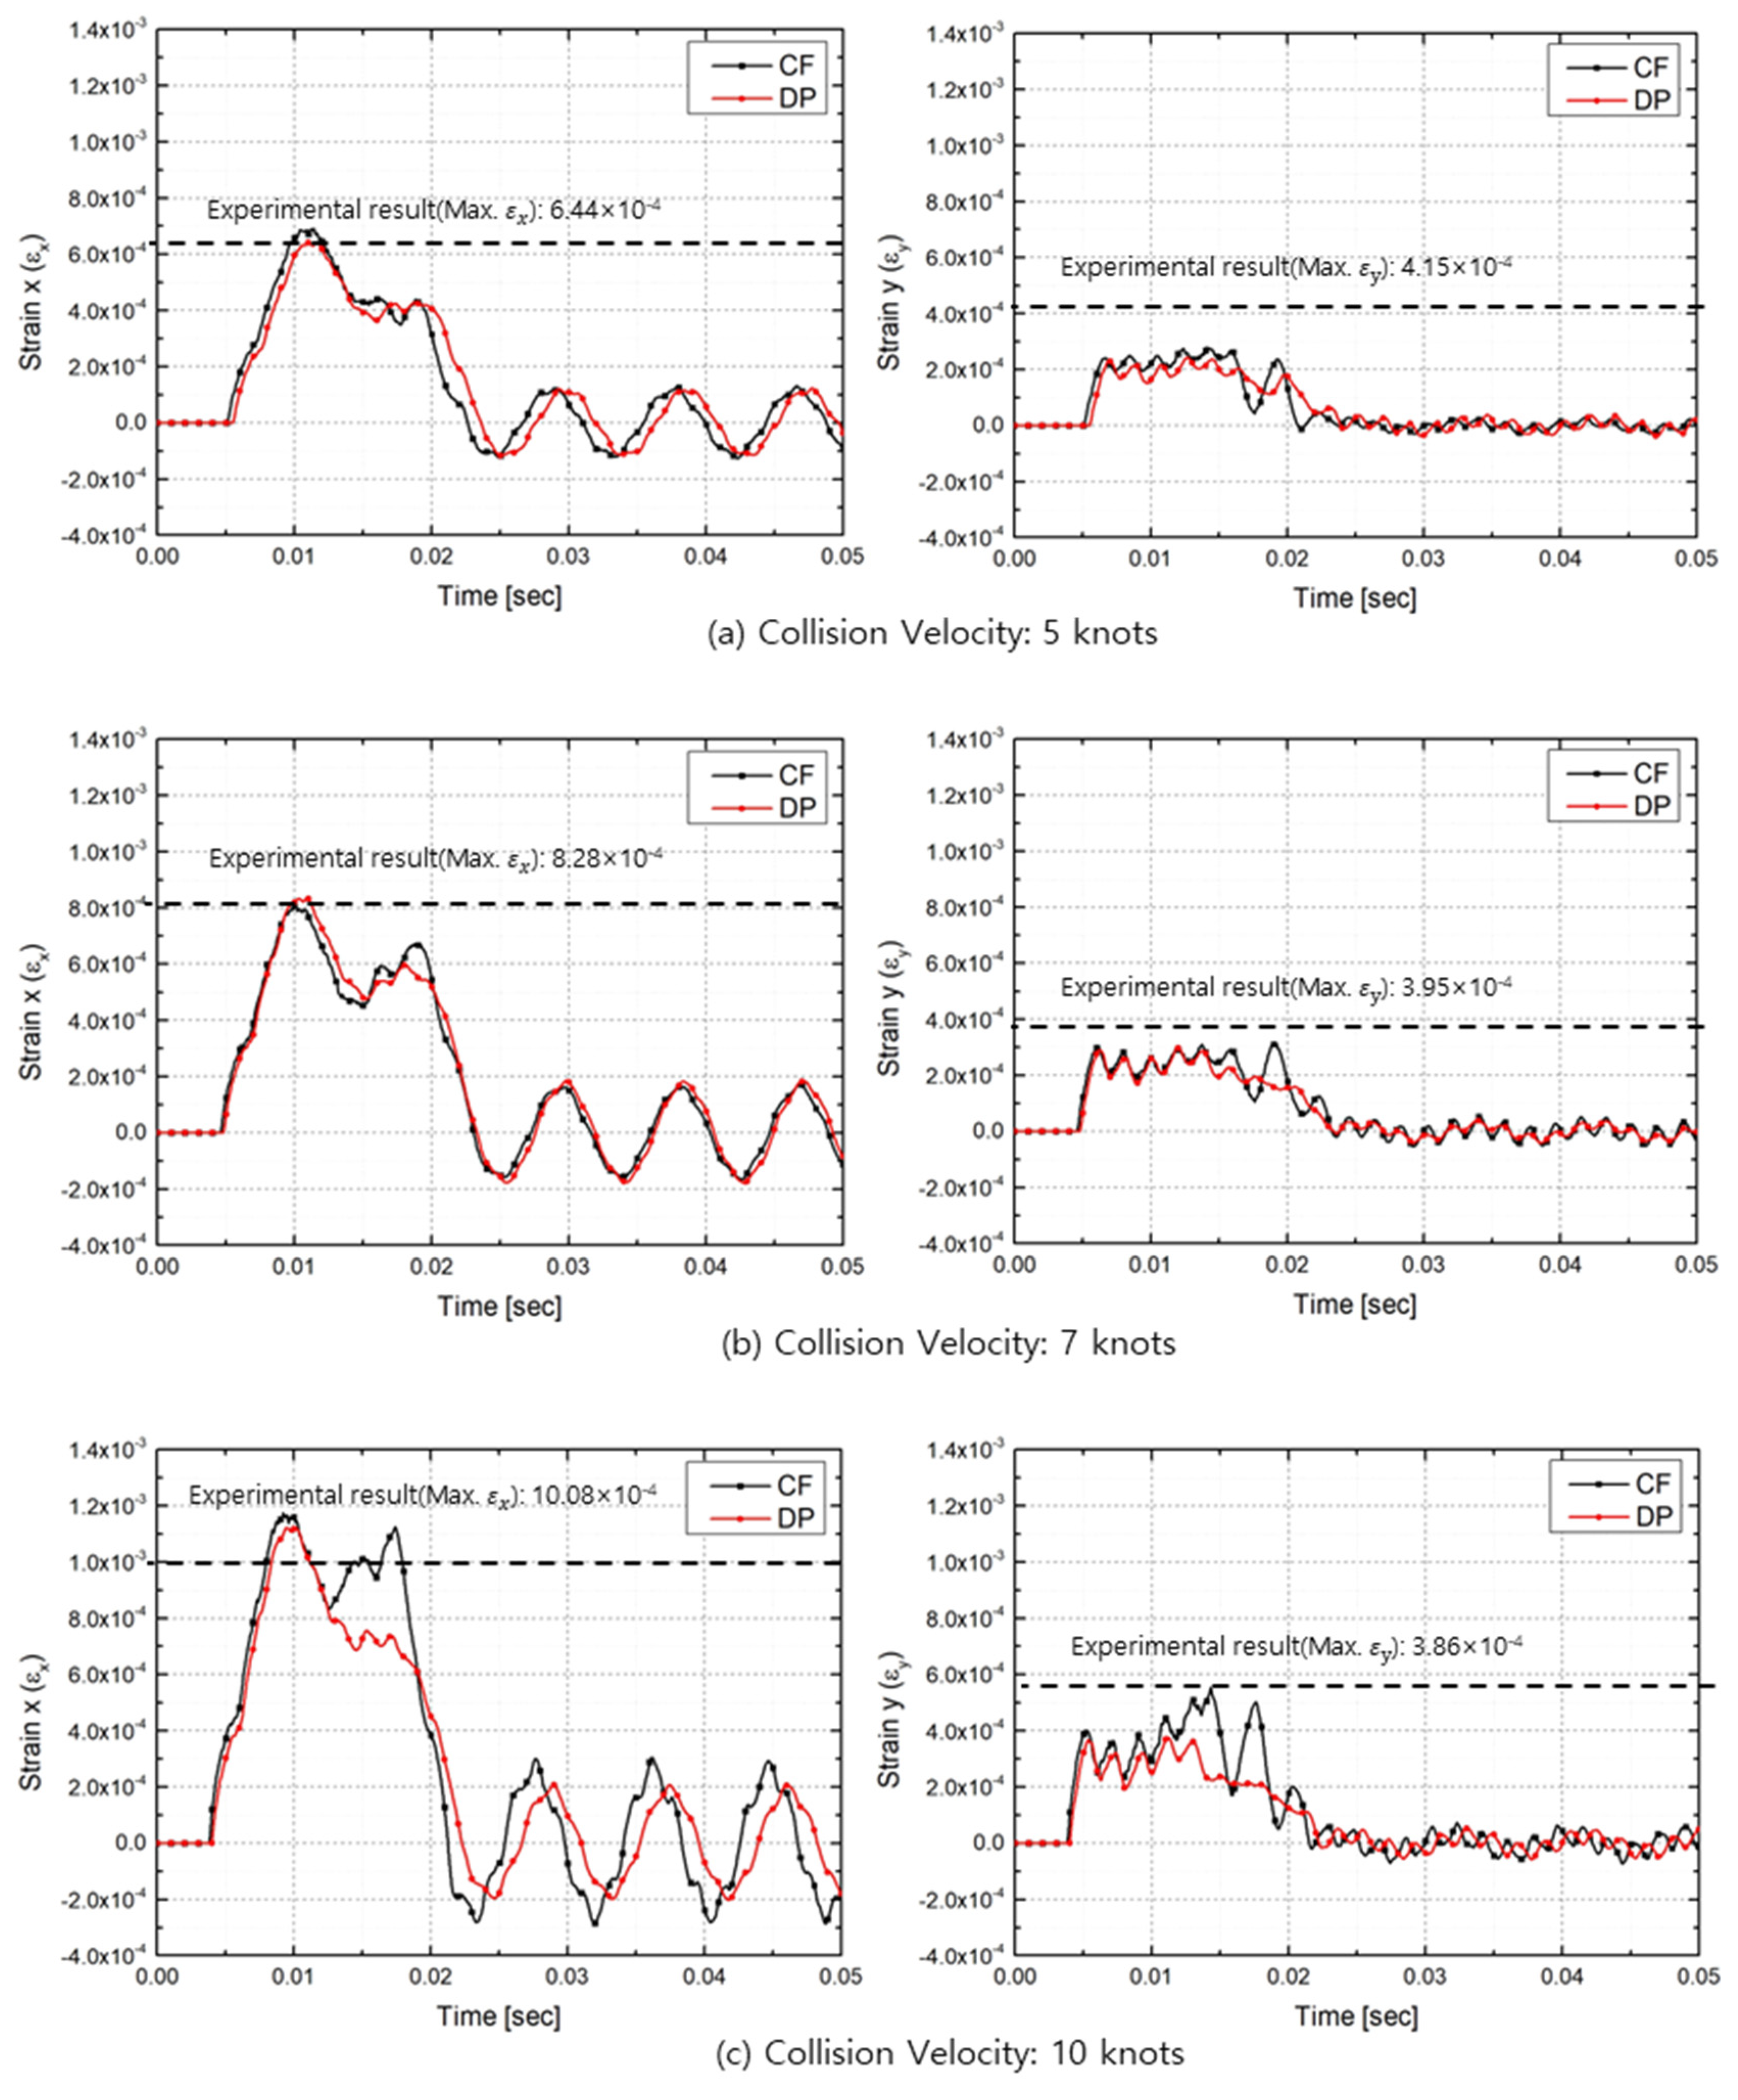
4.4. Strain History of Steel Specimen

The strain was measured on the back-facing side of the steel plate, both in the width ( ε x ) and height ( ε y ) directions. The temporal evolution of the strain is depicted in Figure 17. Both Table 8 and Figure 18 present the maximum strains observed at each collision velocity. With the increasing velocity, the horizontal strain ( ε x ) demonstrated noticeable differences, while the vertical strain ( ε y ) remained relatively constant.
When the collision velocity increased from 5 knots to 10 knots, there was a notable change in the strain behaviors of the steel-plate specimen. Specifically, the horizontal strain ( ε x ) exhibited a 70% increase, whereas the vertical strain ( ε y ) decreased by approximately 10%. This anisotropic behavior can be attributed to the boundary conditions applied to the steel plate during the experiment. While the left and right edges of the plate were clamped, restricting vertical movement, the upper and lower boundaries were left unconstrained, allowing for relatively greater horizontal deformation. Consequently, any numerical model that aims to simulate this experimental setup should incorporate these specific boundary conditions for accurate results.

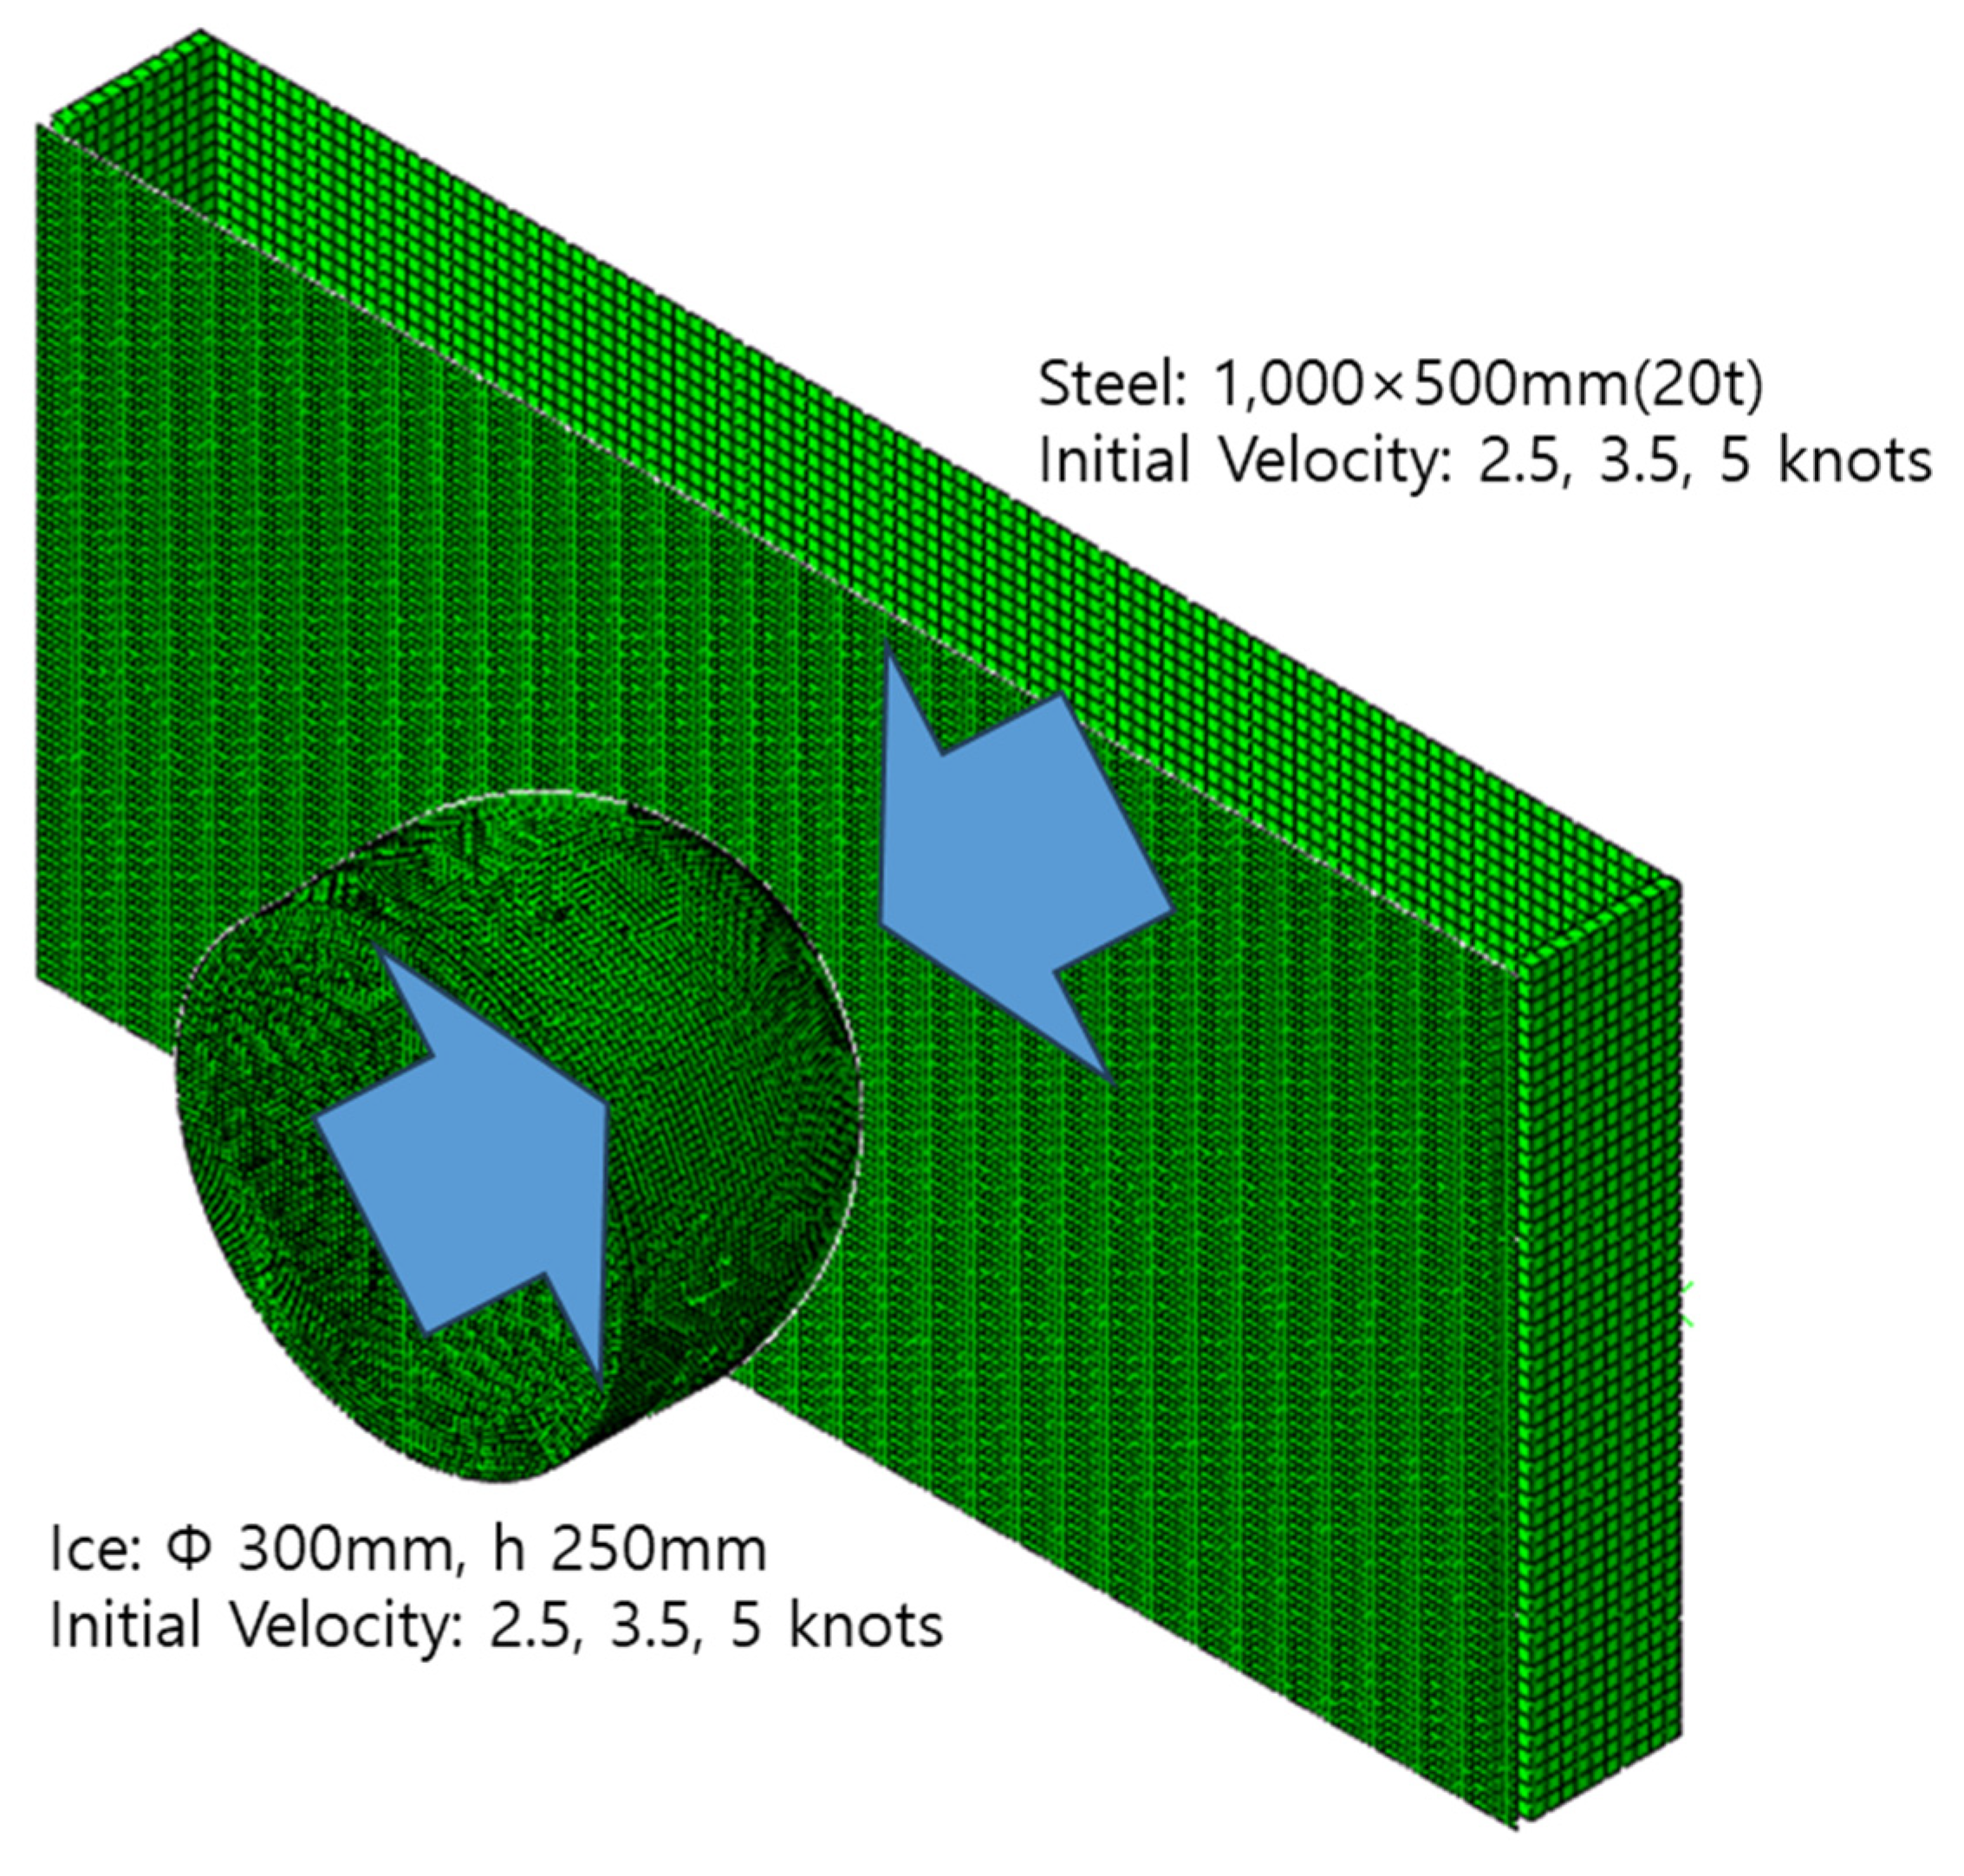
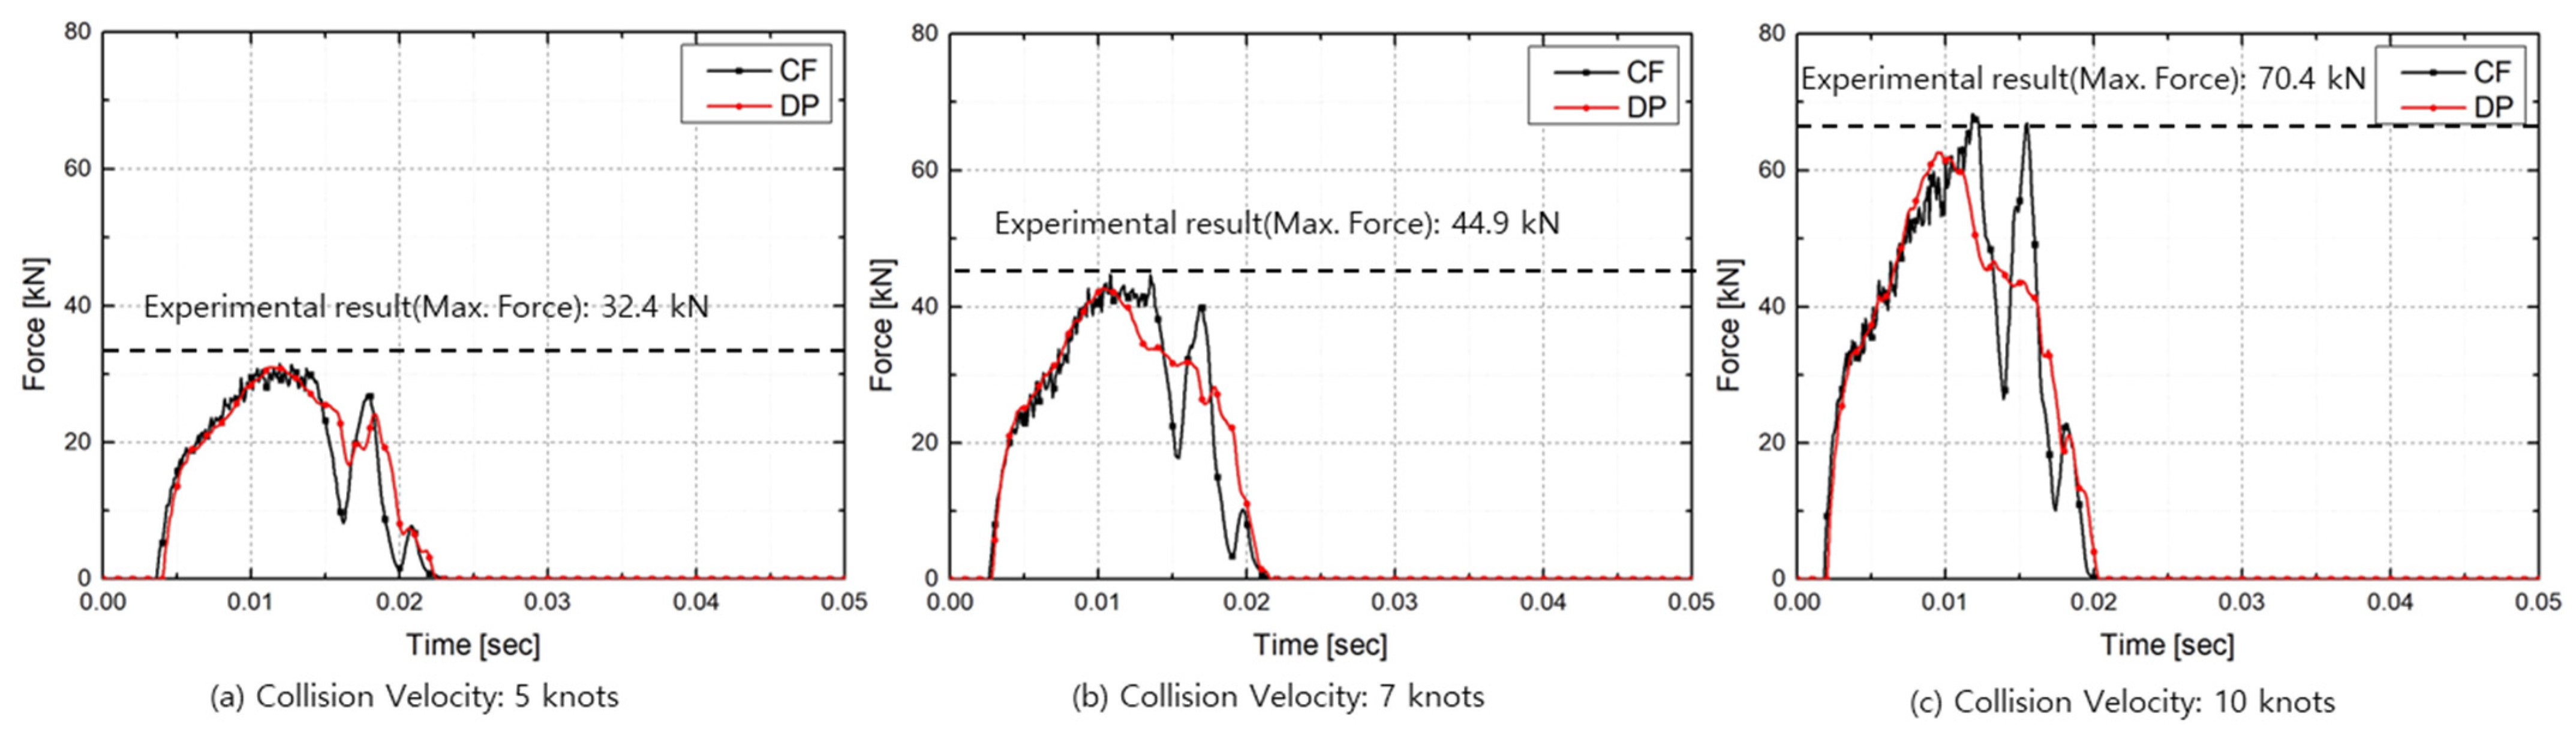
4.5. Simplified Numerical Model to Simulate Experiments

To simulate the ice collision experiments described in the preceding sections, a finite element analysis (FEA) was employed. The primary objective was to compare predicted deformations and collision forces from the numerical model with those obtained experimentally, thereby assessing the model’s accuracy and feasibility. The setup of the finite element model is depicted in Figure 19. ABAQUS’s explicit time integration was employed for capturing transient behavior. Collision forces were calculated for each of the collision velocities used in the experimental setup. The ice specimen was modeled as a hemisphere with dimensions of a 250 mm height ( h ) and a 300 mm diameter ( D ) and was defined using 8-node solid elements (C3D8R). The holder for the ice specimen was represented as a cylinder with a diameter of 300 mm and a height of 25 mm and was treated as a rigid body, precluding any deformation. Tie contact conditions were employed to simulate the interactions between the ice specimen and its holder. The steel-plate specimen, having dimensions of 1000 × 500 mm and a thickness of 20 mm, was meshed using shell (S4R) elements. Contact between the plate specimen and the jig was implemented through tie conditions to enforce fixed motion.
The material properties of ice were assumed based on those used in the literature [28,29,47,48,49,50]. In their studies, the density was found to be between 900 and 920 k g / m 3 , the elastic modulus was about 8 and 9 GPa, and the Poisson’s ratio was between 0.3 and 0.34. Two yield criteria for ice were incorporated, namely the Crushable Foam (CF) model and the Drucker–Prager (DP) model, while two hardening models were adopted. For the Crushable Foam model, the low-stress facet behavior model (M2) of the hardening proposed by Gagnon [47] was applied. The hardening model for the Drucker–Prager model adopted the material constants proposed by Kajaste-Rudnitski and Kujala [48]. It is still necessary to calibrate the material model and material constants for the ice sample used in the FEA and to obtain accurate material properties through experiments. However, given that the material model of ice warrants a dedicated study, this study adopted the material constants available in the existing literature.
Figure 20 presents the strain in the horizontal direction ( ε x ) and vertical direction ( ε y ) of the plate according to the yield model. As found in the experiment, ε x is identified as the primary mode of deformation for the plate, while ε x is observed to be smaller due to the non-fixed boundary condition in the y-direction of the jig. Figure 21 and Table 9 offer a comparison between the maximum strain values for each yield model as a function of collision velocity and the experimental results. When comparing the experimental and analytical outcomes for all collision velocities, the Crushable Foam model shows an average difference of about 8.1%. Conversely, the Drucker–Prager model aligns more closely with the experimental results for all collision velocities, with an average difference of approximately 1.7%. Thus, in terms of the behavior of the structure due to ice collision, the Drucker–Prager model exhibits a higher level of accuracy.
The force histories for different yield models, Crushable Foam (CF) and Drucker–Prager (DP), are presented in Figure 22. A comparison of the maximum calculated forces for different collision velocities with the experimental values is summarized in Table 10 and Figure 23. When comparing the force predicted by the Crushable Foam model with the experimental results, an average difference of approximately 2.6% is observed. In contrast, the Crushable Foam model, compared to the Drucker–Prager model, shows a higher degree of agreement with the experimental results for all collision velocities, displaying an average difference of about 6.8%. This indicates that the Crushable Foam model more closely approximates the experimental outcomes for the investigated parameters.

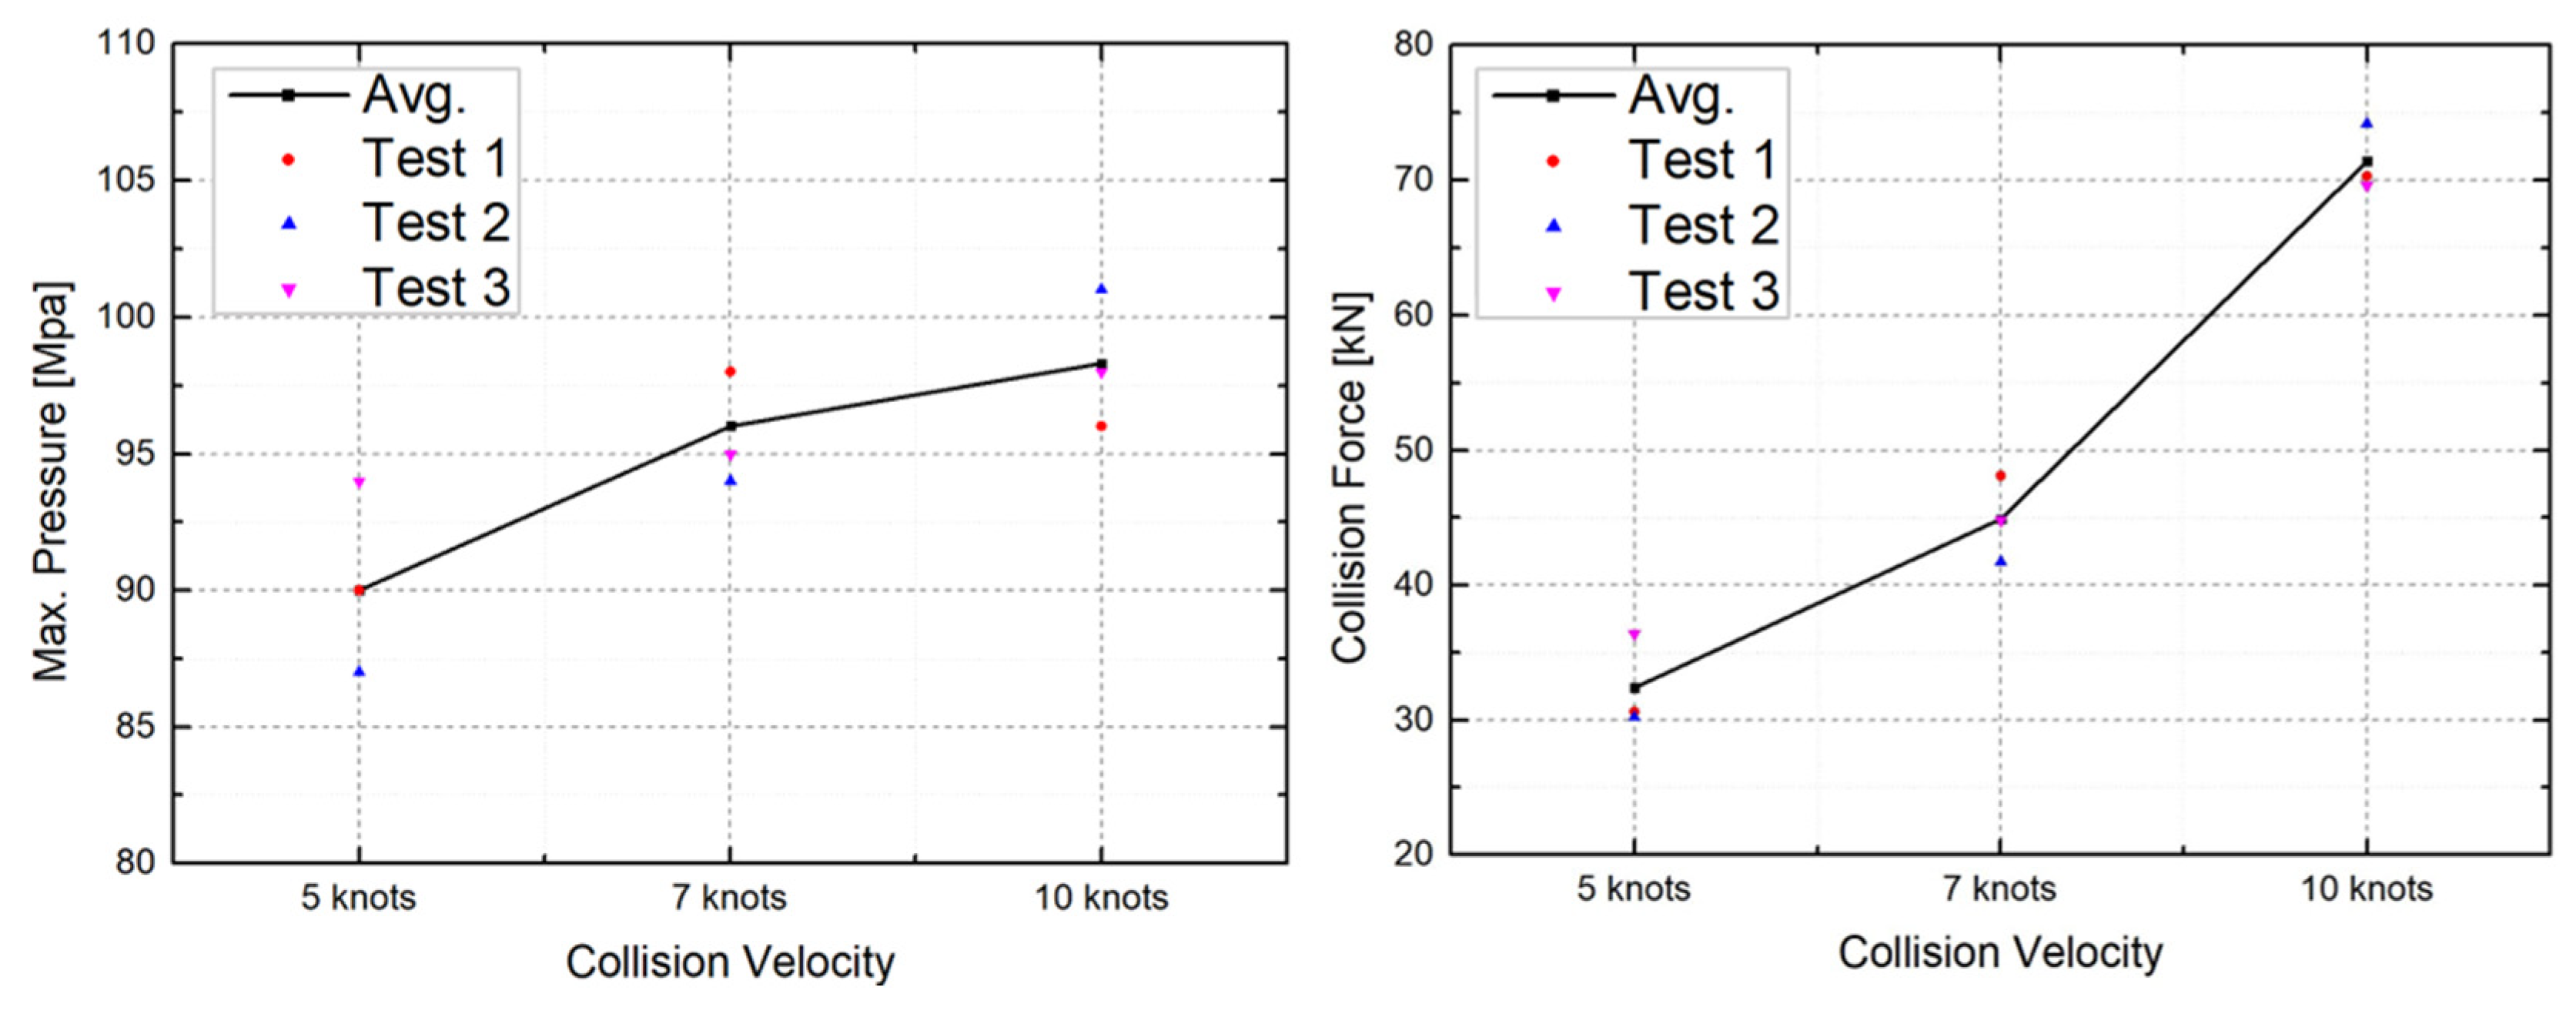
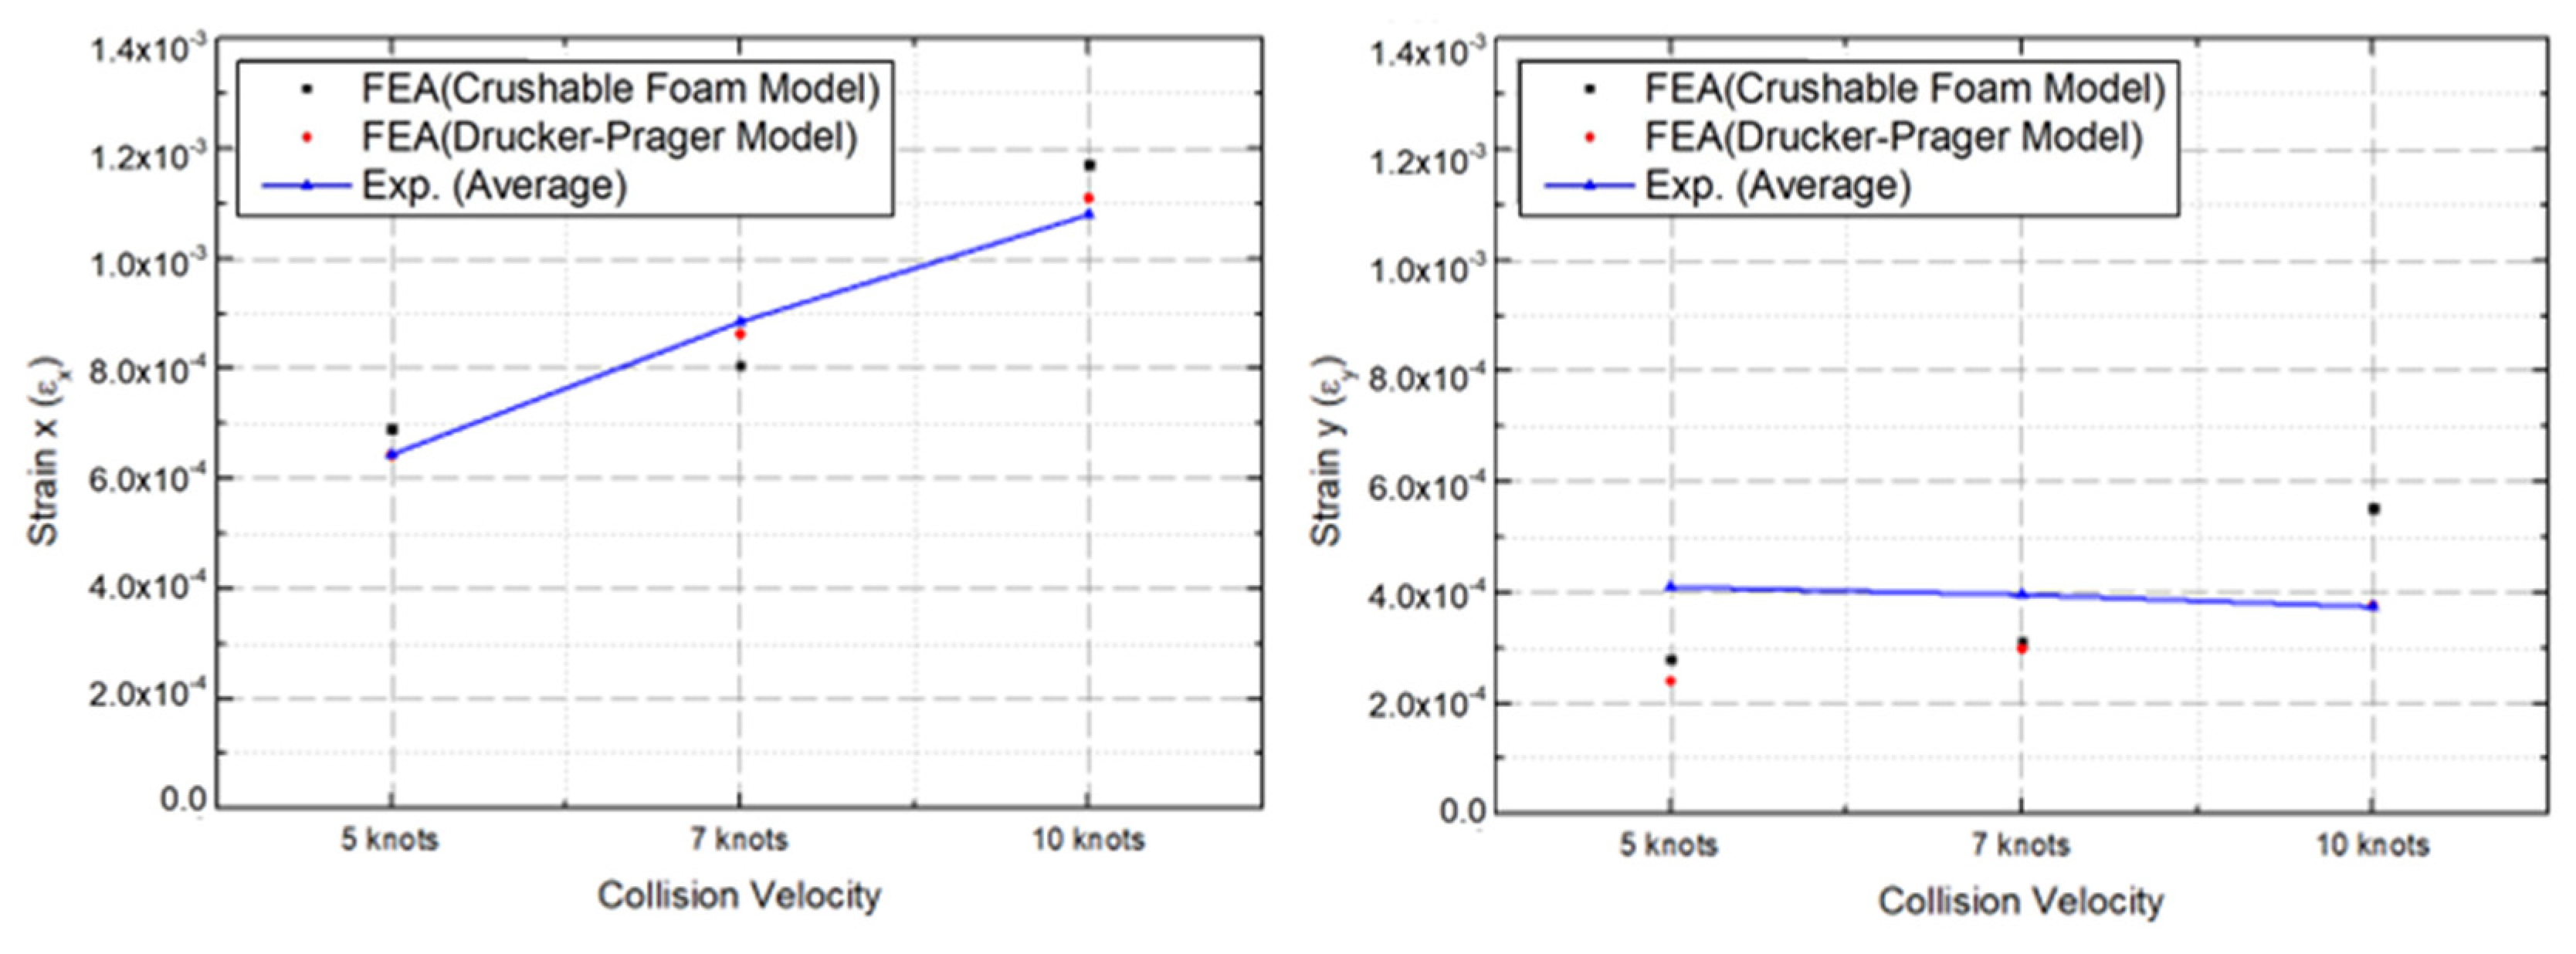
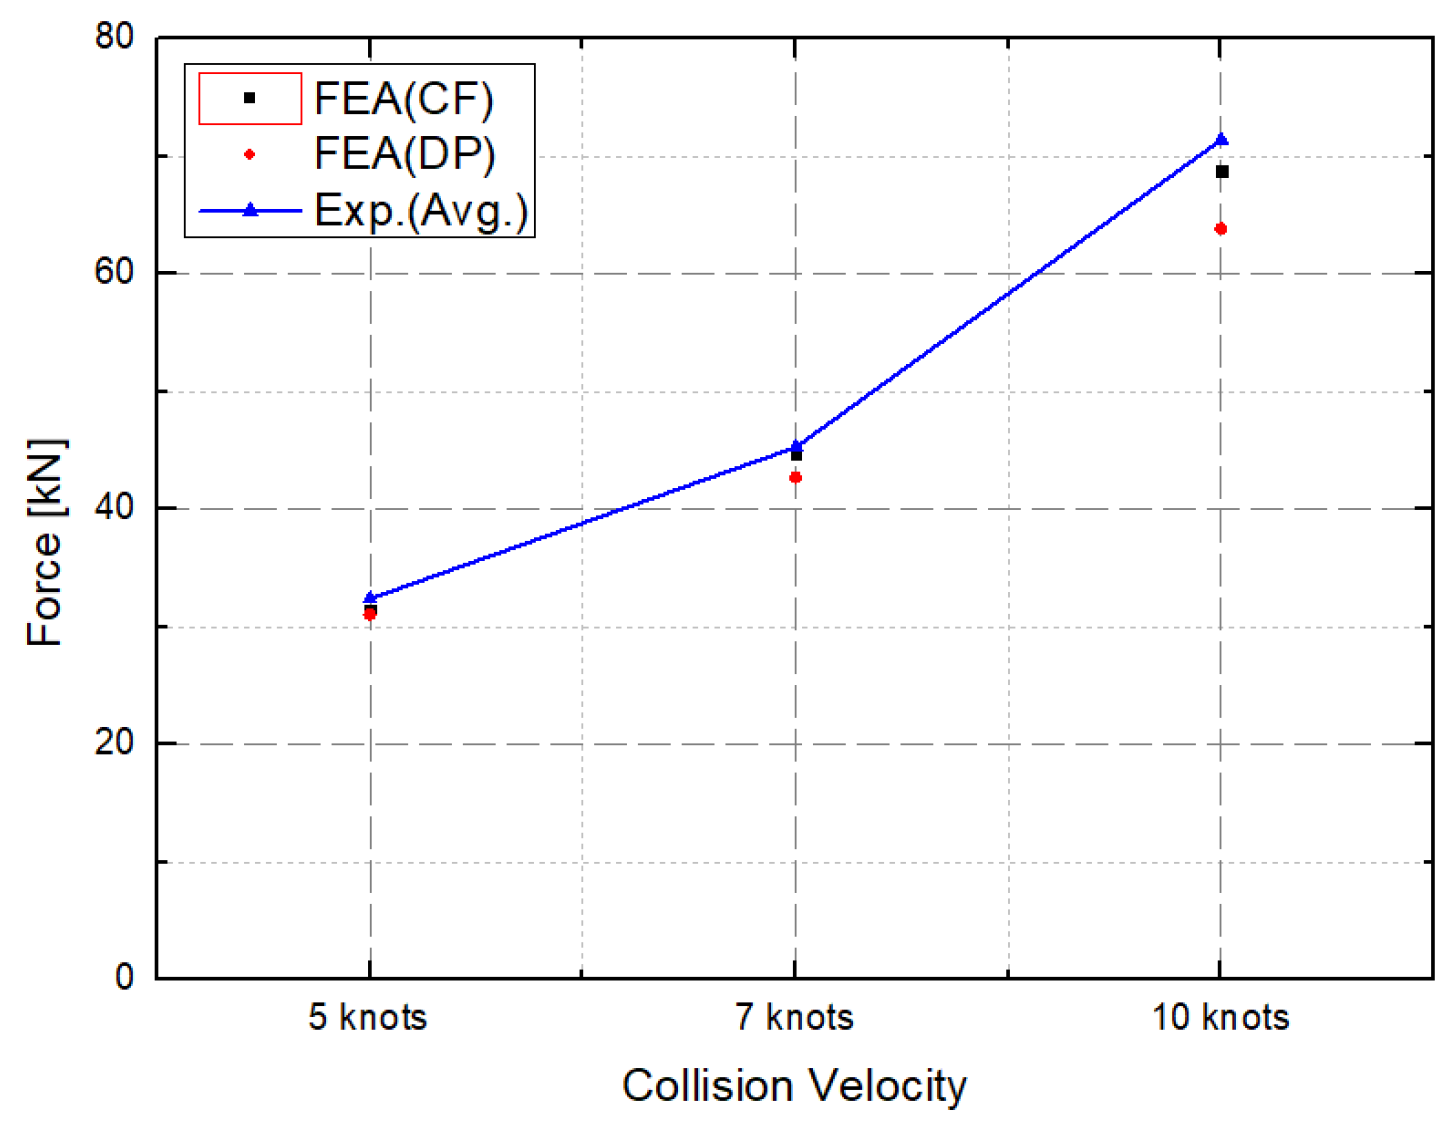
4.6. Analysis of Experimental Results

The collision forces measured in this study were compared with results from other studies [10,11,13,14,15,18,19,20] that employed different methods, such as pendulum collision, trolley collision, and free-drop collision. Figure 24 illustrates the scatter of collision forces according to the collision velocity and collision energy. This provides a comprehensive view of how collision forces vary across different experimental setups and conditions. In Figure 25, the collision velocity, collision force, and collision energy are plotted on a logarithmic scale. This figure further categorizes the data by the type of experimental apparatus used. The different methods are color-coded for clarity, with red markers representing data obtained through pendulum collision, green markers for trolley collision, and blue markers for free-drop collision. This approach facilitates a more nuanced understanding of how collision forces relate to different experimental configurations.
Notably, prior work by Daley [51] and Daley and Kim [52] observed specimen deformation in experiments, using a similar collision-pendulum method. Across the literature, it is generally observed that both the trolley and free-drop collision methods result in higher collision forces compared to the collision-pendulum method. Zhang et al. [53], Daley [51], Daley and Kim [52], and Cai et al. [54] proposed an energy conservation framework wherein the initial energy before a collision is converted into kinetic energy of the colliding bodies and deformation energy in the target. In terms of this energy conservation equation (Equation (1)), the change in kinetic energy for the striker ( K E s t r i k e r ) in unidirectional collision methods such as the trolley and free-drop methods can be expressed as 1 / 2 m s t r i k e r v s t r i k e r 2 . In these cases, since the striking body is considered to be fixed, the energy change is zero, allowing the full transmission of the repulsive force upon collision due to the stationary condition of the specimen. In contrast, for the pendulum-collision method, the change in kinetic energy for both colliding bodies is 1 / 2 m s t e e l v s t e e l 2 + 1 / 2 m i c e v i c e 2 . In this situation, when both specimens collide, the collision reaction force tends to be attenuated compared to scenarios where the specimen is fixed, due to the distribution of energy between both colliding bodies.
K E = E i c e   b r e a k + E s t e e l   s t r a i n + K E i c e + K E s t e e l
In summary, the relationship between the collision force and collision energy depends on how the collision occurs. When focusing on the speed at which the collision occurs, it is hard to accurately predict the force that will result. However, when the collision force is evaluated based on the involved energy, more meaningful data can be obtained. The bidirectional collision method yielded force results that align more closely with the expected outcomes, particularly when compared to unidirectional collision methods where one object is stationary. As a result, the collision force of the pendulum-collision test conducted in this study seems to be reasonable when compared to the those of other studies.

5. Conclusions

This study introduced a pendulum-based experimental setup to investigate collisions between structures and ice. The chosen collision method serves as a foundational step for understanding ice collision phenomena and interactions between ice and structures. Experiments were conducted at various collision velocities, taking measurements of the environmental temperature, collision velocity, strain in the steel plate specimens, and distribution of ice collision pressure. The experimental results were analyzed based on the strain and pressure distribution in the steel plates at different collision velocities. Comparisons with previous studies enabled an evaluation of the relationship between collision energy and force. It was observed that the collision force increased in proportion to collision energy when plotted on a logarithmic scale. Moreover, when comparing collision forces with those reported in previous research, the force trends were almost identical for the same collision method. This aligns the findings of this study closely with those of the existing literature, particularly in the realm of bidirectional collision experiments.
However, several factors still require further investigation, including the thickness and stiffness of the steel plate, as well as the material properties of ice and their influence on collision forces. Additionally, this study utilized the explicit finite element analysis to calculate impact force and strain, comparing the results with experimental findings. Although the finite element analysis effectively simulated the experimental conditions, the appropriateness of the different plasticity and fracture models specific to ice needs to be studied. Future study will focus on developing a refined numerical model that is capable of simulating the ice impact tests conducted in this study. Given the limitations of the experimental design, advanced numerical techniques are essential for estimating collision forces beyond what can be empirically verified. Subsequent studies will aim to identify the most suitable material constitutive model for ice by incorporating various models discussed in the existing literature.

Author Contributions

J.H.L. suggested the concept of ice-collision-pendulum apparatus; S.-Y.H. analyzed the data and suggested an experiment procedure; H.-S.J. and S.-Y.H. manufactured an ice specimen and performed an ice compression test; H.-S.J. performed an ice–steel collision test; H.-S.J. and J.H.L. wrote the paper. All authors have read and agreed to the published version of the manuscript.

Funding

This research was funded by INHA Research Grant.

Institutional Review Board Statement

Not applicable.

Informed Consent Statement

Not applicable.

Data Availability Statement

Not applicable.

Acknowledgments

This research was supported by INHA Research Grant.

Conflicts of Interest

The authors declare no conflict of interest.

References

  1. FSICR. Ice Class Regulations 2010: Finnish-Swedish Ice Class Rules 2010; Finnish Transport Safety Agency: Helsinki, Finland, 2010; p. 48. [Google Scholar]
  2. Hill, B.T. Ship collision with iceberg database. In Proceedings of the 7th International Conference and Exhibition on Performance of Ships and Structures in Ice, Banff, AB, Canada, 16–19 July 2006; pp. 16–19. [Google Scholar]
  3. Kärnä, T.; Kamesaki, K.; Tsukuda, H. A numerical model for dynamic ice-structure interaction. Comput. Struct. 1999, 72, 645–658. [Google Scholar] [CrossRef]
  4. Leira, B.; Børsheim, L.; Espeland, O.; Amdahl, J. Ice-Load Estimation for a Ship Hull Based on Continuous Response Monitoring. J. Eng. Marit. Environ. 2009, 223, 529–540. [Google Scholar] [CrossRef]
  5. Suyuthi, A.; Leira, B.J.; Riska, K. Fatigue damage of ship hulls due to local ice-induced stresses. Appl. Ocean. Res. 2013, 42, 87–104. [Google Scholar] [CrossRef]
  6. Suyuthi, A.; Leira, B.J.; Riska, K. Statistics of local ice load peaks on ship hulls. Struct. Saf. 2013, 40, 1–10. [Google Scholar] [CrossRef]
  7. Suominen, M.; Li, F.; Lu, L.; Kujala, P.; Bekker, A.; Lehtiranta, J. Effect of maneuvering on ice-induced loading on ship hull: Dedicated full-scale tests in the Baltic Sea. J. Mar. Sci. Eng. 2020, 8, 759. [Google Scholar] [CrossRef]
  8. Hu, J.; Zhou, L. Experimental and numerical study on ice resistance for icebreaking vessels. Int. J. Nav. Arch. Ocean. Eng. 2015, 7, 626–639. [Google Scholar] [CrossRef]
  9. Zhou, L.; Chuang, Z.; Ji, C. Ice forces acting on towed ship in level ice with straight drift. Part I: Analysis of model test data. Int. J. Nav. Archit. Ocean. Eng. 2018, 10, 60–68. [Google Scholar] [CrossRef]
  10. Choi, Y.H.; Choi, H.Y.; Lee, C.S.; Kim, M.H.; Lee, J.M. Suggestion of a design load equation for ice-ship impacts. Int. J. Nav. Arch. Ocean. 2012, 4, 386–402. [Google Scholar] [CrossRef]
  11. Yu, T.Q.; Wang, J.X.; Liu, J.J.; Liu, K. Experimental and Numerical Simulation of the Dynamic Response of a Stiffened Panel Suffering the Impact of an Ice Indenter. Metals 2022, 12, 505. [Google Scholar] [CrossRef]
  12. Quinton, B.W. Progressive Damage to a Ship’s Structure Due to Ice Loading. Ph.D. Thesis, Memorial University of Newfoundland, St. John’s, NL, Canada, 2008. [Google Scholar]
  13. Zhu, L.; Qiu, X.; Chen, M.; Yu, T.X. Simplified ship-ice collision numerical simulations. In Proceedings of the ISOPE International Ocean and Polar Engineering Conference, Rhodes, Greece, 26 June–1 July 2016. [Google Scholar]
  14. Zhu, L.; Cai, W.; Chen, M.; Tian, Y.; Bi, L. Experimental and numerical analyses of elastic-plastic responses of ship plates under ice floe impacts. Ocean. Eng. 2020, 218, 108174. [Google Scholar] [CrossRef]
  15. Cai, W.; Zhu, L.; Yu, T.X.; Li, Y.G. Numerical simulations for plates under ice impact based on a concrete constitutive ice model. Int. J. Impact Eng. 2020, 143, 103594. [Google Scholar] [CrossRef]
  16. Glen, I.; Comfort, G. Ice Impact Pressure and Load: Investigation by Laboratory Experiments and Ship Trials. In Proceedings of the Seventh International Conference on Port and Ocean Engineering Under Arctic Conditions, Helsinki, Finland, 5–9 April 1983. [Google Scholar]
  17. Gagnon, R.; Daley, C.; Colbourne, B. A large double-pendulum device to study load, pressure distribution and structure damage during ice impact tests in the lab. In Proceedings of the International Conference on Port and Ocean Engineering Under Arctic Conditions, Trondheim, Norway, 14–18 June 2015. [Google Scholar]
  18. Gagnon, R.; Andrade, S.; Quinton, B.; Daley, C.; Colbourne, B. Pressure distribution data from large double-pendulum ice impact tests. Cold Reg. Sci. Technol. 2020, 175, 103033. [Google Scholar] [CrossRef]
  19. Clarke, G.S. Ice Collision Experiments with a Pendulum Impact Apparatus. Ph.D. Thesis, Memorial University of Newfoundland, St. John’s, NL, Canada, 2012. [Google Scholar]
  20. Lande Andrade, S.; Elruby, A.Y.; Hipditch, E.; Daley, C.G.; Quinton, B.W. Full-scale ship-structure ice impact laboratory experiments: Experimental apparatus and initial results. Ships Offshore Struct. 2023, 18, 500–514. [Google Scholar] [CrossRef]
  21. Zhang, M. Ice Load Prediction for Design of Ice-Going Ships for Inland Waterways. Ph.D. Thesis, KTH Royal Institute of Technology, Stockholm, Sweden, 2019. [Google Scholar]
  22. Zhang, N.; Zheng, X.; Ma, Q. Updated smoothed particle hydrodynamics for simulating bending and compression failure progress of ice. Water 2017, 9, 882. [Google Scholar] [CrossRef]
  23. Gao, Y.; Hu, Z.; Wang, J. Sensitivity analysis for iceberg geometry shape in ship-iceberg collision in view of different material models. Math. Probl. Eng. 2014, 2014, 414362. [Google Scholar] [CrossRef]
  24. Kubat, I.; Timco, G. Vessel damage in the Canadian Arctic. In Proceedings of the International Conference on Port and Ocean Engineering Under Arctic Conditions, Trondheim, Norway, 16–19 June 2003. [Google Scholar]
  25. Zhou, L.; Gao, J.; Li, D. An engineering method for simulating dynamic interaction of moored ship with first-year ice ridge. Ocean. Eng. 2019, 171, 417–428. [Google Scholar] [CrossRef]
  26. Arakawa, M.; Maeno, N.; Higa, M.; Iijima, Y.-I.; Kato, M. Ejection velocity of ice impact fragments. Icarus 1995, 118, 341–354. [Google Scholar] [CrossRef]
  27. Kim, H.; Welch, D.A.; Kedward, K.T. Experimental investigation of high velocity ice impacts on woven carbon/epoxy composite panels. Compos. Part. A Appl. Sci. Manuf. 2003, 34, 25–41. [Google Scholar] [CrossRef]
  28. Tippmann, J.D. Development of a Strain Rate Sensitive Ice Material Model for Hail Ice Impact Simulation; University of California: San Diego, CA, USA, 2011. [Google Scholar]
  29. Tippmann, J.D.; Kim, H.; Rhymer, J.D. Experimentally validated strain rate dependent material model for spherical ice impact simulation. Int. J. Impact Eng. 2013, 57, 43–54. [Google Scholar] [CrossRef]
  30. Combescure, A.; Chuzel-Marmot, Y.; Fabis, J. Experimental study of high-velocity impact and fracture of ice. Int. J. Solids Struct. 2011, 48, 2779–2790. [Google Scholar]
  31. Chai, W.; Leira, B.J.; Høyland, K.V.; Sinsabvarodom, C.; Yu, Z. Statistics of thickness and strength of first-year ice along the Northern Sea Route. J. Mar. Sci. Technol. 2021, 26, 331–343. [Google Scholar] [CrossRef]
  32. Kim, S.-Y.; Choi, K. Standardization of laboratory experimental techniques with a cold room in Korea. In Proceedings of the 18th IAHR International Symposium on Ice, Sapporo, Japan, 28 August–1 September 2006. [Google Scholar]
  33. Kim, J.-H.; Choi, K.-S.; Seo, Y.-K. Standardization of Ice Mechanics Experimental Procedures in a Cold Room. J. Ocean. Eng. Technol. 2007, 21, 60–66. [Google Scholar]
  34. Kim, J.-H.; Choi, K.-S. Comparison of EG/AD/S and EG/AD model ice properties. Int. J. Ocean. Syst. Eng. 2011, 1, 32–36. [Google Scholar] [CrossRef]
  35. Kim, H.; Daley, C.; Colbourne, B. Comparison of Ice Load Development on Non-Planar Surface. Int. J. Offshore Polar Eng. 2015, 25, 194–204. [Google Scholar] [CrossRef]
  36. Choi, K.; Kim, J.; Seo, Y. An experiment for the mechanical properties of model ice grown in a cold room. In Proceedings of the 19th IAHR Ice Symposium, Vancouver, BC, Canada, 6–11 July 2008; pp. 985–992. [Google Scholar]
  37. Cho, S.-R.; Jeong, S.-Y.; Ha, J.-S.; Kang, K.-J. An experimental study on generation and measurement method of EG/AD model ice at cold room for improvement of its properties. J. Soc. Nav. Archit. Korea 2013, 50, 414–420. [Google Scholar] [CrossRef]
  38. Bruneau, S.E.; Dillenburg, A.K.; Ritter, S. Ice sample production techniques and indentation tests for laboratory experiments simulating ship collisions with ice. In Proceedings of the ISOPE International Ocean and Polar Engineering Conference, Anchorage, AK, USA, 30 June–5 July 2013. [Google Scholar]
  39. Do, Y.; Kim, Y. Basic Experimental Study for Ice-Concrete Friction Behavior. J. Soc. Nav. Archit. Korea 2020, 57, 365–372. [Google Scholar] [CrossRef]
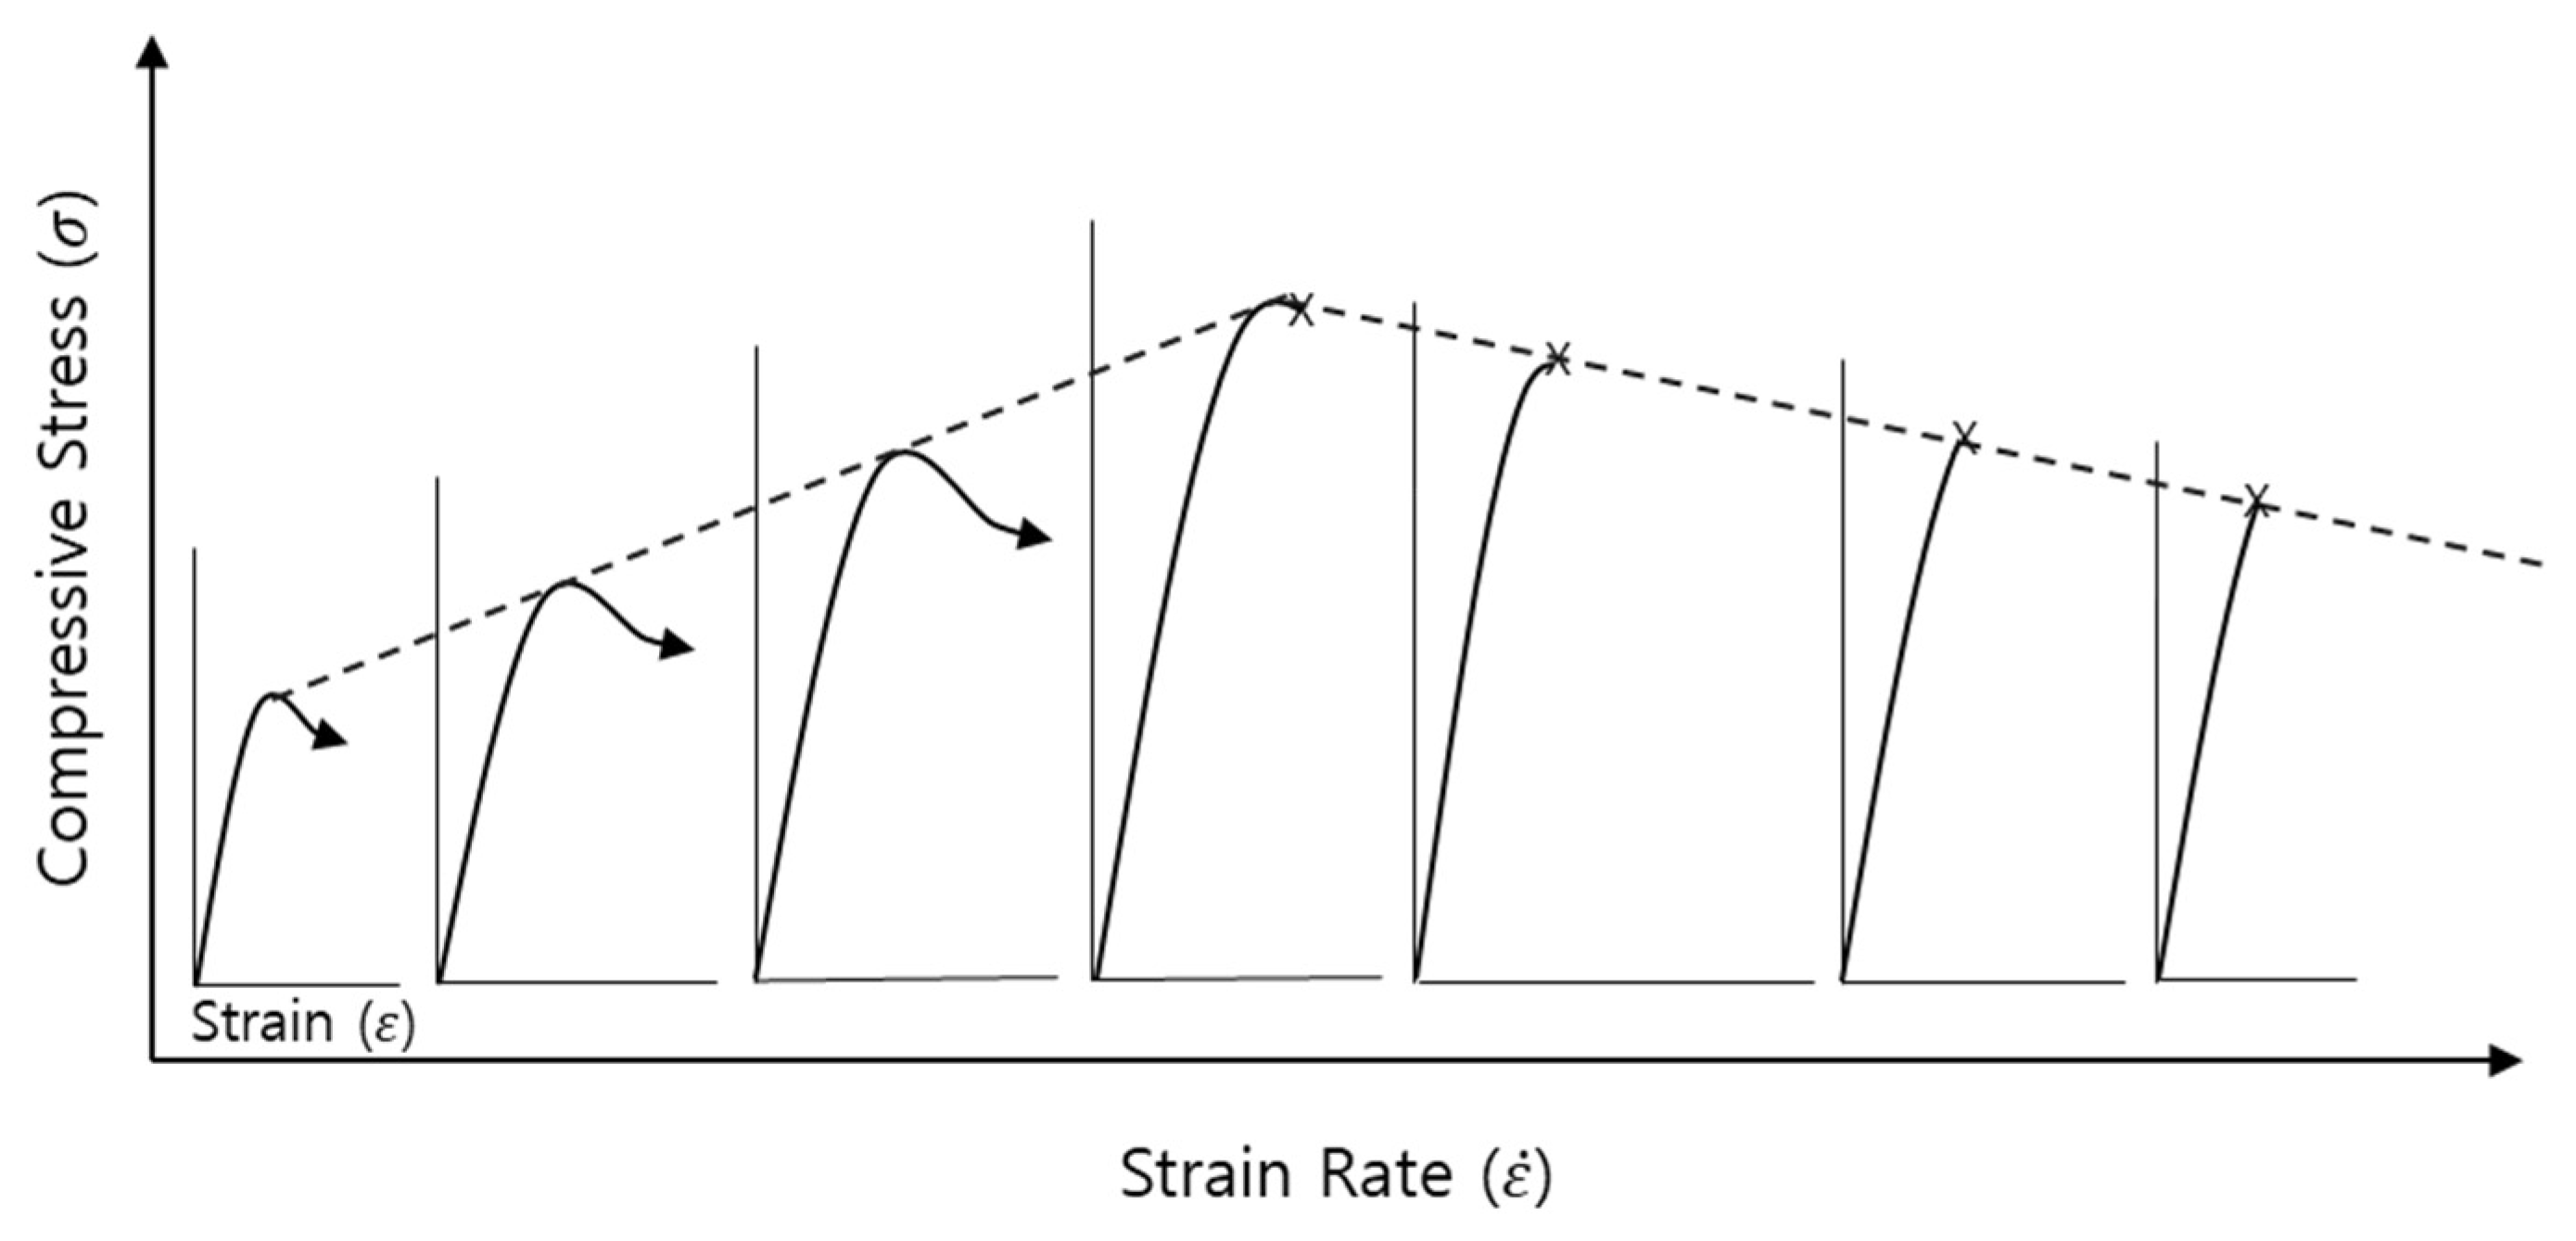
  40. Batto, R.A.; Schulson, E.M. On the Ductile-to-Brittle Transition in Ice under Compression. Acta Met. Mater. 1993, 41, 2219–2225. [Google Scholar] [CrossRef]
  41. Schulson, E.M. Brittle failure of ice. Eng. Fract. Mech. 2001, 68, 1839–1887. [Google Scholar] [CrossRef]
  42. Carney, K.S.; Benson, D.J.; DuBois, P.; Lee, R. A phenomenological high strain rate model with failure for ice. Int. J. Solids Struct. 2006, 43, 7820–7839. [Google Scholar] [CrossRef]
  43. Kim, H.; Daley, C. Characteristics of ice crushing pressure on non-planar surface. In Proceedings of the SNAME Maritime Convention, Bellevue, WA, USA, 6–8 November 2013. [Google Scholar] [CrossRef]
  44. Kim, H.; Daley, C.; Colbourne, B. A numerical model for ice crushing on concave surfaces. Ocean. Eng. 2015, 106, 289–297. [Google Scholar] [CrossRef]
  45. Kim, H.; Quinton, B. Evaluation of moving ice loads on an elastic plate. Mar. Struct. 2016, 50, 127–142. [Google Scholar] [CrossRef]
  46. Wells, J.; Jordaan, I.; Derradji-Aouat, A.; Taylor, R. Small-scale laboratory experiments on the indentation failure of polycrystalline ice in compression: Main results and pressure distribution. Cold Reg. Sci. Technol. 2011, 65, 314–325. [Google Scholar] [CrossRef]
  47. Gagnon, R.E. A numerical model of ice crushing using a foam analogue. Cold Reg. Sci. Technol. 2011, 65, 335–350. [Google Scholar] [CrossRef]
  48. Kajaste-Rudnitski, J.; Kujala, P. Ship propagation through ice field. J. Struct. Mech. 2014, 47, 34–49. [Google Scholar]
  49. Han, D.; Lee, H.; Choung, J.; Kim, H.; Daley, C. Cone ice crushing tests and simulations associated with various yield and fracture criteria. Ships Offshore Struc. 2017, 12, S88–S99. [Google Scholar] [CrossRef]
  50. Kim, H. Simulation of compressive ‘cone-shaped’ ice specimen experiments using LS-DYNA. In Proceedings of the 13th International LS-DYNA Users Conference, Dearborn, MI, USA, 8–10 June 2014. [Google Scholar]
  51. Daley, C. Energy based ice collision forces. In Proceedings of the Proceedings of the 15th International Conference on Port and Ocean Engineering under Arctic Conditions (POAC), Espoo, Finland, 23–27 August 1999; pp. 674–686. [Google Scholar]
  52. Daley, C.; Kim, H. Ice collision forces considering structural deformation. In Proceedings of the International Conference on Offshore Mechanics and Arctic Engineering, Nantes, France, 16–17 February 2010; pp. 817–825. [Google Scholar]
  53. Zhang, M.; Garme, K.; Burman, M.; Zhou, L. A numerical ice load prediction model based on ice-hull collision mechanism. Appl. Sci. 2020, 10, 692. [Google Scholar] [CrossRef]
  54. Cai, W.; Zhu, L.; Gudmestad, O.T.; Guo, K.L. Application of rigid-plastic theory method in ship-ice collision. Ocean. Eng. 2022, 253, 111237. [Google Scholar] [CrossRef]
Figure 1. Categorization of ice based on age and type.
Jmse 11 01761 g001
Figure 2. Assembled ice collision pendulums in a low-temperature chamber.
Jmse 11 01761 g002
Figure 3. Assembled steel-plate specimen with pendulum.
Jmse 11 01761 g003
Figure 6. Experimental setup for temperature and strain measurement.
Jmse 11 01761 g006
Figure 7. Appearance of the manufactured ice specimens.
Jmse 11 01761 g007
Figure 8. Rotating machine used to shape the ice specimens.
Jmse 11 01761 g008
Figure 9. Fractured surface of an ice specimen after compression testing.
Jmse 11 01761 g009
Figure 10. Relationship between the reaction force and displacement in compression testing.
Jmse 11 01761 g010
Figure 11. Modes of failure in ice as a function of the strain rate.
Jmse 11 01761 g011
Figure 12. Relative velocity between the ice and steel specimens.
Jmse 11 01761 g012
Figure 13. High-speed-camera images of the collision process.
Jmse 11 01761 g013
Figure 14. Fractures in the ice specimens after collision testing.
Jmse 11 01761 g014
Figure 15. Pressure distribution exerted by ice collisions on steel-plate specimens.
Jmse 11 01761 g015
Figure 16. Relationship between the collision velocities and exerted forces on the steel plate.
Jmse 11 01761 g016
Figure 17. Temporal evolution of strain in the steel specimen, as measured in horizontal ( ε x ) and vertical ( ε y ) directions.
Jmse 11 01761 g017
Figure 18. Maximum value of ε x and ε y at different collision velocities.
Jmse 11 01761 g018
Figure 19. Schematic configuration of finite element model.
Jmse 11 01761 g019
Figure 20. Temporal variation of ε x and ε y under different yield criteria.
Jmse 11 01761 g020
Figure 21. Variation in maximum values of ε x and ε y as a function of collision velocity.
Jmse 11 01761 g021
Figure 22. Collision force histories calculated under different yield models.
Jmse 11 01761 g022
Figure 23. Comparison of maximum forces calculated for different collision velocities with experimental values.
Jmse 11 01761 g023
Figure 24. Collision force as a function of the velocity and energy, represented on a linear scale [10,11,14,15,18,19,20].
Jmse 11 01761 g024
Figure 25. Collision force as a function of the velocity and energy, represented on a logarithmic scale [10,11,14,15,18,19,20].
Jmse 11 01761 g025
Table 1. Ice collision experiments reported in previous studies.
Collision SpeedCollision
Type
Collision
Velocity
Ice Mass
( m i c e )
Reference
High speed
(aerospace)
Droplet 30~530 m/s3.2 gArakawa et al. [26]
Projectile30~200 m/s60~500 gKim et al. [27]
Tippmann [28]
Tippmann et al. [29]
Projectile62.5 and 127.5 m/s7.3 gCombescure et al. [30]
Low speed
(marine)
Free drop1.5~5.0 m/s260~300 kgChoi et al. [10]
7.9 m/s1340 kgYu et al. [11]
Trolley2.0~3.5 m/s80~90 kgZhu et al. [13,14]
Cai et al. [15]
Pendulum5.32 m/s1000 kg
(ice + carriage)
Clarke [19]
4.7 m/s4650 kg
(ice + carriage)
Andrade [20]
Gagnon et al. [18]
Table 2. Specifications for the ice-collision-pendulum rig used in the present studies.
SpecificationAttributeValue
Collision speedNormal collision speed3–10 kts
Max collision speed11 (kts) (5.8 (m/s))
Collision energyMax kinetic energy7000 (J) (20t)
DimensionsChamber size (LBH)5 × 2 × 2.3 (m)
Arm length ( l )1.2 (m)
Max angle45 (degree)
Max height ( h )0.4 (m)
SpecimenSteel specimen
(Plain plate)
1 × 0.5 (m) (20t)
79.8 kg
Ice specimen
(Hemi-spherical shape)
D: 300 mm, h: 250 mm
25.7 kg
Table 3. Dimensions of ice specimens for compression testing.
TestSize (mm)Temperature (°C)
Test 1 (2 ea.)100 × 100 × 300−20
Test 2 (2 ea.)100 × 100 × 250−20
Table 4. Summary of experimental conditions for the ice collision tests.
Test ConditionValue
Ice specimens
(hemispherical)
SizeD = 300, h = 250
Weight35 kg
Steel plate
(thickness = 20 mm)
Size (mm)1000 × 500
Weight78 kg
Ice holderWeight8 kg
PendulumWeight120 kg
Steel-plate jigWeight 208 kg
TemperatureRoom −20 °C
Collision velocityRelative velocity5, 7, and 10 knots
Table 5. Measured pendulum velocity in each test.
Target SpeedTest 1Test 2Test 3Average
5 Knots4.995.015.145.04
7 Knots7.047.257.027.10
10 Knots9.9210.0610.0210.00
Table 6. Summary of measured variable at different collision velocities.
Measured
Variables
Collision
Velocity
Test 1Test 2Test 3
Max pressure (MPa)5 knots908794
7 knots989495
10 knots9610198
Avg. pressure ( M P a )5 knots777874
7 knots797790
10 knots838480
Pressure area ( c m 2 )5 knots3.53.94.4
7 knots5.85.15.0
10 knots7.56.97.1
Collision force
( k N )
5 knots30.630.236.4
7 knots48.141.744.8
10 knots70.374.269.6
Table 7. Summary of average pressures and collision forces.
Measurement5 Knots7 Knots10 Knots
Max pressure ( M P a )90.395.798.3
Avg. pressure ( M P a )76.378.582.2
Pressure area ( c m 2 )3.95.37.2
Collision force ( k N )32.444.971.4
Table 8. Maximum value for ε x and ε y in the steel specimens.
Collision VelocityStrainTest 1Test 2Test 3
5 knotsMax ε x 6.36 × 10−45.84 × 10−47.13 × 10⁻⁴
Max ε y 4.47 × 10−43.96 × 10−44.45 × 10⁻⁴
7 knotsMax ε x 8.85 × 10−48.08 × 10−47.92 × 10⁻⁴
Max ε y 3.96 × 10−43.93 × 10−4N/A
10 knotsMax ε x 1.04 × 10−41.07 × 10−41.15 × 10⁻⁴
Max ε y 4.45 × 10−43.49 × 10−43.64 × 10⁻⁴
Table 9. Comparison of maximum strains obtained from experiments and FEA.
Strain Collision VelocityExp. (Avg.)FEA with CFFEA with DP
Max ε x
(Difference %)
5 knots6.44 × 10−46.90 × 10⁻⁴ (7.1%)6.43 × 10⁻⁴ (0.2%)
7 knots8.85 × 10−48.06 × 10⁻⁴ (8.9%)8.63 × 10⁻⁴ (2.2%)
10 knots10.80 × 10−411.71 × 10⁻⁴ (8.3%)11.08 × 10⁻⁴ (2.8%)
Avg. Difference8.1%1.7%
Max ε y
(Difference %)
5 knots4.10 × 10−42.80 × 10⁻⁴ (31.7%)2.40 × 10⁻⁴ (41.5%)
7 knots3.96 × 10−43.12 × 10⁻⁴ (21.2%)2.99 × 10⁻⁴ (24.5%)
10 knots3.74 × 10−45.53 × 10⁻⁴ (47.9%)3.76 × 10⁻⁴ (0.5%)
Avg. Difference33.6%22.2%
Table 10. Comparison of collision force obtained by experiment and FEA.
Collision VelocityExperiment (kN)FEA with CF (kN)
(Difference (%))
FEA with DP (kN)
(Difference (%))
5 knots32.431.47
(2.9%)
31.05
(4.2%)
7 knots45.344.7
(1.3%)
42.7
(5.7%)
10 knots71.468.79
(3.6%)
63.87
(10.5%)
Avg. Difference-2.6 %6.8 %
Disclaimer/Publisher’s Note: The statements, opinions and data contained in all publications are solely those of the individual author(s) and contributor(s) and not of MDPI and/or the editor(s). MDPI and/or the editor(s) disclaim responsibility for any injury to people or property resulting from any ideas, methods, instructions or products referred to in the content.

