
Development of an Edge Computing-Based Intelligent Feeding System for Observing Depth-Specific Feeding Behavior in Red Seabream


Abstract
:1. Introduction
2. Materials and Methods
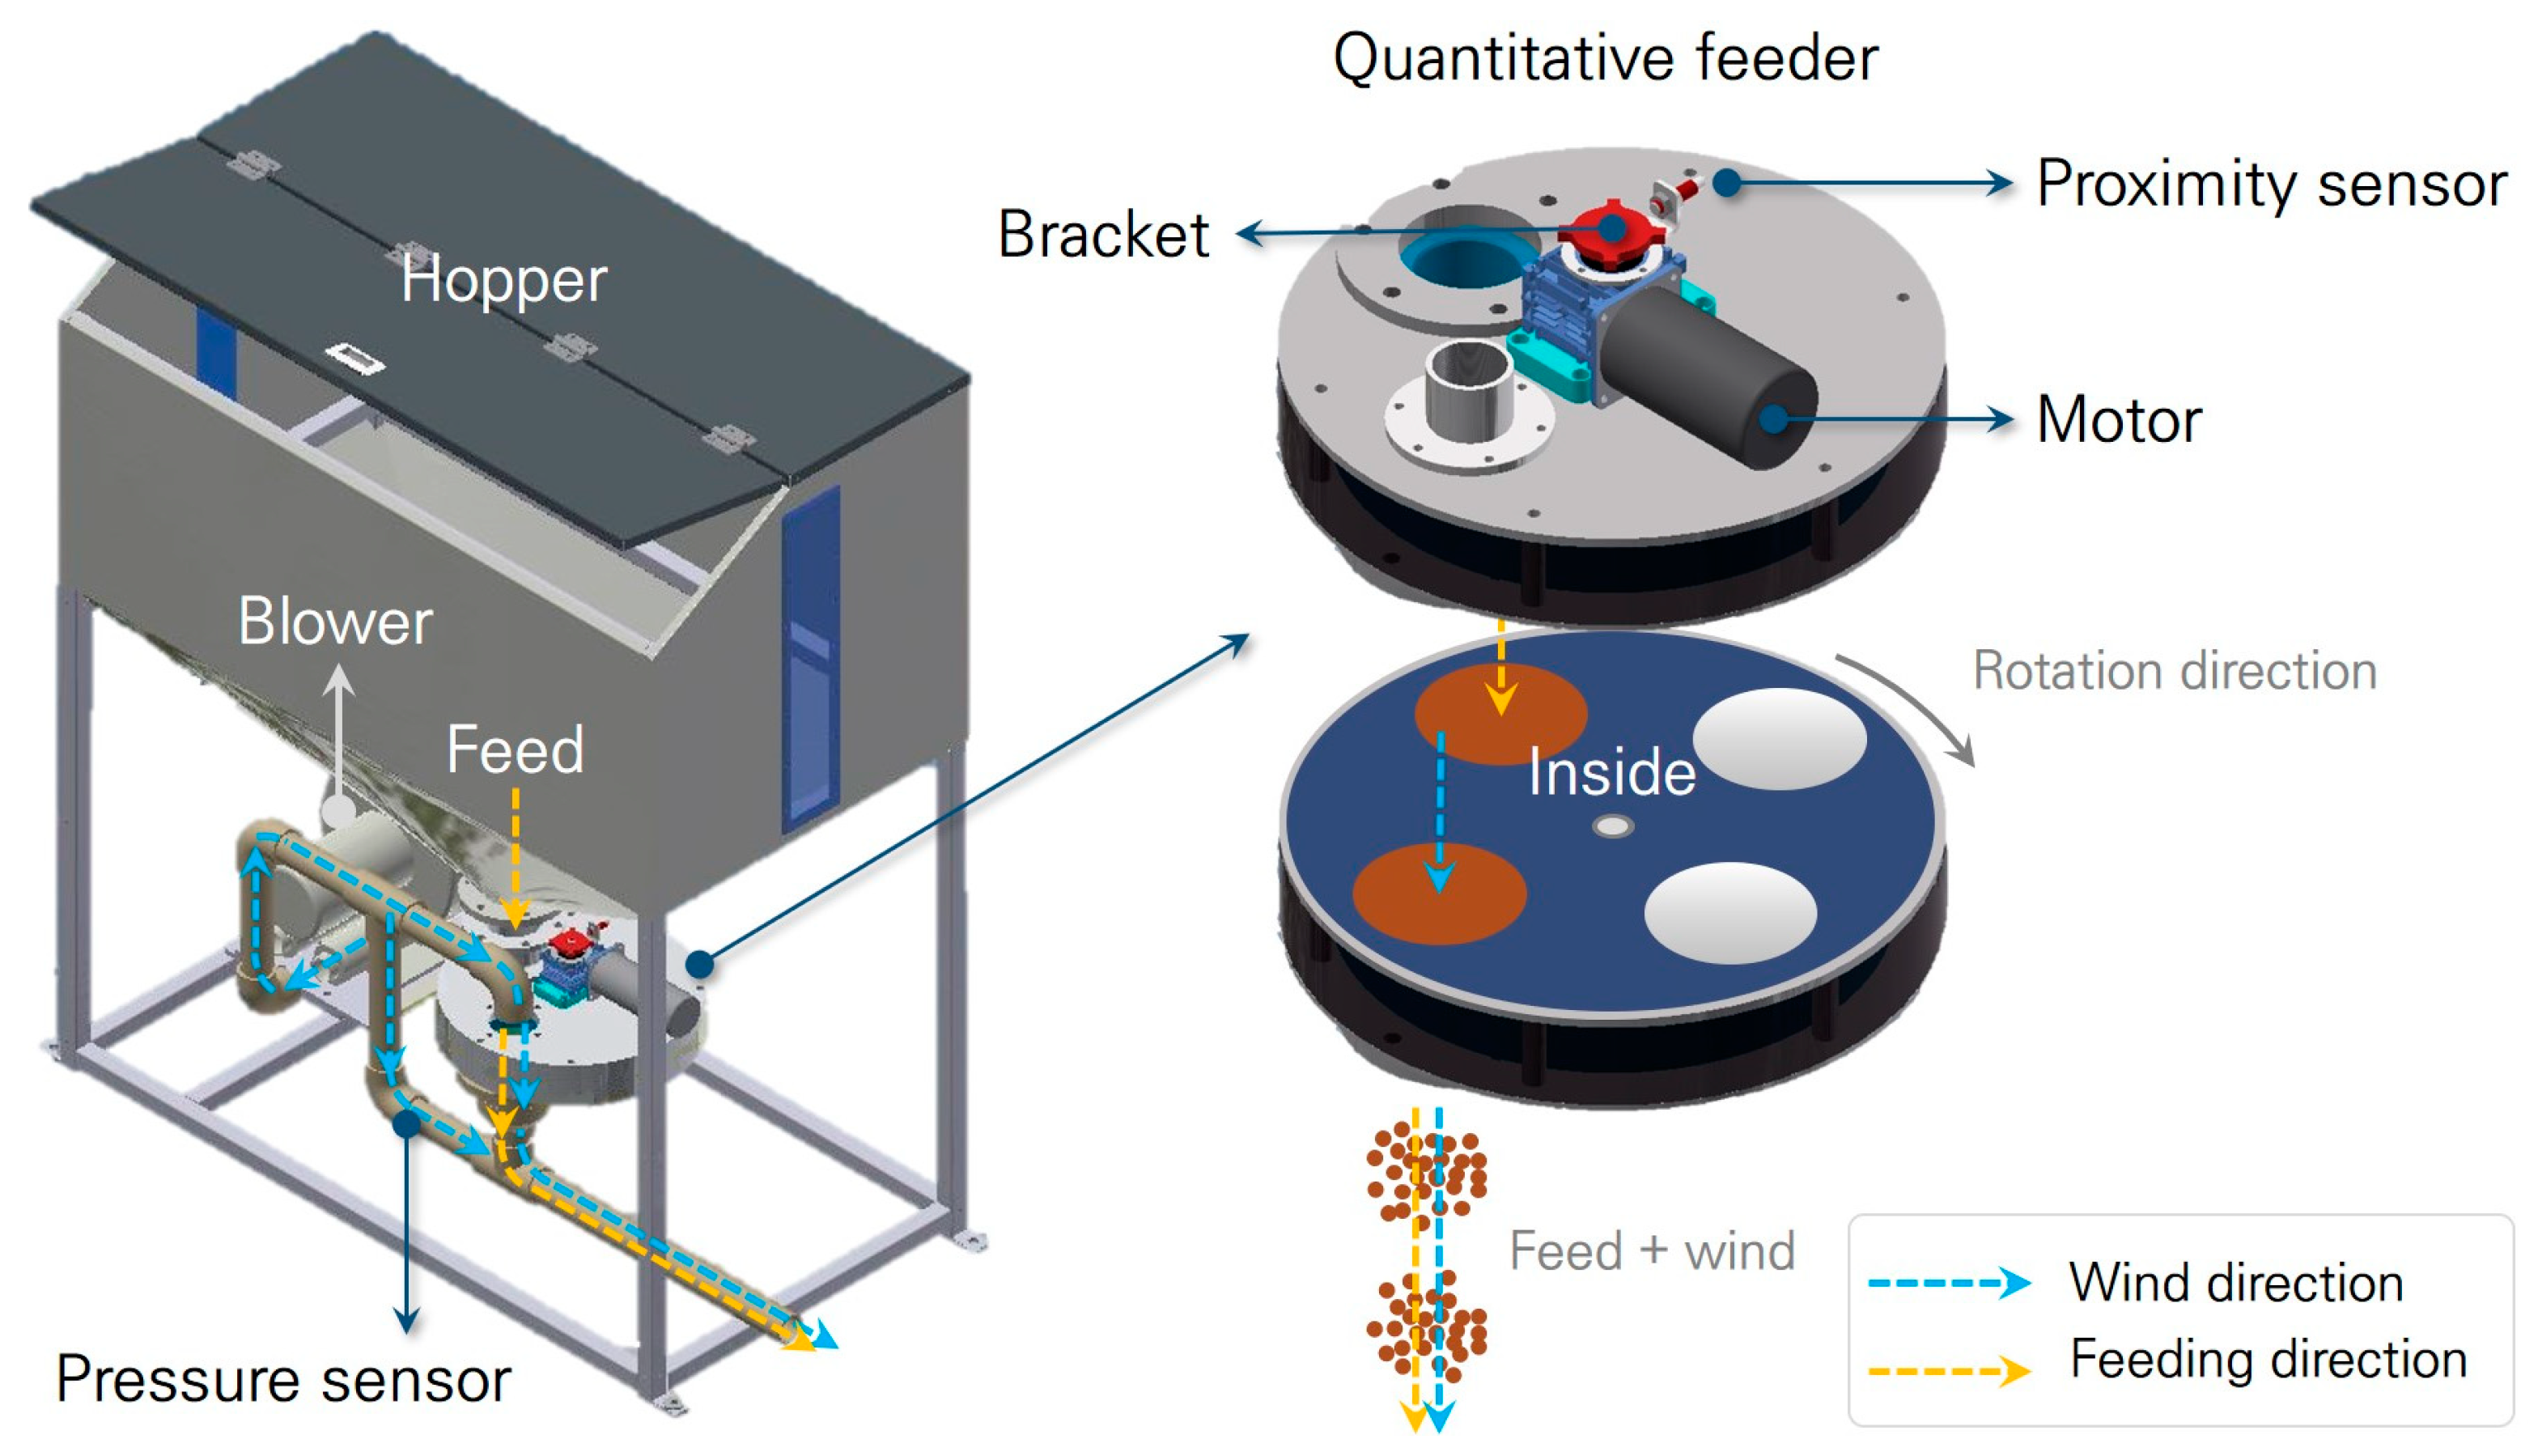
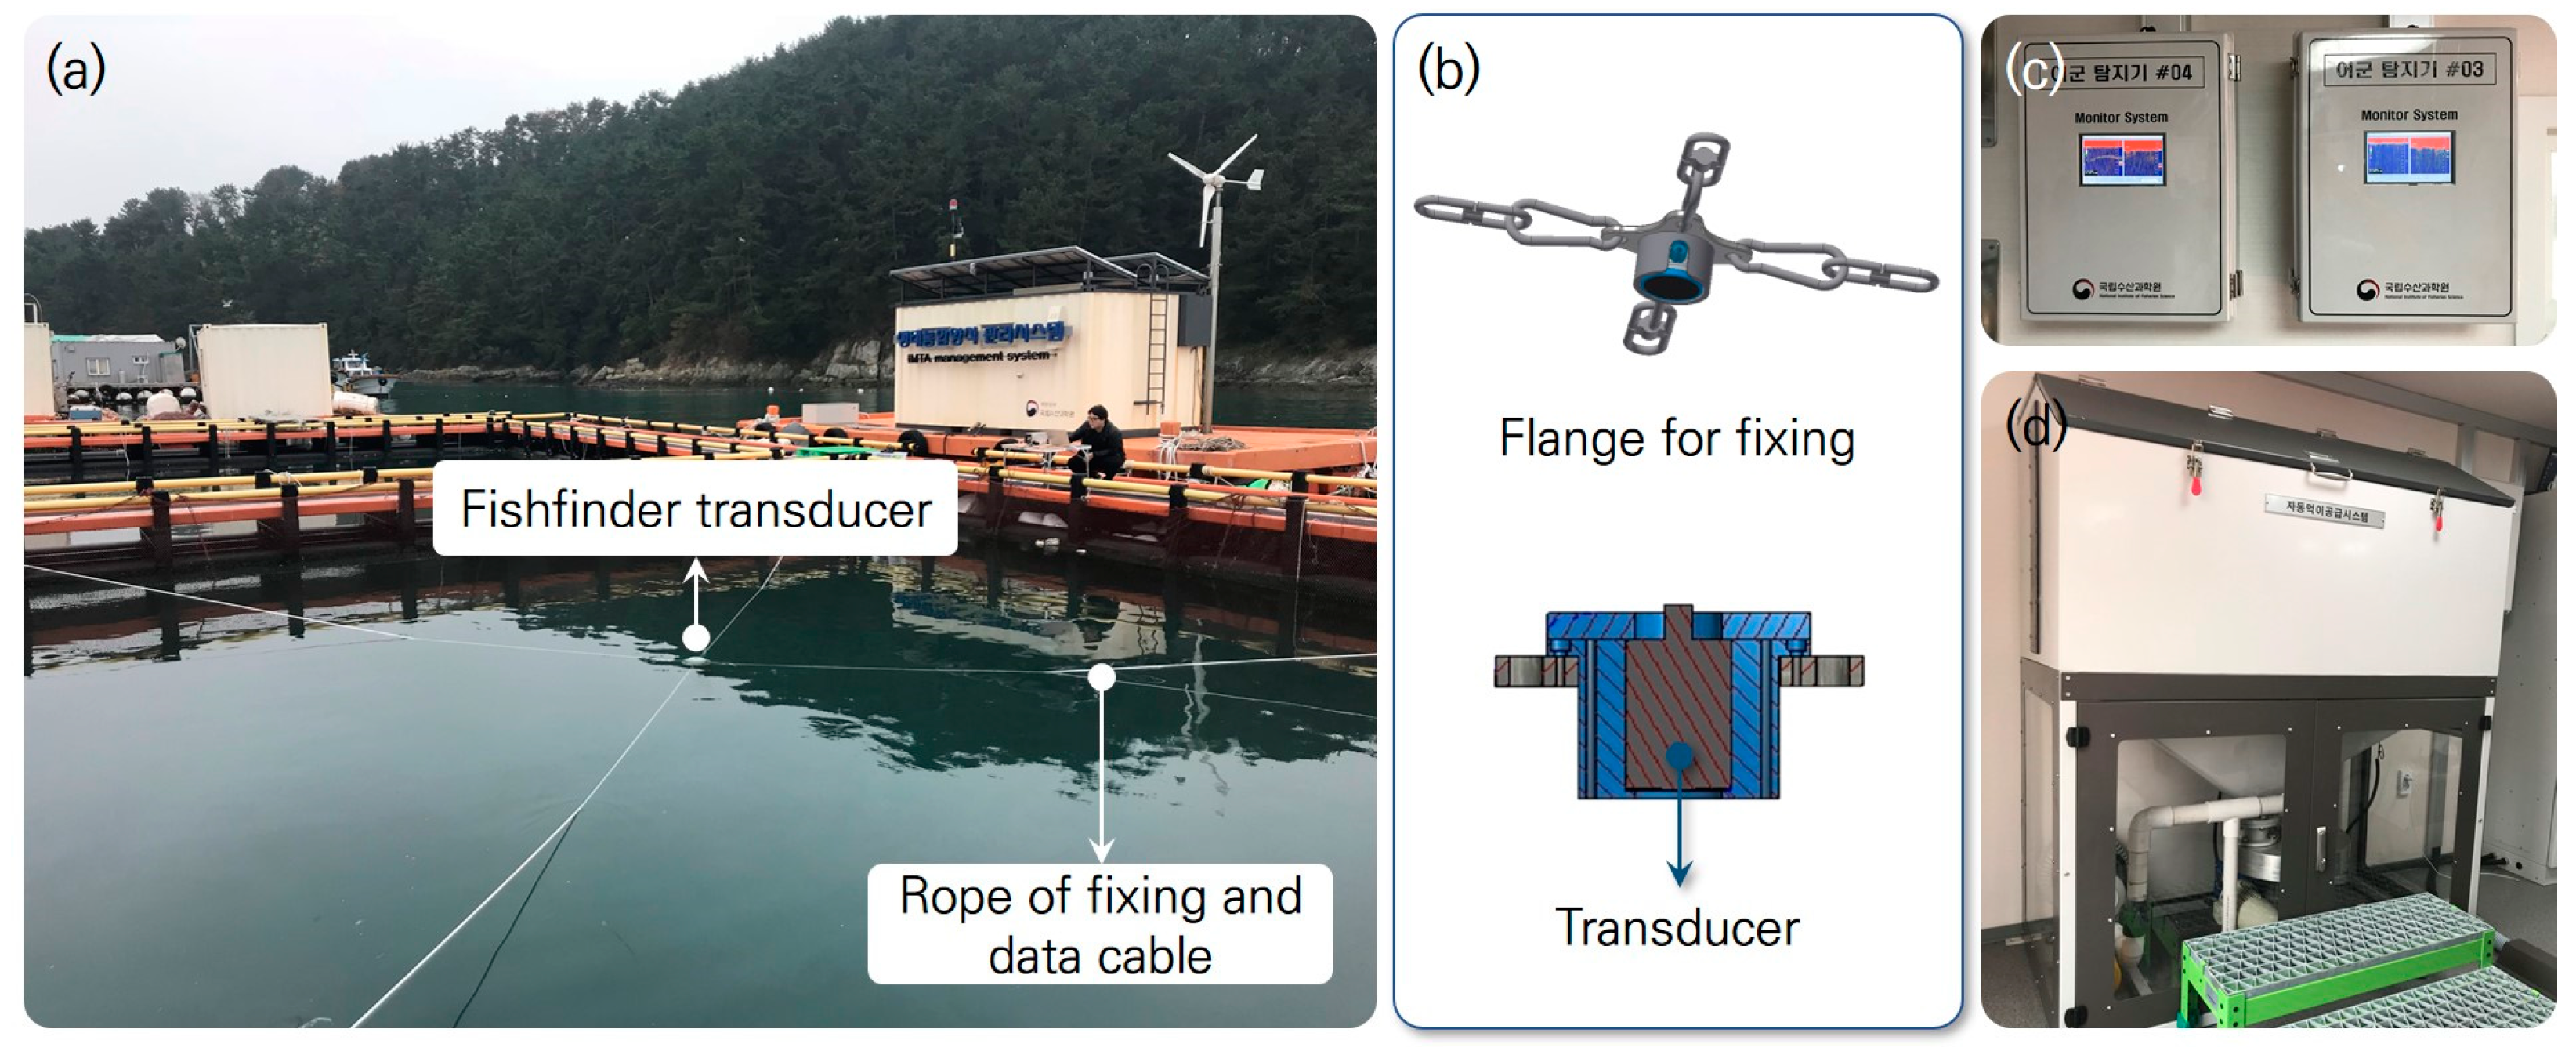
2.1. Design of the Intelligent Feeding System
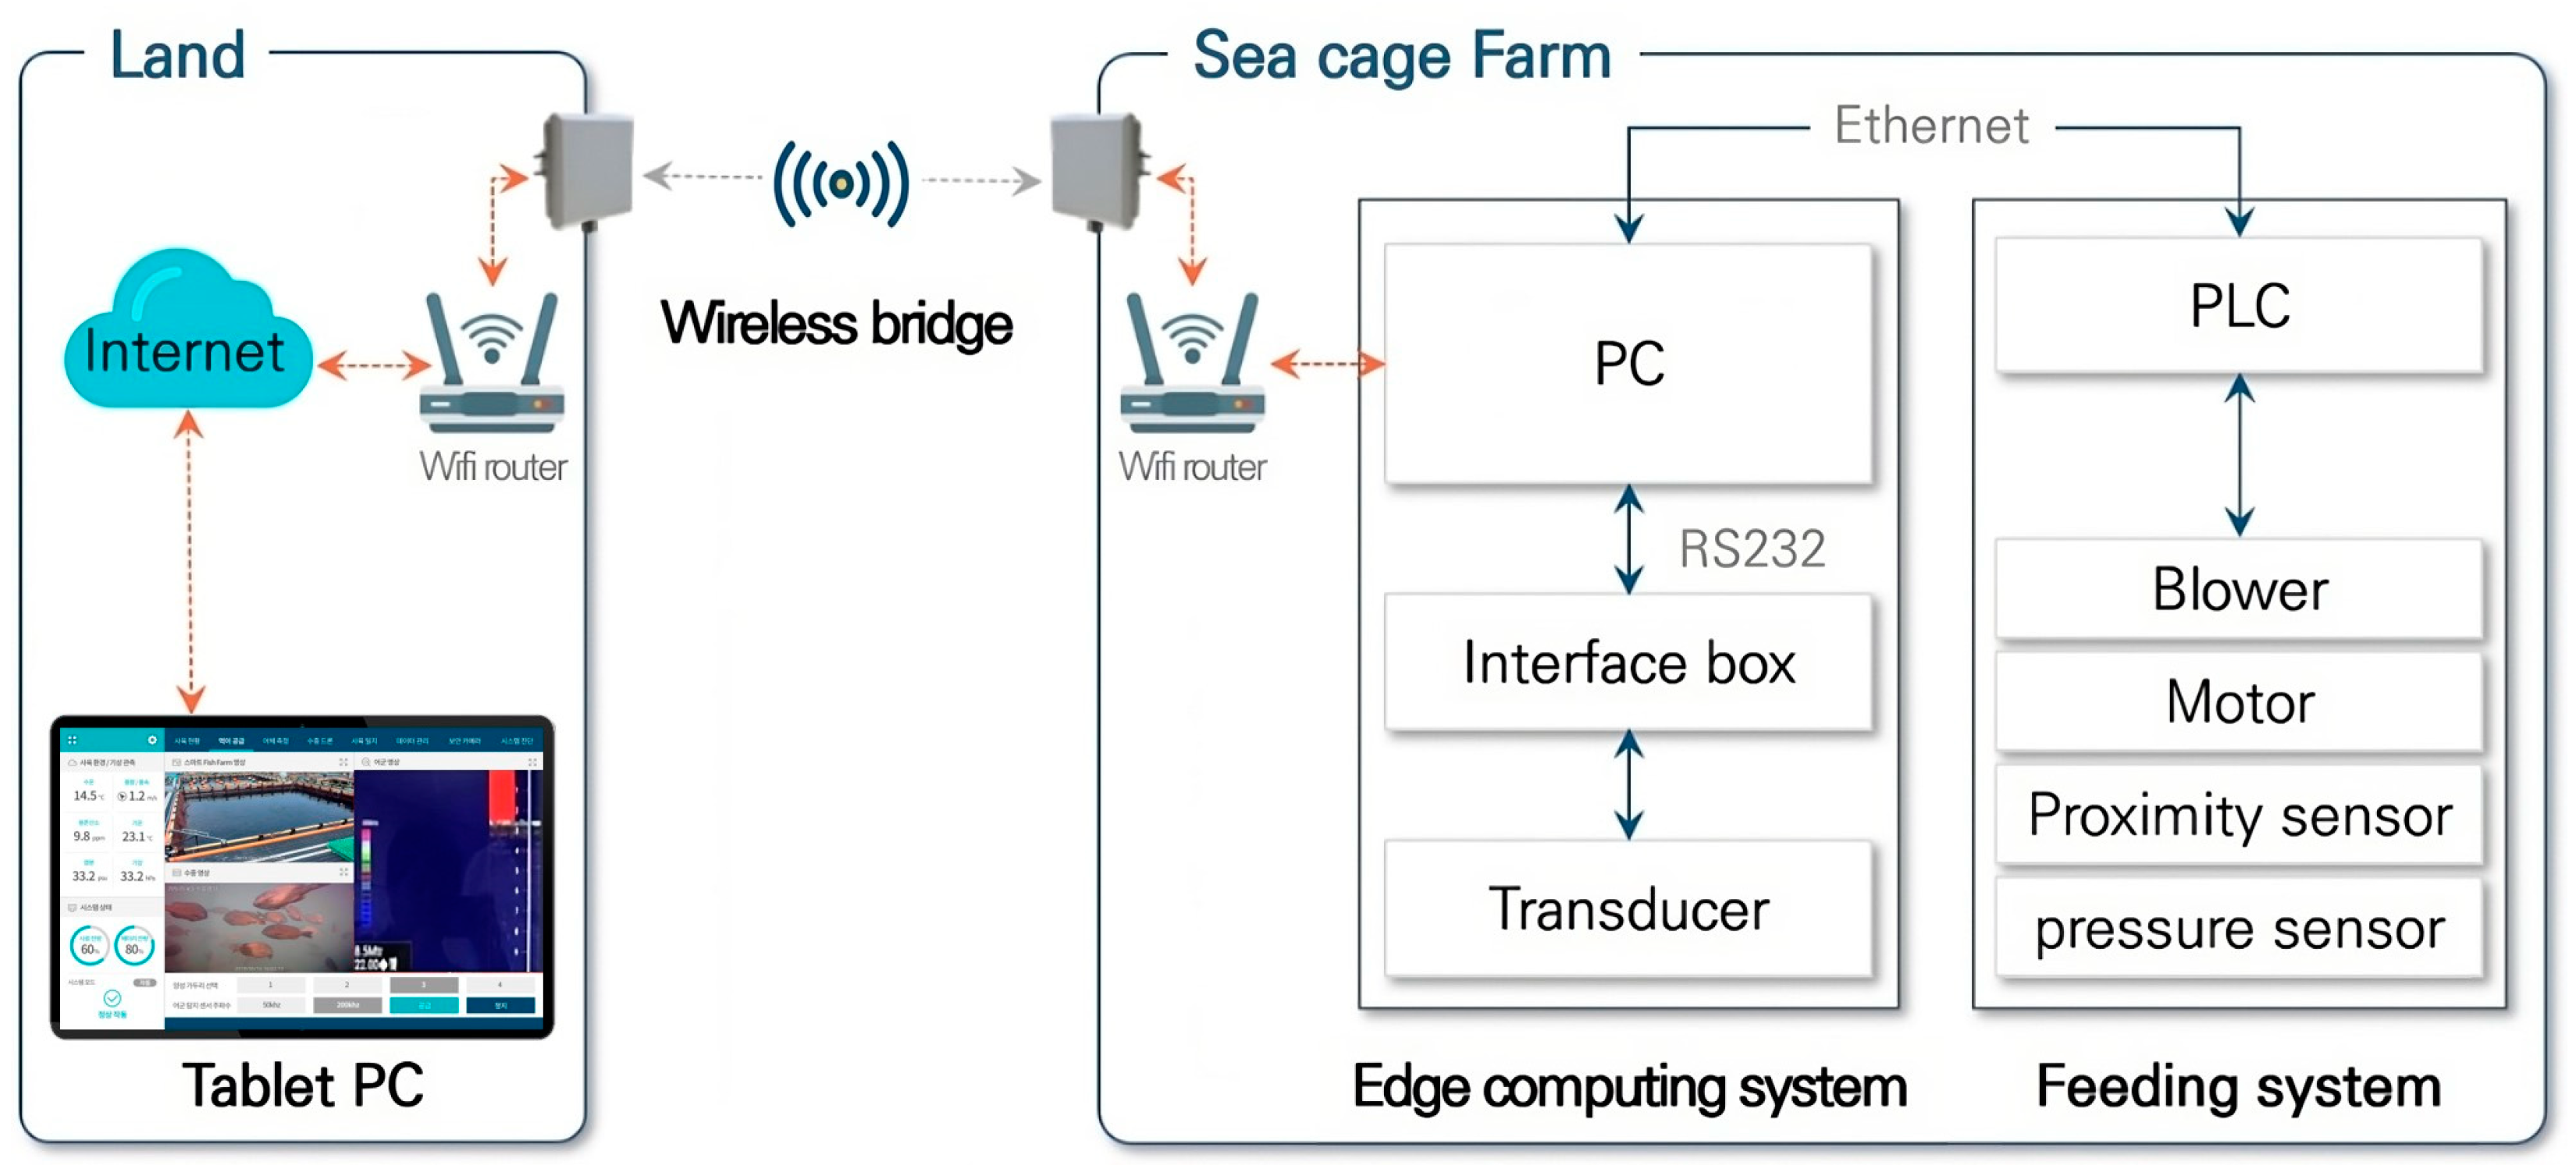
2.2. Edge Computing System
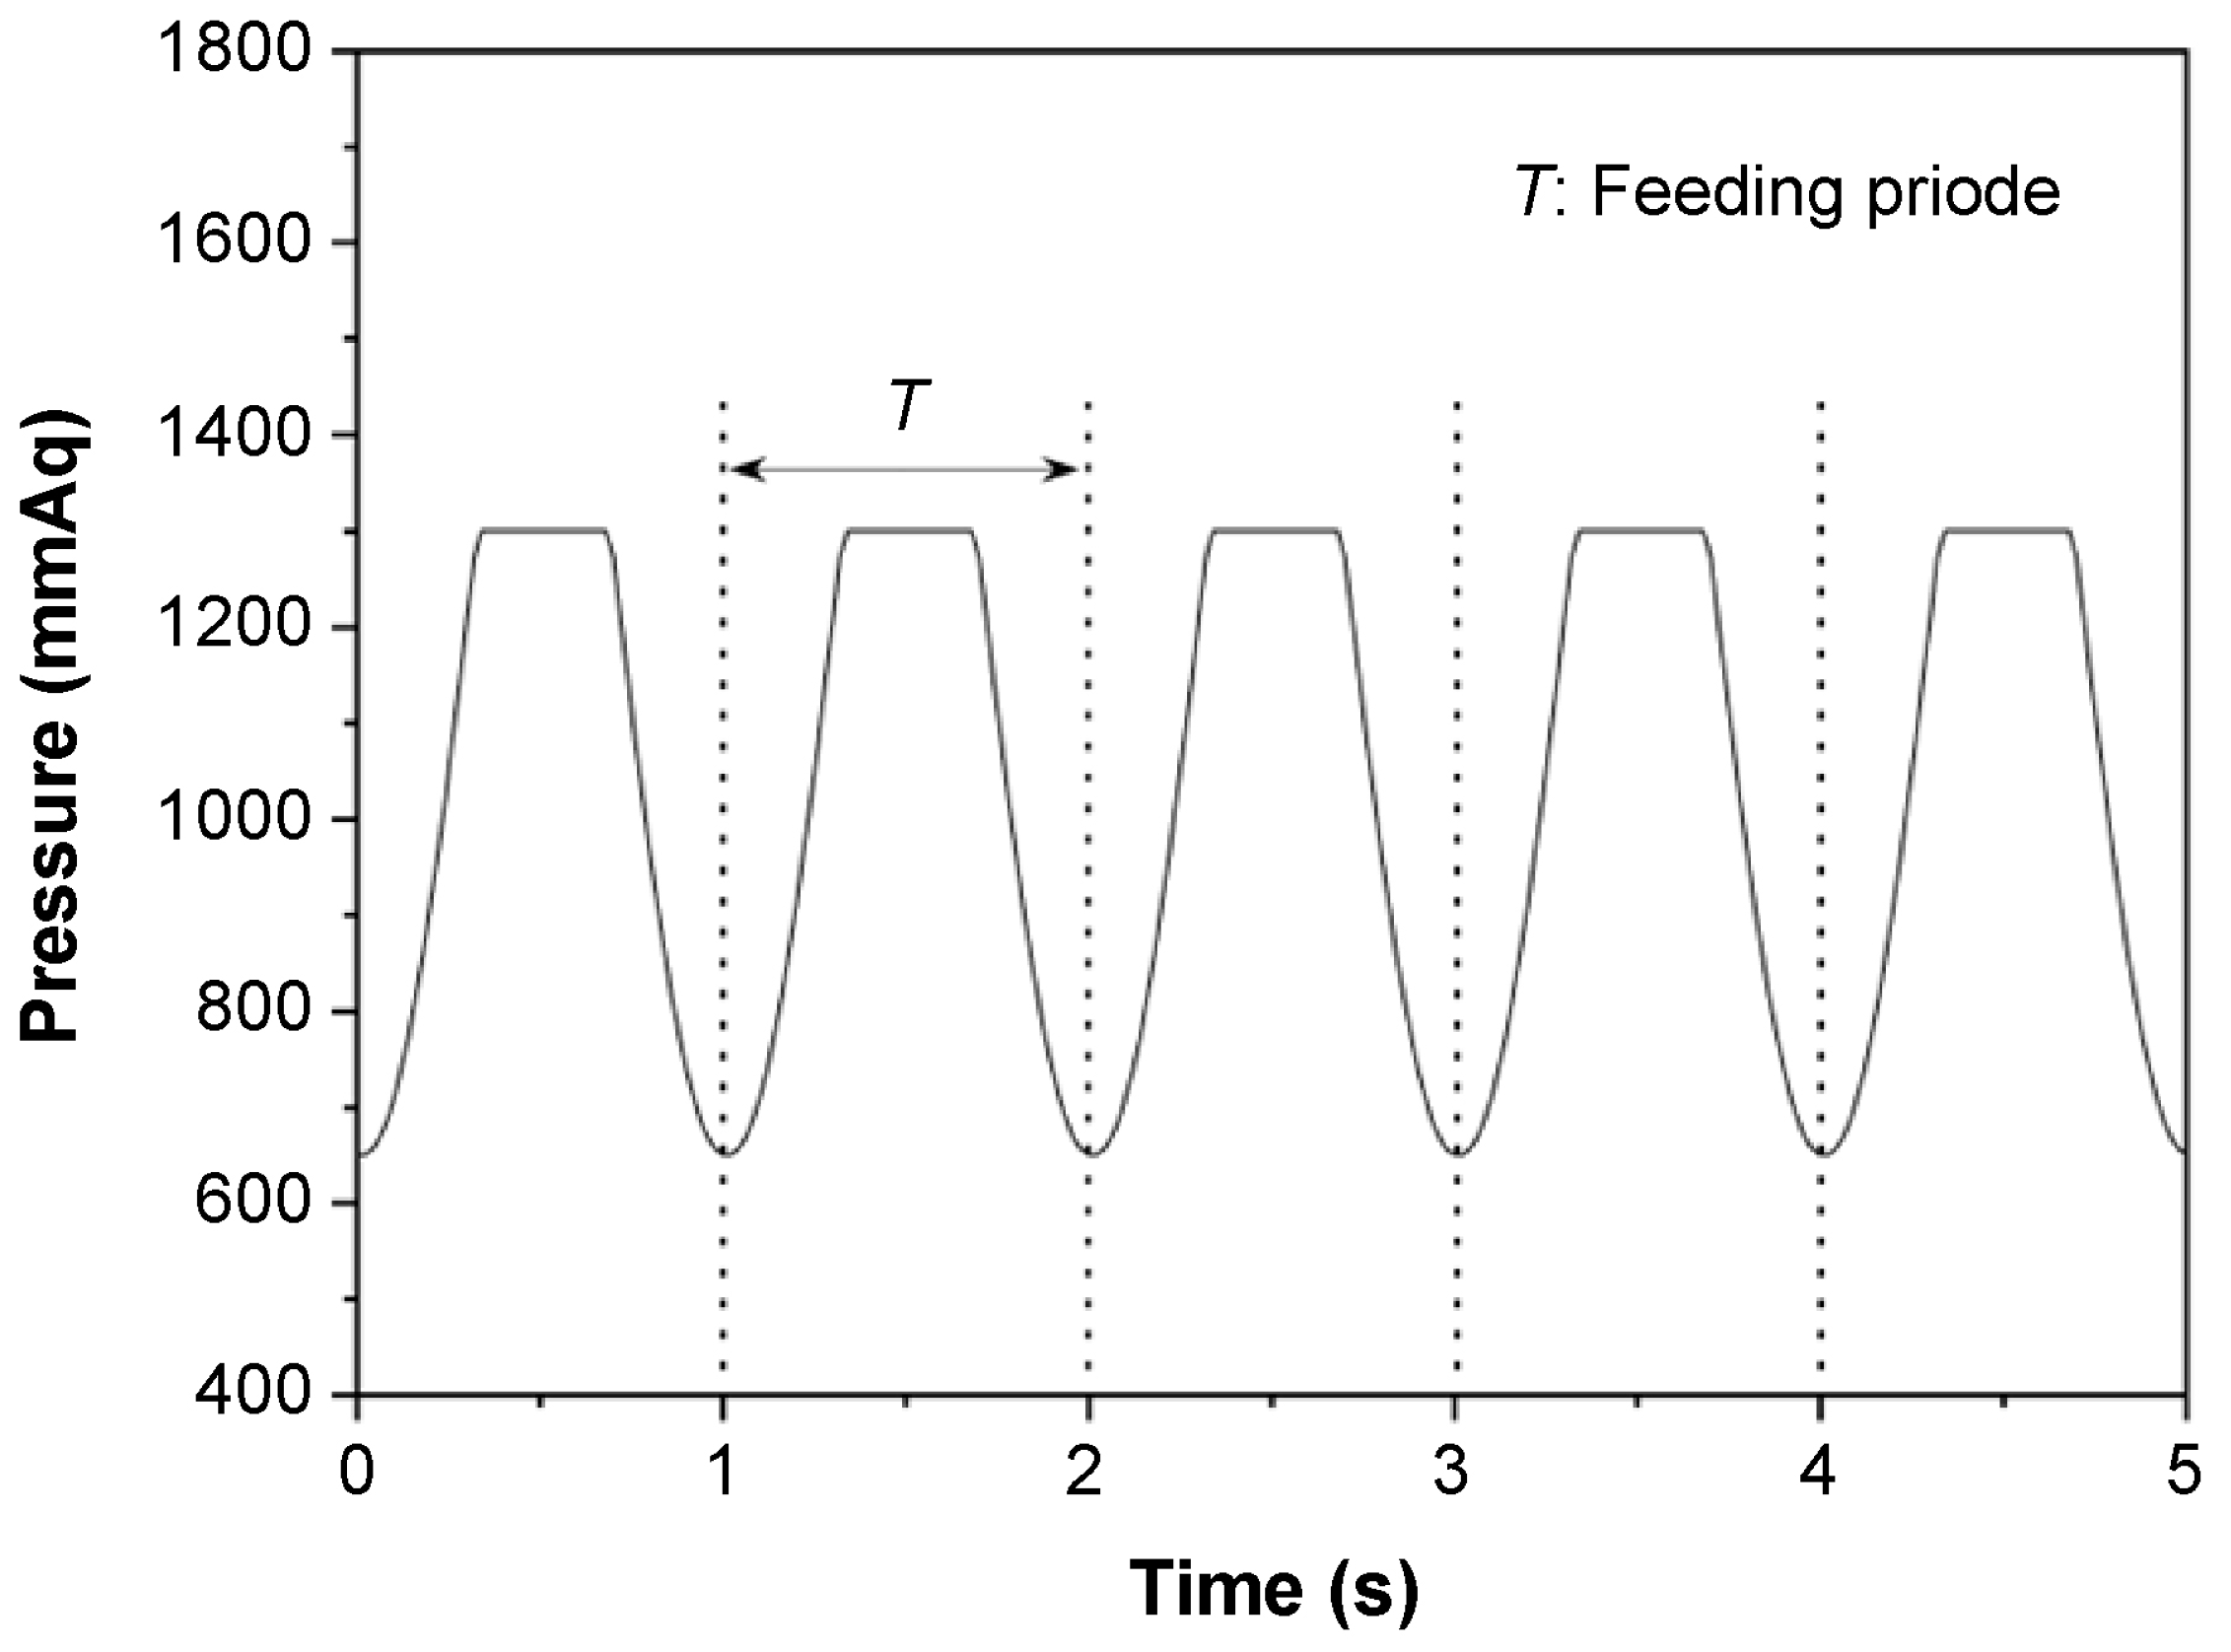
2.3. Feeding Algorithm
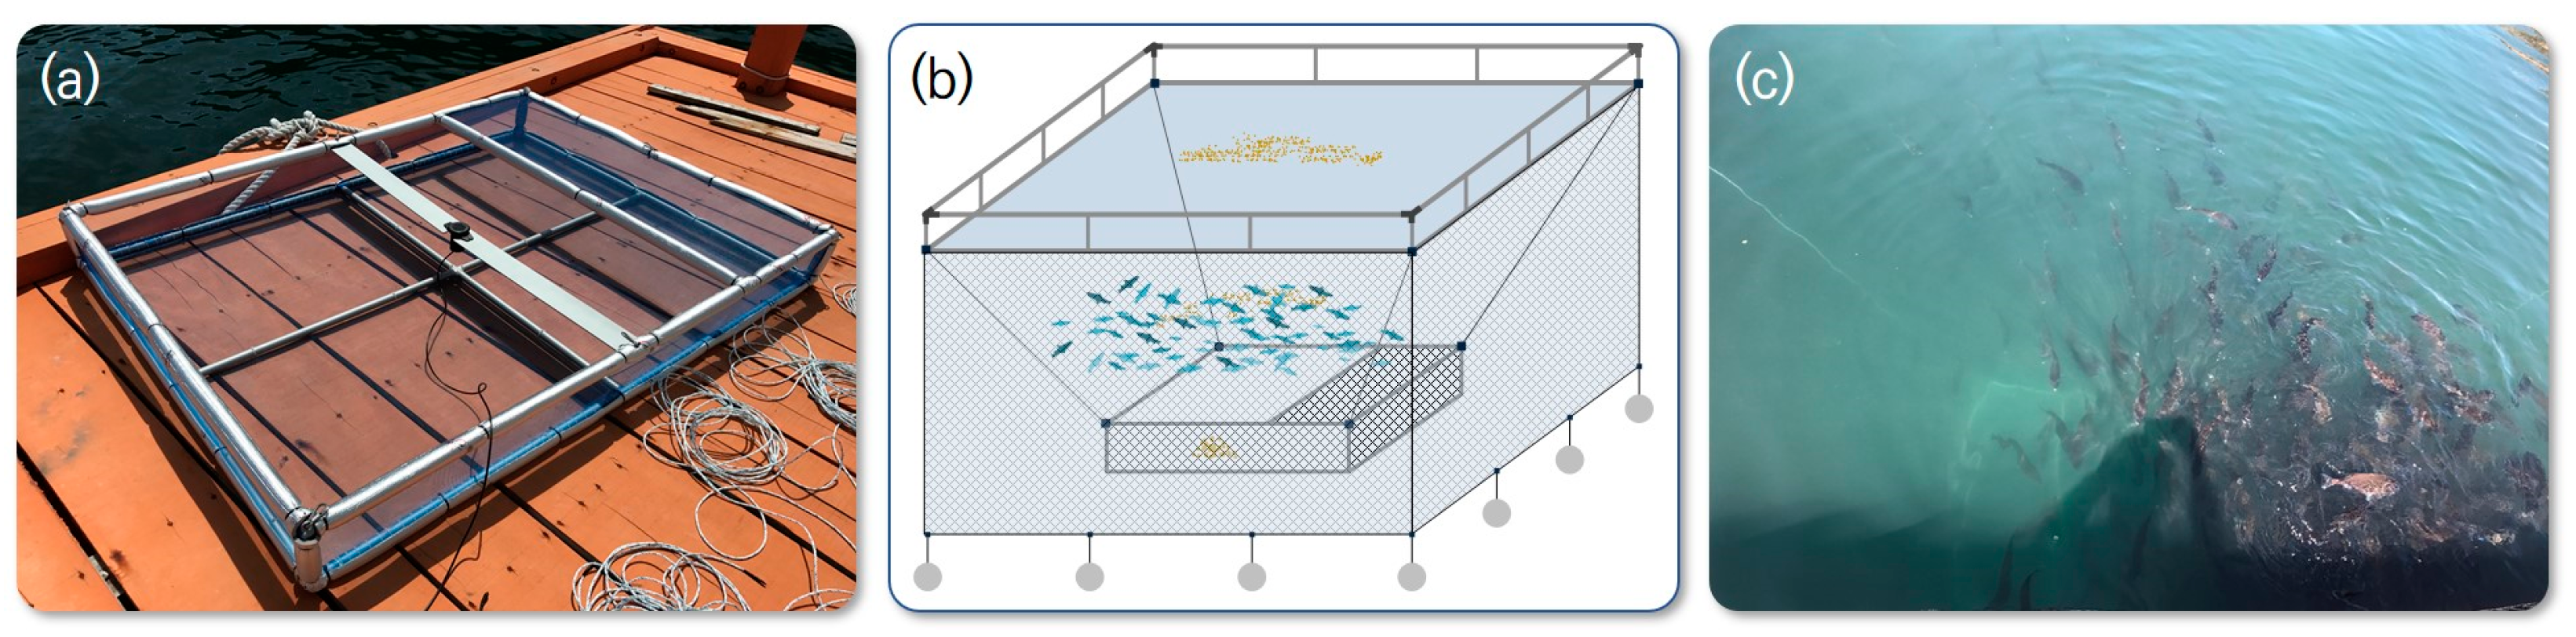
2.4. Performance Evaluation Method
3. Results and Discussion
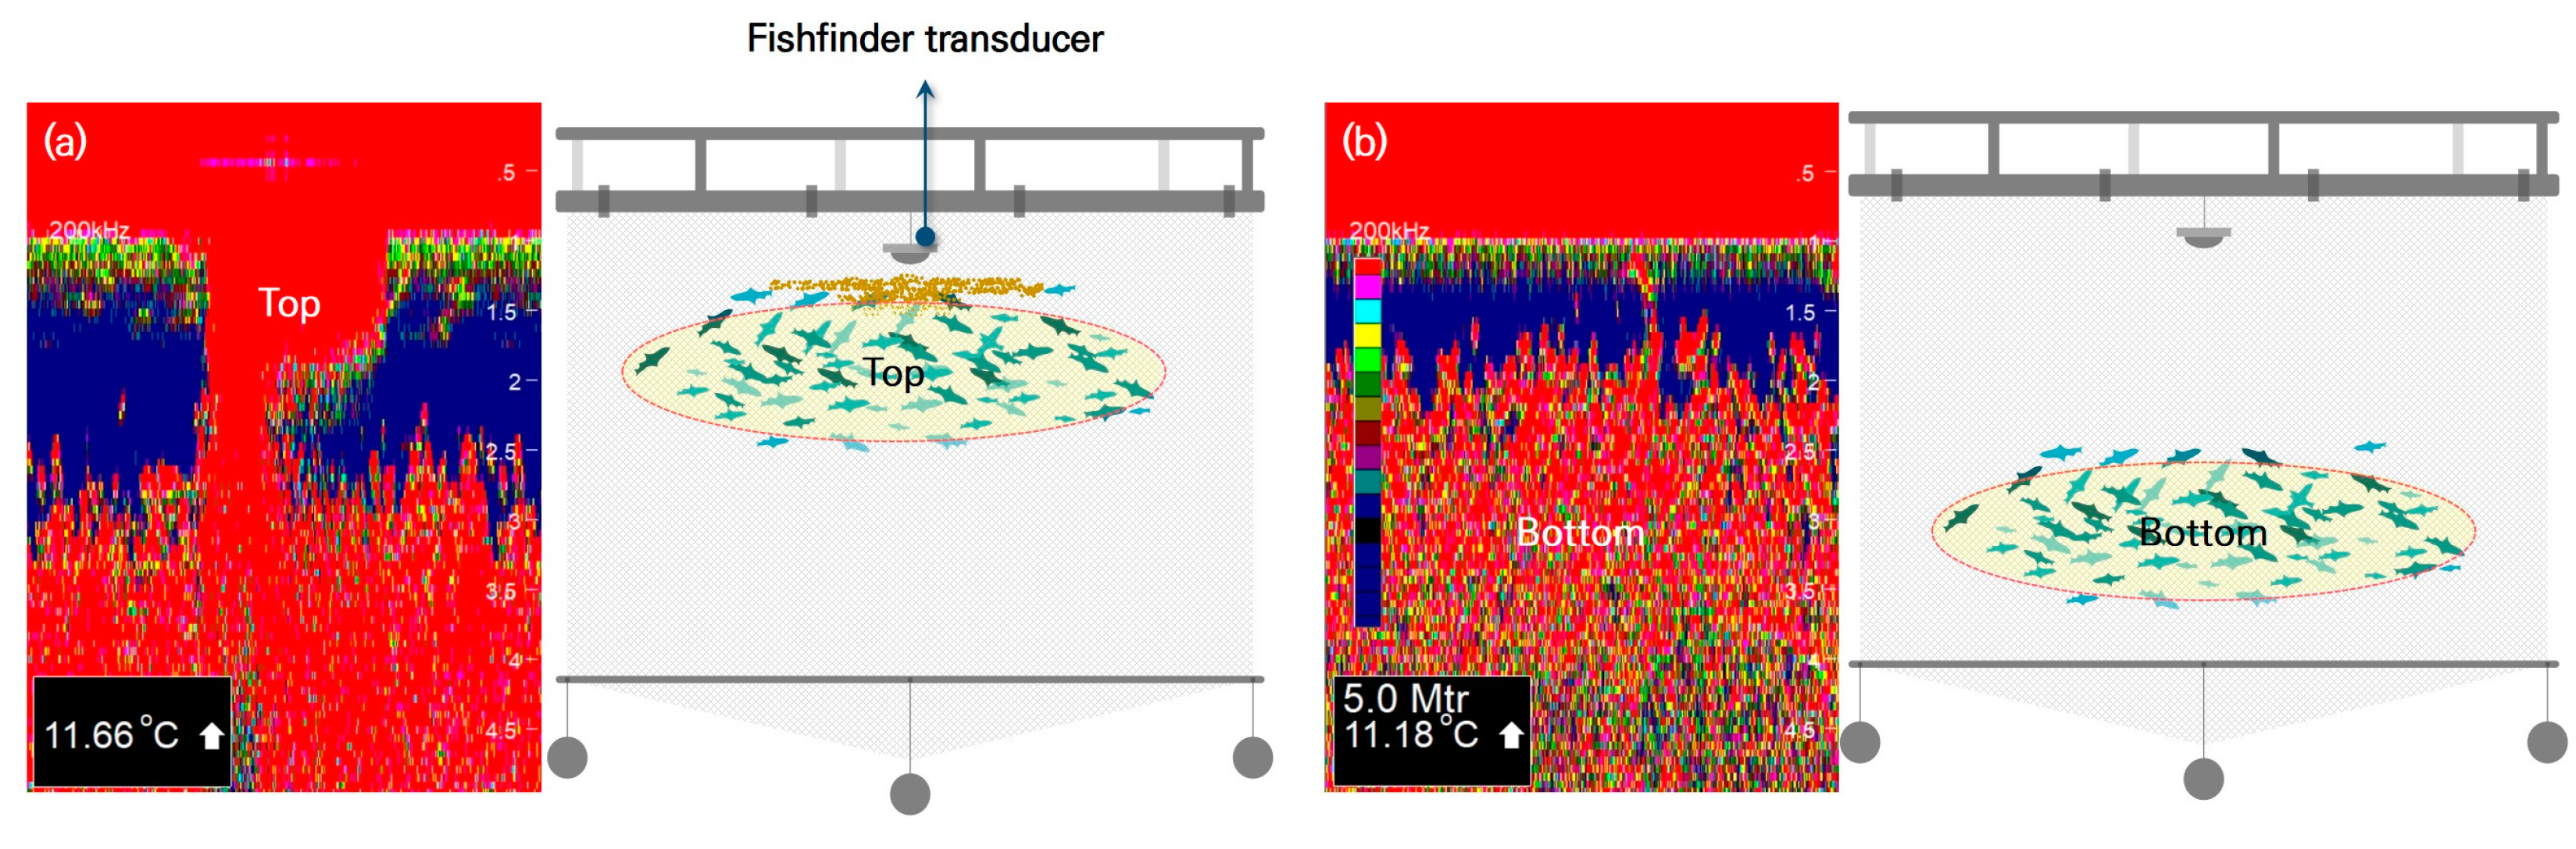
3.1. Feeding Behavior Characteristics of Red Seabream
3.2. Performance of the Intelligent Feeding System
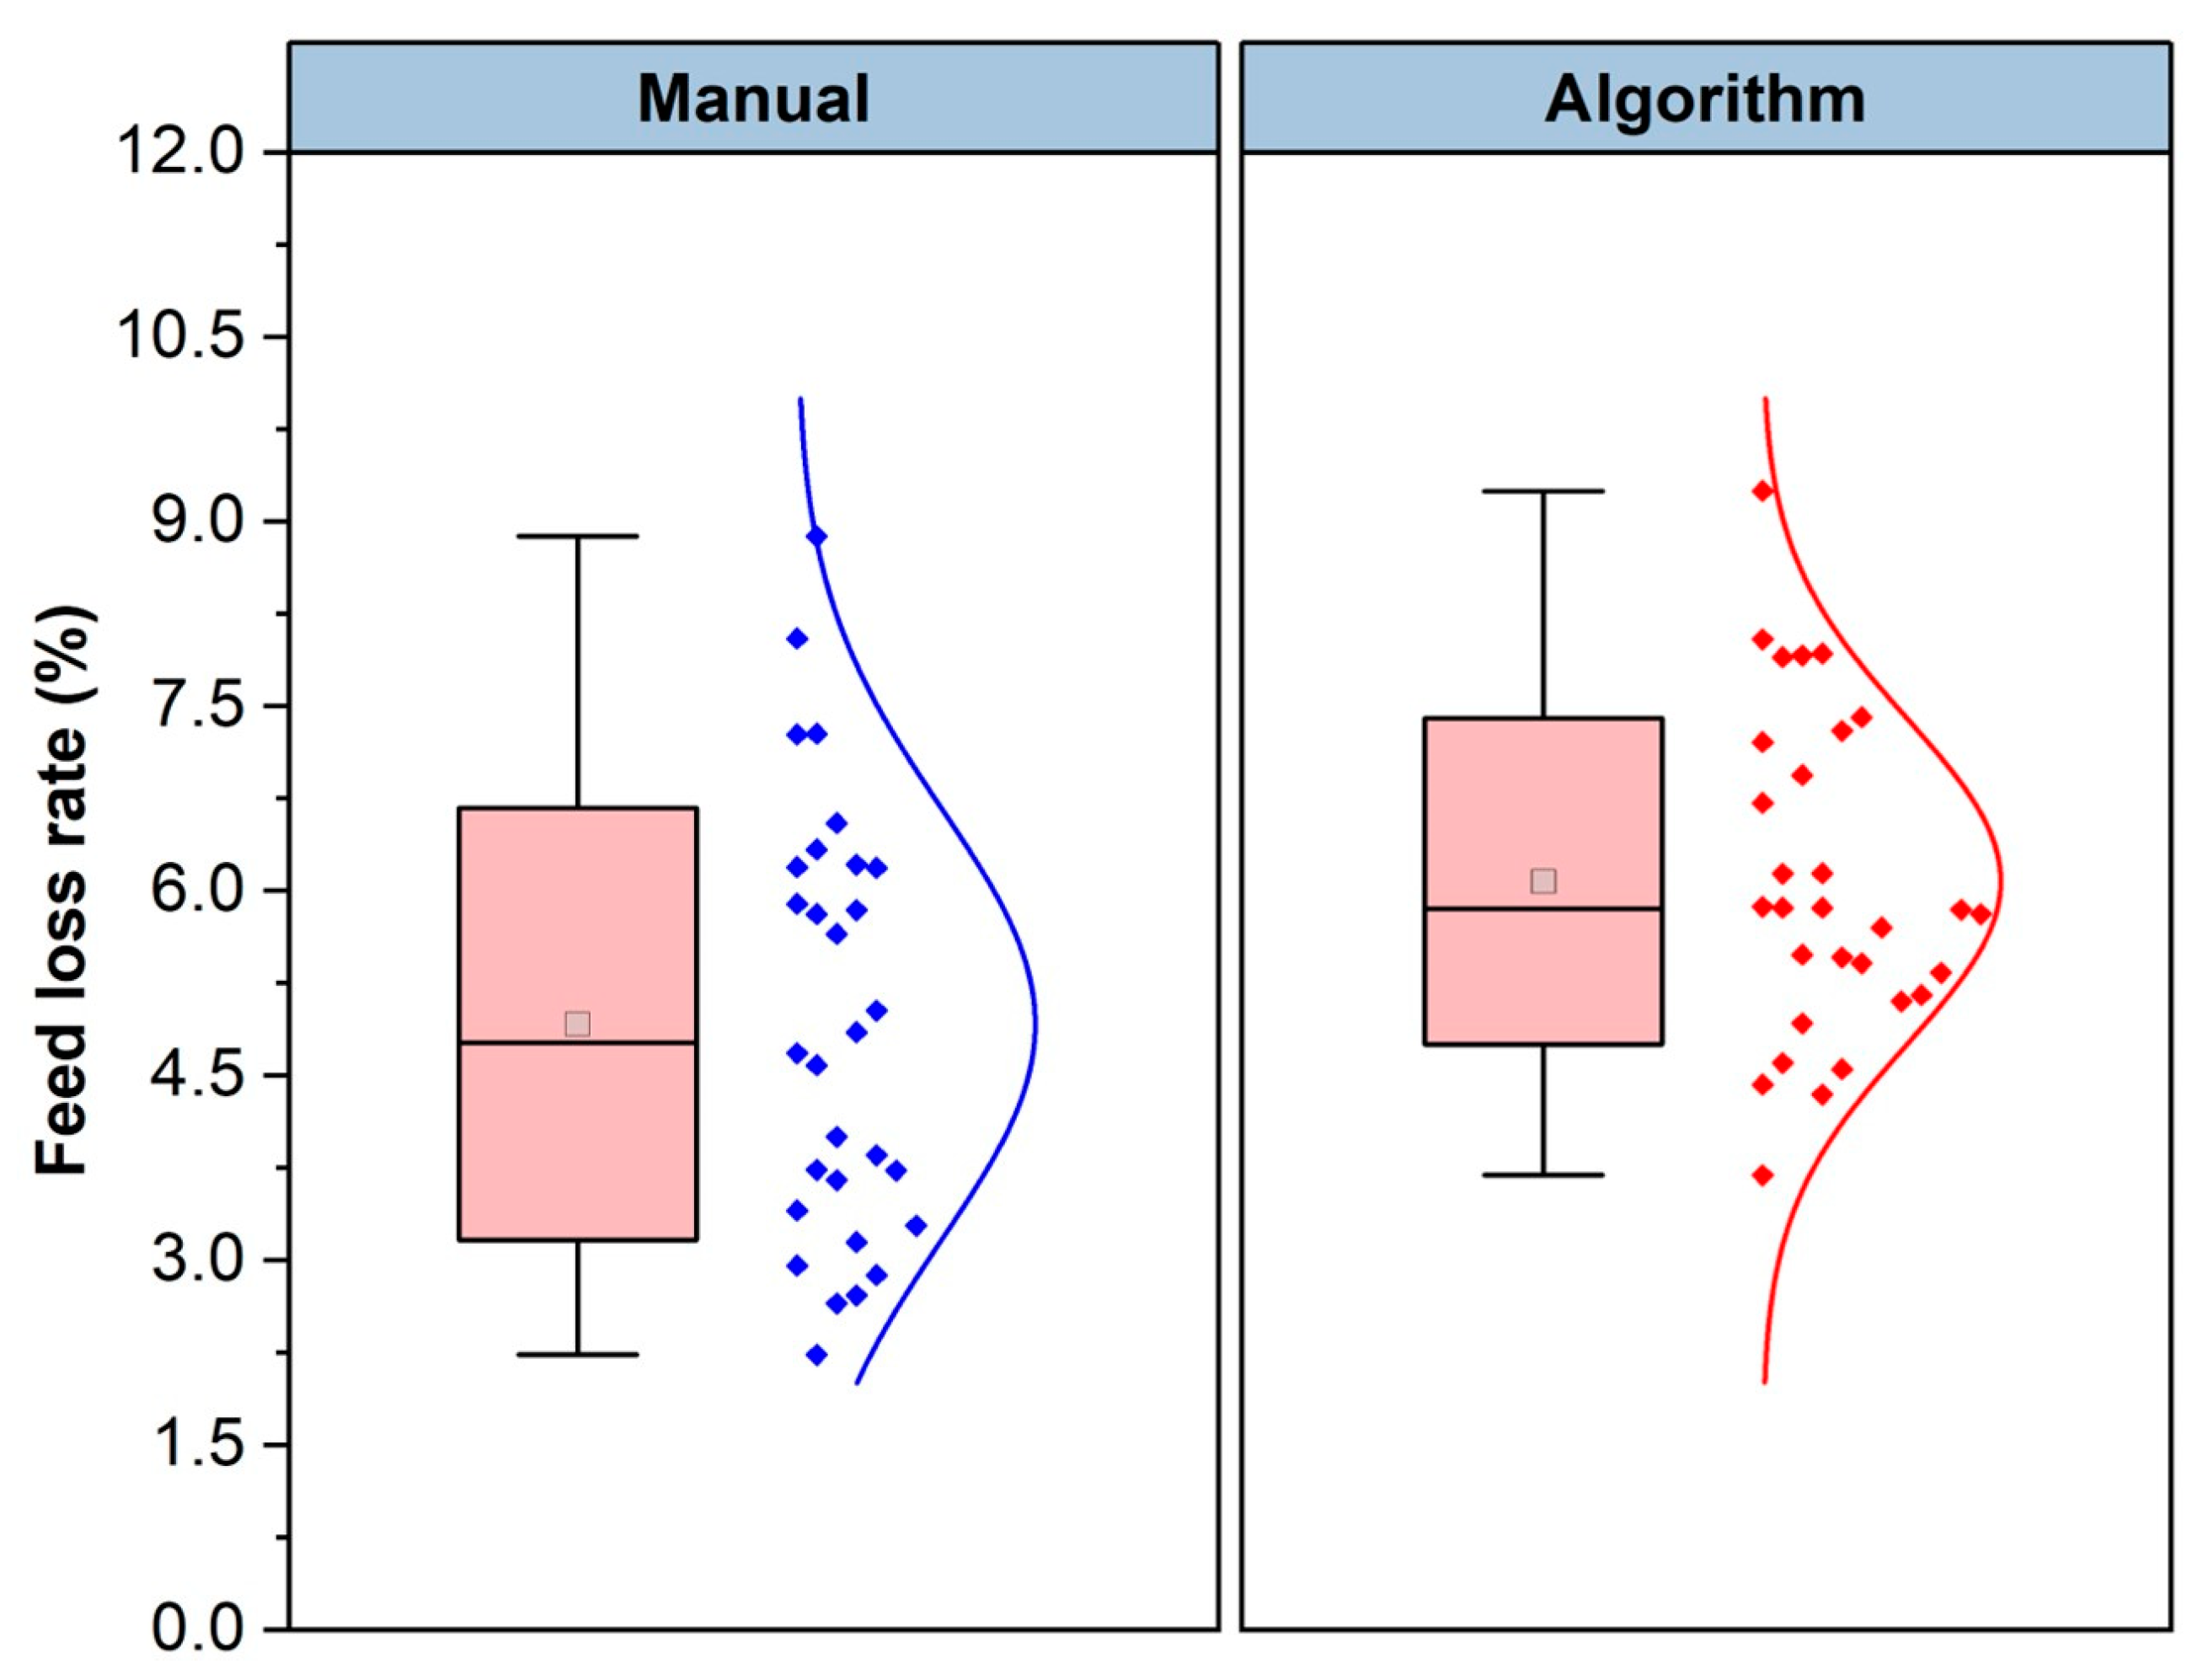
3.3. Analysis of the Feed Loss Rate
4. Conclusions
Author Contributions
Funding
Institutional Review Board Statement
Informed Consent Statement
Data Availability Statement
Acknowledgments
Conflicts of Interest
References
- Food and Agriculture Organization. The State of World Fisheries and Aquaculture 2020: Sustainability in Action; Food and Agriculture Organization (FAO): Rome Italy, 2020; Volume 165, Available online: http://www.fao.org/3/ca9229en/CA9229EN.pdf (accessed on 30 June 2023).
- Naylor, R.L.; Hardy, R.W.; Buschmann, A.H.; Bush, S.R.; Cao, L.; Klinger, D.H.; Little, D.C.; Lubchenco, J.; Shumway, S.E.; Troell, M. A 20-year retrospective review of global aquaculture. Nature 2021, 591, 551–563. [Google Scholar] [CrossRef] [PubMed]
- Zhao, S.; Zhang, S.; Liu, J.; Wang, H.; Zhu, J.; Li, D.; Zhao, R. Application of machine learning in intelligent fish aquaculture: A review. Aquaculture 2021, 540, 736724. [Google Scholar] [CrossRef]
- Chang, C.M.; Fang, W.; Jao, R.C.; Shyu, C.Z.; Liao, I.C. Development of an intelligent feeding controller for indoor intensive culturing of eel. Aquac. Eng. 2005, 32, 343–353. [Google Scholar] [CrossRef]
- El-Ebiary, E.-S.H. Rearing sharp-snout seabream (Diplodus puntazzo) fingerlings at varying dietary protein and lipid levels. Egypt. J. Aquat. Res. 2005, 31, 443–452. [Google Scholar]
- Varadi, L. Mechanized Feeding in Aquaculture. Inland Aquaculture Engineering, ADCP/REP/84/21; Food and Agriculture Organization (FAO): Rome, Italy, 1984. [Google Scholar]
- Li, D.; Wang, Z.; Wu, S.; Miao, Z.; Du, L.; Duan, Y. Automatic recognition methods of fish feeding behavior in aquaculture: A review. Aquaculture 2020, 528, 735508. [Google Scholar] [CrossRef]
- Persson, G. Eutrophication resulting from salmonid fish culture in fresh and salt waters: Scandinavian experiences. Nutritional strategies & aquaculture waste. In Proceeding of the 1st International Symposium on Nutrient Strategies in Management of Aquaculture Waste, Guelf, Ontario, Canada; Cowey, C.B., Cho, C.Y., Eds.; Fish Nutrition Research Laboratory, University of Guelph: Guelph, ON, Canada, 1991. [Google Scholar]
- Zhou, C.; Xu, D.; Lin, K.; Sun, C.; Yang, X. Intelligent feeding control methods in aquaculture with an emphasis on fish: A review. Rev. Aquac. 2018, 10, 975–993. [Google Scholar] [CrossRef]
- Liu, Z.; Li, X.; Fan, L.; Lu, H.; Liu, L.; Liu, Y. Measuring feeding activity of fish in RAS using computer vision. Aquac. Eng. 2014, 60, 20–27. [Google Scholar] [CrossRef]
- Zeng, Y.; Yang, X.; Pan, L.; Zhu, W.; Wang, D.; Zhao, Z.; Liu, J.; Sun, C.; Zhou, C. Fish school feeding behavior quantification using acoustic signal and improved swin transformer. Comput. Electron. Agric. 2023, 204, 107580. [Google Scholar] [CrossRef]
- Mallekh, R.; Lagardère, J.P.; Eneau, J.P.; Cloutour, C. An acoustic detector of turbot feeding activity. Aquaculture 2003, 221, 481–489. [Google Scholar] [CrossRef]
- Yang, X.; Zhang, S.; Liu, J.; Gao, Q.; Dong, S.; Zhou, C. Deep learning for smart fish farming: Applications, opportunities and challenges. Rev. Aquac. 2021, 13, 66–90. [Google Scholar] [CrossRef]
- Yang, Y.S.; Bae, J.H.; Bae, B.S.; Ahn, H.C.; Kim, I.O.; Lee, B.I.; Jung, Y.G. A study on the development of auto-feeding system for the cultured fish-I. J. Kor. Soc. Fish. Technol. 2006, 42, 234–239. [Google Scholar] [CrossRef]
- Shaari, M.F.; Zulkefly, M.E.I.; Wahab, M.S.; Esa, F. Aerial fish feeding system. In Proceedings of the 2011 IEEE International Conference on Mechatronics and Automation, Beijing, China, 7–10 August 2011. [Google Scholar]
- Herrera, L.A.; dos Santos, A.P.; de Sousa, O.M.; Kuhnen, V.V.; Sanches, E.G. Performance of common snook subjected to different feeding frequencies and rates using automatic feeders. Pesqui. Agropecuária Bras. 2019, 54, e00225. [Google Scholar] [CrossRef]
- Petridis, D.; Rogdakis, I. The development of growth and feeding equations for seabream, sparus aurata L., culture. Auquc. Res 1996, 27, 413–419. [Google Scholar] [CrossRef]
- Assan, D.; Huang, Y.; Mustapha, U.F.; Addah, M.N.; Li, G.; Chen, H. Fish feed intake, feeding behavior, and the physiological response of apelin to fasting and refeeding. Front. Endocrinol. 2021, 12, 798903. [Google Scholar] [CrossRef] [PubMed]
- Yoon, S.J. Critical low temperature and response of behavioral tolerance in red seabream pagrus major fingerlings exposed to cold shock. J. Korea Acad.-Ind. Coop. Soc. 2021, 22, 575–584. [Google Scholar]
- Llorens, S.; Pérez-Arjona, I.; Soliveres, E.; Espinosa, V. Detection and target strength measurements of uneaten feed pellets with a single beam echosounder. Aquac. Eng. 2017, 78, 216–220. [Google Scholar] [CrossRef]
- Blyth, P.J.; Purser, G.J.; Russell, J.F. Detection of feeding rhythms in sea caged atlantic salmon using new feeder technology. In Fish Farming Technology; CRC Press: Boca Raton, FL, USA, 1993; pp. 209–216. [Google Scholar]


| Frequency | Depth Capability | Operating Supply | Communication Interface |
|---|---|---|---|
| 200/50 kHz | Minimum: 3 feet, 1000 feet or more at 200 kHz, 2500 feet or more at 50 kHz for both shallow and deep-water high resolution | 9.5–16.0 VDC, 0.05 A nominal, 4.7 A peak at max power | RS232, 115,200 bps, serial data USB 1.1 and 2.0 compatible (comes with both USB and RS232) |
| Group | Feeding Method | Average Weight (g) | Number of Fish | Fish Density (kg/m3) | Diameter of Feed (mm) |
|---|---|---|---|---|---|
| Control | Manual | 538.2 ± 19.0 | ~28,000 | 17.8 | 7 |
| Experimental | Algorithm | 506.2 ± 20.2 | ~25,000 | 15.0 | 7 |
| Frequency | Beam Width | Fixed Analog Gain | Depth Range |
|---|---|---|---|
| 200 kHz | 11° | 10 | 0~5 m |
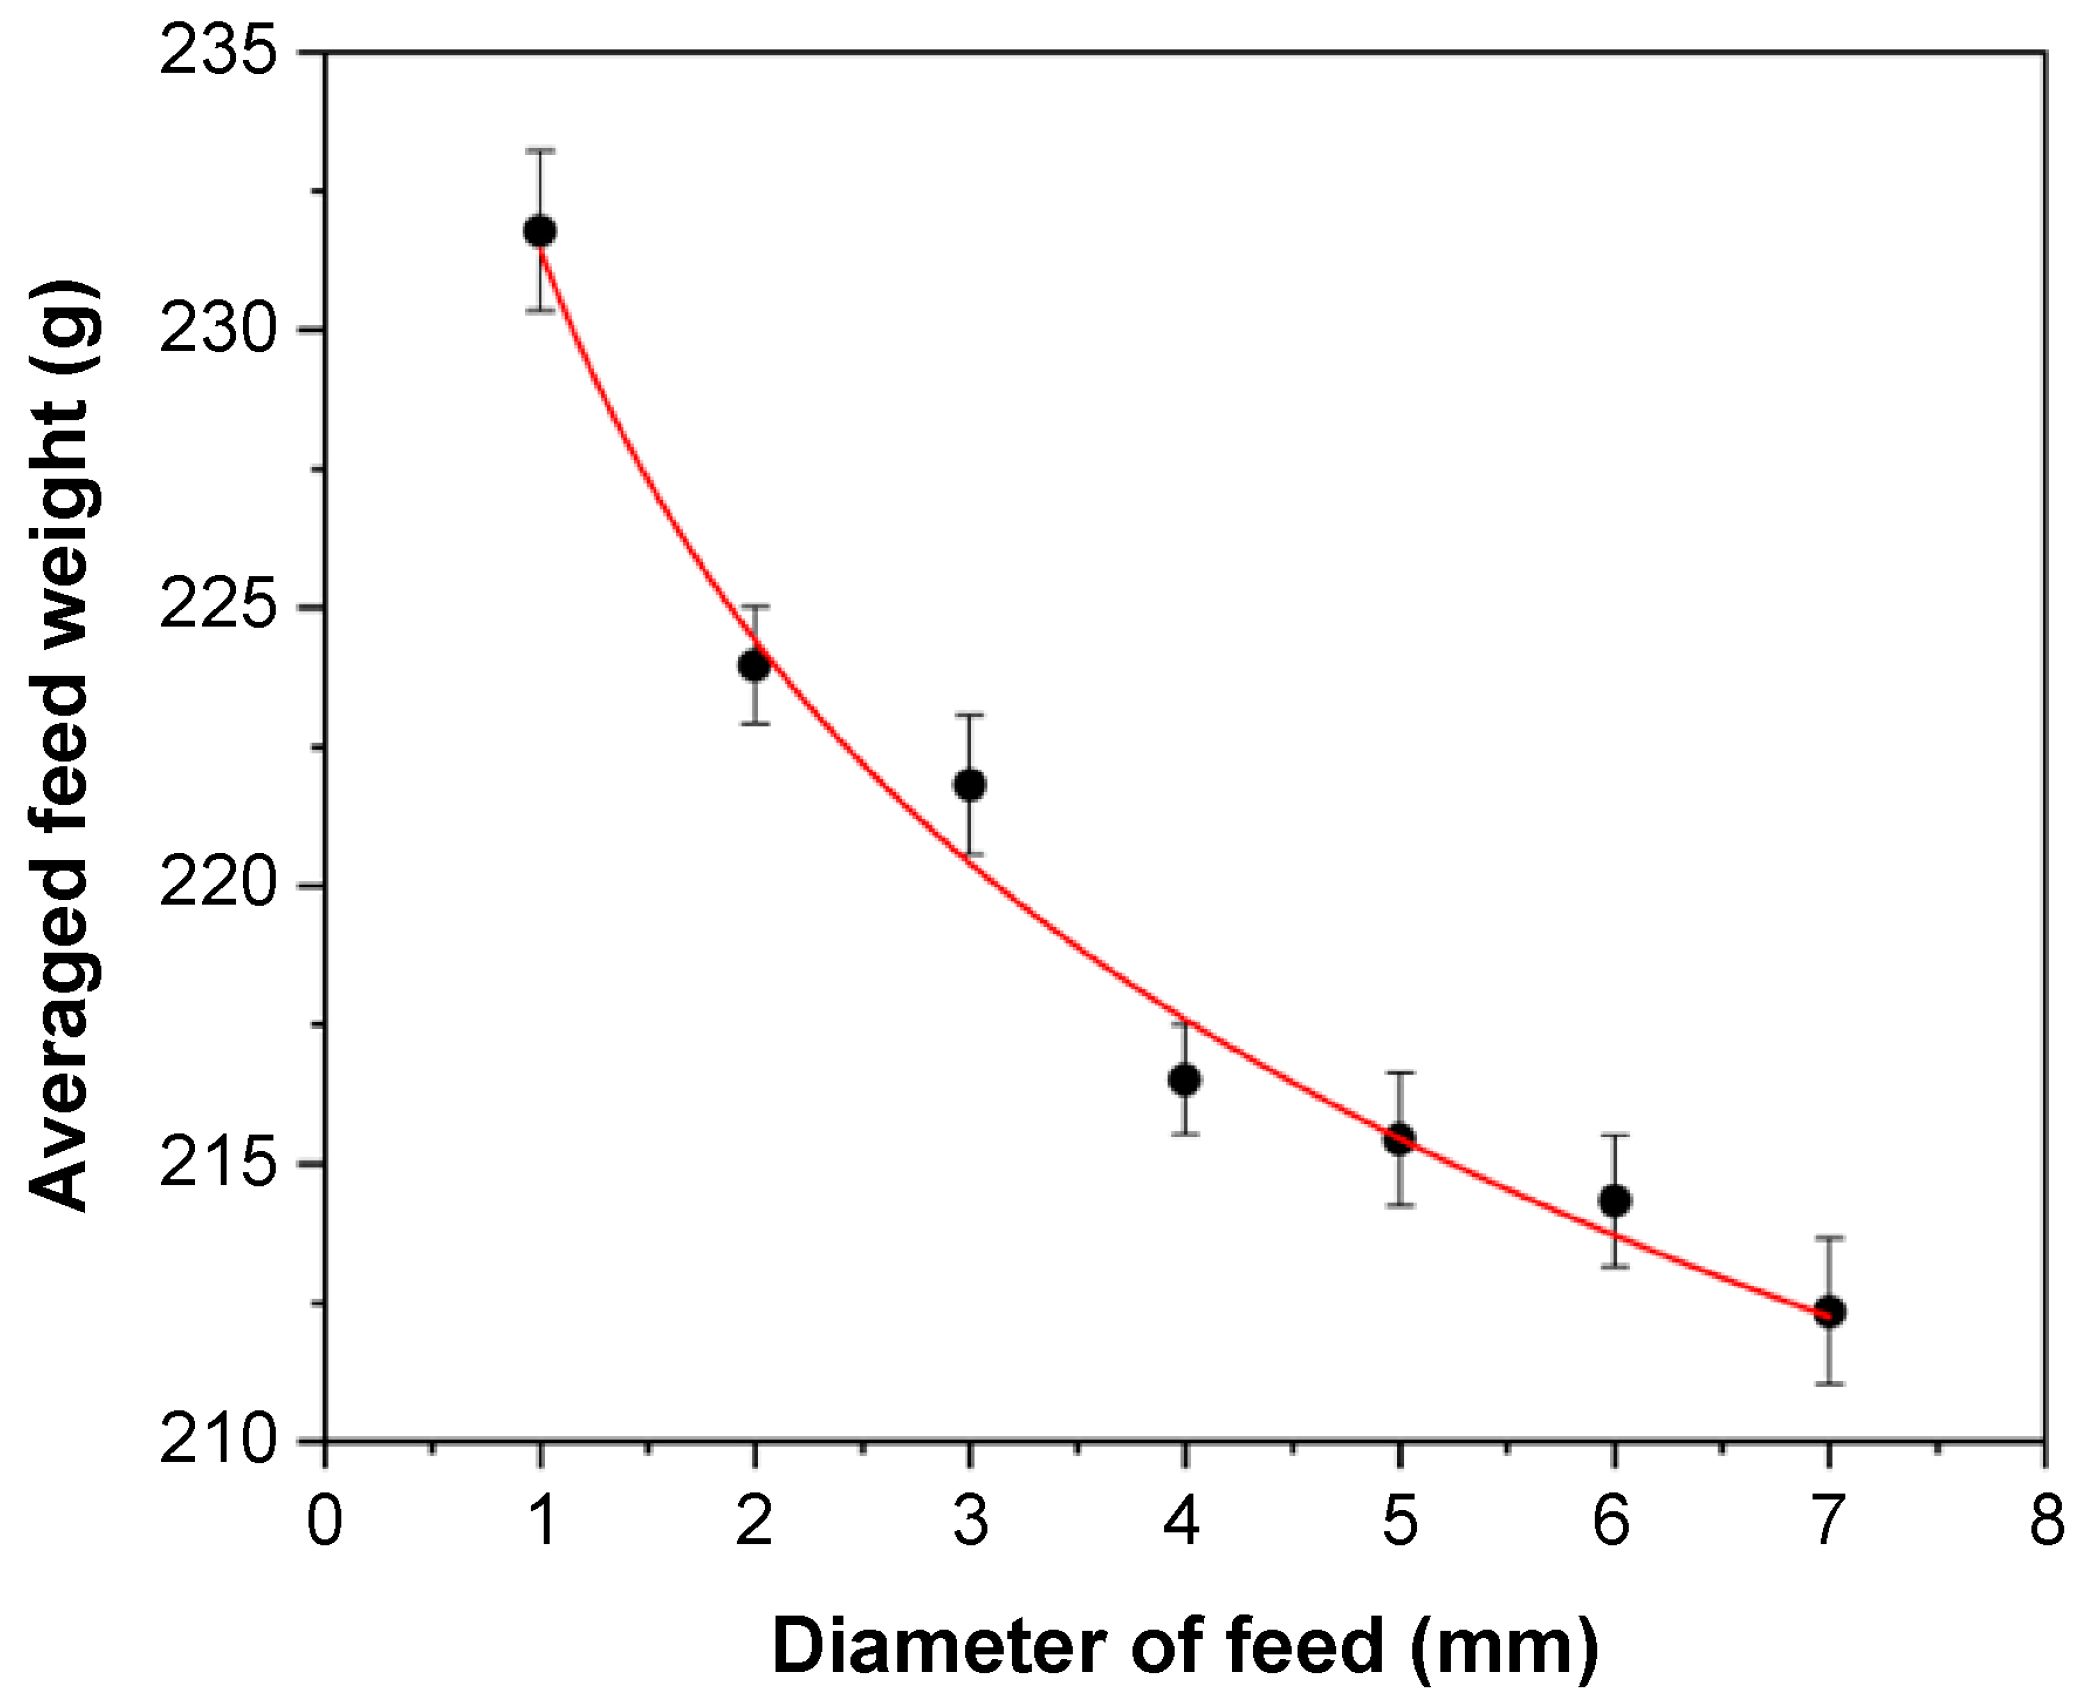
| Equation | a | b | R2 |
|---|---|---|---|
| y = a·xb | 231.41 | −0.043 | 0.986 |
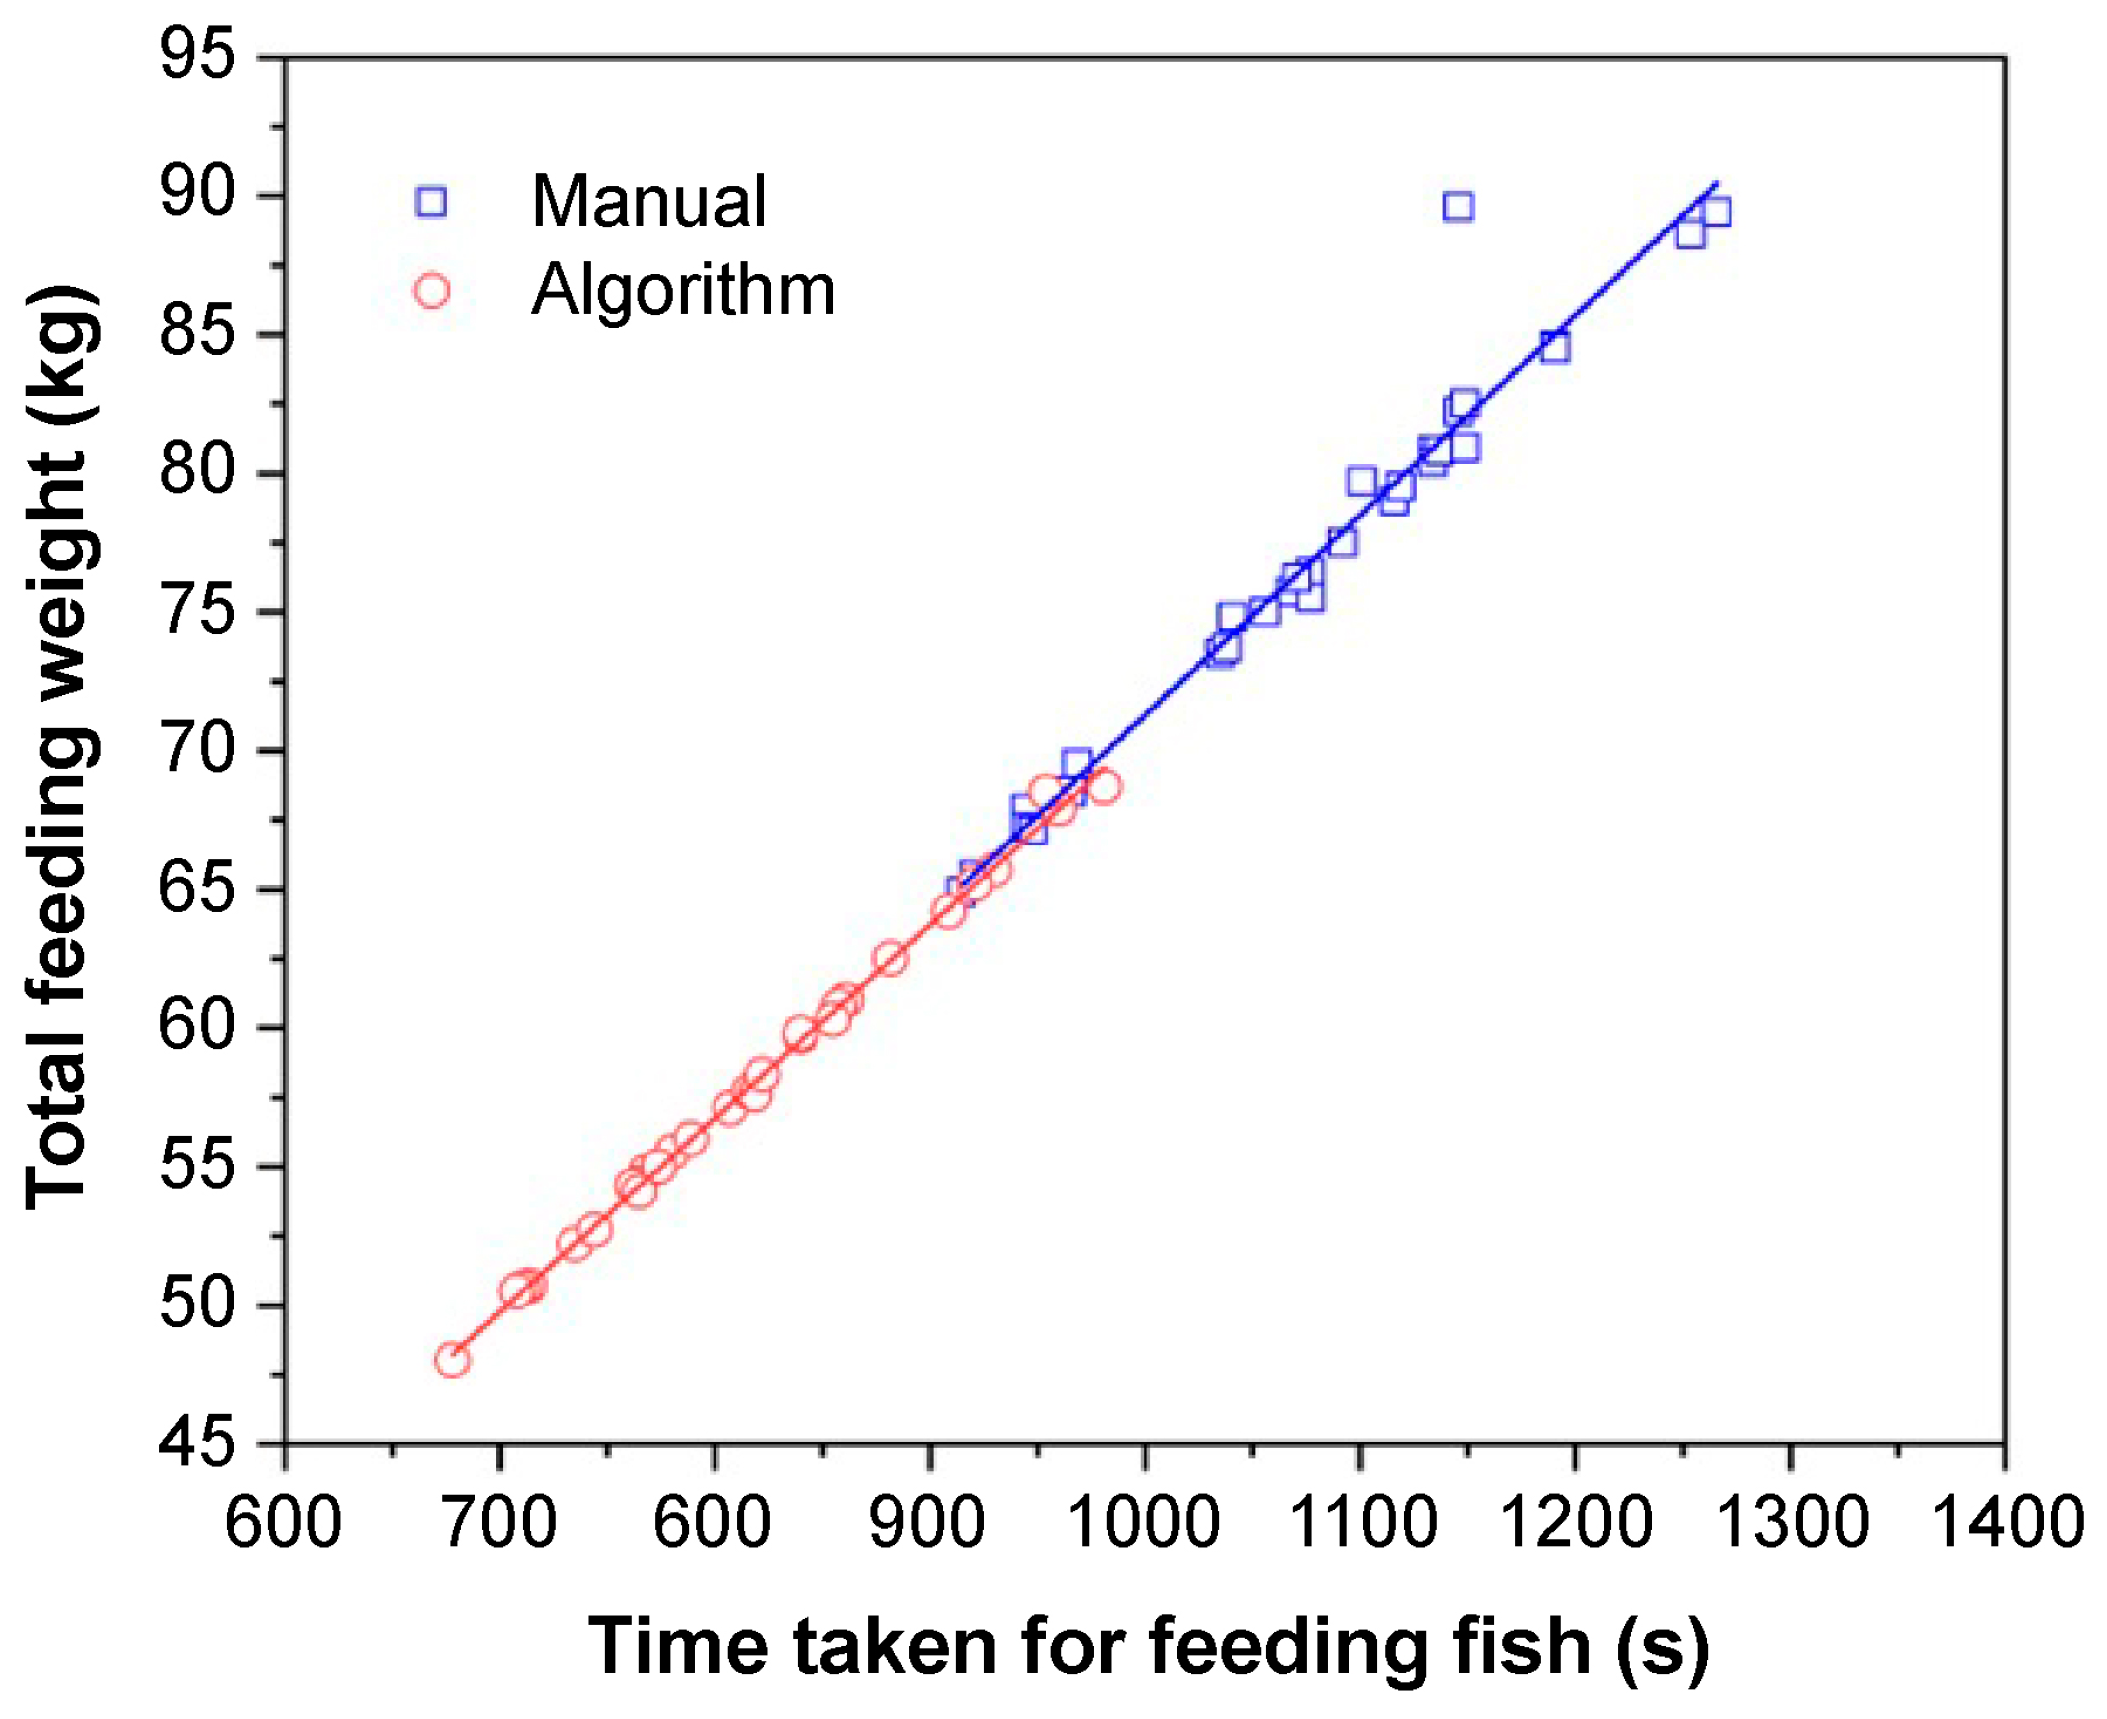
| Total Feeding Weight (kg) | Time Taken for Feeding Fish (s) | Feed Weight Per Second (kg/s) | Equation: y = a·x + b | |||
|---|---|---|---|---|---|---|
| a | b | R2 | ||||
| Manual | 2311.4 | 3239.7 | 0.071 | 0.070 | −0.814 | 0.948 |
| Algorithm | 1743.6 | 24588 | 0.070 | 0.070 | 0.927 | 0.997 |
Disclaimer/Publisher’s Note: The statements, opinions and data contained in all publications are solely those of the individual author(s) and contributor(s) and not of MDPI and/or the editor(s). MDPI and/or the editor(s) disclaim responsibility for any injury to people or property resulting from any ideas, methods, instructions or products referred to in the content. |
© 2023 by the authors. Licensee MDPI, Basel, Switzerland. This article is an open access article distributed under the terms and conditions of the Creative Commons Attribution (CC BY) license (https://creativecommons.org/licenses/by/4.0/).
Share and Cite
Lee, D.; Bae, J.; Lee, K. Development of an Edge Computing-Based Intelligent Feeding System for Observing Depth-Specific Feeding Behavior in Red Seabream. J. Mar. Sci. Eng. 2023, 11, 1767. https://doi.org/10.3390/jmse11091767
Lee D, Bae J, Lee K. Development of an Edge Computing-Based Intelligent Feeding System for Observing Depth-Specific Feeding Behavior in Red Seabream. Journal of Marine Science and Engineering. 2023; 11(9):1767. https://doi.org/10.3390/jmse11091767
Chicago/Turabian StyleLee, Donggil, Jaehyun Bae, and Kyounghoon Lee. 2023. "Development of an Edge Computing-Based Intelligent Feeding System for Observing Depth-Specific Feeding Behavior in Red Seabream" Journal of Marine Science and Engineering 11, no. 9: 1767. https://doi.org/10.3390/jmse11091767