Technical Note

Port Digital Twin Development for Decarbonization: A Case Study Using the Pusan Newport International Terminal

1
Department of Intelligent Mechatronics Engineering, Sejong University, Seoul 05006, Republic of Korea
2
Research Department of Port, Busan Port Authority, Busan 48943, Republic of Korea
*
Author to whom correspondence should be addressed.
J. Mar. Sci. Eng. 2023, 11(9), 1777; https://doi.org/10.3390/jmse11091777
Submission received: 12 August 2023 / Revised: 4 September 2023 / Accepted: 8 September 2023 / Published: 11 September 2023
(This article belongs to the Special Issue Advanced Research on the Sustainable Maritime Transportation)

Abstract

:
The maritime industry is a major carbon emission contributor. Therefore, the global maritime industry puts every effort into reducing carbon emissions in the shipping chain, which includes vessel fleets, ports, terminals, and hinterland transportation. A representative example is the carbon emission reduction standard mandated by the International Maritime Organization for international sailing ships to reduce carbon emissions this year. Among the decarbonization tools, the most immediate solution for reducing carbon emissions is to reduce vessel waiting time near ports and increase operational efficiency. The operation efficiency improvement in maritime stakeholders’ port operations can be achieved using data. This data collection and operational efficiency improvement can be realized using a digital twin. This study develops a digital twin that measures and reduces carbon emissions using the collaborative operation of maritime stakeholders. In this study, the authors propose a data structure and backbone scheduling algorithm for a port digital twin. The interactive scheduling between a port and its vessels is investigated using the digital twin. The digital twin’s interactive scheduling for the proposed model improved predictions of vessel arrival time and voyage carbon emissions. The result of the proposed digital twin model is compared to an actual operation case from the Busan New Port in September 2022, which shows that the proposed model saves over 75 % of the carbon emissions compared with the case.

1. Introduction

1.1. Background

In the face of mounting environmental challenges, one critical issue that has emerged as a defining concern for the maritime industry is decarbonization. The global shipping sector, which is responsible for transporting approximately 90% of the world’s goods, plays a pivotal role in international trade and economic prosperity. However, this essential industry has also been a significant contributor to greenhouse gas emissions and climate change. As the consequences of climate change become increasingly evident, the urgency to address maritime decarbonization is reaching a tipping point. Transitioning toward cleaner, more sustainable practices within the maritime sector has become an imperative shared by governments, industry stakeholders, and environmental advocates alike.
Decarbonization within the maritime industry hinges on the seamless coordination of stakeholders in the shipping supply chain. To achieve this, a system capable of monitoring, sharing, and scheduling the operations of each actor becomes essential. One such system is the digital twin, a concept that holds promise as a suitable system for this purpose.
A digital twin represents a virtual counterpart of a physical object, system, or process. It is continually updated with real-time data from its physical counterpart. The term ‘digital twin’ was first introduced at the SME (Society of Manufacturing Engineering) conference in Troy, Michigan in October 2002 [1]. Initially conceived within the context of product lifecycle management (PLM), the concept evolved over time, transitioning from PLM to the Mirrored Spaces Model, then to the Information Mirroring Model, and finally, in 2010, it assumed the name ‘Digital Twin’ [2]. The strength of digital twins lies in their ability to replicate tasks performed in the physical world, commencing from the support and operational stages of the product life cycle. Unlike physical spaces with a single instance, their power resides in their capacity to manifest an infinite number of instances in the digital realm. Digital twin applications become pertinent when an object system is too complex and vast to construct in a real-scale test facility, thereby mitigating high costs. Examples range from simulating entire cities to ports, airports, and industrial plants. Real-time remote monitoring and effective decision-making are facilitated with the development of digital twin cities (DTCs), underpinned by core technologies such as surveying and mapping, building information modeling, 5G-enabled Internet of Things (IoT), blockchain, and collaborative computing [3]. The concept of DTCs holds the potential to enhance not only urban planning, disaster management, construction, and transportation but also the efficiency and sustainability of logistics, energy consumption, and communication.
Given the colossal scale of maritime shipping chain components, conducting tests for informed decision-making is exceedingly challenging. For instance, when managers at a container terminal seek to experiment with a trial scheme to reduce carbon emissions from vessels berthing at the terminal by developing a berth allocation policy, they face formidable financial barriers to conducting validation tests with real ships and berths, as real-scale operational trials incur substantial costs. In contrast, a digital twin model that can be used for simulation testing is a more cost-effective alternative, requiring only the initial investment to construct the model.
Maritime shipping plays an indispensable role in global trade. However, it also exerts a significant influence on greenhouse gas emissions, which are a primary driver of climate change. In 2018, the International Maritime Organization (IMO) reported that shipping accounted for approximately 2.89% of the global greenhouse gas emissions [4]. As the demand for maritime shipping continues to surge, emissions follow suit, presenting a considerable predicament for the shipping industry. The industry must now seek solutions to curtail emissions while upholding its essential role in global trade. Recent regulations on CO2 emissions have been reinforced on a global scale. To counterbalance the cumulative greenhouse gases released into the atmosphere by numerous vessels, the IMO introduced new CO2 regulations aimed at steering the maritime shipping chain toward “net-zero” emissions during the 80th MEPC (Marine Environment Protection Committee) meeting. Concurrently, the European Union (EU) imposed additional taxes on vessels emitting CO2 while sailing in EU waters.
The significance of digital twins extends beyond shipping and encompasses port infrastructures as well. A port digital twin serves as a digital replica of a physical port in the real world, encompassing vessels, quay cranes, yard tractors, and hinterland transportation. These digital models allow port stakeholders to monitor and forecast operational efficiency in real time, thereby reducing energy consumption and promoting greener port operations. Moreover, digital twins enable the identification of optimal energy efficiency measures using simulation and data analysis, contributing to emissions reduction and the realization of sustainable port operations. Consequently, a port digital twin is recognized as an indispensable element in attaining carbon neutrality at the port level.
In contrast with the conventional berth planning method used in commercial digital port solutions, which does not incorporate real-time data from moving objects such as ships, terminal equipment, and hinterland transportation, the digital twin model proposed in this study leverages current data for real-time-based simulation and decision-making, thus eliminating time delays. This approach enables efficient operation planning using real-time-based simulation and forecasting.
This study implements a port digital twin to reduce CO2 emissions from vessels and terminals. It showcases the simulation model, the data structure, and case studies that compare CO2 reduction performance with and without the developed digital twin. Furthermore, it presents real terminal case results demonstrating carbon emission reductions achieved with the application of the digital twin at the Pusan Newport International Terminal (PNIT).

1.2. Literature Review

A digital twin is a research field wherein a twin of a real-world physical entity is made in digital space. As complexity and integration become defining characteristics of various subsystems, the demand for digital twins continues to grow. Particularly, digital twins are essential for testing and simulating intricate and interconnected operations. Augustine [5] underscored the application of digital twins in diverse projects, including space initiatives and aircraft development. Taylor et al. [6] delineated domains where digital twins are useful, with a focus on the manufacturing sector.
Given the intricate dynamics and large-scale operations involving multiple stakeholders such as shipping companies, terminals, tugboats, pilot boats, hinterland trucks, and port authorities, ports represent ideal environments for implementing digital twins. Recent research efforts have aimed to develop specialized digital twins tailored to the unique requirements of port areas. Hofmann and Branding [7] advocated for the implementation of the Internet of Things (IoT) and cloud-based digital twins to support real-time decision-making in port operations. The International Maritime Organization (IMO) has suggested the adoption of port community systems to enhance communication between ships and ports during recent facilitation committee meetings [8]. The Digital Container Shipping Association (DCSA) and the Maritime & Port Authority of Singapore (MPA) have also bolstered communication infrastructures between ships and ports to reduce CO2 emissions and improve ship arrival and departure efficiency [9]. The digital twin emerges as a pivotal infrastructure for facilitating data exchange between ships and ports, thus enhancing their interaction.
The maritime industry has embraced digital twins as a valuable tool for validation and integrated simulation. For instance, Liu, Zhou et al. [10] applied digital twin tools to analyze variations in ship voyage performance. Stoumpos et al. [11] performed research to develop high-fidelity digital twins as integrated models for modeling dual-fuel engines and ship control systems. Gao et al. [12] harnessed digital twins for automated storage scheduling in container terminals. Wang et al. [13] integrated digital twins into management infrastructure within smart port contexts. Wang, Hu, and Liu [14] asserted that digital twins are apt tools for managing shipping industry processes and outlined their potential application in the smart port concept.
Digital twin technology has also made inroads into the shipbuilding industry, primarily for performance analysis. Fonseca and Gaspar [15] proposed data modeling for digital twin ships. Coraddu et al. [16] estimated ship fouling using a data-driven digital twin model. Danielsen-Haces [17] introduced a comprehensive digital twin model for simulating electricity-driven model vessels. Vasstein [18] proposed a high-fidelity digital twin framework for testing autonomous vessels, while Raza et al. [19] applied digital twins to an application framework for autonomous ship development.
The existing digital twin research has predominantly focused on either ships [10,11,15,16,17,19] or terminal yards [7,12]. Even when digital twins have been proposed for an entire port infrastructure [13,14], they often omit critical interfaces between ships, ports, terminals, and dynamic objects. This study strives to establish a coupled operational digital twin platform that facilitates interaction among vessels, terminal assets, and port authorities. Real-world equipment and situational data from actual ports are harnessed to create a functional port digital twin and its associated simulation algorithm.
Research into port call optimization delves into resolving scheduling challenges between ships and ports. Initiatives such as port collaborative decision-making (PortCDM) and just-in-time arrival (JITA) have aimed to reduce ship, tug, and terminal waiting times. Unfortunately, these concepts have not been widely adopted within the industry due to technical limitations of the digital infrastructure among port members and data standardization issues. Jahn and Scheidweiler [20] sought to optimize port calls by exchanging estimated time of arrivals (ETAs), while Cho et al. [21] proposed the development of a digital infrastructure to facilitate communication and data sharing among port stakeholders.
Ports represent significant hubs for addressing carbon dioxide emissions, given the substantial emissions from various moving objects such as ships, yard tractors, container trailers, and quay cranes. Congestion among these moving objects exacerbates carbon emissions in ports. To mitigate congestion and reduce excessive carbon emissions, seamless communication between these objects becomes paramount. Sarantakos, Bowkett et al. [22] introduced digital infrastructure aimed at improving a port’s carbon emissions profile. Alamoush, Ölçer, and Ballini [23] conducted a review of the existing regulations and incentives for potentially reducing CO2 emissions in port areas. Both the European Union (EU) and the United States have established emission control areas (ECAs) to regulate gas emissions in nearshore and port areas. Additionally, the IMO’s data collection system (DCS) and the EU’s monitoring, reporting, and verification (MRV) framework have been instrumental in monitoring and controlling CO2 emissions.
This study’s prime contribution lies in the application of digital twins within the maritime industry, specifically addressing challenges involving terminals, ships, and tugboats. Most previous berth scheduling models primarily focus on one or two elements, often overlooking complex considerations. For instance, Lu and Le [24] focused on equipment planning in the yard to reduce costs, while Ismail et al. [25] considered the berth’s surroundings in their berth planning. In order to solve an unexpected delay in a ship’s arrival, which affects berth operation plans in addition to terminal conditions, Du, Xu, and Chen [26] solved a berth assignment problem by considering the ship’s delay probabilistically. Their study adjusted the time buffer for each ship and supported planner decision-making with a diagram showing the frequency distribution of the time buffer. Xiang, Liu, and Miao [27] addressed uncertainty in berthing schedules using discrete scenarios and accounting for ship arrival and sailing times. Park, Cho, and Lee [28] introduced time buffers to accommodate uncertain ship arrival times in berth scheduling.
In contrast to previous studies that often treated ship arrival times as probabilistic or inserted time buffers into plans to account for ship and terminal scheduling uncertainties, this study leverages real-time ship location data for accurate ship arrival time prediction and terminal operation data to plan schedules, considering a terminal’s operational status. By collecting real-time data from ships and terminals and incorporating it into schedule planning, this study enhances operational efficiency using dynamic data integration. Compared with previous port call optimization research, this study distinguishes itself by focusing on schedule optimization among ships, terminals, and tugboats, thus encompassing more than just terminal yard scheduling problems.

1.3. Physical Asset in the Real World—Pusan Newport International Container Terminal

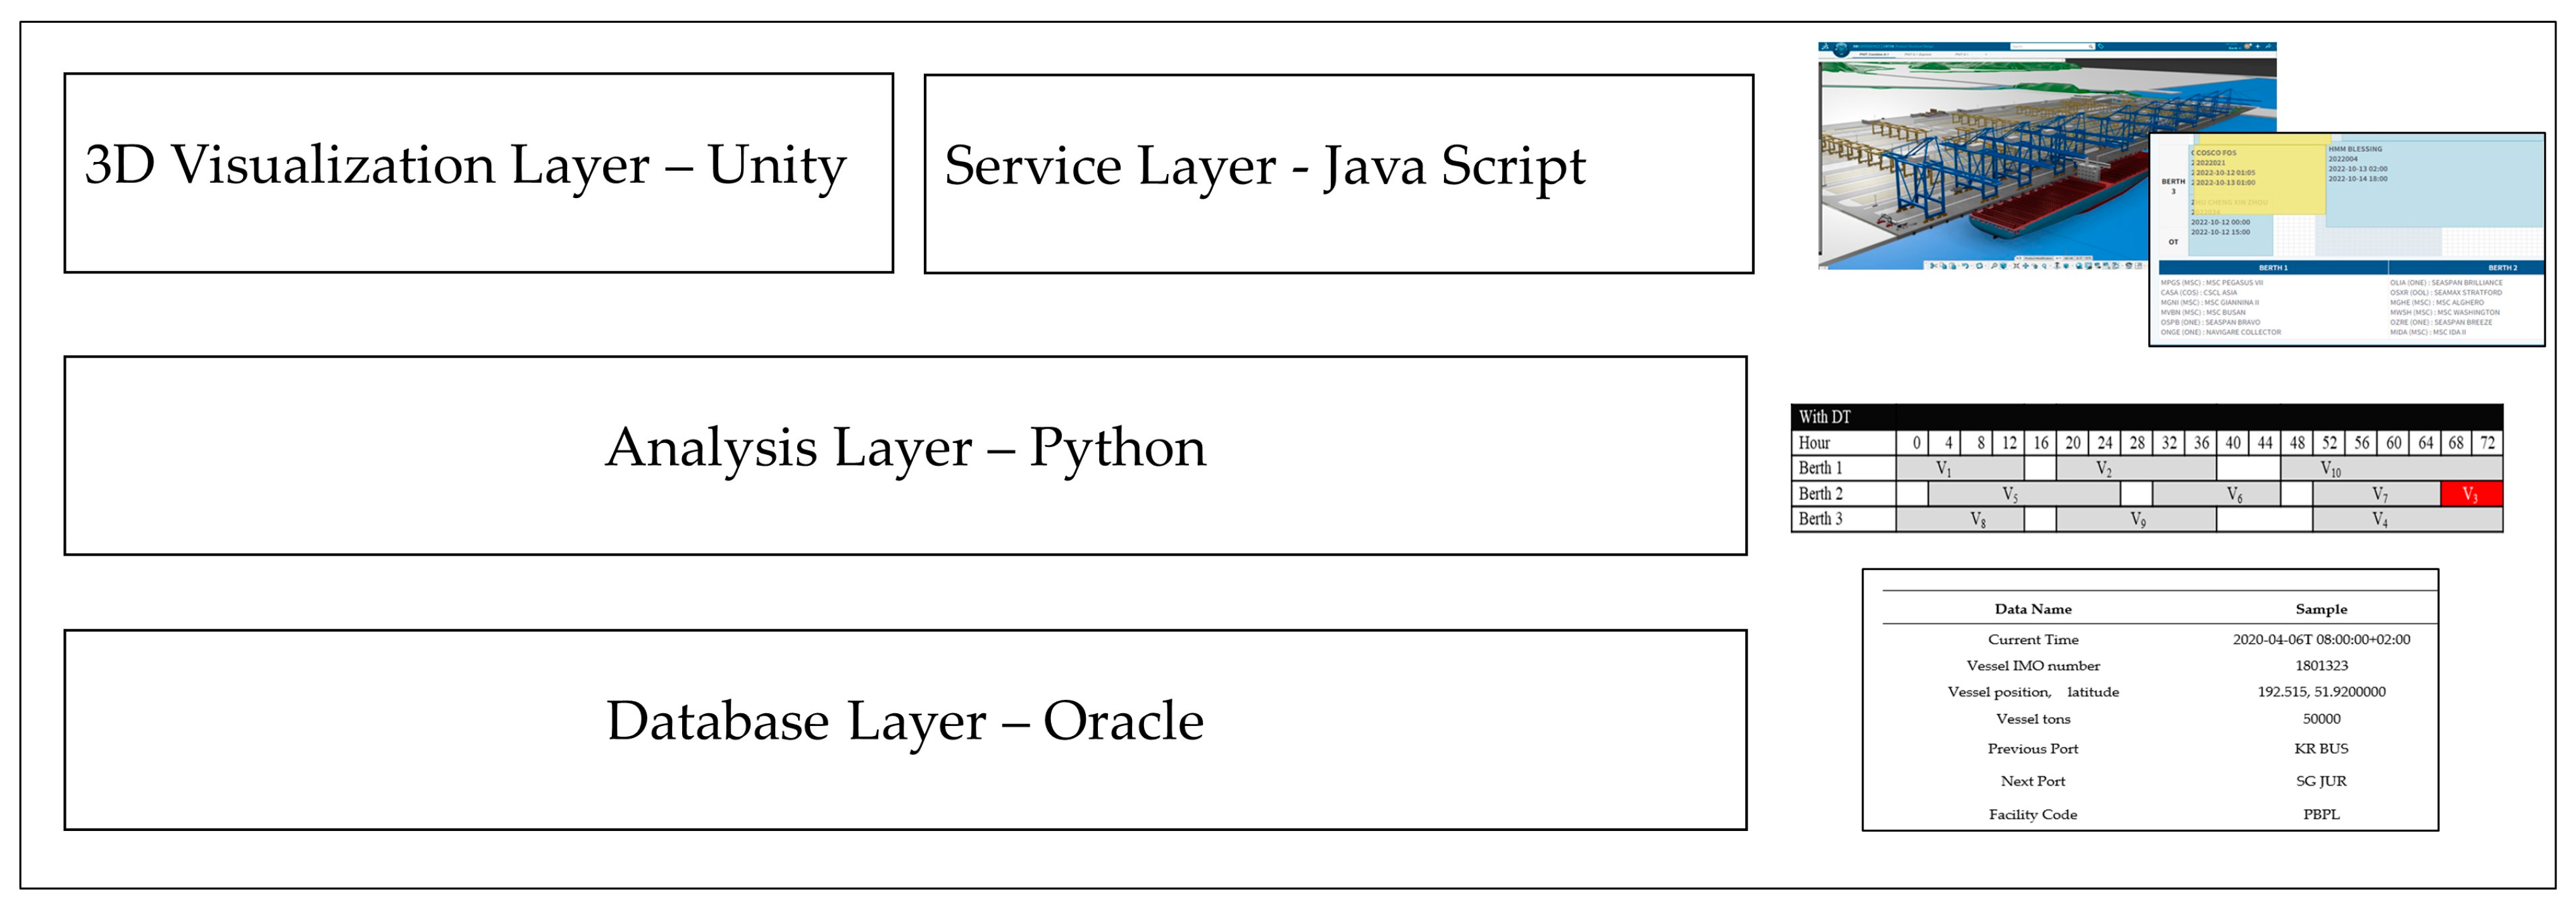
The focus of this study was the Pusan Newport International Terminal (PNIT) located in the Busan New Port of South Korea, which is recognized as the seventh largest container port globally. In 2022, the volume of containers handled at the Busan port amounted to approximately 22 million. To construct a fully operational technical system for the digital twin, real-time operational data from PNIT was harnessed. The development of this system was underpinned by various technologies: Unity for 3D object visualization, the Oracle Database for database management, Java for web application development, and Python for simulation modeling, as illustrated in Figure 1.
Geographic and climatic data, including geometric details, weather forecasts, bathymetry, and static and dynamic elements of PNIT, were transformed into digital representations. Dynamic elements included vessels, quay cranes, yard cranes, yard tractors, and containers, with PNIT typically accommodating 400 vessel arrivals and handling an average of 8,000,000 containers per year. PNIT boasts a 1.2 km quay wall and 27-yard blocks for container stacking. Figure 2 provides an overhead view of the case study, highlighting the PNIT terminal within the broader context of the Busan New Port.
Figure 3 illustrates the outcome of this study, showcasing digitally replicated dynamic elements such as vessels, cranes, containers, buildings, roads, gateways, and trailers.
The initial step in this study involved digitally reproducing all real physical assets within the digital twin model. The selection of these digital assets was driven by their capacity to emulate real-world phenomena. Table 1 lists the digital assets incorporated into the target digital twin.
Figure 4 showcases a representative digital twin model from Table 1, including ships, yard cranes, and quay cranes. Each digital asset’s position, speed, and identification were meticulously recorded within the digital twin. Additionally, each object features a cost model that calculated the performance of the digital twin.
Traditional port system scheduling often operates independently in silos, where the actions of one object do not correspond with others. When delays occur, other related objects can become idle while waiting for congestion to subside, which can exacerbate CO2 emissions. Recognizing this issue, the concept of chained scheduling has been proposed by multiple authors [13,14] to address downtime. For instance, when unexpected delays due to weather or prior port conditions occur, a ship may inform the terminal operator and shipping agent via email. However, if changing the original berth schedule to accommodate the delay is more efficient, but the terminal operator cannot make the change without confirmation from another shipper, it becomes challenging to resolve this issue within the current system. Nevertheless, digital twins (DTs) offer a potential solution. DTs can be accessible to all port members, including the port, terminal, and tug operators. This open platform allows everyone to monitor ship arrivals and departures and share their schedules with others using the DT schedule model. Such a system can serve as a valuable tool for collaborative scheduling among port stakeholders.

2. Materials and Methods

2.1. Analysis Framework

This study proposes a comprehensive five-step framework for the development of a port digital twin model, as depicted in Figure 5. The research formulation for the port’s digital twin is elucidated in Section 2.2, providing insights into the problem formulation and defining the scheduling decision-making problem within the context of the port’s digital twin. Section 2.3 delves into data structure modeling, while Section 2.5.1 explores interactive scheduler modeling, a pivotal development in this study. This section meticulously describes the scheduling interactions among all stakeholders, including ships, tugs, and terminal berth scheduling. In Section 2.5.2, we delve into the visualization aspect of the digital twin. Subsequently, Section 3 highlights a case study that investigates the impact of using the digital twin in port scheduling.
This study offers three significant contributions to its topic. First, it introduces the port digital twin development process, shedding light on the intricacies of its creation. Second, it puts forth a robust data structure and analysis framework essential for facilitating collaborative scheduling aimed at reducing carbon emissions using interconnected scheduling. Third, this study presents a digital twin model that addresses the conventional berth planning problem in operations research. While conventional berth planning research often assumes shipping delays as probability distributions, the developed model can instantaneously resolve berth scheduling based on real-time data concerning the port’s moving objects.

2.2. Problem Formulation

Unexpected delays can lead to additional carbon emissions at a port, as ships must run their generators while waiting at anchor to supply electricity. Furthermore, the time spent waiting at anchor before berthing can result in ship biofouling, increased fuel consumption, and carbon emissions. One common scenario contributing to delays is a shift in ship arrival time, which can be caused by adverse weather conditions or delays in cargo operations at a previous port.
The port of Busan, for example, sees an average delay of at least 4 hours, contributing to additional carbon emissions. Conventional cargo loading and unloading methods exacerbate sequential delays of ships docking at the same berth, further increasing carbon emissions. These unexpected delays could be mitigated by sharing information about delays; however, the current operational method only exchanges arrival time stamps twice before a vessel’s arrival per voyage. In contrast, this study proposes continuous time stamp exchanges, allowing for more frequent communication—every 5 min, leading to 288 communications between ships and the terminal per day under the port digital twin system. This seamless communication enables the early detection of delays for vessels and terminals, ultimately reducing CO2 emissions.
Another significant contribution of this study lies in streamlining the communication process for arrival timestamps. Figure 6 and Figure 7 illustrate the difference between the legacy method and the proposed approach. The legacy port system typically requires three steps to generate ETA (estimated time of arrival), RTA (required time of arrival), and PTA (planned time of arrival). ETA represents the expected arrival time of a vessel at its destination, as reported to the terminal based on the voyage plan. RTA is the time required for a ship to arrive at a berth, as determined by the terminal. PTA is derived from timestamp exchanges between a ship and terminal, signifying a mutually agreed-upon arrival time. In general, the required arrival time forms the basis for contracts between a ship and a terminal. If the ship arrives later than the RTA, demurrage charges may apply.
In contrast, the proposed method simplifies the timestamp decision-making process by combining two optimization problems into one coupled optimization problem that simultaneously determines the timestamps for both a ship and a terminal. This method offers the advantage of considering CO2 reduction for both vessels and terminals, thereby reducing overall CO2 emissions in a port area.
The collaborative time of arrival (CTA) is the timestamp that minimizes overall CO2 emissions by optimizing the arrival times of ships and a terminal’s berth schedule concurrently. The following formulation presents the combined optimization problem based on the mixed integer linear programming (MILP) model for berth planning, which determines the collaborative time of arrival (CTA) that minimizes CO2 emissions for both vessels and terminals. The model’s decision variables encompass ship arrival time at a berth and berthing positions, constituting the berth plan.
  • Decision variables
BTi (i-th vessel’s berth start time) and BPi (i-th vessel’s berth place).
  • Objective function
M i n i m i z e   ( v e s s e l   C O 2 B T i , B P i + t e r m i n a l   C O 2 B P i )
  • Constraints
B T i + d w e l l   t i m e < B T i + 1
B T i < R T A i
where R T A i is the required time of arrival.
0 < B P i < 80
L i < 1200   ( B e r t h   L e n g t h )
where L i is the i-th vessel’s overall length.
H i < H q u a y
where H i is the i-th vessel’s height and H q u a y is the height of the quay crane.
Constraint set (2) ensures that berthing times between vessels do not overlap, and constraint set (3) guarantees that the arrival time can be adjusted by setting the RTA of the ship to be later than the berthing start time. Constraint sets (4)–(6) ensure that the ship can be docked, considering the berthing bitt, the length of the berth, and the height of the quay crane.
  • Objective Function Modeling
e s s e l   C O 2 ( B T i , B P i ) [ t o n ] = ( v o y a g e   C O 2 S i + w a i t i n g   C O 2 B T i W T i )
where S(i) = ship speed = Distance i/( B T i Present Time) and W T i is the waiting time of the i-th vessel.
Ship CO2 modeling was derived from Kim, Son, and Yoon’s works [29,30,31]. The ship cost modeling was based on the objective function of the autonomous vessel’s route decision-making model. RTAi is a constraint in the route decision-making algorithm.
T e r m i n a l   C O 2 ( B P i ) t o n = y a r d   t r a c t o r   C O 2 ( B P i , B P o p t i m a l , i )
where if BPi == BPoptimal,i then =0;
Else, yard tractor CO2 = ∑cargo(j) * (BPiBPoptimal,i);
where cargo(j) is the j-th container cargo.
The calculation for yard tractor CO2 emissions considers the container cargo’s target yard position, which aligns with the vessel’s berth position BPi. To minimize carbon emissions, it is optimal for a ship’s berthing location (BPoptimal,i) and the yard location to be close. However, if a ship’s berthing position changes due to a shift in the berthing order or if berthing does not occur at the optimal position, carbon emissions increase as yard tractors move the container cargo to the target yard position.

2.3. Timestamp Exchanging Using the Port Digital Twin

One of the primary benefits of the digital twin infrastructure is that all stakeholders with access to the digital twin can observe the movements and schedules of other parties in real time. Figure 8 illustrates the main distinction between the proposed digital twin model and the legacy system. The proposed model uses a continuous schedule-sharing approach between a ship and a terminal with satellite communication. In contrast, the legacy system only exchanges timestamps twice per voyage. Consequently, if there is a deviation in the arrival time, it cannot be promptly reflected in the schedule, potentially leading to additional congestion.
A ship’s arrival estimator can provide continuous predictions of the ship’s arrival. The terminal can then create a CO2-minimized schedule based on this real-time estimated time of arrival (ETA). ETA calculations utilize data from the automatic identification system (AIS), environmental forecasts for the voyage route, and historical voyage data [29,30,31]. This research introduces a schedule exchange structure between the ship, terminal, and tug fleet, enabling the schedule optimization process to occur every five minutes, totaling 288 times per day.
In the digital twin model, the primary aim was to establish continuous, intermediate communication among the terminal, ship, and tug fleet. Each party updates its schedule in real time and proactively reacts to changes in the schedule, ensuring that all stakeholders can monitor each other’s movements and plans.
In contrast, the legacy system struggles to deliver changes in the terminal’s berth schedule to the vessel in a timely manner. As a result, the ship cannot adjust its speed during the voyage, leading to additional fuel consumption and excessive CO2 emissions at the port. This is because the ship relies on auxiliary diesel engines to generate electricity for accommodation, and fouling affects its hull. Furthermore, for berth planners, without a digital twin, manually monitoring and updating ship arrival and departure times can be challenging. Consequently, adjusting schedules in the event of delays becomes a complex task. Table 2 summarizes the differences in the schedule optimization methods used by port stakeholders in the legacy model compared to the proposed digital twin (DT) model.

2.4. Data Structure Design

One of the primary contributions of this paper is the proposed data structure for the port’s digital twin. This data structure has the capacity to generate all the necessary schedule decision-making processes required for ship berthing using the digital twin itself. It not only monitors the current movements of all objects within the digital twin but also provides contextual information to predict the next movements of these objects. Figure 9 illustrates the data structure of the digital twin and depicts the relationships among the data. For the sake of brevity, detailed data that can be used to generate a collaborative schedule for the port’s digital twin are summarized in Table 3, Table 4 and Table 5. The complete tables, including all their contents, are provided in Appendix A Table A1, Table A2 and Table A3.
A distinctive feature of the digital twin, particularly in the context of large-scale simulation, is real-time data synchronization. To ensure the validity of real-time data, the digital twin maintains a latency of less than one second, achieved with the use of 5G communication technology among port objects such as vessels, quay cranes, yard cranes, and trailers. Additionally, the primary analysis logic incorporates a function that evaluates the quality of communication among these objects. This seamless communication network for the digital twin, reflecting real-world phenomena, interfaces with the smart ship platform, the terminal operating system, and the truck management system. Satellite communication is used for offshore ship–port communication, while a 5G network is utilized near the shore. Equipment status data, including that from quay cranes (QCs), yard trucks (YTs), yard cranes (YCs), and hinterland trucks, are collected using 5G-RTK (real-time kinematic) global positioning system (GPS) devices. Terminal operation data are periodically retrieved using the terminal operating system (TOS) via the internal network. These datasets are stored in the digital twin’s database at the terminal and inform the decision-making process. Figure 10 provides a visual representation of the data flow and communication method.

2.4.1. Ship Data for the DT Collaborative Scheduler

Table 3 summarizes the data obtained from vessels in the port digital twin. The majority of these data pertain to the voyage. The information in Table 3 serves as the basis for creating the CO2-optimal vessel time schedule.

2.4.2. Terminal Data for the DT Collaborative Scheduler

Table 4 presents data relevant to terminal berth allocation. These data are explained and exemplified, allowing readers to reproduce the berth allocation algorithm in the DT model.

2.5. Digital Twin Development

The port digital twin has four layers: visualization, service, analysis, and database, as presented in Figure 1. The database layer was previously explained in Section 2.4. Therefore, we will delve into the development of the analysis, visualization, and service layers in this section.

2.5.1. Analysis Layer Development—Collaborative Scheduler

For the analysis layer, we focus on the development of the scheduler module, as detailed in this section. The scheduler is the core component responsible for optimizing schedules for vessels, berths, and tugs. The problem formulation for the scheduler was introduced in Section 2.2. Traditionally, scheduling for ships, berths, and tugs has been conducted independently and discretely. In a previous study by Park and Kim [32], ship arrival was treated as an unknown value following a uniform distribution due to the inability to predict real-time vessel arrival estimates. In contrast, this study aims to predict vessel arrival in real time and feed this information to the berth and tug schedulers, enabling real-time schedule optimization.
Previous studies [32,33,34] often assumed ship arrivals followed a probability distribution, resulting in certain delays. Consequently, terminals needed to allocate buffer time to accommodate unexpected arrivals and departure delays. The proposed digital twin (DT) continuously monitors and shares estimated time of arrival (ETA) and estimated time of departure (ETD) data with all stakeholders, eliminating the need for buffer time. This creates opportunities for schedule optimization.
Kim et al. [29] proposed an optimal vessel routing method based on three-dimensional dynamic programming (3DDP). This method allows for the calculation of ETAs, corresponding fuel consumption, and CO2 emissions. The output of the ship schedule optimization is the collaborative time of arrival (CTA), constrained by the required time of arrival (RTA) for berth voyage optimization. Voyage optimization can only select route candidates that meet the RTA condition. The digital twin’s ship scheduling algorithm aims to calculate ship ETA and corresponding fuel consumption, considering a total of 600 vessels that visited the PNIT more than once. The berth plan comprises ETAs of expected vessel arrivals at the PNIT.
The digital twin addresses this challenge using continuous state updates between ships and the terminal. The DT provides information on ship arrival and departure status, as well as terminal berth availability. This enables ships to adjust their speed, while terminal and hinterland transportation can prepare for variable ship arrivals.
  • Vessel Scheduler Optimizer
Ship ETA can be calculated using Equation (9). AIS (automatic identification system) data indicate a vessel’s current position. The remaining distance to the berth location is the remaining distance for the vessel. This study uses the route estimation method developed by Kim and Yoon [29,31], which selects a similar route based on a target vessel’s voyage history. The berth plan is constructed based on real-time vessel positions, eliminating the need for probabilistic assumptions about ship arrival times.
This study proposes a vessel arrival scheduler that minimizes its fuel oil consumption using the following steps:
  • Setting up voyage planning constraints including available berth time (BTi), maximum speed ( S m a x ), weather, and geography.
  • Generating a grid.
  • Assigning weather forecast data to the grid.
  • Determining bathymetry and geo-fencing data.
  • Finding the optimal route based on past voyage history.
  • Calculating the ship’s fuel oil consumption based on route selection.
  • Estimating carbon emissions using fuel consumption data.
BTi = Dremain,i/Soptimal,i
where D r e m a i n , i is the remaining distance of the i-th vessel and S o p t i m a l , i is the optimal speed of the i-th vessel.
Fuel Oil Consumption[ton] = PowerME(Soptimal,i) × SFOCME × VTi + PowerGE(Soptimal,i) × SFOCGE × WTi
where SFOC is specific fuel oil consumption, V T i is the voyage time of the i-th vessel, M E is the main engine, G E is the diesel generator engine, and W T i is the waiting time of the i-th vessel.
C O 2   e m i s s i o n s t o n = F u e l   o i l   c o n s u m p t i o n × C F
where C F is the carbon factor by fuel type [35], as presented in Table 5.
  • Terminal Berth Schedule Optimizer
Berth scheduling involves determining the vessel arrival schedule (BTi) and vessel berth placement (BPi) for coupled optimization of vessels and berths. The result is represented as a berth plan, as shown in Figure 11. A berth plan illustrates the scheduling coordination between vessel arrival time (BTi) and berth location (BPi) in a two-dimensional chart encompassing times and berths. This chart presents vessel allocation within a 72-hour (3-day) period across three berth locations. In Figure 11, the gray squares represent vessel berth assignments, such as V1 berthing at 0 and departing at 12 at Berth 1.
In this study, the berthing plan provides a consolidated schedule for vessels and berths and serves as the final output of the digital twin’s collaborative scheduler. The following steps were undertaken for berth allocation:
  • Extracting the berth plan from the terminal operating system (TOS).
  • Updating real-time ETA for vessels (BTi).
  • Reallocating berthing schedules based on carbon emission considerations for both vessels and terminal facilities.
  • Optimizing vessel berth start time (BTi) and berth location (BPi) once the cost of the terminal plan cost is converged.

2.5.2. Visualization Layer Development

One of the primary objectives of the digital twin is to ensure the visibility of the port’s dynamic objects. In the current port operation system, visibility of all dynamic objects is not provided to the port community members, leading to several accidents. An example of such an incident occurred at the PNC terminal in 2019, as depicted in Figure 12, underscoring the need for real-time object monitoring.
On the other hand, the digital twin offers complete visibility without any shadow zones. It visualizes the real-time movement of dynamic objects such as vessels, cranes, tugs, and containers using real-time location data. AIS (automatic identification system) data are used for vessel location, high-precision RTK (real-time kinematic) GPS data for crane and yard tractor location, and terminal operating system data for container location. UNITY software, a powerful game development platform and engine, was utilized to create the digital twin’s visualization. All objects within the area were modeled using real-scale CAD data.
To bring the DT of the PNIT to life, an area of 625 km² was modeled, encompassing anchorages, the PNIT terminal, and the hinterland. All essential objects for digital twin development, including ships, port geometry, terminal berths, quay cranes, yard cranes, yard tractors, and truck trailers, were modeled with real-scale and real-geometry information.
The digital twin archives the complete history of the moving components of the port during the study period. It is designed to store data for two weeks from a given time and can generate a timeline within two weeks in advance every five minutes. This enables users to analyze past events or forecast future scenarios.
To realize the port’s digital twin, all 36 objects were modeled during development, and Figure 13a showcases examples of 9 of the 36 objects. The object locations are converted into latitude and longitude, and they possess variables reflecting their location at specific time slots based on real CAD layers. These objects not only have physical shapes but also incorporate cost modeling capabilities to calculate port performance and carbon emissions.

2.5.3. Service Layer Development

The digital twin platform includes functions that provide services for stakeholders. The prominent service functions include status monitoring, simulation of different operation schemes, and a guidance system.
  • Monitoring Service
This service enables operators to monitor real-time data of the port’s digital twin objects, including vessels, quay cranes, yard tractors, and tugs. Operators can track the current positions of vessels, berths, cranes, containers, yard tractors, and trailers, as depicted in Figure 14.
The monitoring service of the digital twin provides real-time status updates for vessels, including location, voyage status, and estimated time of arrival (ETA). It also offers a summary of CO2 emissions from various objects, as shown in Figure 15.
  • Simulation
The digital twin’s primary purpose is to evaluate planned scenarios using simulations. Simulations forecasts the future performance of the digital twin and can replay past operation results. One key function is berth planning, which allows terminal operators to compare the efficiency of berth plans, as demonstrated in Figure 16. The sky-blue squares represent the original berth plan, and the yellow squares represent the reallocated berth schedule.
  • Guidance Service
This service offers a safe route and operational guidance for digital twin objects. It provides a recommended route for ships arriving at or departing from berths, thus enhancing safety and reducing the risk of collisions, as seen in Figure 17. The red dotted line indicates the recommended departure route for vessels, while the yellow dotted line indicates the suggested arrival route for vessels. The light green bounding box signifies the anchorage area where ships can anchor. The orange bounding box delineates the pilot embarking area, where pilots board incoming vessel, while the sky blue bounding box delineates the pilot disembarking area, where pilots disembark from departing vessels.

3. Results

This section delves into the operational efficiency changes observed in the proposed DT model using collaborative scheduling in real-world cases. The real-world cases were carefully selected from the operational data from the PNIT (Pusan Newport International Terminal) spanning the month of September 2022. These analysis cases are designed to uncover temporal effects over various timeframes, including the short-term (8 h—one shift), mid-term (24 h—three shifts), and long-term (48 h—six shifts).

3.1. Ship Arrival Estimation Performance

The DT boasts a pivotal function that predicts ship arrival and departure times based on real-time location data and a sophisticated route planning algorithm, as detailed in Section 2. This ship arrival estimation function lays the foundation for collaborative scheduling between vessels and terminals. The accuracy of ship arrival predictions plays a vital role in dynamic berth planning within the DT. Prior to the development of the DT, automatic ship arrival estimation was unavailable, and thus berth planning changes were made after unexpected delays had already occurred. However, with the DT, it is now possible to proactively react to changes in berth planning based on real-time ship arrival predictions.
Of paramount significance is the precision of a vessel’s ETA, as it directly impacts the quality of the berthing schedule. To estimate a ship’s arrival time, this study leveraged historical data, specifically the shortest route taken by vessels from the previous port to PNIT, with reference to AIS historical data. The DT’s ETA predictor provides real-time vessel arrival times, taking into account factors such as a vessel’s current position (AIS), ship size, chosen route, and corresponding weather forecasts. This predictive function allows berth planners to use the DT to anticipate vessel arrival times and adjust berth plans accordingly.
Table 6 below presents a comparison between ETA errors over a three-month period obtained using the conventional method and the proposed DT-based method. The conventional method exhibited an average mean absolute error of 25.1 h, which was calculated using data recorded by ships and stored in the terminal operating system. In contrast, with the introduction of DT data, the ETA prediction accuracy significantly improved, achieving a mean absolute error of only 1.7 h, with a standard deviation of just 0.5 h. Hence, the proposed DT-based method enhanced the ETA by 95%.

3.2. Schedule Optimization and CO2 Emission Quantification

To showcase the performance of the DT application, we used three simulation cases, each addressing unexpected delays at different temporal scales. These scenarios encompassed short-term (Section 3.2.1), mid-term (Section 3.2.2), and long-term (Section 3.2.3) delays. Prior to the DT application, the existing independent scheduling system lacked the ability to adapt to unforeseen delays. Consequently, when vessels experienced delays and deviated from their original schedules, an entire port’s operations, including berth allocation, terminal facilities, and other port activities, came to a halt until the delayed vessel arrived. In contrast, the proposed DT-based berth planner proactively reallocates berth schedules, resulting in improved operational efficiency and reduced overall operating expenses.

3.2.1. Case 1: Short-Term Delay

In Case 1, involving a short-term 8-hour delay, the existing independent scheduling system caused downtime, as illustrated in Figure 18. Without the DT platform, a short-term delay of 8 hours led to a cascade effect, where multiple vessels’ schedules were sequentially delayed within the same timeframe. The upper chart in Figure 18 shows Vessel 3’s 8-hour delay marked in a red box, while the lower chart displays the statuses of Vessel 3 and Vessel 4 after this delay. Vessel 3’s cargo operations start was postponed from the 44th hour to the 52nd hour, and Vessel 4’s cargo operations start was pushed from the 52nd hour to the 60th hour.
However, with the DT platform, Vessel 3’s arrival time was adjusted simultaneously, extending from the 52nd to the 68th hour, as depicted in Figure 19. In this case, Vessel 3 sailed the same distance over the entire duration of its voyage, and the extra time gained, 16 hours, was factored into its schedule. This adjustment allowed Vessel 3 to reduce its speed, as expressed in Equation (12):
V 3 ( r e d u c e d ) = V o y a g e   d i s t a n c e O r i g i n a l   v o y a g e   d u r a t i o n V 3 + 16
where V 3 ( r e d u c e d ) is the reduced vessel speed of Vessel 3.
Figure 19 further demonstrates the berth plan adjustments in response to the short-term delay with and without the DT application. In the absence of the DT, the delayed schedule led to a 4-hour operation stop at Berth 1 between the 44th and 48th hour. Conversely, with the DT, the application reshuffled schedules, resulting in a mere 4-hour delay. This adjustment not only saved 4 hours in terminal berth scheduling but also reduced carbon emissions by 28.01 tons, as detailed in Table 7. Ultimately, the digital twin contributed to a significant reduction of 61.62 tons of CO2 compared with the scenario without its use.
Figure 20 provides a visual representation of the accumulated cost savings, with the DT application significantly reducing costs compared with the scenario without the DT. The delayed scenario without the DT results in a higher cost increase due to from vessel delays.

3.2.2. Case 2: Mid-Term Delay

In Case 2, involving a mid-term 28-hour delay, the independent scheduling system led to downtime, as depicted in Figure 21. Vessel 3 experienced a 28-hour delay, shifting its cargo operation start from the 44th hour to the 72nd hour.
With the DT application, Vessel 3’s arrival time was adjusted from the 44th to the 68th hour, enabling a 24-hour saving achieved by slowing down the vessel’s speed to meet the new required arrival time (68th hour). This speed reduction is expressed in Equation (13):
V 3 ( r e d u c e d ) = V o y a g e   d i s t a n c e O r i g i n a l   v o y a g e   d u r a t i o n V 3 + 24
where V 3 ( r e d u c e d ) represents the reduced vessel speed of Vessel 3.
Figure 22 illustrates the schedule changes implemented using the DT application in the berth plan. The red-colored vessel symbolizes the delay. Without the DT, the ship and berth were both delayed by 28 hours. However, with the DT, the application adjusted the schedules for Vessel 5 and Vessel 3, resulting in Vessel 3 arriving eight hours earlier. This adjustment not only saved Vessel 3 24 hours but also ensured that other vessels expected to arrive at Berth 1 and 2 after 72 hours did not need to wait longer than originally scheduled.
Table 8 and Figure 23 provide insights into the CO2 emissions in cases with and without the DT. The DT application substantially reduced CO2 emissions by 173.66 tons compared with the scenario without the DT. These findings highlight the substantial benefits of applying the digital twin, particularly in scenarios involving extended waiting times.

3.2.3. Case 3: Long-Term Delay

The final case entails a 48-hour delay, as depicted in Figure 24, which showcases the schedule changes implemented using the DT application. Without the DT, Vessel 2 was delayed by 48 hours, resulting in a corresponding delay in the berth scheduling. After the DT application changed the plan, the schedules for Vessel 5, Vessel 7, Vessel 8, and Vessel 2 were modified and reassigned.
Figure 25 and Table 9 illustrate the accumulated CO2 emissions in cases with and without the DT. The DT application achieved a remarkable reduction of 313.69 tons of CO2 emissions compared with the scenario without the DT. These results emphasize the exponential benefits of the digital twin, particularly in scenarios involving extended waiting times. These findings indicate that as the duration of vessel arrival delays increases, the benefits of the DT application become increasingly pronounced.

4. Discussion

In this study, we pioneered the development of a port digital twin model that caters to the diverse needs of port stakeholders, including vessels, tugs, and terminals, with the primary goal of optimizing plans and operations within container terminals. Our digital twin model proved to be capable of not only measuring but also significantly reducing carbon emissions stemming from vessels, terminal operations, and hinterland trucks, all while fostering collaborative and efficient maritime operations. The implications of this research hold profound significance for the shipping industry.
The digital twin model we created meticulously replicates the intricate decision-making processes involved in vessel arrivals and departures. Prior to our work, traditional methods for planning berth schedules, often reliant on statistical distributions of delays, struggled to predict vessel delays accurately. In stark contrast, our study introduces a novel data structure and a robust scheduling algorithm to form the backbone of our port digital twin. This innovation brings forth interactive scheduling capabilities between the port and vessels, thereby drastically enhancing our ability to predict vessel arrival times and reduce the carbon footprint associated with maritime voyages.
To validate the efficacy of our proposed digital twin model, we conducted a meticulous comparison with actual operational data from the studied terminal, focusing on September 2022. Using three compelling case studies, we demonstrated that our digital twin technology can reduce CO2 emissions by an impressive average of 77.33% when compared with conventional independent scheduling systems. In absolute terms, this translates to an average reduction of 171.78 tons of CO2 emissions. Consequently, the DT platform emerges as a formidable tool in the pursuit of reducing wait times for ships and port-related carbon emissions.
The performance of our model in ship arrival estimation and optimal scheduling is truly remarkable, boasting a 95% decrease in estimation errors when compared with conventional non-digital twin methods. Furthermore, our research delved into the digital twin’s schedule optimization performance under variable conditions. We explored three distinctive scenarios, encompassing short-term, mid-term, and long-term delays, which allowed us to quantify the DT’s schedule optimization capabilities using CO2 reduction metrics. In the short term, we achieved a 75% reduction in CO2 emissions, while in the mid-term, this reduction amounted to 77%. Notably, the long-term scenario exhibited an astonishing 80% reduction in CO2 emissions when compared with legacy systems. In absolute terms, this translated to substantial reductions of 28.01 tons in the 8-hour delay case, 173.66 tons in the 24-hour delay case, and a remarkable 313.69 tons in the 48-hour delay case. This empirical validation underscores the digital twin’s potential as a versatile tool for replicating current operations and optimizing schedules across port stakeholders.
Our proposed DT model, which encompasses crucial data components for vessel and berth scheduling, naturally positions itself as a potential backbone for autonomous operations within the maritime supply chain. This vision includes autonomous vessel arrivals and port operations, revolutionizing the way we envision maritime logistics and operations in the future.
In future studies, we envision using advanced optimization algorithms such as particle swarm optimization (PSO) to further enhance ship and port operational efficiency. Moreover, achieving pinpoint accuracy in predicting ship port arrival times remains a pivotal focus, and we will explore methods to enhance this accuracy further, leveraging real-time AIS data for precise ship ETA predictions. These endeavors hold immense promise for the continued advancement and transformation of the shipping industry in the digital era.

Author Contributions

Conceptualization, S.-W.K.; methodology, J.-O.E.; software, J.-H.Y. (Jeong-Hyun Yoon); validation, S.-W.K. and J.-H.Y. (Jeong-Hum Yeon); formal analysis, S.-W.K.; resources, S.-W.K.; data curation, J.-H.Y. (Jeong-Hyun Yoon) and J.-O.E.; writing—original draft preparation, S.-W.K.; writing—review and editing, S.-W.K., J.-O.E. and J.-H.Y. (Jeong-Hyun Yoon); visualization, J.-H.Y. (Jeong-Hum Yeon); supervision, S.-W.K.; funding acquisition, S.-W.K. All authors have read and agreed to the published version of the manuscript.

Funding

This research was supported by Korea Institute of Marine Science & Technology Promotion (KIMST) funded by the Ministry of Oceans and Fisheries (RS-2023-00256127).

Conflicts of Interest

The authors declare no conflict of interest.

Acronym

PNITPusan Newport International Terminal
JITAjust-in-time arrival
ETAestimated time of arrival
ETDestimated time of departure
CTAcollaborative time of arrival
PTAplanned time of arrival
PTDplanned time of departure
RTArequired time of arrival
RTDrequired time of departure
PBPpilot boarding place
ETA PBPestimated time of arrival at pilot boarding place
RTA PBPrequired time of arrival at pilot boarding place
PTA PBPplanned time of arrival at pilot boarding place
ETCestimated time of completion
ETSestimated time of service
ATDactual time of departure
ETD PBPestimated time of departure at pilot boarding place
RTD PBPrequired time of departure at pilot boarding place
ATD PBPactual time of departure at pilot boarding place
ATA PBPactual time of departure at pilot boarding place
YTyard tractor
YCyard crane
QCquay crane
TUGtug vessel
DTdigital twin
AISautomatic identification system
TOSterminal operating system
Port MISPort Maritime Information System
IMOInternational Maritime Organization
DCSADigital Container Shipping Association
MRVmonitor, report, and verification
CO2carbon dioxide
MEPCMarine Environment Protection Committee
PortCDMport collaborative decision-making
RTKreal-time kinematic

Appendix A. Data for the DT Collaborative Scheduler

Table A1. Ship data for the DT collaborative scheduler (Table 3).
Data NameSampleStandard
Current time 2020-04-06T 08:00:00 + 02:00ISO8601
Vessel IMO number1801323IMO
Vessel position, latitude 192.515, 51.9200000ISO 6709:2008
Vessel tons50,000Gross ton
Previous portKR BUSUN location code
Next portSG JURUN location code
Facility codePBPLDCSA
ETA BERTH2020-04-06T 08:00:00 + 02:00ISO8601
ETA PBP2020-04-06T 08:00:00 + 02:00ISO8601
EmissionTonCarbon content
Berth locationBerth NR5
Voyage typeCargo
Vessel typeContainer
Crew number10Integer
Tug usageYes
PilotYes
No-go zone in port 192.515, 51.9200000ISO15016
Wind speedm/sISO15016
Wind directionDegreeISO15016
Wave height MISO15016
Wave direction degreeISO15016
Current speedm/sISO15016
Current direction DegreeISO15016
Route candidate information192.515, 51.9200000
ISO 6709:2008
Optimal route information(192.515, 51.920, speed, direction, time)ISO 6709:2008
Table A2. Terminal data for the DT collaborative scheduler (Table 4).
Data NameSampleStandard
Current time 2020-04-06T 08:00:00 + 02:00ISO8601
Vessel IMO number1801323IMO
Vessel tons50,000Gross ton
Previous portKR BUSUN location code
Next portSG JURUN location code
Facility codePBPLDCSA
ETA BERTH/ ETD berth2020-04-06T 08:00:00 + 02:00ISO8601
ETA PBP/ETD PBP2020-04-06T 08:00:00 + 02:00ISO8601
EmissionTonCarbon content
Berth locationBerth NR5
Operation expenditure Korean won
Berth air draft50 m
Berth depth −25 m
Bitt number0~110
Yard tractor costKorean won
Quay crane capacity 30TEU/h
Weight factor Constant
Table A3. Ship data for DT collaborative scheduler (Table 5).
Data NameSampleStandard
Current time 2020-04-06T 08:00:00 + 02:00ISO8601
Vessel IMO number1801323IMO
Vessel tons50,000Gross ton
Previous portKR BUSUN location code
Next portSG JURUN location code
Facility codePBPLDCSA
ETA BERTH/ ETD berth2020-04-06T 08:00:00 + 02:00ISO8601
ETA PBP/ETD PBP2020-04-06T 08:00:00 + 02:00ISO8601
Tug allocation result (number)1~8
Tug unit cost Korean won/h

References

  1. Grieves, M. Completing the Cycle: Using PLM Information in the Sales and Service Functions [Slides]; SME Management Forum: Plymouth, MI, USA, 2002. [Google Scholar]
  2. Grieves, M.W. Digital Twins: Past, Present, and Future. In The Digital Twin; Springer: Berlin/Heidelberg, Germany, 2023; pp. 97–121. [Google Scholar]
  3. Deng, T.; Zhang, K.; Shen, Z.-J.M. A systematic review of a digital twin city: A new pattern of urban governance toward smart cities. J. Manag. Sci. Eng. 2021, 6, 125–134. [Google Scholar] [CrossRef]
  4. Joung, T.-H.; Kang, S.-G.; Lee, J.-K.; Ahn, J. The IMO initial strategy for reducing Greenhouse Gas (GHG) emissions, and its follow-up actions towards 2050. J. Int. Marit. Saf. Environ. Aff. Shipp. 2020, 4, 1–7. [Google Scholar] [CrossRef]
  5. Augustine, P. The industry use cases for the digital twin idea. In Advances in Computers; Elsevier: Amsterdam, The Netherlands, 2020; Volume 117, pp. 79–105. [Google Scholar]
  6. Taylor, N.; Human, C.; Kruger, K.; Bekker, A.; Basson, A. Comparison of digital twin development in manufacturing and maritime domains. In Service Oriented, Holonic and Multi-Agent Manufacturing Systems for Industry of the Future: Proceedings of SOHOMA 2019; Springer: Berlin/Heidelberg, Germany; pp. 158–170.
  7. Hofmann, W.; Branding, F. Implementation of an IoT-and cloud-based digital twin for real-time decision support in port operations. IFAC-Pap. 2019, 52, 2104–2109. [Google Scholar] [CrossRef]
  8. Facilitation Committee (FAL), 47th session, 13–17 March 2023. Available online: https://www.imo.org/en/MediaCentre/MeetingSummaries/Pages/FAL-47th-session.aspx (accessed on 12 August 2023).
  9. DCSA. Just-in-Time Port Call. Available online: https://dcsa.org/standards/jit-port-call/ (accessed on 12 August 2023).
  10. Liu, M.; Zhou, Q.; Wang, X.; Yu, C.; Kang, M. Voyage performance evaluation based on a digital twin model. In IOP Conference Series: Materials Science and Engineering; IOP Publishing: Bristol, UK, 2020; p. 012027. [Google Scholar]
  11. Stoumpos, S.; Theotokatos, G.; Mavrelos, C.; Boulougouris, E. Towards marine dual fuel engines digital twins—Integrated modelling of thermodynamic processes and control system functions. J. Mar. Sci. Eng. 2020, 8, 200. [Google Scholar] [CrossRef]
  12. Gao, Y.; Chang, D.; Chen, C.-H.; Xu, Z. Design of digital twin applications in automated storage yard scheduling. Adv. Eng. Inform. 2022, 51, 101477. [Google Scholar] [CrossRef]
  13. Wang, K.; Hu, Q.; Zhou, M.; Zun, Z.; Qian, X. Multi-aspect applications and development challenges of digital twin-driven management in global smart ports. Case Stud. Transp. Policy 2021, 9, 1298–1312. [Google Scholar] [CrossRef]
  14. Wang, K.; Hu, Q.; Liu, J. Digital twin-driven approach for process management and traceability towards ship industry. Processes 2022, 10, 1083. [Google Scholar] [CrossRef]
  15. Fonseca, Í.A.; Gaspar, H.M. Challenges when creating a cohesive digital twin ship: A data modelling perspective. Ship Technol. Res. 2021, 68, 70–83. [Google Scholar] [CrossRef]
  16. Coraddu, A.; Oneto, L.; Baldi, F.; Cipollini, F.; Atlar, M.; Savio, S. Data-driven ship digital twin for estimating the speed loss caused by the marine fouling. Ocean Eng. 2019, 186, 106063. [Google Scholar] [CrossRef]
  17. Danielsen-Haces, A. Digital Twin Development—Condition Monitoring and Simulation Comparison for the ReVolt Autonomous Model Ship. Master’s Thesis, Norwegian University of Science and Technology, Trondheim, Norway, 2018. [Google Scholar]
  18. Vasstein, K. A High Fidelity Digital Twin Framework for Testing Exteroceptive Perception of Autonomous Vessels. Master’s Thesis, NTNU, Trondheim, Norway, 2021. [Google Scholar]
  19. Raza, M.; Prokopova, H.; Huseynzade, S.; Azimi, S.; Lafond, S. Towards integrated digital-twins: An application framework for autonomous maritime surface vessel development. J. Mar. Sci. Eng. 2022, 10, 1469. [Google Scholar] [CrossRef]
  20. Jahn, C.; Scheidweiler, T. Port call optimization by estimating ships’ time of arrival. In Proceedings of Dynamics in Logistics: Proceedings of the 6th International Conference LDIC 2018, Bremen, Germany, 17 February 2018; Springer: Berlin/Heidelberg, Germany, 2018; pp. 172–177. [Google Scholar]
  21. Cho, J.; Craig, B.; Hur, M.; Lim, G.J. A novel port call optimization framework: A case study of chemical tanker operations. Appl. Math. Model. 2022, 102, 101–114. [Google Scholar] [CrossRef]
  22. Sarantakos, I.; Bowkett, A.; Allahham, A.; Sayfutdinov, T.; Murphy, A.; Pazouki, K.; Mangan, J.; Liu, G.; Chang, E.; Bougioukou, E. Digitalization for Port Decarbonization: Decarbonization of key energy processes at the Port of Tyne. IEEE Electrif. Mag. 2023, 11, 61–72. [Google Scholar] [CrossRef]
  23. Alamoush, A.S.; Ölçer, A.I.; Ballini, F. Ports’ role in shipping decarbonisation: A common port incentive scheme for shipping greenhouse gas emissions reduction. Clean. Logist. Supply Chain 2022, 3, 100021. [Google Scholar] [CrossRef]
  24. Lu, Y.; Le, M. The integrated optimization of container terminal scheduling with uncertain factors. Comput. Ind. Eng. 2014, 75, 209–216. [Google Scholar] [CrossRef]
  25. Ismail, T.; Elbeheiry, M.; Elkharbotly, A.; Afia, N.; Abdalla, K. Continuous Berth Scheduling in Port Terminals. Int. J. Eng. Res. Technol. 2016, 5, 531–535. [Google Scholar]
  26. Du, Y.; Xu, Y.; Chen, Q. A feedback procedure for robust berth allocation with stochastic vessel delays. In Proceedings of the 2010 8th World Congress on Intelligent Control and Automation, Jinan, China, 7–9 July 2010; pp. 2210–2215. [Google Scholar]
  27. Xiang, X.; Liu, C.; Miao, L. A bi-objective robust model for berth allocation scheduling under uncertainty. Transp. Res. E Logist. Transp. Rev. 2017, 106, 294–319. [Google Scholar] [CrossRef]
  28. Park, H.J.; Cho, S.W.; Lee, C. Particle swarm optimization algorithm with time buffer insertion for robust berth scheduling. Comput. Ind. Eng. 2021, 160, 107585. [Google Scholar] [CrossRef]
  29. Kim, S.; Jang, H.; Cha, Y.; Yu, H.; Lee, S.; Yu, D.; Lee, A.; Jin, E. Development of a ship route decision-making algorithm based on a real number grid method. Appl. Ocean Res. 2020, 101, 102230. [Google Scholar] [CrossRef]
  30. Son, J.; Kim, D.-H.; Yun, S.-W.; Kim, H.-J.; Kim, S. The development of regional vessel traffic congestion forecasts using hybrid data from an automatic identification system and a port management information system. J. Mar. Sci. Eng. 2022, 10, 1956. [Google Scholar] [CrossRef]
  31. Yoon, J.-H.; Kim, D.-H.; Yun, S.-W.; Kim, H.-J.; Kim, S. Enhancing Container Vessel Arrival Time Prediction through Past Voyage Route Modeling: A Case Study of Busan New Port. J. Mar. Sci. Eng. 2023, 11, 1234. [Google Scholar] [CrossRef]
  32. Park, Y.-M.; Kim, K.H. A scheduling method for berth and quay cranes. OR Spectr. 2003, 25, 1–23. [Google Scholar] [CrossRef]
  33. Kim, K.H.; Moon, K.C. Berth scheduling by simulated annealing. Transp. Res. B Methodol. 2003, 37, 541–560. [Google Scholar] [CrossRef]
  34. Park, K.; Kim, K.H. Berth scheduling for container terminals by using a sub-gradient optimization technique. J. Oper. Res. Soc. 2002, 53, 1054–1062. [Google Scholar] [CrossRef]
  35. Bayraktar, M.; Yuksel, O. A scenario-based assessment of the energy efficiency existing ship index (EEXI) and carbon intensity indicator (CII) regulations. Ocean Eng. 2023, 278, 114295. [Google Scholar] [CrossRef]
  36. Team, P.T. Mega-Ship Questions Raised after ONE Vessel Crashes in Busan; Port Technology International: London, UK, 2020. [Google Scholar]
Figure 1. Port digital twin structure and implementation.
Jmse 11 01777 g001
Figure 2. Layout of the Pusan Newport International Terminal (PNIT).
Jmse 11 01777 g002
Figure 3. The digital twin of PNIT.
Jmse 11 01777 g003
Figure 4. Digital twin subjects.
Jmse 11 01777 g004
Figure 5. Schematic diagram showing the research methodology.
Jmse 11 01777 g005
Figure 6. Arrival timestamp decision process of a legacy system.
Jmse 11 01777 g006
Figure 7. Collaborative scheduling of the digital twin.
Jmse 11 01777 g007
Figure 8. Communication scheme difference between the legacy system and digital twin.
Jmse 11 01777 g008
Figure 9. Database structure for a digital twin.
Jmse 11 01777 g009
Figure 10. Data flow method used in the digital twin.
Jmse 11 01777 g010
Figure 11. A sample berth plan.
Jmse 11 01777 g011
Figure 12. Ship and quay crane collision in Pusan New Port [36].
Jmse 11 01777 g012
Figure 13. (a) Examples of digital twin objects. (b) Bird’s eye view of the digital twin.
Jmse 11 01777 g013
Figure 14. Graphic user interface of a monitoring service.
Jmse 11 01777 g014
Figure 15. Vessel arrival monitoring service in the DT.
Jmse 11 01777 g015
Figure 16. Berth plan using the DT simulation function.
Jmse 11 01777 g016
Figure 17. Guidance service.
Jmse 11 01777 g017
Figure 18. Separated operation without the digital twin—short-term delay case.
Jmse 11 01777 g018
Figure 19. Berthing plan—short-term delay case.
Jmse 11 01777 g019
Figure 20. Accumulated delay costs—short-term delay case.
Jmse 11 01777 g020
Figure 21. Separated operation without the DT—mid-term delay case.
Jmse 11 01777 g021
Figure 22. Berthing plan—mid-term delay case.
Jmse 11 01777 g022
Figure 23. Accumulated delay costs—mid-term delay case.
Jmse 11 01777 g023
Figure 24. Berthing plan—long-term delay case.
Jmse 11 01777 g024
Figure 25. Accumulated delay costs—long-term delay case.
Jmse 11 01777 g025
Table 1. Digital twin model.
Digital AssetsNumberDetail
Ship600200~10,000 TEU container carrier
Quay crane12Outreach 65~70 m
Yard crane426 TEU height
Tug810 m length
Yard tractor82220 horsepower (HP)
Container20,000/day20 ft, 40 ft container
Truck10020 ft, 40 ft trailer
Area625 km2Yard, anchorage, and hinterland
Table 2. Schedule optimization method.
EntityWithout DT (Legacy Model)With DT (Proposed Model)
ShipETAs updated twice
during the voyage
Collaborative time of arrival generated every five minutes during the voyage
TerminalFirst-come-first-serveMixed integer linear programming
TugFirst-come-first-serveMixed integer linear programming
Table 3. Ship data for the DT collaborative scheduler.
Data NameSampleStandard
Current Time2020-04-06T 08:00:00 + 02:00ISO8601
Vessel IMO number1801323IMO
Vessel position, latitude192.515, 51.9200000ISO 6709:2008
(Continued in Appendix A)
Table 4. Terminal data for the DT collaborative scheduler.
Data NameSampleStandard
Current time 2020-04-06T 08:00:00 + 02:00ISO8601
Vessel IMO number1801323IMO
Vessel tons50,000Gross ton
(Continued in Appendix A)
Table 5. Carbon factors by fuel type.
Fuel Type C F (t-CO2/t-fuel)Carbon Content
MDO3.2060.8744
HFO3.1140.8493
LNG2.7660.7500
Methanol1.3750.3750
Table 6. ETA error comparison.
ETA Error—3 MonthsAverage (h)Standard Deviation
Without DT data (conventional method)25.112.7
With DT data (proposed method)1.70.5
Table 7. Delay cost comparison for the short-term delay case.
CaseCO2 Emissions (Tons)
Without the digital twin (conventional method) 89.63
With the digital twin (proposed method)28.01
CO2 saved61.62
Table 8. Delay cost comparison for the mid-term delay case.
CaseCO2 Emissions (Tons)
Without the digital twin (conventional method) 224.08
With the digital twin (proposed method)50.42
CO2 saved173.66
Table 9. Delay cost comparison for the long-term delay case.
CaseCO2 Emissions (Tons)
Without the digital twin (conventional method)392.12
With the digital twin (proposed method)78.43
CO2 saved313.69
Disclaimer/Publisher’s Note: The statements, opinions and data contained in all publications are solely those of the individual author(s) and contributor(s) and not of MDPI and/or the editor(s). MDPI and/or the editor(s) disclaim responsibility for any injury to people or property resulting from any ideas, methods, instructions or products referred to in the content.

