Abstract
Upwelling is a widespread phenomenon in the ocean and plays key roles in the marine environment, marine fishery and air–sea carbon exchange. In coastal regions, the upwelling is usually modulated by tides and complex topography, but the dynamical mechanism is still unclear and yet to be quantified. In this study, a three-dimensional (3D) regional ocean model is used to investigate tide-induced upwelling and its mechanisms quantitatively in the mouth of a semi-closed bay, the Bohai Strait, which is a tide-dominated coastal region. The results show that the upwelling mainly occurs near the tidal front in the north of the Laotieshan Channel and the southern region of the front, with the most active upwelling existing off promontories and small islands. Numerical sensitivity experiments indicate that the upwelling in the study area is mainly caused by tides, accounting for approximately 86% of the total. The 3D balance of the vertical component of the vorticity based on the model results quantifies the dynamic processes of the upwelling and reveals that tides induce the upwelling through tidal mixing and nonlinear effects. In the tidal front zone, the upwelling is mainly caused by baroclinic processes related to tidal mixing. Off promontories and small islands, we first reveal that the upwelling is driven by both the tidal mixing and nonlinear effect related to centrifugal force rather than just one of the two mechanisms, and the latter plays a dominant role in producing the upwelling. The strong nonlinear effect is attributed to the periodic movement of barotropic tidal currents rather than the mean flow.
1. Introduction
Upwelling is an important phenomenon in the ocean, usually characterized by high nutrient content and low sea surface temperature (SST). Upwelling brings nutrients from the lower layer to the upper layer at a vertical velocity of approximately 10−6 to 10−4 m/s, and it plays an important role in marine primary and secondary productivity [1,2,3,4]. Because of the high productivity, upwelling areas tend to be important fishing grounds, providing more than 20% of the global fish production in only a small fraction of the world’s oceans (less than 3%) [5,6]. In addition, upwelling also affects atmosphere–ocean CO2 exchange and carbon recycling [7].
In general, dynamic mechanisms that generate upwelling include many aspects, such as the wind, topography, and tides. [4]. The alongshore wind and wind stress curl control upwelling by wind-driven offshore Ekman transport and Ekman pumping, respectively [8,9,10]. A sharp change in topography, such as a widened shelf, shelf break, promontory, and canyon, can also generate upwelling [11,12,13,14]. In addition, tides, stratification, and background currents are important causes of upwelling [11,15,16,17,18].
Tides often play a key role in coastal upwelling through tidal straining, internal tides, tidal mixing, and centrifugal force. According to the tidal straining theory presented in [19], in stratified coastal waters, the surface and bottom tidal current ellipses are counter-rotating [20,21]. Because of the continuity requirements imposed by the coastal wall, the offshore surface tidal current and onshore bottom tidal current should lead to upwelling, while the onshore surface current and offshore bottom current cause downwelling [22]. This upwelling induced by tidal straining varies with the tidal cycle [22]. For example, in the Rhine region of fresh water influence (ROFI), there is a 100 km semi-diurnal cold upwelling band caused by tidal straining along the coast [22]. Meanwhile, the interaction between the upwelling and internal tides is also important for coastal upwelling, such as in the northern South China Sea, where the uplift of the isopycnal due to internal tides enhances the upwelling, and the internal tides can, in turn, also be intensified by the upwelling [4,17].
Tidal mixing is another important process that triggers upwelling, especially in regions with tidal fronts, which are a common phenomenon in coastal areas, such as in the Yellow Sea [16], off the Yangtze River estuary [15], in the South China Sea [23,24], over the Sulu Ridge [25], and on the southern flank of Georges Bank [26]. The location of a tidal front can be quantified using the Simpson–Hunter Index [27], which is also used to investigate the relationship between tidal mixing and upwelling. Based on numerical simulations, Lü et al. [15,16,23] suggested that strong tidal mixing could induce a tilt in the thermocline and generate a significant baroclinic pressure gradient force across the tidal front in the bottom layer, resulting in a cross-frontal secondary circulation with distinct upwelling on the mixed side of the front.
Off promontories, tides may induce upwelling through the centrifugal forces associated with strong tidal currents flowing around the promontories [28]. The centrifugal force is balanced by the Coriolis force and the pressure gradient force in the water column. Because of a bottom friction effect, the weakened centrifugal force and the maintained pressure gradient force drive an onshore current in the bottom boundary layer [28]. This centrifugal upwelling mechanism has also been used in some studies to explain the upwelling at the tips of Liaodong Peninsula and Shandong Peninsula [29,30]. In addition, tidal current-induced eddies near promontories can also cause periodic upwelling. For example, in Nanwan Bay, the headlands on both sides of the bay generate strong tide-induced eddies in each tidal phase, forming a pressure gradient from the edge of the eddy to the center that supports the centrifugal force. As a result, the bottom water flows toward the eddy center and then generates upwelling [31,32].
The Bohai Strait is a typical tide-induced upwelling region with promontories and a tidal front [33,34], and studying the upwelling near the Bohai Strait will help us to better understand the dynamic processes of tide-induced upwelling. Near the Bohai Strait, the SST of the upwelling is below 22 °C, and there are two cold cores (below 20 °C) at the tip of Liaodong Peninsula and around the islands in the middle of the Bohai Strait [35]. The persistent existence of the summer surface cold patch in the Bohai Strait creates suitable conditions for sea fog, which affects maritime navigation and land transport along the coast [36]. Based on an automatic identification system, it is found that the northern part of the Bohai Strait has always been a gathering area for fishing activities [37]. In addition, Zang et al. [38] found that upwelling near the Bohai Strait significantly enhances the vertical transport of methane (CH4), making the northern part of the strait the most intense source of CH4 in the Bohai Sea.
Using satellite SST data from 1999 to 2018, Zhang et al. [35] found that there are significant spring-neap variations in the upwelling near the Bohai Strait and suggested that the strong spring-neap variations may be related to the strength of tidal mixing, which can be checked using the Simpson–Hunter Index [27]. It is considered that the upwelling in this area is a current–topographic upwelling with a relatively fixed location [39] and is suppressed by the wind and background current [29,35]. At the tip of Liaodong Peninsula, some studies suggest that the cold bottom water is lifted by the centrifugal forces related to strong barotropic tidal current [29,30]. However, Lü et al. [16] proposed another explanation: a strong tidal current leads to high tidal mixing and causes the upwelling at the convex tips of peninsula.
Previous studies mainly focused on the qualitative study of the upwelling near the Bohai Strait based on satellite SST data [35,40]; however, the specific contribution of the tides to the upwelling near the Bohai Strait is still unclear and not well quantified. In addition, according to the results of Lü et al. [16], the upwelling near the Bohai Strait is not well reconstructed when only tidal mixing is considered. Therefore, the mechanism of tidal influence on upwelling near the Bohai Strait is incomprehensive. Investigating the upwelling modulated by the tide and discussing the mechanisms quantitatively using a numerical model should promote our knowledge of the structure and variability of the upwelling not only in the Bohai Strait but also in other similar tide-induced upwelling regions.
The dynamics of upwelling processes can be diagnosed using transformed momentum equations and vorticity equations under some assumptions. Previous studies mainly focused on qualitative research by dividing the momentum equations into cross-isobath and along-isobath components and then examining the contributing factors to the cross-isobath movement [4]. Liu et al. [41] first obtained the equation for the vertical component of vorticity related to the divergence of horizontal velocities from the equations for the horizontal components of momentum, and they demonstrated the importance of nonlinear advection in the Kuroshio intrusions and strong upwelling to the northeast of Taiwan based on the equation for the vertical component of vorticity. The equation for vertical component of vorticity can quantitatively diagnose the dynamical processes of convergence and divergence of horizontal velocities.
In this study, we aimed to quantify the contribution of the tide to the upwelling near the Bohai Strait and investigate more comprehensively mechanisms of tide-induced upwelling using the equation for the vertical component of vorticity based on numerical simulations.
2. Data and Methods
2.1. Study Area
The Bohai Strait is the only passage that connects the semi-enclosed Bohai Sea with the open Yellow Sea in northern China (Figure 1). The strait is approximately 104 km wide and deepens from southwest to northeast, with depths ranging from 10 to 70 m. There are several small islands in the middle and south of the Bohai Strait, which divide the strait into two parts: a shallow part in the south with depths of 10–30 m and a deep part in the north with depths of 30–70 m. The Laotieshan Channel is the deep part of the strait and is surrounded by a topographic sill in the north and the central bank in the west.
Tides play an important role in the hydrodynamic conditions of the Bohai Sea and Yellow Sea [34,42]. Previous observations indicate that large tidal currents occur near the Bohai Strait, where the maximum tidal current velocity can reach 2.5 m/s [43], and the mean flow in summer is approximately 10 cm/s, which is much weaker than the tidal current [44]. Bi et al. [44] analyzed the current data from ADCP moorings deployed in the Bohai Strait and showed that tidal currents were predominant at all stations, accounting for approximately 75% of the total kinetic energy. The contribution of the M2 constituent was the largest among all of the tidal constituents [44]. In addition, Bi et al. [44] also found that the amplitude of the tidal current decreased with depth.
Both simulations and observations indicate that the northern Yellow Sea water flows into the Bohai Sea through the Laotieshan Channel [34,45]. Because of the lack of large-scale and long-term observed data on the current, the specific current structure in the study area is mainly attained using numerical models. However, these numerical models have been well verified. Xu et al. [34] used a well-validated model and showed that part of the inflow joins the counter-clockwise Ω-shaped frontal circulation steered by the topography after entering the Bohai Sea, while the rest turn back to the Yellow Sea in the strait zone [34]. Moreover, Xu et al. [34] also discussed the existence of the Ω-shaped tidal front through multiyear observations of temperature and confirmed the distribution of the tidal front. It should be noted that the small islands in the Bohai Strait may strongly influence the exchange flow in the strait based on high-resolution simulations [46].

Figure 1.
Geography of the study area. The red arrows indicate the circulation in the north of the Bohai Strait, which was redrawn according to Xu et al. [34]. The location of the tidal front is represented using double solid rectangles, where the temperature difference between the surface and bottom is 2.0 °C [47,48]. The contour lines denote the 25-, 30-, and 50-m isobaths. The blue line indicates the transect (T) across the front.

2.2. Ocean Model
2.2.1. Model Configurations
We used the Regional Ocean Modeling System (ROMS) [49] to simulate the three-dimensional (3D) hydrodynamic conditions of the Bohai Sea and Yellow Sea. The model setup was the same as that used by Xu et al. [34]. The model domain was the Bohai Sea and Yellow Sea, with a horizontal resolution of between 1.33 km and 2.79 km. The vertical s-coordinate layers were set to 20 layers. The model contains eight principle tidal constituents (M2, S2, N2, K2, K1, O1, P1, and Q1) based on Oregon State University’s global inverse tidal model: TPXO9 [50]. The surface heat flux, wind stress, and freshwater flux were derived from the climatological monthly mean of the Comprehensive Ocean-Atmosphere Data Set (COADS) [51]. The vertical turbulence closure adopted here was the generic length scale (GLS) scheme in a gen configuration [52]. More details of the model’s setup and validation can be found in the work of Xu et al. [34].
The model was spun up for 10 years using repeat year forcing. We used the data from June to August from the last 5 years as the control run result. In ROMS, each term in the momentum equations is continuously accumulated at every time step and then averaged over the summer to ensure that the time-averaged vorticity budget (including the tendency term) is highly accurate.
2.2.2. Model Experiments
We used the control run to analyze the standard upwelling near the Bohai Strait. In addition, we also designed two sensitivity experiments to investigate the effects of tides on the upwelling. Based on the control run, the first sensitivity experiment (No-Tide) excluded the tidal forcing at the open boundary and was used to evaluate the total effect of the tides. The second sensitivity experiment (BT-Tide) was a barotropic experiment with the temperature and salinity fixed at 20 °C and 33, respectively. The barotropic experiment was designed to estimate the upwelling induced by barotropic tides.
2.3. MODIS Data
The SST data were derived from the monthly mean Moderate Resolution Imaging Spectroradiometer (MODIS) SST datasets (https://oceancolor.gsfc.nasa.gov/l3/, accessed on 16 August 2023) with a horizontal resolution of 4 km. The SST data used in our study were from 2003 to 2022.
2.4. 3D Balance of the Vertical Component of Vorticity
To further discuss the dynamic mechanism of the upwelling in the study area, the equation for the vertical component of vorticity was derived from the equations for horizontal components of the momentum following Liu et al. [41]. The equations for the horizontal components of momentum in Cartesian coordinates are written as follows:
where the subscripts and stand for the east–west and north–south directions, respectively; and are the horizontal velocity in the - and -directions; is the vertical velocity; is the Coriolis coefficient; is the gravity acceleration; is the surface elevation; and represent the density and reference density, respectively; is the vertical viscosity coefficient; and and are the horizontal viscosity terms. In Equations (1) and (2), the following terms are used: term I, acceleration; term II, Coriolis force; term III, nonlinear advection; term IV, horizontal pressure gradient; and term V, viscosity.
The equation for the vertical component of vorticity in Cartesian coordinates is obtained by taking the vertical component of the curl of the equations for the horizontal components of momentum (Equations (1) and (2)). The summer mean acceleration term in the momentum equations and the tendency term in the equation for the vertical component of vorticity can be neglected as they are an order of magnitude smaller than the other terms. Thus, we only consider the steady-state balance. The equation for the vertical component of vorticity in Cartesian coordinates is written following Liu et al. [41]:
where the superscripts and stand for the east–west and north–south directions, respectively, and the notations and represent advection and viscosity in Equations (1) and (2), respectively. Term I in Equation (3) is the stretching of planetary vorticity tubes which is related to the divergence of horizontal velocities. Term II is the curl of the advective terms for the horizontal components of momentum, which include advective terms for the relative vorticity and terms describing the stretching and tilting of the relative vorticity tubes. Term III is the production of the vertical component of vorticity by friction (or eddy viscosity). Equation (3) indicates that the vertical velocity is determined by nonlinear advection and dissipation.
3. Results
3.1. Model Validation
To evaluate the performance of the model in capturing the upwelling near the Bohai Strait in summer, we compared the mean SST in the summer season from the simulation and the observational data. The results show good agreement (Figure 2). The root mean square error (RMSE) between the simulated SST and MODIS SST is 0.67 °C (Figure 2c). The cold SST (below 22 °C), induced by the upwelling near the Bohai Strait, shows a pod-like zone, which was reasonably reconstructed in our model (Figure 2a,b). The two cold cores mentioned by Zhang et al. [35] at the tip of Lvshun and around the islands in the middle of the Bohai Strait were also reproduced (Figure 2b). However, the cold core in the middle of the Bohai Strait was not obvious in the MODIS SST (Figure 2a), which might be due to the interannual variability, since different time periods were used between the MODIS data and our simulation. The simulated SST off Changxing Island and the islands in the middle of the Bohai Strait was lower than the MODIS SST, which may be caused by differences in the wind and heat fluxes.
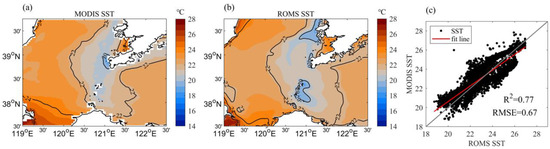
Figure 2.
Comparison of the (a) simulated and (b) MODIS SST summer means near the Bohai Strait. The MODIS data are the climatological mean in summer during 2003–2022. (c) The correlation between the simulated and MODIS SST.
Other model results for the summer hydrodynamic conditions near the Bohai Strait, including temperature, salinity, current, and tides, have been verified by observations [34]. The good agreements between the simulations and the observations indicate that it is reasonable to investigate the dynamic processes of the upwelling near the Bohai Strait, as well as their mechanisms, using this model.
3.2. Tide-Induced Upwelling Near the Bohai Strait
In the region near the Bohai Strait, the upwelling and downwelling are alternately distributed horizontally, and their locations are consistent with the cold SST (Figure 2b and Figure 3a–c). The active vertical motions occur in the region where the SST is below 22 °C. Around the tidal front (Figure 3d), the upwelling generally appears on the shallower side, while the downwelling generally appears on the deeper side, which is consistent with those in the Yellow Sea [16]. The magnitude of the upwelling in this region is 10−5 m/s, which is similar to that in the Yellow Sea [16,53]. The most active vertical motions occur off promontories with complex coastlines and small islands, such as the tip of Liaodong Peninsula and the islands in the Bohai Strait, with a maximum vertical velocity exceeding 10 × 10−5 m/s (Figure 3a–c).
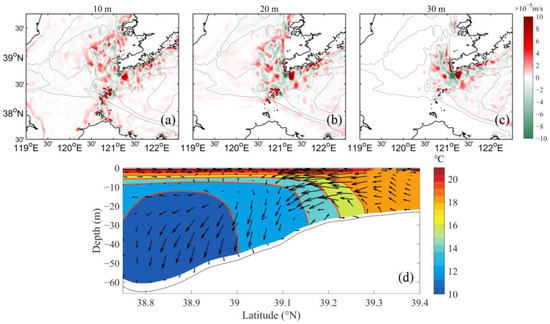
Figure 3.
Mean vertical velocity distributions in summer at (a) 10 m, (b) 20 m, and (c) 30 m. The solid gray curves are the 25, 30, 50, and 60 m isobaths. (d) Distributions of the temperature (the red contour lines represent 2 °C intervals) and v-w velocity (vectors) along the transect (T) across the tidal front. The position of the transect (T) is shown in Figure 1. The vertical velocity has been amplified 1000 times.
Following Lü et al. [15,54], we compared the upwelling at 10 m from the control run with that of the No-Tide experiment, and took the vertical water mass flux through 10 m as an index to evaluate the influence of the tides on the upwelling (Figure 4). Figure 3a–c show that the spatial distributions of the upwelling and downwelling at different depths near the Bohai Strait are similar, so it is reasonable to consider the upwelling at a 10 m depth as representative of the overall upwelling in different experiments. Since our study focused on upwelling, we calculated variations in the upward velocity in the study area. Compared with the control run, the upwelling near the Bohai Strait was much weaker in the No-Tide experiment (Figure 4). The vertical water mass fluxes through 10 m were integrated at all positive-velocity grids near the Bohai Strait (Figure 4, black boxes), with magnitudes of 1.51 × 10⁵ m3/s in the control run and 0.21 × 10⁵ m3/s in the No-Tide experiment (Figure 4). Without tidal forcing, the vertical water mass flux decreased by 86.1%, indicating the indispensability of the tides in the upwelling near the Bohai Strait. It can be estimated that approximately 86.1% of the upwelling is attributed to tides in the study area.
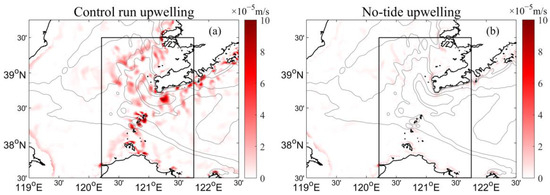
Figure 4.
Horizontal distribution of the summer mean upwelling velocity at 10 m: (a) control run; (b) No-Tide experiment. The black boxes mark the region used for calculating the total upwelling-induced vertical water mass flux at 10 m. The solid gray curves are the 25, 30, 50, and 60 m isobaths.
The vertical distributions of the temperature and v-w velocity along the transect (T) in the control run and No-Tide experiment are also provided to aid in the investigation of the effects of the tides on the upwelling in the frontal region (Figure 5). The results show that the strong temperature gradient and vertical motion were weakened in the case without tides (Figure 5b). The vertical distribution of temperature isoline is coincident with the vertical eddy diffusion coefficient in the control case, which suggests an enhanced near-bottom tidal mixing (Figure 5a,c). The vertical mixing was weak, as indicated by the low vertical eddy diffusion coefficient in the No-Tide experiment (Figure 5d). The tides enhanced the bottom vertical mixing, forming a frontal zone with a strong bottom temperature gradient across the front, which is important for upwelling (Figure 5c).
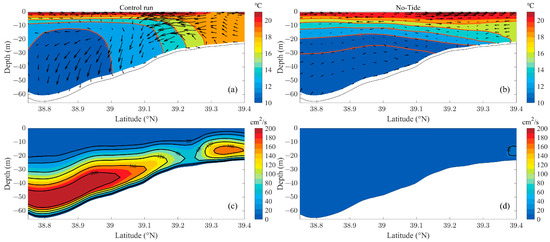
Figure 5.
Distributions of temperature (red contour lines represent 2 °C intervals) and v-w velocity (vectors) along the transect (T) across the tidal front: (a) control run; (b) No-Tide experiment. The vertical velocity has been amplified 1000 times. Model-simulated summer mean vertical eddy diffusion coefficient along the transect (T): (c) control run; (d) No-Tide experiment.
3.3. Mechanism of the Tidal Effect on the Upwelling
According to the distribution of the upwelling and the terms in the equation for the vertical component of vorticity, we divided the upwelling into two categories: upwelling off promontories with complex coastlines and small islands and upwelling in the offshore region. For simplicity, Zone P is used to represent the region off the promontories and small islands, including the area near Changxing Island (Zone P1), the tip of Liaodong Peninsula (Zone P2), and the area around the islands in the Bohai Strait (Zone P3), while Zone O represents the rest of the study area, namely, the offshore region (Figure 6a). In the offshore region (Zone O), Zone O2 is the shallow water between Changxing Island and Lvshun, while Zone O1 indicates the rest of Zone O.
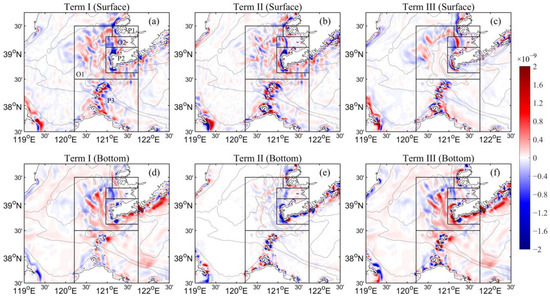
Figure 6.
Horizontal distributions of the surface and bottom 3D balance of the vertical component of vorticity (s−2) from the control run: (a,d) term I; (b,e) term II; (c,f) term III. The solid, gray curves are the 15, 25, 30, 50, and 60 m isobaths. The black boxes mark the different zones.
3.3.1. Upwelling and Balance of the Vertical Component of Vorticity off Promontories and Small Islands
Off the promontories and small islands (Zone P), where the upwelling and downwelling are very strong, term I was also large and balanced by term II and term III (Figure 6). Term II and term III were strong from the surface to the bottom off the promontories and small islands, demonstrating the importance of both nonlinear advection and dissipation in the upwelling and downwelling of the entire water column in this area. It is worth noting that each term in the equation for the vertical component of vorticity was calculated using model diagnostics, and the residual of the total vorticity budget (including the tendency term) was orders of magnitude smaller than the other terms, which indicates the accuracy of Equation (3) in this region.
To investigate the mechanism of the tidal effect on the upwelling off the promontories and small islands (Zone P), we also calculated each term in Equation (3) from the No-Tide experiment (Figure 7). The results show that all three terms decreased sharply when tides were excluded, except in the bottom layer, where term III was strong and mainly balanced by term I. It should be noted that the term II almost disappears without tides. At the bottom, term III was strong near Changxing Island and the islands in the Bohai Strait but very weak at the tip of Liaodong Peninsula. The absence of term II and a weakened term III indicate that both tide-induced nonlinear advection and dissipation are important for upwelling off promontories with complex coastlines and small islands.
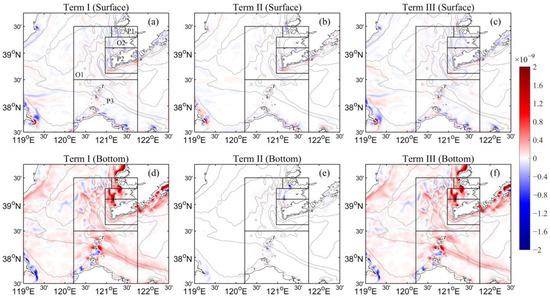
Figure 7.
Same as in Figure 6 but for the No-Tide experiment.
3.3.2. Upwelling and Balance of the Vertical Component of Vorticity in the Offshore Region
In the offshore region (Zone O), upwelling occurs mainly near the tidal front and in the southern part of the front, and the dominant terms in the equation for the vertical component of vorticity were different from those off the promontories and small islands. At the surface, term III was strong near the frontal region and in shallow water (Zone O2) but very small in deep water (>25 m) (Figure 6c). At the bottom, term II was very small, except for part of Zone O2, and it was mainly balanced between term I and term III (Figure 6d–f).
To further explore the dynamic mechanism of the tide-induced upwelling in this region, we calculated the vertical distribution of the area-averaged vertical velocity and 3D balance of the vertical component of vorticity in the different vertical layers (Figure 8), referring to Liu et al. [41]. The distribution of the vertical velocity is consistent with that of term I. A positive value for term I indicates that w increased with depth, while a negative value for term I indicates that w decreased with depth. In the deep region (>25 m in Zone O1), term I was mainly balanced by term II at the surface and mainly balanced by term III in the lower layer (Figure 6 and Figure 8c,f). In summer, strong stratification occurs in the deep region, and the vertical motion of the bottom water is dominated by strong tidal mixing. From Figure 8c,f, the thickness of the bottom boundary layer dominated by term III is approximately 20 m and 35 m in the 30 m and 50 m depth regions, respectively, which is consistent with the temperature distributions (Figure 5a,c). In the frontal (approximately 25 m in Zone O1) and shallow region (Zone O2), where the strong tidal mixing homogenizes the water column (Figure 5a,c), term III was strong throughout the water column (Figure 8g–o).
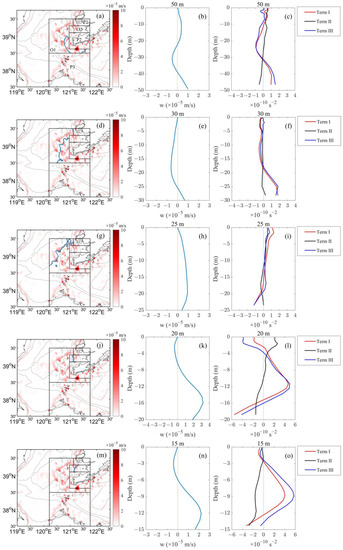
Figure 8.
Vertical profiles of the area-averaged vertical velocity and 3D balance of the vertical component of vorticity at water depths of (a–c) 50, (d–f) 30, (g–i) 25, (j–l) 20, and (m–o) 15 m according to the control run. In the left panels (a,d,g,j,m), the grid points of the different depths selected for the vertical profiles are marked in blue. The shaded, red color represents the summer mean upwelling velocity at 10 m from the control run. The solid, gray curves are the 10, 15, 25, 30, and 50 m isobaths.
Figure 9 shows the vertical profiles of the area-averaged vertical velocity and 3D balance of the vertical component of vorticity in the offshore region from the No-Tide experiment. The upwelling was very weak and occurred only in the bottom layer when the tides were excluded (Figure 9a–e). As indicated by the 3D balance of the vertical component of vorticity (Figure 9f–j), the thickness of the bottom boundary layer in the No-Tide experiment was approximately 5–10 m, which is much thinner than that in the control run. The difference between the two experiments indicates that tidal dissipation increases the thickness of the bottom boundary layer and causes the active vertical motions in the bottom layer.
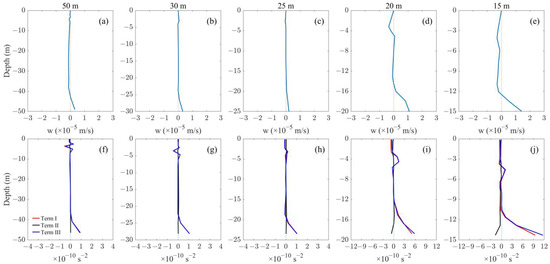
Figure 9.
Vertical profiles of the area-averaged (a–e) vertical velocity and (f–j) 3D balance of the vertical component of vorticity at water depths of 50, 30, 25, 20, and 15 m from the No-Tide experiment.
4. Discussion
4.1. Tidal Nonlinear Effect
From an examination of 3D balance of the vertical component of vorticity, it appears that nonlinear advection plays an important role in the upwelling near the Bohai Strait. To explore the influence of the tides on the nonlinear advection, we compared the depth-averaged nonlinear advection in the momentum equation between the control run and No-Tide experiment (Figure 10a,b). The nonlinear advection was strong off the promontories and small islands (Zone P) and the shallow water between Changxing Island and Lvshun (Zone O2) (Figure 10a). However, the strong nonlinear advection in the momentum equation almost disappeared in the No-Tide experiment (Figure 10b), which is consistent with that in the vorticity equation. This indicates that the strong nonlinear advection in this region is induced by tides.
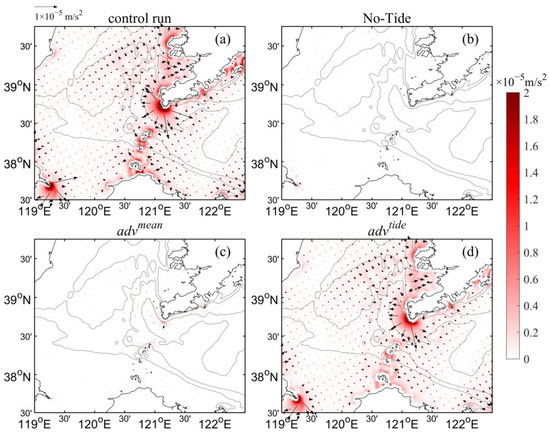
Figure 10.
Horizontal distributions of the depth-averaged nonlinear advection in the momentum equation from the (a) control run and (b) No-Tide experiment. Horizontal distributions of the depth-averaged nonlinear advection induced by the (c) mean flow and (d) periodic tidal current, respectively. The nonlinear advection is shown by black arrows with the color representing the magnitude.
It should be noted that the mean circulation became very weak without tides [34]. To eliminate the effects of the mean flow on the nonlinear advection, we divided the advection into advection induced by the mean flow and advection induced by the periodic tidal current. The advection induced by the periodic tidal current can be approximated as the total advection minus the advection induced by the mean flow. The depth-averaged advection induced by the two factors can be written as follows:
where is the nonlinear advection in the momentum equations; the superscripts and represent the advection induced by the mean flow and the periodic tidal current, respectively; and the overbar denotes depth-averaged values.
Figure 10c,d show the horizontal distributions of the depth-averaged nonlinear advection induced by the mean flow and periodic tidal current, respectively. The advection induced by the mean flow was very small compared to that induced by the periodic tidal current. This demonstrates that the strong nonlinear (inertial) effect off the promontories and small islands and in the shallow water was caused by the periodic movement of strong tidal currents. The contribution of the tidal residual current and mean current to the strong nonlinear effect can be neglected.
4.2. Upwelling Induced by Barotropic and Baroclinic Tides
The mechanism of tide-induced upwelling involves two aspects: barotropic and baroclinic processes [54]. In the Yellow Sea, upwelling generally occurs in the tidal front zones and is mainly caused by baroclinic processes [16]. In our study area, there was also a tidal front with distinct upwelling in the north of the Bohai Strait (Figure 4a). To distinguish the contribution of the tide-induced barotropic and baroclinic processes to the upwelling in the study area, we also conduct a barotropic experiment (BT-Tide).
Figure 11 shows the horizontal distributions of the upwelling at 10 m and the depth-averaged nonlinear advection in the momentum equation from the BT-Tide experiment. Because of the barotropicity, the vertical distribution of the upwelling in the BT-Tide experiment was more uniform than that in the control run. The strong upwelling only occurred off the promontories with complex coastlines and small islands, including the area near Changxing Island (Zone P1), the tip of Liaodong Peninsula (Zone P2), and the area around islands in the Bohai Strait (Zone P3). In these regions, distinct upwelling also occurred in the control run, but the location of the upwelling was slightly different from that under the barotropic conditions. Compared with the control run (Figure 4a), the upwelling in the BT-Tide experiment was located closer to the coast, especially at the tip of Liaodong Peninsula (Zone P2). In Zone P, including Zone P1, Zone P2, and Zone P3, the total upwelling-induced vertical flux through 10 m in the BT-Tide experiment accounted for 68.8% of that in the control run and, therefore, the barotropic tidal current plays a predominant role in inducing the upwelling in this area. It should be noted that the strong nonlinear advection in Zone P was similar between the control run and the BT-Tide experiment, which shows that the strong nonlinear advection off the promontories and small islands is also mainly induced by the barotropic tidal current. As for the offshore region (Zone O), the upwelling in the BT-Tide experiment was very weak, and the total vertical flux through 10 m decreased by 89.7% compared to the control run. This indicates that the upwelling in the offshore region, such as the frontal region, is mainly caused by baroclinic processes related to tidal mixing.
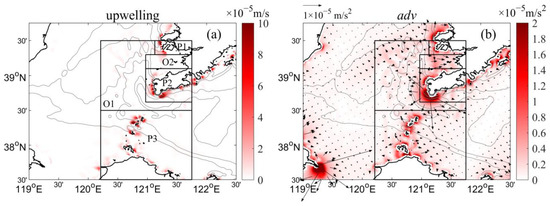
Figure 11.
Horizontal distribution of the summer mean upwelling velocity at (a) 10 m and (b) depth-averaged nonlinear advection in the momentum equation from the BT-Tide experiment. The black boxes in (a) mark the regions for Zone P and Zone O. The solid, gray curves are the 25, 30, 50, and 60 m isobaths.
4.3. Mechanism of the Tide-Induced Upwelling off Promontories
As for the upwelling off the promontories, previous studies have provided two explanations. First is the traditional centrifugal upwelling mechanism [28,29,31,32]. The other, a baroclinic mechanism, which was put forward by Lü et al. [16], which suggests that the high tidal mixing induced by the large tidal current and the consequent tidal front cause the strong upwelling in the Yellow Sea, especially off promontories with complex coastlines and small islands.
In our study, the upwelling off the promontories was induced by both strong tidal mixing and nonlinear advection. In actuality, both nonlinear advection and centrifugal force are inertial effects. From the horizontal distribution of the depth-averaged momentum equation, we can see that the direction of the nonlinear advection coincides with the centrifugal force (Figure 10a), while both the pressure gradient force and Coriolis force were opposite to the centrifugal force (not shown). The nonlinear advection, pressure gradient force, and Coriolis force were almost balanced off the promontories and small islands because of the relatively small surface and bottom stresses. As mentioned by Garrett and Loucks [28], the centrifugal force of a tidal current is calculated as , where represents the tidal current velocity, and is the radius of the curvature of the coastline. According to Xia and Guo [29], the tidal current at the tip of Liaodong Peninsula can reach more than 1 m/s, and the can be estimated as 30 km, so the magnitude of the centrifugal force of the tidal current is approximately O (10−5 m/s2), which corresponds to the nonlinear advection in the momentum equation (Figure 10a). This indicates that the strong centrifugal force in our study was related to nonlinear advection. Therefore, our explanation for the strong upwelling off promontories with complex coastlines and small islands is a combination of these two mechanisms.
4.4. Model Implications and Limitations
The upwelling near the Bohai Strait is also affected by other factors, but this paper focused on the main influencing factor—the tides. According to our results, the tide-induced upwelling accounts for approximately 86% of the total upwelling. Therefore, it is necessary to discuss the tidal effects separately. Previous studies have qualitatively discussed that the strength of the upwelling in the Bohai, Yellow, and East China Seas is related to tidal mixing or bottom baroclinic pressure gradient forces [15,16,35,53,54]. In this paper, we first used the equation for the vertical component of vorticity related to the vertical velocity to quantify the processes of tide-induced upwelling, indicating that both the tidal mixing and tidal nonlinear effect are important for the upwelling near the Bohai Strait. Since it is a typical area for tide-induced upwelling with promontories and a tidal front [34], the study of the upwelling near the Bohai Strait will help us better understand the dynamic processes of tide-induced upwelling. It should be noted that the hydrodynamic conditions in the Bohai Sea are also affected by surface waves [55], which can be considered in future studies. In addition, more observations of upwelling in the study area are needed to support the model’s results.
5. Conclusions
In this study, the upwelling and mechanism of tide-induced upwelling in a tide-dominated area near the Bohai Strait were investigated quantitatively using a high-resolution regional ocean model. The upwelling near the Bohai Strait was mainly present near the Ω-shaped tidal front in the north of Laotieshan Channel and in the southern region of the front. The most active upwelling occurred off promontories with complex coastlines and small islands, such as the Changxing Island, the tip of Liaodong Peninsula, and the islands in the Bohai Strait. The sensitivity experiment shows that approximately 86% of the upwelling is caused by tides in the study area, indicating that the upwelling near the Bohai Strait is mainly induced by tides.
The 3D balance of the vertical component of vorticity quantifies the dynamical processes of the vertical motion in the ocean and shows that the vertical motion is determined by the dissipation and nonlinear effect. On the one hand, tidal dissipation thickens the bottom boundary layer, resulting in active vertical motions in the bottom layer. On the other hand, tidal dissipation enhances seawater mixing, which is also called tidal mixing, resulting in a secondary circulation with upwelling and downwelling in the tidal front zone, which corresponds to the baroclinic processes. In addition, the nonlinear effect caused by the tides will also promote upwelling, especially off the promontories and small islands.
Based on the 3D balance analysis of the vertical component of vorticity, tide-induced upwelling near the Bohai Strait can be concluded in two areas (Figure 12): the offshore region (such as the tidal front zone) and off the promontories and small islands. In the tidal front zone (Figure 12b), the upwelling is mainly caused by baroclinic processes associated with tidal mixing. The strong mixing creates high baroclinic pressure gradient forces in the frontal region and then drives an upslope bottom current crossing the front. The spatial variation of the pressure gradient force causes the bottom current to converge on the shallow side and diverge on the deep side because of the bottom friction effect, which leads to the upwelling and downwelling on the two sides of the front, respectively. Off the promontories and small islands (Figure 12c), both the tidal mixing and nonlinear effect contribute to the upwelling, and the latter is more important. In the upper layer, the balance is between the ageostrophic pressure gradient force (apg) and adv. Because of the bottom friction effect, the adv decreases in the bottom layer, where the apg is balanced by adv and friction, resulting in the upslope movement of the bottom water. The strong nonlinear effect is attributed to the periodic movement of barotropic tidal currents, which induces approximately 68.8% of the total upwelling in this area.
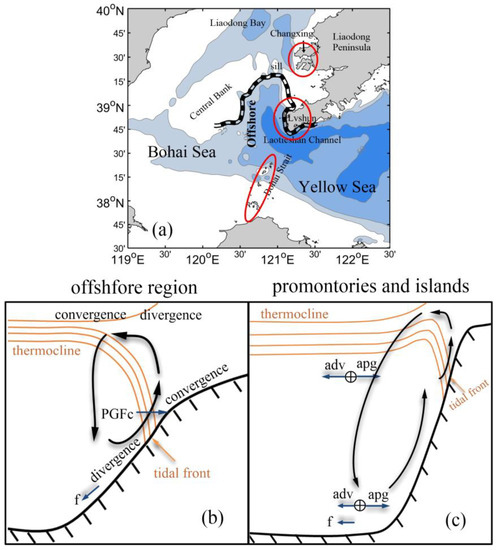
Figure 12.
(a) Geography of the study area. The double solid rectangles represent the Ω-shaped tidal front, while the red circles indicate the locations of the promontories and small islands in the study area. Schematic of the tide-induced upwelling (b) in the offshore region and (c) off the promontories and small islands. The red–brown lines represent the thermocline and tidal front. The black arrows denote the circulation related to the upwelling, while the blue arrows indicate the forces. The notations PGFc, adv, apg, and f are the baroclinic pressure gradient force, nonlinear advection, ageostrophic pressure gradient force, and bottom friction. The apg was used to consider the combined effects of the Coriolis force and pressure gradient force.
It should be noted that our model did not include surface waves, which may cause weak mixing in the upper ocean [55]. In the future, we will couple the wave model to elucidate the effect of surface waves on the circulation. Although ocean modes help us to better understand the characteristics and mechanisms of the upwelling near the Bohai Strait, we still need more long-term observations of upwelling in the study area to support the model’s results.
Author Contributions
Conceptualization, F.Z. and X.L.; methodology, X.L. and Y.X.; software, Y.X. and X.L.; validation, Y.X.; formal analysis, Y.X., F.Z., X.L., X.C., R.Y. and D.C.; data curation, Y.X.; writing—original draft preparation, Y.X.; writing—review and editing, D.C., F.Z., X.L., X.C., R.Y. and Y.X.; visualization, Y.X.; supervision, F.Z., D.C., X.C. and X.L.; funding acquisition, F.Z. and X.L. All authors have read and agreed to the published version of the manuscript.
Funding
This research was funded by the Zhejiang Provincial Ten Thousand Talents Plan (grant number: 2020R52038); the Key R&D Program of Zhejiang Province (contract number: 2022C03044); the National Program on Global Change and Air–Sea Interaction (Phase II, grant number: GASI-04-WLHY-03); the Zhejiang Provincial Natural Science Foundation of China (grant number: LY21D060001); and the Scientific Research Fund of the Second Institute of Oceanography, MNR (grant number: SL2105).
Data Availability Statement
The MODIS SST datasets are available from NASA Ocean Color: https://oceancolor.gsfc.nasa.gov/l3/ (accessed on 16 August 2023).
Acknowledgments
The model simulations were supported by the high-performance computing cluster of the State Key Laboratory of Satellite Ocean Environment Dynamics.
Conflicts of Interest
The authors declare no conflict of interest.
References
- Joint, I.; Rees, A.P.; Woodward, E.M.S. Primary Production and Nutrient Assimilation in the Iberian Upwelling in August 1998. Prog. Oceanogr. 2001, 51, 303–320. [Google Scholar] [CrossRef]
- Escribano, R.; Schneider, W. The Structure and Functioning of the Coastal Upwelling System off Central/Southern Chile. Prog. Oceanogr. 2007, 75, 343–347. [Google Scholar] [CrossRef]
- Song, X.; Lai, Z.; Ji, R.; Chen, C.; Zhang, J.; Huang, L.; Yin, J.; Wang, Y.; Lian, S.; Zhu, X. Summertime Primary Production in Northwest South China Sea: Interaction of Coastal Eddy, Upwelling and Biological Processes. Cont. Shelf Res. 2012, 48, 110–121. [Google Scholar] [CrossRef]
- Hu, J.; Wang, X.H. Progress On Upwelling Studies in the China Seas. Rev. Geophys. 2016, 54, 653–673. [Google Scholar] [CrossRef]
- Fréon, P.; Barange, M.; Arístegui, J. Eastern Boundary Upwelling Ecosystems: Integrative and Comparative Approaches. Prog. Oceanogr. 2009, 83, 1–14. [Google Scholar] [CrossRef]
- Benazzouz, A.; Mordane, S.; Orbi, A.; Chagdali, M.; Hilmi, K.; Atillah, A.; Lluís Pelegrí, J.; Hervé, D. An Improved Coastal Upwelling Index From Sea Surface Temperature Using Satellite-Based Approach—The Case of the Canary Current Upwelling System. Cont. Shelf Res. 2014, 81, 38–54. [Google Scholar] [CrossRef]
- McGregor, H.V.; Dima, M.; Fischer, H.W.; Mulitza, S. Rapid 20th-Century Increase in Coastal Upwelling off Northwest Africa. Science 2007, 315, 637–639. [Google Scholar] [CrossRef]
- Xie, S.; Xie, Q.; Wang, D.; Liu, W.T. Summer Upwelling in the South China Sea and its Role in Regional Climate Variations. J. Geophys. Res. Oceans 2003, 108, 3261. [Google Scholar] [CrossRef]
- Dippner, J.W.; Nguyen, K.V.; Hein, H.; Ohde, T.; Loick, N. Monsoon-Induced Upwelling Off the Vietnamese Coast. Ocean Dynam. 2007, 57, 46–62. [Google Scholar] [CrossRef]
- Wang, D.; Wang, H.; Li, M.; Liu, G.; Wu, X. Role of Ekman Transport Versus Ekman Pumping in Driving Summer Upwelling in the South China Sea. J. Ocean Univ. China 2013, 12, 355–365. [Google Scholar] [CrossRef]
- Gan, J.; San Ho, H.; Liang, L. Dynamics of Intensified Downwelling Circulation over a Widened Shelf in the Northeastern South China Sea. J. Phys. Oceanogr. 2013, 43, 80–94. [Google Scholar] [CrossRef]
- Benthuysen, J.; Thomas, L.N.; Lentz, S.J. Rapid Generation of Upwelling at a Shelf Break Caused by Buoyancy Shutdown. J. Phys. Oceanogr. 2015, 45, 294–312. [Google Scholar] [CrossRef]
- Liu, Z.; Gan, J. Modeling Study of Variable Upwelling Circulation in the East China Sea: Response to a Coastal Promontory. J. Phys. Oceanogr. 2014, 44, 1078–1094. [Google Scholar] [CrossRef]
- Liu, Z.; Gan, J. Upwelling Induced by the Frictional Stress Curl and Vertical Squeezing of the Vortex Tube over a Submerged Valley in the East China Sea. J. Geophys. Res. Oceans 2015, 120, 2571–2587. [Google Scholar] [CrossRef]
- Lü, X.; Qiao, F.; Xia, C.; Zhu, J.; Yuan, Y. Upwelling Off Yangtze River Estuary in Summer. J. Geophys. Res. 2006, 111, C11S08. [Google Scholar] [CrossRef]
- Lü, X.; Qiao, F.; Xia, C.; Wang, G.; Yuan, Y. Upwelling and Surface Cold Patches in the Yellow Sea in Summer: Effects of Tidal Mixing on the Vertical Circulation. Cont. Shelf Res. 2010, 30, 620–632. [Google Scholar] [CrossRef]
- Gu, Y.; Pan, J.; Lin, H. Remote Sensing Observation and Numerical Modeling of an Upwelling Jet in Guangdong Coastal Water. J. Geophys. Res. Oceans 2012, 117, C08019. [Google Scholar] [CrossRef]
- Gan, J.; Wang, J.; Liang, L.; Li, L.; Guo, X. A Modeling Study of the Formation, Maintenance, and Relaxation of Upwelling Circulation on the Northeastern South China Sea Shelf. Deep Sea Res. Part II Top. Stud. Oceanogr. 2015, 117, 41–52. [Google Scholar] [CrossRef]
- Simpson, J.H.; Brown, J.; Matthews, J.; Allen, G. Tidal Straining, Density Currents, and Stirring in the Control of Estuarine Stratification. Estuaries 1990, 13, 125–132. [Google Scholar] [CrossRef]
- Visser, A.W.; Souza, A.J.; Hessner, K.; Simpson, J.H. The Effect of Stratification on Tidal Current Profiles in a Region of Freshwater Influence. Oceanol. Acta 1994, 17, 369–381. [Google Scholar]
- Simpson, J.H.; Souza, A.J. Semidiurnal Switching of Stratification in the Region of Freshwater Influence of the Rhine. J. Geophys. Res. Oceans 1995, 100, 7037–7044. [Google Scholar] [CrossRef]
- de Boer, G.J.; Pietrzak, J.D.; Winterwerp, J.C. SST Observations of Upwelling Induced by Tidal Straining in the Rhine ROFI. Cont. Shelf Res. 2009, 29, 263–277. [Google Scholar] [CrossRef]
- Lü, X.; Qiao, F.; Wang, G.; Xia, C.; Yuan, Y. Upwelling Off the West Coast of Hainan Island in Summer: Its Detection and Mechanisms. Geophys. Res. Lett. 2008, 35, L02604. [Google Scholar] [CrossRef]
- Li, Y.; Curchitser, E.N.; Wang, J.; Peng, S. Tidal Effects on the Surface Water Cooling Northeast of Hainan Island, South China Sea. J. Geophys. Res. Oceans 2020, 125, e2019JC016016. [Google Scholar] [CrossRef]
- Jing, Z.; Qi, Y.; Du, Y. Persistent Upwelling and Front over the Sulu Ridge and their Variations. J. Geophys. Res. Oceans 2012, 117, C11011. [Google Scholar] [CrossRef]
- Gregory Lough, R.; Manning, J.P. Tidal-Front Entrainment and Retention of Fish Larvae on the Southern Flank of Georges Bank. Deep Sea Res. Part II Top. Stud. Oceanogr. 2001, 48, 631–644. [Google Scholar] [CrossRef]
- Simpson, J.H.; Hunter, J.R. Fronts in the Irish Sea. Nature 1974, 250, 404–406. [Google Scholar] [CrossRef]
- Garrett, C.J.R.; Loucks, H. Upwelling along the Yarmouth Shore of Nova Scotia. J. Fish. Res. Board Can. 1976, 33, 116–117. [Google Scholar] [CrossRef]
- Xia, Z.; Guo, B. Cold Water and Upwelling around the Tips of Shandong Peninsula and Liaodong Peninsula. J. Oceanogr. Huanghai Bohai Seas 1983, 1, 13–19. [Google Scholar]
- Guo, B.; Xia, Z. An Analytical Model of Upwelling Induced by Tidal Current around the Peninsula. Acta Oceanol. Sin. 1986, 8, 272–282. [Google Scholar]
- Lee, H.J.; Chao, S.Y.; Fan, K.L.; Kuo, T.Y. Tide-Induced Eddies and Upwelling in a Semi-Enclosed Basin: Nan Wan. Estuar. Coast. Shelf Sci. 1999, 49, 775–787. [Google Scholar] [CrossRef]
- Hsu, P.; Lee, H.; Zheng, Q.; Lai, J.; Su, F.; Ho, C. Tide-Induced Periodic Sea Surface Temperature Drops in the Coral Reef Area of Nanwan Bay, Southern Taiwan. J. Geophys. Res. Oceans 2020, 125, e2019JC015226. [Google Scholar] [CrossRef]
- Liu, D.; Lv, T.; Lin, L.; Wei, Q. Review of Fronts and its Ecological Effects in the Shelf Sea of China. Adv. Mar. Sci. 2022, 40, 725–741. [Google Scholar] [CrossRef]
- Xu, Y.; Zhou, F.; Meng, Q.; Zeng, D.; Yan, T.; Zhang, W. How Do Topography and Thermal Front Influence the Water Transport from the Northern Laotieshan Channel to the Bohai Sea Interior in Summer? Deep Sea Res. Part II Top. Stud. Oceanogr. 2023, 208, 105261. [Google Scholar] [CrossRef]
- Zhang, R.; Song, J.; Polonsky, A.B.; Wang, L.; Guo, J.; Fu, Y.; Zhao, Q.; Zhang, R. The Spring–Neap Variability and Mechanisms of Long-Term Variations in the Upwelling at the Tip of Liaodong Peninsula, China. Reg. Stud. Mar. Sci. 2022, 55, 102574. [Google Scholar] [CrossRef]
- Meng, X.; Zhang, S. The Effect of Cold SST on Summer Atmosphere Boundary Layer and Sea Fog over the Yellow Sea. Period. Ocean. Univ. China 2012, 42, 16–23. [Google Scholar]
- Chen, R.; Wu, X.; Liu, B.; Wang, Y. Spatiotemporal Distribution of Fishing Grounds in the Bohai Sea and its Adjacent Waters Based on AIS. Mar. Fish. 2022, 44, 780–789. [Google Scholar] [CrossRef]
- Zang, K.; Zhang, G.; Zhao, H.; Xu, X.; Zheng, N.; Wang, J.; Zhang, G. Multiple Factors Dominate the Distribution of Methane and its Sea-To-Air Flux in the Bohai Sea in Summer and Autumn of 2014. Mar. Pollut. Bull. 2020, 154, 111049. [Google Scholar] [CrossRef] [PubMed]
- Yan, T. Features and Classification of Coastal Upwellings off China. Mar. Sci. Bull. 1991, 10, 16–26. [Google Scholar]
- Liu, S.; Zhao, Q.; Wang, Y.; Zhang, Y. Long-Term Variation of Upwelling at the Tip of Liaodong Peninsula: Features and Factors. Oceanol. Limnol. Sin. 2020, 51, 31–39. [Google Scholar] [CrossRef]
- Liu, X.; Wang, D.; Su, J.; Chen, D.; Lian, T.; Dong, C.; Liu, T. On the Vorticity Balance over Steep Slopes: Kuroshio Intrusions Northeast of Taiwan. J. Phys. Oceanogr. 2020, 50, 2089–2104. [Google Scholar] [CrossRef]
- Moon, J.; Hirose, N.; Yoon, J. Comparison of Wind and Tidal Contributions to Seasonal Circulation of the Yellow Sea. J. Geophys. Res. 2009, 114, C08016. [Google Scholar] [CrossRef]
- Liu, Z.; Tang, Y.; Wang, K.; Xia, D.; Berne, S.; Marsset, T.; Bourillet, J.F. Tidal Dynamic Geomorphic System in the East Part of the Bohai Sea. J. Oceanogr. Huanghai Bohai Seas 1996, 14, 7–21. [Google Scholar]
- Bi, C.; Bao, X.; Ding, Y.; Zhang, C.; Wang, Y.; Shen, B.; Wan, K. Observed Characteristics of Tidal Currents and Mean Flow in the Northern Yellow Sea. J. Oceanol. Limnol. 2019, 37, 461–473. [Google Scholar] [CrossRef]
- Liu, H.; Pang, C.; Yang, D.; Liu, Z. Seasonal Variation in Material Exchange through the Bohai Strait. Cont. Shelf Res. 2021, 231, 104599. [Google Scholar] [CrossRef]
- Li, Y.; Wolanski, E.; Dai, Z.; Lambrechts, J.; Tang, C.; Zhang, H. Trapping of Plastics in Semi-Enclosed Seas: Insights from the Bohai Sea, China. Mar. Pollut. Bull. 2018, 137, 509–517. [Google Scholar] [CrossRef] [PubMed]
- Bowers, D.G.; Simpson, J.H. Mean Position of Tidal Fronts in European-shelf Seas. Cont. Shelf Res. 1987, 7, 35–44. [Google Scholar] [CrossRef]
- Liu, H.; Pan, W. Numerical Simulation of the Seasonal Variations of the Stratification and Tidal Front in the Bohai Sea. Adv. Water Sci. 2007, 18, 398–403. [Google Scholar]
- Haidvogel, D.B.; Arango, H.G.; Hedstrom, K.; Beckmann, A.; Malanotte-Rizzoli, P.; Shchepetkin, A.F. Model Evaluation Experiments in the North Atlantic Basin: Simulations in Nonlinear Terrain-following Coordinates. Dynam. Atmos. Oceans 2000, 32, 239–281. [Google Scholar] [CrossRef]
- Egbert, G.D.; Erofeeva, S.Y. Efficient Inverse Modeling of Barotropic Ocean Tides. J. Atmos. Ocean. Technol. 2002, 19, 183–204. [Google Scholar] [CrossRef]
- Da Silva, A.M.; Young, C.C.; Levilus, S. Atlas of Surface Marine Data 1994, Vol. I: Algorithms and Procedures; NOAA Atlas NESDIS 6; NOAA: Washington, DC, USA, 1994.
- Warner, J.; Sherwood, C.; Arango, H.; Signell, R. Performance of Four Turbulence Closure Methods Implemented Using a Generic Length Scale Method. Ocean Model. 2005, 8, 81–113. [Google Scholar] [CrossRef]
- Sun, F.; Yu, F.; Si, G.; Wang, J.; Xu, A.; Pan, J.; Tang, Y. Characteristics and Influencing Factors of Frontal Upwelling in the Yellow Sea in Summer. Acta Oceanol. Sin. 2022, 41, 84–96. [Google Scholar] [CrossRef]
- Lü, X.; Qiao, F.; Xia, C.; Yuan, Y. Tidally Induced Upwelling off Yangtze River Estuary and in Zhejiang Coastal Waters in Summer. Sci. China Ser. D-Earth Sci. 2007, 50, 462–473. [Google Scholar] [CrossRef]
- Lin, X.; Xie, S.; Chen, X.; Xu, L. A Well-Mixed Warm Water Column in the Central Bohai Sea in Summer: Effects of Tidal and Surface Wave Mixing. J. Geophys. Res. 2006, 111, C11017. [Google Scholar] [CrossRef]


Disclaimer/Publisher’s Note: The statements, opinions and data contained in all publications are solely those of the individual author(s) and contributor(s) and not of MDPI and/or the editor(s). MDPI and/or the editor(s) disclaim responsibility for any injury to people or property resulting from any ideas, methods, instructions or products referred to in the content. |
© 2023 by the authors. Licensee MDPI, Basel, Switzerland. This article is an open access article distributed under the terms and conditions of the Creative Commons Attribution (CC BY) license (https://creativecommons.org/licenses/by/4.0/).