Article

A Statistical Analysis of Ship Accidents (1990–2020) Focusing on Collision, Grounding, Hull Failure, and Resulting Hull Damage

by
Aggelos N. Pilatis
1,2,
Dimitrios-Nikolaos Pagonis
1,2,*,
Michael Serris
1,
Sofia Peppa
1 and
Grigoris Kaltsas
2
1
Department of Naval Architecture, University of West Attica, 12243 Athens, Greece
2
microSENSES Laboratory, Department of Electrical and Electronics Engineering, University of West Attica, 12241 Athens, Greece
*
Author to whom correspondence should be addressed.
J. Mar. Sci. Eng. 2024, 12(1), 122; https://doi.org/10.3390/jmse12010122
Submission received: 9 December 2023 / Revised: 4 January 2024 / Accepted: 5 January 2024 / Published: 8 January 2024
(This article belongs to the Section Ocean Engineering)

Abstract

:
In this work, over a thousand maritime casualty reports were reviewed in order to fully investigate and assess selected 213 marine accidents concerning the collision, grounding, and hull failure of ships, which occurred during the time period of 1990–2020, worldwide. Ship type and vessels’ main characteristics, as well as the cause of accidents, were categorized and analyzed statistically. The statistical software IBM SPSS© Statistics v.29 was employed for the investigation of a possible association between the above set criteria. Furthermore, the location and the extent of hull damage was extracted for all incidents, providing valuable insights into the resulting consequences for vessel integrity. These data are essential for estimating the accident’s impact on the viability of the ship, crew, and cargo. According to the main results obtained, significant correlations are deduced regarding the analyzed parameters. In collision accidents, these include the ship type, the location of the damage, visibility and age of the ship, the impact of the accident, and the type of casualty. In the case of grounding incidents, correlations emerge involving the type of ships, day/night period, the width of the resulting damage, the type of casualty, and the cause of accidents.

1. Introduction

Building safer ships is the primary intention of the maritime community, to ensure the protection of human life, the environment, the cargo, and the ships themselves. Accidents that occur during the operation of ships are the source of the most important information for identifying hazards and their causes. In this context, it is a standard procedure after every ship incident for marine accident experts to investigate the cause of the casualty. Thus, each state and the authorized body involved in the investigation regularly publish a casualty report [1,2] for each accident to identify the weaknesses and possible problems that contributed to the accident.
In fact, extensive analysis of accidents and their causes is the main reason for amending a ship’s safety and construction regulations accordingly, to prevent the same accident from occurring again in the future. According to the relevant International Maritime Organization (IMO) Sub-Commission [3], each “initial incident” assigned to appropriate reviewers forming the Correspondence Group on Casualty Analysis, is categorized as: 1. Collision, 2. Stranding or grounding, 3. Contact, 4. Fire or explosion, 5. Hull failure (or failure of watertight doors, ports, etc.), 6. Machinery damage, 7. Damages to the ship or equipment, 8. Capsizing or listing, 9. Missing, 10. Accidents with life-saving appliances, 11. Other.
In Europe, the European Maritime Safety Agency (EMSA) [2] is responsible for providing technical assistance for the implementation of Directive 2009/18/EC establishing the fundamental principles that govern the investigation of accidents in the maritime transport sector. Its activities focus on developing the accident investigation capability of the Member States and the ability to collect and analyze casualty data at EU level. Moreover, accident investigation approaches like CASMET (Casualty Analysis Methodology for Maritime Operations) have been developed to analyze and code maritime accidents, providing valuable insights for safety improvements and the development of risk models tailored to specific accidental scenarios [4]. Additionally, TRACEr (Technique for the Retrospective and Predictive Analysis of Cognitive Errors), originally developed for air traffic control, considers the cognitive framework of the end user and the external factors affecting his performance [5], offering a comprehensive and detailed coding of human errors in accidents, furthering progress in accident investigation.
Furthermore, the classification societies IACS members [6] have also established inspection procedures related to maritime accidents. A standard methodology (Incident Investigation Model) from the American Bureau of Shipping (ABS) [7] is presented as an example of an incident inspection procedure for classification societies in Figure 1a, while the corresponding procedure by IMO is presented in Figure 1b.
According to EMSA’s EMCIP (European Marine Casualty Information Platform) taxonomy) [8], “a casualty event is an unwanted event in which there was some kind of energy release with impact on people and/or ship including its equipment and its cargo or environment”. Casualty events are classified as: capsizing/listing, collision, contact, damage to equipment, grounding/stranding, fire/explosion, flooding/foundering, hull failure, loss of control, missing and non-accidental events.
Although all the above accidental events can potentially affect the vessel’s integrity (e.g., fire, explosion etc.), in this work, particular emphasis was placed on three types of casualty events; i.e., ship collision, grounding, and structural failure due to increased loads. In order to identify the above related casualties, over a thousand reports from maritime accident that occurred during the time period of 1990–2020 were reviewed. From this, a sample of 100 collision cases, 99 cases related to grounding, and 14 related to structural failure was obtained. Thus, the specific sample provides a solid base for an initial and independent analysis, from which several conclusions can be derived regarding particular ship accidents.
Statistical analysis, including correlation investigation among the main factors related to the cause of each incident, was performed using the statistical software IBM SPSS© Statistics [9]. Furthermore, determination of the location and extent of the damage made to each ship involved in an accident was also in the scope of this investigation.
We should note that the presented statistical results in this work are concerning only the three specific types of incidents and they represent a subsample of the overall accidental events analyzed in previous research works. Therefore, it is not in the scope of this paper to evaluate the current level of safety for different vessels subtypes present in the world merchant fleet [10], nor to quantify risk in maritime transportation [11]. Moreover, previous research findings have primarily concentrated on investigating the causes of accidents, analyzing both human and organizational factors to enhance our understanding of accident causation, and developing techniques and causation models [12]. Furthermore, recent studies on ship collisions and groundings, such as the work by Kim et al. [13], focus on passenger ship response in collisions and groundings for typical accident scenarios simulated, while the research conducted by Taimuri et al. [14] assesses the extent of damage to grounded ships, and its effect on ships’ stability. Our study, however, focuses on examining the relationship between three specific types of accidental events and the resulting damage to ships, with a primary emphasis on characterizing the size and location of the damage. Additionally, we explore the correlation between key vessel factors (type, characteristics, age, etc.) and the emerged damage, providing valuable insights into the resulting consequences for vessel integrity. These findings open up new possibilities, such as the development of a real-time hull strength monitoring system with optimal sensor topology tailored to the specific type of ship, to efficiently monitor the vessel’s structural integrity and trigger alarms in response to any potential dangers arising from an accident incident.

2. Literature Review

The investigation of marine casualties considers various factors such as human error, environmental conditions, and ship type. In general, based on the relevant performed studies, human error is the most significant cause of marine casualties, accounting for 80–85% of all incidents [15]. According to E.A. Youssef et al. [16], the underlying causes of human error are mainly fatigue, stress, substance abuse, and poor decision-making. Implementing measures such as enhanced rest periods, positive crew dynamics, drug and alcohol policies, simulation training, and a robust safety culture can significantly reduce the risk of accidents at sea.
T. Olgaç and O. Bayazit [17] assessed the impact of environmental factors on maritime incidents in the Aegean area during 2001–2020, considering the sea location, accident time, vessel type, and nature of the accident. The specific analysis results indicate that yachts and recreational boats in general are the vessel types that experience the most accidents, while hull and engine failure are the most common accident types. Furthermore, maritime accidents occur most frequently during the summer season.
Furthermore, considering worldwide accident investigation reports for the period 2010–2019, the findings reveal that the severity of marine accidents is positively linked to sinking incidents, occurrences far from port, strong winds, heavy seas, strong currents, and/or good visibility. Regarding ship types, fishing vessels, yachts, and sailing vessels, as well as other ship types, are those most commonly associated with a higher severity of accidents [18]. Moreover, a recent study by H. Lan et al. [19], covering almost the same period (2010–2020), analyzed a total of 1554 maritime accidents involving cargo ships, passenger ships, tankers, offshore vessels, and miscellaneous ships. The key findings indicate that ships aged over 20 years, along with hull/machinery damage and foundering, are the primary factors contributing to the total loss of ships.
N.J. Ece [20] investigated accidents that occurred in the Strait of Istanbul (connecting the Black Sea to the Sea of Marmara) during the “right-side up” scheme period from 1982 to 2010, using statistical methods such as frequency distribution and chi-square (χ2) analysis. The results concluded that the most frequent type of incident was collisions, followed by groundings; both were primarily caused by human error. Moreover, it was observed that there existed a statistical correlation between the type, the cause, and the zone of the accident [20].
The chi-square test is commonly employed to assess the level of correlation between two factors and to investigate the interactions between all independent factors and the fitted distributions. In a study conducted by Xintong Liu [21], it was determined that three critical factors, i.e., the type of accident, type of vessel, and whether it was day or night, significantly influence marine casualties in the coastal waters of China, as identified through an analysis of historical accident records.
P. Antao et al. assessed accidents that occurred between 2005 and 2017, evaluating the contribution of specific risk factors to the occurrence of ship collisions [22]. In the specific study, the effects of six Risk Influencing Factors (RIFs) were analyzed, i.e., ship type, ship length, flag, class, age, and geographical area. According to the obtained results, the most commonly involved ship types in collisions are: general cargo (22%), container ships (20%), bulk carriers (20%), tugs (18%), and oil and chemical tankers (15%).
N. P. Ventikos et al. [23] examined maritime accidents over a 10-year period (1999–2009), within specific Aegean Sea zones, demonstrating that 35% of accidents were due to hull or machinery failure, while 37% resulted from collision or contact. According to the available data, the Greek flag, which presents low risk [24], recorded the highest number of accidents. Furthermore, the most common types of vessels involved in accidents are ro-ro (25%) and bulk carriers (35%); these account for a combined total of 60% of all accidents. Additionally, a significant percentage of the vessels involved in these accidents are over 25 years old, indicating that older vessels may be at a higher risk for accidents.
J. Deng et al. [25] analyzed maritime accidents in China over the past 20 years. The findings demonstrate that a significant proportion of vessels (41%) were involved in collision incidents; 4% of these experienced grounding accidents, and 18% experienced sinking. In addition, 13% of the ships suffered a major accident, and 4% suffered a severe event. The primary cause of these maritime incidents, however, can be attributed to human factors.
Regarding the frequency of marine accidents over recent years, a 20-year analysis spanning from 2001 to 2020 conducted by X. Zhou et al. [26] on global maritime accidents, revealed significant spatial variations in their distribution across different time periods. This suggests that not only did the frequency of accidents change over the years, but the locations or regions where these accidents occurred also displayed diverse patterns, reflecting notable fluctuations in both the temporal and spatial aspects of maritime accidents. Furthermore, according to the specific study, a substantial decrease in accidents was observed in 2020.
Numerous studies have also analyzed the structural reliability of vessel hulls [27] in various types of accident, including collisions and groundings, while various investigations have also been conducted into the causes of these accidents and relevant risk assessment variables [28,29,30,31,32,33,34,35,36,37,38]. Considering the pertinent research findings presented above, it is crucial to prioritize the enhancement of ship safety and reliability. This is not only essential for protecting human lives but also for safeguarding the marine environment. While the examination of marine accidents holds vital importance in understanding patterns, trends, and contributing factors to improve maritime safety, this task is inherently complex due to the heterogeneity and complexity of available data sources [39]. Diverse reporting standards, data collection methodologies, and data-sharing practices across multiple sources significantly impact the analysis of marine accidents.
Furthermore, as emphasized in the introduction section, previous research has predominantly focused on the causes of accidents, without a comprehensive exploration of the resulting damage to involved vessels, including its characteristics such as size and location. Additionally, there is a scarcity of information regarding the correlation between key vessel factors (type, characteristics, age, etc.) and the resulting damage.

3. Methodology

As already mentioned in the previous section, over a thousand maritime casualty reports were identified and collected by the official marine accident investigation branches worldwide (presented in Appendix A). From these, a sufficient number of accidents and their corresponding investigations reports, particularly those related to hull damage, were selected. Furthermore, to obtain additional information regarding the ships’ specifics, details on the identity and size of each vessel involved were sought through thorough repetitive searches on reputable websites such as Marine Traffic and Vessel Finder. As a result, an appropriate database was created for the three main vessel categories of damage (i.e., collision cases, grounding cases, and structural failure cases).
The extracted and validated data for each category relevant to the involved vessel’s details (ships’ characteristics) are the following: name, IMO number, length O.A., beam, depth, draft (summer), gross tonnage, deadweight (max.), type of ship, size of ship, age, flag and risk of flag.
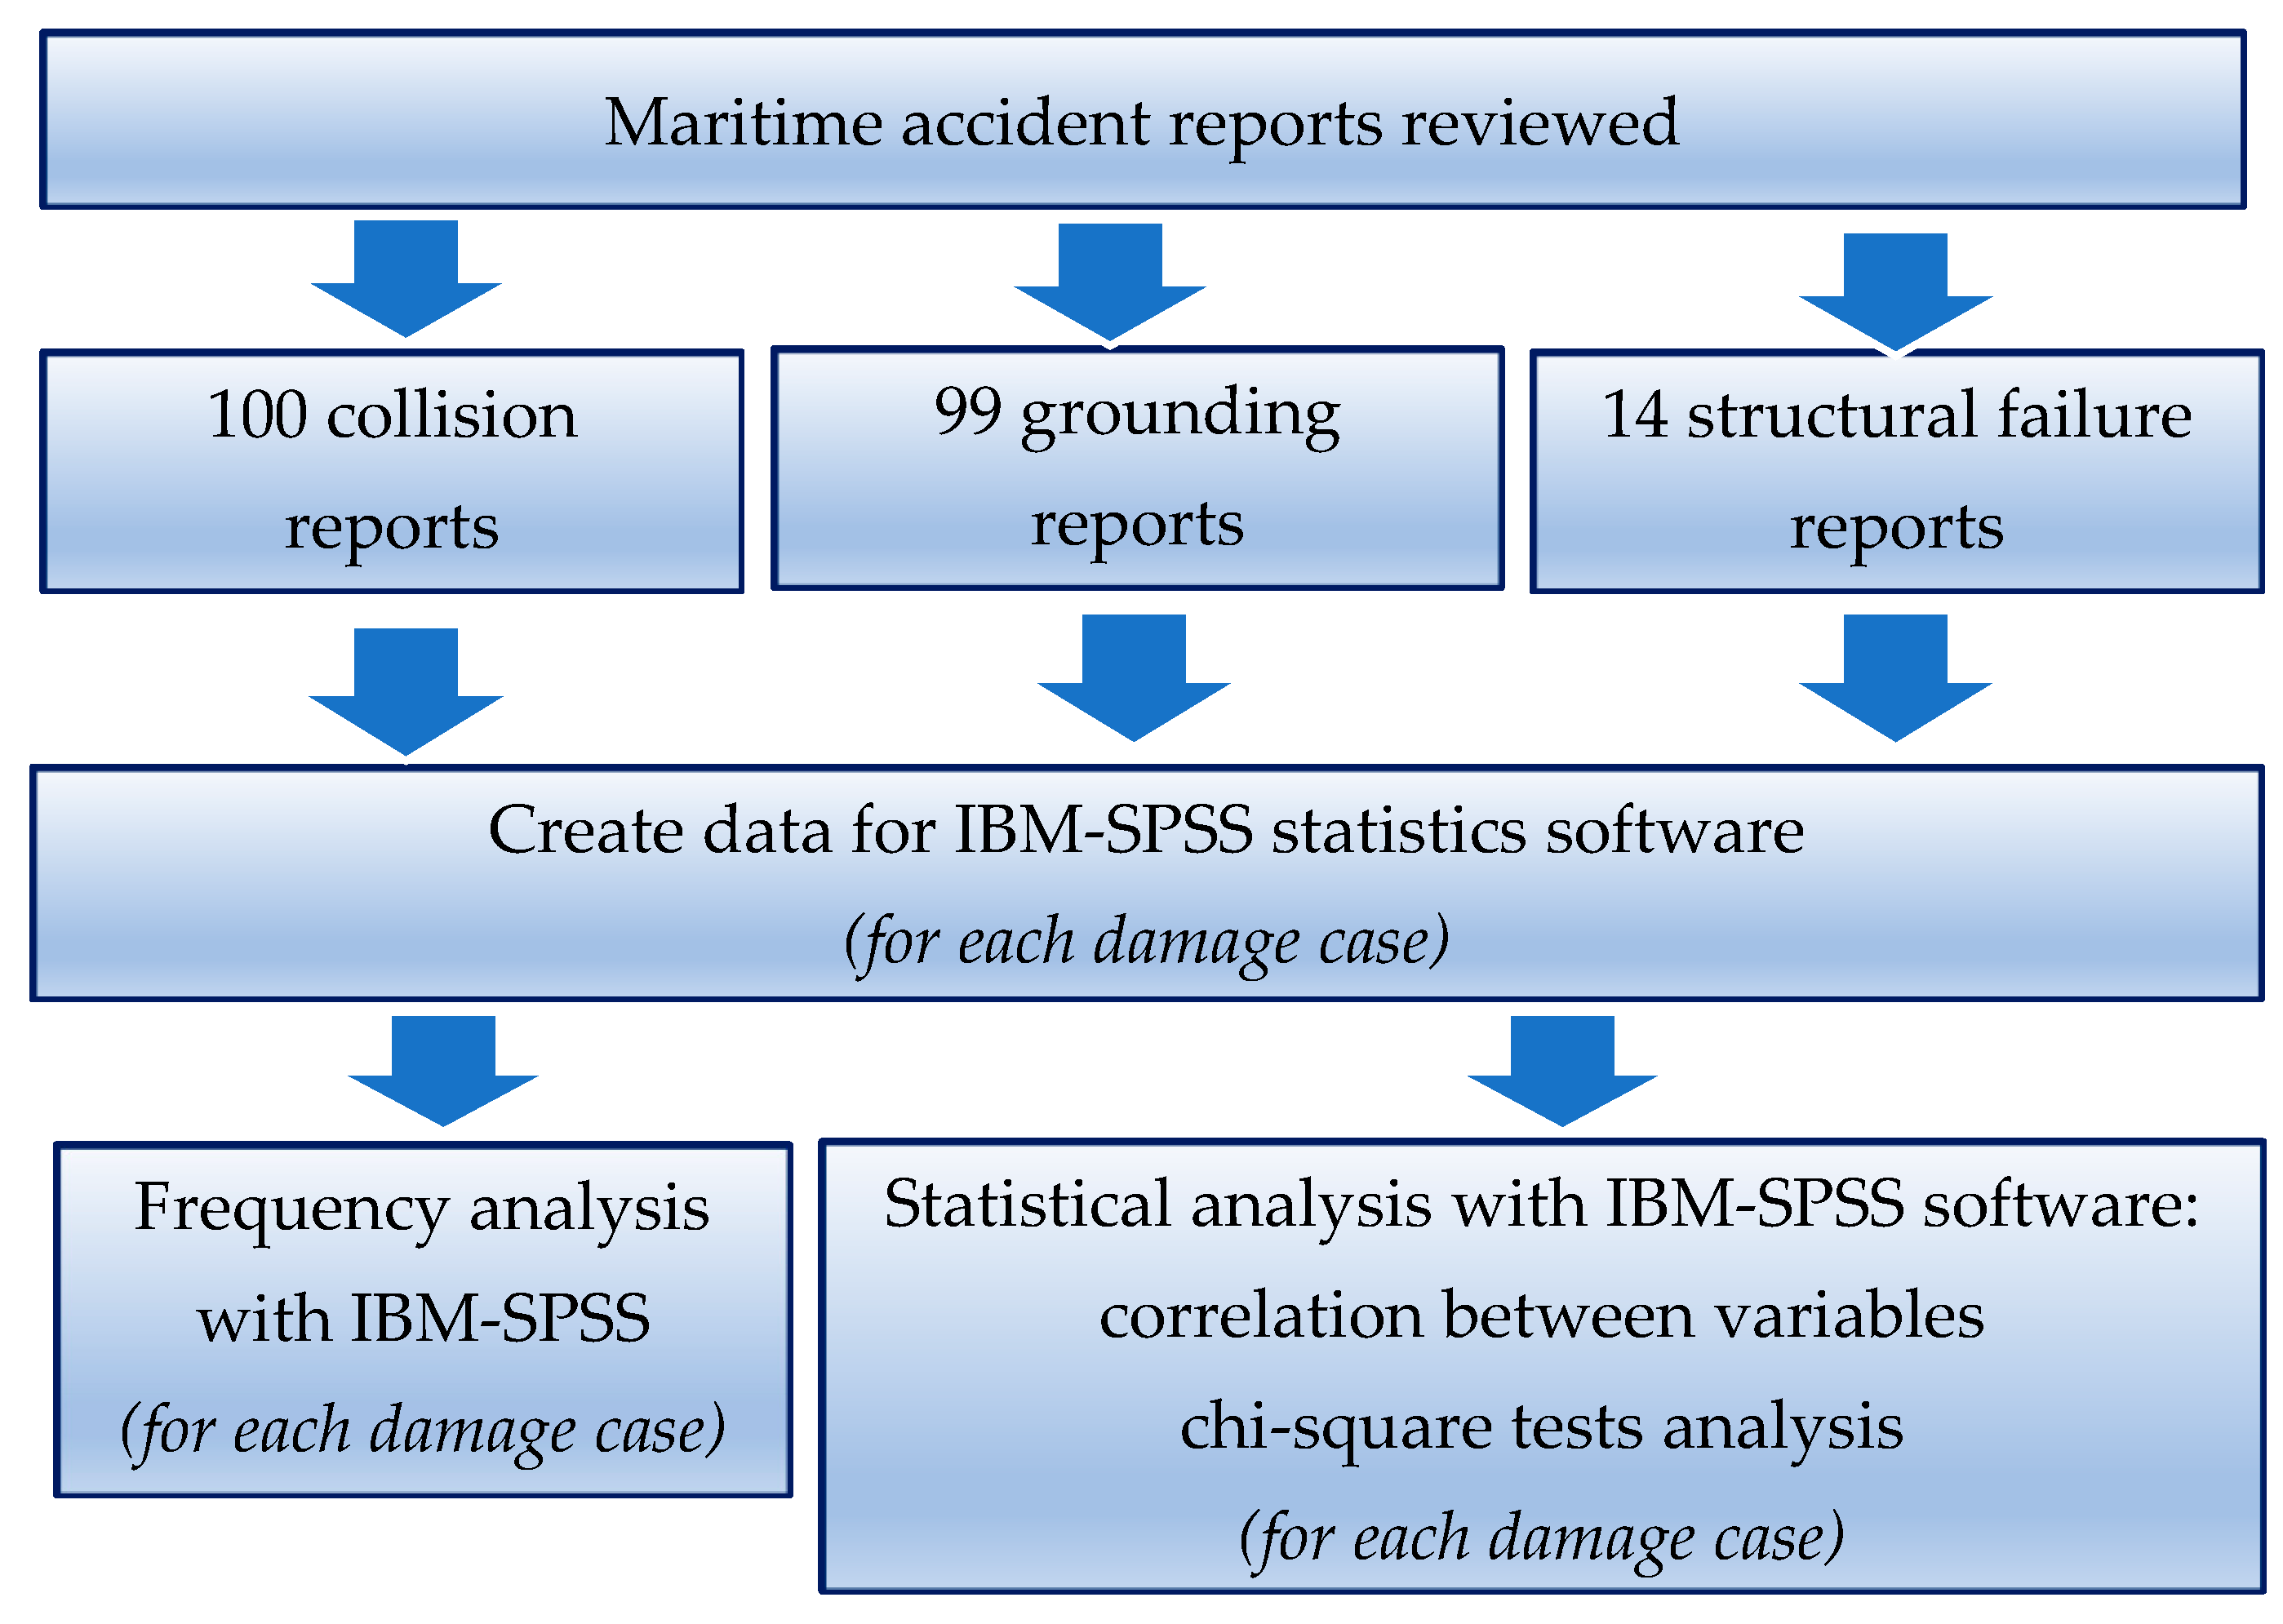
The corresponding information regarding weather conditions and natural light during the accident is: wind force state, sea state, visibility level, presence of natural light (day/night). Information regarding the description of damage to the vessel is: size of damage (length, height or width extents and area of damage), location of damage (longitudinal, vertical or transverse, side of damage). Furthermore, information related to each incident includes: casualty event severity, impact of the accident, EMSA/IMO cause of accident, type of casualty, and date of occurrence. All the above information was extracted from the available data (related to worldwide marine accidents that occurred during the specific time period) and was categorized accordingly in order to carry out the necessary statistical analysis, employing IBM SPSS© Statistics [9]. In more detail, a frequency analysis of the data variables and an appropriate correlation study was performed for a given set of combinations of the key factors, employing the chi-square test and the Monte Carlo method. We should note that frequency analysis is a form of content analysis that simplifies the comprehension of the density and significance of a specific item, while the chi-square test was employed to examine significant connections among variables included in the data set in order to test the interrelation between two nominal variables. The null hypothesis (H0) posits that the two nominal variables are unrelated, meaning that there is no notable correlation between them [40]. The necessary categorizations are presented in the following paragraphs, while the overall procedure followed is illustrated in Figure 2.

3.1. Type of Vessels and Vessels Characteristics

This research was carried out for SOLAS vessels that have an Automatic Identification System (AIS) installed onboard. The involved ships were grouped based on their type, i.e., container ships, general cargo ships, bulk carriers, passenger ships, tankers, ro-ro/vehicle carriers, tug/special vessels, trawlers, and LNG carriers. The corresponding distribution is shown in Figure 3. The characteristics of the vessels (length, breadth, draft and deadweight) were categorized accordingly for the purposes of the specific analysis.

3.2. Vessels Size

The vessels were also categorized concerning to their size, as shown in Table 1, taking into account the criteria applicable to their category. Note that, with regard to the category of dry bulk carriers and tankers, they were divided by their carrying capacity, according to the global criteria that have been established, as small, medium, large, very large, and ultra large [41].

3.3. Vessels’ Ages

The age of each vessel was categorized as follows:
-
New vessel: 1–5 years;
-
Middle vessel: 5–25 years;
-
Old vessel: 25+ years.

3.4. Risk of Vessels’ Flags

Flag risk was considered a significant criterion for vessel categorization, and was taken into consideration in this study. Each flag is defined according to the Paris MoU criteria [42], thus, the risk of a vessel being involved in an incident was categorized as:
-
Low risk: Ships whose flag is on the “White” flag list (considered to have a consistently high level of compliance with maritime safety and pollution prevention conventions);
-
Medium risk: Ships whose flag is on the “Grey” list (considered to have some weaknesses in their implementation of maritime safety and pollution prevention regulations);
-
High risk: Ships whose flag is on the “Black” flag list (considered to have demonstrated a persistent disregard for maritime safety and pollution prevention standards);
-
Very high risk: Ships whose flag is at the top of the list of countries on the black list (considered to have a high detention record).

3.5. Damage Location and Size Estimation

In order to estimate the location and the extent of the damage to each vessel involved in an accident, the following methodology was employed. According to the type of vessel, subdivision into appropriate sections for each of the three dimensions (length, width, and height) was carried out. For damage length, the typical profile arrangement drawing for each specific ship type was taken into account. The length between perpendiculars was divided into 10 sections of equal distance, i.e., 10% of the LBP, as shown in Figure 4. Note that the initial division (0) is located at the A.P. (Frame Nr. 0), while the last division (100% of LBP) is located at the F.P., accordingly. Before or after these two divisions, however, the Transom and Fore End (F.E.) sections of the vessel are placed, respectively; these are also considered in the damage length recording.
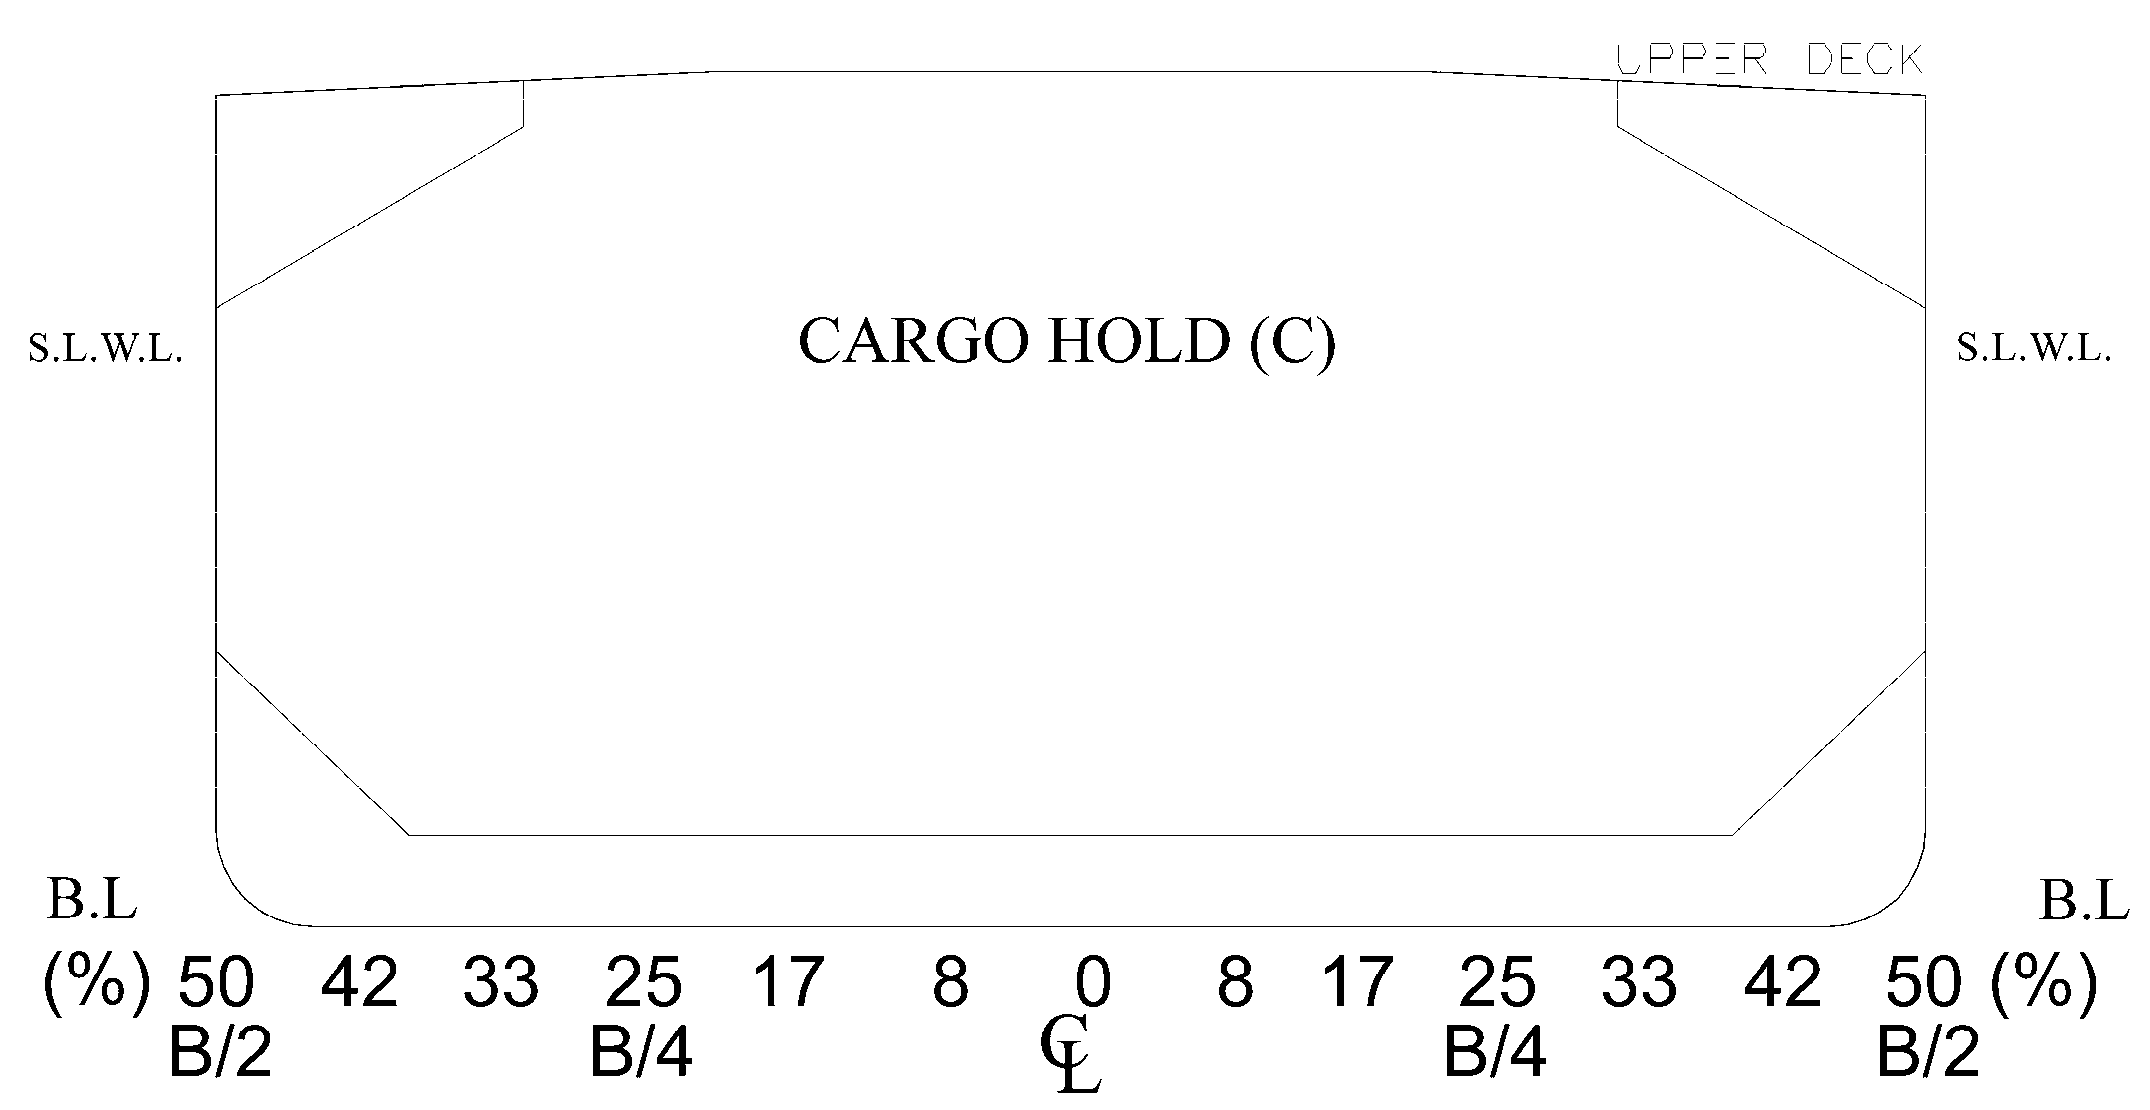
To estimate the width of the damage, a typical midship section for the specific ship type was employed, while half of the ship’s breadth was divided into 6 equal parts from C.L. to outboard (port or starboard side), i.e., per 1/12 of the whole breadth, as shown in Figure 5. With respect to the height of the external hull damage, the division was not based on the ship’s depth, but on the proximity of the damage to the vessel’s bottom (B.L.), the load waterline (max. draught) and the main deck. In cases where the damage extended above the main deck (upper watertight deck), the incident was excluded from the investigation, since it was assumed that it did not have a significant impact on the ship.
The location of the damage (for each ship after the accident) was extracted from the information provided in each of the reports issued by the appropriate authorities. We should note that in a significant portion of the investigated accidents, the affected compartments may number more than two. For that reason, we have identified all the possible combinations of the compartments that have been affected in the reviewed incidents. The transverse and bottom damage locations for the incidents were also studied.

3.6. Impact of the Accident and Type of Casualty

The condition of the ship after the accident was classified into two categories:
-
“Damages were repaired”: the ship was able to complete its voyage or had been towed for repairing.
-
“Total Loss”: the ship was unable to continue its voyage because it sank or the damage was too expensive to repair.
Furthermore, in accordance with the criteria set by the IMO [1] for assessing the consequences of an accident and its impact on the ship (type of casualty), the assessment of accidents was made as follows:
-
Less serious marine casualty;
-
Serious marine casualty;
-
Very serious marine casualty.

3.7. Cause of Accident

The categorization for the source of the accident that was deduced after reviewing all the corresponding incident reports was as follows:
-
Engineering failure (propulsion, main engine, steering system, or anchor);
-
Crew’s operational mistake;
-
Navigational device failure (ECDIS Electronic Chart Display and Information Systems faults);
-
Environmental conditions (extreme weather conditions such as high-speed winds/waves, heavy fog and high tides, including the squat effect);
-
Wrong maneuvering;
-
Contravention of rules (COLREGs—IMO, STCW—IMO, MLC—ILO and SOLAS conversion);
-
Inappropriate loading.
We should note that the categorization of cause analysis according to EMSA [2] does not include the category “Inappropriate loading” since it is considered to be the crew’s operational mistake. Therefore, the analysis was performed according only to EMSA causes of accidents, excluding inappropriate loading (which was considered to be the crew’s operational mistake).

3.8. Conditions during the Accident

The local weather conditions in the region at the time of the accident, together with the visibility and the presence of natural light were processed and categorized, as presented in Table 2:
-
Wind speed, based on the Beaufort scale [43];
-
Sea state, based on the Douglas scale [44];
-
Visibility based on the corresponding IMO classification [45];
-
Presence of natural light (day or night).
As mentioned above, possible association of the above set criteria was investigated, performing an appropriate correlation study for a given set of combinations of the key factors, employing the chi-square test and Monte Carlo method. The factors investigated are presented in Table 3; note that all the possible combinations for each of the factors situated in the same row of cells of the table were investigated; e.g., risk of flag (as described in Section 3.4) (variable A) and impact of the accident (variable B), etc.

4. Results

4.1. Statistical Data Analysis—Frequency Analysis (Percentages)

Having defined the criteria presented in the previous section, statistical analysis was performed initially in order to investigate the frequency distribution of the vessel’s characteristics in the case of: collision, grounding, and hull failure due to increased loads. This includes failure of the ship’s steel structure due to the application of high bending forces, which can be attributed to factors such as poor loading practices, inadequate maintenance of the ship, or adverse weather conditions. The corresponding percentages regarding deadweight, size, age, and flag risk of the vessel involved in an accident are presented in Table 4, Table 5, Table 6 and Table 7, respectively.
According to the above table, ships with a deadweight tonnage (D.W.T.) of 0–1500 T are the most frequently involved in collision accidents, accounting for 21.5% of incidents. This is followed by ships with a D.W.T. of 5000–10,000 T, accounting for 12.5%, and ships with a D.W.T. of 60,000–100,000 T, making up 11.0%.
For grounding incidents, ships with a D.W.T. of 2500–15,000 T are most frequently involved, accounting for 26.3%, followed by ships with a D.W.T. of 5000–10,000 T, accounting for 20.2%, and ships with a D.W.T. of 0–1500 T, accounting for 12.1%.
In hull structural failure accidents, the most frequently involved ships are those with a D.W.T. of 60,000–100,000 T, which account for 26.7% of incidents, which is approximately one-third of all vessels.
Based on the above table, we can infer that the majority of the vessels involved in all three types of incidents were of small size, followed by medium-sized vessels; this pattern suggests a correlation between vessel size and the likelihood of incidents.
The above results indicate that low-risk flag ships are the most numerous in all three categories of accidents. Additionally, just over 10% of the accidents involving structural failure were attributed to ships with a high-risk flag.
The frequency distribution for the three types of marine accidents according to EMSA Cause analysis is presented in Figure 6 as follows.
Figure 6a–c clearly illustrates that human error (crew’s operational mistakes) was the primary cause in all three accidents; it is noteworthy that incorrect maneuvering played a significant role in each case. In collisions, rule contravention (COLREGs—IMO, STCW—IMO, MLC—ILO, and SOLAS conversion) accounted for almost 20% of accidents, while navigational device failure contributed to 16.1% of groundings. Environmental conditions (extreme weather conditions such as high-speed winds/waves, heavy fog and high tides, including the squat effect) were responsible for 25% of structural failure accidents.
The severity of the incident, the extent, and the location of damage for all vessels involved in an accident regarding: (a) collision, (b) grounding, and (c) hull failure are presented in Figure 7, Figure 8, Figure 9, Figure 10, Figure 11, Figure 12, Figure 13, Figure 14 and Figure 15, accordingly.
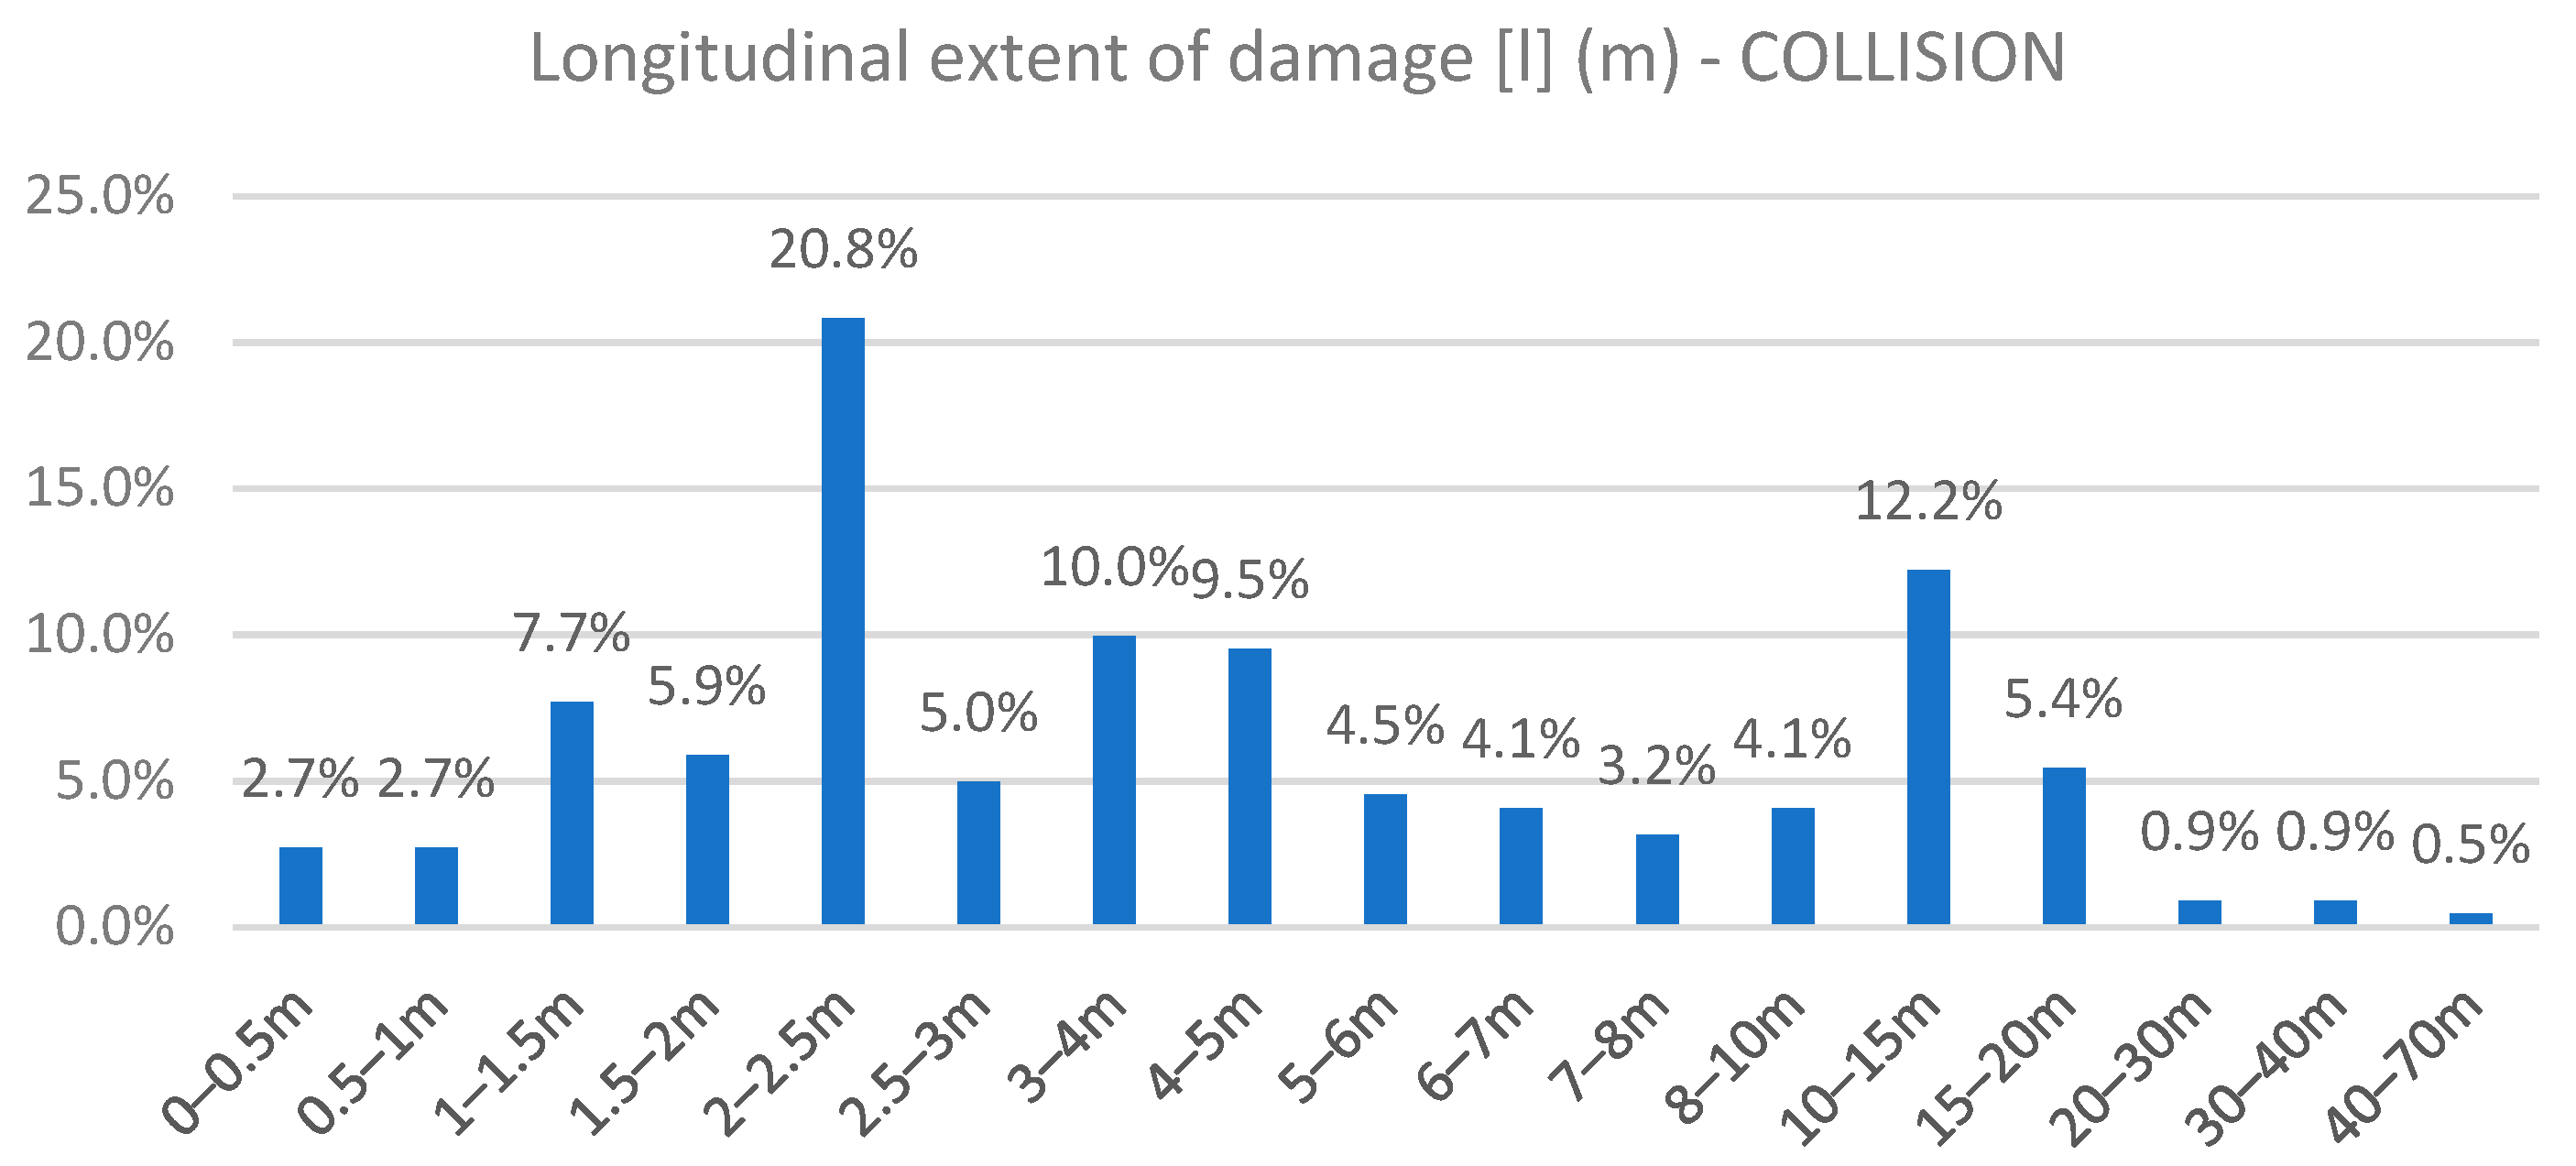
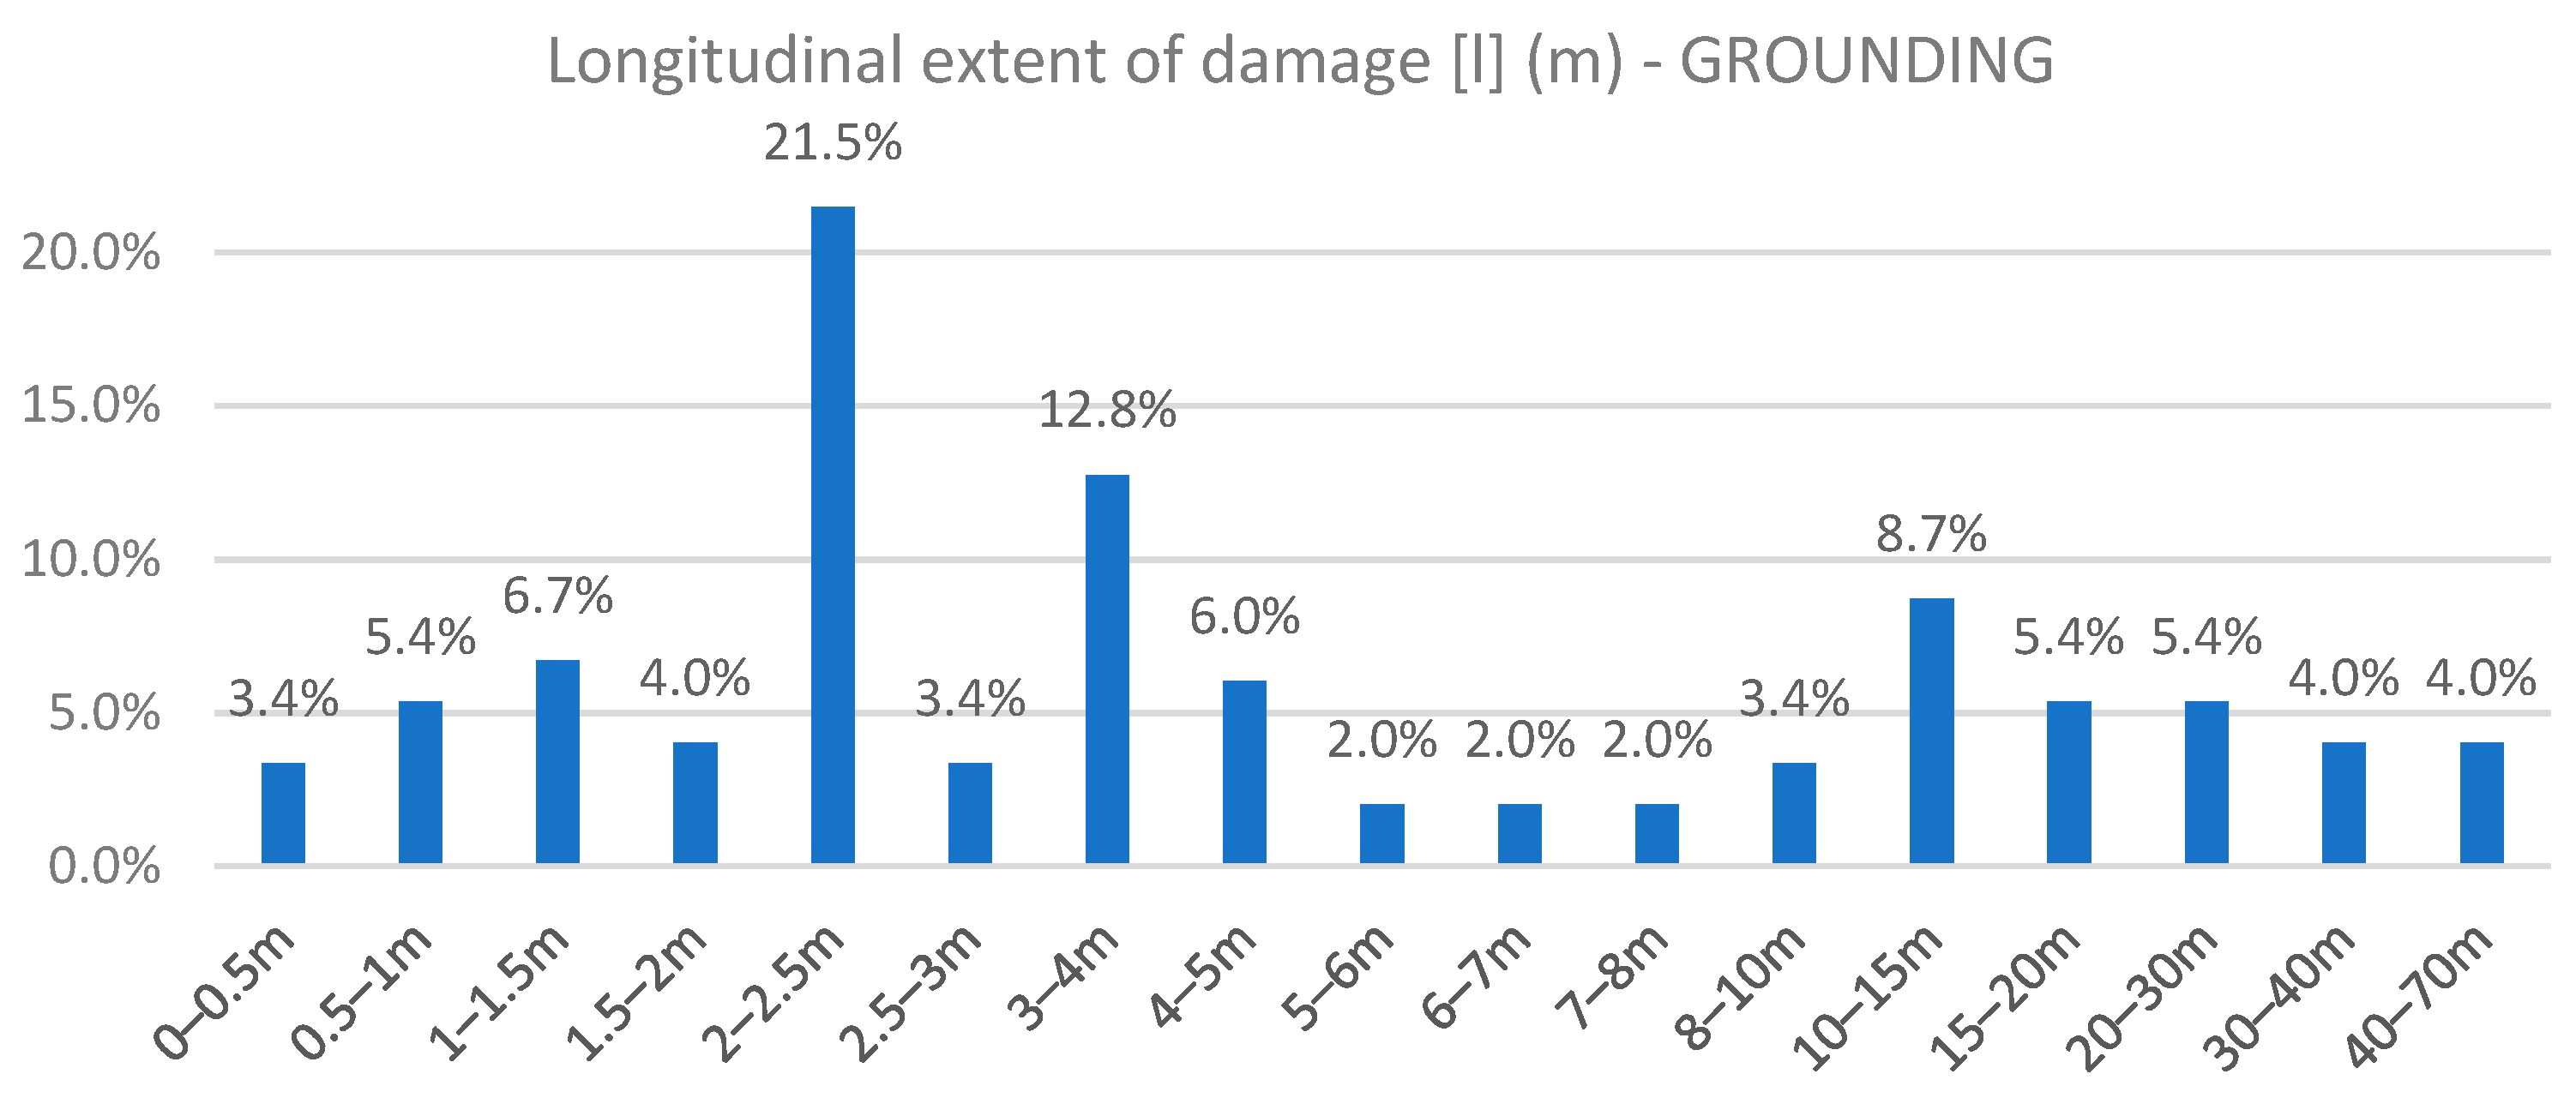
Based on Figure 7 and Figure 8, it is evident that the most significant damage length (longitudinal extent) for collision and grounding accidents over 20% is 2–2.5 m, followed by 3–4 m, 4–5 m, and 10–15 m.
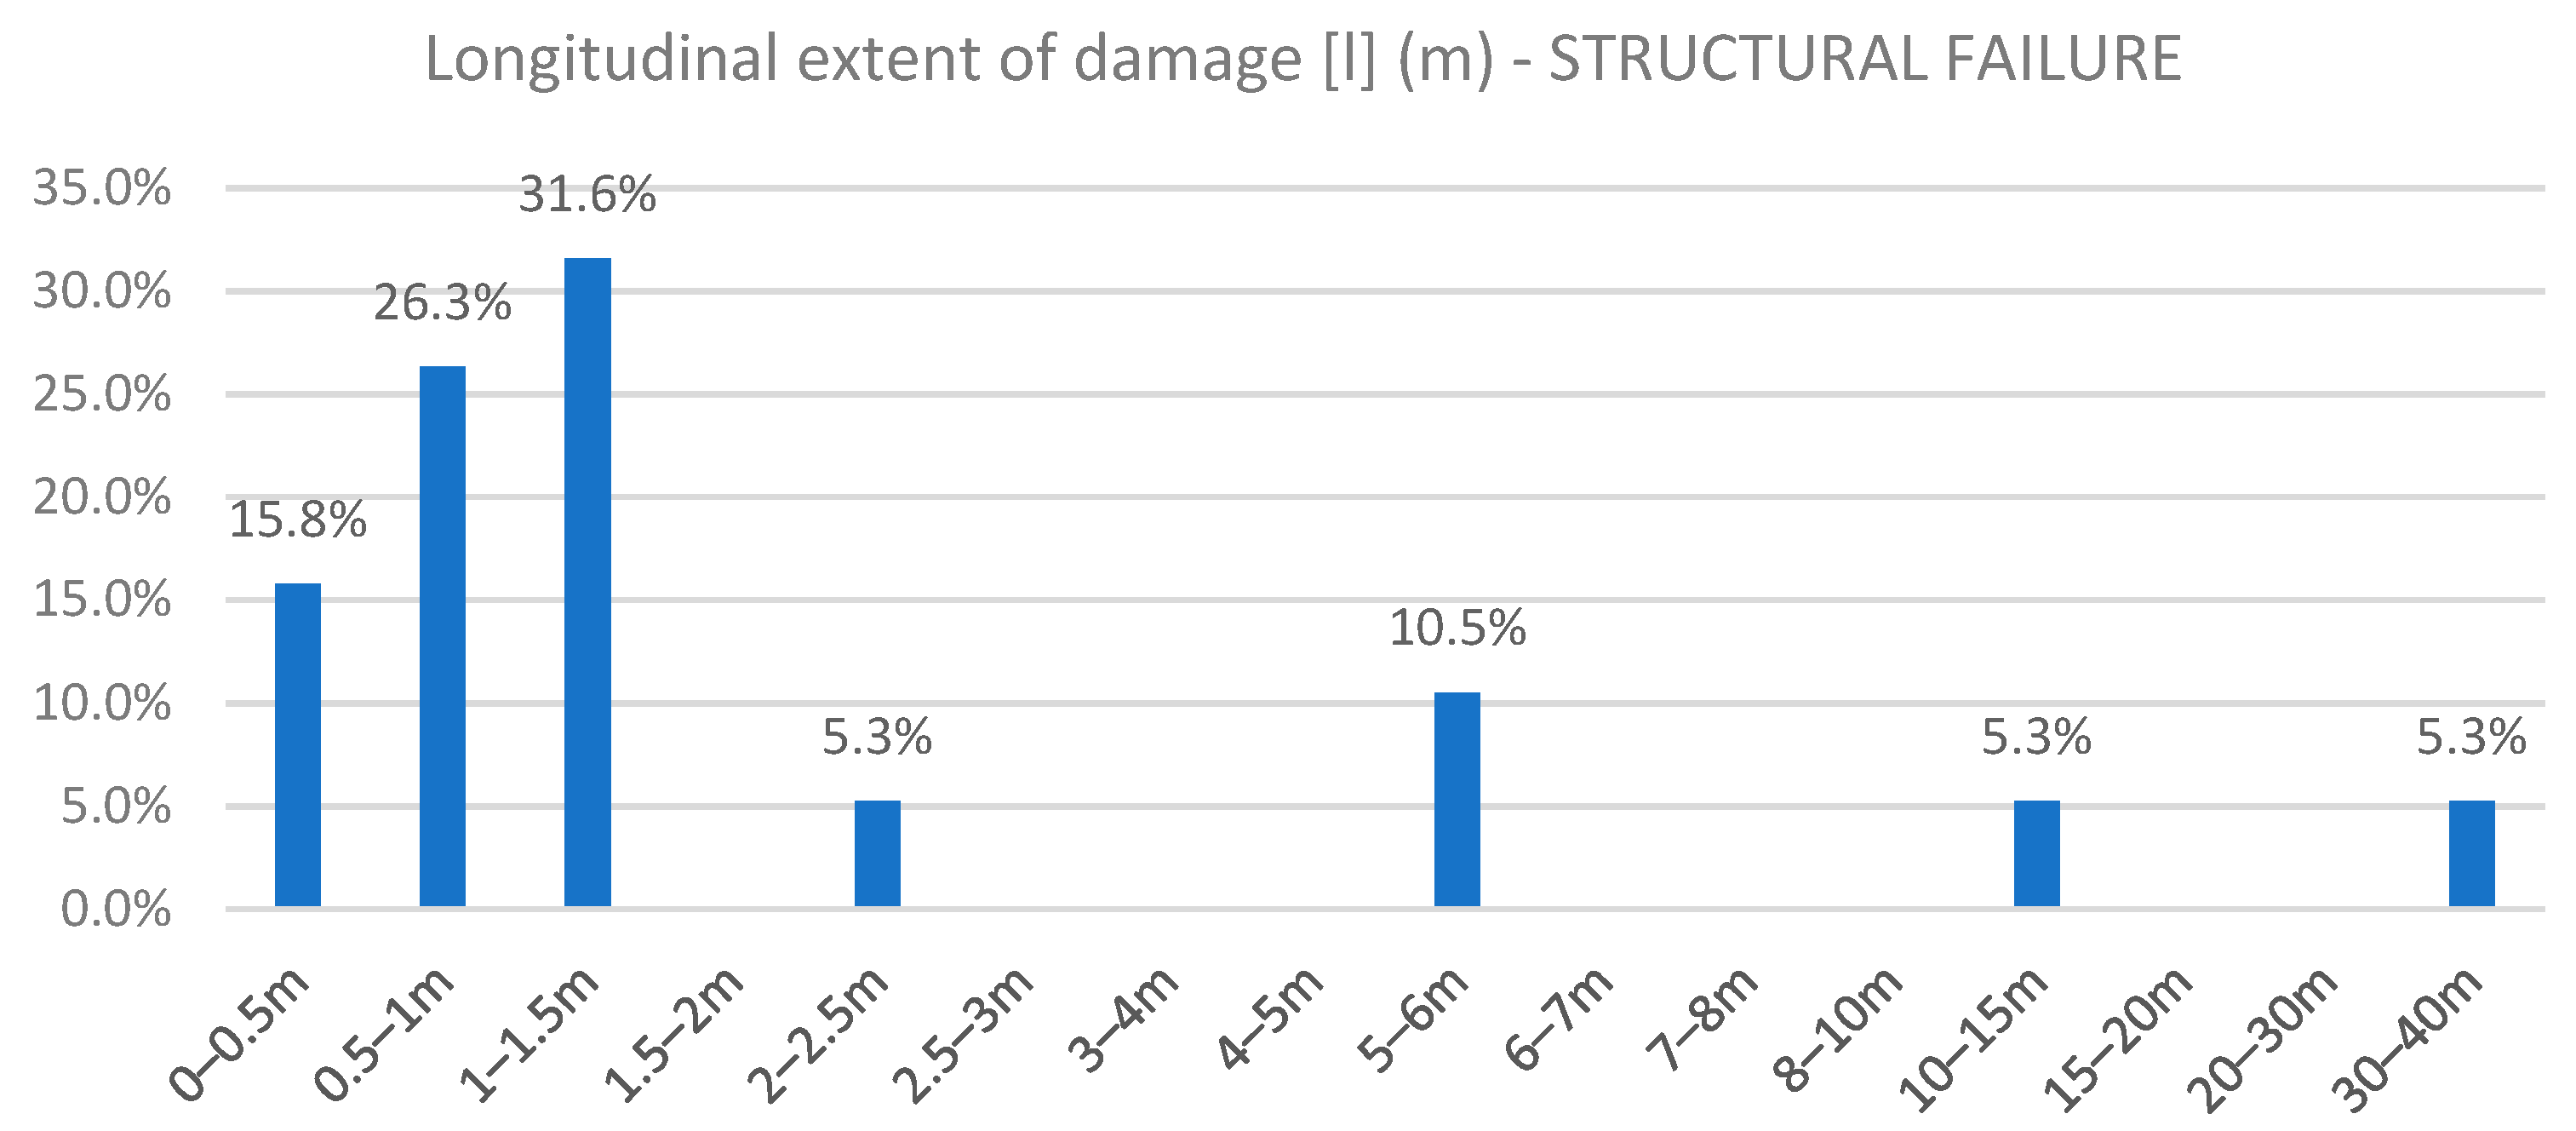
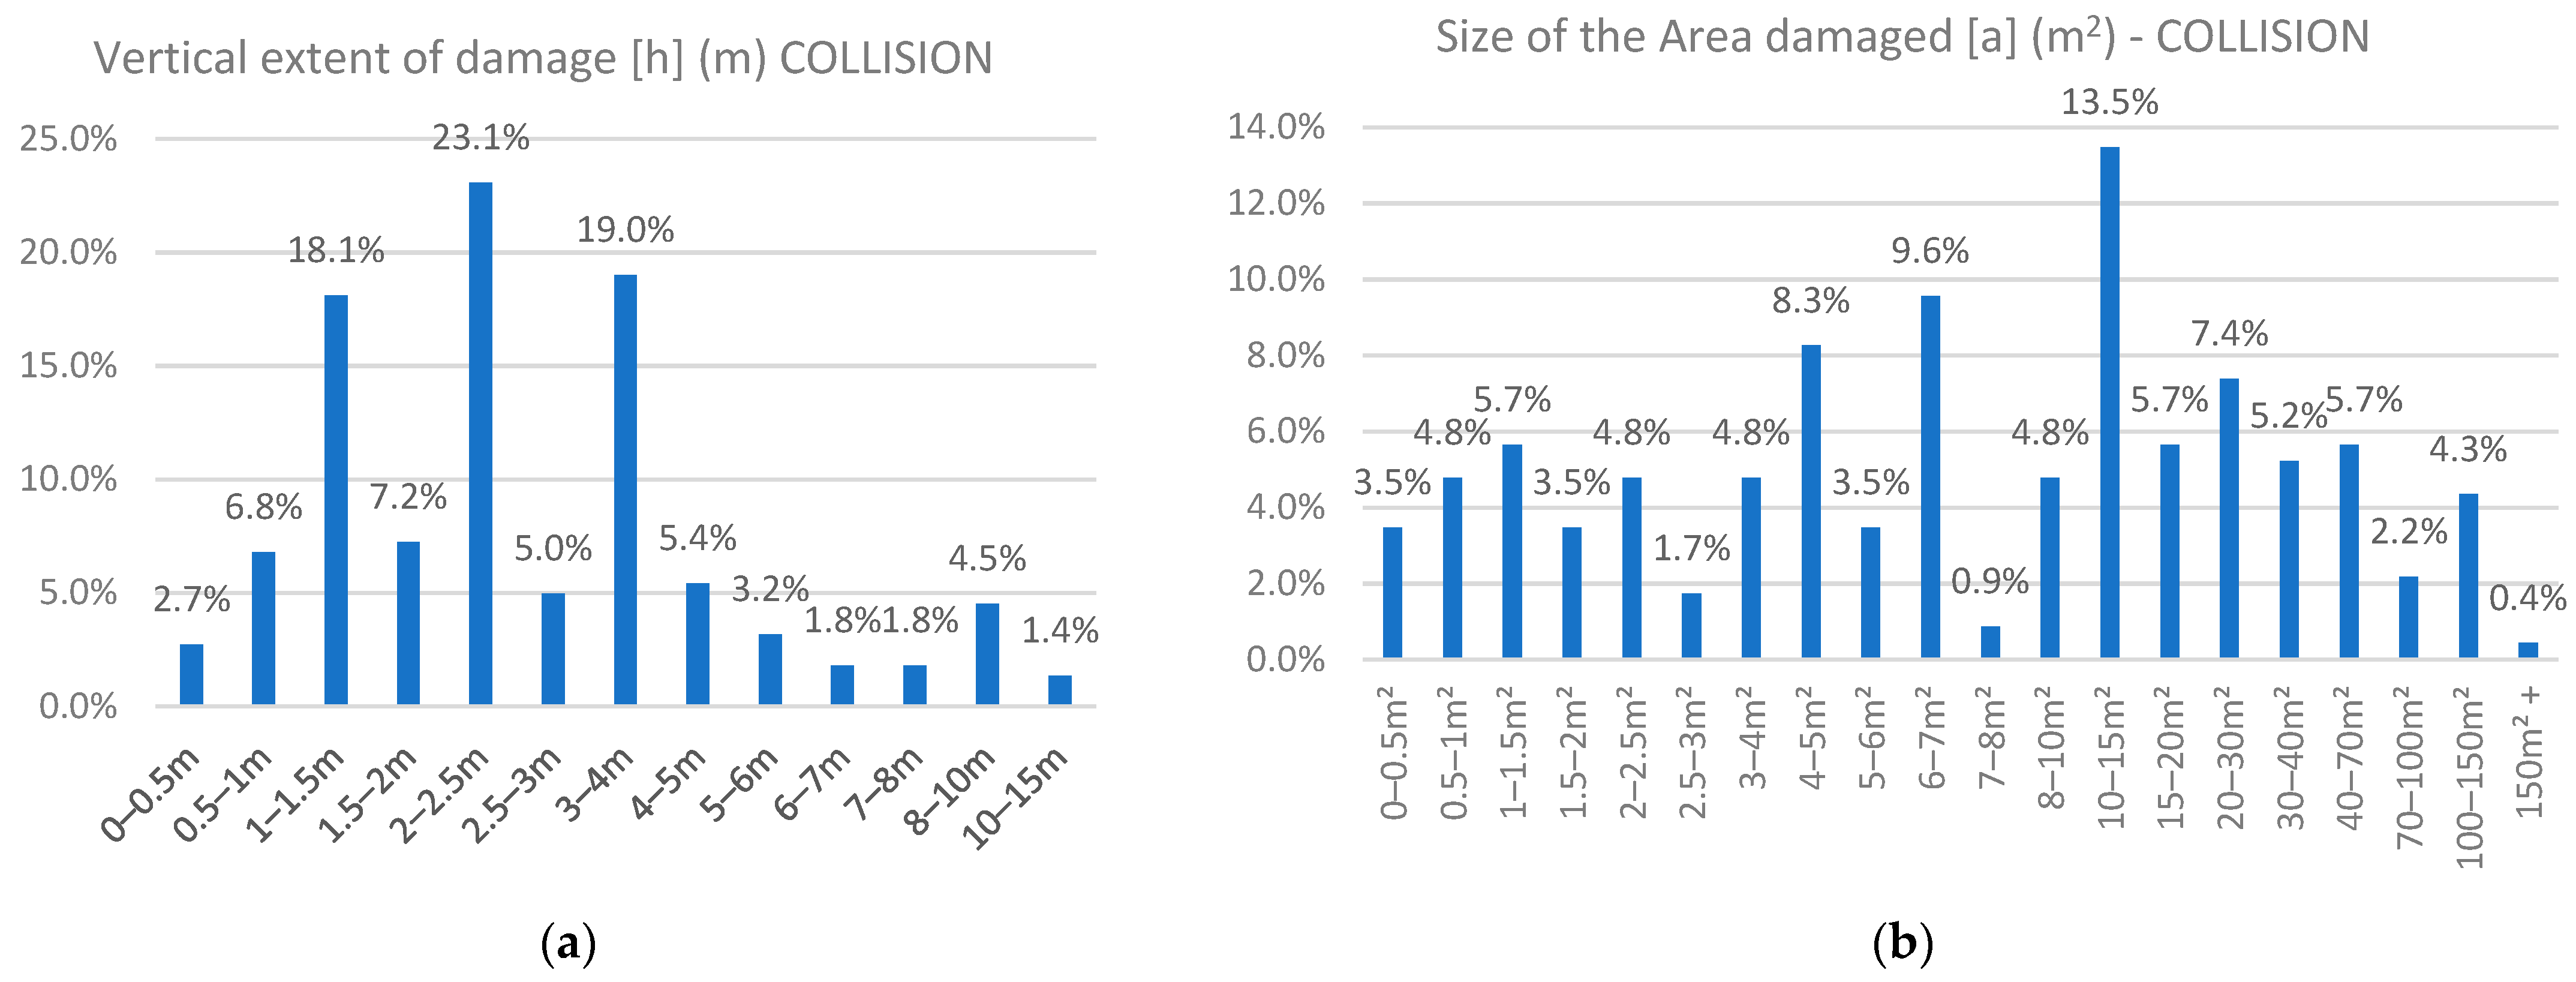
Figure 9 indicates that the longest damage length (longitudinal extent) for hull structural failure is 1–1.5 m, followed by 0.5–1 m, and 0–0.5 m. Additionally, based on Figure 10a,b regarding collision accidents, the largest damage height (vertical extent) is 2–2.5 m, followed by 3–4 m, and 1–1.5 m; the largest damaged area deduced was 10–15 m2, followed by 6–7 m2, and 4–5 m2.
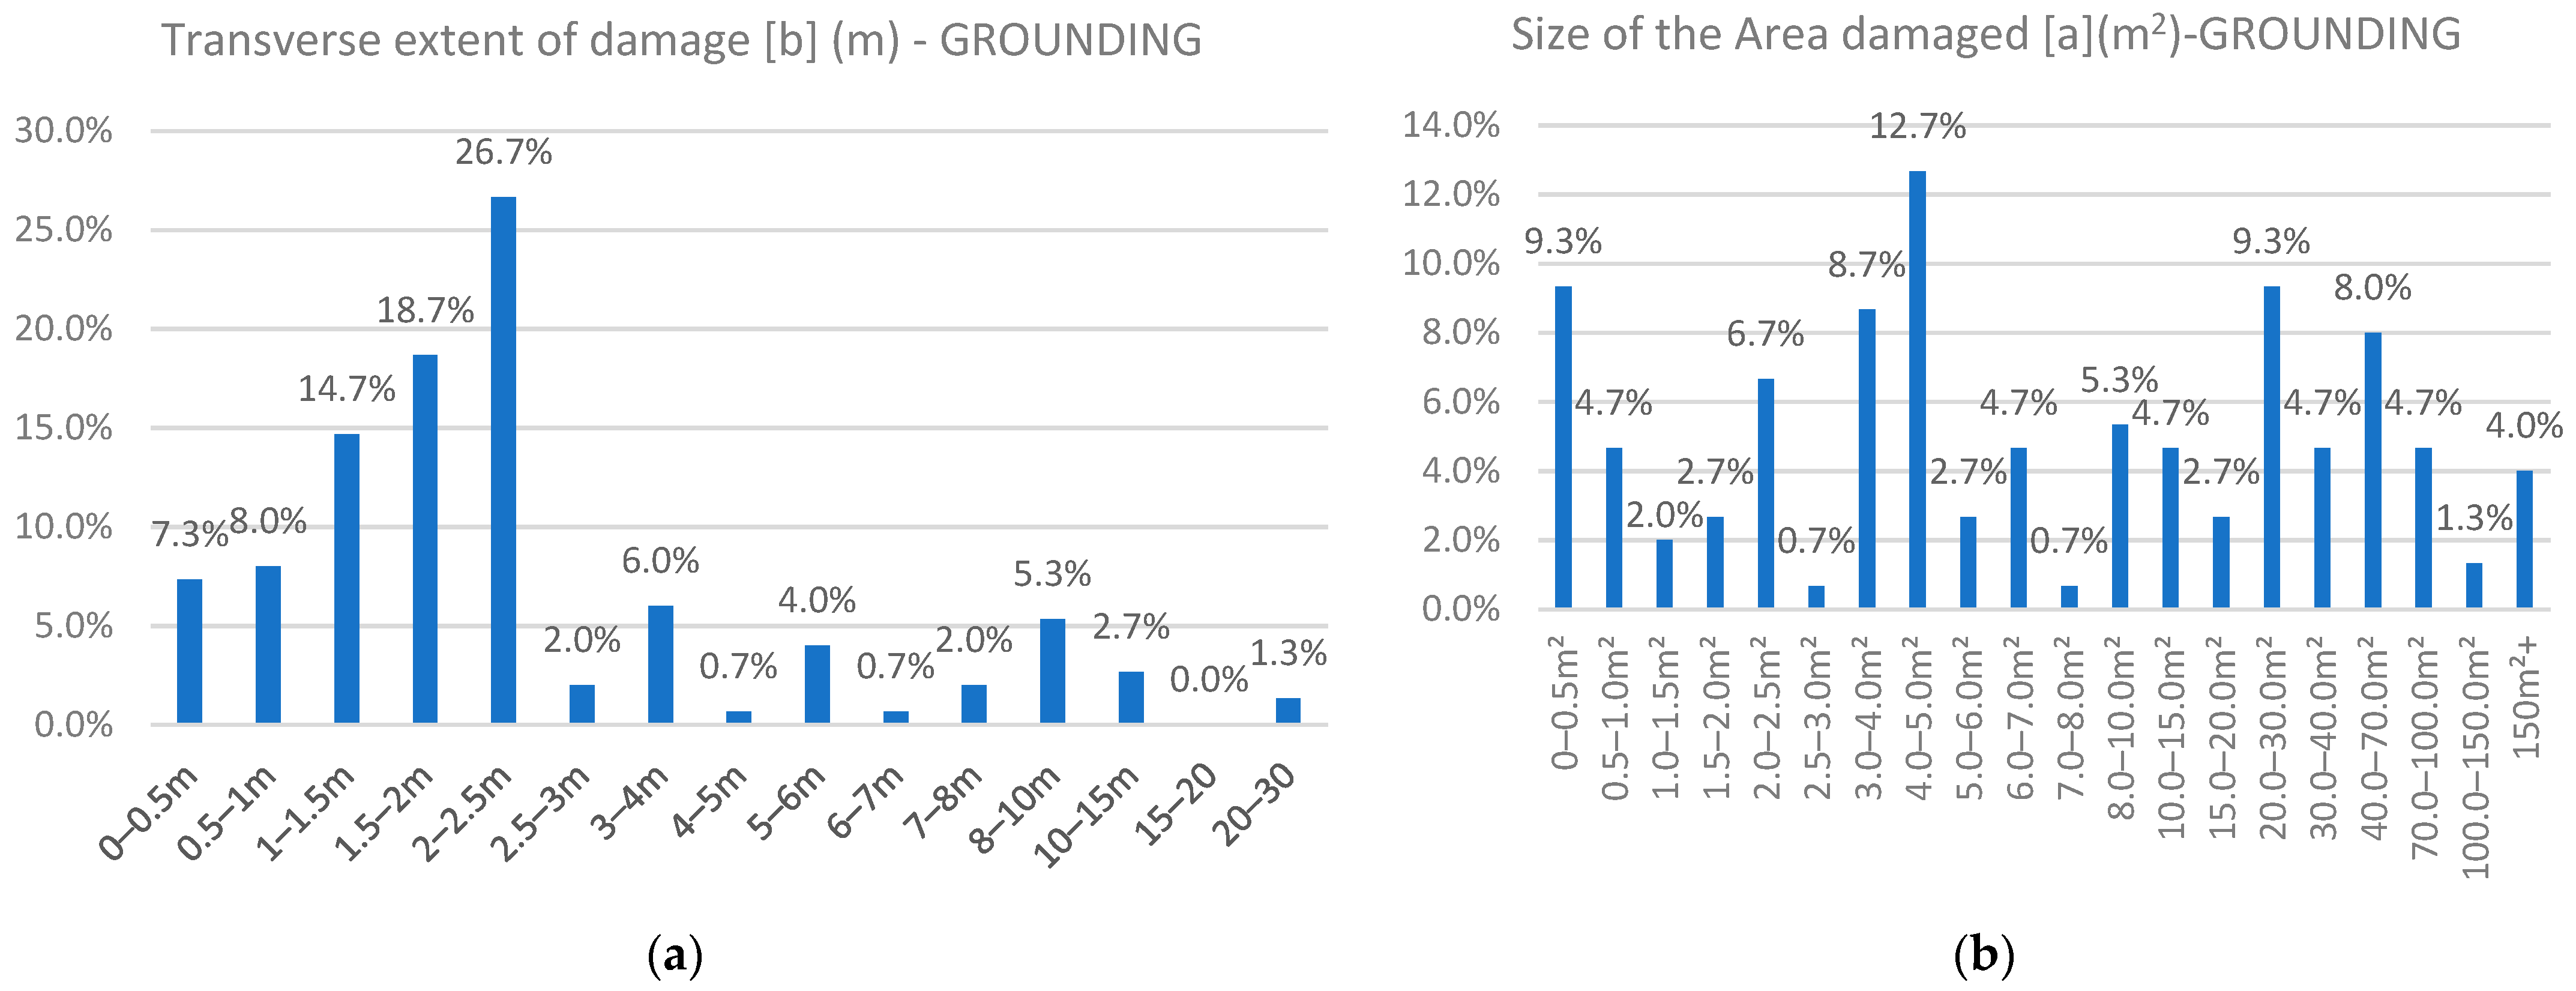
From the above (Figure 11a,b), it can be seen that the largest damage width (transverse extent) for grounding is 2–2.5 m, accounting for 26.7%. This is followed by 1.5–2 m and 1–1.5 m, accounting for 18.7% and 14.7%, respectively. The largest damaged area was 4–5 m2, accounting for 12.7%, followed by 0–0.5 m2, and 20–30 m2, both of which accounted for 9.3%.
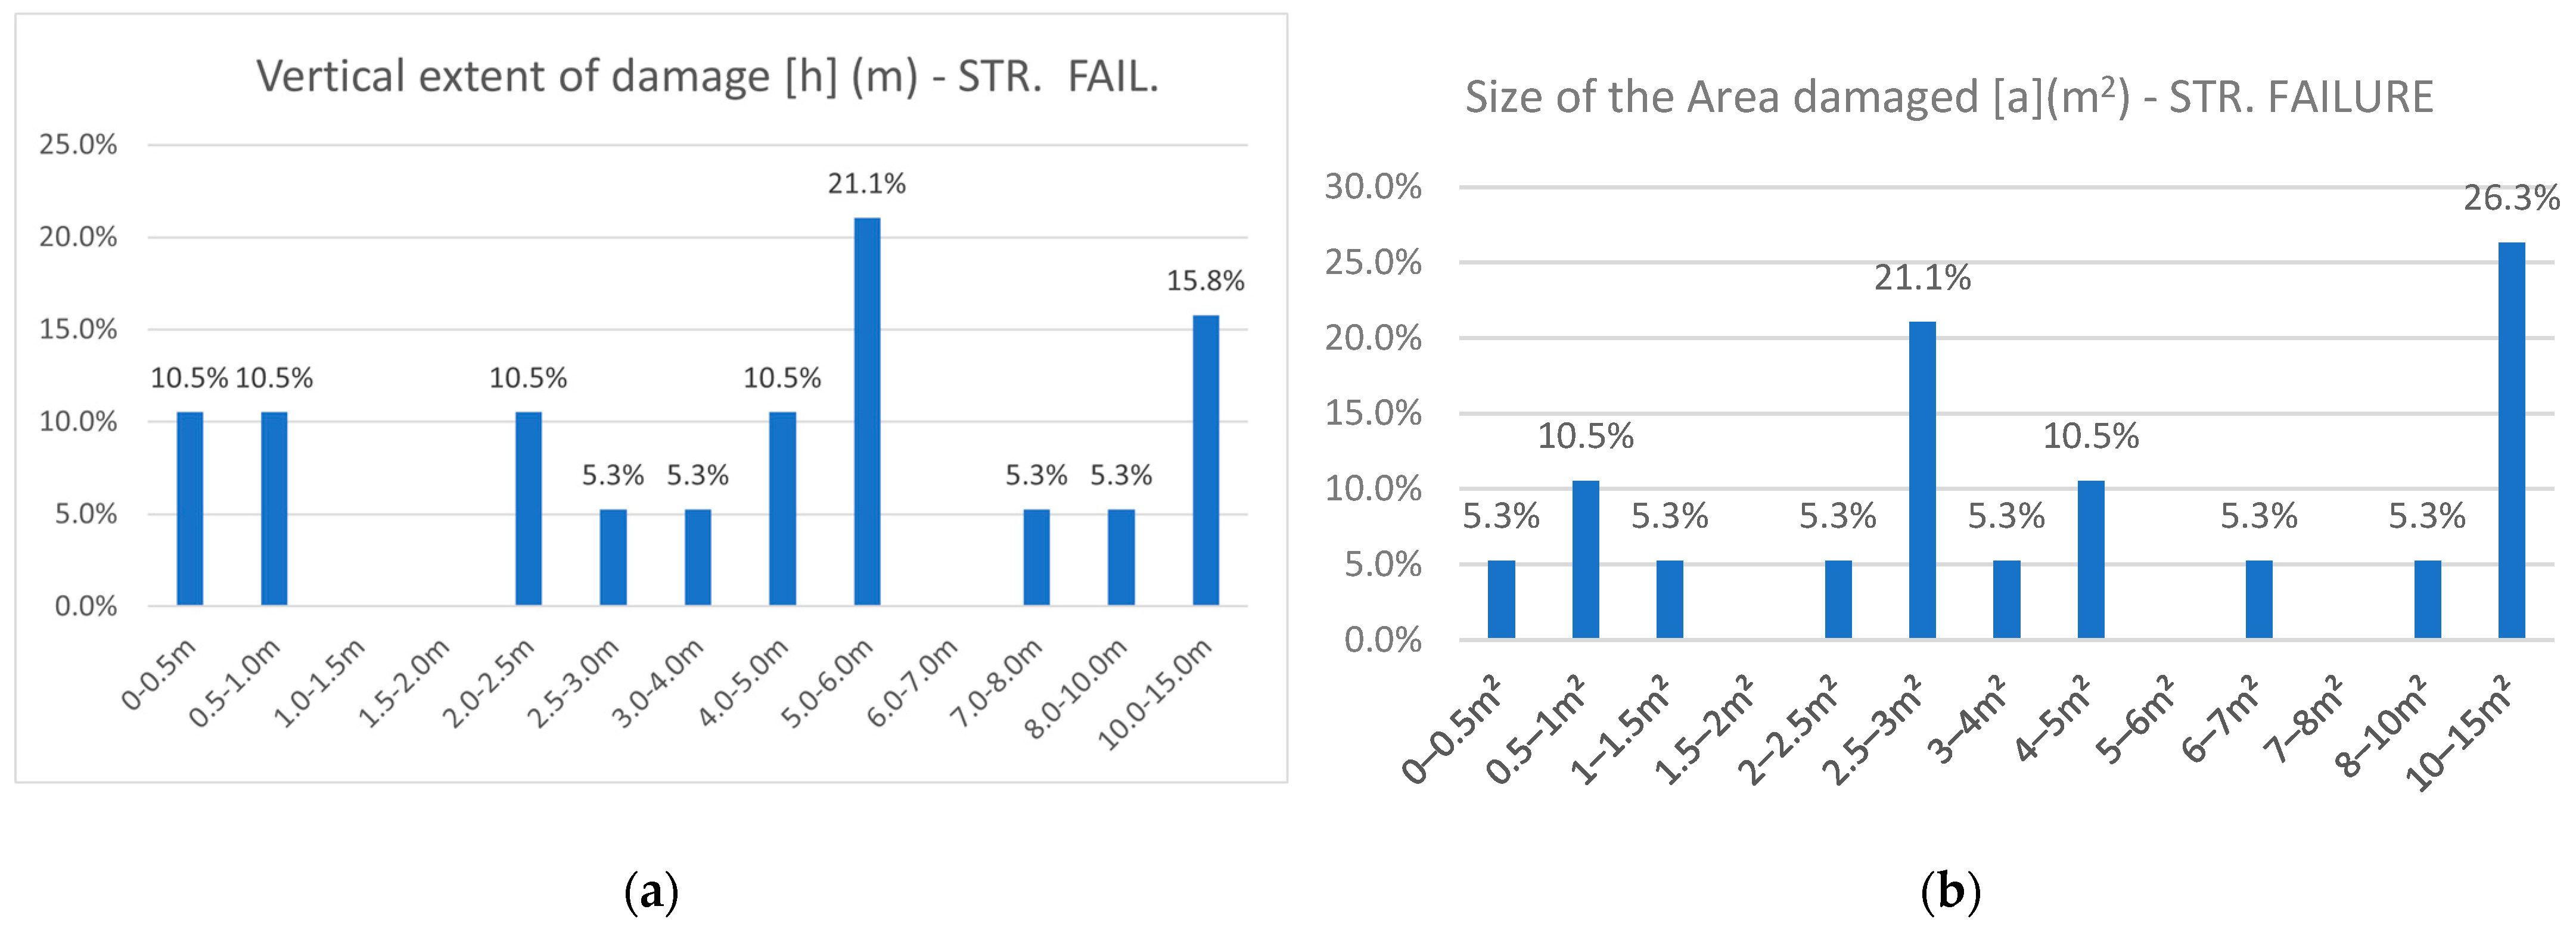
Based on the above results (Figure 12a,b), it is clear that the largest damage width (transverse extent) for hull structural failure is 5–6 m, with 21.1%, followed by 10–15 m, with a percentage of 15.8%. Furthermore, the largest damaged area was 10–15 m2, followed by 2.5–3 m2, with the corresponding percentages equal to 26.3% and 21.1%, respectively.
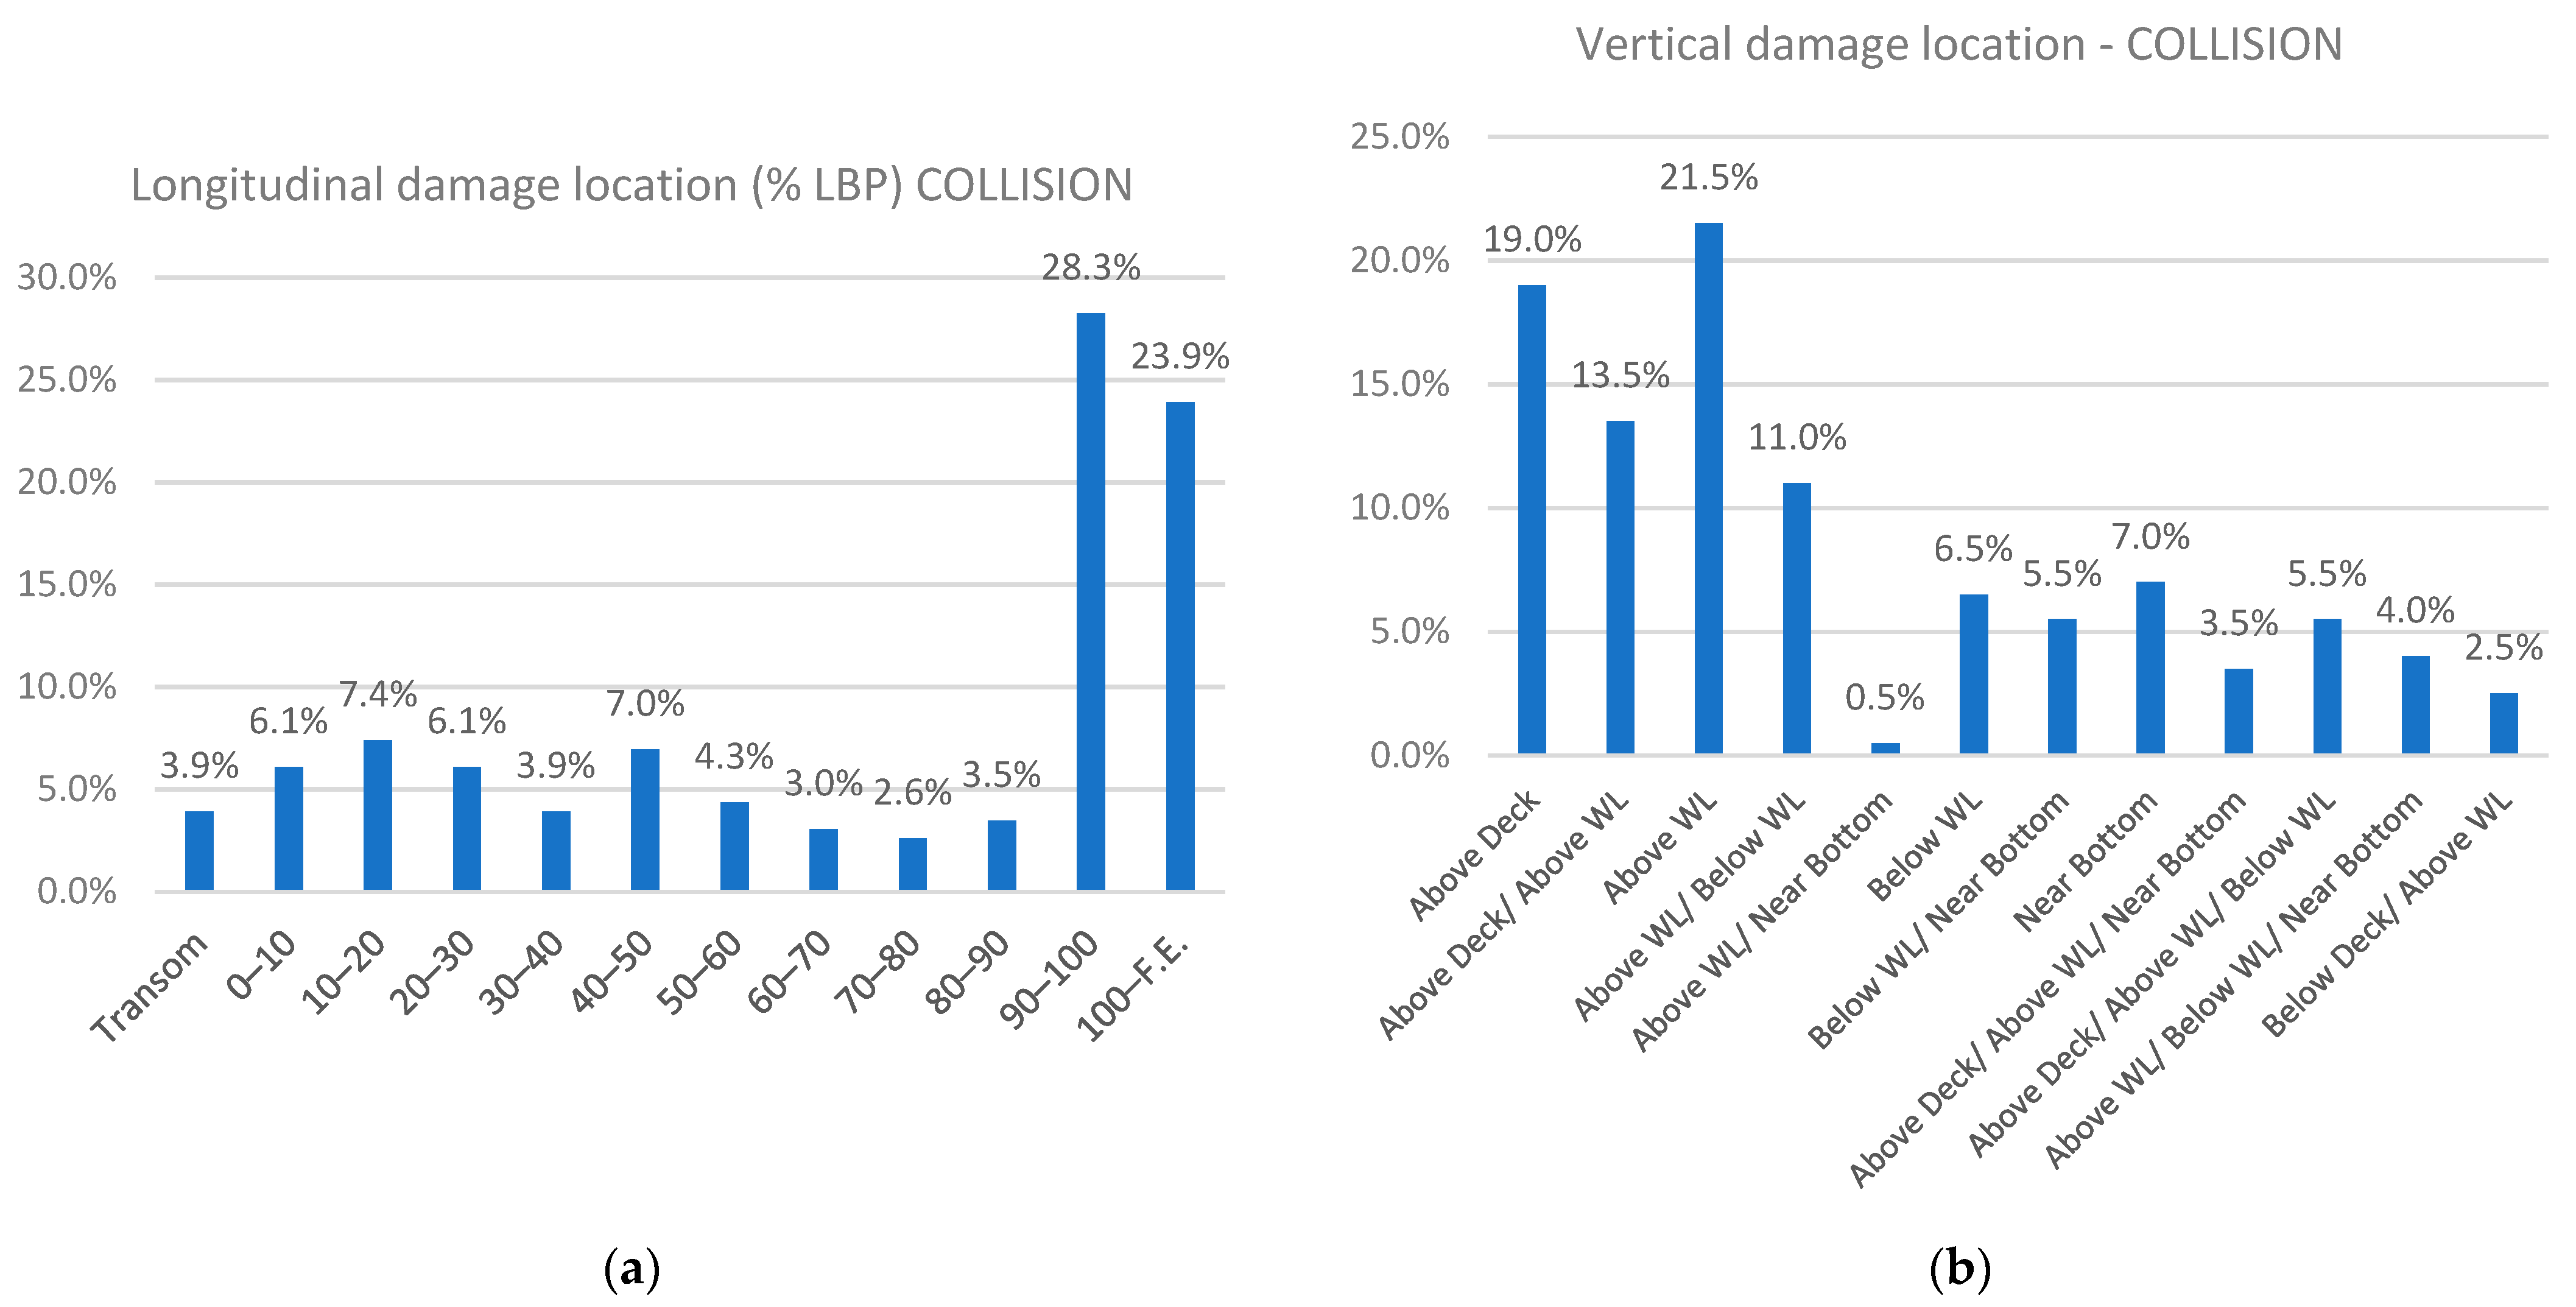
The collision accident Figure 13a,b indicate that the primary longitudinal damage is located 90–100% LBP, with 28.3%; and 100% F.E., with 23.9%. The vertical damage location is mainly above the waterline, with 21.5%, followed by above deck, with 19%, and between above deck and above waterline, with 13.5%.
The grounding accident Figure 14a,b reveal that the longitudinal damage is primary located between 90–100% LBP, with 18.8%; followed by 30–40% LBP, with 12.9% and the transom (aft part), with 11.3%. Additionally, the transverse damage location is mainly in the centerline, with 12.4%, followed by 0–8% (starboard and port sides), with 11.8% and 10.5%, respectively.
The Figures related to structural failure, 15a and 15b, indicate that the primary longitudinal damage is located in the midship area, between 40–50% LBP, with 28.6%; followed by 30–40% and 50–80% LBP, with 14.3%. The location of the external hull damage is mainly in the areas between below waterline/near bottom and above deck/above waterline with 21.4%.
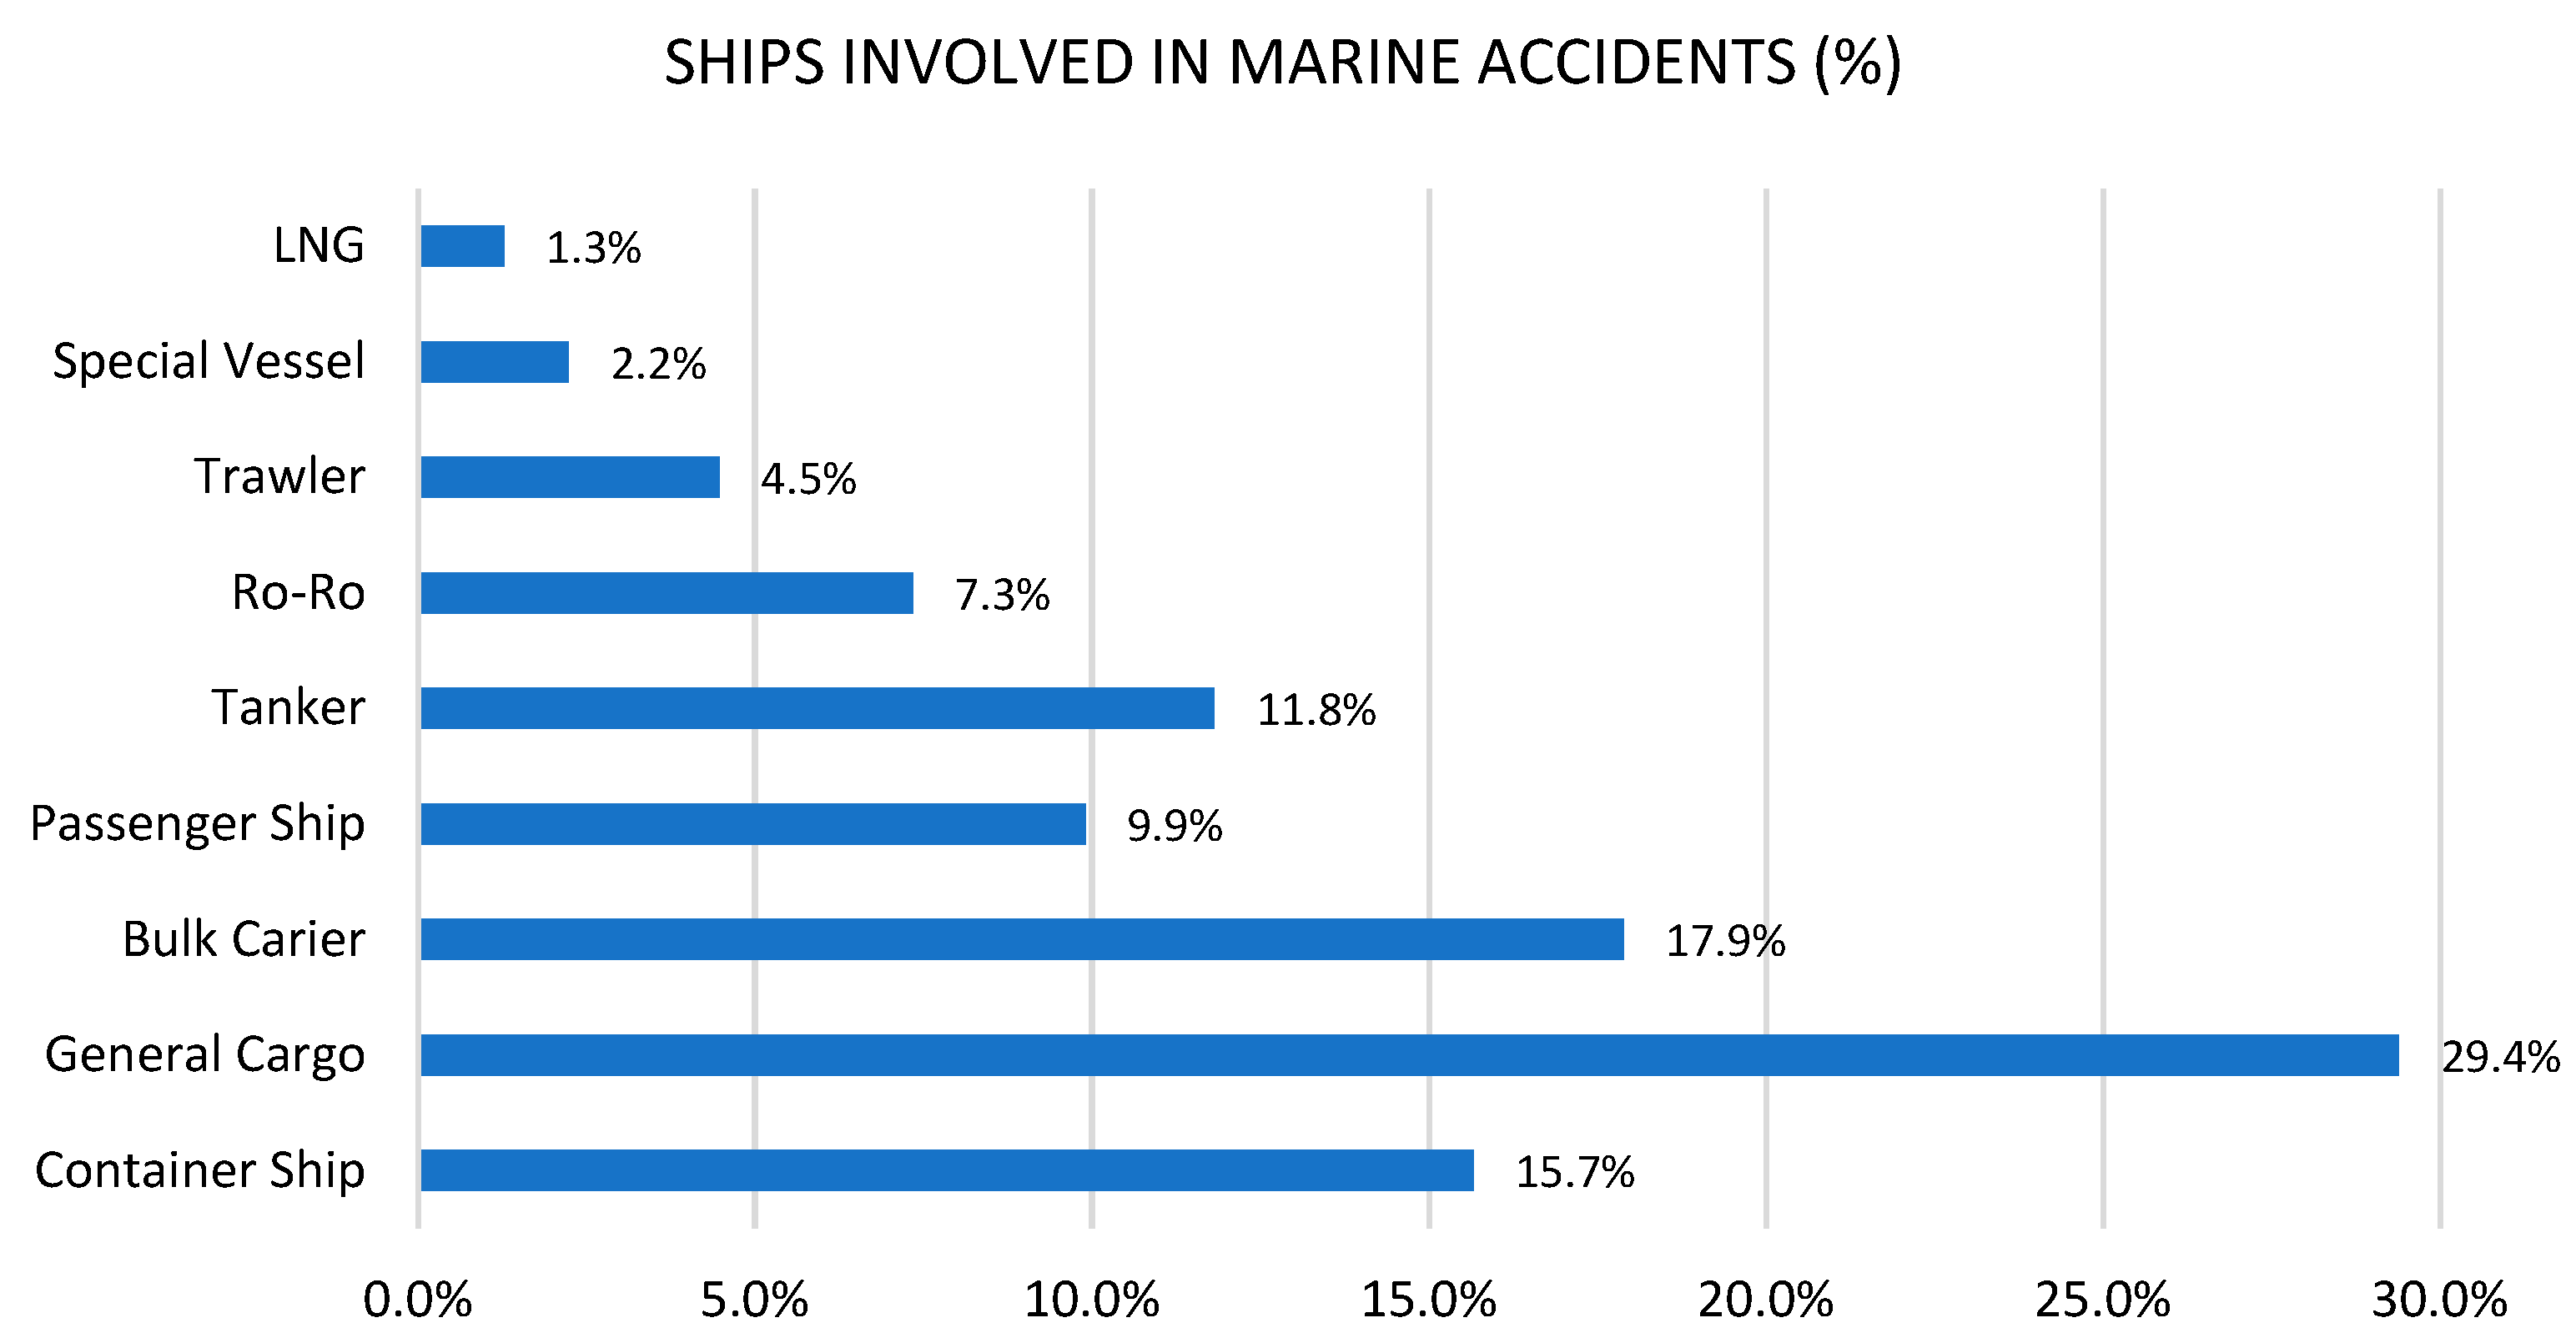
Figure 16 presents the deduced percentages from the frequency analysis performed for different types of vessels that were involved in marine incidents related to collision, grounding, and structural failure. As we can easily observe from the specific figure, general cargo ships were involved in the highest percentage of accidents across all three categories, accounting for 29.4%; this is followed by bulk carriers, with 17.9%, container ships, with 15.7%, and tankers, with 11.8%. LNG ships had the lowest percentage at 1.3%. It is worth noting that cargo ships are also the most numerous in maritime transport.
The most frequent vessel characteristics and accident-related factors for the three types of incidents are summarized in Table 8 based on the results from the performed statistical analysis. Note that the higher percentages for each vessel characteristic/accident-related factor are provided. In some cases, such as “side” damage characteristic (in the location of damage section), the second highest occurring percentages (with a difference of no more of 5%) are also presented, to provide a comprehensive overview.
According to the statistical results presented in Table 8, in the case of structural failure accidents, 27% of the vessels are in the range of 60,000–100,000 T (deadweight) while 40% are categorized as small (size). This is not considered controversial since in each characteristic the highest percentage reported can potentially belong to a different group of vessels, i.e., the most frequently occurring groups for each characteristic may not necessarily overlap.

4.2. Correlation Analysis and Chi-Square Tests

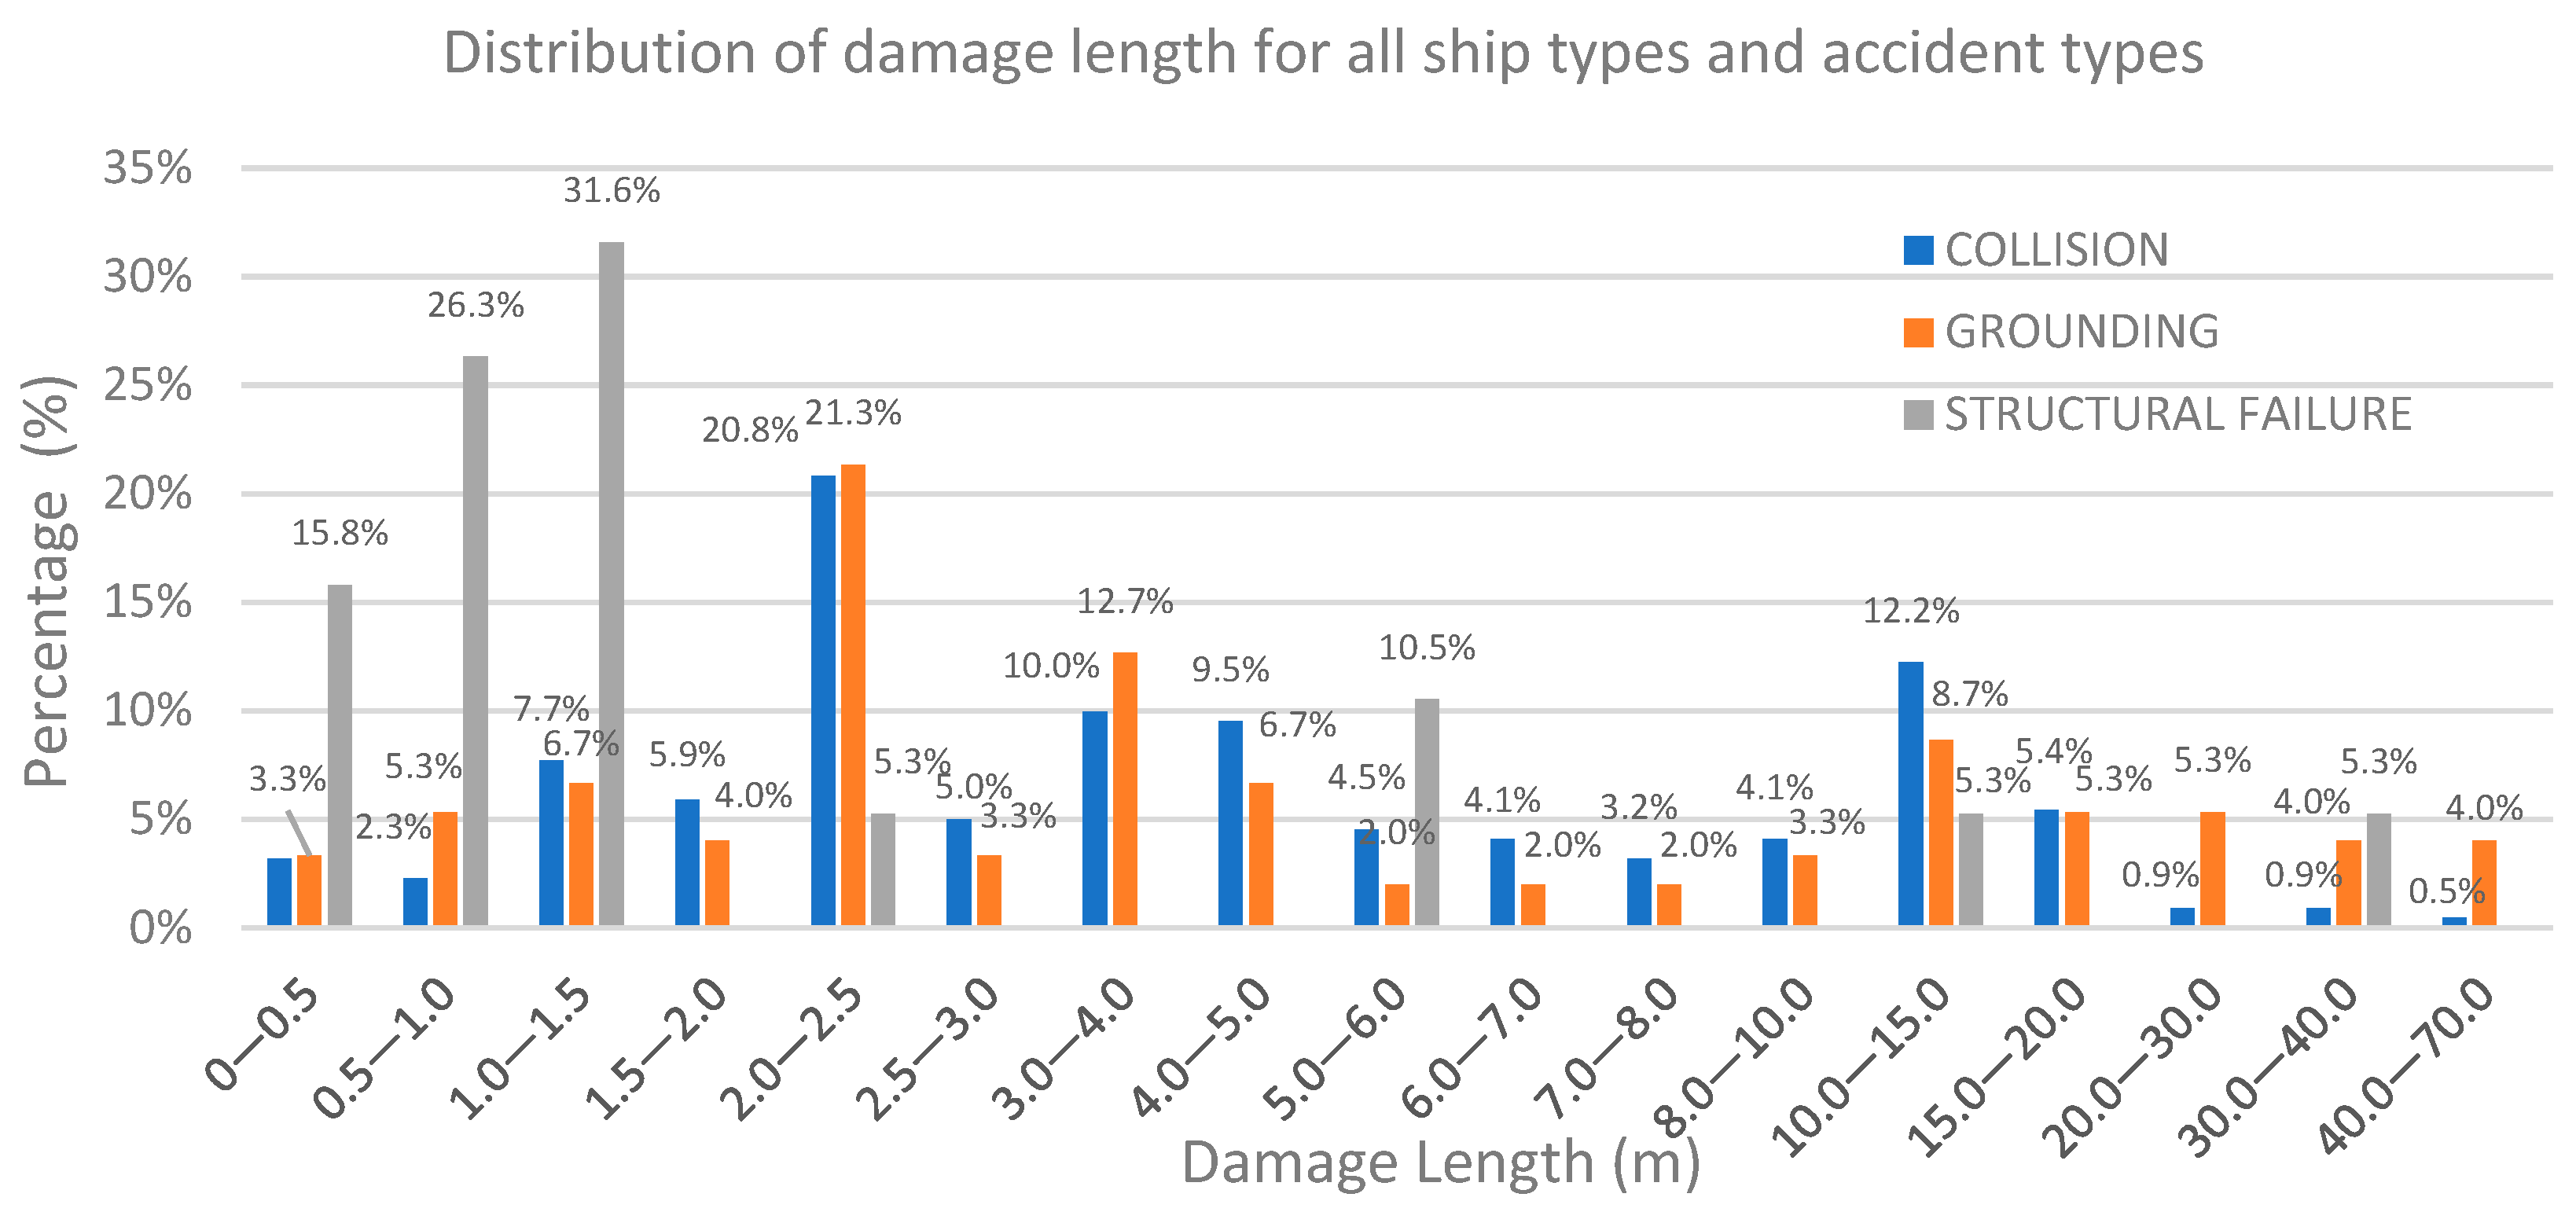
The correlation between all the possible combinations of the key factors reported in Table 3 that affect the investigated incidents in cases of (a) collision, (b) grounding, and (c) hull failure are demonstrated in the following Figure 17, Figure 18, Figure 19, Figure 20, Figure 21, Figure 22, Figure 23, Figure 24, Figure 25, Figure 26, Figure 27, Figure 28, Figure 29, Figure 30, Figure 31, Figure 32, Figure 33, Figure 34, Figure 35, Figure 36, Figure 37 and Figure 38. Furthermore, in Figure 39, the distribution of damage length for all ship types and categories of marine accidents (collision, grounding, and hull failure) is also presented.

4.2.1. Collision

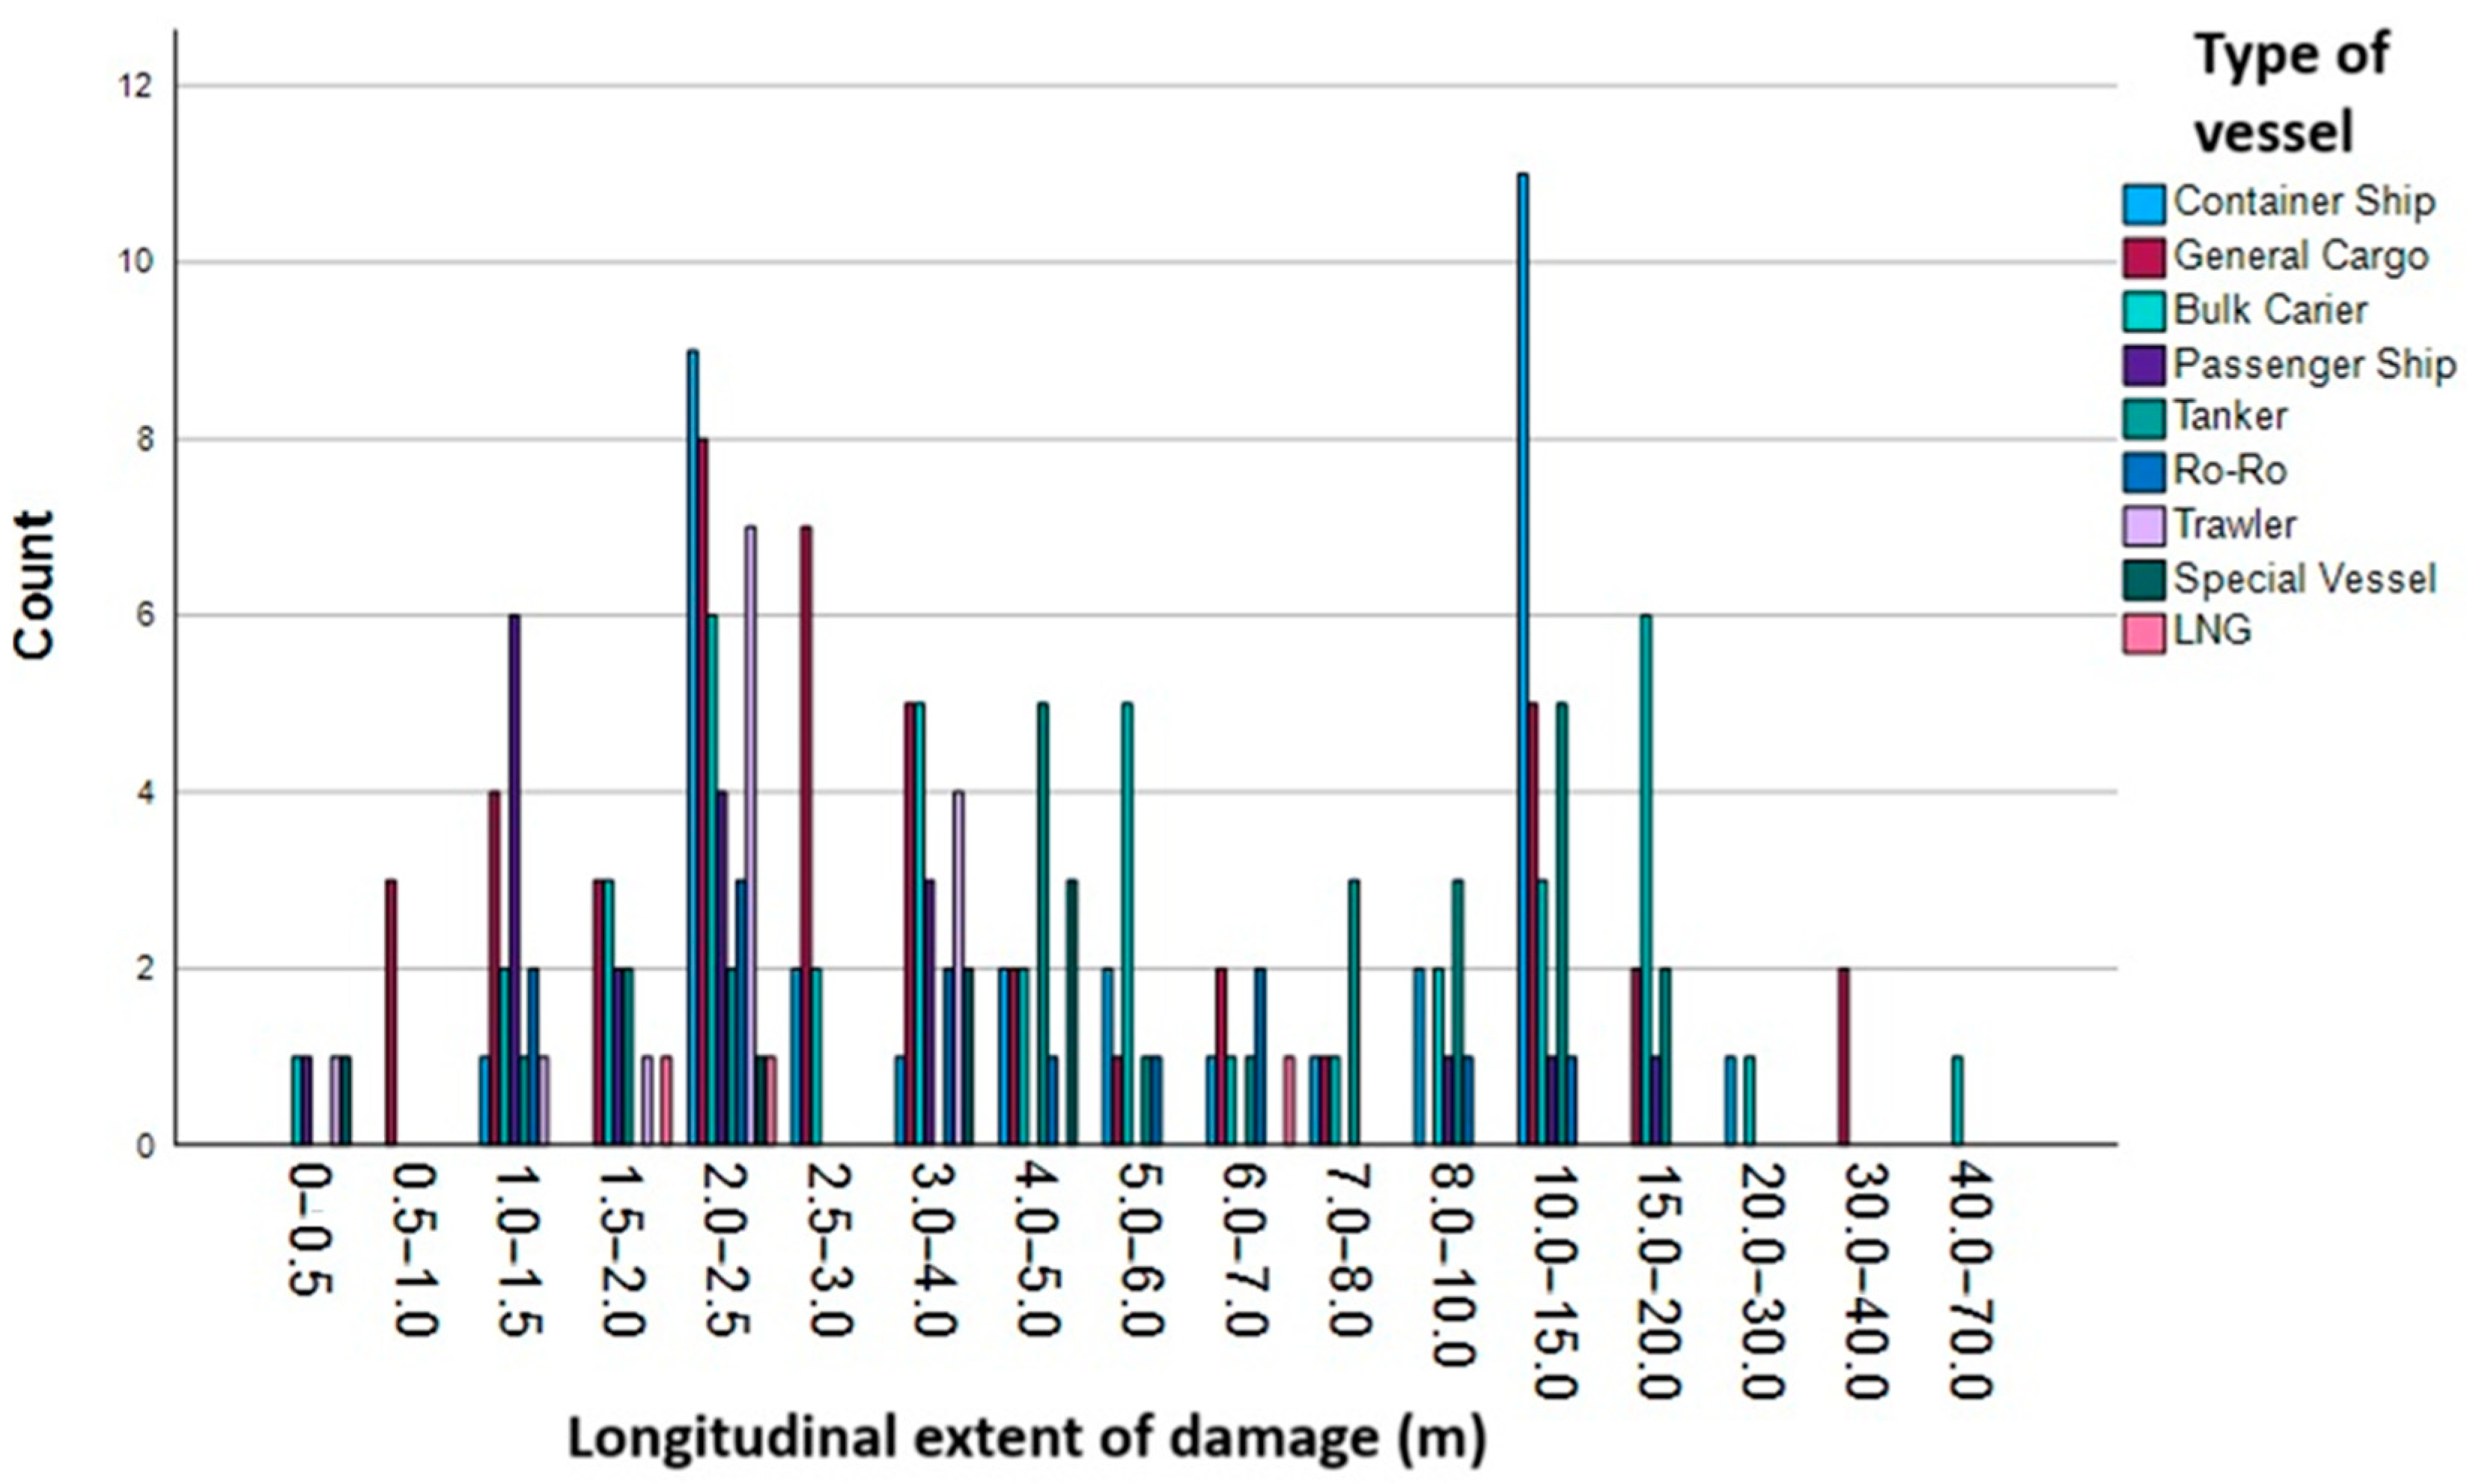
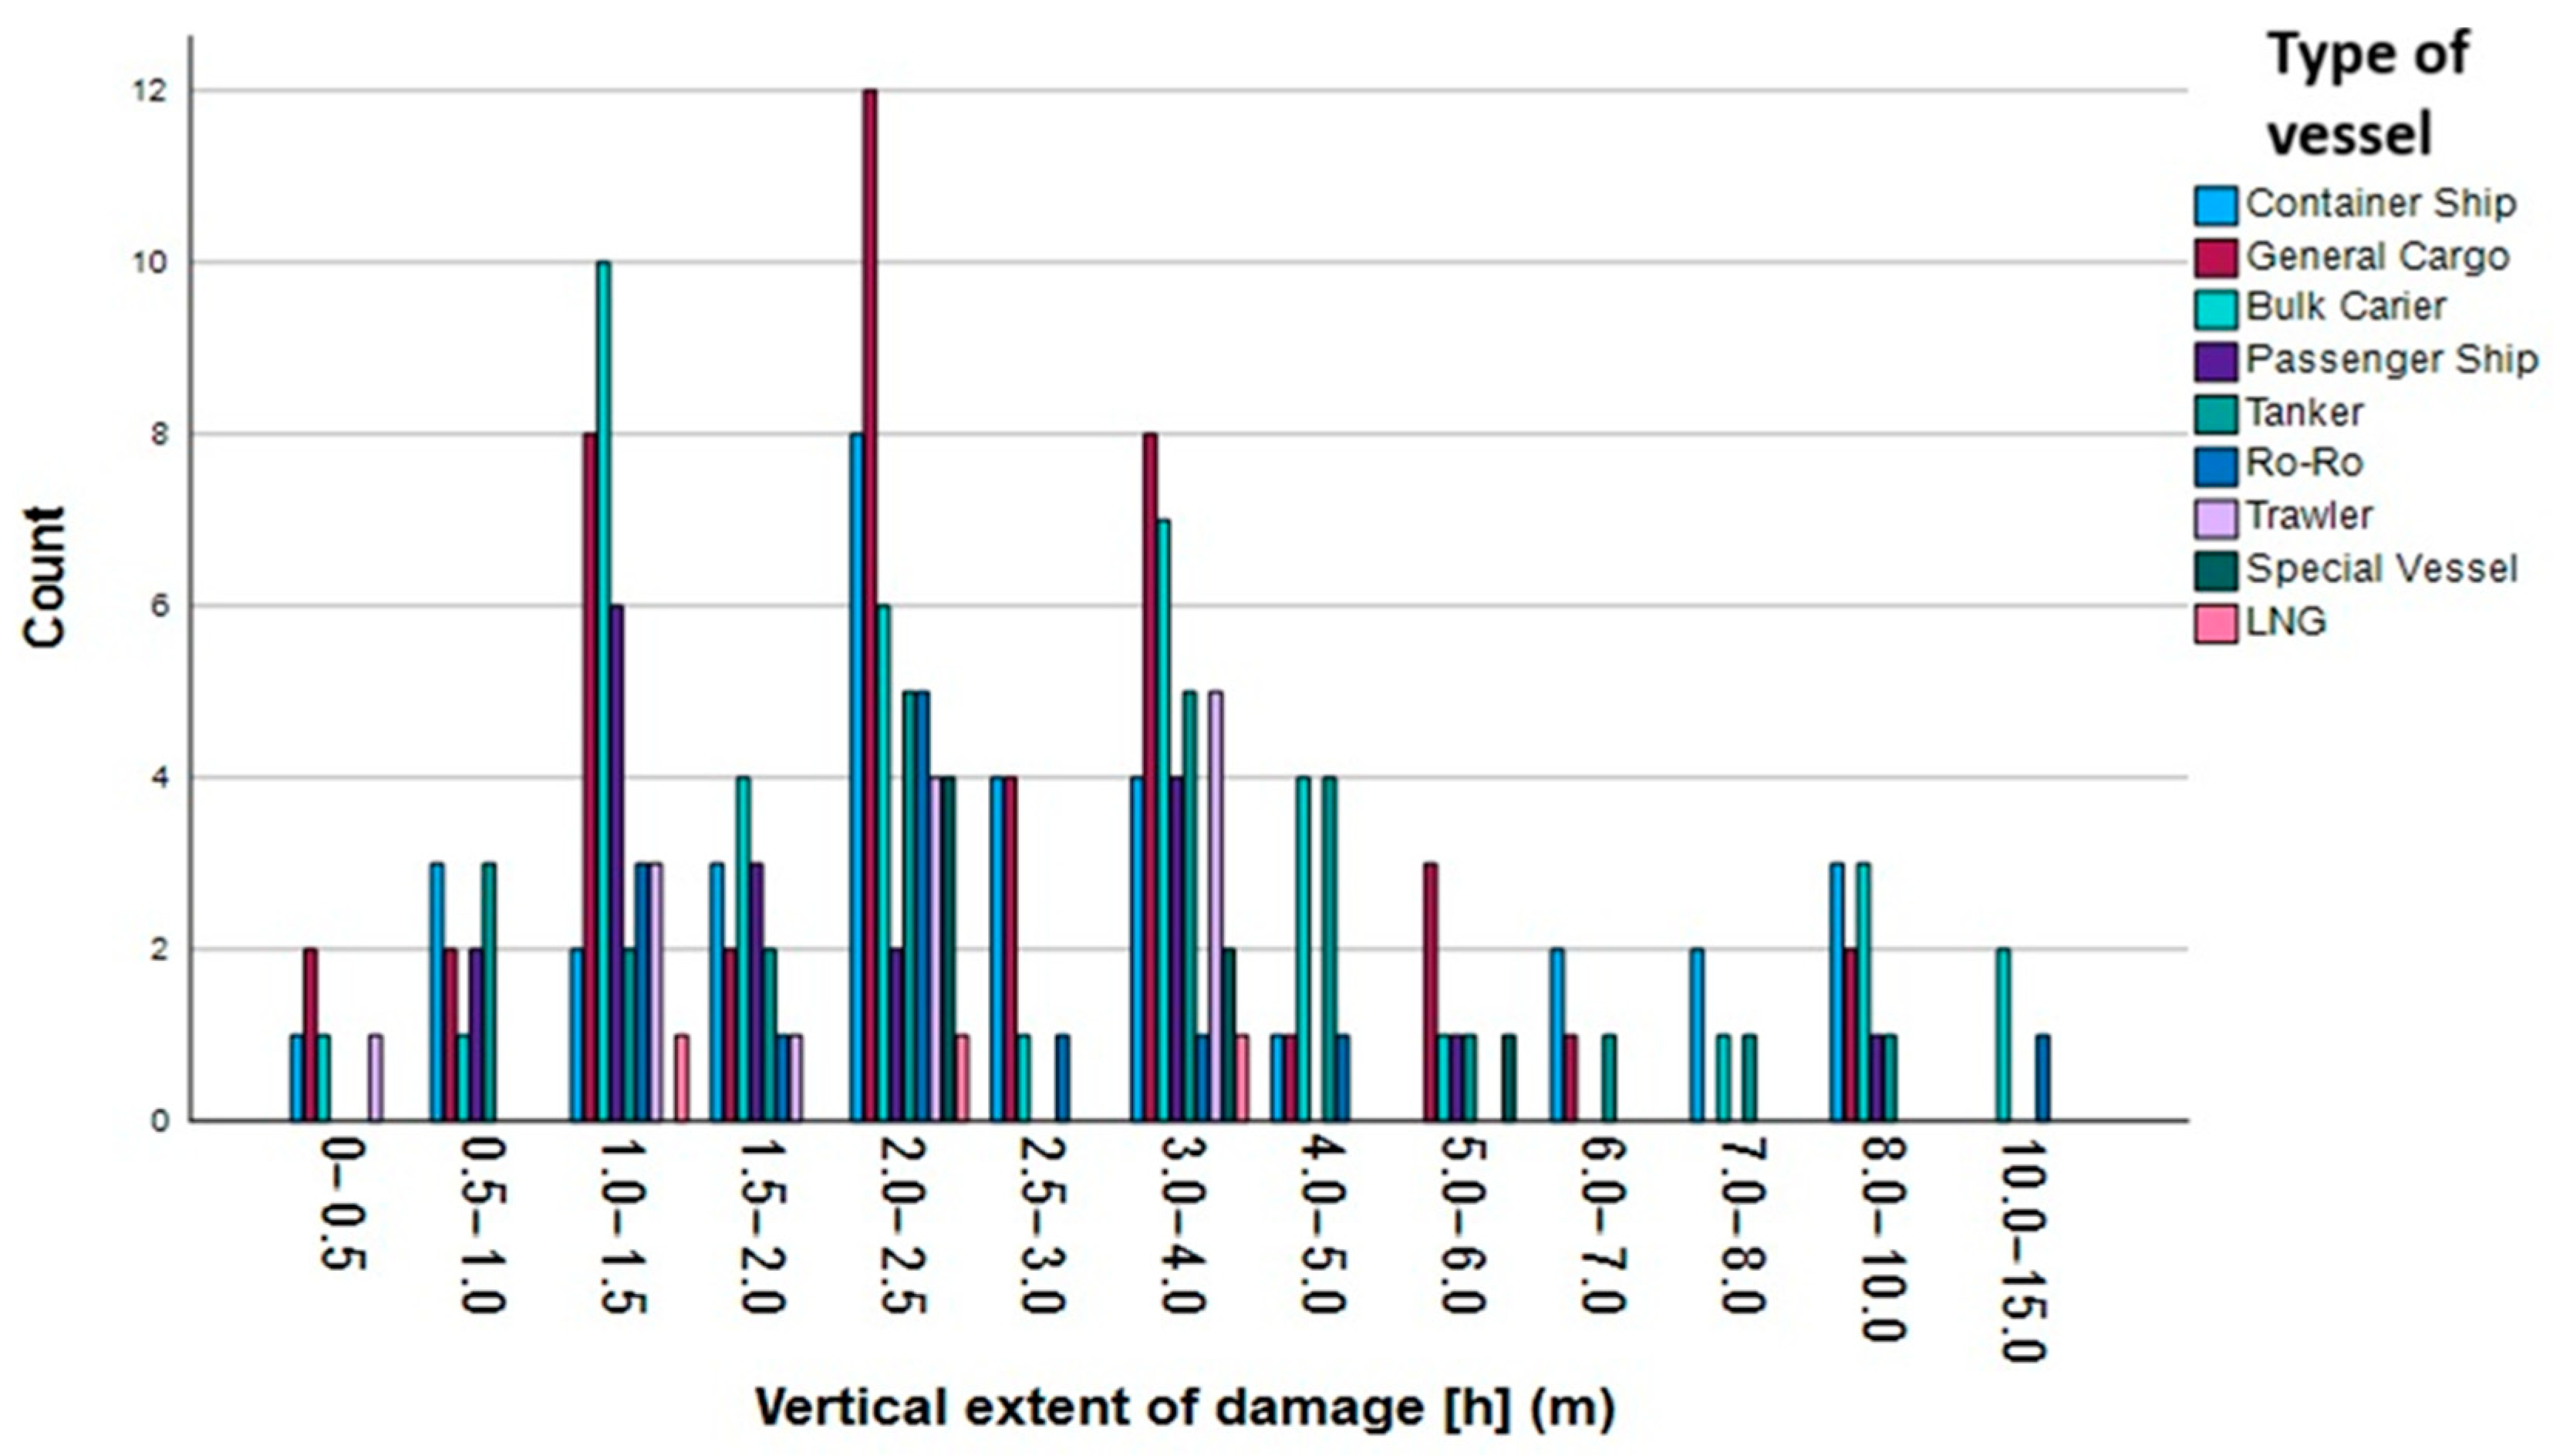
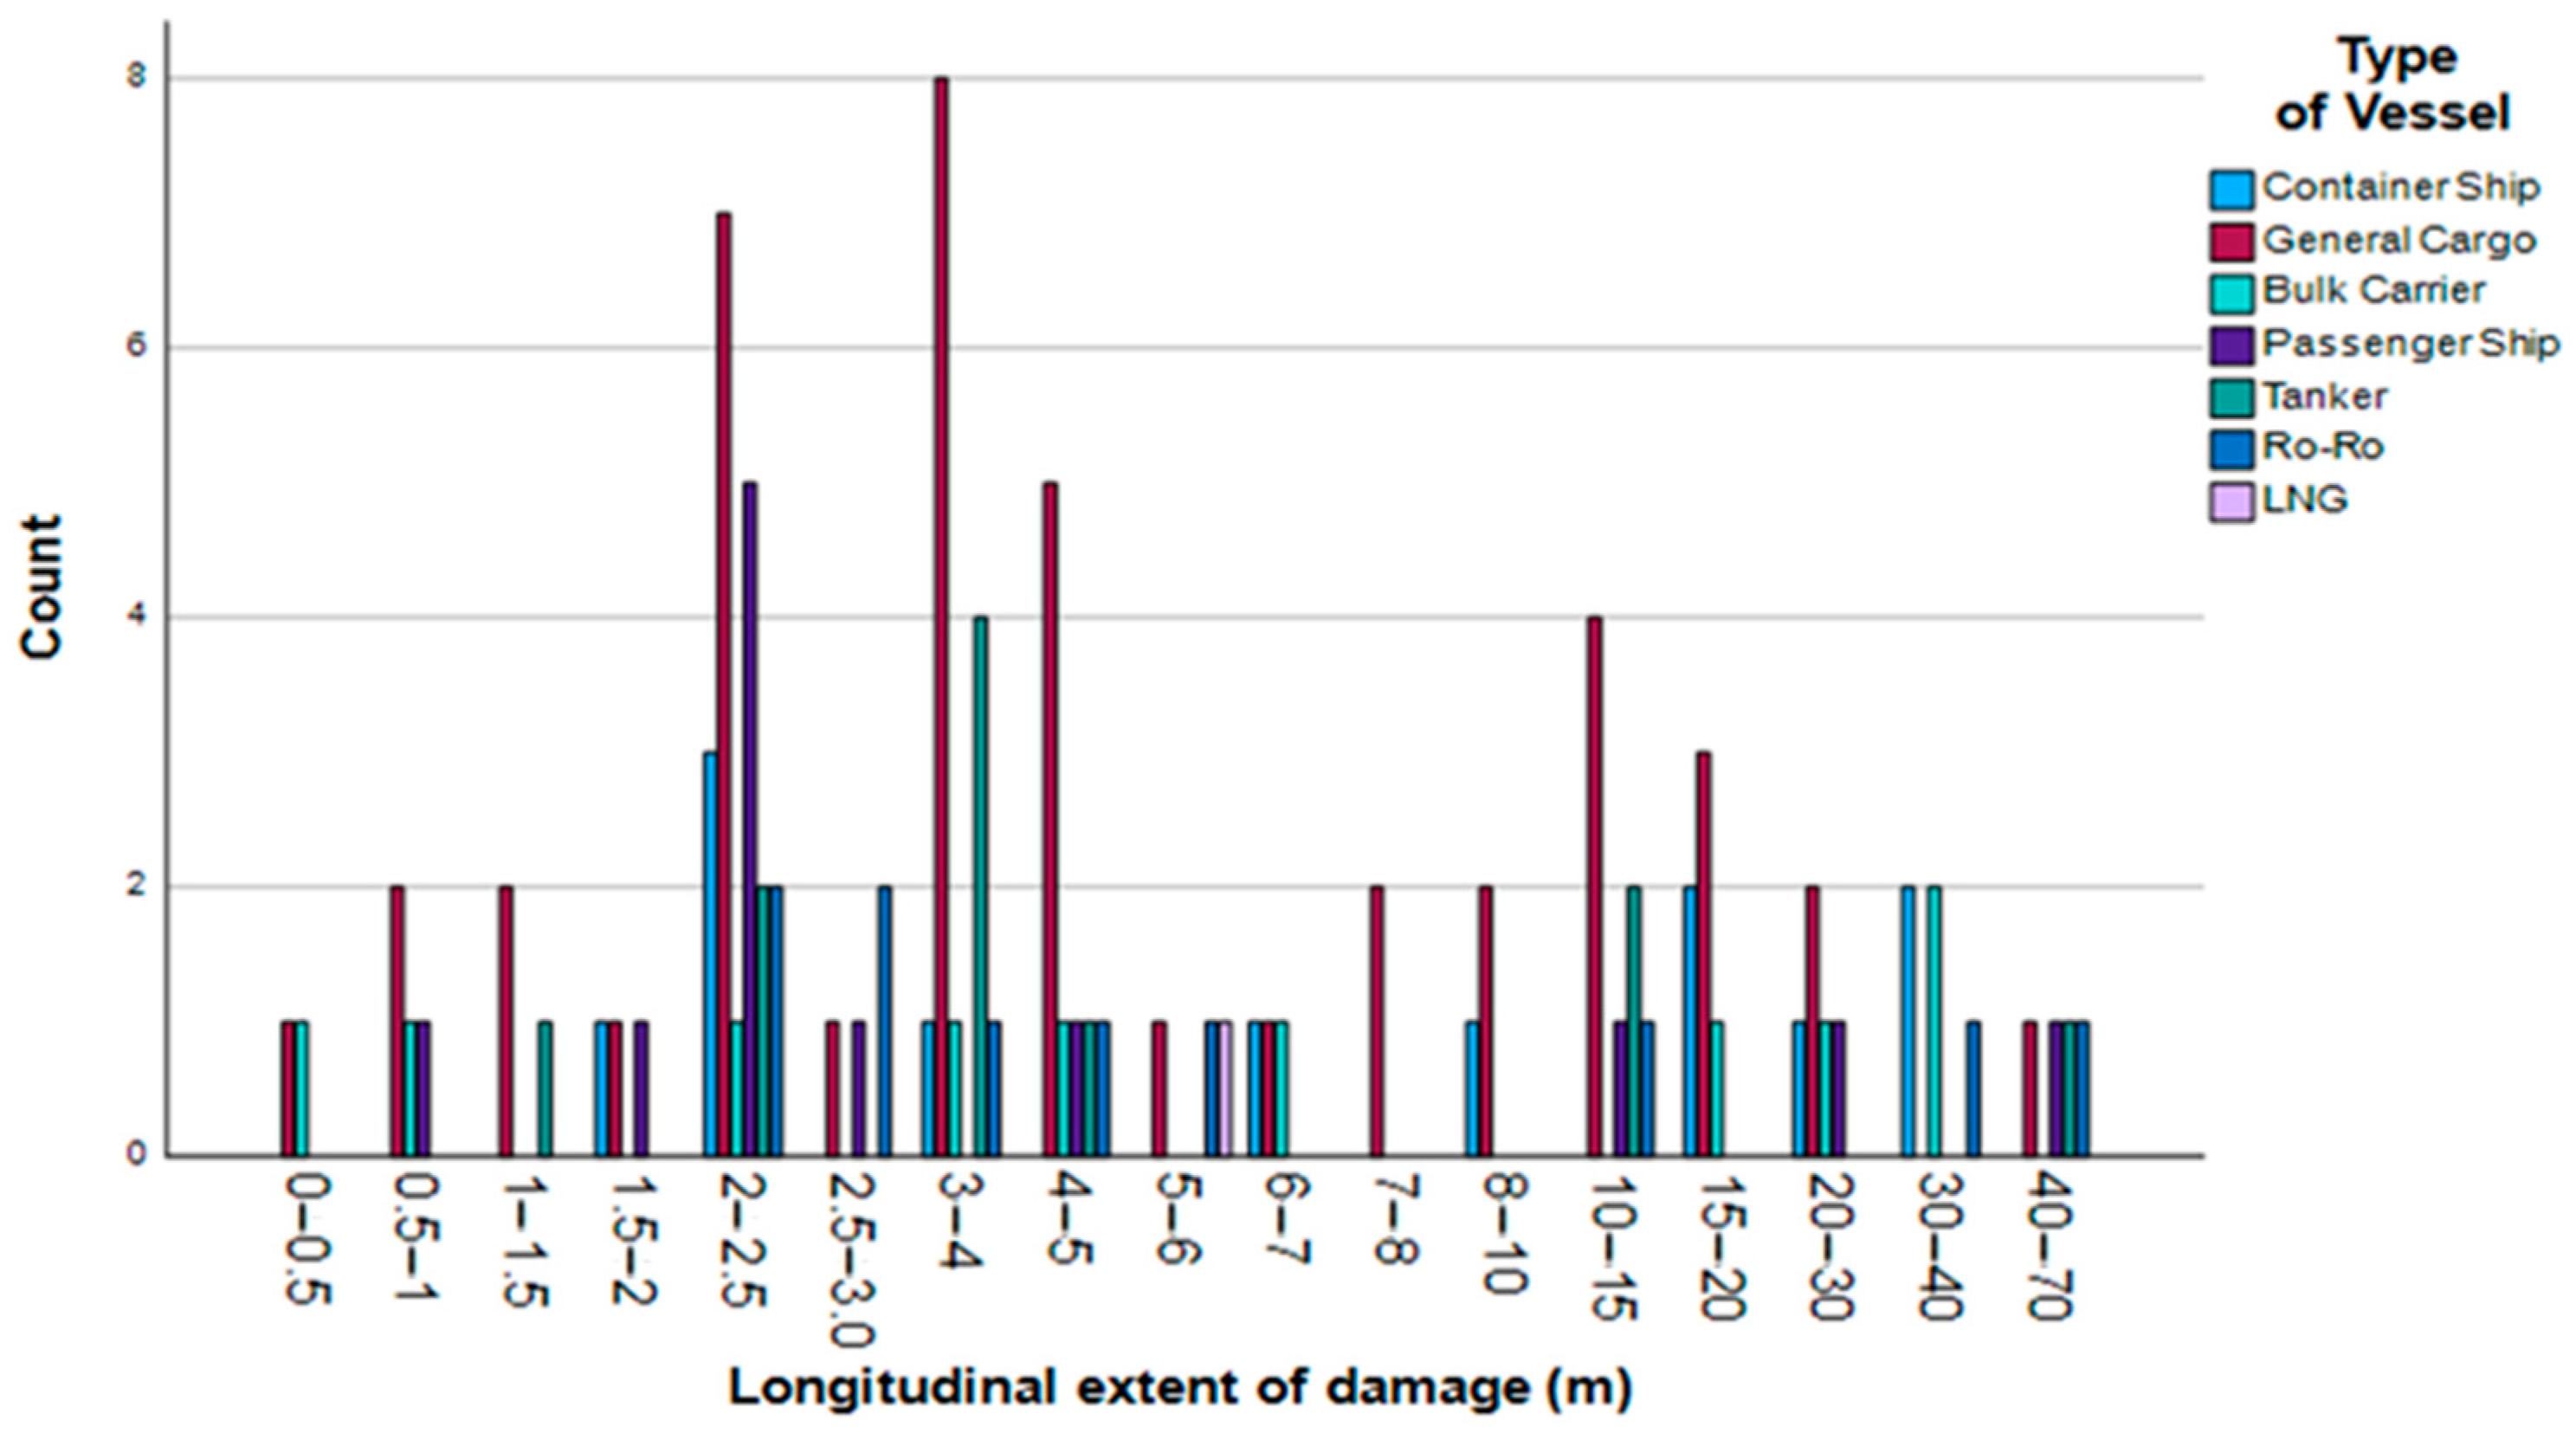
According to Figure 17 and Figure 18, the most frequently occurring longitudinal damage extent due to collision accidents is in the 10–15 m and 2.0–2.5 m ranges. Container ships are the most common type of ship, followed by general cargo ships, then trawlers and other types of ships. For vertical damage extent, the most frequent height is 2–2.5 m, while the most common type of ship is general cargo, followed by bulk carriers (with a damage height of 1–1.5 m).
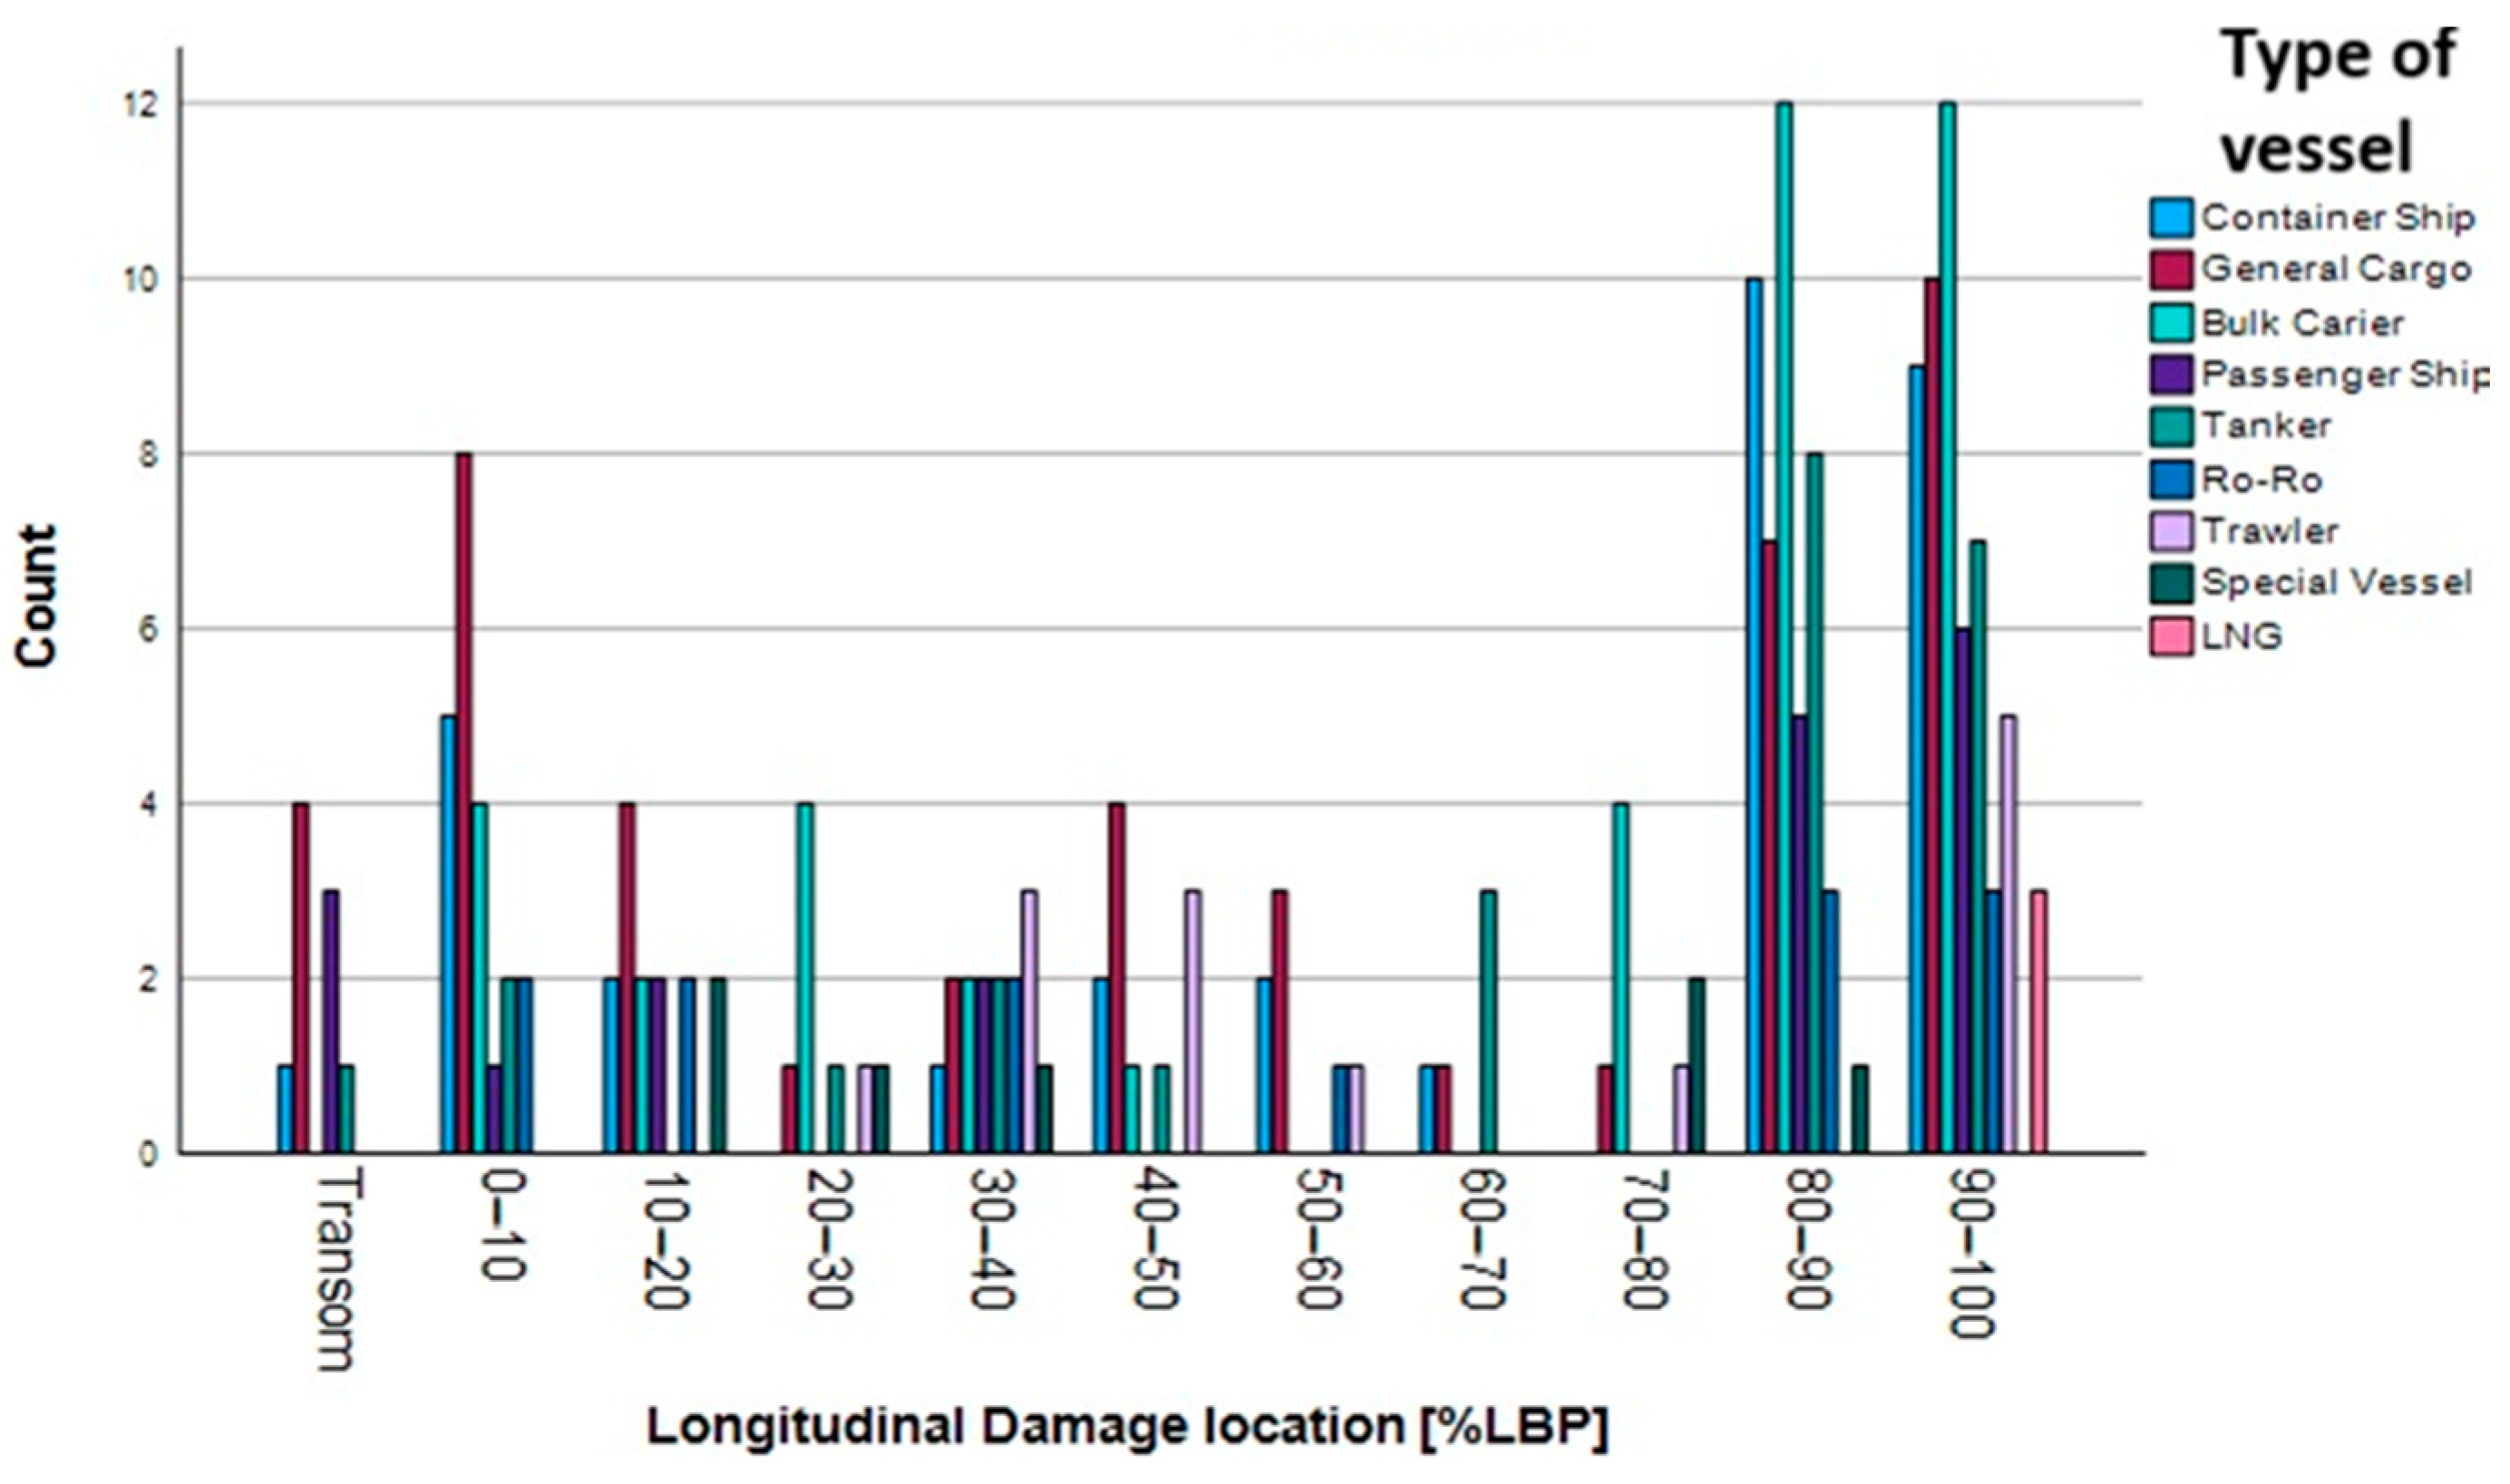
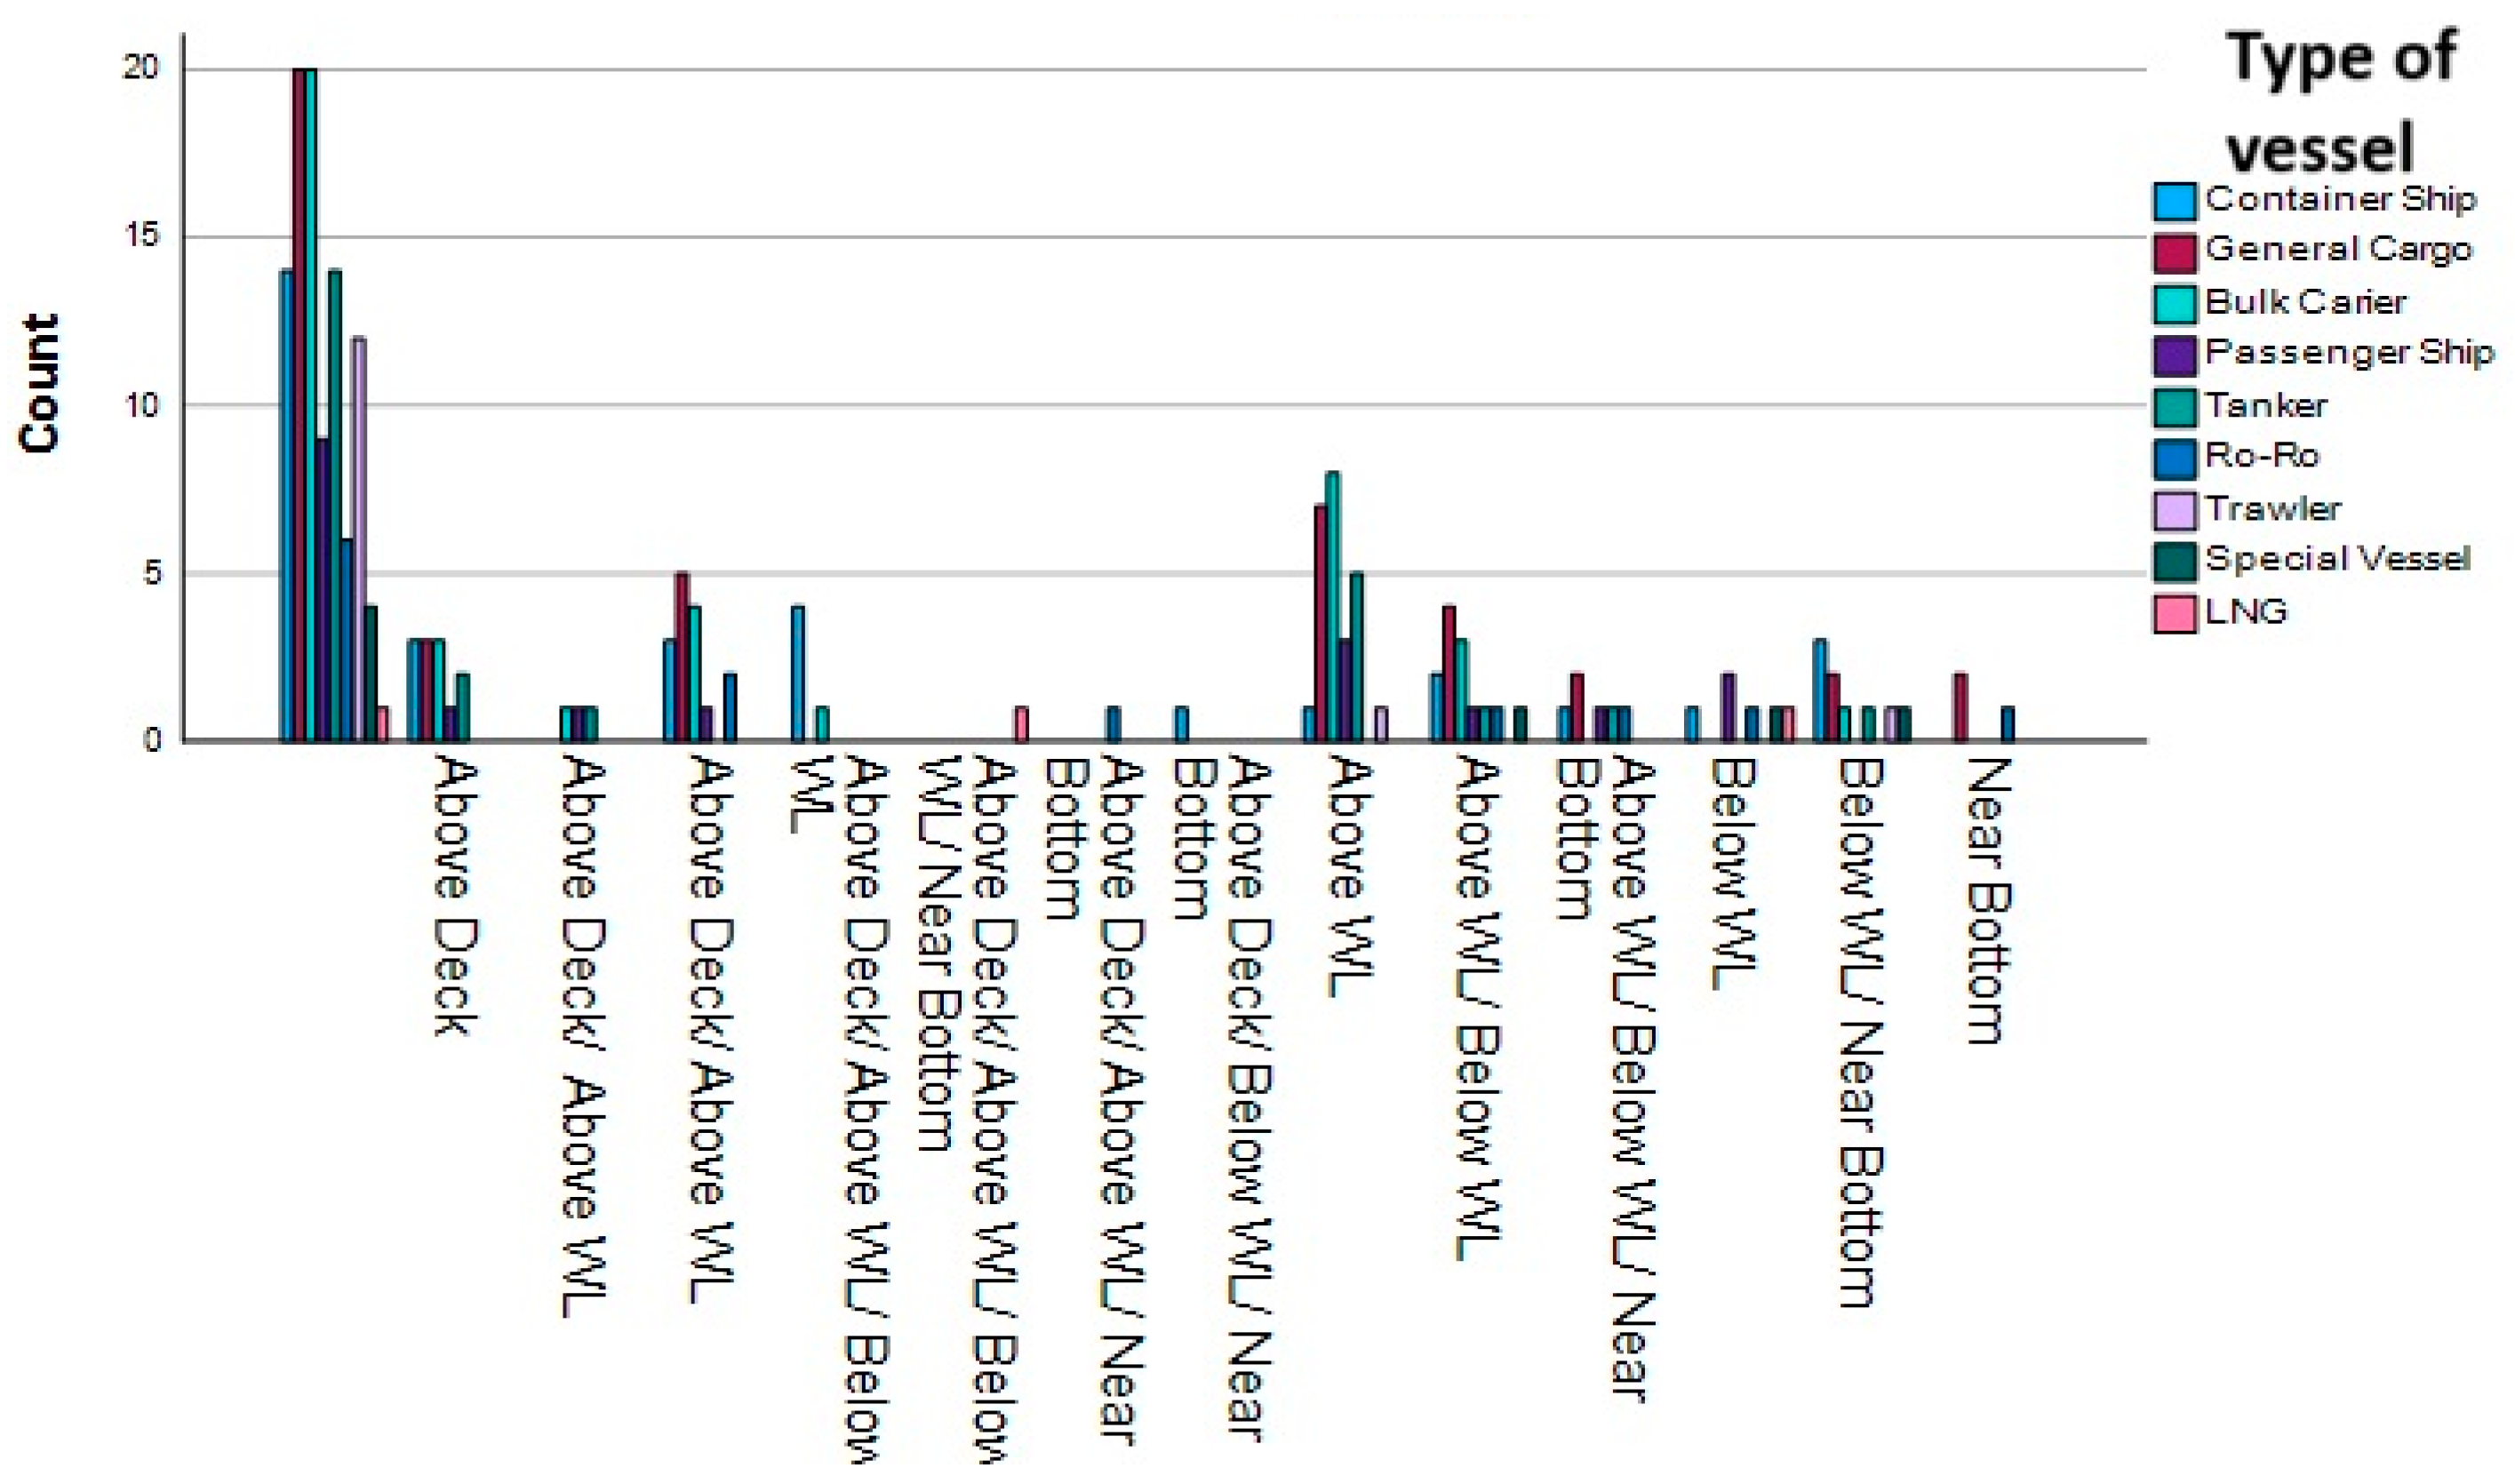
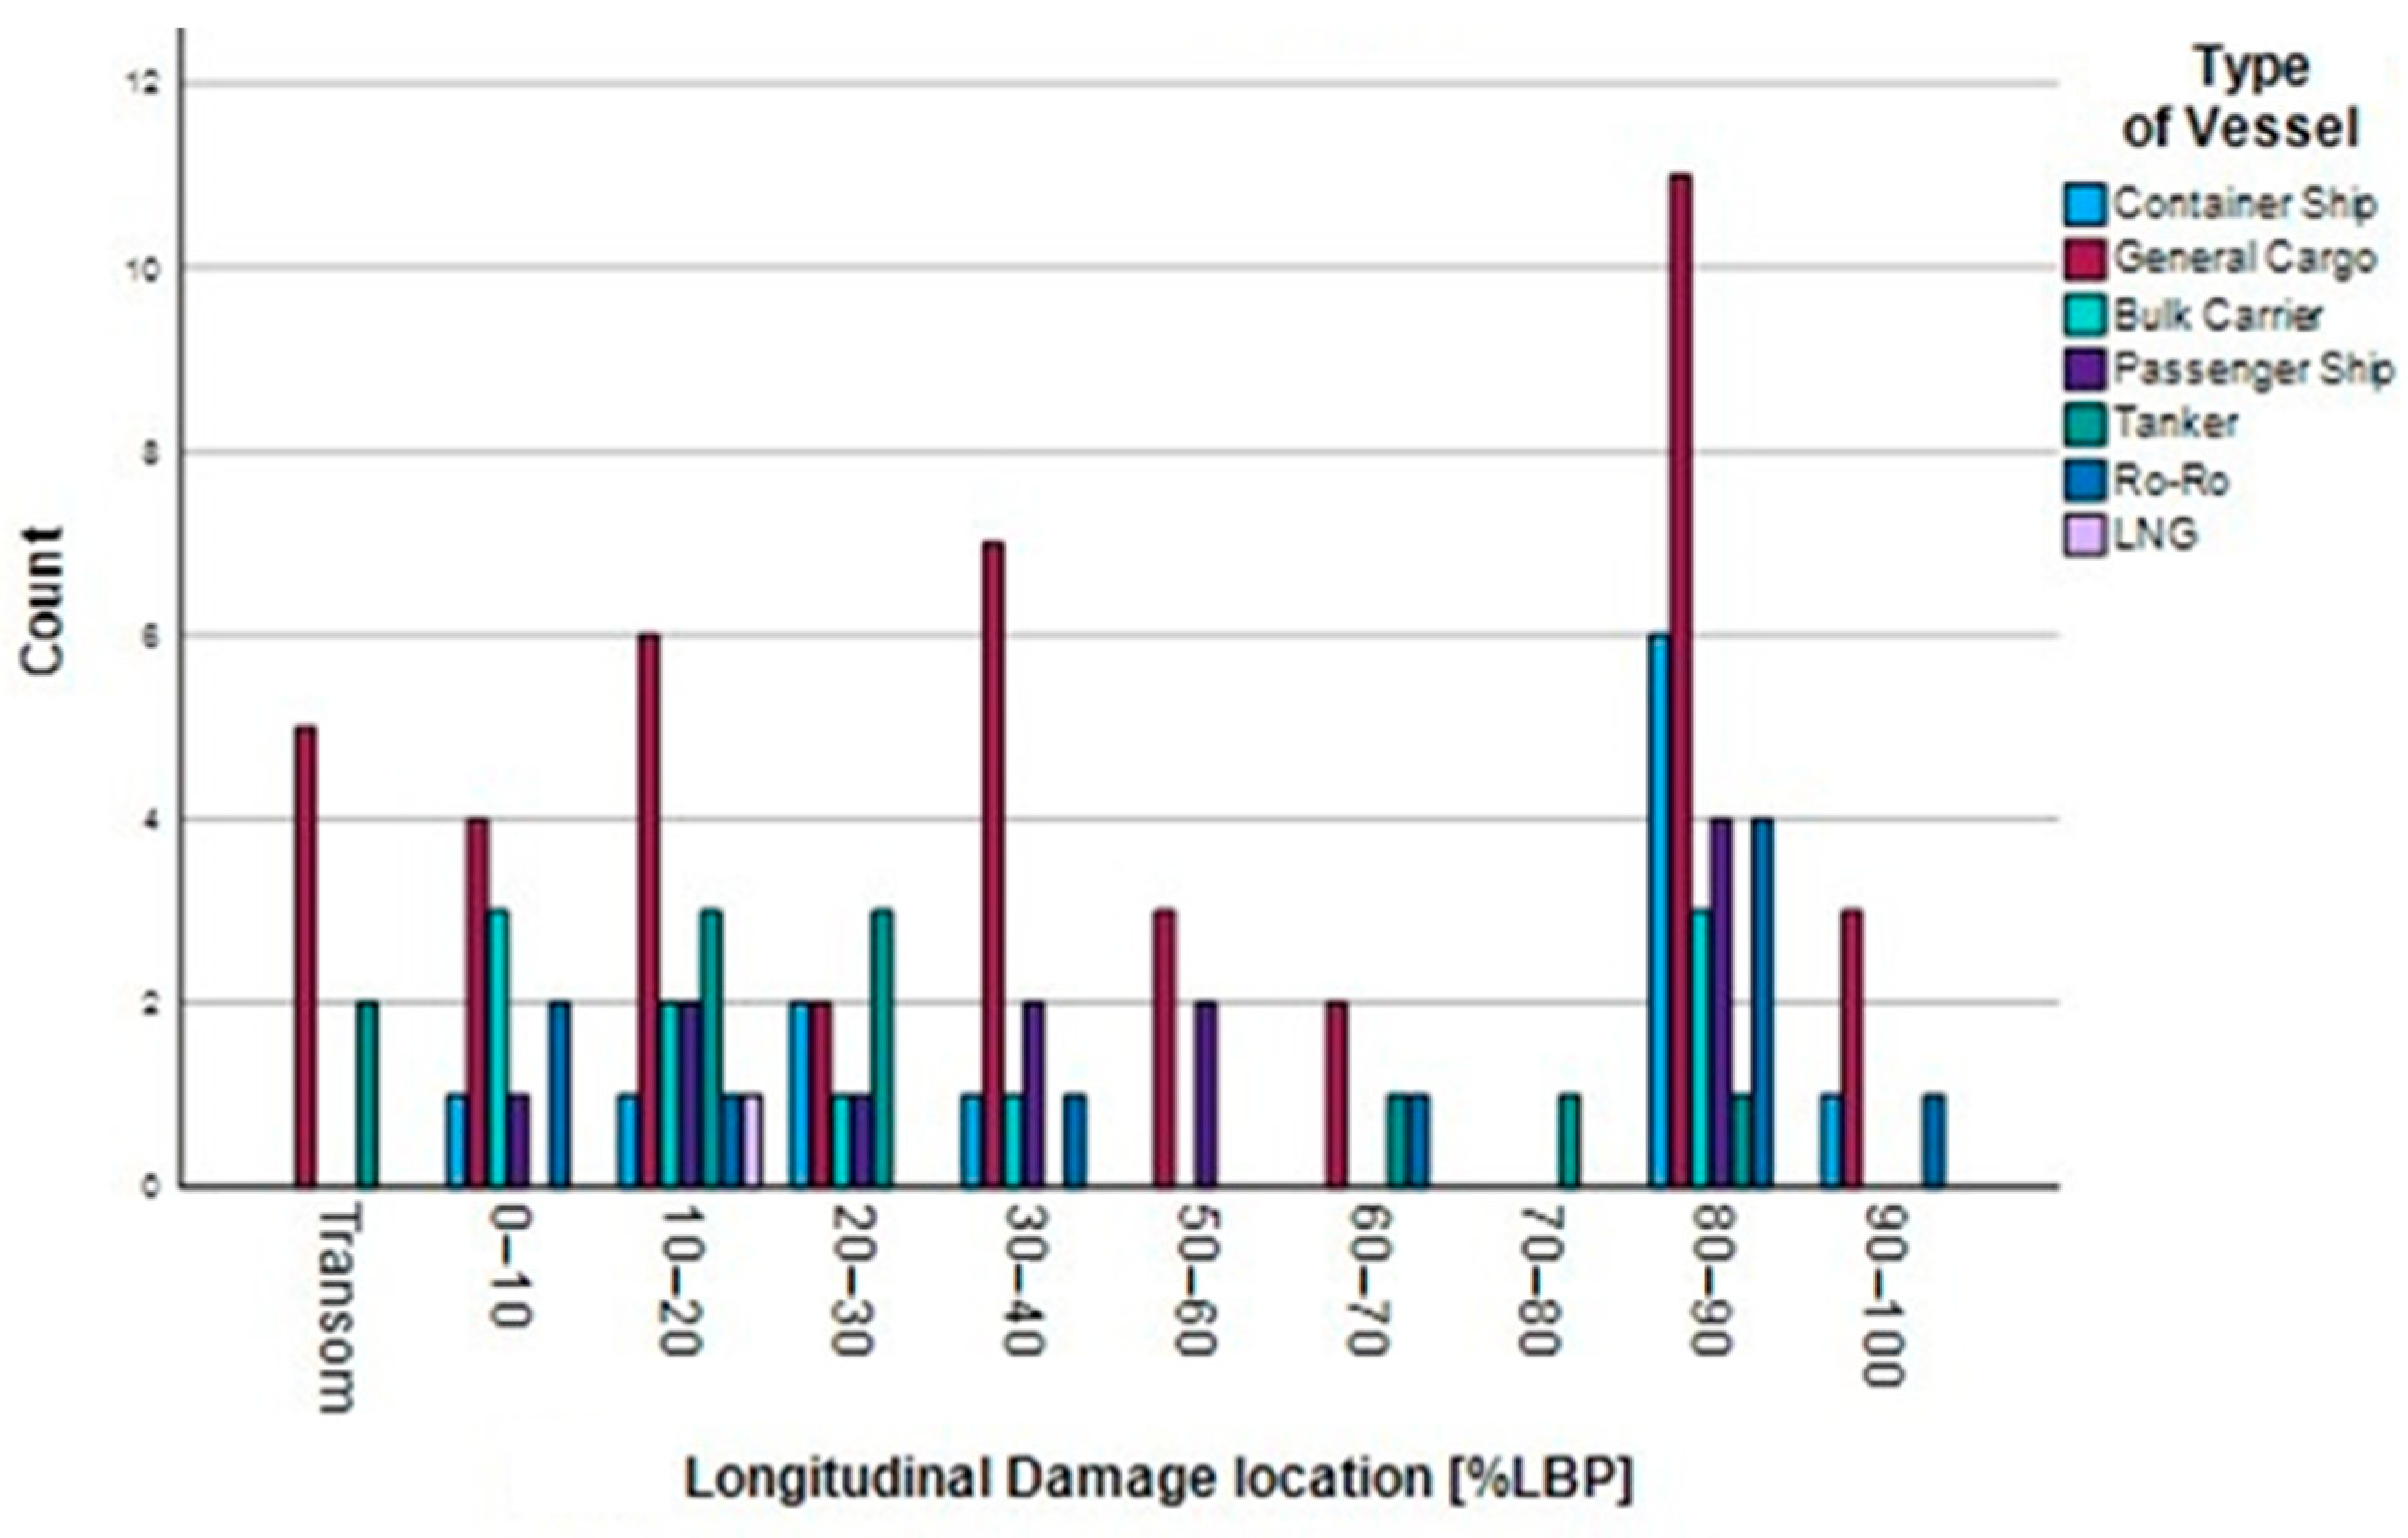
Figure 19 and Figure 20 illustrate that, in collision accidents bulk carriers are the most common type of ship for longitudinal damage locations in the 80–90% and 90–100% LBP ranges, followed by general cargo and container ships at the same locations. For the vertical damage location “Above deck”, the most frequent ship types are general cargo and bulk carriers, followed by other types.
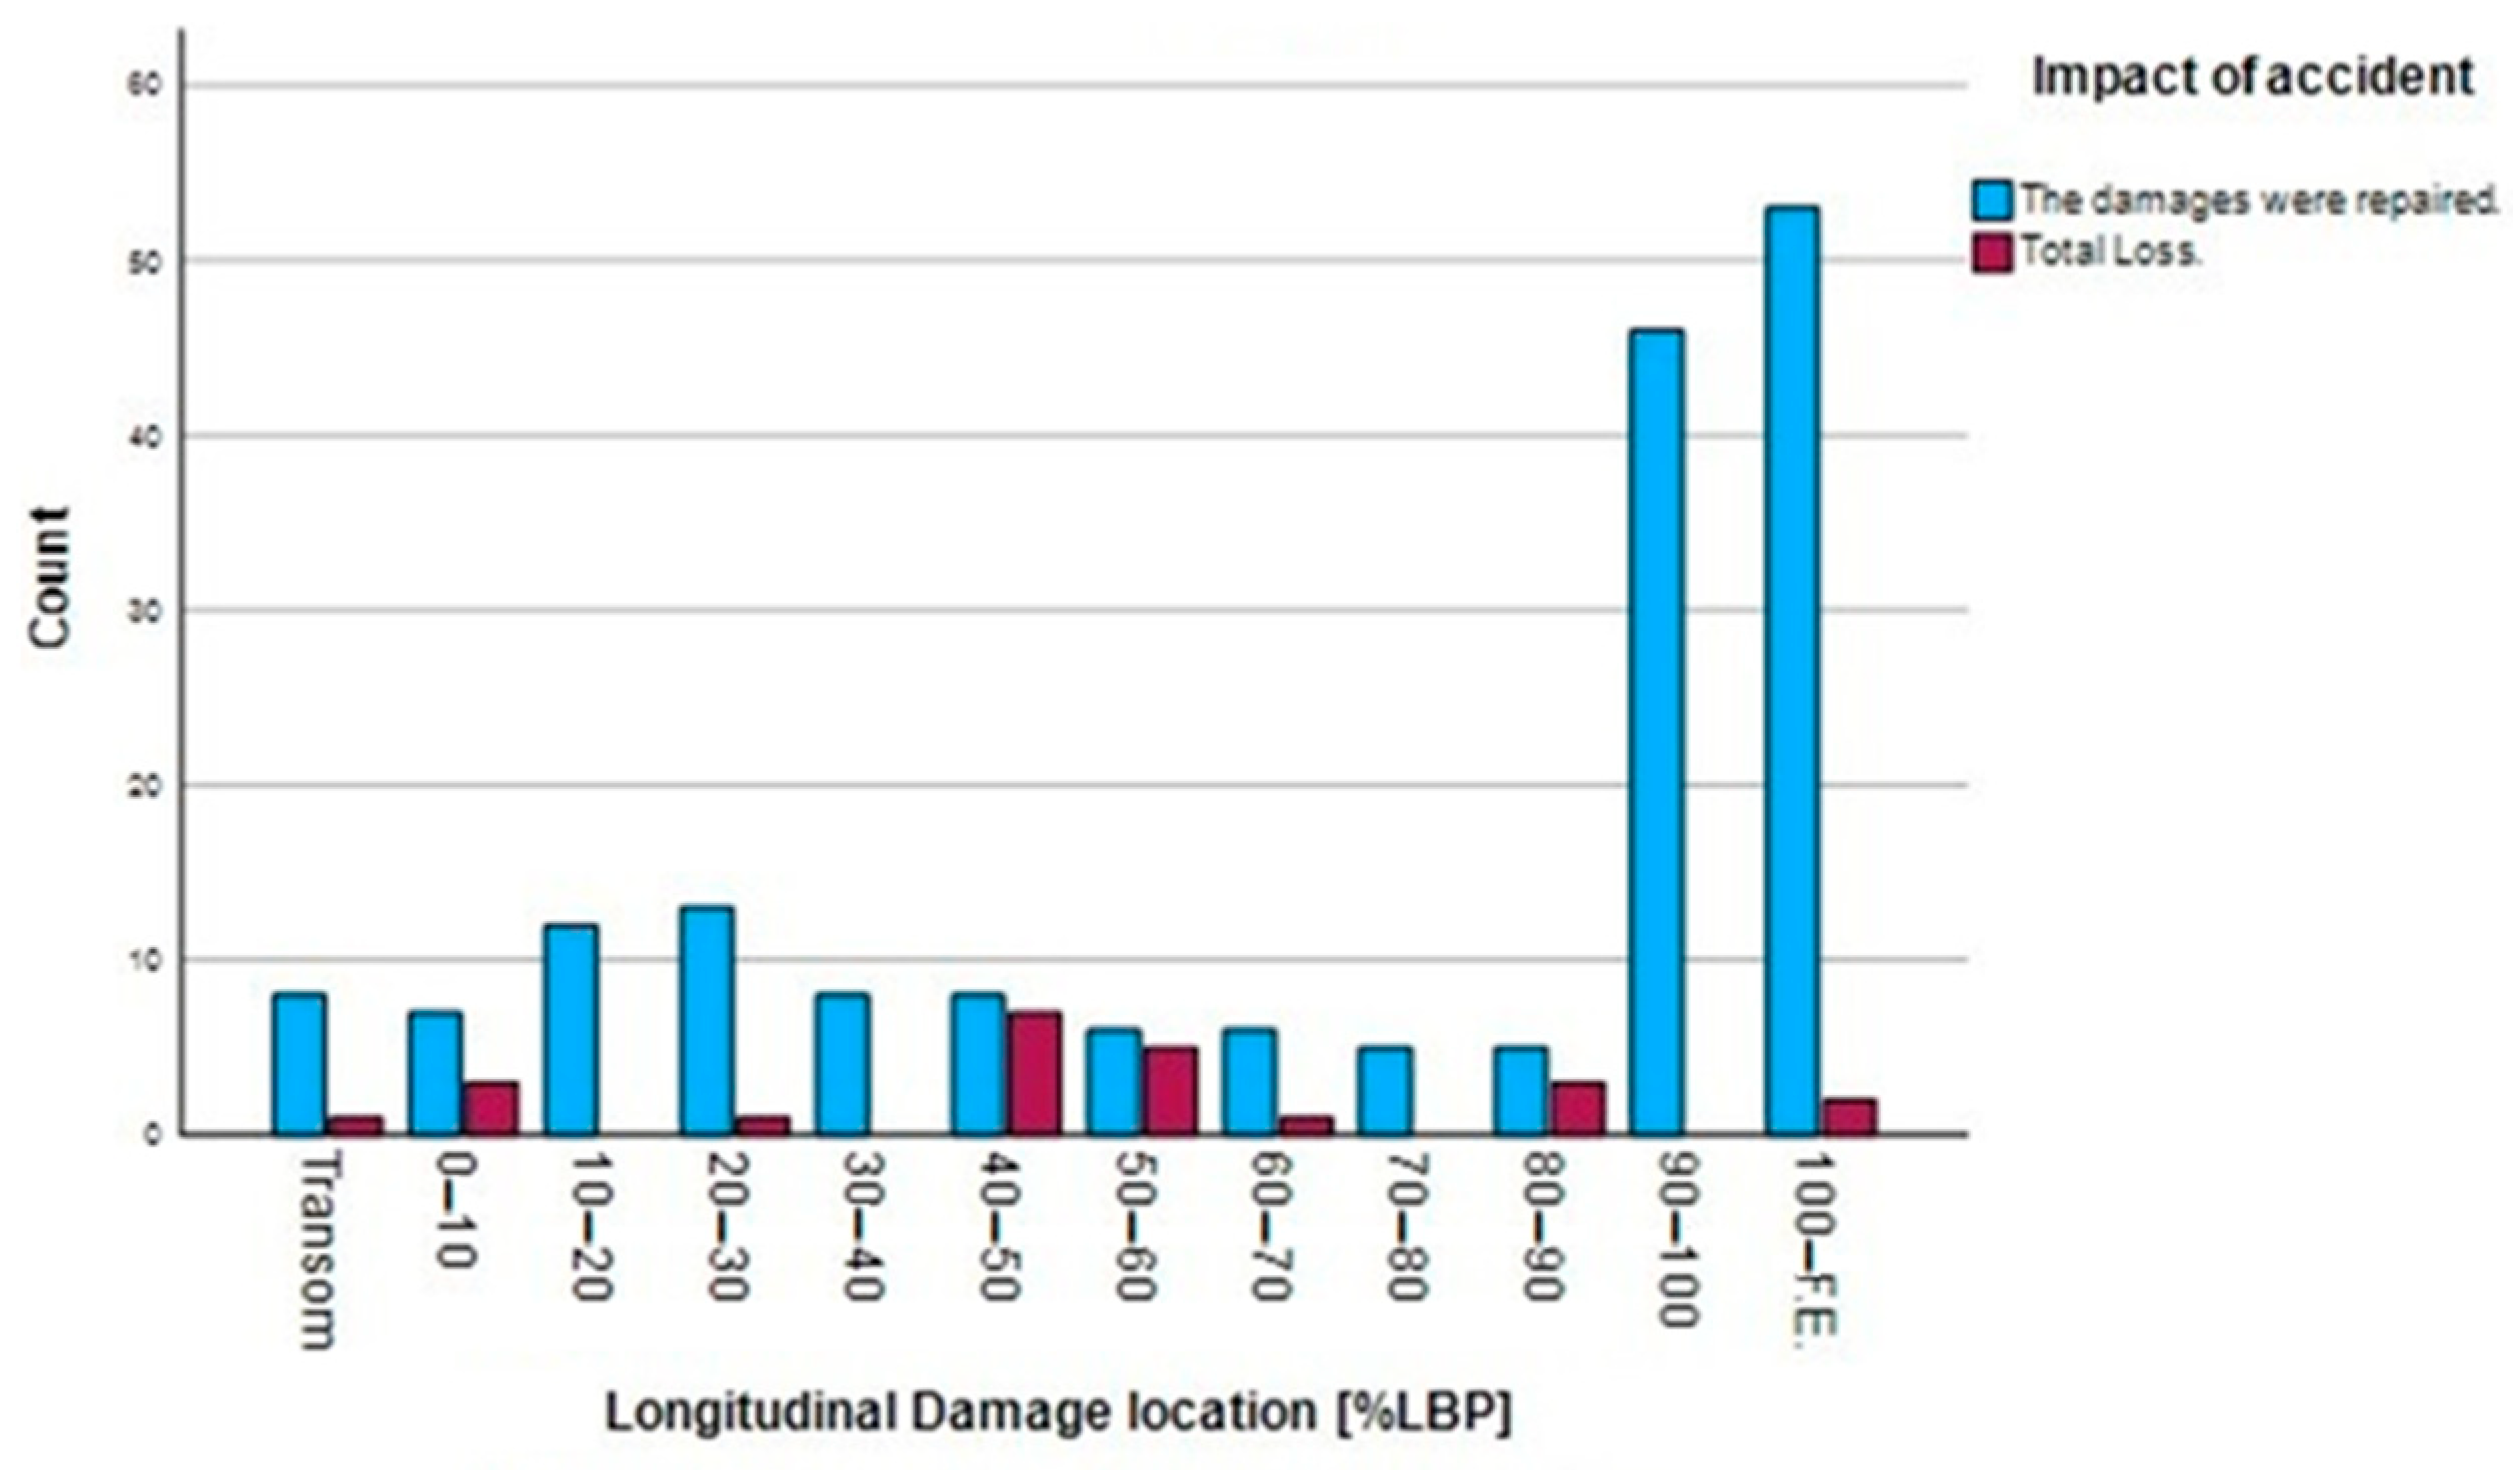
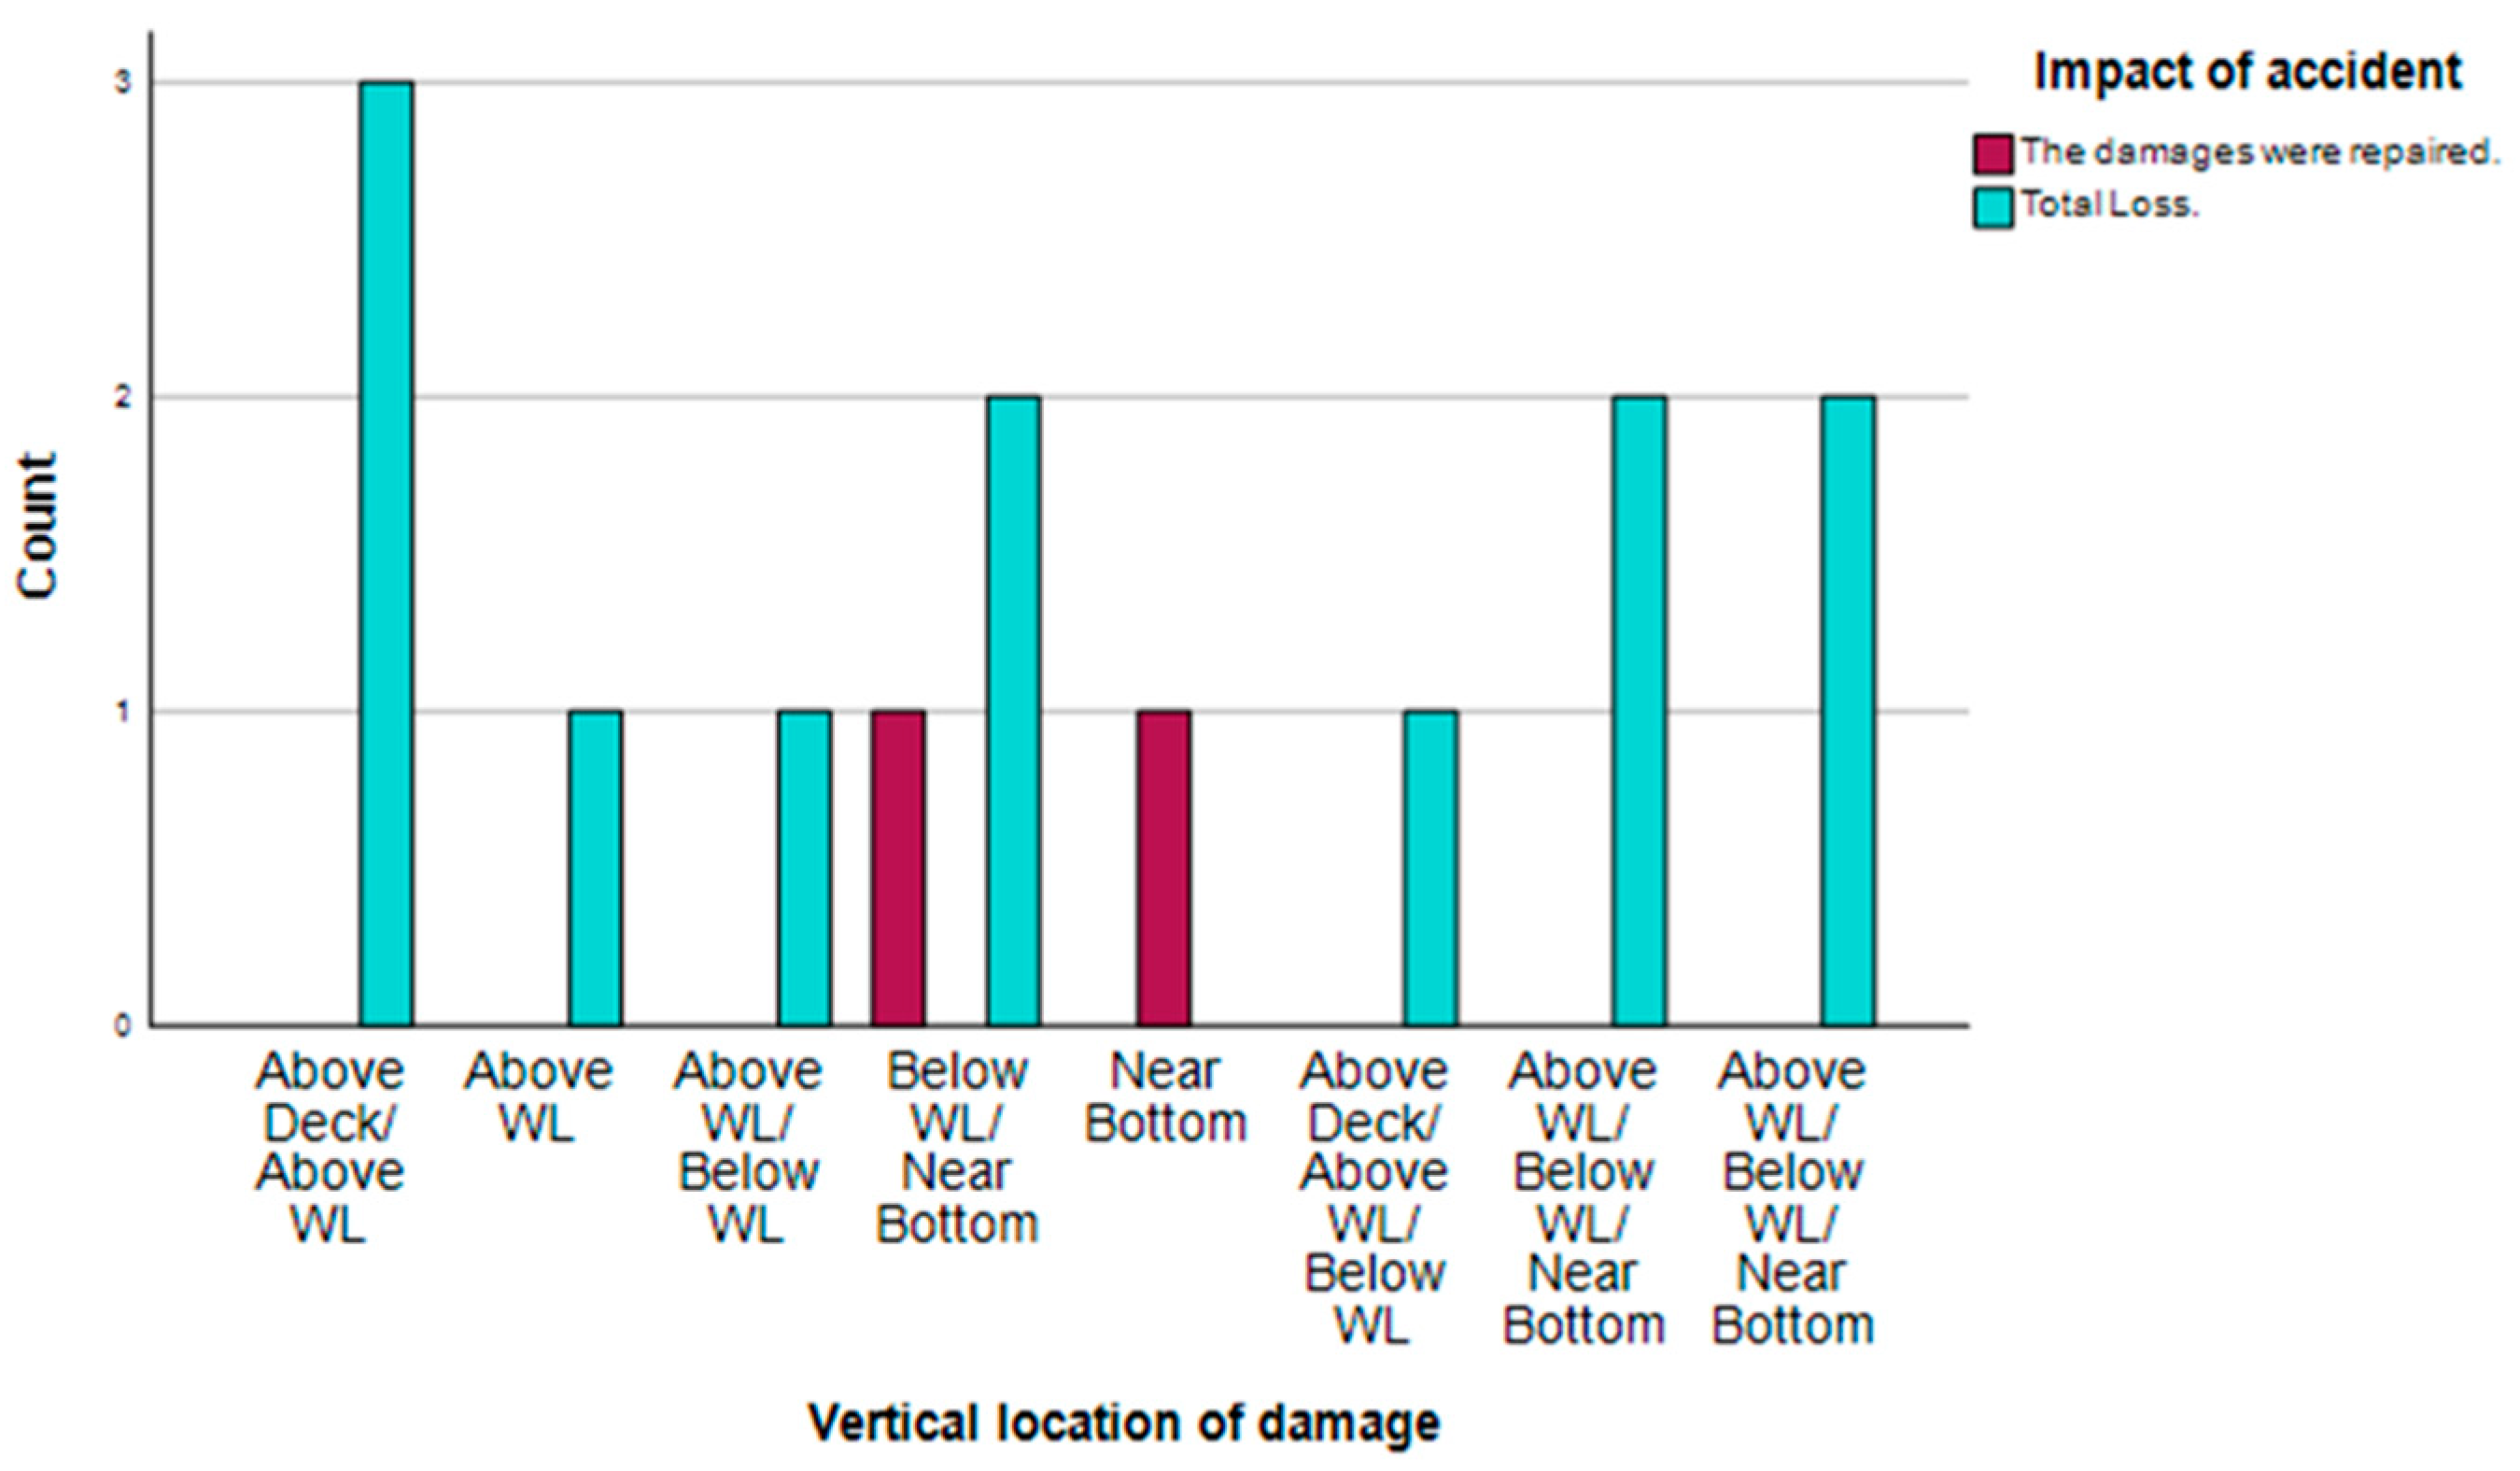
Figure 21 and Figure 22 demonstrate the impact of accidents with respect to damage locations. We can see that, for all longitudinal damage positions the damage was repaired. The position with the highest number of total losses is amidship at locations in the 40–50% and 50–60% LBP ranges. Ships with damage in the area below the waterline have a higher total loss rate, followed by those above/below the waterline/near the bottom.
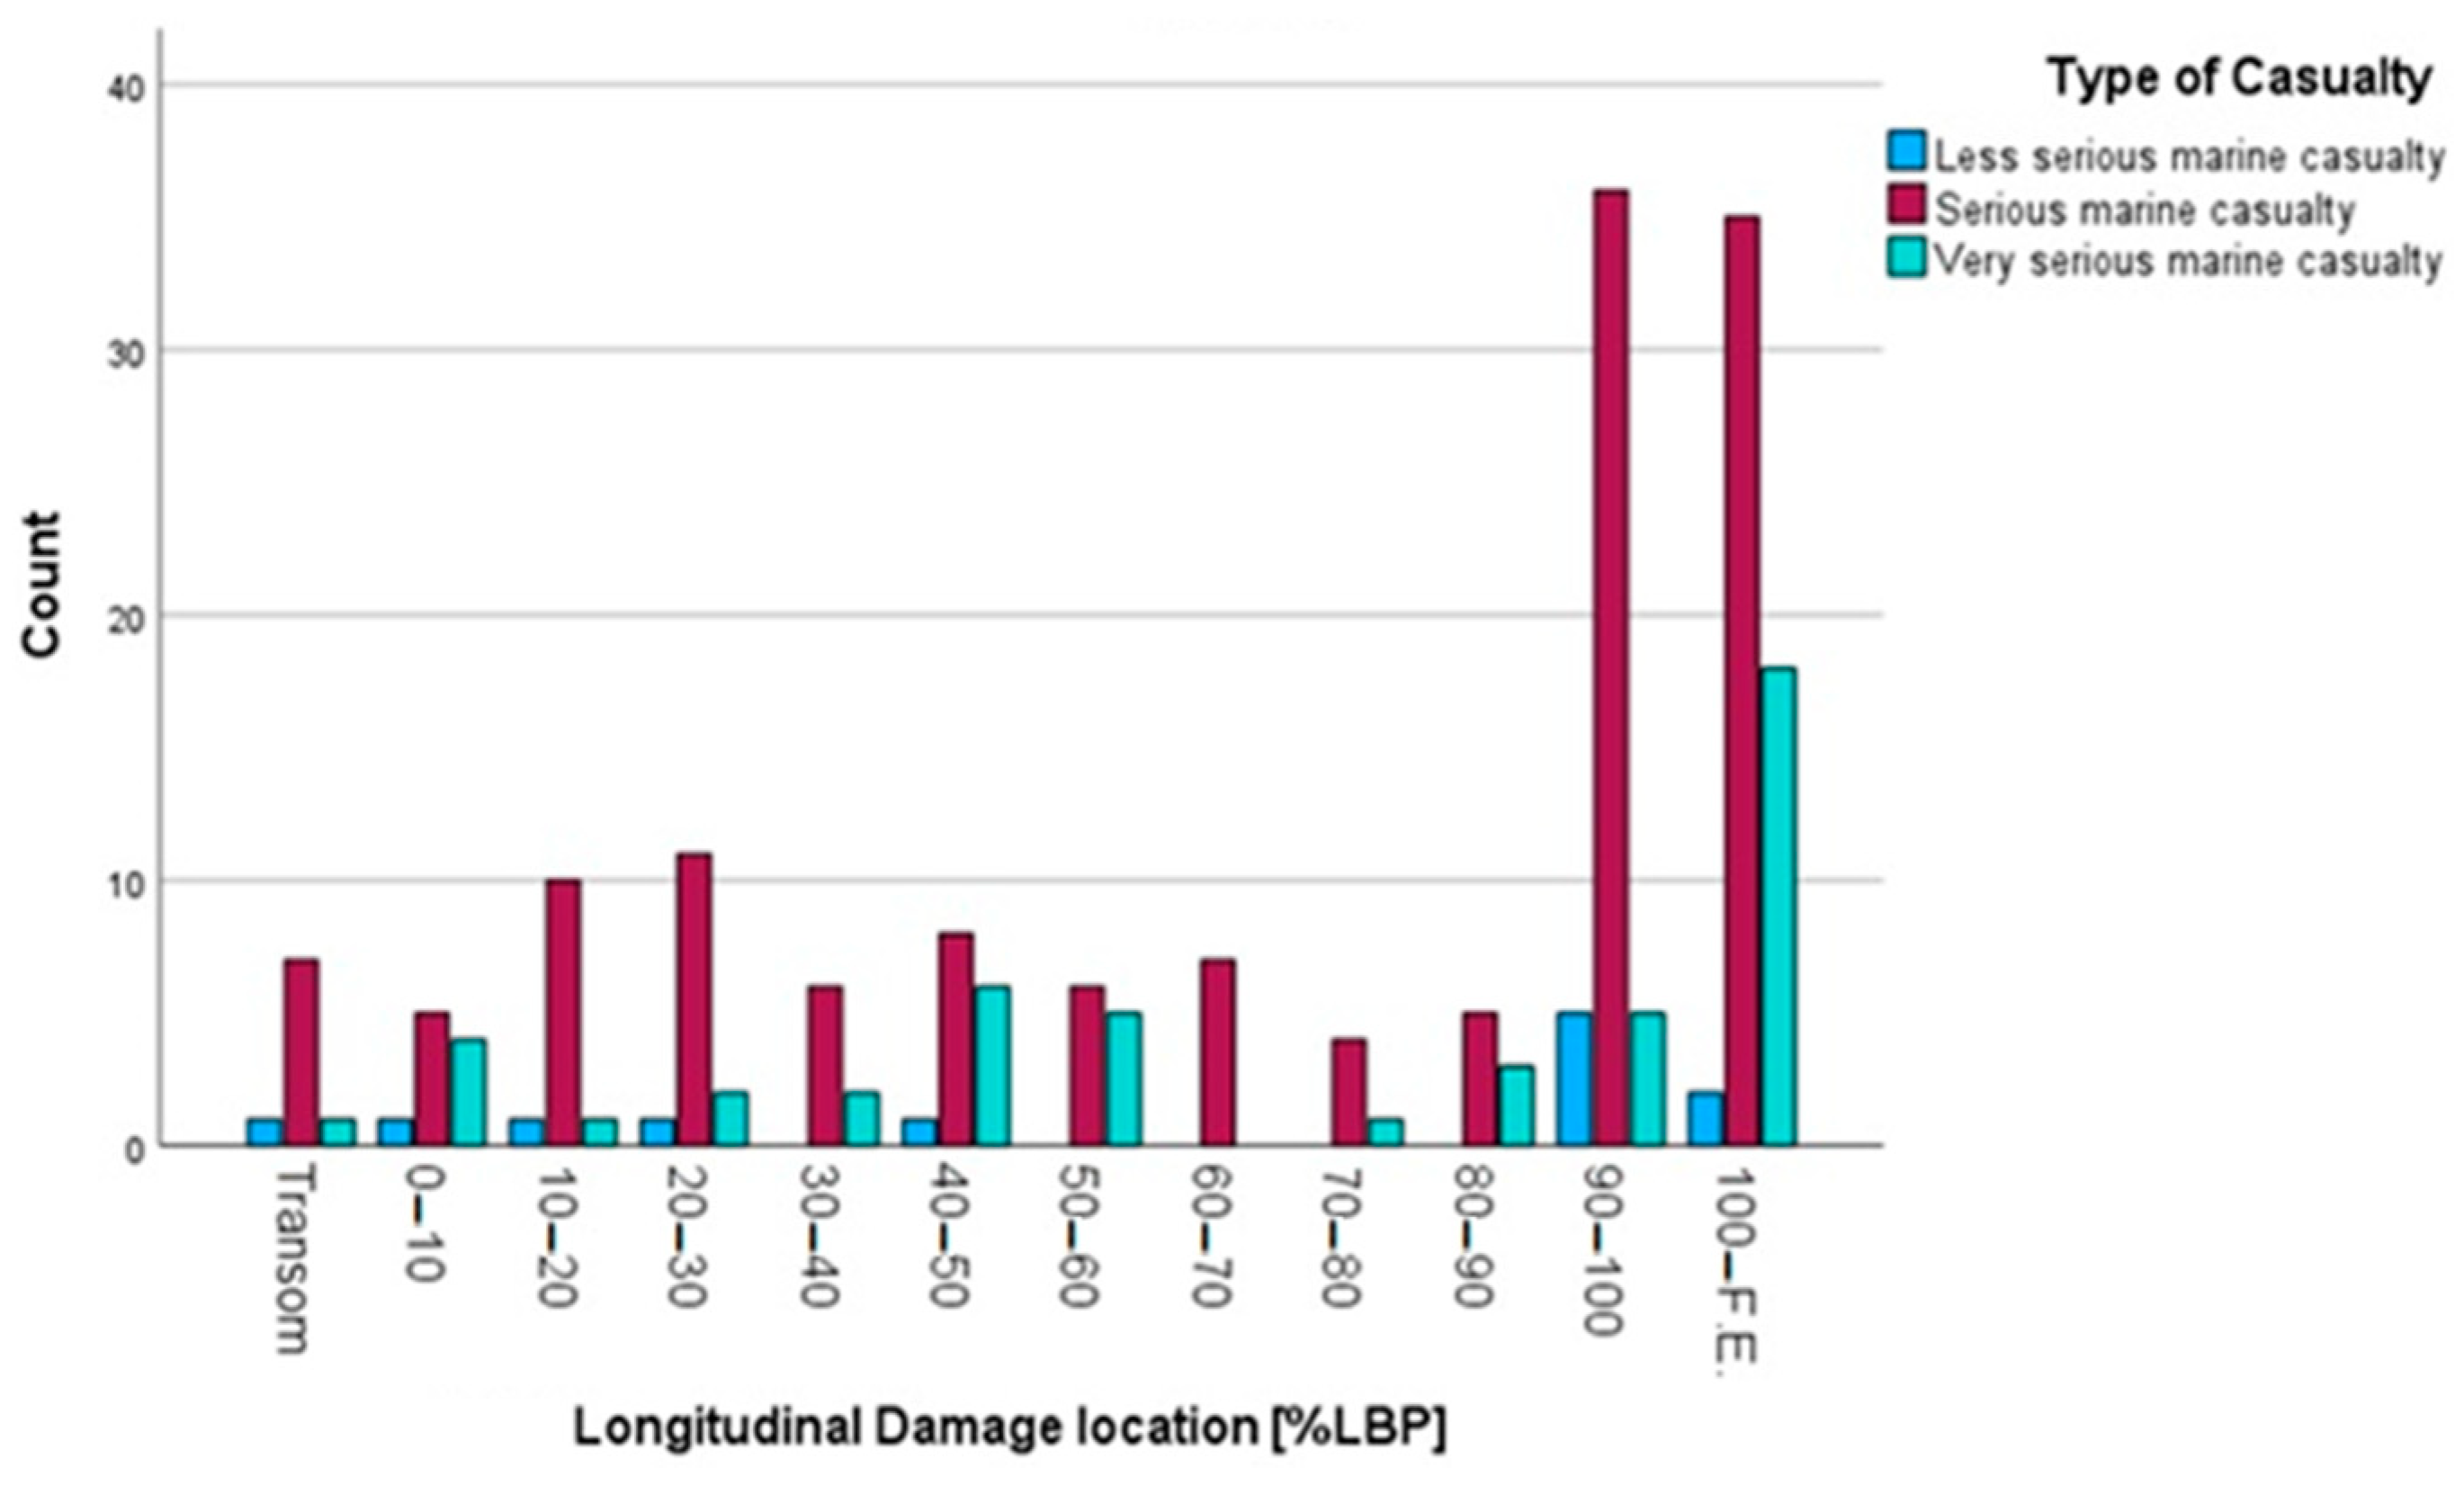
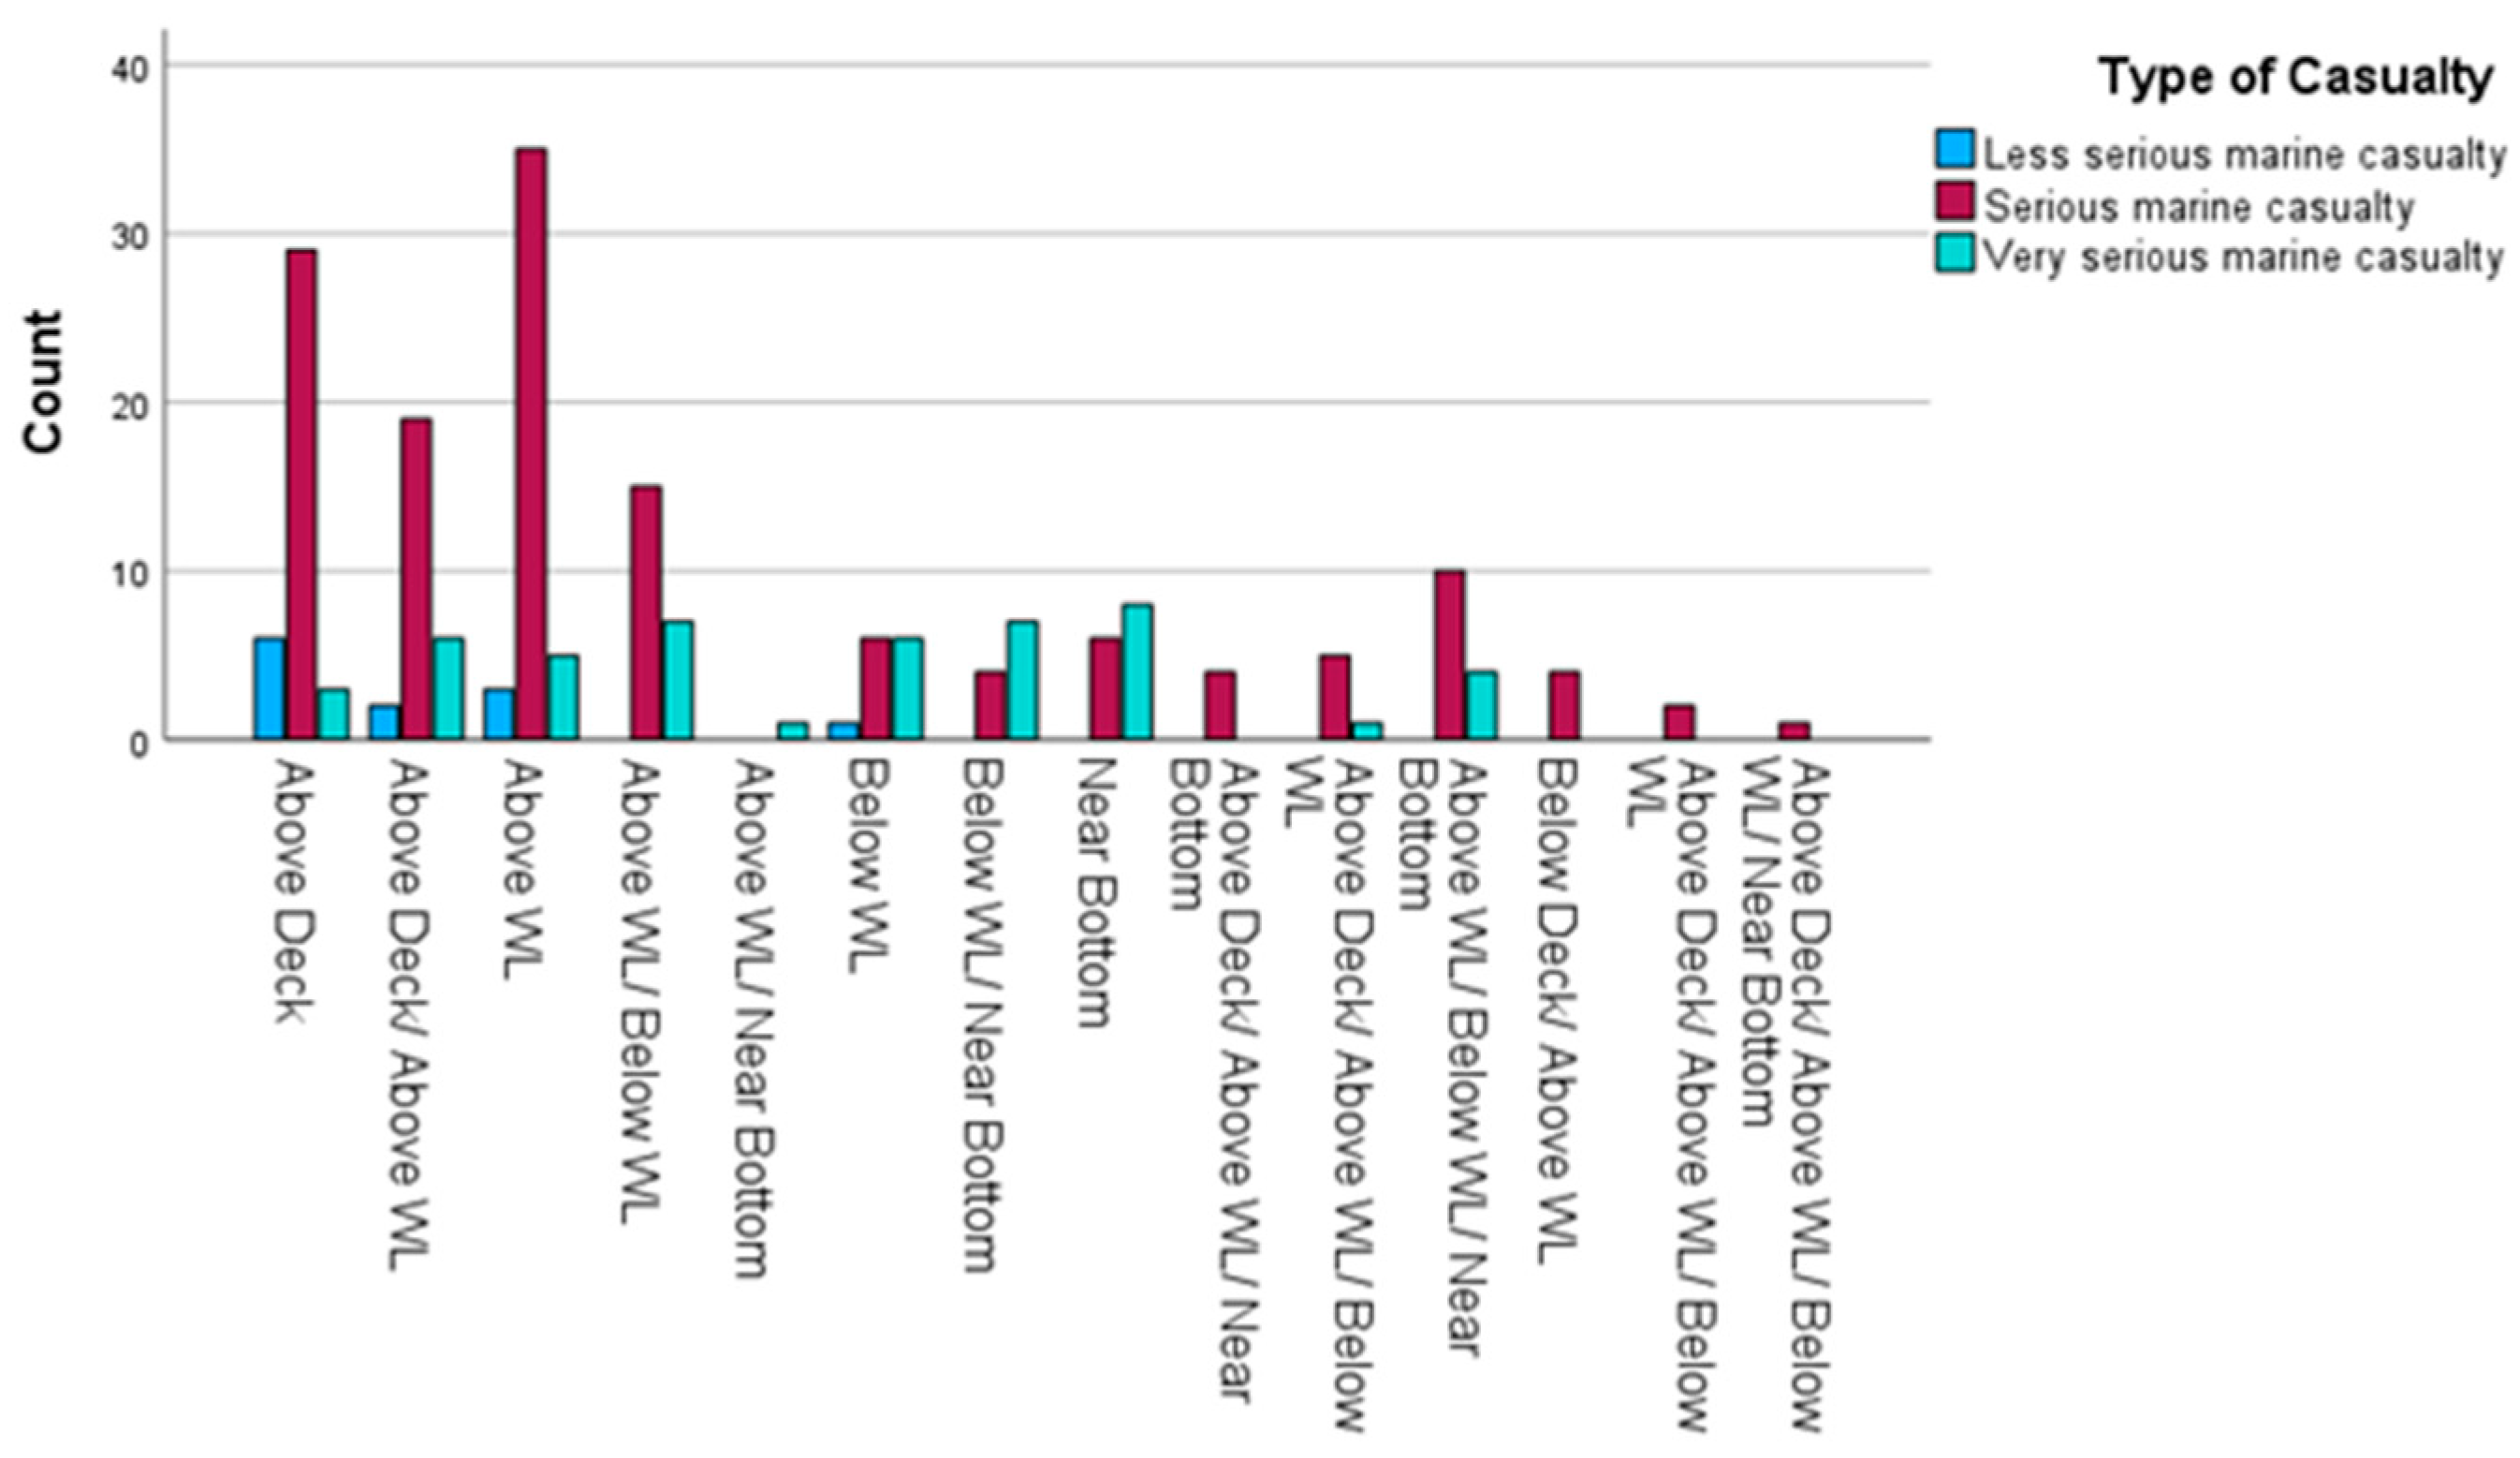
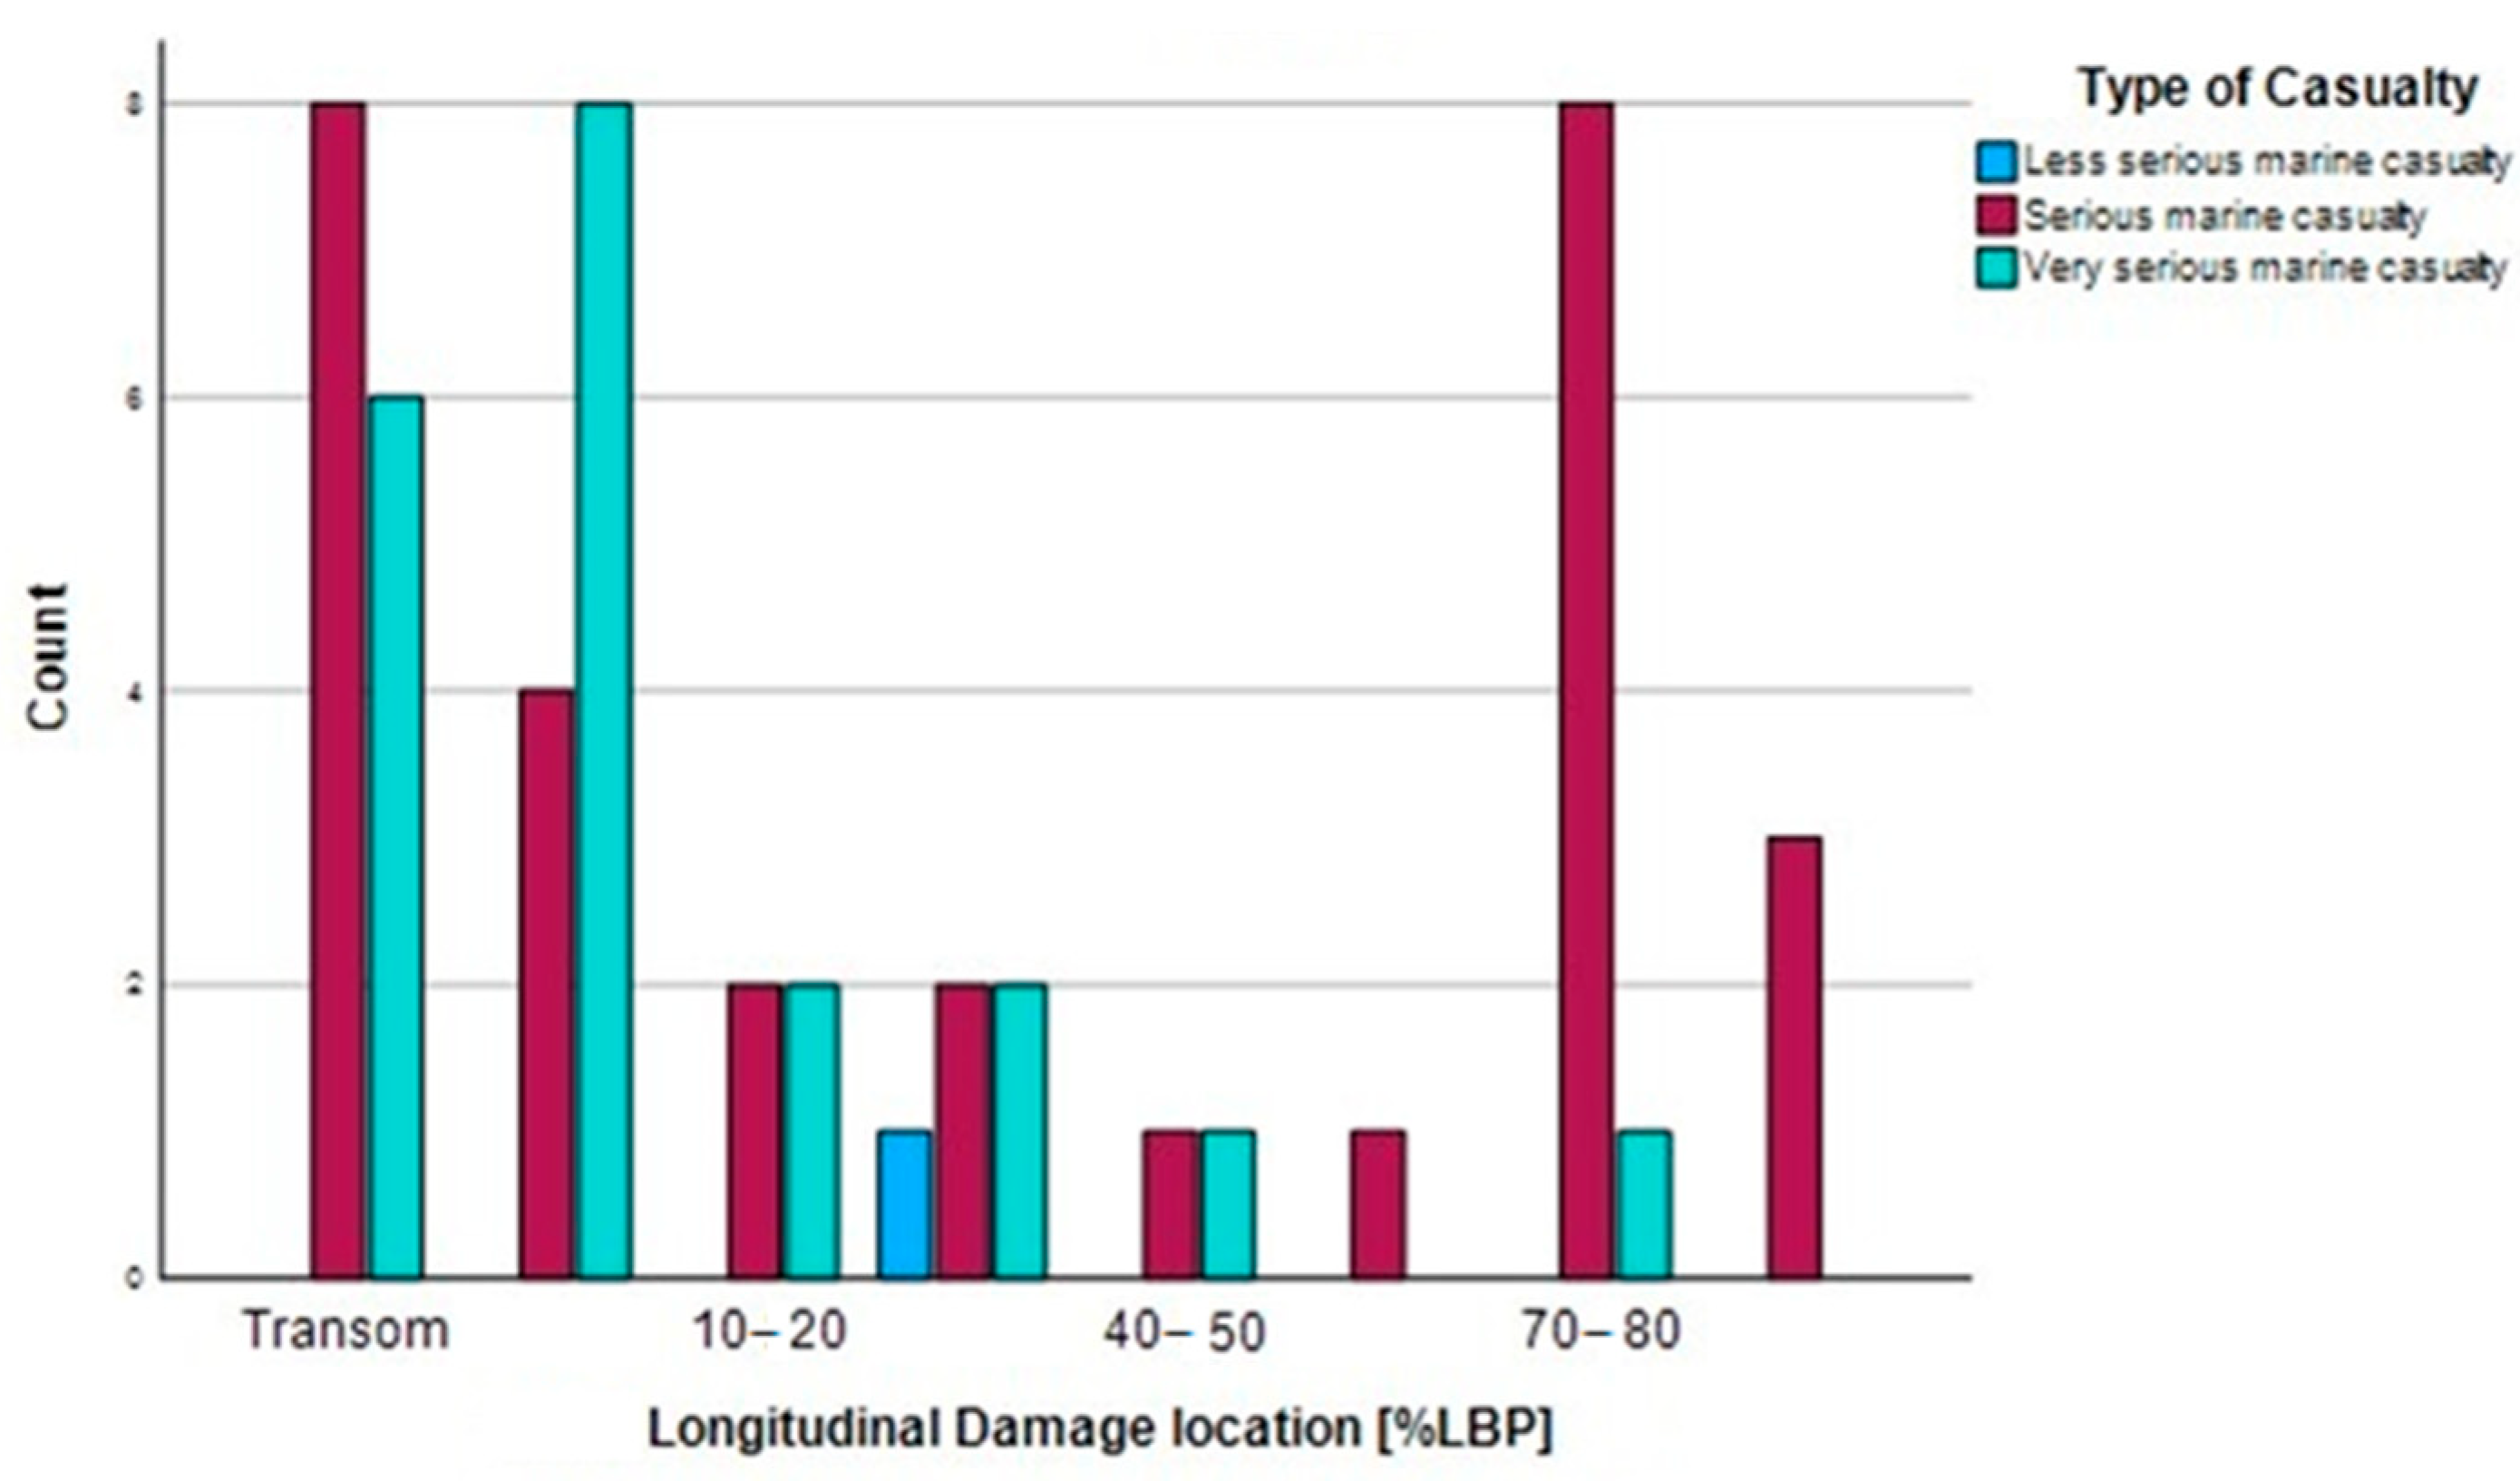
Figure 23 and Figure 24 demonstrate the types of marine casualties due to collision accidents. The most severe marine casualties were in the 90–100% LBP and 100% fore end ranges, followed by the 20–30%, and 10–20% LBP ranges. Instances of very serious marine casualties were found at 100% fore end, and amidships at 40–50% and 50–60% LBP. With respect to vertical damage location, serious marine casualties occurred above the waterline (W.L.), followed by above deck and the area above deck/above the waterline, while very serious casualties were found near the bottom and below the waterline.
From the correlation analysis results presented above (Figure 17, Figure 18, Figure 19, Figure 20, Figure 21, Figure 22, Figure 23 and Figure 24), regarding the location and extent of the damage, the impact of the accident, and the type of casualty, we can identify the most dominant key factors (such as ship type, longitudinal location or damage, etc.). The summarized key factors are as follows:
-
Longitudinal extent of damage: 10 m–15 m; ship type: containers;
-
Vertical extent of damage: 2 m–2.5 m; ship type: general cargo;
-
Vertical location: above deck; ship type: general cargo and bulk carrier;
-
Impact of accident: the damages were repaired; longitudinal location: 90–100% LBP;
-
Type of casualty: serious marine; longitudinal location: 90–100% LBP and 100%—FE;
-
Impact of accident: the damage was repaired; vertical damage location: above WL;
-
Type of casualty: serious marine; vertical damage location: above WL.

4.2.2. Grounding

As observed in Figure 25 and Figure 26, for longitudinal damage extents in the length ranges 3–4 m, 2.0–2.5 m, and 4.0–5.0 m, the most frequently encountered ship type is general cargo, followed by passenger ships at 2.0–2.5 m length, and then other types. For transverse damage extents at a width of 2–2.5 m, most ships are general cargo.
According to Figure 27, in grounding incidents, general cargo vessels are the most common type of ship for longitudinal damage locations in the 80–90%, 30–40%, and 10–20% LBP ranges, followed by container ships at 80–90% LBP location.
Figure 28 illustrates the impact of accidents on damages that were repaired for all longitudinal damage locations in the grounding. The position with the highest number of total losses is in the aft part of the ship at longitudinal damage locations in the 0–10% LBP and transom ranges.
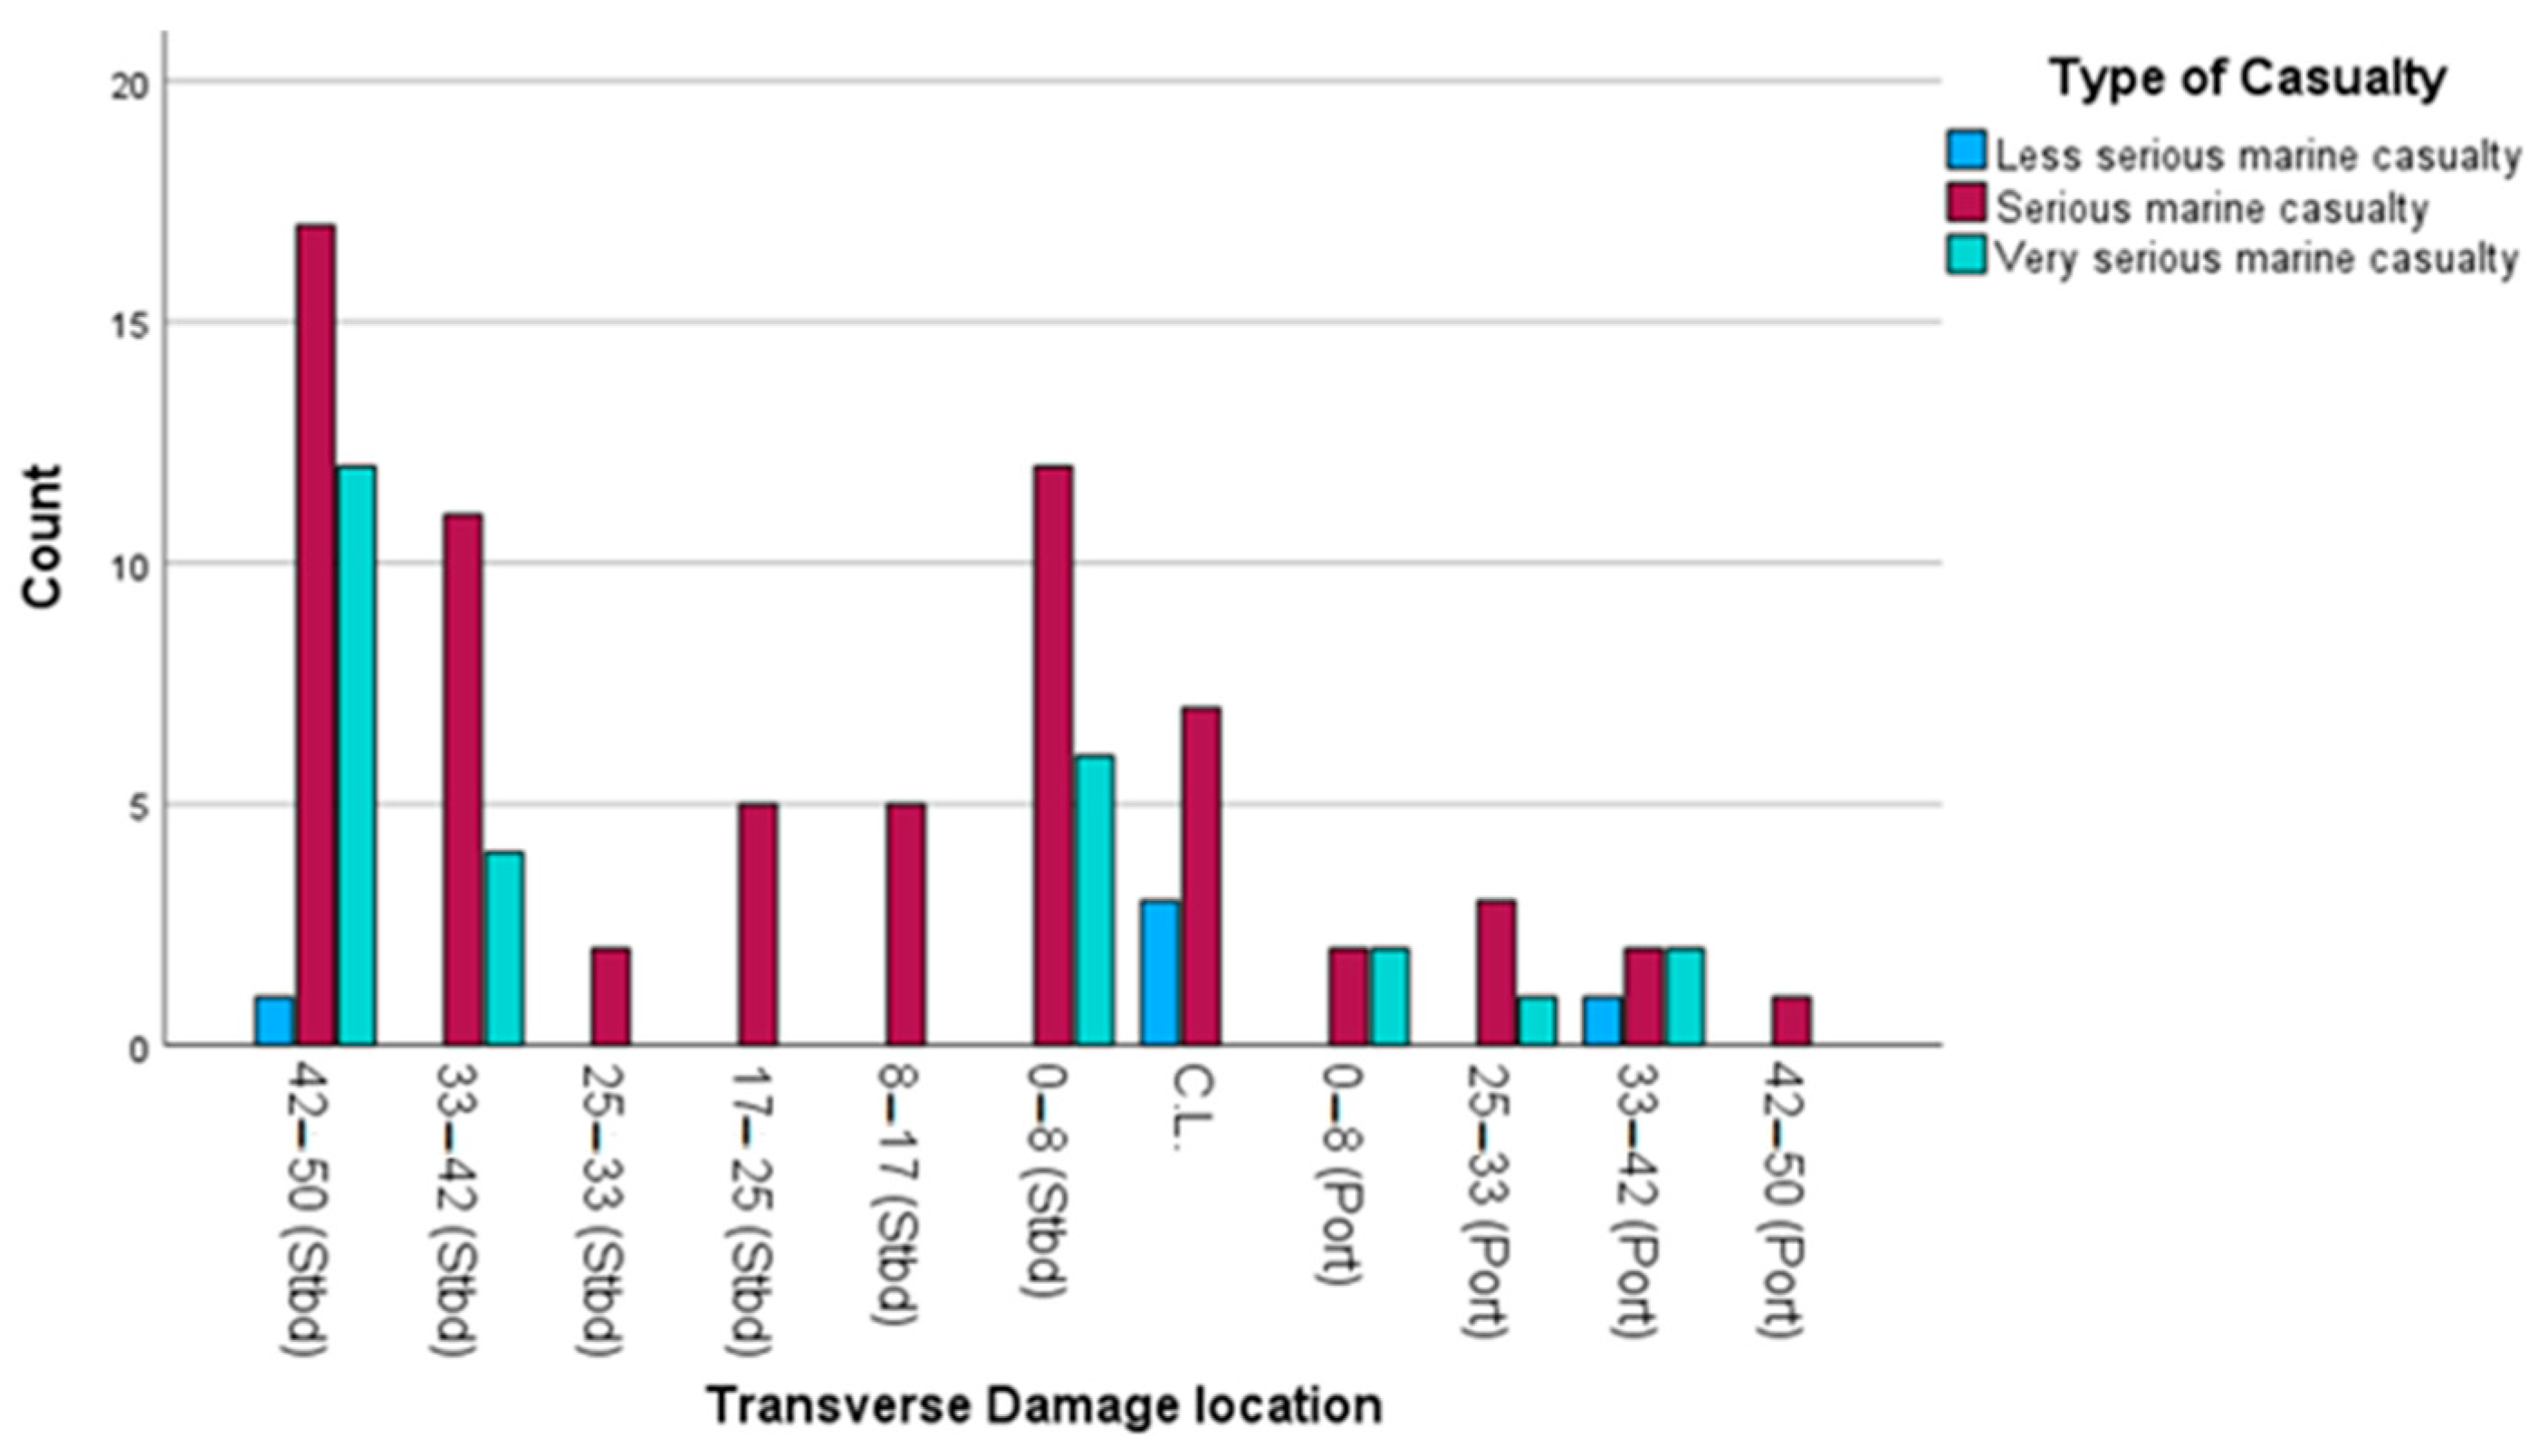
Figure 29 and Figure 30 depict the types of marine casualties. Serious marine casualties were observed in the 70–80% LBP and at the transom areas. Very serious marine casualties were found at 0–10% LBP and at the transom areas. Regarding transverse locations, serious marine casualties occurred at the starboard side of the vessel in 42–50% B, followed by 0–8% B, and 33–42% B, all at the starboard side. Very serious casualties were found 42–50% B, followed 0–8% B, both at the starboard side of the vessel.
From the correlation analysis results presented above (Figure 25, Figure 26, Figure 27, Figure 28, Figure 29 and Figure 30), regarding the location and extent of the damage, the impact of the accident, and the type of casualty, we can identify and summarize the most dominant key factors in the case of grounding, as follows:
-
Longitudinal extent of damage: 3 m–4 m; ship type: general cargo;
-
Transverse extent of damage: 2 m–2.5 m; ship type: general cargo;
-
Longitudinal damage location: 80–90% LBP; ship type: general cargo;
-
Impact of accident: the damages were repaired; longitudinal location: transom;
-
Type of casualty: serious marine; longitudinal location: transom and 70–80% LBP; and type of casualty: very serious; longitudinal location: 0–10% LBP;
-
Type of casualty: serious marine casualty; transverse location: 42–50% B (starboard).

4.2.3. Structural Failure

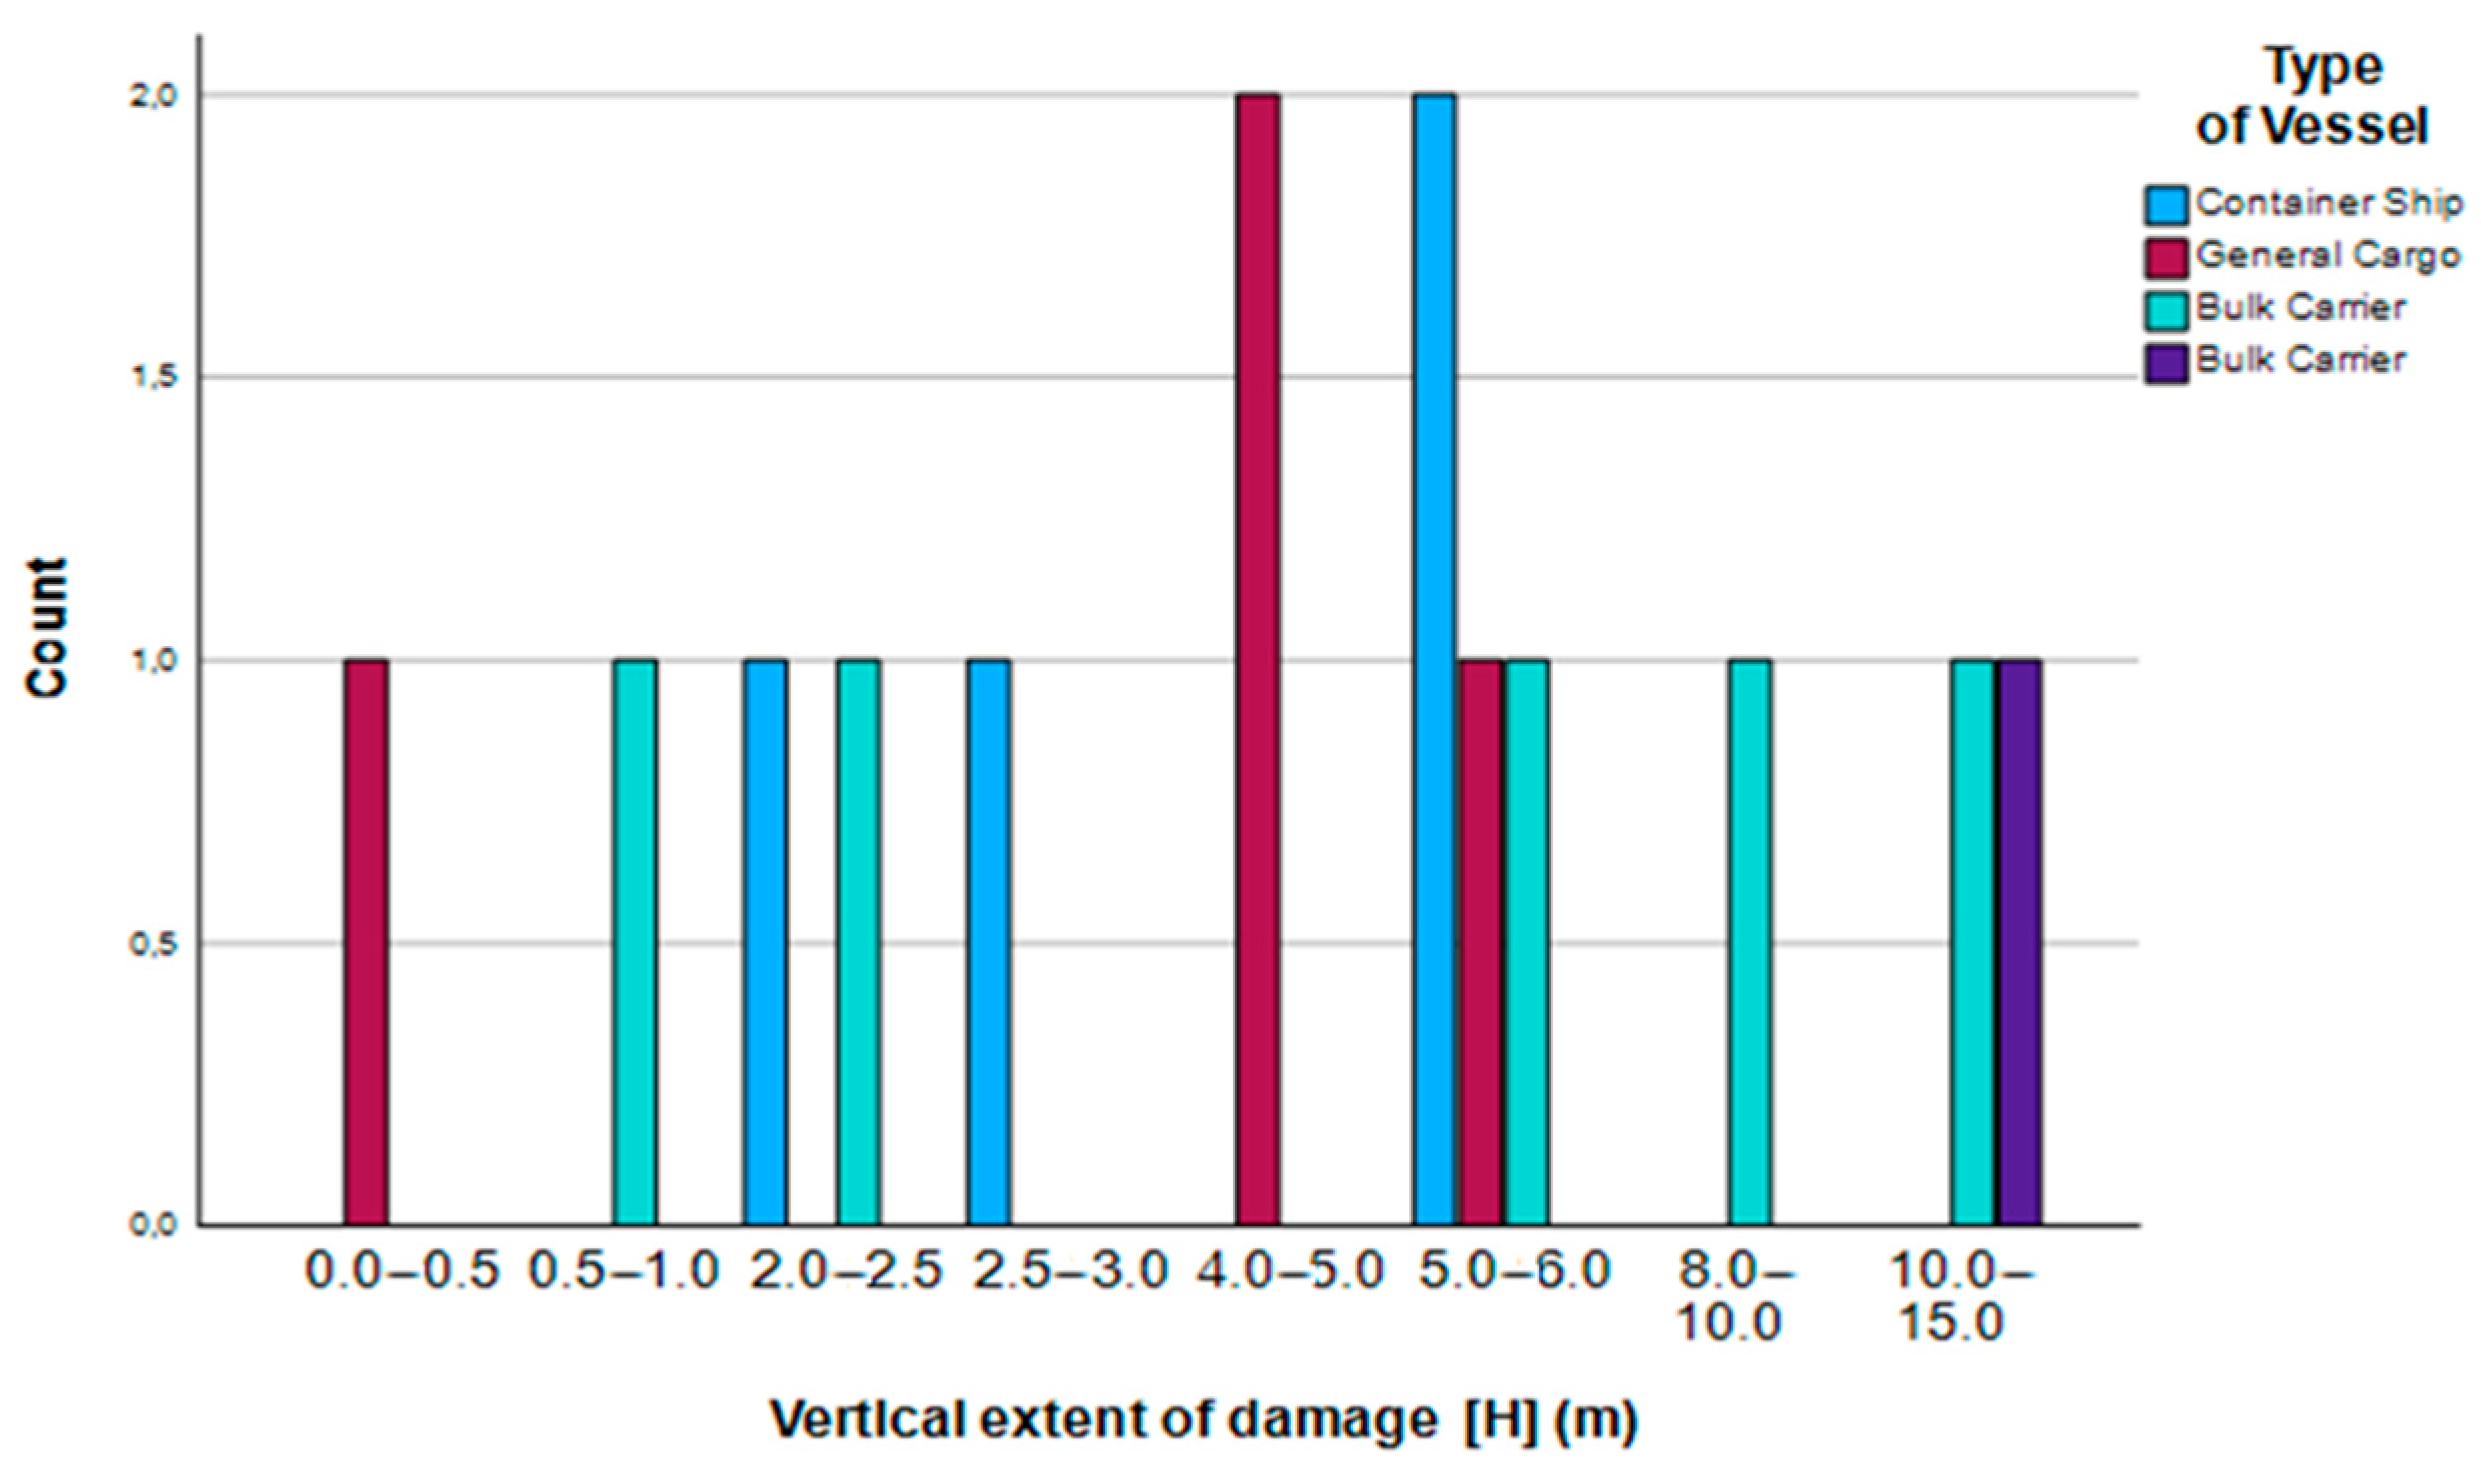
Figure 31 and Figure 32 illustrate that general cargo and bulk carriers are the most common types of ships for longitudinal damage extent, in the range of length 1–1.5 m, while container ships are the most common type for damage length of 0.5–1.0 m. Regarding the vertical damage extent, the most frequent damage height is in the range of 4–5 m for general cargo ship type, followed by a height of 5–6 m for containers.
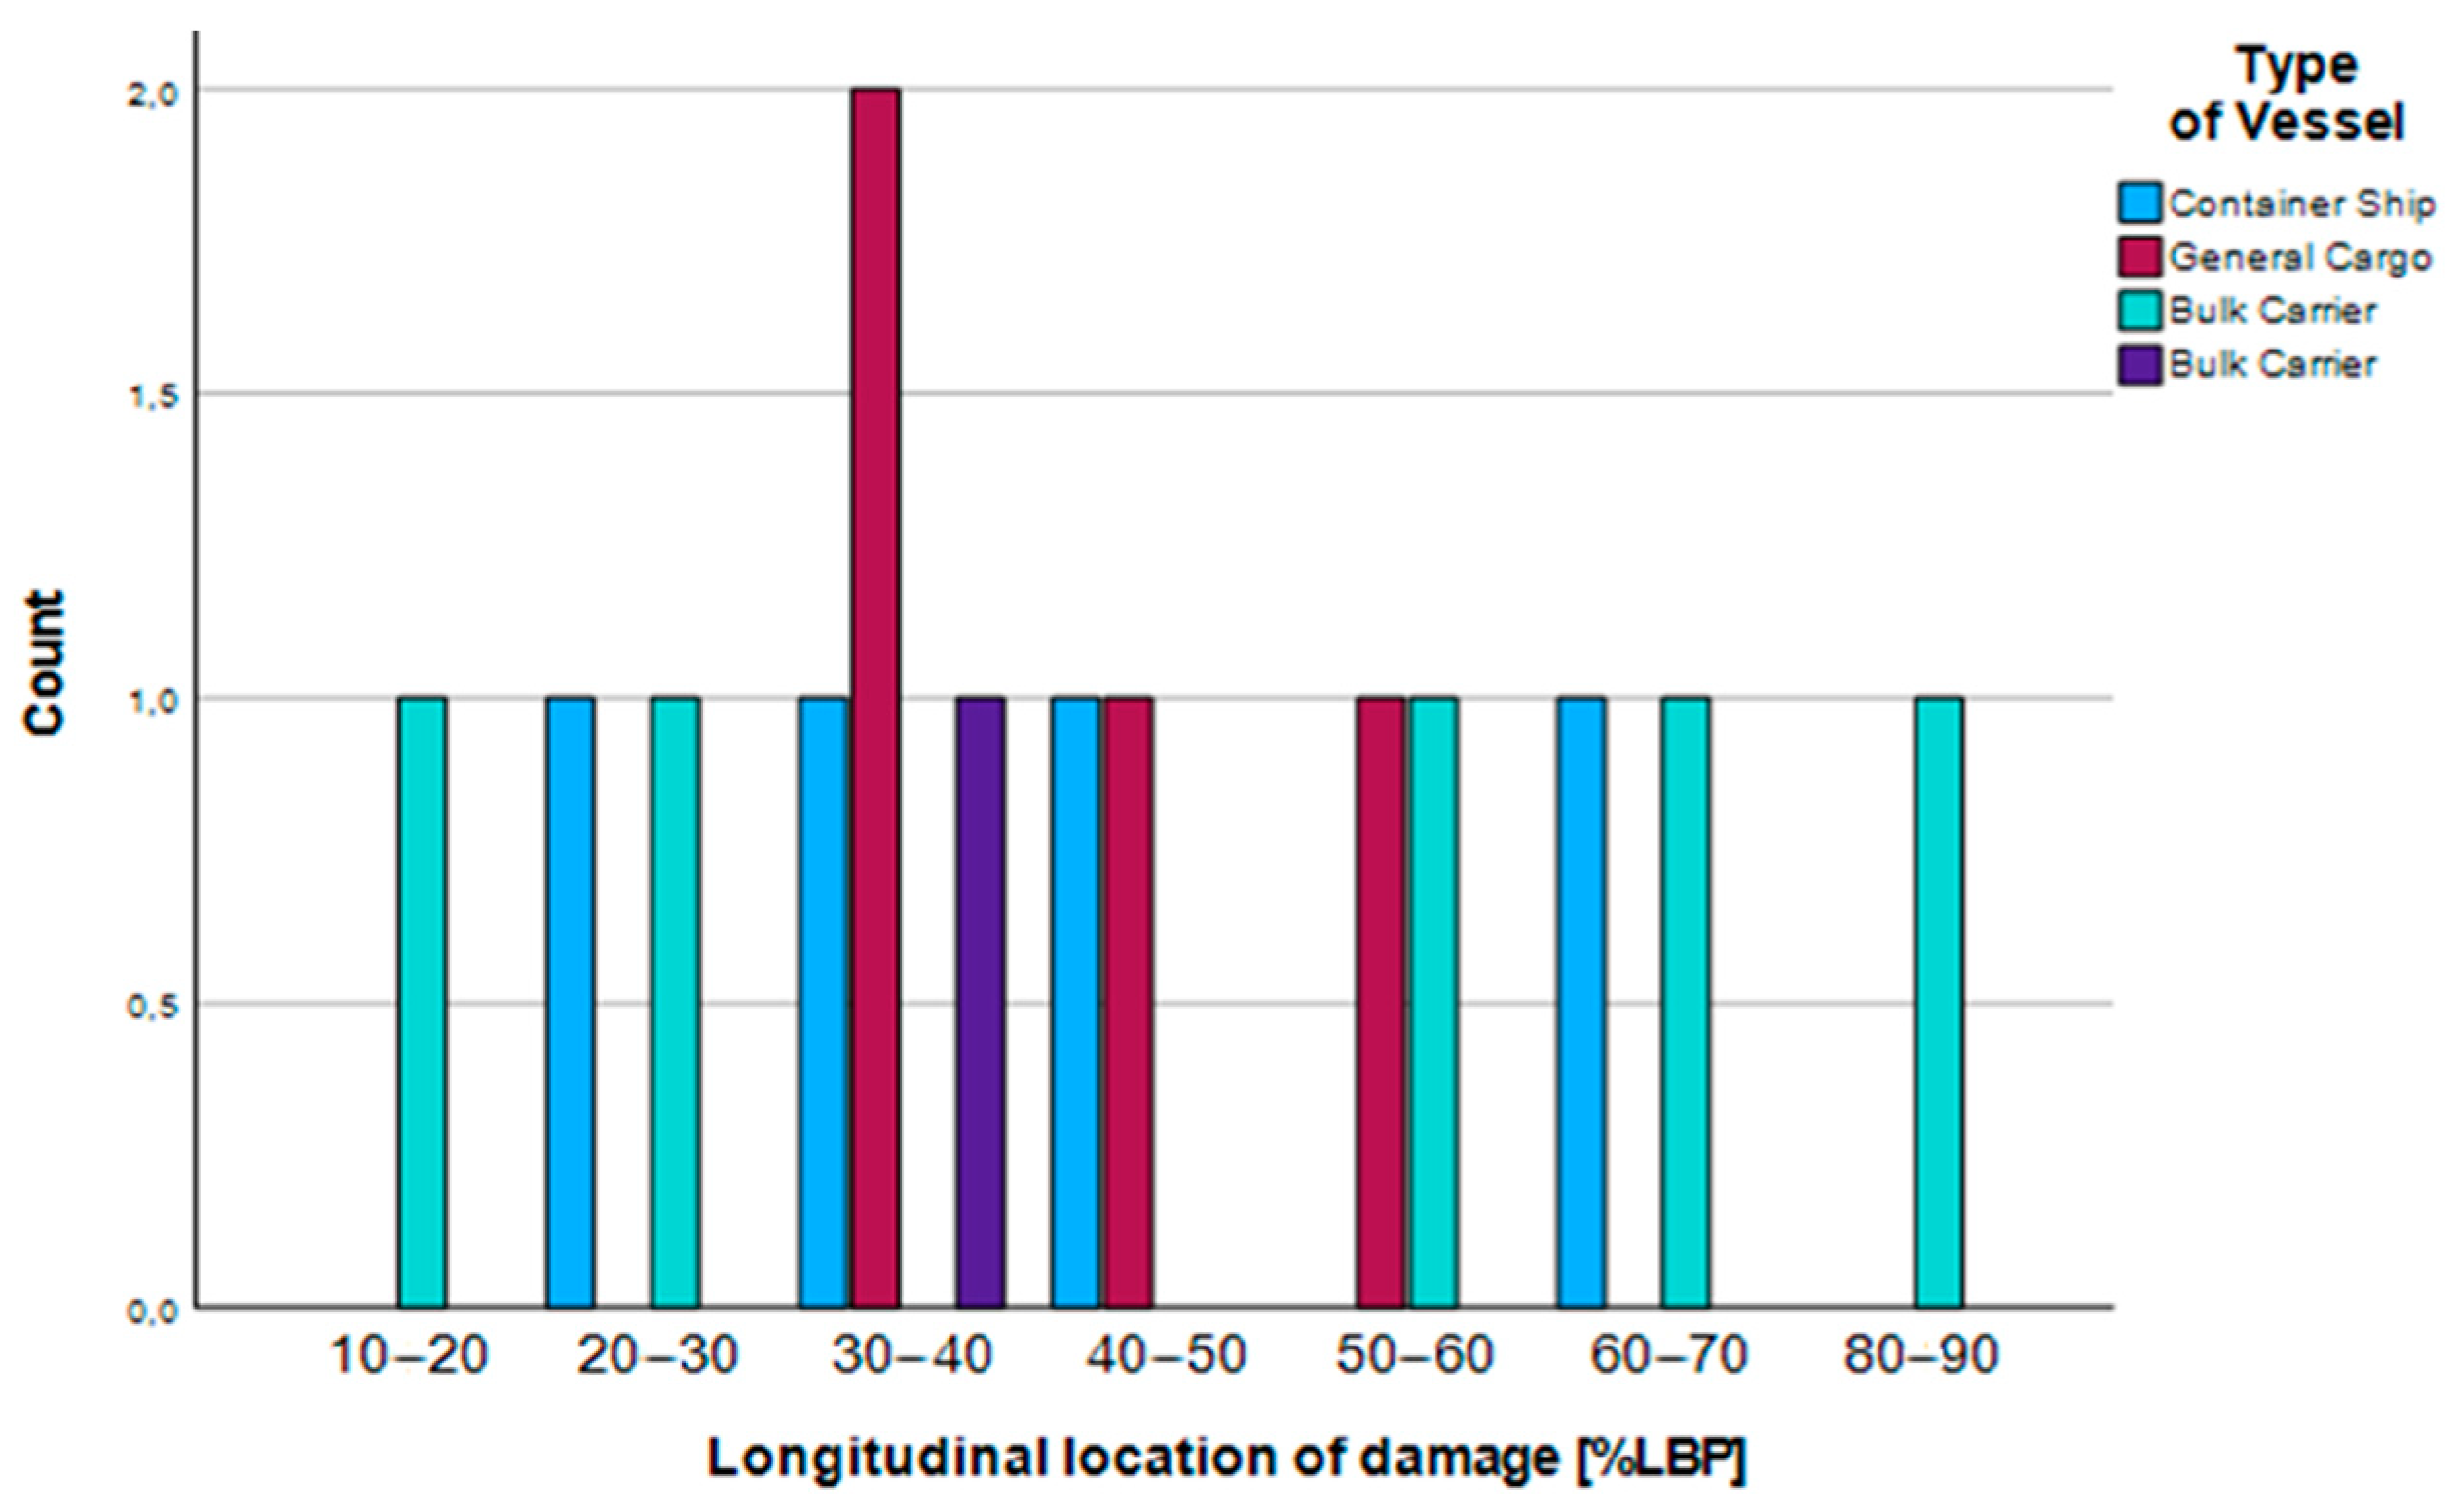
Figure 33 and Figure 34 demonstrate that general cargo is the most common type of ship for longitudinal damage locations in the 30–40% LBP range, while for vertical damage locations between above/below waterline and near the bottom, most ships are bulk carriers.
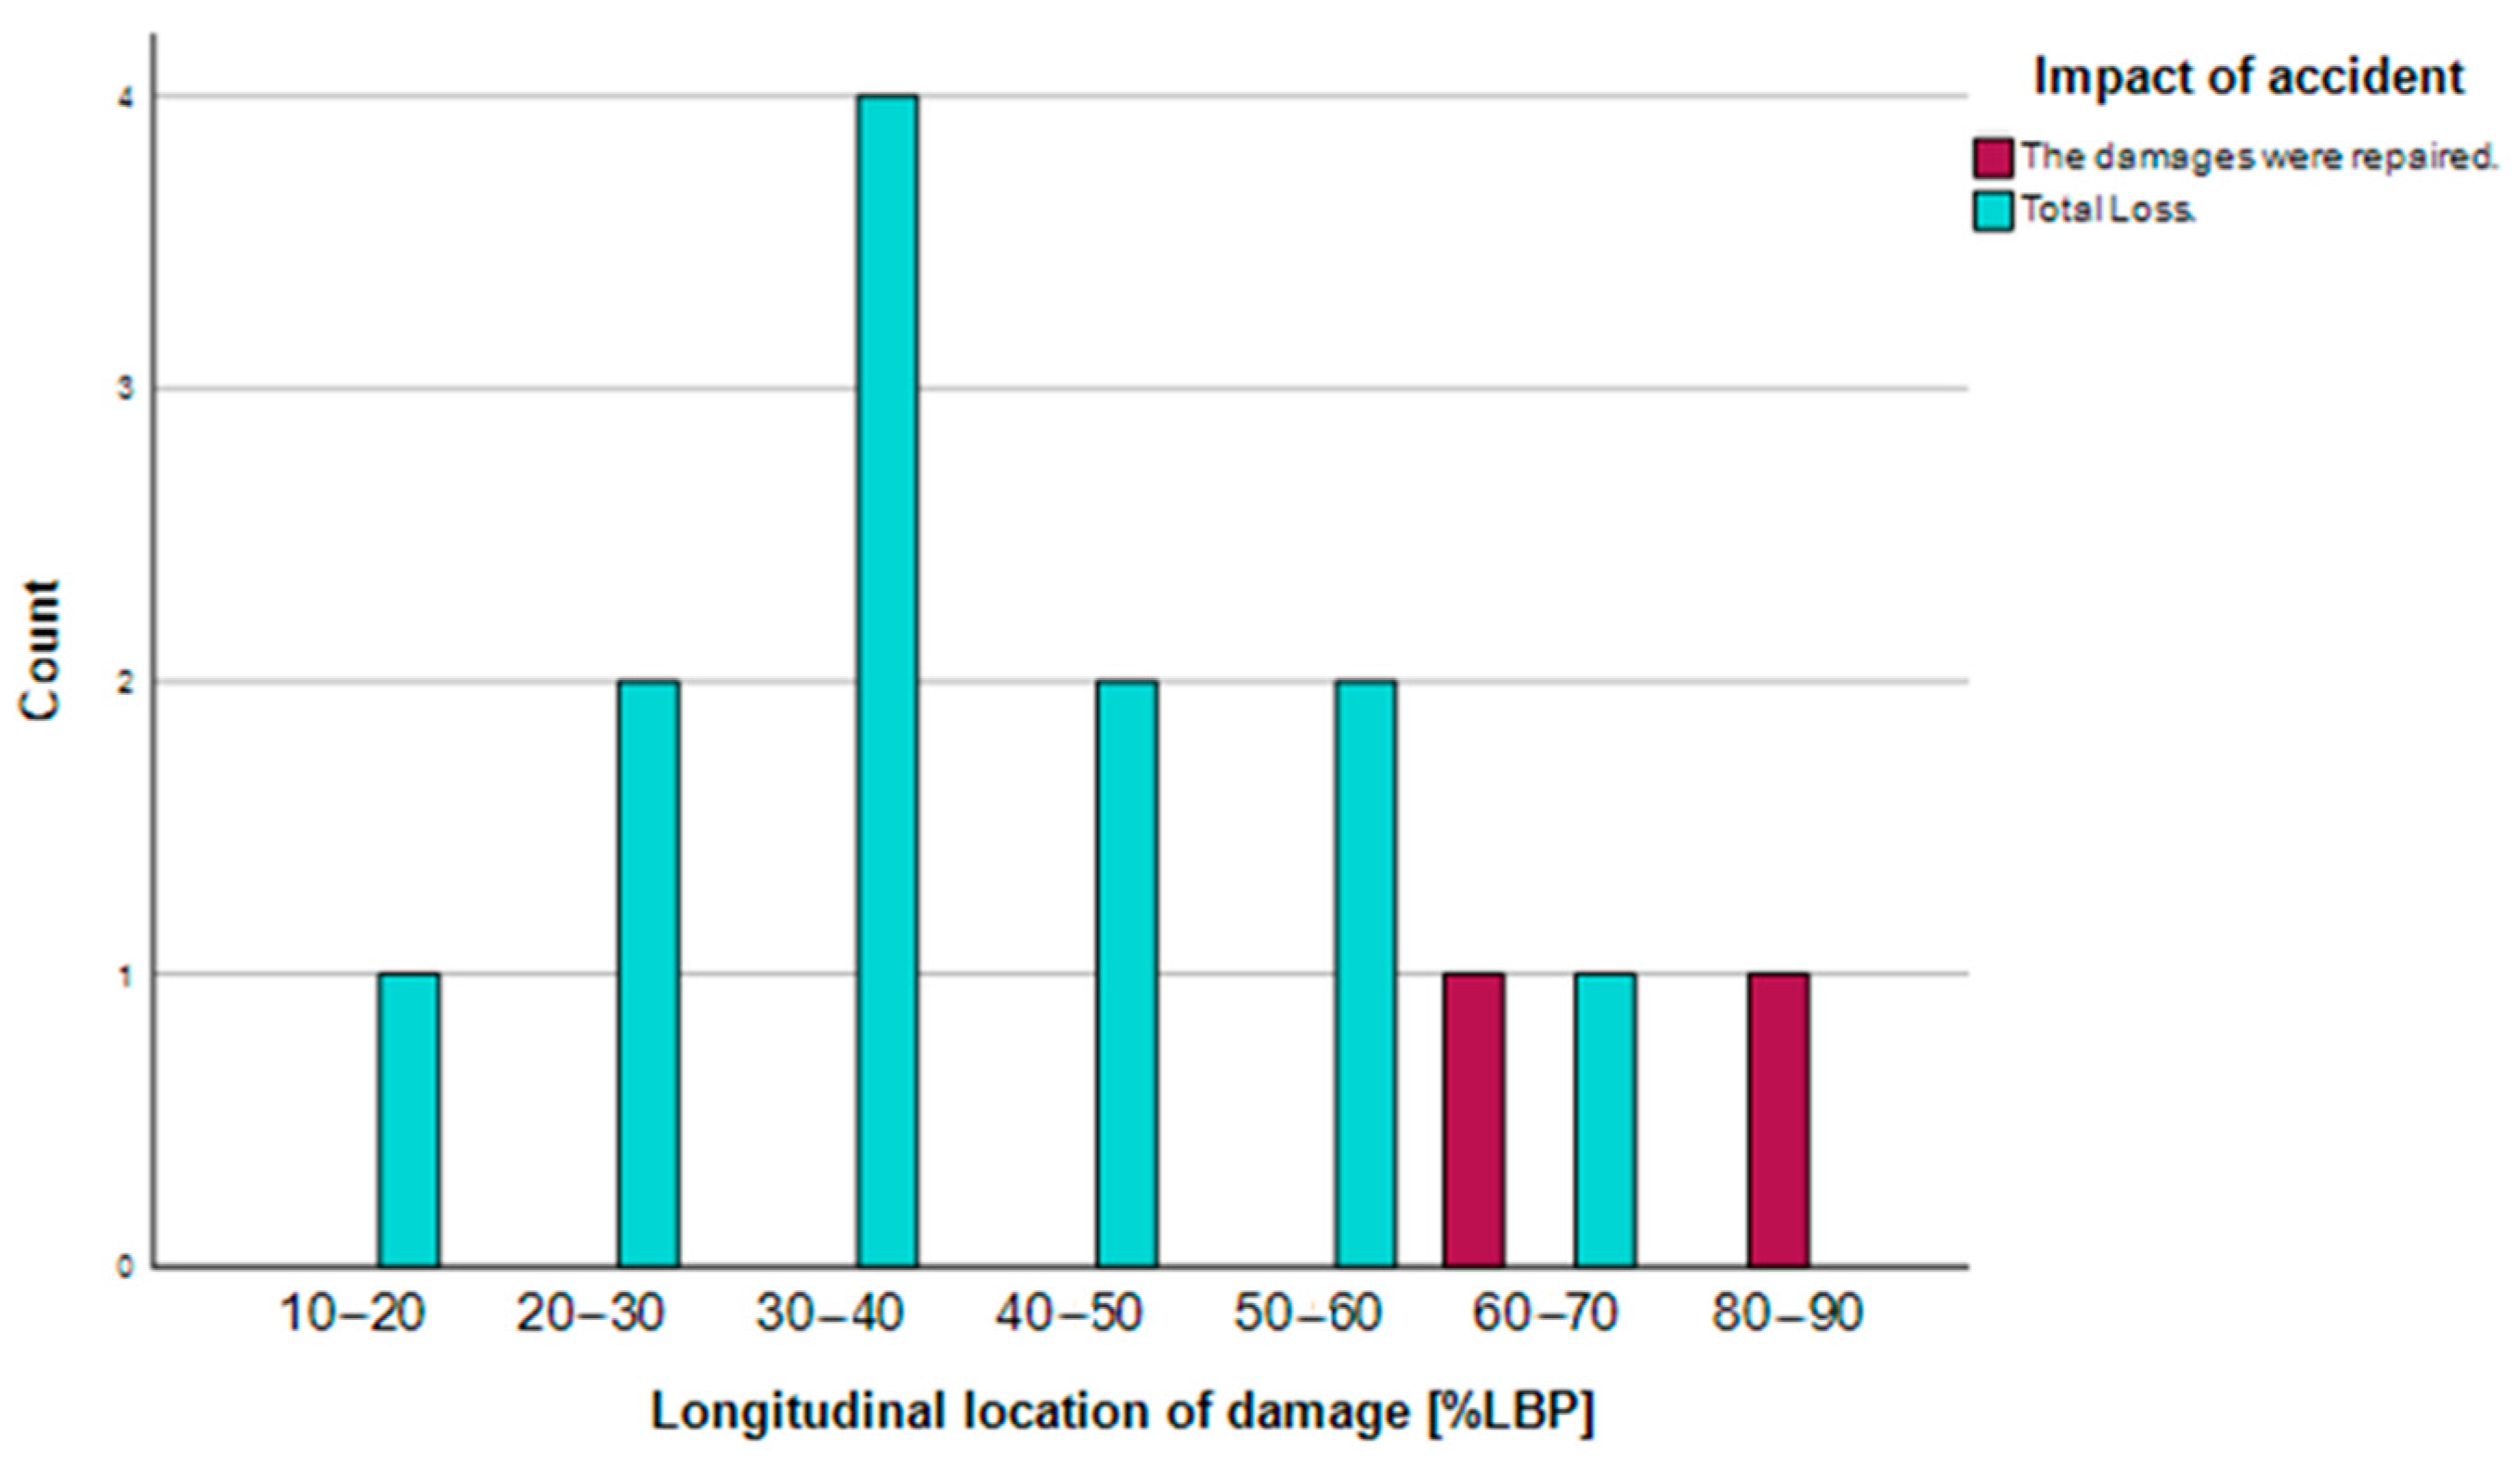
Figure 35 and Figure 36 demonstrate the impact of accidents with respect to damage lo-cations. We can see that, for longitudinal damage positions 60–70% and 80–90% LBP range, the damage was repaired. The positions with the highest number of total losses is amidship and aft at longitudinal damage locations in the area of 30–40% LBP, followed by 20–30%, 40–50%, and 50–60% LBP. Ships with damage in the area above deck/above the waterline have a higher total loss rate, while those near the bottom and below the waterline/near the bottom had the resulting damage repaired.
As we can observe from Figure 37 and Figure 38, serious marine casualties mainly occurred in the 60–70% LBP range; very serious casualties were mostly found at 30–40% LBP, followed by 20–30% LBP, and 40–60% LBP occurring equally. With respect to the vertical locations, very serious casualties were most prevalent in the above deck/above waterline areas, followed by below waterline/near bottom and the above waterline/below waterline/near bottom areas. Additionally, serious casualties were evenly distributed among the above waterline, below waterline/near bottom, near bottom, and above waterline/below waterline/near bottom areas.
Similarly to the previous two types of accidents, in the case of hull failure, from the correlation analysis results presented above (Figure 31, Figure 32, Figure 33, Figure 34, Figure 35, Figure 36, Figure 37 and Figure 38) concerning the location and extent of the damage, the impact of the accident, and the type of casualty, we can identify and summarize the most dominant key factors, as follows:
-
Longitudinal extent of damage: 0.5 m–1.0 m; ship type: container ship and longitudinal extent of damage: 1 m–1.5 m; ship type: general cargo and bulk carrier;
-
Vertical extent of damage: 4 m–5 m; ship type: general cargo and vertical extent of damage: 5 m–6 m; ship type: container ship;
-
Vertical damage location: above WL/below WL/near bottom; ship type: bulk carrier;
-
Longitudinal damage location: 30 m–40 m; ship type: general cargo;
-
Impact of accident: total loss; longitudinal location: 30–40% LBP;
-
Type of casualty: very serious marine casualty; longitudinal location of damage: 30–40% LBP;
-
Impact of accident: total loss; vertical location: above deck/above WL;
-
Type of casualty: very serious marine casualty; vertical location: above deck/ above WL.
Figure 39 depicts that similar damage lengths occur for collision and grounding accident types, with the most common being 2–2.5 m, followed by 3–4 m, and 10–15 m. In the case of structural failure, the most common damage length is 1–1.5 m, followed by 0.5–1.0 m, and 0–0.5 m.

4.2.4. Chi-Square Tests

The statistical analysis case study in this work included correlations between various factors, as listed in Table 3. Consequently, we conducted a chi-square test (employing IBM-SPSS software) to analyze the correlation between these two groups of factors. A total of twenty three (23) correlations with ship types, two (2) correlations with the effect of age in the accident, two (2) with the effect of the location of the ship damage (longitudinal or vertical), and one (1) with flag risk were analyzed.
In general, the chi-square test is a test of significance to determine whether the association between two qualitative variables is statistically significant [46]. The null hypothesis proposes that there is no significant association between the two values. Briefly, there is enough evidence to reject the null hypothesis when the p-value for the chi-square statistic is smaller than 0.05. When the data set is small, the tables are sparse or unbalanced, the data are not normally distributed, or the data do not meet any of the underlying assumptions required for reliable results using the standard asymptotic method, exact and Monte Carlo methods, provide powerful means for obtaining accurate results [40].
In the following Table 9 and Table 10, the corresponding chi-square and Monte Carlo results with a p < 0.05 are shown, indicating an interaction between the analyzed two factors for the cases of collision and grounding. It is important to note that smaller chi-square test values signify less variation among the specific factors. In the case that the observed significance exceeds 0.05, it can be safely concluded that the results of the corresponding factors are independent, indicating no significant interaction between them. The specific results are not reported in Table 9 and Table 10; this is applicable to the hull failure category for all the combinations of factors.
We should note that, for crosstabs with dimensions larger than 2 × 2, a minimum expected count of one is permissible, as long as no more than about 20% of the cells have expected frequencies below five [47]. In the present study, the results of the chi-square tests between the two factors, which are presented in Table 9 and Table 10, indicate that more than 20% of the expected frequencies are less than five. Consequently, Monte Carlo tests should be used to analyze the specific correlations.

5. Discussion

According to the results from the conducted analyses of frequency and correlation, presented in the previous sections, the main conclusions that can be drawn are analyzed in the following sections.
Longitudinal damage location.
The results of the statistical analysis presented in Table 8 and illustrated in the relevant diagrams in Section 4, reveal that collisions and grounding accidents cause damage predominantly in the bow area, whereas structural failure accidents mainly cause damage in the midship area. Notably, collision incidents also lead to a significant percentage of ships being damaged in the engine room, while grounding incidents can also result in damage to the engine room, aft of amidships, and aft section, including the transom (Figure 13a and Figure 14a). Moreover, structural failure can lead to damage in midship area and both the aft and forward sections of the amidships (as shown in Figure 15a).
Concerning collision incidents, the majority of ships damaged in the forward part (80–100% LBP) are bulk carriers and container ships, followed by the other types of vessels. Conversely, general cargo ships exhibit a higher prevalence in the aft part, including the half of the engine room (see Figure 19).
In the context of grounding accidents, most vessels damaged in the fore part (80–90% LBP) are primary general cargo ships, with all other types of ships following in frequency. Note that in the area surrounding the engine room and fore, general cargo ships and all other types are affected (Figure 27).
In incidents of structural failure, it is typical for general cargo ships to incur the most damage in the region of 30–40% LBP outside of the engine room (see Figure 33).
For total losses in all types of casualties, vessels were damaged in the midship and aft of the midship. Damages were repaired in the bow area (refer to Figure 21 and Figure 28) while, in the case of structural failure, this extends forward of the midship (refer to Figure 35).
The most common longitudinal extent of damage across all ship types is between 2.0–2.5 m for collision and grounding incidents, while for structural failure it is between 0.5–1.5 m (refer to Figure 7 and Figure 9).
Vertical damage location.
In conclusion, from the relevant statistical analysis (see Figure 13b and Figure 15b), it was observed that the majority of vessels were damaged in the area above the main deck and above the waterline in the cases of collision and structural failure casualties, while vertical damages were reported below the main deck and below the waterline/near the bottom for structural failure casualties. Furthermore, as can be seen in Figure 22, for collision casualties, the vertical damages in the total loss cases were identified in areas below the waterline and near the bottom, with repairs predominantly being carried out above the waterline. Furthermore, the vertical damages in structural failure casualties (refer to Figure 36) were identified mostly above the main deck and above the waterline, and repairs were conducted below waterline/near the bottom areas.
Transverse damage location.
Based on the statistical analysis (refer to Figure 14b), it can be considered that, for grounding accidents, the majority of vessels are damaged in the center line (C.L.) and 0–8% of the breadth (port and starboard) of the vessel. We should mention at this point that in general, accidents involving collision and grounding exhibit damages extending longitudinally, vertically or transversely by 2–2.5 m, covering an area size in the range of 10 m2 to 15 m2.
Cause analysis according to EMSA categorization.
According the analysis performed for the causes of marine accidents (in line with EMSA categorization), crew’s operational mistakes have the highest percentage of accident analyzed in general. This is followed by environmental condition, wrong maneuvering, contravention of rules, and navigational device failure (refer to Figure 6a–c). Moreover, 50% of cases concerning grounding and structural failure are attributed to the crew’s operational mistakes.
Accidents by vessel type, age, flag risk, and conditions during the accident.
Accidents categorized by vessel type reveal that general cargo and bulk carriers were the most common types of vessels involved, collectively contributing to over half of the total number of ships involved in all three categories of maritime accidents. However, it is important to note that the number of these types of ships (G.C. and B.C.) is significantly higher than that of other ship types. Following were container ships at 15.7% and tankers at 11.8%. The least common type of vessel involved in such accidents were LNG ships, which account for only 1.3% (see Figure 16). The predominant percentage for damage length is 2.0–2.5 m in collision and grounding accidents while, for structural failure accidents, it is 1.0–1.5 m (refer to Figure 39 and Table 8).
Furthermore, ships characterized as “Small” are mostly involved in case of grounding (79%) and collisions (70%), whereas ships with deadweight 60,000–100,000 T are primarily associated with structural failure (27%). Note that “Small” characterization for vessels corresponds to the type of vessel rather than the deadweight.
The percentage of general cargo and bulk carriers involved in grounding and structural failure is quite similar (each accounting for around 40%) while approximately 20% of both types are involved in collisions.
Ships of a “middle” age and with a “low” flag risk are generally the ones involved in accidents occurring under “good” conditions, with moderate to rough sea states and a gentle breeze. Visibility was generally good, except in the case of structural failure, which occurred in an area that was half dark and half light.
Interaction between the analyzed factors employing chi-square tests.
The chi-square tests analysis for accidents related to collision reveals statistically significant correlations between the following key factors: type and size of the vessel, vertical size of damage, longitudinal extent, visibility, and vessel age. Additionally, there is a correlation between the longitudinal location of damage and the subsequent repair carried out. Furthermore, the vertical location of damage shows a significant correlation with the type of casualty and the subsequent repair carried out.
The corresponding chi-square tests in the case of grounding accidents revealed statistically significant correlations between the following key factors: type of vessel with size of vessel, day/night period, and width of damage. Additionally, there is a correlation between these factors: type of casualty and longitudinal damage location, transverse damage location and impact of accident, and impact of accident and EMSA cause analysis.
Table 9 and Table 10 present the obtained results from the performed chi-square tests for collision and grounding incidents, respectively, between the key factors listed in Table 3. As a first observation, it is evident that, in both cases of accident types, a general conclusion is derived by correlating the type of ship with its size. This can easily be justified since each type of vessel involved in the accidents has been designed and constructed optimally for an intended use, with a specific carrying purpose that significantly affects its overall size.
With regard to collision accidents, a significant correlation is deduced between the ship type and the vertical and longitudinal locations of the damage. Therefore, there is a statistical significance in the correlation between the ship type and where the resulting damage is located after collision. As we observe from the obtained results, however, the specific correlation is deduced only for one of the two colliding ships (vessel A, as referred to in Table 9). This can be attributed to a common scenario in collision cases, where one ship typically rams the other with its bow, resulting in a high percentage of damage to the bow of that ship, independently of its type. As a result, the above correlation does not apply for both ships.
Similarly, according to the results illustrated in Table 9, a statistically significant correlation is observed between ship type and the visibility during the collision incidents. This result can be potentially explained by the distinct visibility conditions under which that different types of vessels operate; for instance, a passenger ship and a general cargo ship do not voyage under the same visibility conditions, nor are they subject to the same geographical restrictions. Note that, as in the previous case, the specific correlation is deduced only for the one of the two colliding ships; this could be attributed to the previously mentioned common collision scenario.
Furthermore, a correlation has been determined between ship type and age in all ships involved in collision accidents, something that does not seem to apply in the other two cases of accidents (grounding and hull failure). The statistical results in this study show that middle-aged ships (5–25 years old) account for 65% of the ships involved in a collision accident (refer to Table 8). This finding aligns with the corresponding one by P. Antao et al. [22], where 50% of the vessels involved in collisions were middle-aged ships, between 5 to 14 years old. According to N. P. Ventikos et al. [23], vessels that were involved in collision accidents were over 25 years old; however, it is essential to mention that the specific analysis was constrained geographically to certain Aegean Sea zones. The above suggest that older vessels may be at a higher risk for collision accidents.
Moreover, in collision accidents, there is a strong statistical correlation between the longitudinal location of the damage and the impact of the accident. Specifically, the ability of the ship to complete its voyage or to be towed for repairing correlates with the longitudinal location of the damage, as a result of the collision. This aligns with the findings illustrated in Figure 21 (correlation between impact of accident and longitudinal damage location due to collision accident), from which we can infer that repairs were carried out in the bow area, while midship collision areas (40–60% LBP) pose an increased risk for total loss.
Similarly, the vertical location of the resulting damage statistically correlates to the impact of the accident. As in the previous case, the ability of the ship to complete its voyage or to be towed for repairing correlates with the vertical location of the damage resulting from the collision. This finding aligns with the results illustrated in Figure 22 (correlation between impact of accident and vertical damage location due to collision accident), from which we can conclude that repairs were carried out in the areas above the waterline and above deck, while below the waterline and near the bottom areas pose an increased risk for total loss.
Furthermore, the vertical location of the resulting damage shows a statistical correlation with the type of the casualty; specifically, serious marine casualty, in collision accidents. That is, the vertical damage location also correlates with the severity of the incident. This finding aligns with the results illustrated in Figure 24 (correlation between type of casualty and vertical damage location due to collision accident) from which we can infer that damage located in the areas above the waterline and above deck resulted in a serious marine casualty. Damage in the areas between below the waterline and near the bottom poses an increase risk of leading to a very serious marine casualty.
With regard to grounding accidents, the deduced results reveal a correlation between the type of ships and the day/night period. This finding aligns with the results presented in Table 8, where the majority of grounding incidents occurred during the dark period, accounting for 67%. Notably, according to Xintong Liu [21], day or night conditions are a critical factor in marine casualties.
Moreover, in grounding incidents, we observe that the type of ship is correlated with the width of the damage. This observation aligns with Figure 26 (transverse extent of damage), where we notice a notably distinct pattern in the width of damage for general cargo vessels compared to the other types. Similarly, the transverse location of the resulting damage in grounding accidents is correlated with the impact of the accident, i.e., the ability of the ship to complete its voyage, be towed for repairs, or be considered a total loss.
Furthermore, the type of casualty correlates with the EMSA cause of grounding accidents, aligning with the results illustrated in Figure 6. In this Figure, crew’s operational mistakes emerge as the dominant cause of accidents, occurring at a frequency of about 50%. It is worth noting that, according to N.J. Ece [20], collision and grounding accidents are primarily caused by human error, and a statistical correlation between the type, the cause and the zone of the accident was deduced. Additionally, a similar analysis made by J. Deng et al. [25] concluded that the primary cause of maritime incidents can be attributed to human factors.
Limitations of the current study and implications of the findings for future research.
With regard to the main limitations of the present study, it is important to note that the current research did not consider ship accidents involving vessels that do not comply with SOLAS convection, i.e., vessels with relatively small tonnage, passenger ships without international voyages etc.
Additionally, despite identifying and collecting over a thousand maritime casualty reports from official marine accident investigation branches worldwide (as presented in the Appendix A), the sample size specifically for ships involved in accidents leading to structural failure (refer to Figure 2) can be considered relatively small. This could potentially introduce a significant statistical error to the corresponding results. Therefore, collecting a greater number of incidents in future work would enrich the sample size, minimizing this specific limitation.
Furthermore, we should note that in the reports analyzed for the considered incidents, there was no exact information on the geometry, size, or location of the resulting damage induced by the accident. Thus, the damage location and size was extracted from the available pictures or relevant information provided in the accident reports employing the methodology described in Section 3.5 of the manuscript.
In terms of the implications of the findings of the current study for future research, it is noteworthy that the derived results provide valuable information regarding the correlation between the main characteristics of a ship (type, age, etc.) involved in an incident of collision, grounding, or structural failure and the key characteristics of resulting damage, i.e., its location and extent. This contribution not only deepens our understanding of the causes of marine accidents and their impacts but also addresses in more detail the resulting consequences for vessel integrity. The specific findings have direct implications also for other research areas such as the development of a real-time hull strength monitoring system with optimal sensor topology tailored to the specific type of vessel.

6. Conclusions

In this study, we reviewed over a thousand maritime accidents reports spanning from 1990 to 2020. From this data set, a sample of 213 incidents regarding ship collision, grounding, or structural failure cases was obtained. Statistical analysis including correlation investigation among the main factors contributing to each incident was performed employing statistical software IBM SPSS© Statistics [9]. Furthermore, we deduced the location and the extent of damage for each ship involved in the particular accidents.
The novelty of our work lies in deducing both the size and location of damage for each vessel involved in collisions, groundings, or hull failures. Additionally, the correlation between key characteristics of the involved vessels (such as type and age) and the resulting ship damage was analyzed. The specific contribution regarding the arising damage not only deepens our understanding of the causes of marine accidents and their impacts but also provides valuable insights into the resulting consequences on vessel integrity, since determining the location and extent of the damage is crucial in estimating its potential impact on the viability of the ship, crew, and cargo. It is the authors’ belief that the specific information is not typically subjected to statistical analysis in the existing literature.
Furthermore, our findings have direct implications for other research areas. As an example, they could substantially contribute to advancing the development of a real-time hull strength monitoring system with optimal sensor topology which will be customized for the specific type of vessel; that is, the areas more likely to be affected in a collision, grounding or hull failure incident would be prioritized (i.e., more dense sensor grid) enhancing the system’s efficiency on monitoring the vessel’s structural integrity. Moreover, the derived results can be utilized to statistically identify specific areas more affected in these three types of accident, contributing to the ongoing improvement of ship hulls and the overall safety of vessels.
With respect to the main findings deduced, the statistical analysis results align with the existing literature, highlighting that human error (crew’s operational mistakes) is the leading cause of damage in maritime accidents in general. Additionally, a major contribution to the cause of ship collisions is rule contravention, while navigational device failure is a prominent factor in ship groundings. Furthermore, environmental conditions were responsible for a quarter of structural failure accidents, while general cargo and bulk carriers ship types were involved in the highest percentage of accidents across all three incident categories analyzed.
With regard to total loss resulting from collision incidents, damage positions with the highest rate are amidship, below waterline, and near bottom, while very serious marine casualties are more often in cases of damages in the fore part of the ship and amidship areas, for all ship types.
Similarly, in grounding incidents, very serious marine casualties were more common when the ship damage was at the aft part or approximately at the full breadth of the ship (on the starboard side) while, in the case of structural failure accidents, very serious marine casualties were more frequent when the resulting damage was in the aft amidship, above waterline, and above deck areas.
In general, ships characterized as “Small” are mostly involved in cases of grounding and collision. Additionally, “middle” age and “low” flag risk vessels are generally the ones involved in accidents that occur under “good” environmental conditions, with moderate to rough sea states and a gentle breeze. Lastly, visibility was considered “good” in the majority of the incidents analyzed.
With regard to the obtained results from the performed chi-square tests between the key factors analyzed (refer to Table 3) for both collision and grounding incidents, it is evident that the type of ship is statistically correlated with its size. Regarding collision incidents, the ship type is correlated to the vertical and longitudinal location of the resulting damage, visibility, and age of all ships involved. Additionally, a strong statistical correlation is identified between the longitudinal location of the resulting damage and the impact of the accident. Similarly, the vertical location of the damage is correlated with the impact of the accident as well, while a correlation is also deduced between the type of casualty and ship type.
In the case of grounding incidents, from the performed chi-square tests, statistically significant correlations emerge between the type of ships involved, the day/night period and the width of the resulting damage. Moreover, a statistically significant correlation is identified between the type of casualty and EMSA cause analysis, which is primarily attributed to human error (crew’s operational mistakes emerge as the dominant cause of grounding accidents, occurring at a frequency of about 50%).

Author Contributions

Conceptualization, A.N.P. and D.-N.P.; Methodology, A.N.P., D.-N.P., S.P., M.S. and G.K.; Investigation, A.N.P., M.S. and D.-N.P.; Validation, A.N.P., D.-N.P., M.S., S.P. and G.K.; Resources, A.N.P., D.-N.P., S.P., M.S. and G.K.; Data curation, A.N.P. and M.S.; Writing—original draft preparation, A.N.P., D.-N.P., S.P., M.S. and G.K.; Writing—review and editing, D.-N.P., A.N.P., S.P., M.S. and G.K.; Visualization, A.N.P. and M.S.; Supervision, D.-N.P. All authors have read and agreed to the published version of the manuscript.

Funding

This research received no external funding.

Institutional Review Board Statement

Not applicable.

Informed Consent Statement

Not applicable.

Data Availability Statement

The data presented in this study are available on request from the corresponding author.

Acknowledgments

The authors would like to thank Dimitris Liontis (UNIWA), for his valuable support in sample data extraction from various organizations.

Conflicts of Interest

The authors declare no conflict of interest.

Appendix A

The organizations from which the data sample was extracted for the purposes of the investigation:
-
Marine Accident Investigation Branch reports—GOV.UK https://www.gov.uk/maib-reports (accessed on 7 November 2022).
-
Marine Investigation Report—NTSB (National Transportation Safety Board)—USA.gov.
-
-
Marine Accidents and Incidents Investigation Committee Cyprus (MAIC) http://www.maic.gov.cy/mcw/dms/maic/maic.nsf/page03_en/page03_en?OpenDocument&Start=1&Count=1000&Expand=1 (accessed on 21 November 2022).
-
Marine safety investigation—Ministry of Transport and Communications—REPUBLIC OF BULGARIA
-
-
Danish Maritime Accident Investigation Board (DMAIB)
-
https://dmaib.com/ (accessed on 1 December 2022).
-
Danish Maritime Authority https://dma.dk/ (accessed on 5 December 2022).
-
Reports published—Bureau d’enquêtes sur les événements de mer (BEA MER)—FRANCE
-
-
Federal Bureau of Maritime Casualty Investigation (BSU)—German Maritime Casualty Investigation
-
-
Investigation Reports—Hellenic Bureau for Marine Casualties Investigation (HBMCI) https://www.hbmci.gov.gr/indexEng.htm (accessed on 19 December 2022).
-
Marine Casualty Investigation Board (MCIB)—Ireland https://www.mcib.ie/ (accessed on 22 December 2022).
-
Marine Investigation Reports—Transport Accident and Incident Investigation Bureau—Republic of Latvia
-
-
Marine Safety Investigation Unit (MSIU)—Merchant Shipping (Accident and Incident Safety Investigation) MALTA
-
-
Dutch Safety Board.
-
-
State Marine Accident Investigation Commission (SMAIC)—POLAND https://pkbwm.gov.pl/en/home/ (accessed on 2 January 2023).
-
Civil Maritime Transport—Swedish Accident Investigation Authority (SHK) https://www.havkom.se/en/om-shk/civil-sjoefart (accessed on 5 January 2023).
-

References

  1. IMO Publication. Casualty Investigation Code (Code of the International Standards and Recommended Practices for a Safety Investigation into a Marine Casualty or Marine Incident), 2008 ed.; IMO Publication: London, UK, 2008. [Google Scholar]
  2. EMSA European Maritime Safety Agency. Available online: https://www.emsa.europa.eu/ (accessed on 15 November 2022).
  3. IMO Casualty Analysis Procedure (Document FSI 17/WP.1, Annex 2). Available online: https://wwwcdn.imo.org/localresources/en/OurWork/MSAS/Documents/CASUALTY%20ANALYSIS%20PROCEDURE.pdf (accessed on 15 November 2022).
  4. Kristiansen, S.; Koster, E.; Schmidt, W.F.; Olofsson, M.; Guedes Soares, C.; Caridis, P. A New Methodology for Marine Casualty Analysis Accounting for Human and Organisational Factors. In Proceedings Conference on Learning from Marine Incidents; Paper No.14; Royal Institution of Naval Architects: London, UK, 1999; pp. 1–14. [Google Scholar]
  5. Graziano, A.; Teixeira, A.P.; Soares, G.C. Classification of human errors in grounding and collision accidents using the TRACEr taxonomy. Saf. Sci. 2016, 86, 245–257. [Google Scholar] [CrossRef]
  6. IACS International Association of Classification Societies. Available online: https://iacs.org.uk/membership/iacs-members (accessed on 27 December 2023).
  7. ABS. Guidance Notes on the Investigation of Marine Incidents; Updated 1 February 2014; American Bureau of Shipping: Houston, TX, USA, 2005. [Google Scholar]
  8. EMSA Annual Overview of Marine Casualties and Incidents 2022. Available online: https://emsa.europa.eu/csn-menu/items.html?cid=14&id=4867 (accessed on 30 December 2023).
  9. IBM SPSS Statistics. Available online: https://www.ibm.com/products/spss-statistics?lnk=ushpv18ct7 (accessed on 15 November 2022).
  10. Eliopoulou, E.; Papanikolaou, A.; Voulgarellis, M. Statistical analysis of ship accidents and review of safety level. Saf. Sci. 2016, 85, 282–292. [Google Scholar] [CrossRef]
  11. Soares, G.C.; Teixeira, A.P. Risk assessment in maritime transportation. Reliab. Eng. Syst. Saf. 2001, 74, 299–309. [Google Scholar] [CrossRef]
  12. Wu, B.; Yip, T.L.; Yan, X.; Soares, G.C. Review of techniques and challenges of human and organizational factors analysis in maritime transportation. Reliab. Eng. Syst. Saf. 2022, 219, 108249. [Google Scholar] [CrossRef]
  13. Kim, S.J.; Taimuri, G.; Kujala, P.; Conti, F.; Sourne, H.S.; Pineau, J.F.; Looten, T.; Bae, H.; Mujeeb-Ahmed, M.P.; Vassalos, D.; et al. Comparison of numerical approaches for structural response analysis of passenger ships in collisions and groundings. Mar. Struct. 2022, 81, 10325. [Google Scholar] [CrossRef]
  14. Taimuri, G.; Ruponen, P.; Yan, X.; Hirdaris, S. A novel method for the probabilistic assessment of ship grounding damages and their impact on damage stability. Struct. Saf. 2023, 100, 102281. [Google Scholar] [CrossRef]
  15. Hasanspahic, N.; Vujicic, S.; Francic, V.; Campara, L. The Role of the Human Factor in Marine Accidents. J. Mar. Sci. Eng. 2021, 9, 261. [Google Scholar] [CrossRef]
  16. Youssef, E.A.; El-Sayed, S.F.; Abdelkader, S. Maritime Accidents Analysis Using Maritime Human Factors and Analysis Model. Marit. Res. Technol. 2023, 2, 44–60. [Google Scholar] [CrossRef]
  17. Olgaç, T.; Bayazit, O. An investigation of the maritime accident in the Aegean Sea Turkish search and rescue region. Aquat. Res. 2023, 6, 83–96. [Google Scholar] [CrossRef]
  18. Wang, H.; Liu, Z.; Wang, X.; Graham, T.; Wang, J. An analysis of factors affecting the severity of marine accidents. Reliab. Eng. Syst. Saf. 2021, 210, 107513. [Google Scholar] [CrossRef]
  19. Lan, H.; Ma, X.; Ma, L.; Qiao, W. Pattern investigation of total loss maritime accidents based on association rule mining. Reliab. Eng. Syst. Saf. 2023, 229, 108893. [Google Scholar] [CrossRef]
  20. Ece, N.J. Analysis of Ship Accidents in the Strait of Istanbul. DSpace Repository. 2012. Available online: http://hdl.handle.net/20.500.12397/855 (accessed on 13 November 2023).
  21. Liu, X.; Yu, Q.; Hu, Y.; Lu, W.; Zhanga, A.; Bo, X. Cause Analysis of Ship Accidents Based on Chi-Square Test. In Proceedings of the 2nd International Conference on Big Data Economy and Digital Management, BDEDM 2023, Changsha, China, 6–8 January 2023. [Google Scholar] [CrossRef]
  22. Antao, P.; Su, S.; Teixeira, A.P.; Soares, C.G. Quantitative assessment of ship collision risk influencing factors from worldwide accident and fleet data. Reliab. Eng. Syst. Saf. 2023, 234, 109166. [Google Scholar] [CrossRef]
  23. Ventikos, N.P.; Stavrou, D.I.; Andritsopoulos, A. Studying the marine accidents of the Aegean Sea: Critical review, analysis and results. J. Mar. Eng. Technol. 2017, 16, 103–113. [Google Scholar] [CrossRef]
  24. International Chamber of Shipping. Shipping Industry Flag State Performance Table 2022/2023. Available online: https://www.ics-shipping.org/wp-content/uploads/2023/01/Shipping-Industry-Flag-State-Performance-Table-2022-2023.pdf (accessed on 1 November 2023).
  25. Deng, J.; Liu, S.; Xie, C.; Liu, K. Risk Coupling Characteristics of Maritime Accidents in Chinese Inland and Coastal Waters Based on N-K Model. J. Mar. Sci. Eng. 2022, 10, 4. [Google Scholar] [CrossRef]
  26. Zhou, X.; Ruan, X.; Wang, H.; Zhou, G. Exploring spatial patterns and environmental risk factors for global maritime accidents: A 20-year analysis. Ocean. Eng. 2023, 286, 115628. [Google Scholar] [CrossRef]
  27. Primorac, B.B.; Parunov, J.; Soares, C.G. Structural Reliability Analysis of Ship Hulls Accounting for Collision or Grounding Damage. J. Mar. Sci. Appl. 2020, 19, 717–733. [Google Scholar] [CrossRef]
  28. Özkan, U.; Umut, Y.; Ersan, B. Analysis of Grounding Accidents Caused by Human Error. J. Mar. Sci. Technol. 2015, 23, 19. [Google Scholar] [CrossRef]
  29. Zhang, Y.; Zhai, Y.; Chen, J.; Xu, Q.; Fu, S.; Wang, H. Factors Contributing to Fatality and Injury Outcomes of Maritime Accidents: A Comparative Study of Two Accident-Prone Areas. J. Mar. Sci. Technol. 2022, 10, 1945. [Google Scholar] [CrossRef]
  30. Eliopoulou, E.; Alissafaki, A.; Papanikolaou, A. Statistical Analysis of Accidents and Review of Safety Level of Passenger Ships. J. Mar. Sci. Eng. 2023, 11, 410. [Google Scholar] [CrossRef]
  31. Dominguez-Péry, C.; Tassabehji, R.; Corset, F.; Chreim, Z. A holistic view of maritime navigation accidents and risk indicators: Examining IMO reports from 2011 to 2021. J. Shipp. Trade 2023, 8, 11. [Google Scholar] [CrossRef]
  32. Kasyk, L.; ElizaWolnowska, A.; Pleskacz, K.; Kapuscinski, T. The Analysis of Social and Situational Systems as Components of Human Errors Resulting in Navigational Accidents. Appl. Sci. 2023, 13, 6780. [Google Scholar] [CrossRef]
  33. Yan, K.; Wang, Y.; Jia, L.; Wang, W.; Liu, S.; Geng, Y. A content-aware corpus-based model for analysis of marine accidents. Accid. Anal. Prev. 2023, 184, 106991. [Google Scholar] [CrossRef] [PubMed]
  34. Kim, S.-H.; Ryu, K.-J.; Lee, S.-H.; Lee, K.-H.; Kim, S.-H.; Lee, Y.-W. Analysis of Frequent Marine Accidents in Commercial Fishing Vessels: Focus on Fatal Accidents in Trap Boats and the Development of Preventive Guidelines. Preprints (www.preprints.org). 11 July 2023. Available online: https://www.preprints.org/manuscript/202307.0641/v1 (accessed on 4 December 2023).
  35. Demirci, S.M.E.; Elçiçek, H. Scientific awareness of marine accidents in Europe: A bibliometric and correspondence analysis. Accid. Anal. Prev. 2023, 190, 107166. [Google Scholar] [CrossRef] [PubMed]
  36. Cao, Y.; Wang, X.; Wang, Y.; Fan, S.; Wang, H.; Yang, Z.; Liu, Z.; Wang, J.; Shi, R. Analysis of factors affecting the severity of marine accidents using a data-driven Bayesian network. Ocean. Eng. 2023, 269, 113563. [Google Scholar] [CrossRef]
  37. Akhtar, M.J.; Utne, I.B. Human fatigue’s effect on the risk of maritime groundings—A Bayesian Network modeling approach. Saf. Sci. 2014, 62, 427–440. [Google Scholar] [CrossRef]
  38. Liao, S.; Weng, J.; Zhang, Z.; Li, Z.; Li, F. Probabilistic Modeling of Maritime Accident Scenarios Leveraging Bayesian Network Techniques. J. Mar. Sci. Eng. 2023, 11, 1513. [Google Scholar] [CrossRef]
  39. Kapoor, P.; Kapoor, Y.; Siddique, A. Towards a Harmonized Approach: Understanding Data Sources for Marine Incident and Accident Analysis. IIRE J. Marit. Res. Dev. 2023, 7. Available online: https://ojsiire.com/index.php/IJMRD/article/view/235 (accessed on 18 December 2023).
  40. Mehta, C.R.; Patel, N.R. IBM SPSS Exact Tests. Available online: https://www.ibm.com/docs/en/SSLVMB_27.0.0/pdf/en/IBM_SPSS_Exact_Tests.pdf (accessed on 5 November 2023).
  41. U.S. Energy Information Administration. Oil Tanker Sizes Range from General Purpose to Ultra-Large Crude Carriers on AFRA Scale. Available online: https://www.eia.gov/todayinenergy/detail.php?id=17991 (accessed on 15 November 2022).
  42. Paris MoU on Port State Control Inspection. Available online: https://www.parismou.org/ (accessed on 15 November 2022).
  43. Beaufort Wind Scale. Available online: https://www.researchgate.net/publication/306316637_Beaufort_Wind_Scale (accessed on 2 February 2022).
  44. Douglas Sea Scale (Adapted from World Meteorological Organization). Available online: https://www.researchgate.net/figure/3-Douglas-Sea-Scale-adapted-from-World-Meteorological-Organization_tbl1_289828752 (accessed on 15 November 2022).
  45. IMO. Casualty-Related Matters Reports on Marine Casualties and Incidents. Visibility (Table 9). MSC-MEPC.3/Circ.4/Rev.1. 18 November 2014. Available online: https://wwwcdn.imo.org/localresources/en/OurWork/MSAS/Documents/MSC-MEPC3/MSC-MEPC.3-Circ.4%20Rev%201%20%20Revised%20harmonized%20reporting%20procedures%20-%20Reports%20required%20under%20SOLAS%20regulations%20I21.pdf (accessed on 21 August 2023).
  46. Mindrila, D.; Balentyne, P. The Chi Square Test. In The Basic Practice of Statistics, 6th ed.; W. H. Freeman and Company: New York, NY, USA, 2013; Chapter 23; Available online: https://www.westga.edu/academics/research/vrc/assets/docs/ChiSquareTest_LectureNotes.pdf (accessed on 25 August 2023).
  47. Cochran, W.G. Some methods for strengthening the common χ2 tests. Biometrics 1954, 10, 417–451. [Google Scholar] [CrossRef]
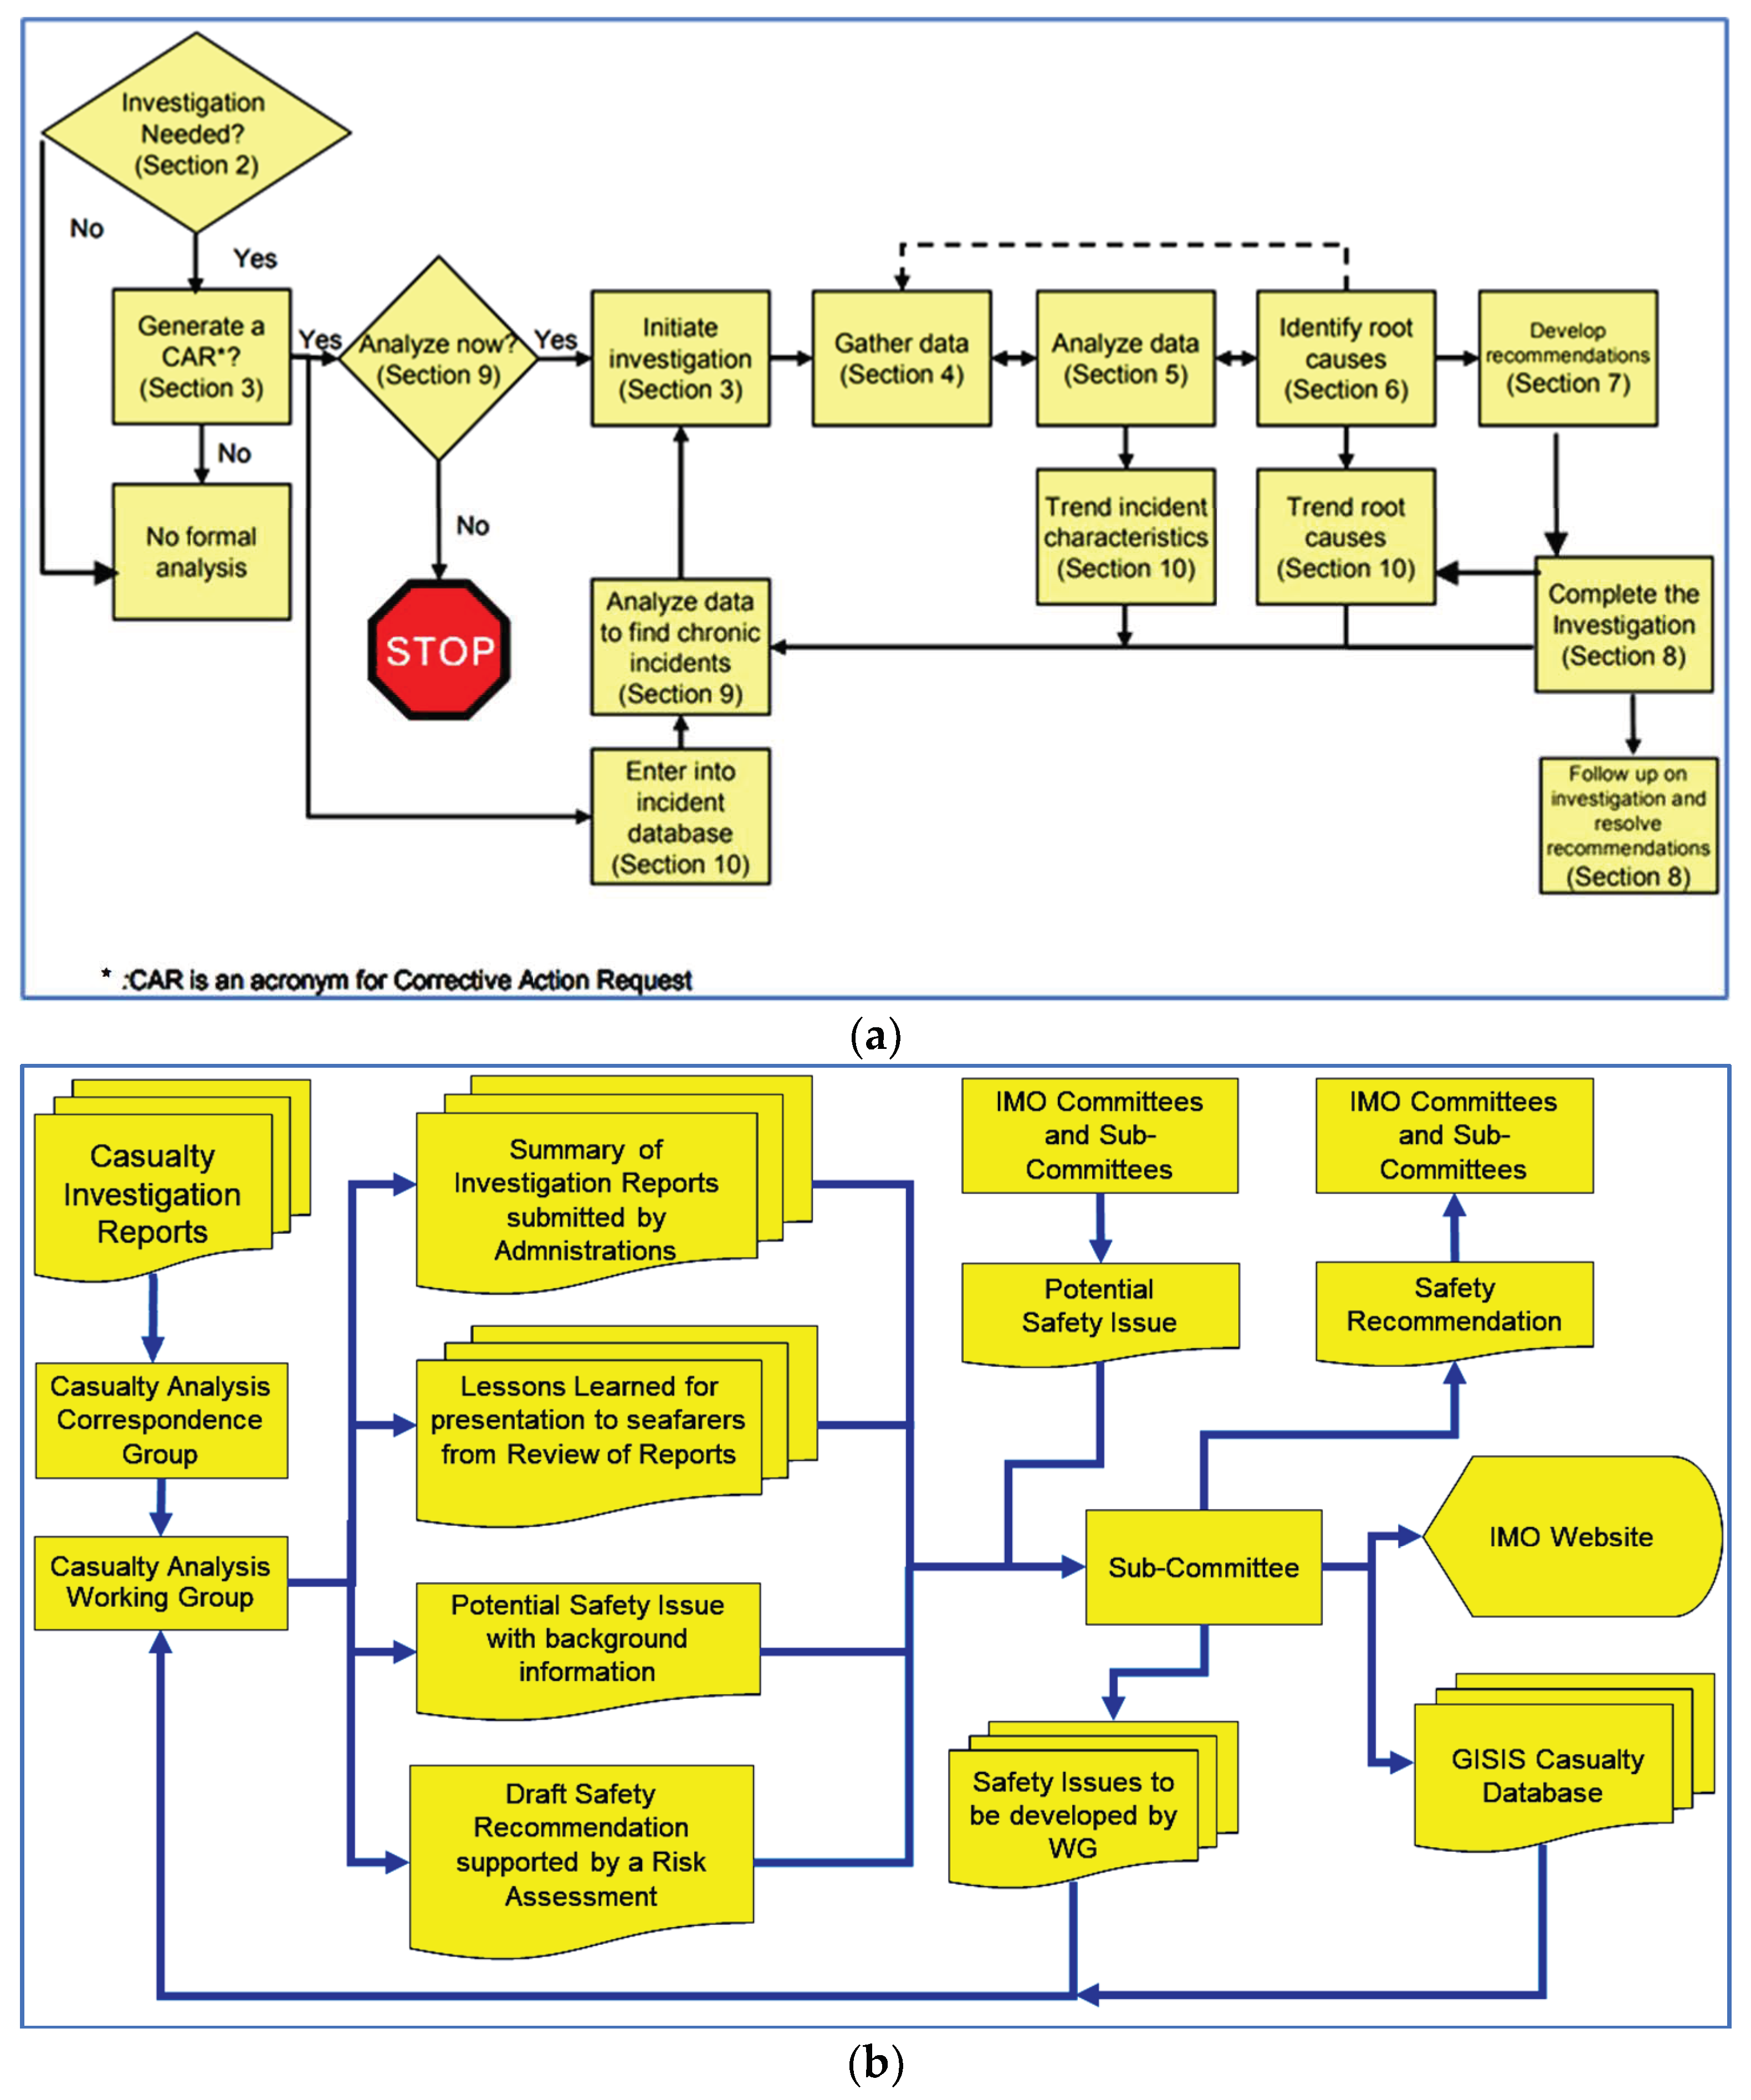
Figure 1. (a) ABS Incident Investigation Model [7]; (b) IMO procedure for evaluating safety issues that need further consideration [3].
Jmse 12 00122 g001
Figure 2. Methodological process of statistical analysis for collision, grounding and structural failure damage cases.
Jmse 12 00122 g002
Figure 3. Percentages of vessel types involved in accidents due to: (a) collision for a total of 200 (100 + 100) vessels; (b) grounding for a total of 99 vessels; (c) structural failure for a total of 14 vessels.
Jmse 12 00122 g003
Figure 4. Typical division of a bulk carrier with five cargo holds.
Jmse 12 00122 g004
Figure 5. Dividing half of the breadth of the same type of vessel as in Figure 4.
Jmse 12 00122 g005
Figure 6. Percentages of vessels according to EMSA cause analysis due to (a) collision, (b) grounding, and (c) structural failure.
Jmse 12 00122 g006
Figure 7. Percentages of vessels’ longitudinal extent of damage due to collision.
Jmse 12 00122 g007
Figure 8. Percentages of vessels’ longitudinal extent of damage due to grounding.
Jmse 12 00122 g008
Figure 9. Percentages of vessels’ longitudinal extent of damage due to structural failure.
Jmse 12 00122 g009
Figure 10. Percentages of vessels’ (a) vertical extent (height) and (b) size of the area damaged due to collision.
Jmse 12 00122 g010
Figure 11. Percentages of vessels’ (a) transverse extent (breadth) and (b) size of the area damaged due to grounding.
Jmse 12 00122 g011
Figure 12. Percentages of vessels’ (a) vertical extent (height) and (b) size of the damaged area due to structural failure.
Jmse 12 00122 g012
Figure 13. Percentages of vessels’ (a) longitudinal location (% of LBP) and (b) vertical location of damage due to collision.
Jmse 12 00122 g013
Figure 14. Percentages of vessels’ (a) longitudinal location (% of LBP) and (b) transverse location of damage due to grounding.
Jmse 12 00122 g014
Figure 15. Percentages of vessels’ (a) longitudinal location and (b) vertical location of damage due to structural failure.
Jmse 12 00122 g015
Figure 16. Total percentage of vessel types involved in a marine casualty (collision, grounding, and structural failure).
Jmse 12 00122 g016
Figure 17. Correlation between vessel type and longitudinal damage extent due to collision accident.
Jmse 12 00122 g017
Figure 18. Correlation between vessel type and vertical damage extent due to collision accident.
Jmse 12 00122 g018
Figure 19. Correlation between vessel type and longitudinal damage location due to collision.
Jmse 12 00122 g019
Figure 20. Correlation between vessel type and vertical damage location due to collision accident.
Jmse 12 00122 g020
Figure 21. Correlation between impact of accident and longitudinal damage location due to collision accident.
Jmse 12 00122 g021
Figure 22. Correlation between impact of accident and vertical damage location due to collision.
Jmse 12 00122 g022
Figure 23. Correlation between type of casualty and longitudinal damage location due to collision.
Jmse 12 00122 g023
Figure 24. Correlation between type of casualty and vertical damage location due to collision.
Jmse 12 00122 g024
Figure 25. Correlation between type of vessel and longitudinal damage extent due to grounding.
Jmse 12 00122 g025
Figure 26. Correlation between type of vessel and transverse damage extent due to grounding.
Jmse 12 00122 g026
Figure 27. Correlation between type of vessel and longitudinal damage location due to grounding.
Jmse 12 00122 g027
Figure 28. Correlation between impact of accident and longitudinal damage location due to grounding.
Jmse 12 00122 g028
Figure 29. Correlation between type of casualty and longitudinal damage location due to grounding.
Jmse 12 00122 g029
Figure 30. Correlation between type of casualty and transverse damage location due to grounding.
Jmse 12 00122 g030
Figure 31. Correlation between type of vessel and longitudinal damage extent due to structural failure.
Jmse 12 00122 g031
Figure 32. Correlation between type of vessel and vertical damage extent due to structural failure.
Jmse 12 00122 g032
Figure 33. Correlation between type of vessel and longitudinal damage location due to structural failure.
Jmse 12 00122 g033
Figure 34. Correlation between type of vessel and vertical damage location due to structural failure.
Jmse 12 00122 g034
Figure 35. Correlation between impact of accident and longitudinal damage location due to structural failure.
Jmse 12 00122 g035
Figure 36. Correlation between impact of accident and vertical damage location due to structural failure.
Jmse 12 00122 g036
Figure 37. Correlation between type of casualty and longitudinal damage location due to structural failure.
Jmse 12 00122 g037
Figure 38. Correlation between type of casualty and vertical damage location due to structural failure.
Jmse 12 00122 g038
Figure 39. Distribution of damage length for all ship types and accident types (collision, grounding, and hull failure).
Jmse 12 00122 g039
Table 1. Size categorization for each type of vessel.
BULK CARRIERSTANKERSCONTAINERPASSENGERS
Handysize
Handymax
Small product
Chemical tankers
General purpose (GP)
Medium range (MR)
Feeder
Feedermax
Early container ships
Fully cellular
Small ships
Small-midsize ships
Supramax
Ultramax
Panamax
Kamsarmax
Long rangePanamax
Panamax Max
Midsize ships
Post-PanamaxAframax,
Long Range 2
Suezmaz
Post Panamax I
and II
Large ships
Capesize
VLOC
VLCC
ULCC
New-Panamax
VLCS
ULSCS
Mega-ships
Table 2. Categorization for wind speed, sea state, visibility and natural light for each vessel involved in an accident; each characteristic is categorized independently.
ΝοWind Force StateSea StateVisibilityNatural Light
1CalmCalmGoodDark
2Light AirSmoothModerateLight
3Light BreezeSlightPoor
4Gentle BreezeModerateFog
5Moderate BreezeRough
6Fresh BreezeVery Rough
7Strong BreezeHigh
8Near GaleVery High
9Gale
10Severe Gale
11Storm
12Violent Storm
13Hurricane
Table 3. Correlation between key factors affecting investigated incidents. All the possible combinations for the factors (A and B) situated in the same row of cells of the table were investigated.
Variable A Variable B
Type of ship:
  • Container ship
  • General cargo
  • Bulk carrier
  • Passenger ship
  • Tanker
  • Ro-ro
  • Trawler
  • Tug-special vessel
  • LNG
Ship characteristics:
  • Length of ship (LOA)
  • Breadth of ship (B)
  • Draft of ship (T)
  • Deadweight of ship (DWT)
  • Size of ship
  • Age of ship (old/middle/new)
  • Flag and risk of flag (low/middle/high/not registered)
Weather conditions:
  • Wind force
  • Sea state
  • Visibility level
  • Presence of natural light (day/night)
Damage characteristics:
  • Longitudinal location (% LBP)
  • Vertical location (Bottom, W.L., Deck)
  • Transverse location (% B/2)
  • Location side (P. or S.)
  • Longitudinal extent
  • Vertical extent
  • Transverse extent
  • Area of damage
Accident-related information:
  • Casualty event severity
  • Impact of the accident
  • Cause of accident
  • Type of casualty
  • Cause of accident
  • Type of casualty
  • Age of ship
  • Type of casualty
  • Impact of the accident
  • Risk of flag
  • Impact of the accident
  • Longitudinal location of damage
  • Impact of the accident
  • Type of casualty
  • Vertical location of damage
  • Impact of the accident
  • Type of casualty
Table 4. Deadweight of the vessels involved in collision, grounding, and structural failure.
DEADWEIGHT
(T)
COLLISION
(%)
GROUNDING
(%)
STRUCTURAL FAILURE (%)
0–150021.512.16.7
1500–25004.011.16.7
2500–50009.526.36.7
5000–10,00012.520.26.7
10,000–15,0006.03.00.0
15,000–20,0003.05.10.0
20,000–30,0005.05.16.7
30,000–40,0009.04.06.7
40,000–50,0007.05.16.7
50,000–60,0003.52.06.7
60,000–100,00011.03.026.7
100,000–150,0002.52.00.0
150,000–200,0003.00.06.7
200,000–500,0001.51.06.7
Not specified1.00.00.0
Table 5. Size of the vessels involved in collision, grounding, and structural failure.
SIZE OF VESSELSCOLLISION
(%)
GROUNDING
(%)
STRUCTURAL FAILURE (%)
Small69.578.840.0
Medium20.015.233.3
Large8.53.013.3
Very Large1.53.06.7
Ultra Large0.50.00.0
Table 6. Age of the vessels involved in collision, grounding, and structural failure.
AGE OF VESSELSCOLLISION
(%)
GROUNDING
(%)
STRUCTURAL FAILURE (%)
New (1–5 years)18.512.113.3
Middle (5–25 years)64.558.653.3
Old (25+ years)17.029.326.7
Table 7. Flag risk of the vessel (according to the categorization described in Section 3.4) involved in an accident, in cases of collision, grounding, and structural failure.
FLAG RISK OF VESSELSCOLLISION
(%)
GROUNDING
(%)
STRUCTURAL FAILURE (%)
Low92.591.973.3
Medium6.53.00.0
High0.54.013.3
Very high0.01.06.7
Not registered0.50.00.0
Table 8. Most frequent vessel characteristics and accident-related factors according to the results from the performed statistical analysis for the three types of incidents.
COLLISION
(Characteristic/Factor—Corresponding Percentage)
GROUNDING
(Characteristic/Factor—Corresponding Percentage)
STRUCTURAL FAILURE
(Characteristic/Factor—Corresponding Percentage)
DIMENSIONS OF SHIPS
SizeSmall—70%Small—79%Small—40%
Deadweight0–1500T—22%2500–3000T—26%60,000–100,000T—27%
TYPE OF SHIPGeneral cargo—23%
& Bulk carriers—21%
General cargo—43%Bulk carriers—40%
AGE OF SHIPMiddle—65%Middle—59%Middle—53%
FLAG RISKLow—93%Low—92%Low—73%
CONDITIONS DURING THE ACCIDENT
Wind forceGentle breeze—25%Calm—30%Fresh Breeze—27%
Sea stateSlight—35%
and Moderate—30%
Moderate—22.2% and Slight
Rough—22%
Rough—27%
VisibilityGood—61%Good—75%Good—60%
Natural lightDark—59%Dark—67%Dark—50%/light—50%
EXTENT OF DAMAGE
Longitudinal2–2.5 m—21%2–2.5 m—22%1–1.5 m—32%
Vertical or transverse2–2.5 m—23%2–2.5 m—27%5–6 m—21%
Area10–15 m2—14%4–5 m2—13%10–15 m2—26% and
2.5–3 m2—21%
LOCATION OF DAMAGE
Longitudinal90–100% LBP—28% and
100% LBP-F.E.—24%
90–100% LBP—19%40–50% LBP—29%
Vertical or transverseAbove waterline—22% and Above deck—19%C.L.—12% and
0–8% (1/2B) starboard—12%
Above deck/above WL and below WL/near bottom—21%.
SidePort side—39%Starboard + CL + port side—23%Starboard + CL + port—23% and center—18%
EMSA CAUSE ANALYSISCrew’s operational mistake—38%Crew’s operational mistake—50%Crew’s operational mistake—50%
Table 9. Chi-Square Tests—Collision.
Correlation ElementsAsymptotic Significance (2-Sided)Monte Carlo
Significance (2-Sided)
Type of vessel vs. size of vessel0.008 (a)
0.031 (b)
0.005 (a)
0.027 (b)
Type of vessel vs. vertical size of damage0.022 (a)0.018 (a)
Type of vessel vs. longitudinal location of damage <0.001 (a)<0.001 (a)
Type of vessel vs. visibility0.018 (a)0.014 (a)
Type of vessel vs. age0.022 (a)
0.004 (b)
0.018 (a)
0.003 (b)
Longitudinal location of damage vs.
after damage (damages were repaired)
<0.001 (a)
0.016 (b)
<0.001 (a)
0.013 (b)
Vertical location of damage vs.
type of casualty (serious marine casualty)
<0.001 (a)
0.049 (b)
0.000 (a)
0.043 (b)
Vertical location of damage vs.
after damage (damages were repaired)
0.020 (a)
0.002 (b)
0.016 (a)
0.001 (b)
Note: (a) is one of the vessels involved in the collision and (b) is the other vessel (since both vessels (a) and (b) were damaged in the collision accident).
Table 10. Chi-Square Tests—Grounding.
Correlation ElementsAsymptotic Significance (2-Sided)Monte Carlo
Significance (2-Sided)
Type of vessel vs. size of vessel<0.0010.041
Type of vessel vs. day/night period0.0360.023
Type of vessel vs. width of damage0.0130.047
Transverse damage location vs. impact of accident 0.0210.004
Type of casualty vs. EMSA cause analysis0.0160.012
Disclaimer/Publisher’s Note: The statements, opinions and data contained in all publications are solely those of the individual author(s) and contributor(s) and not of MDPI and/or the editor(s). MDPI and/or the editor(s) disclaim responsibility for any injury to people or property resulting from any ideas, methods, instructions or products referred to in the content.