
A Statistical Analysis of Ship Accidents (1990–2020) Focusing on Collision, Grounding, Hull Failure, and Resulting Hull Damage
 ,
,
Abstract
:1. Introduction
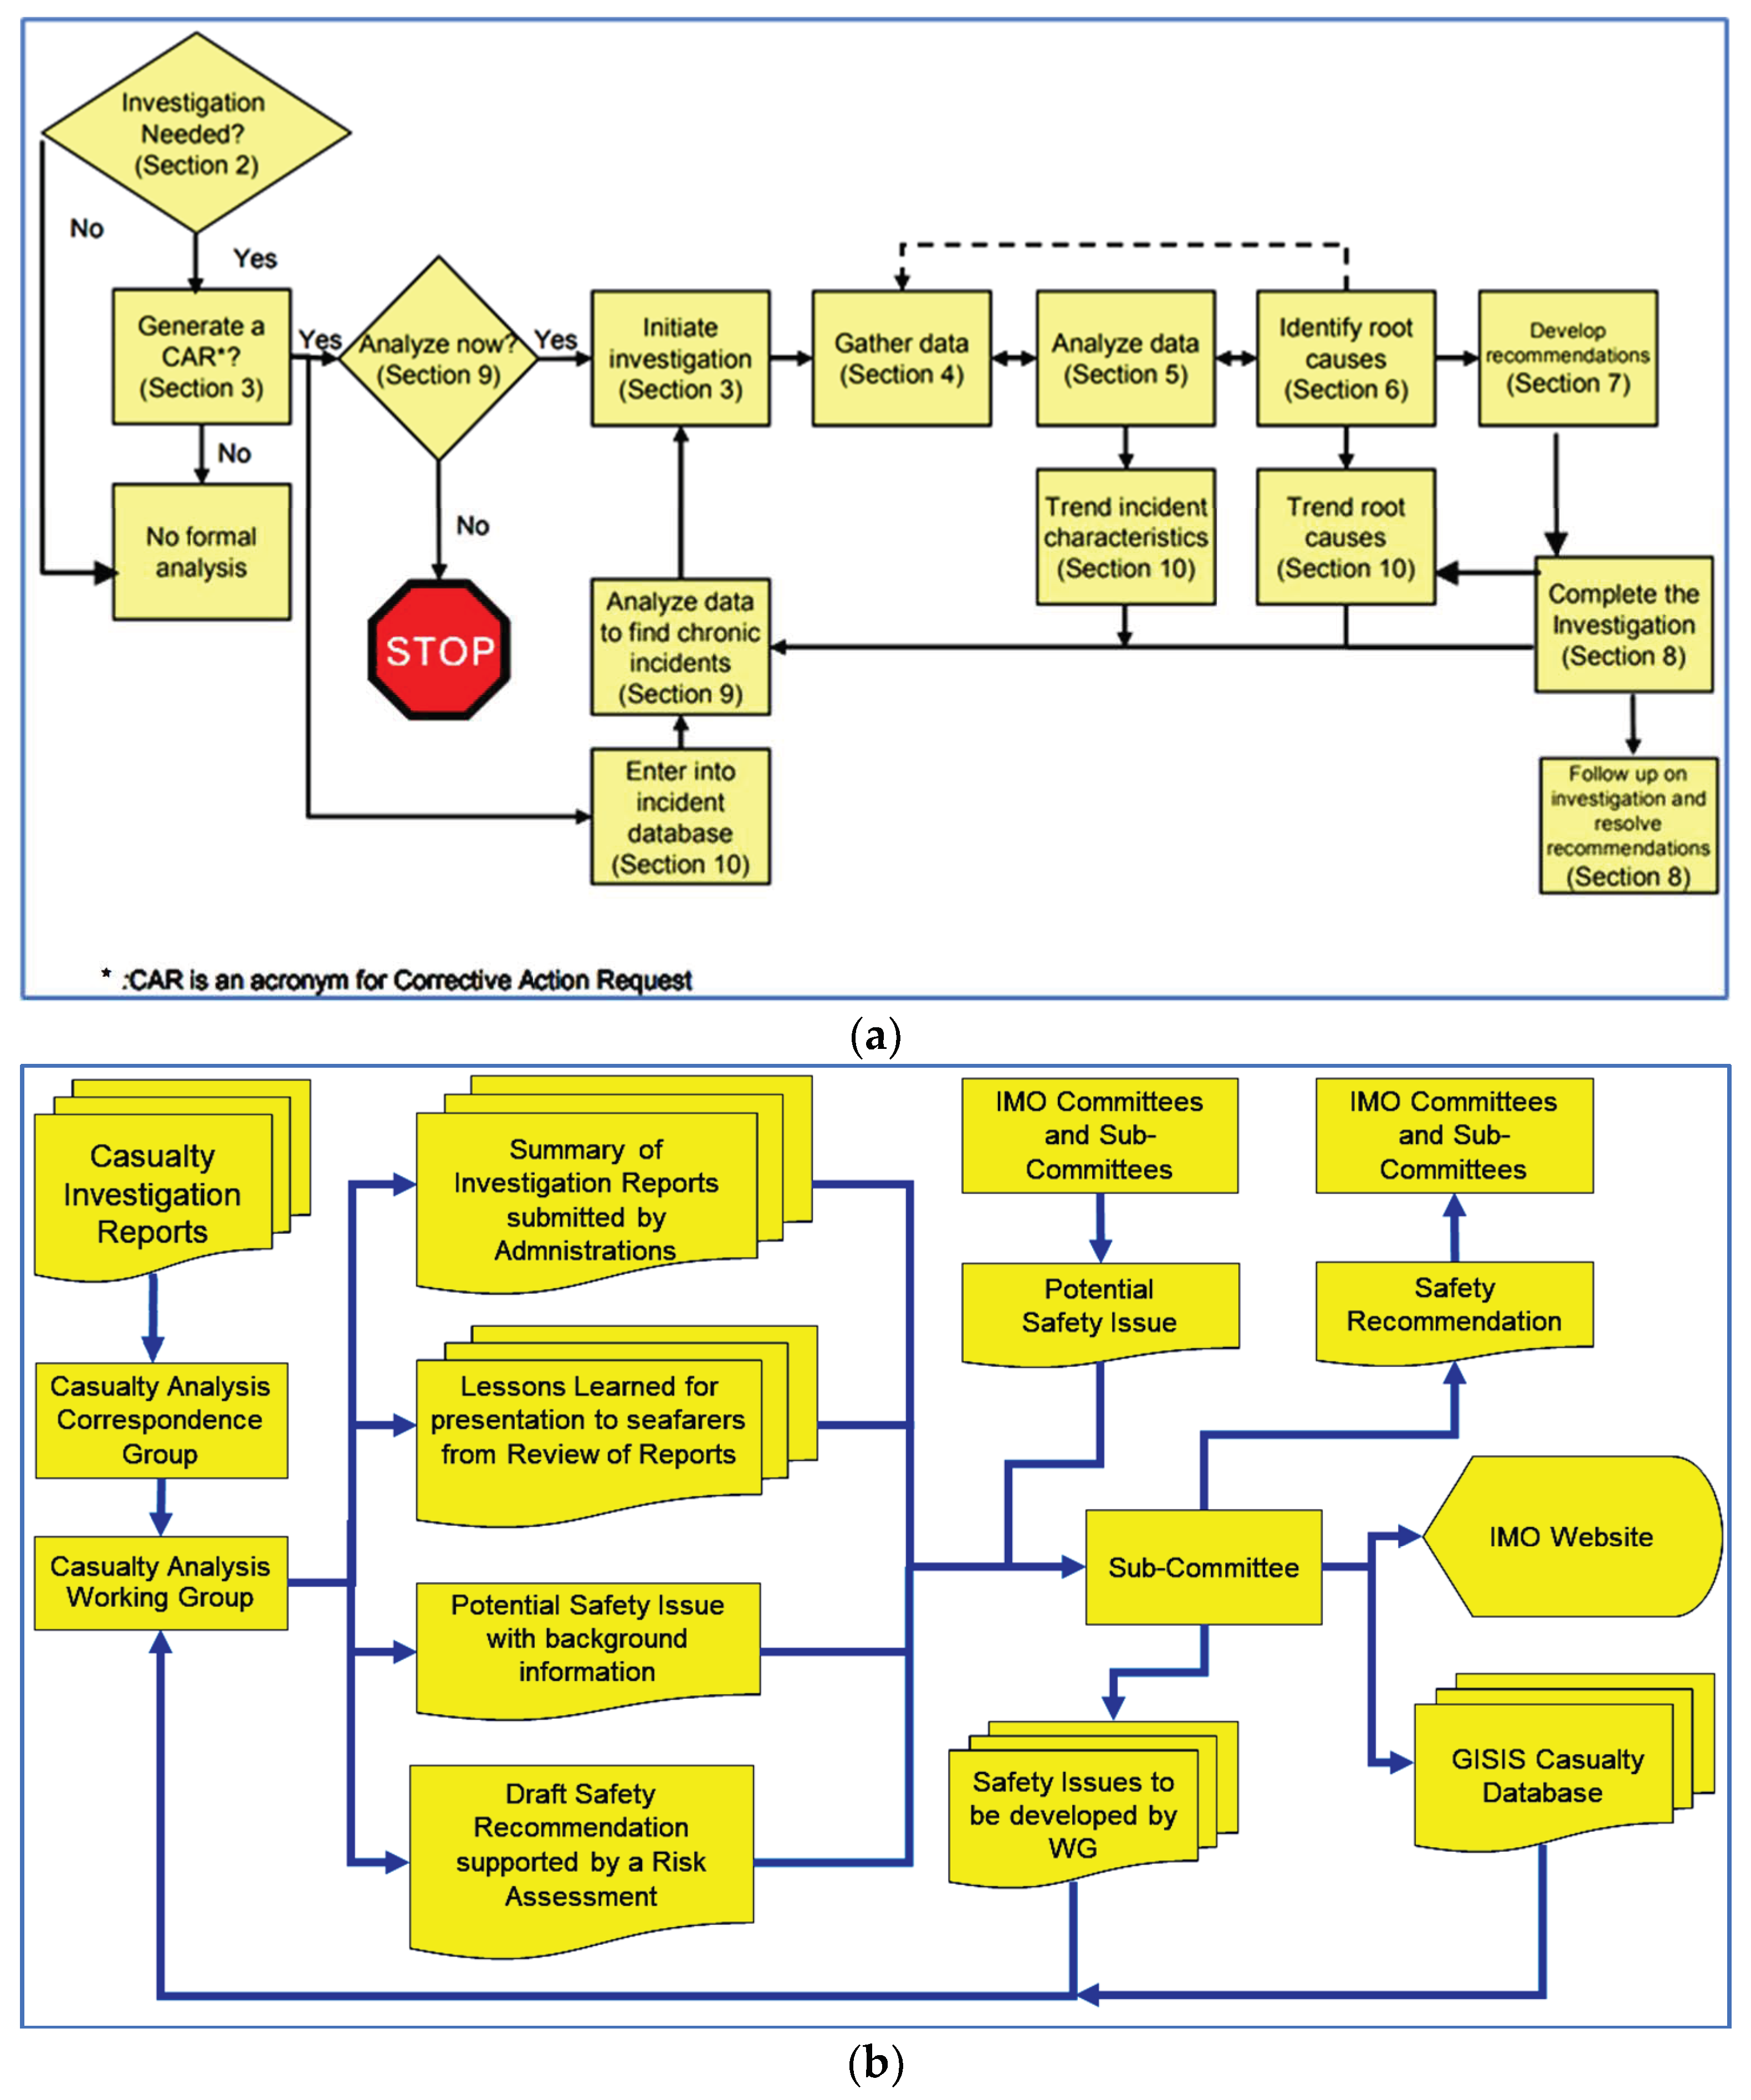
2. Literature Review
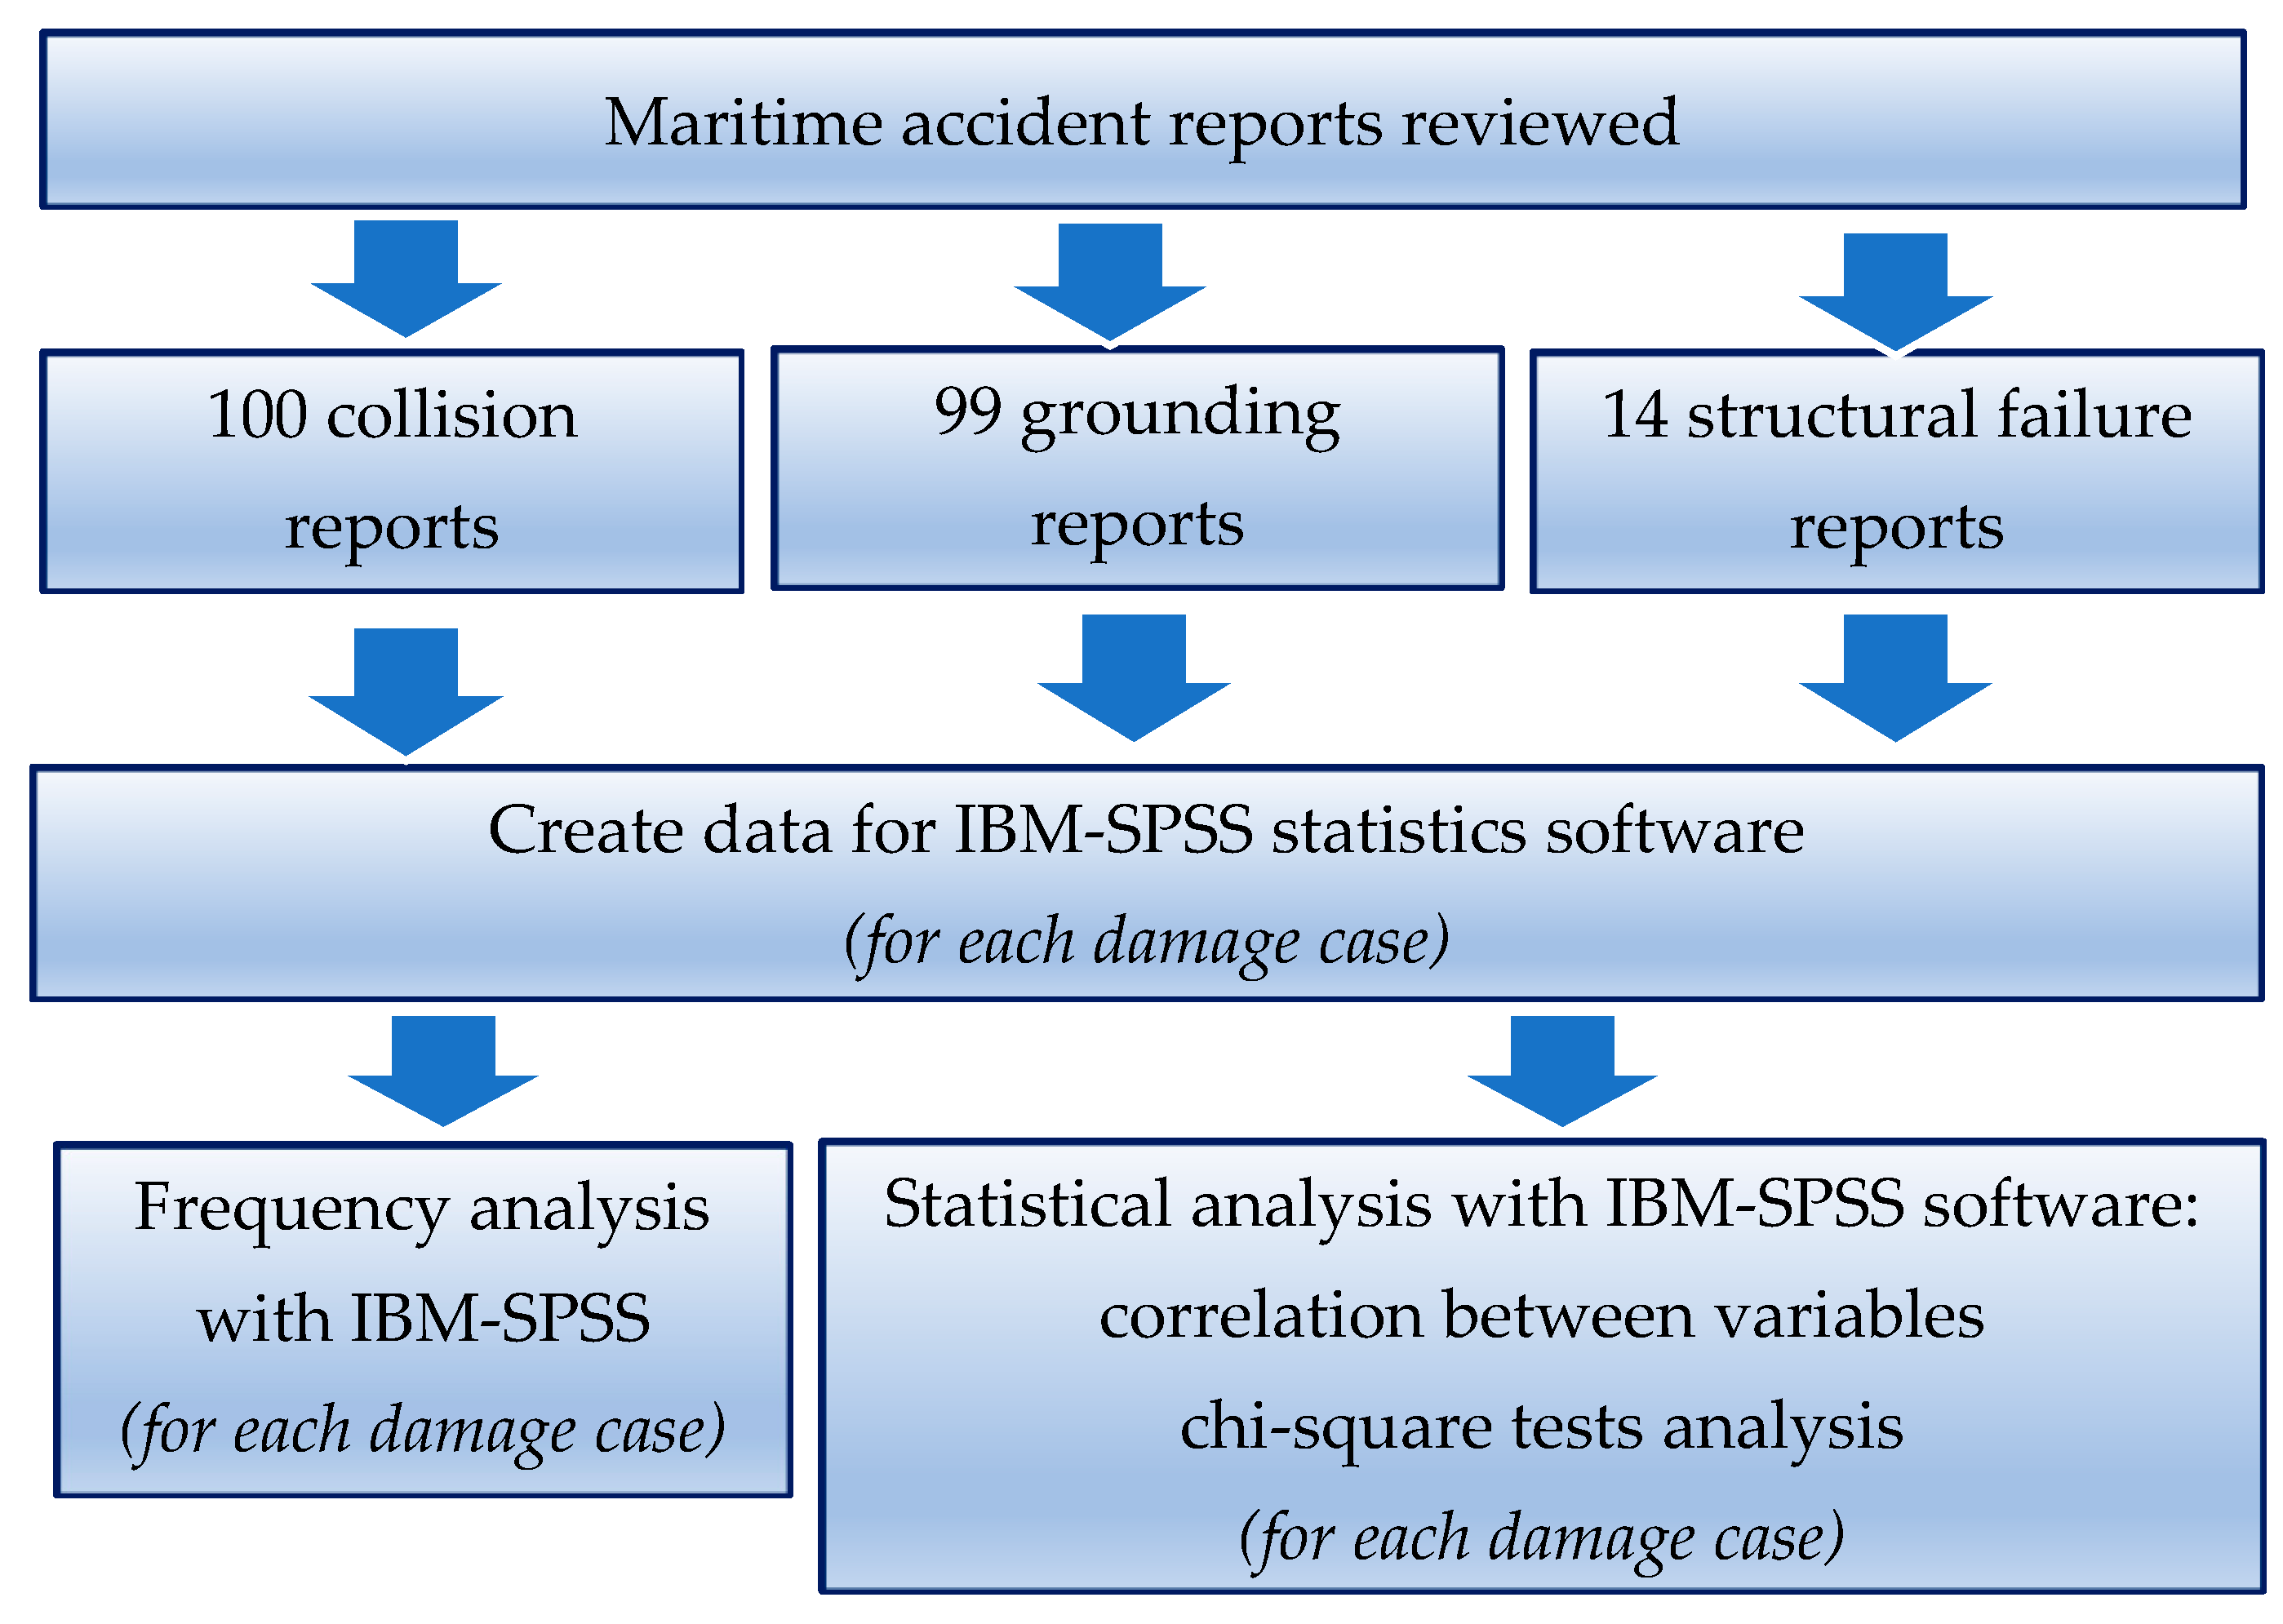
3. Methodology
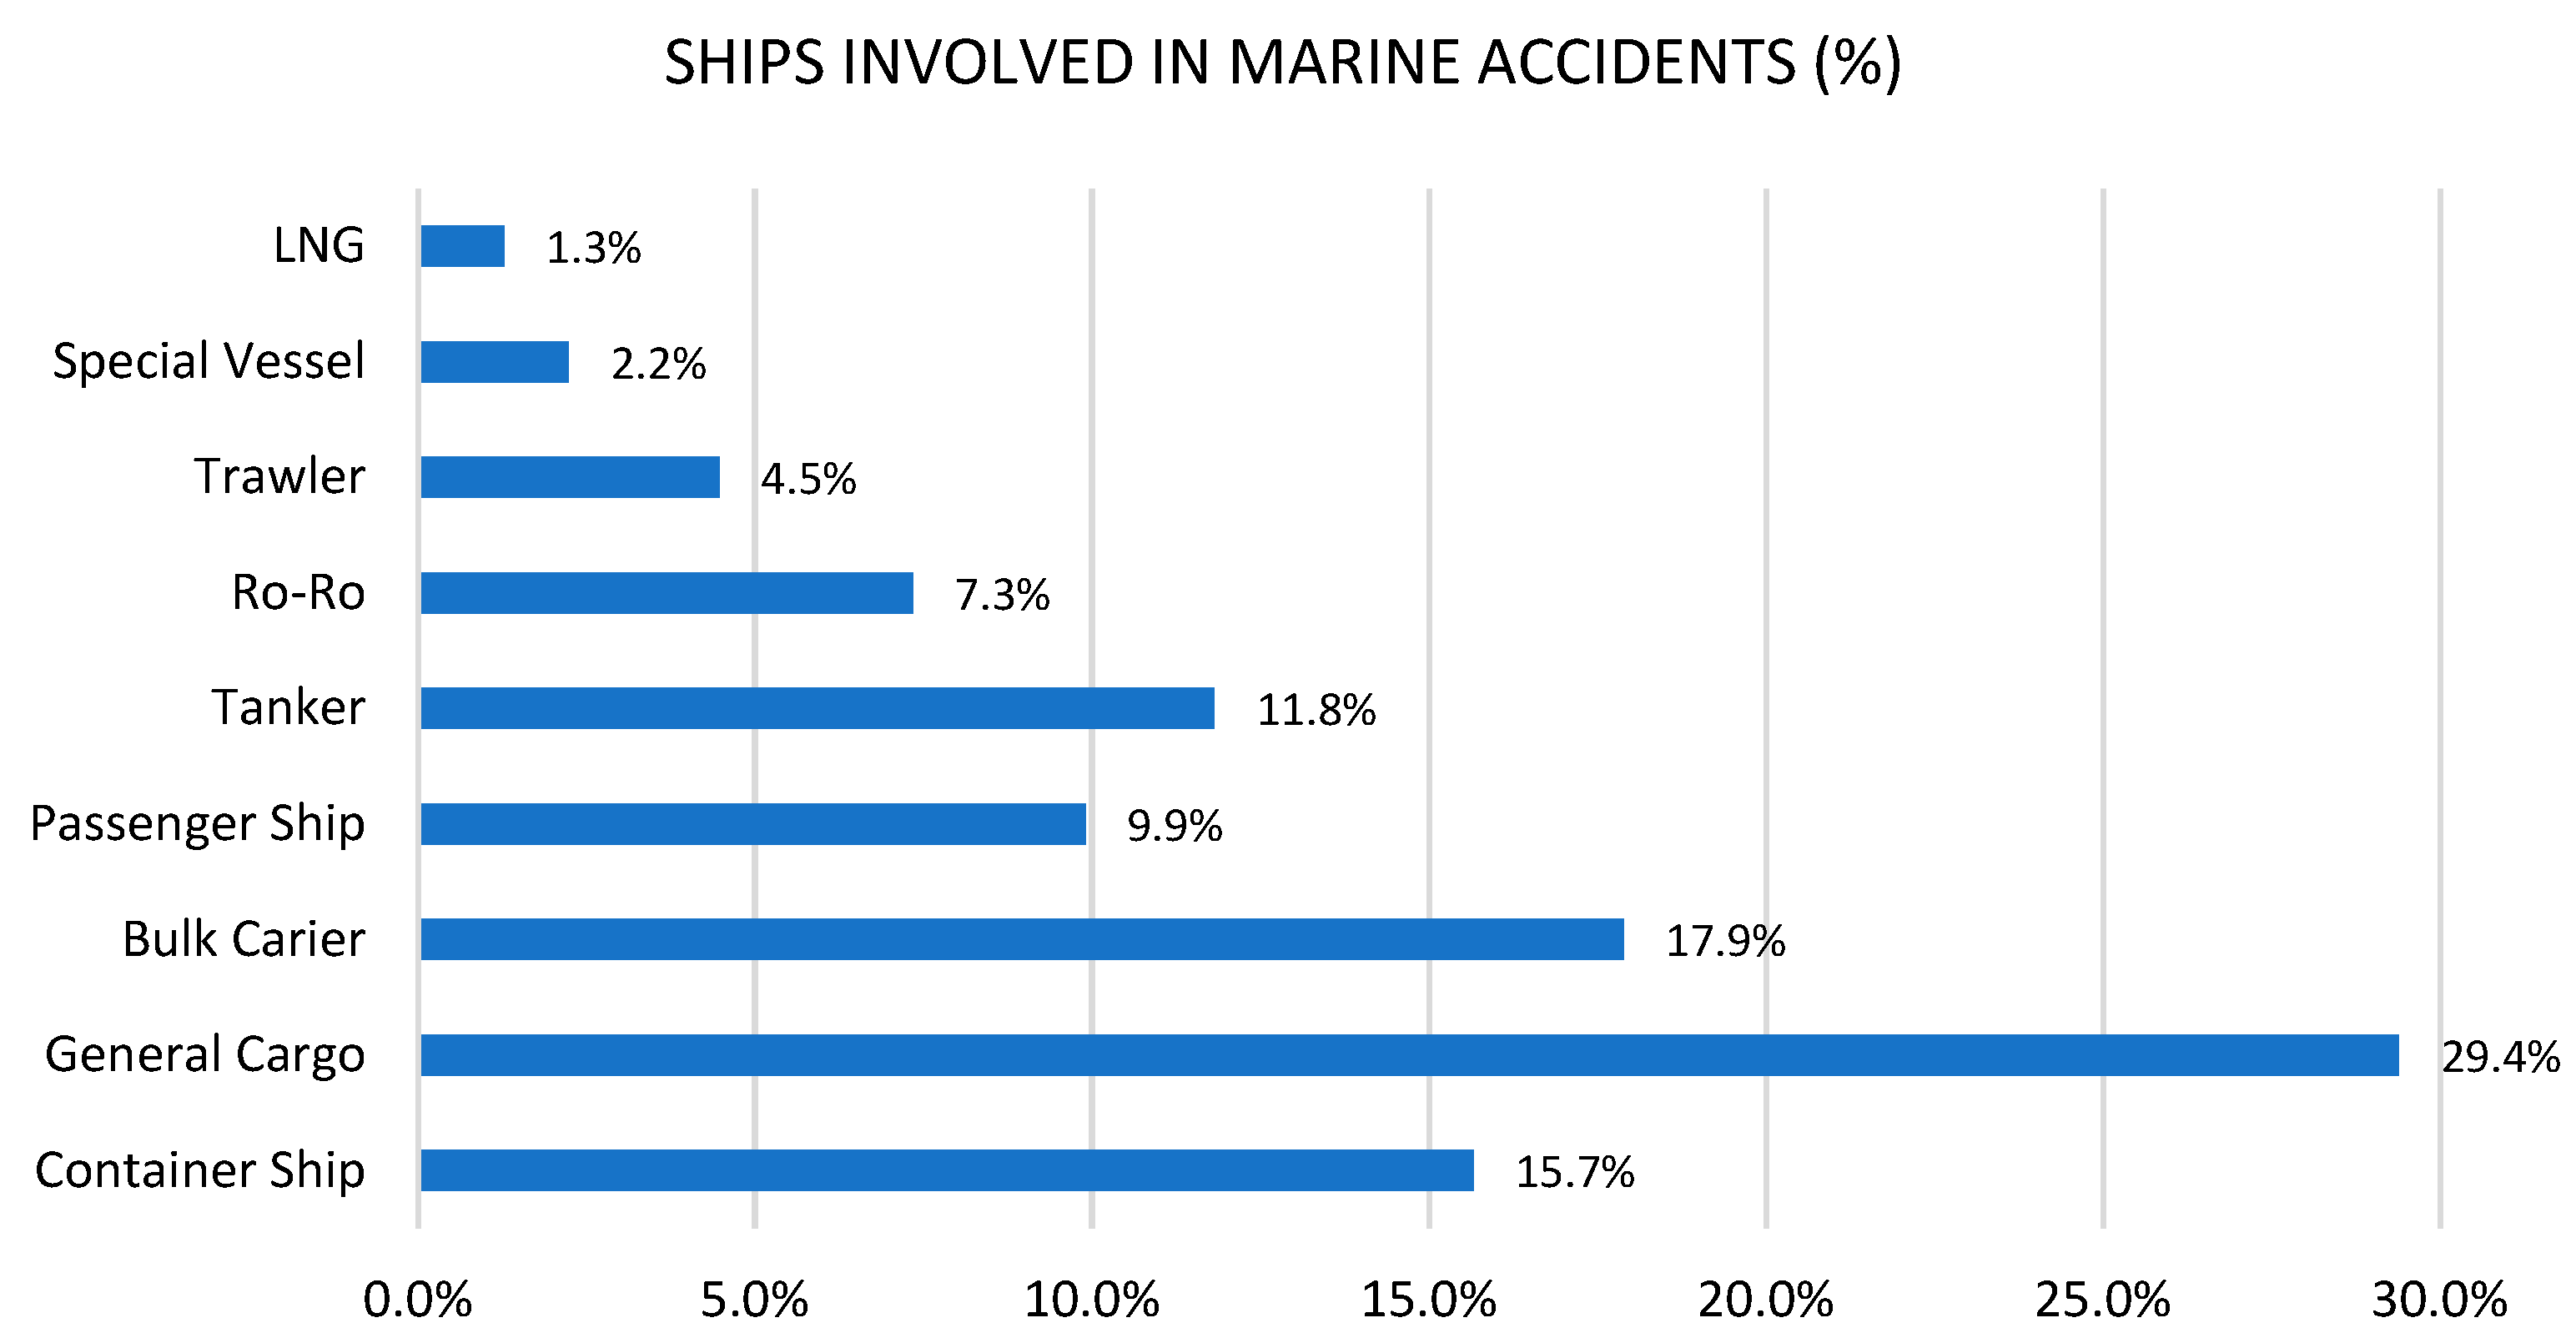
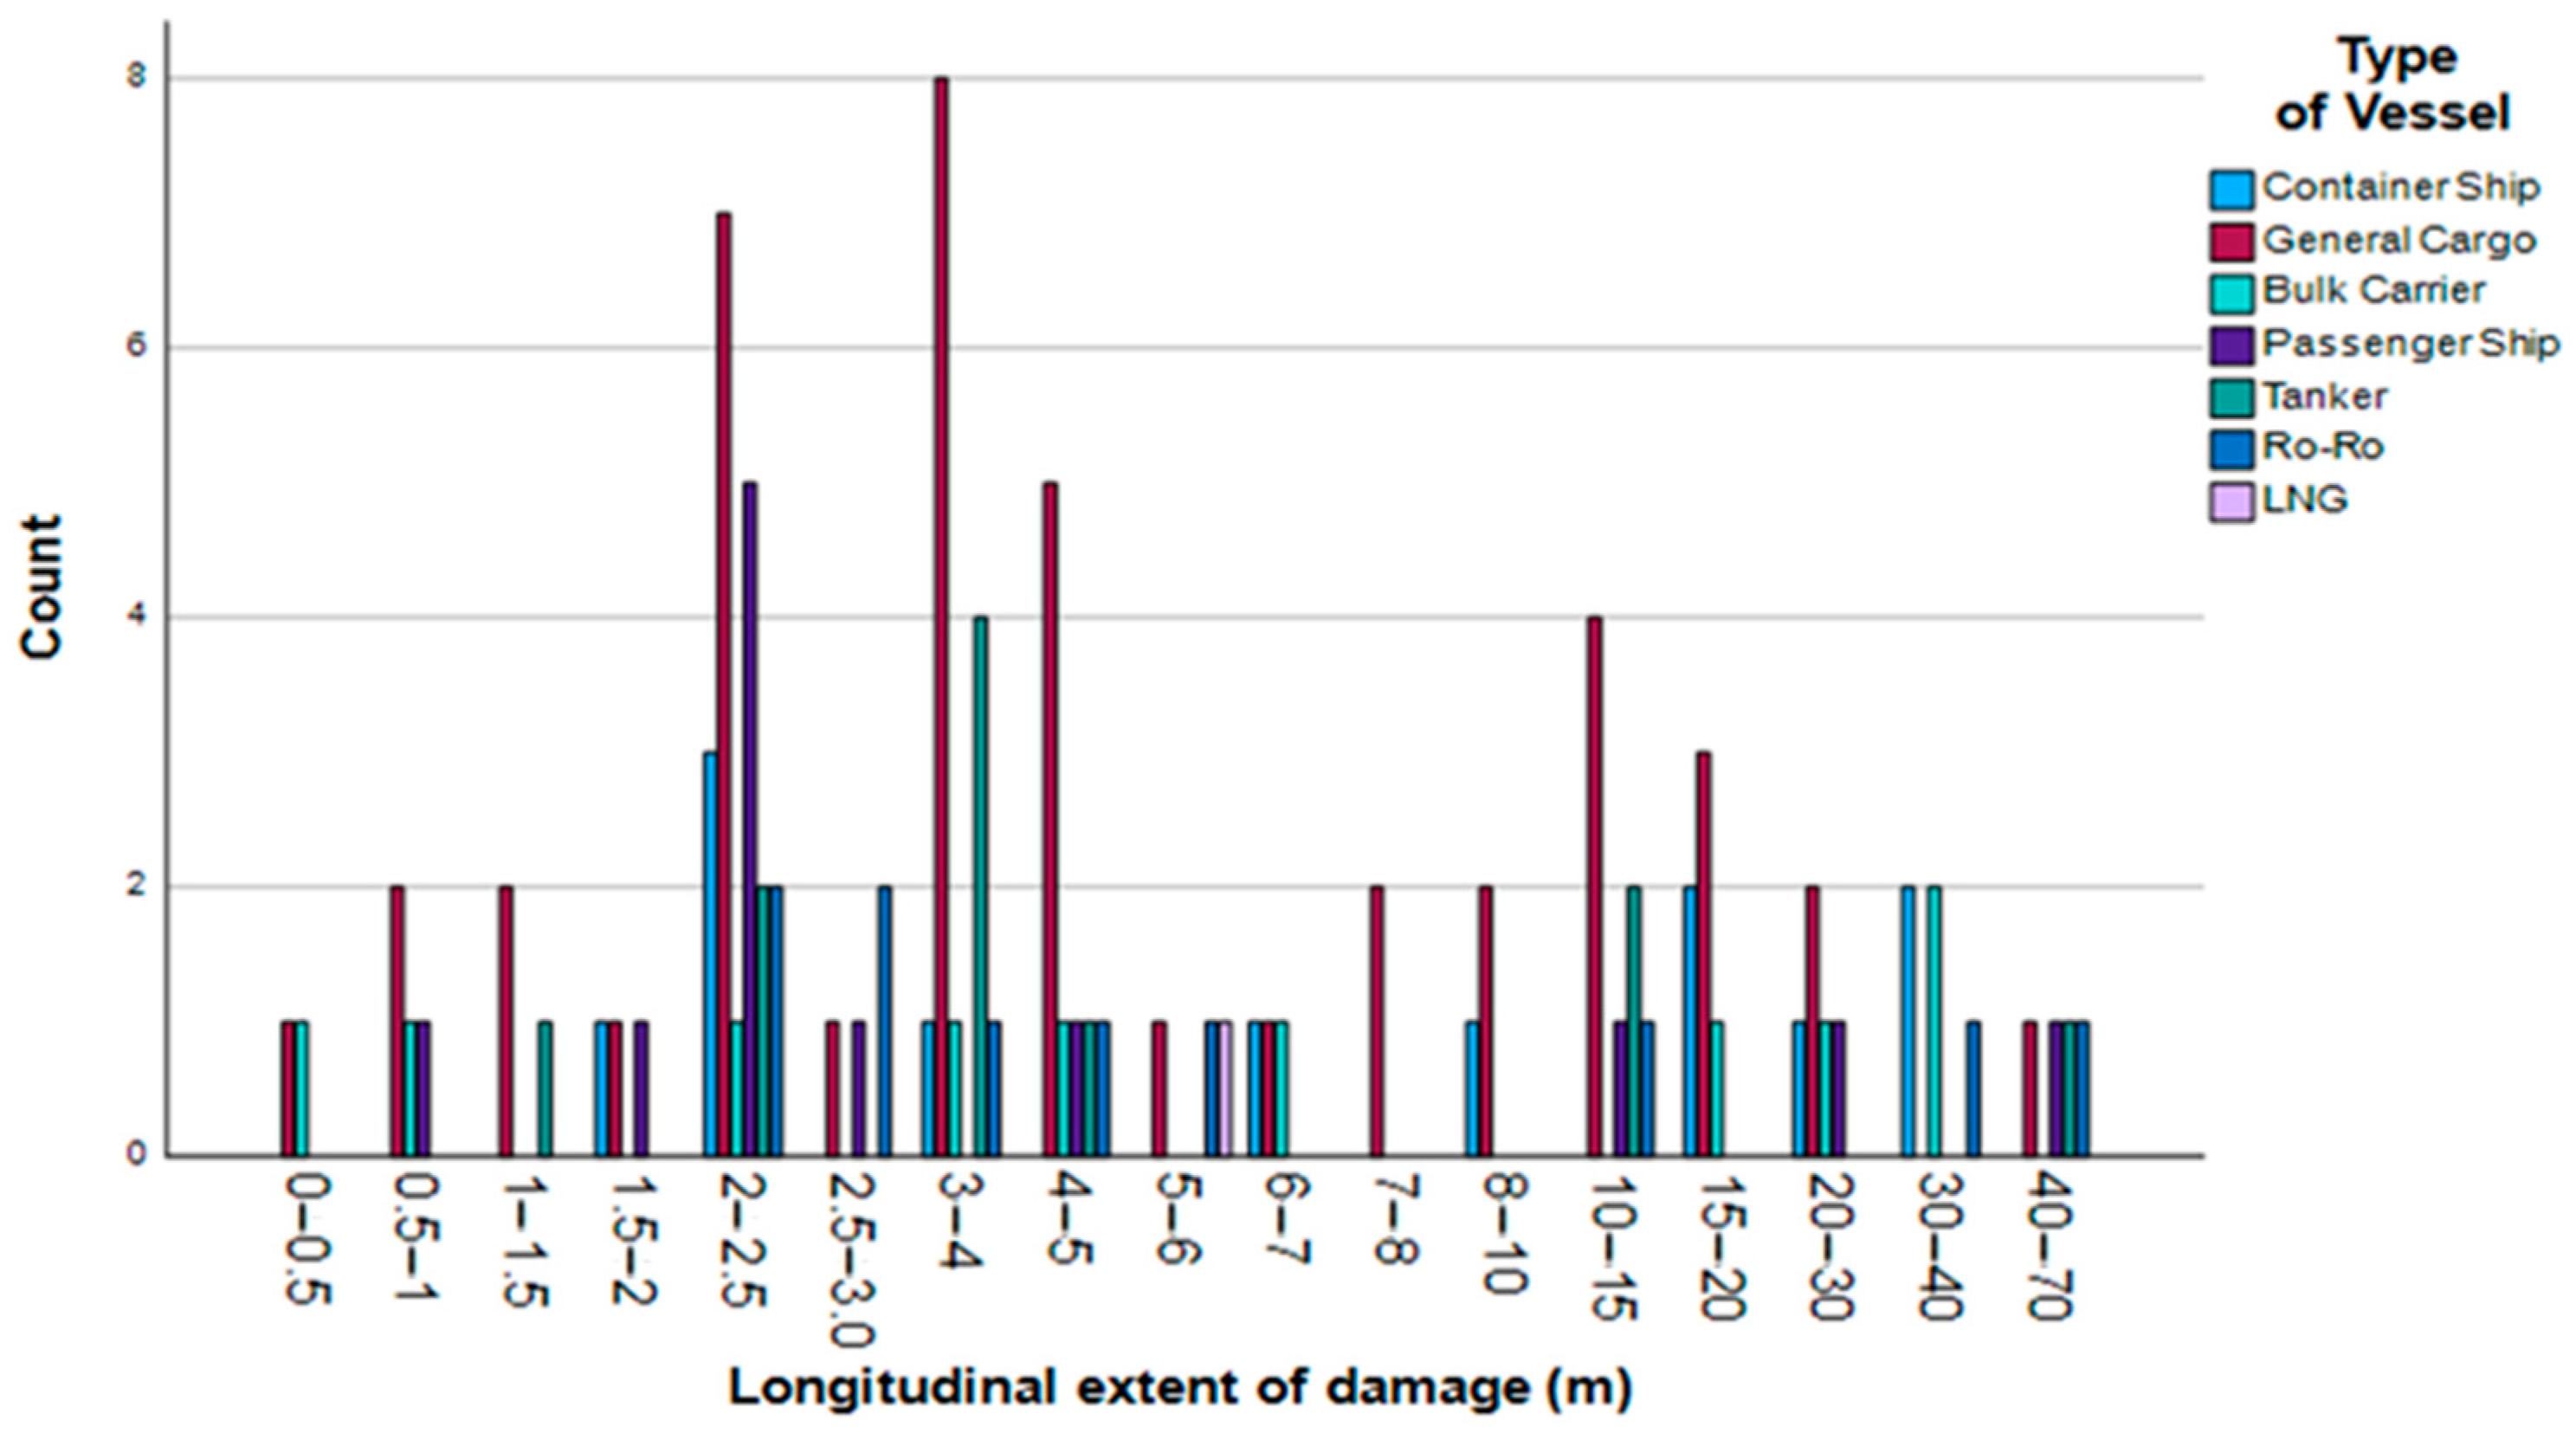
3.1. Type of Vessels and Vessels Characteristics
3.2. Vessels Size
3.3. Vessels’ Ages
- -
- New vessel: 1–5 years;
- -
- Middle vessel: 5–25 years;
- -
- Old vessel: 25+ years.
3.4. Risk of Vessels’ Flags
- -
- Low risk: Ships whose flag is on the “White” flag list (considered to have a consistently high level of compliance with maritime safety and pollution prevention conventions);
- -
- Medium risk: Ships whose flag is on the “Grey” list (considered to have some weaknesses in their implementation of maritime safety and pollution prevention regulations);
- -
- High risk: Ships whose flag is on the “Black” flag list (considered to have demonstrated a persistent disregard for maritime safety and pollution prevention standards);
- -
- Very high risk: Ships whose flag is at the top of the list of countries on the black list (considered to have a high detention record).
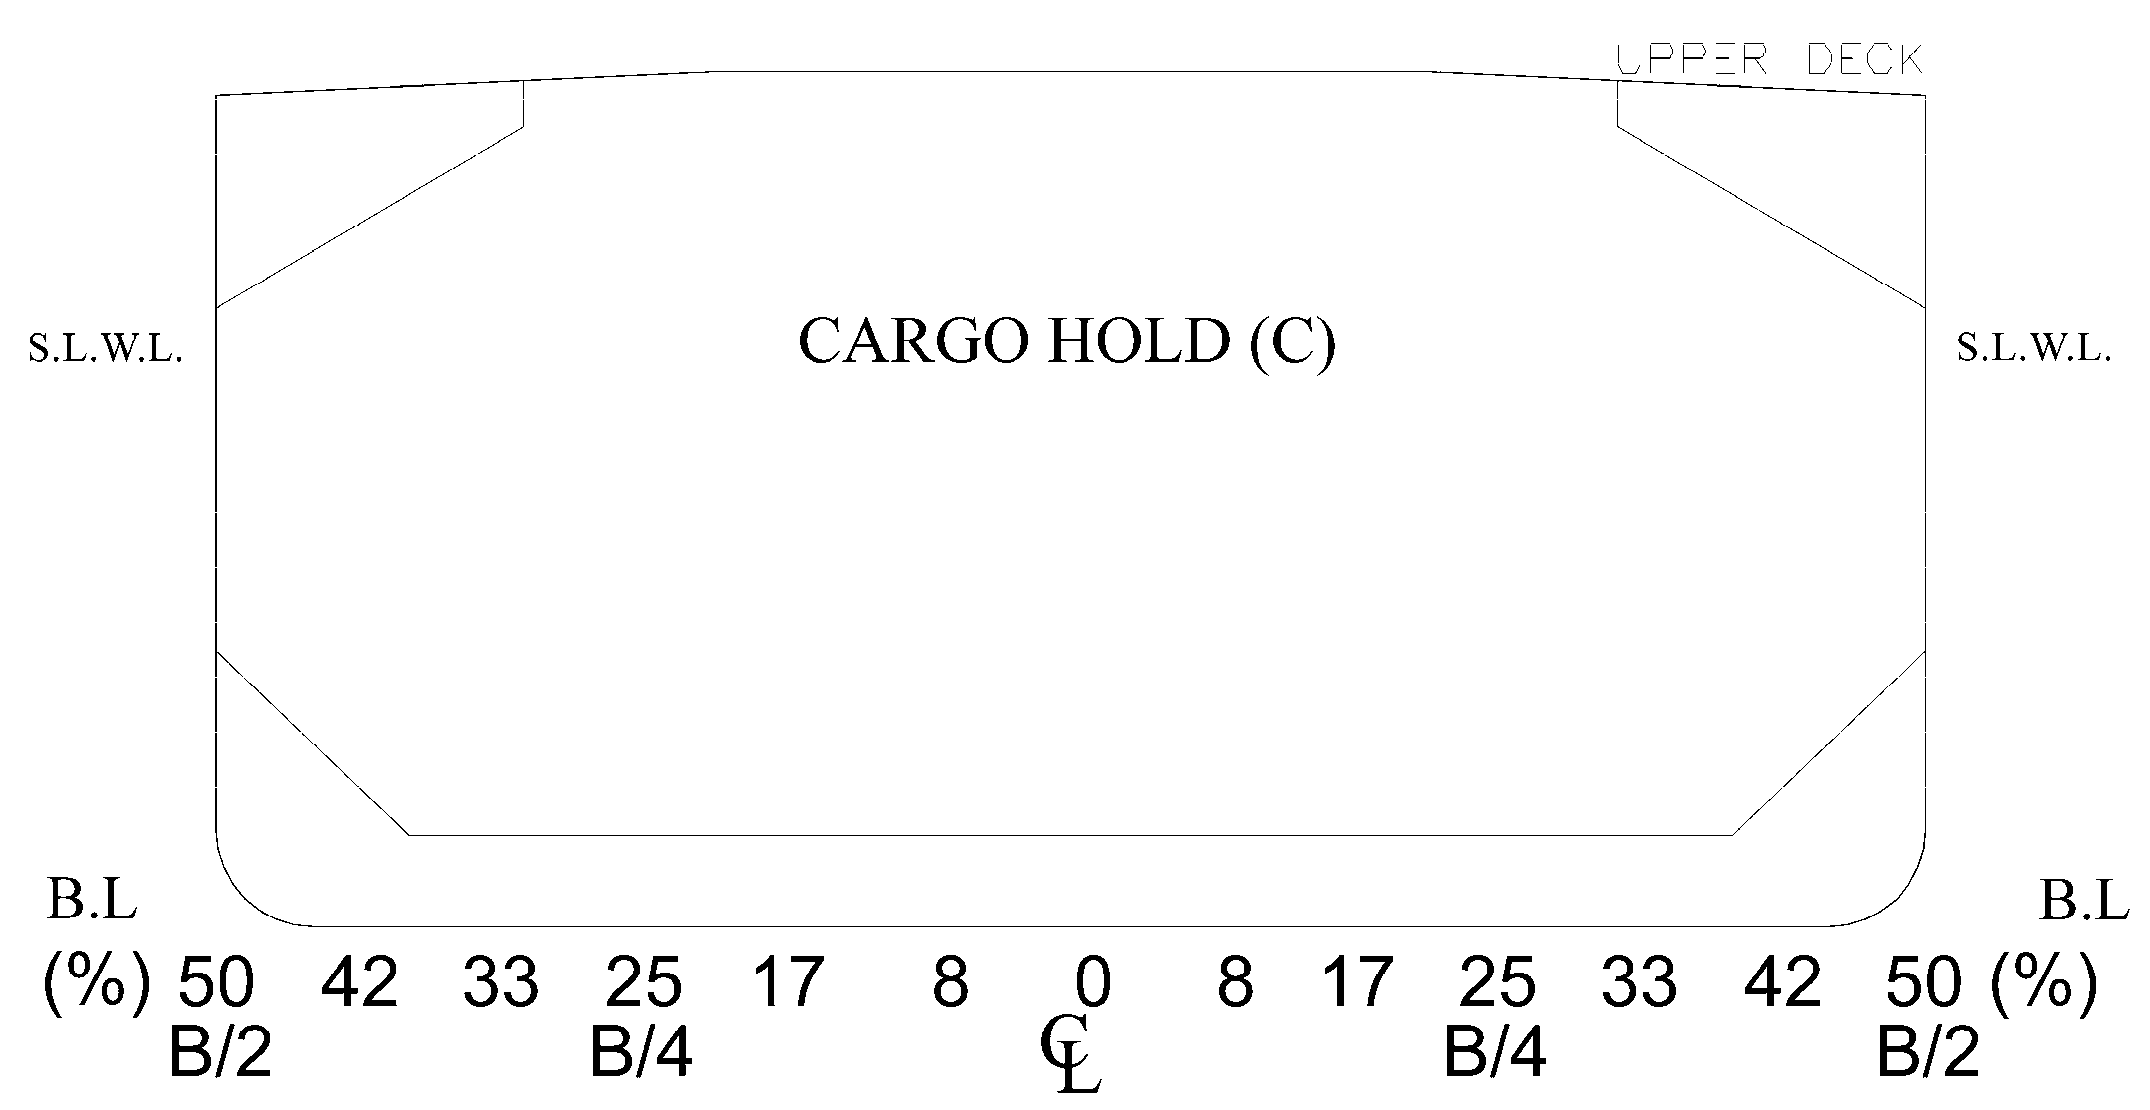
3.5. Damage Location and Size Estimation
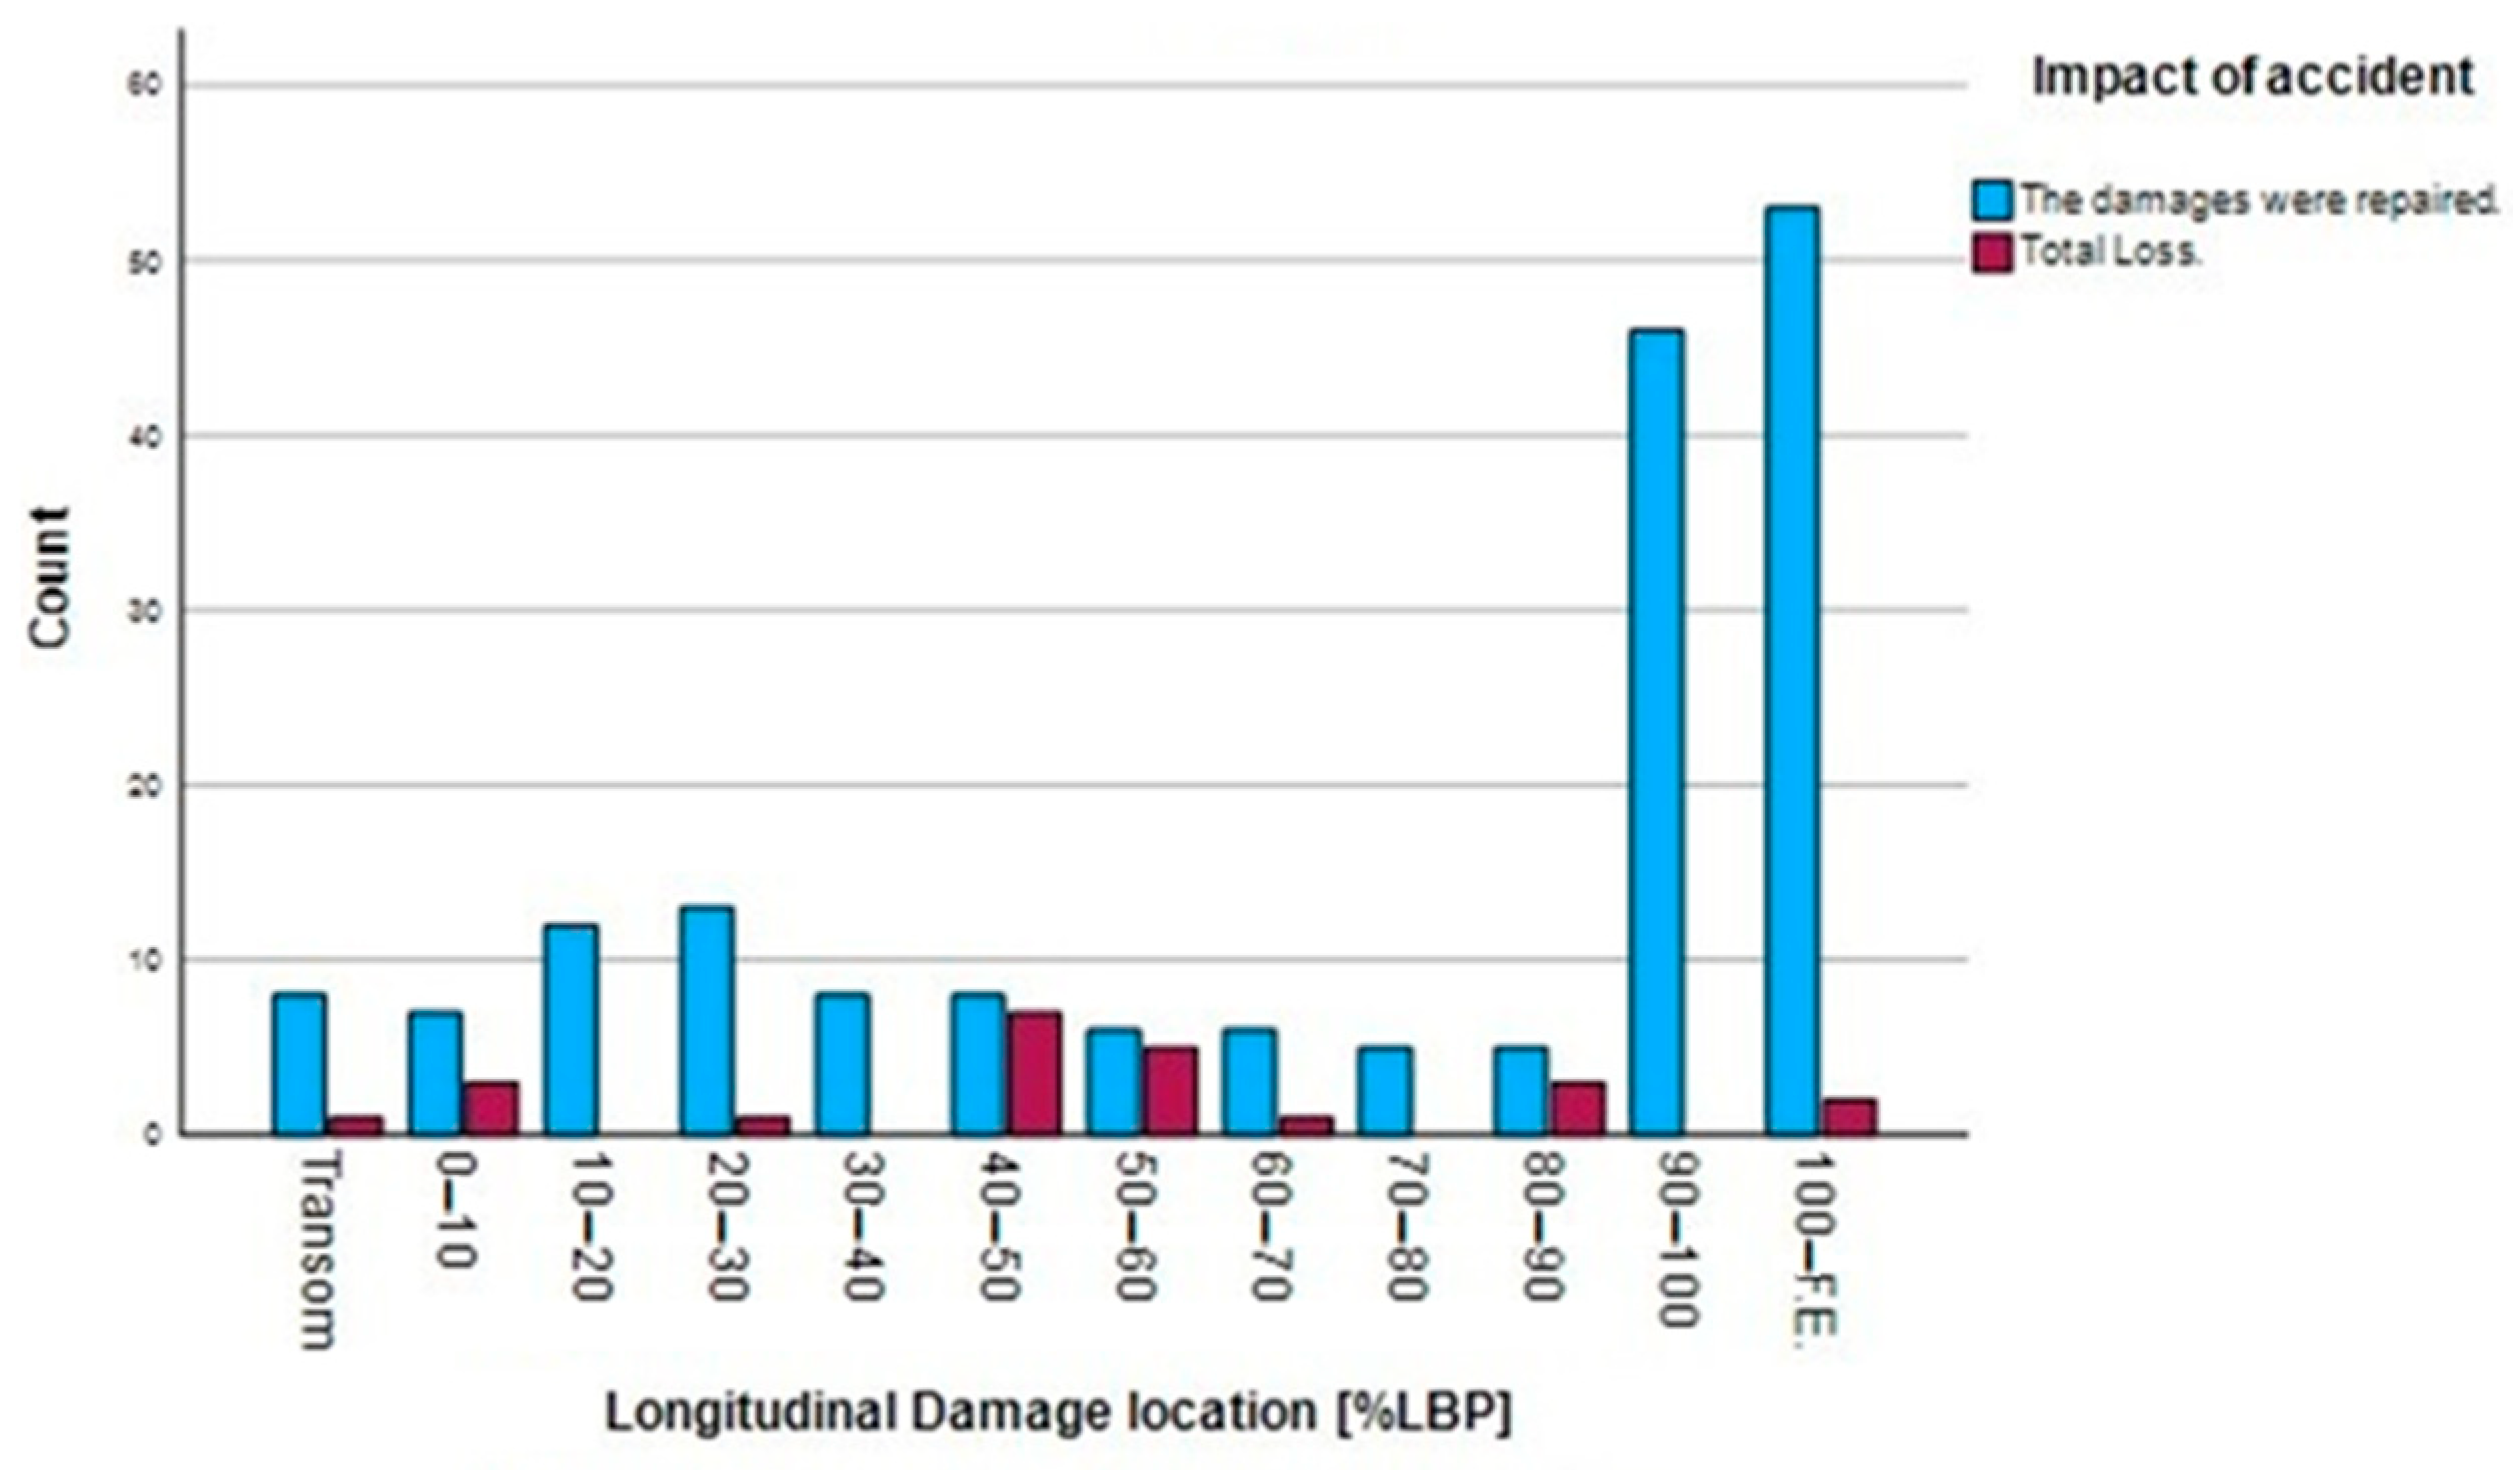
3.6. Impact of the Accident and Type of Casualty
- -
- “Damages were repaired”: the ship was able to complete its voyage or had been towed for repairing.
- -
- “Total Loss”: the ship was unable to continue its voyage because it sank or the damage was too expensive to repair.
- -
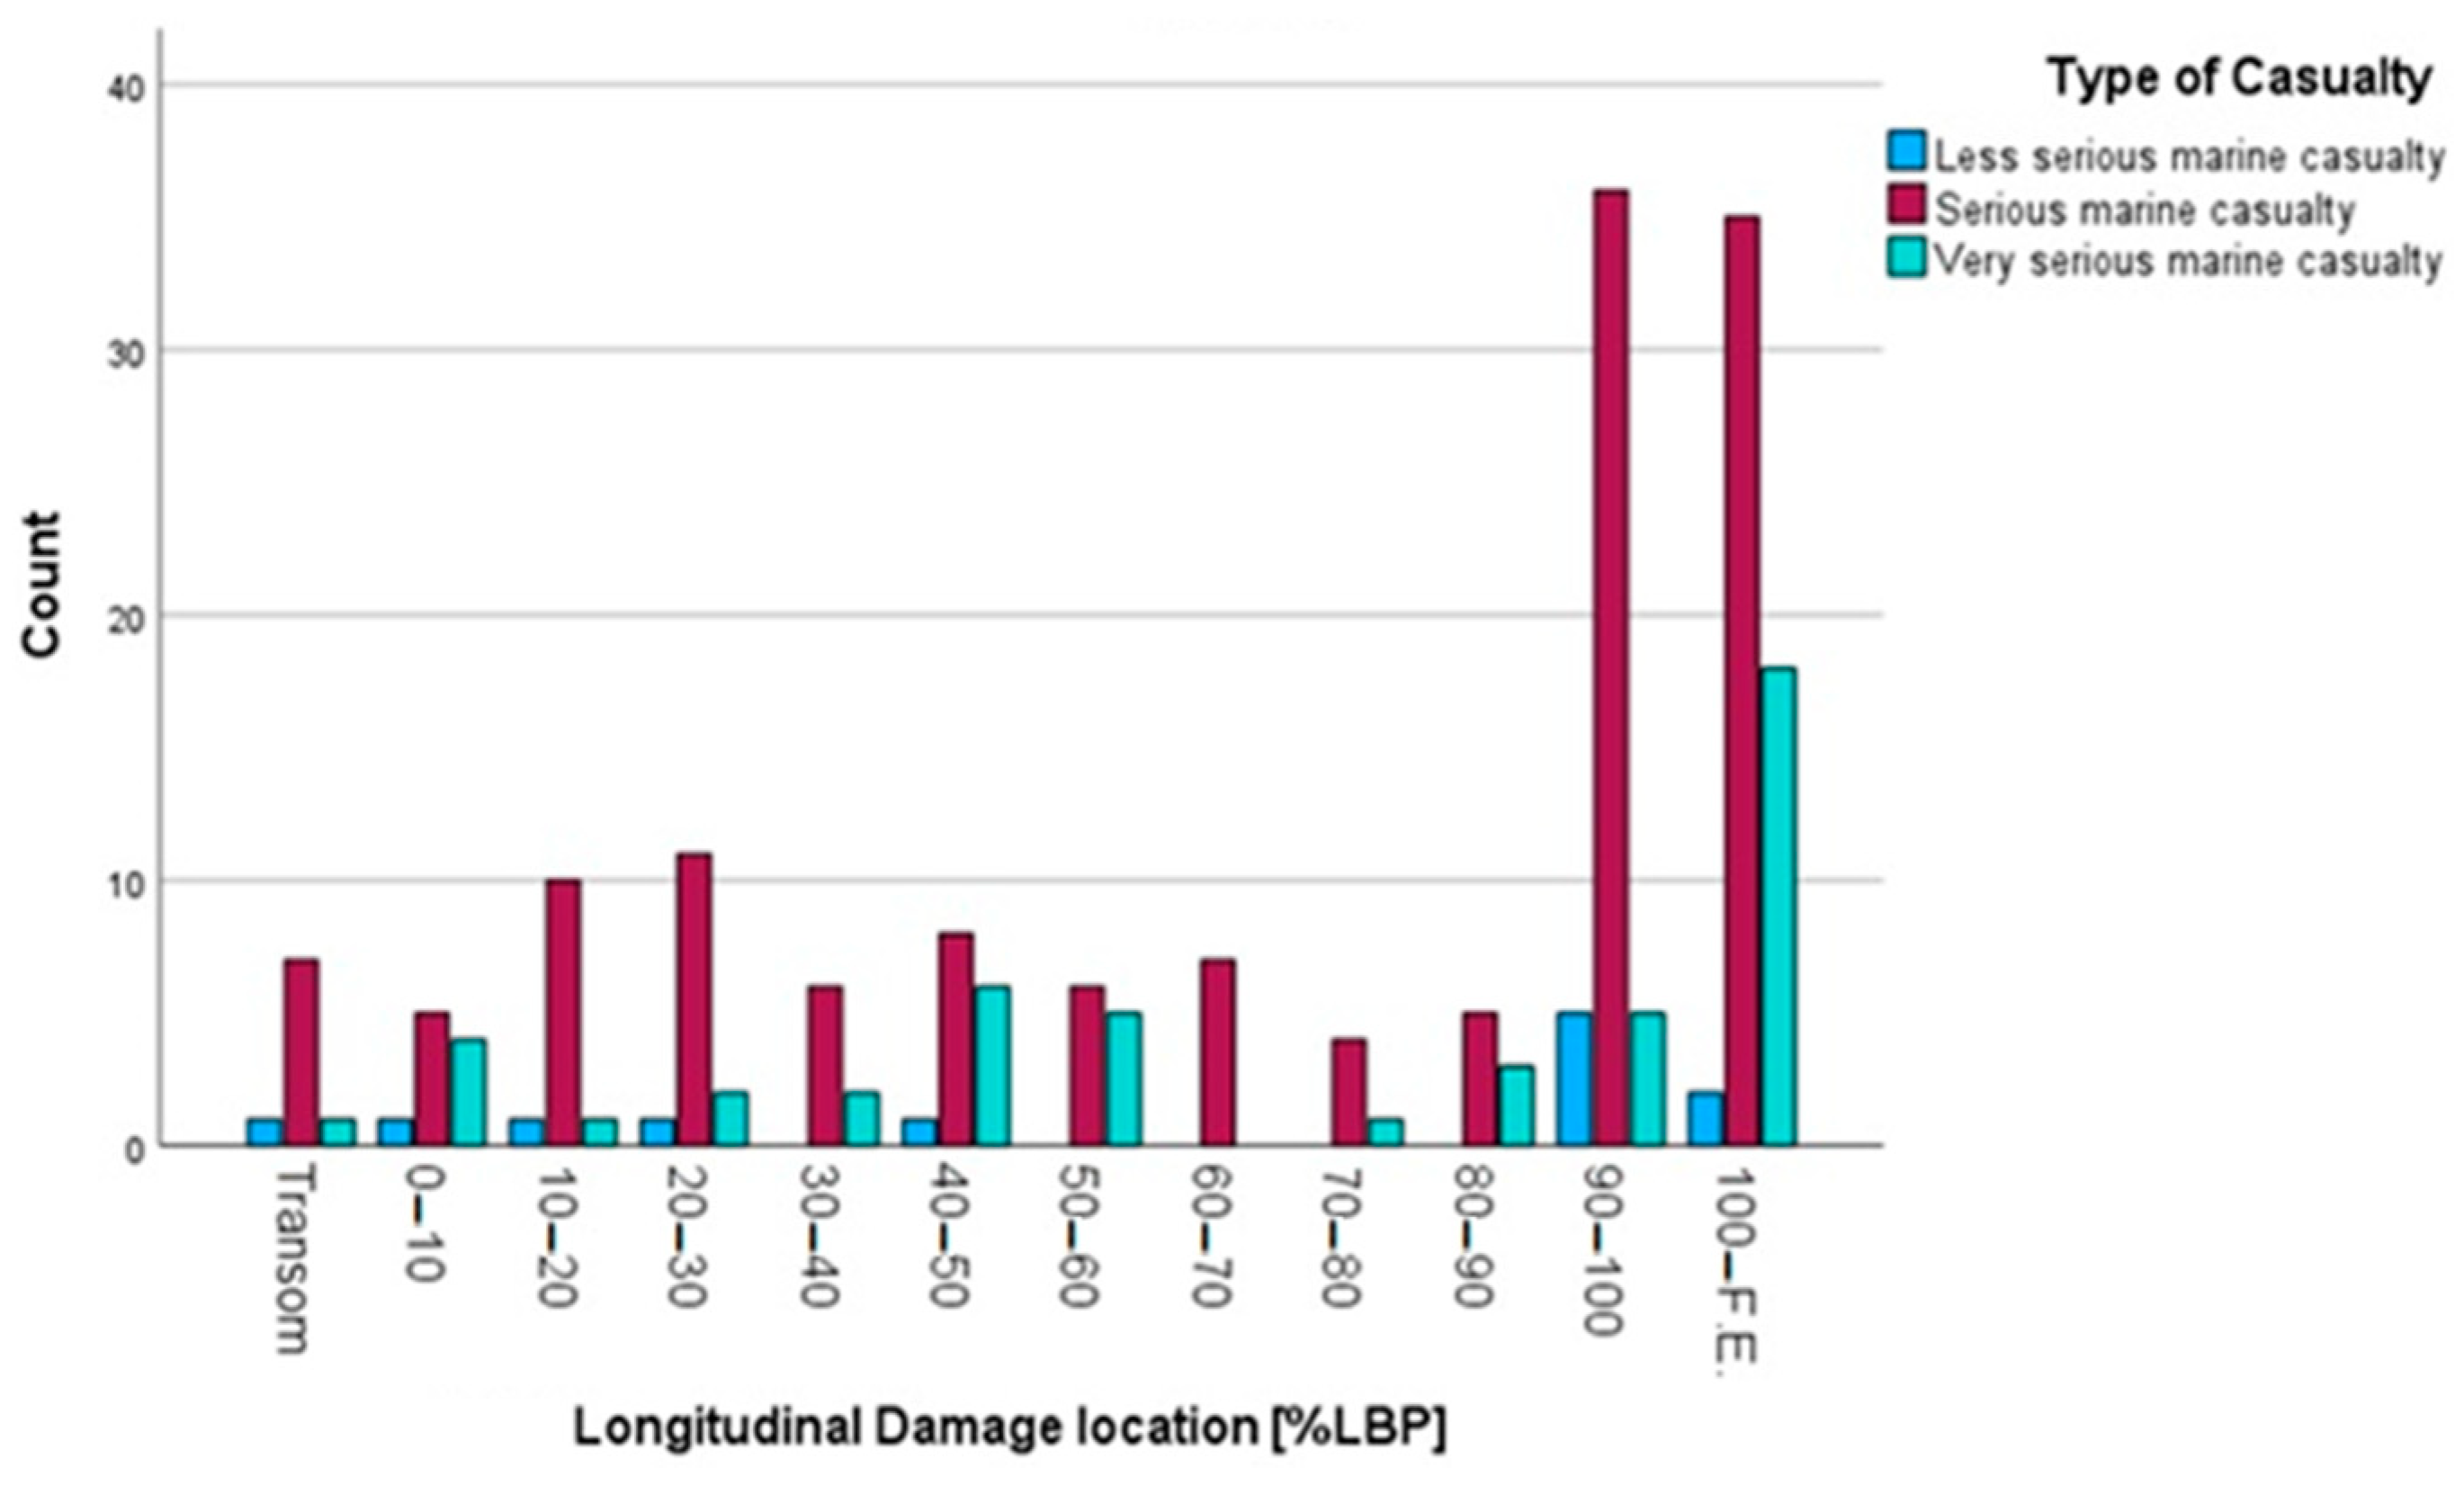
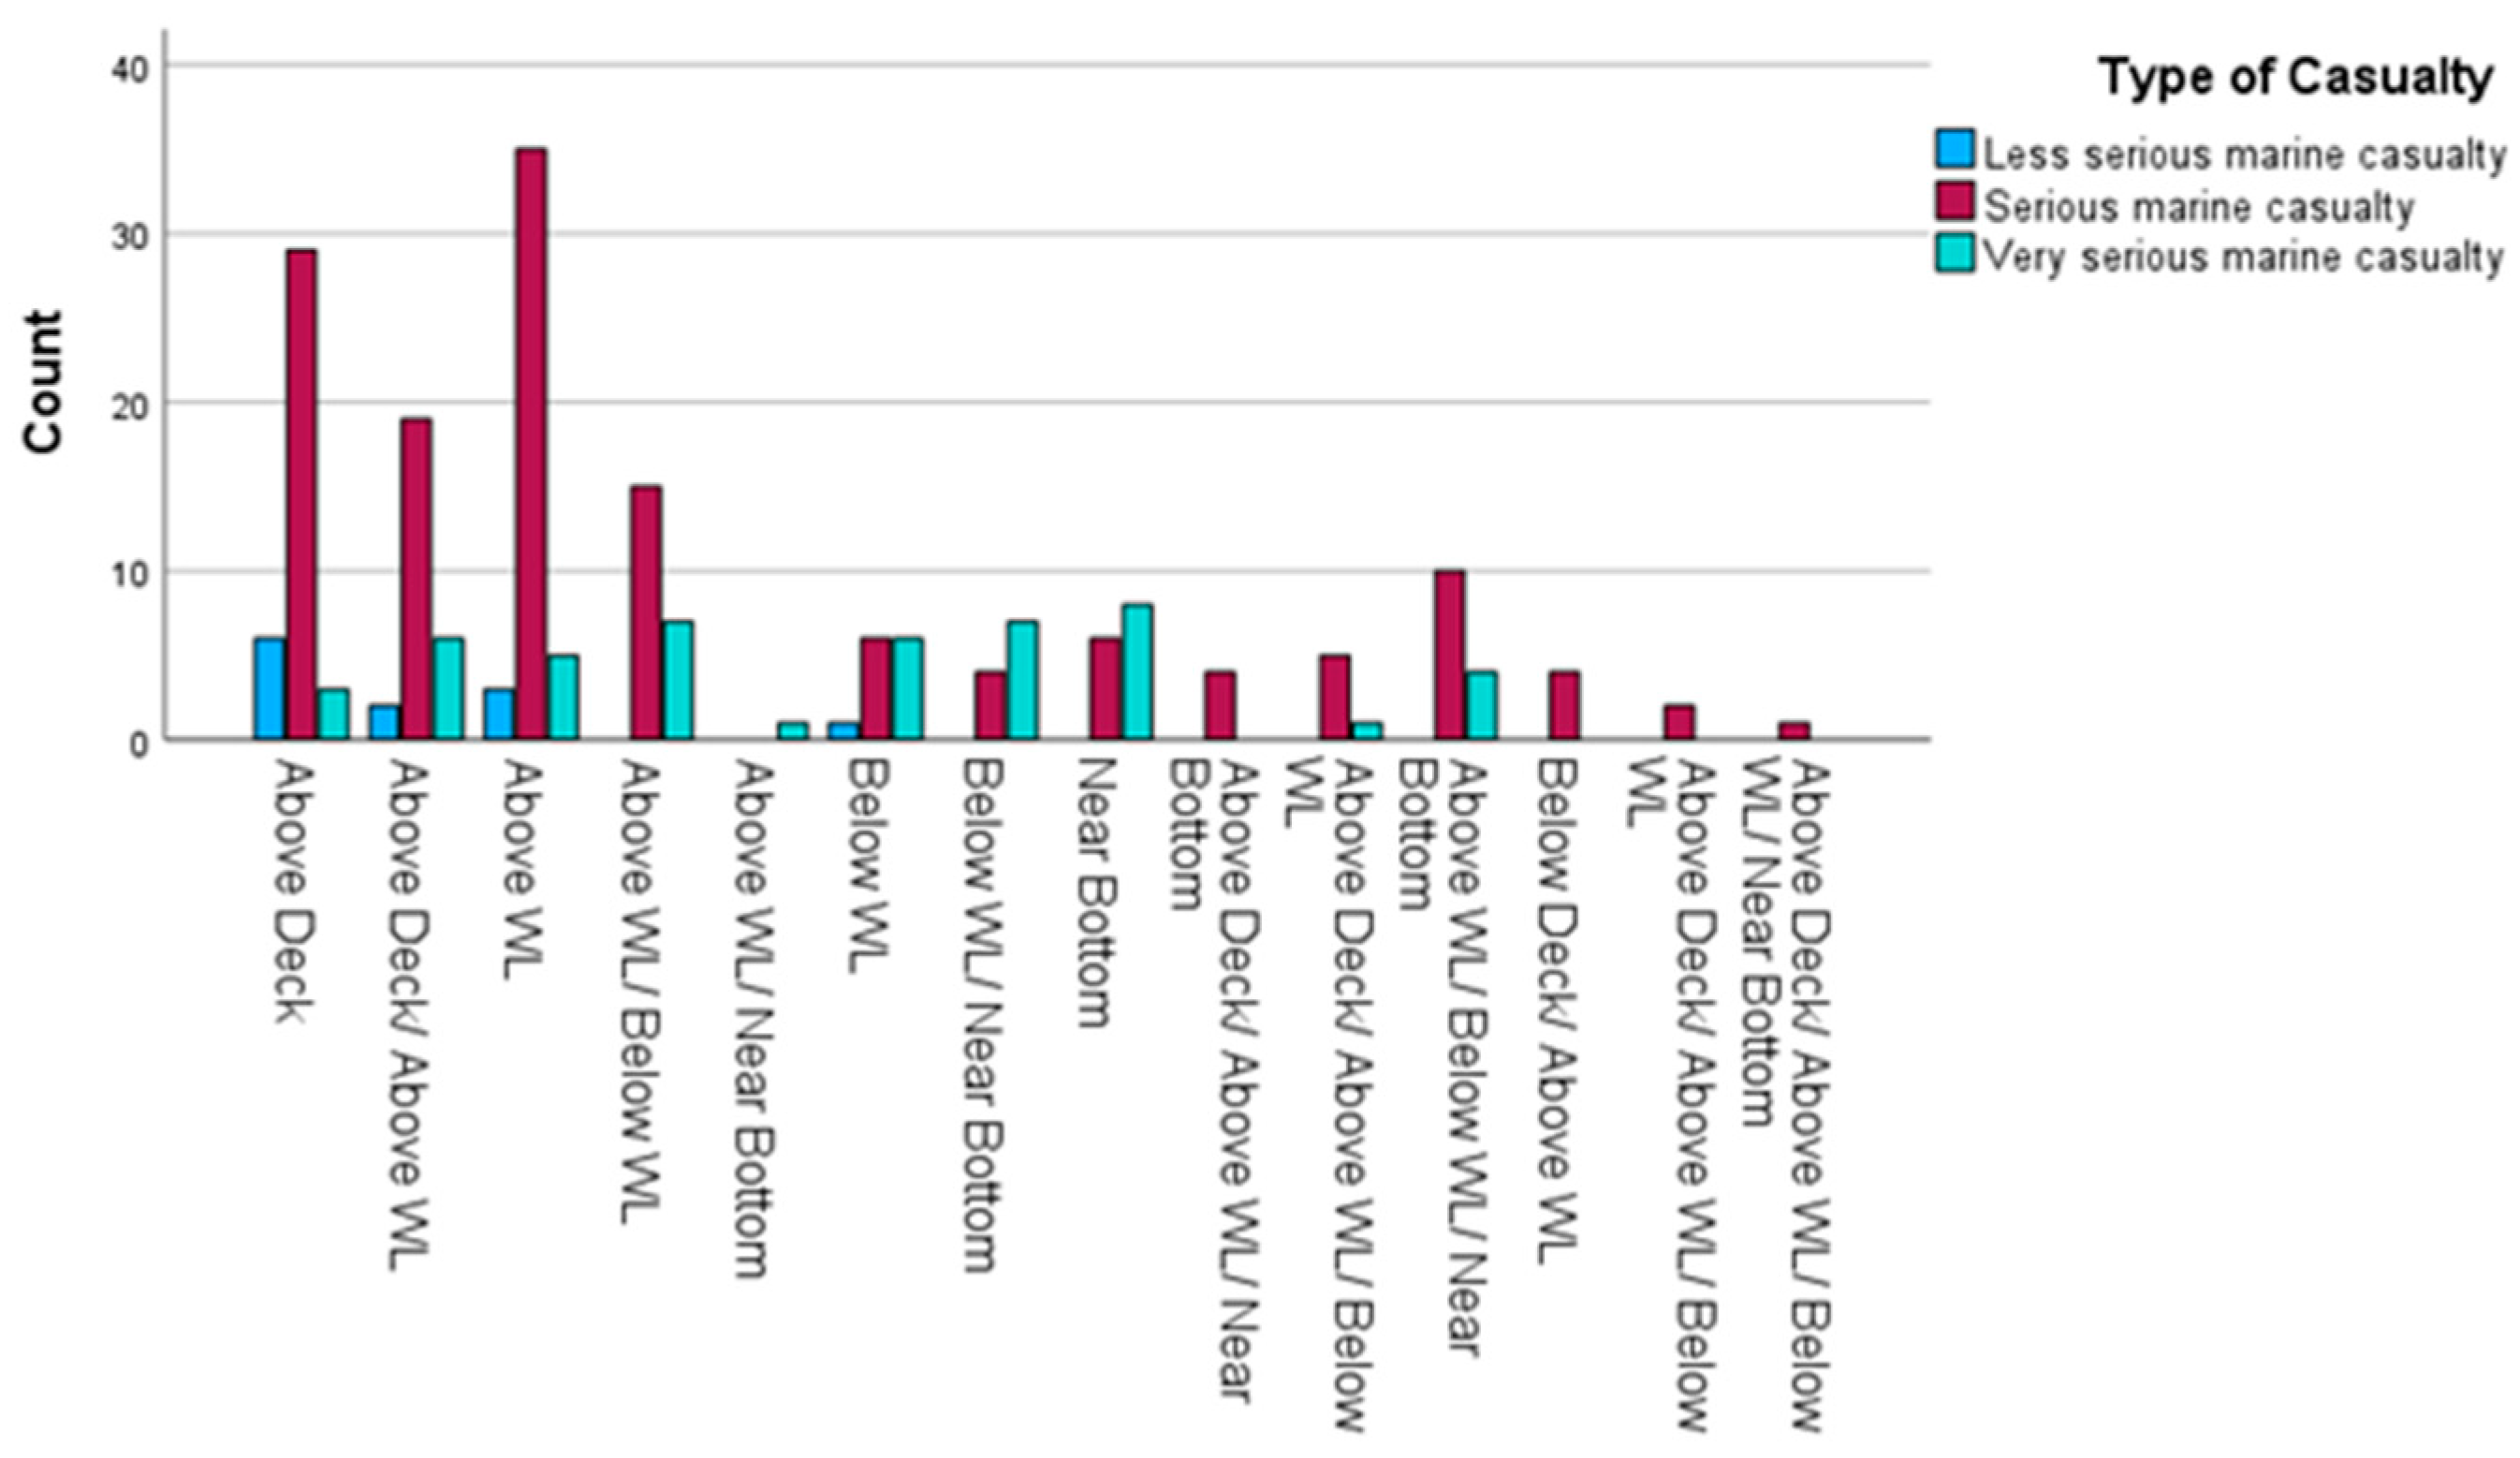
- Less serious marine casualty;
- -
- Serious marine casualty;
- -
- Very serious marine casualty.
3.7. Cause of Accident
- -
- Engineering failure (propulsion, main engine, steering system, or anchor);
- -
- Crew’s operational mistake;
- -
- Navigational device failure (ECDIS Electronic Chart Display and Information Systems faults);
- -
- Environmental conditions (extreme weather conditions such as high-speed winds/waves, heavy fog and high tides, including the squat effect);
- -
- Wrong maneuvering;
- -
- Contravention of rules (COLREGs—IMO, STCW—IMO, MLC—ILO and SOLAS conversion);
- -
- Inappropriate loading.
3.8. Conditions during the Accident
4. Results
4.1. Statistical Data Analysis—Frequency Analysis (Percentages)
4.2. Correlation Analysis and Chi-Square Tests
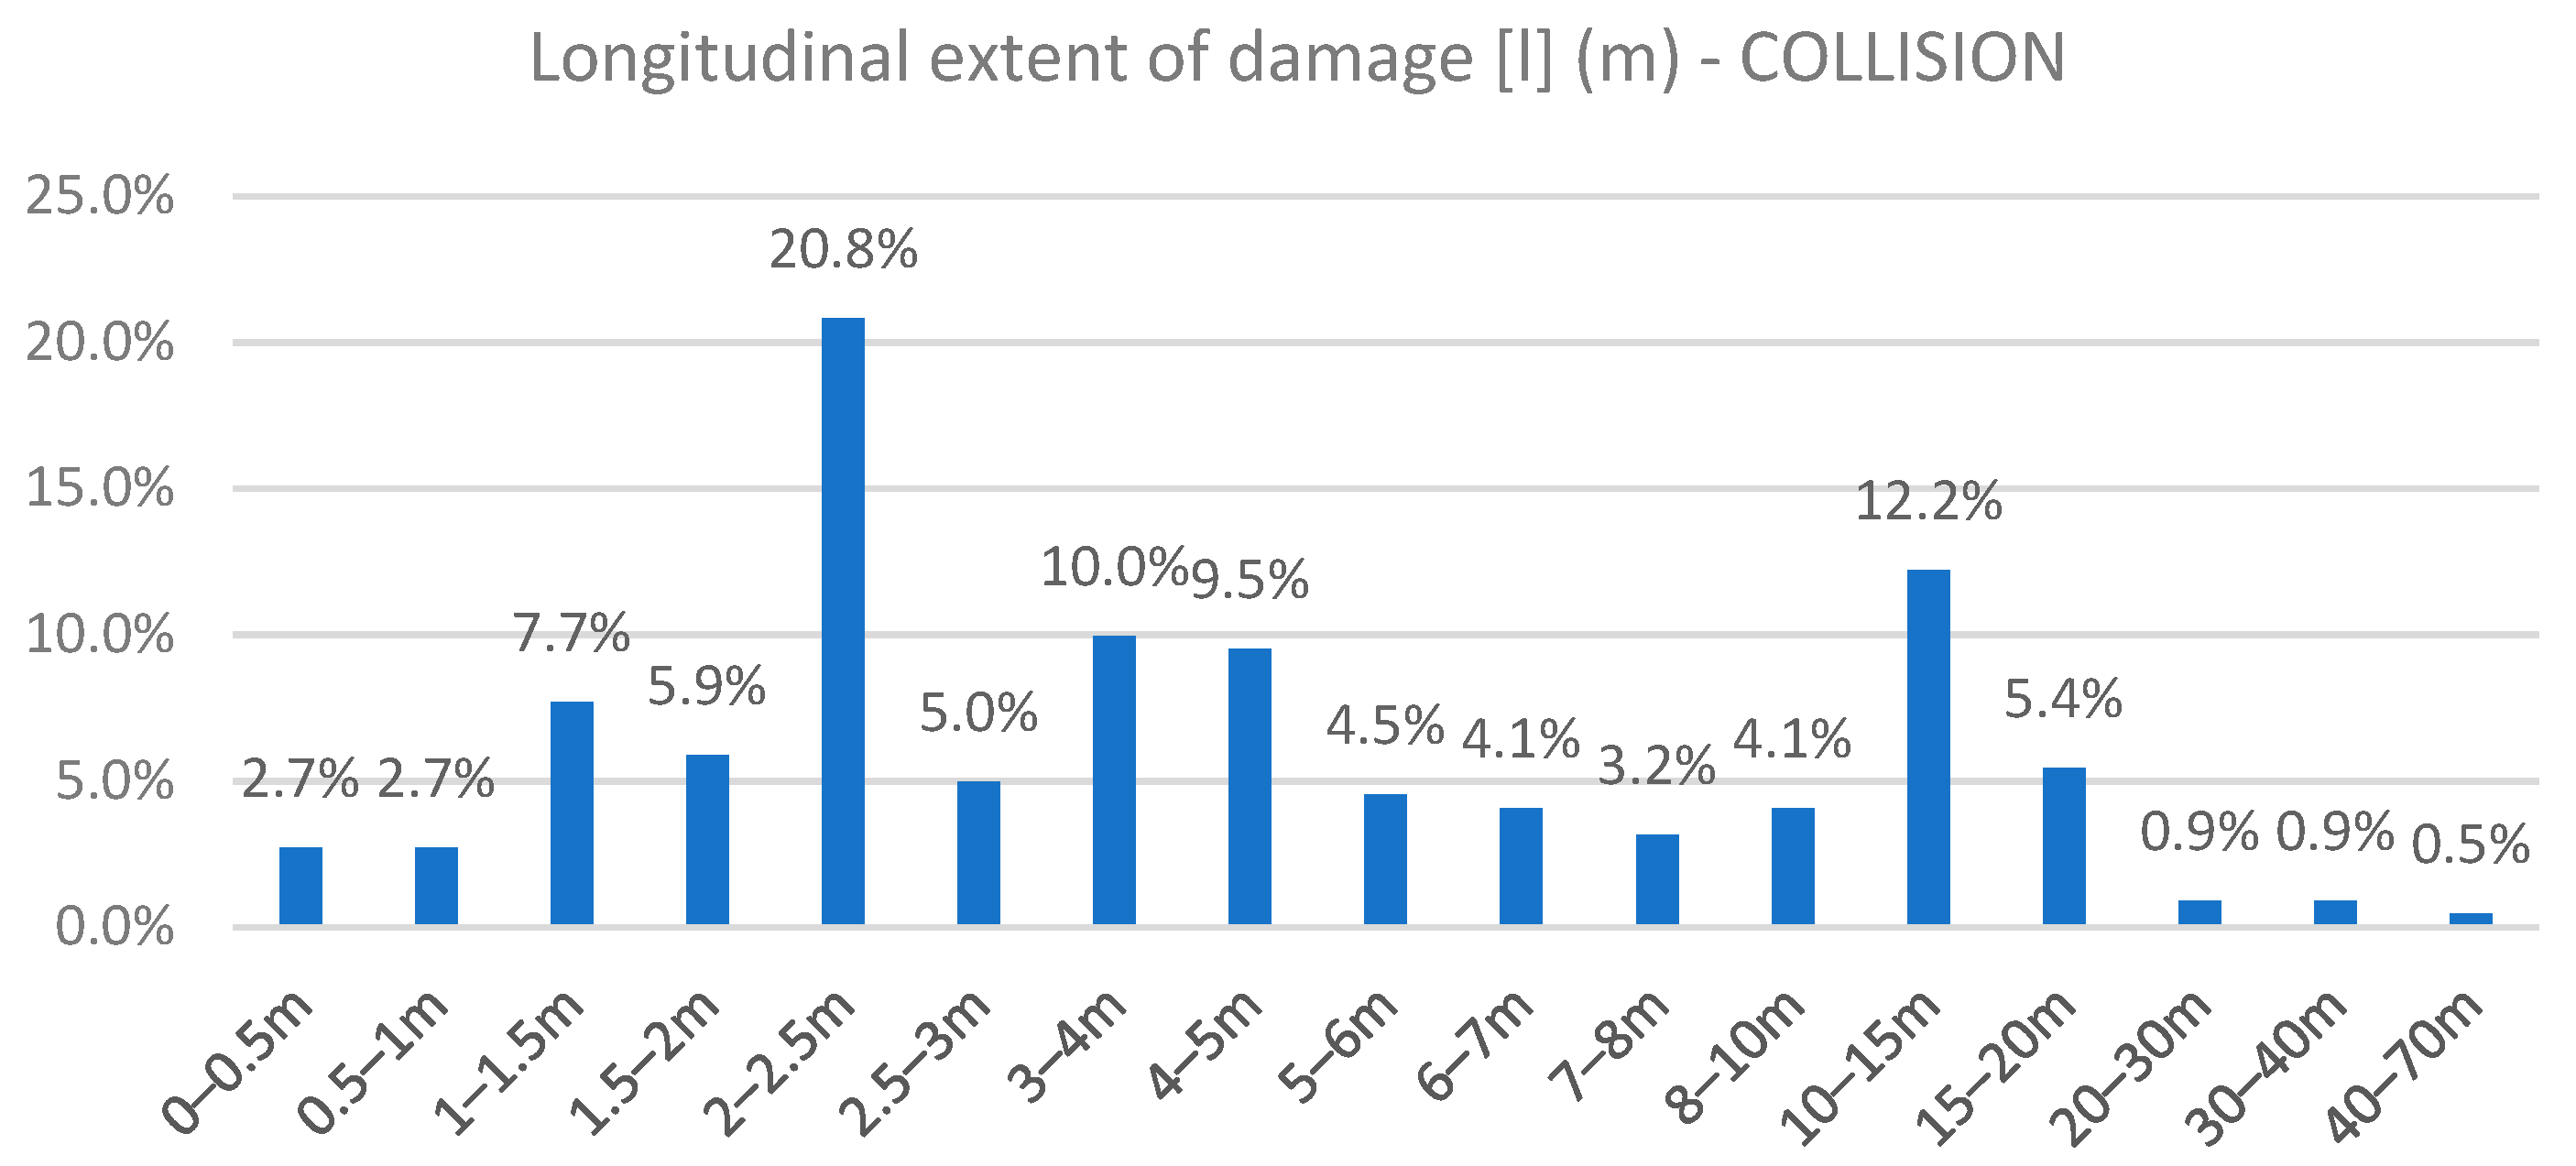
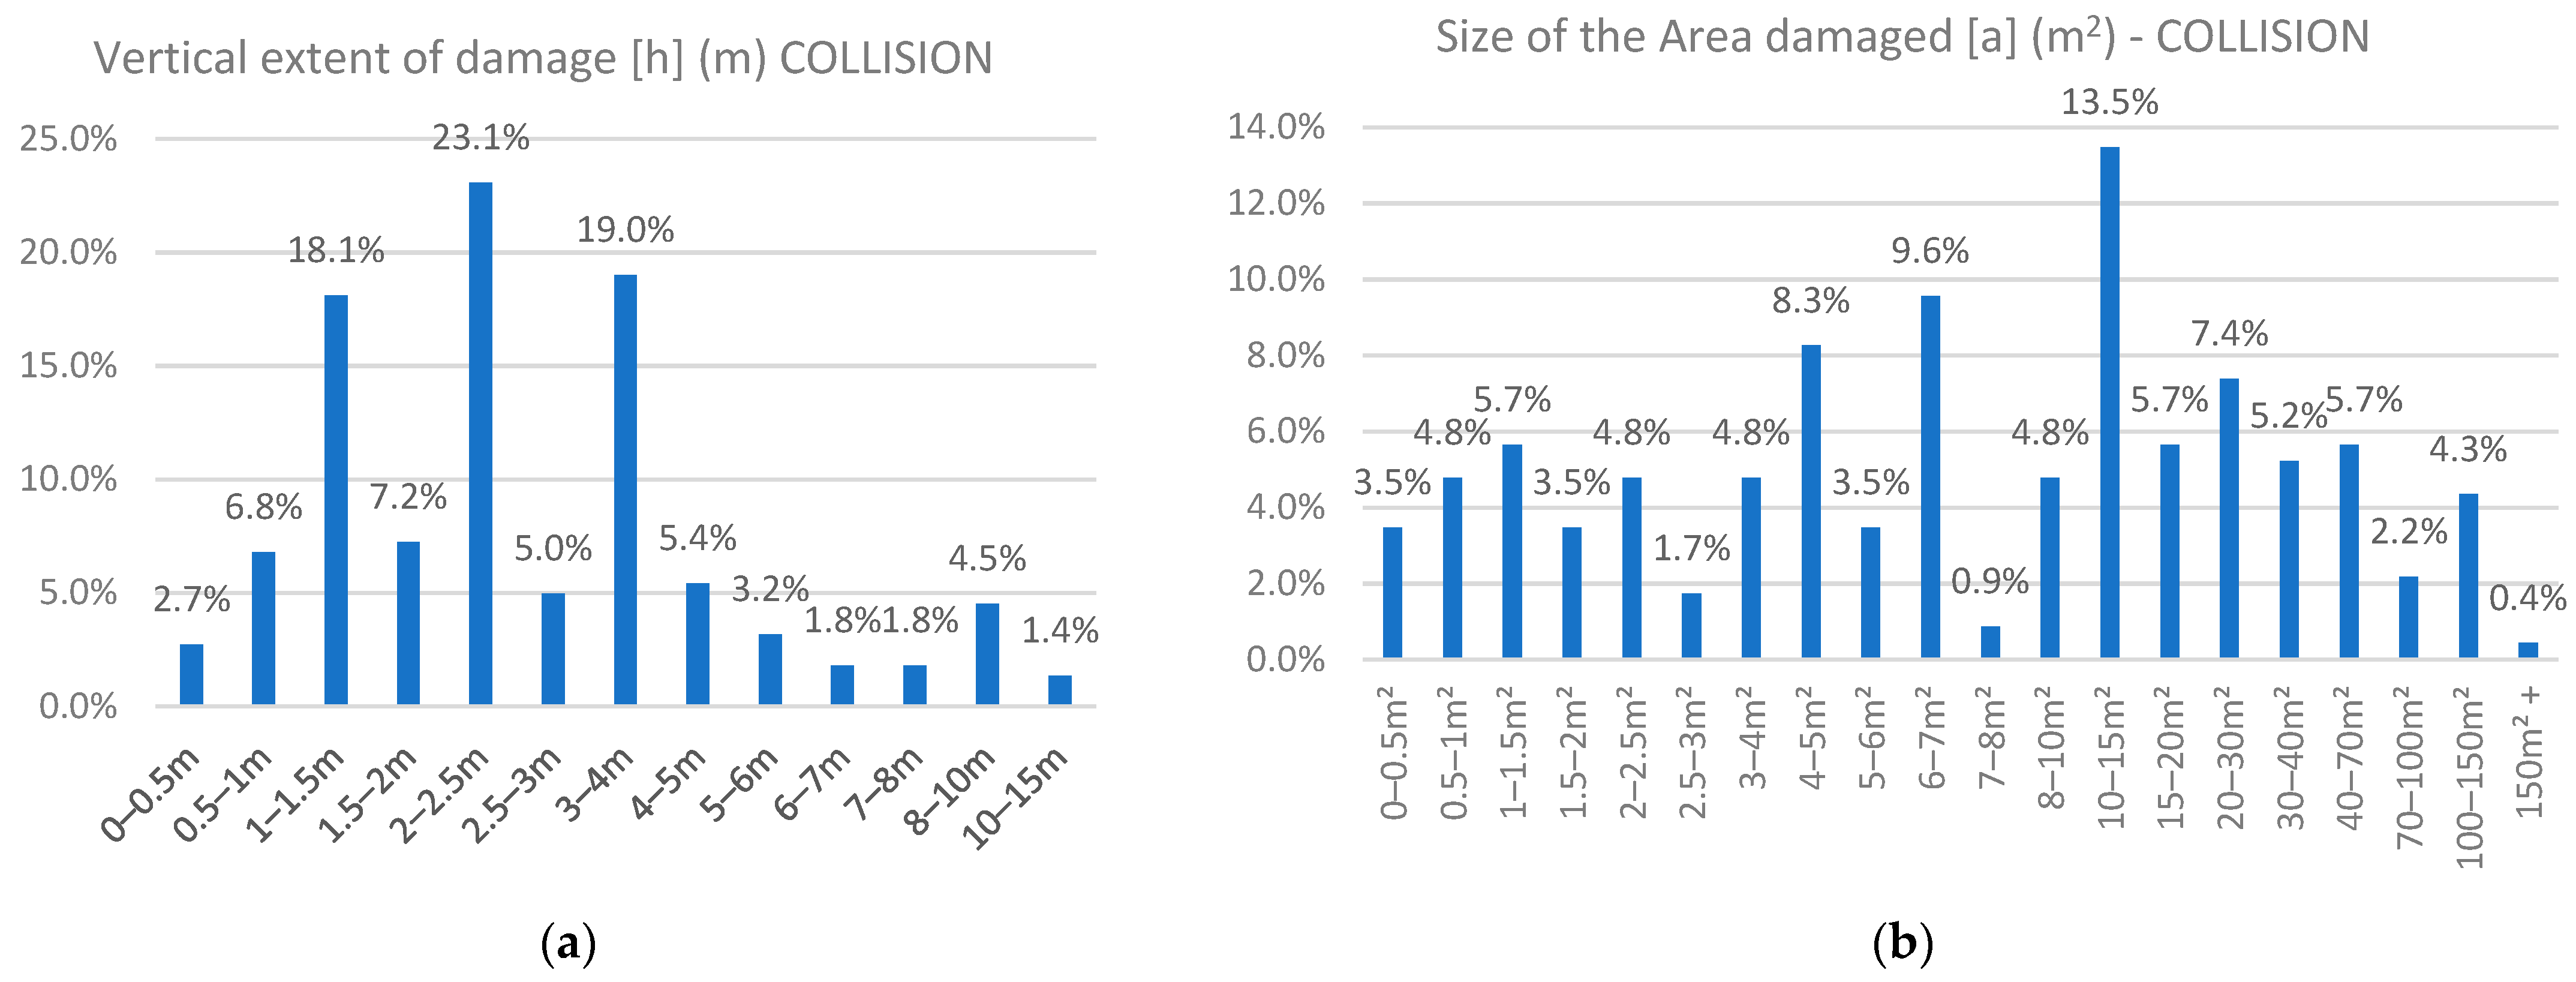
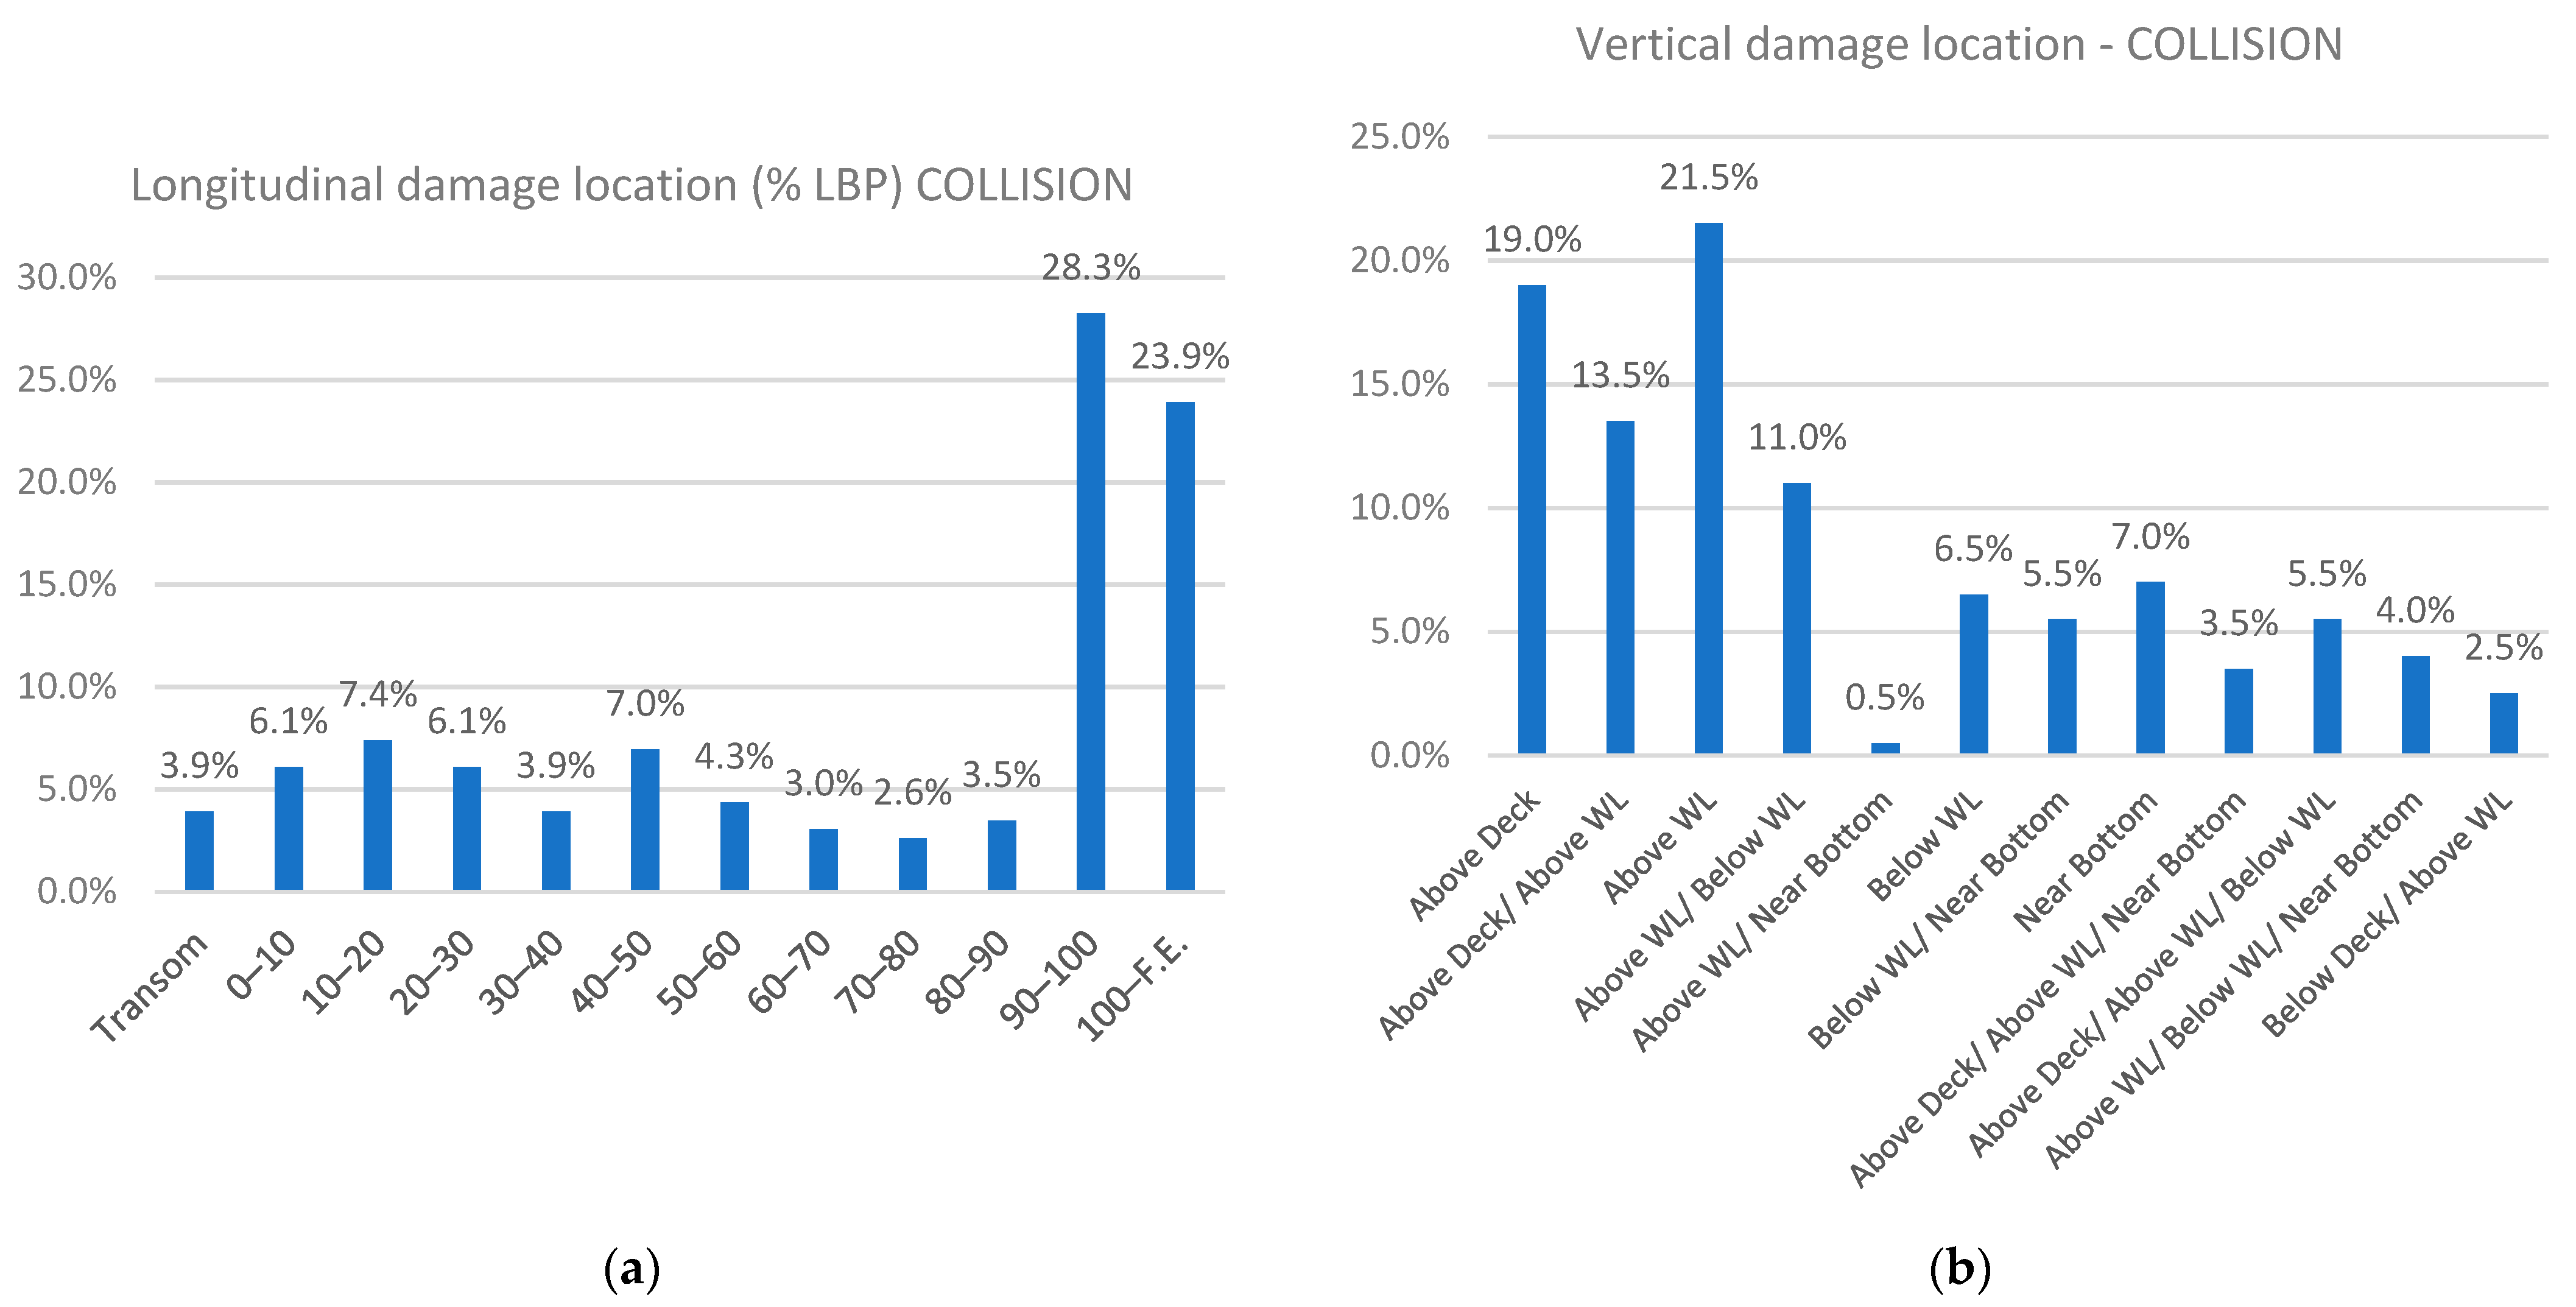
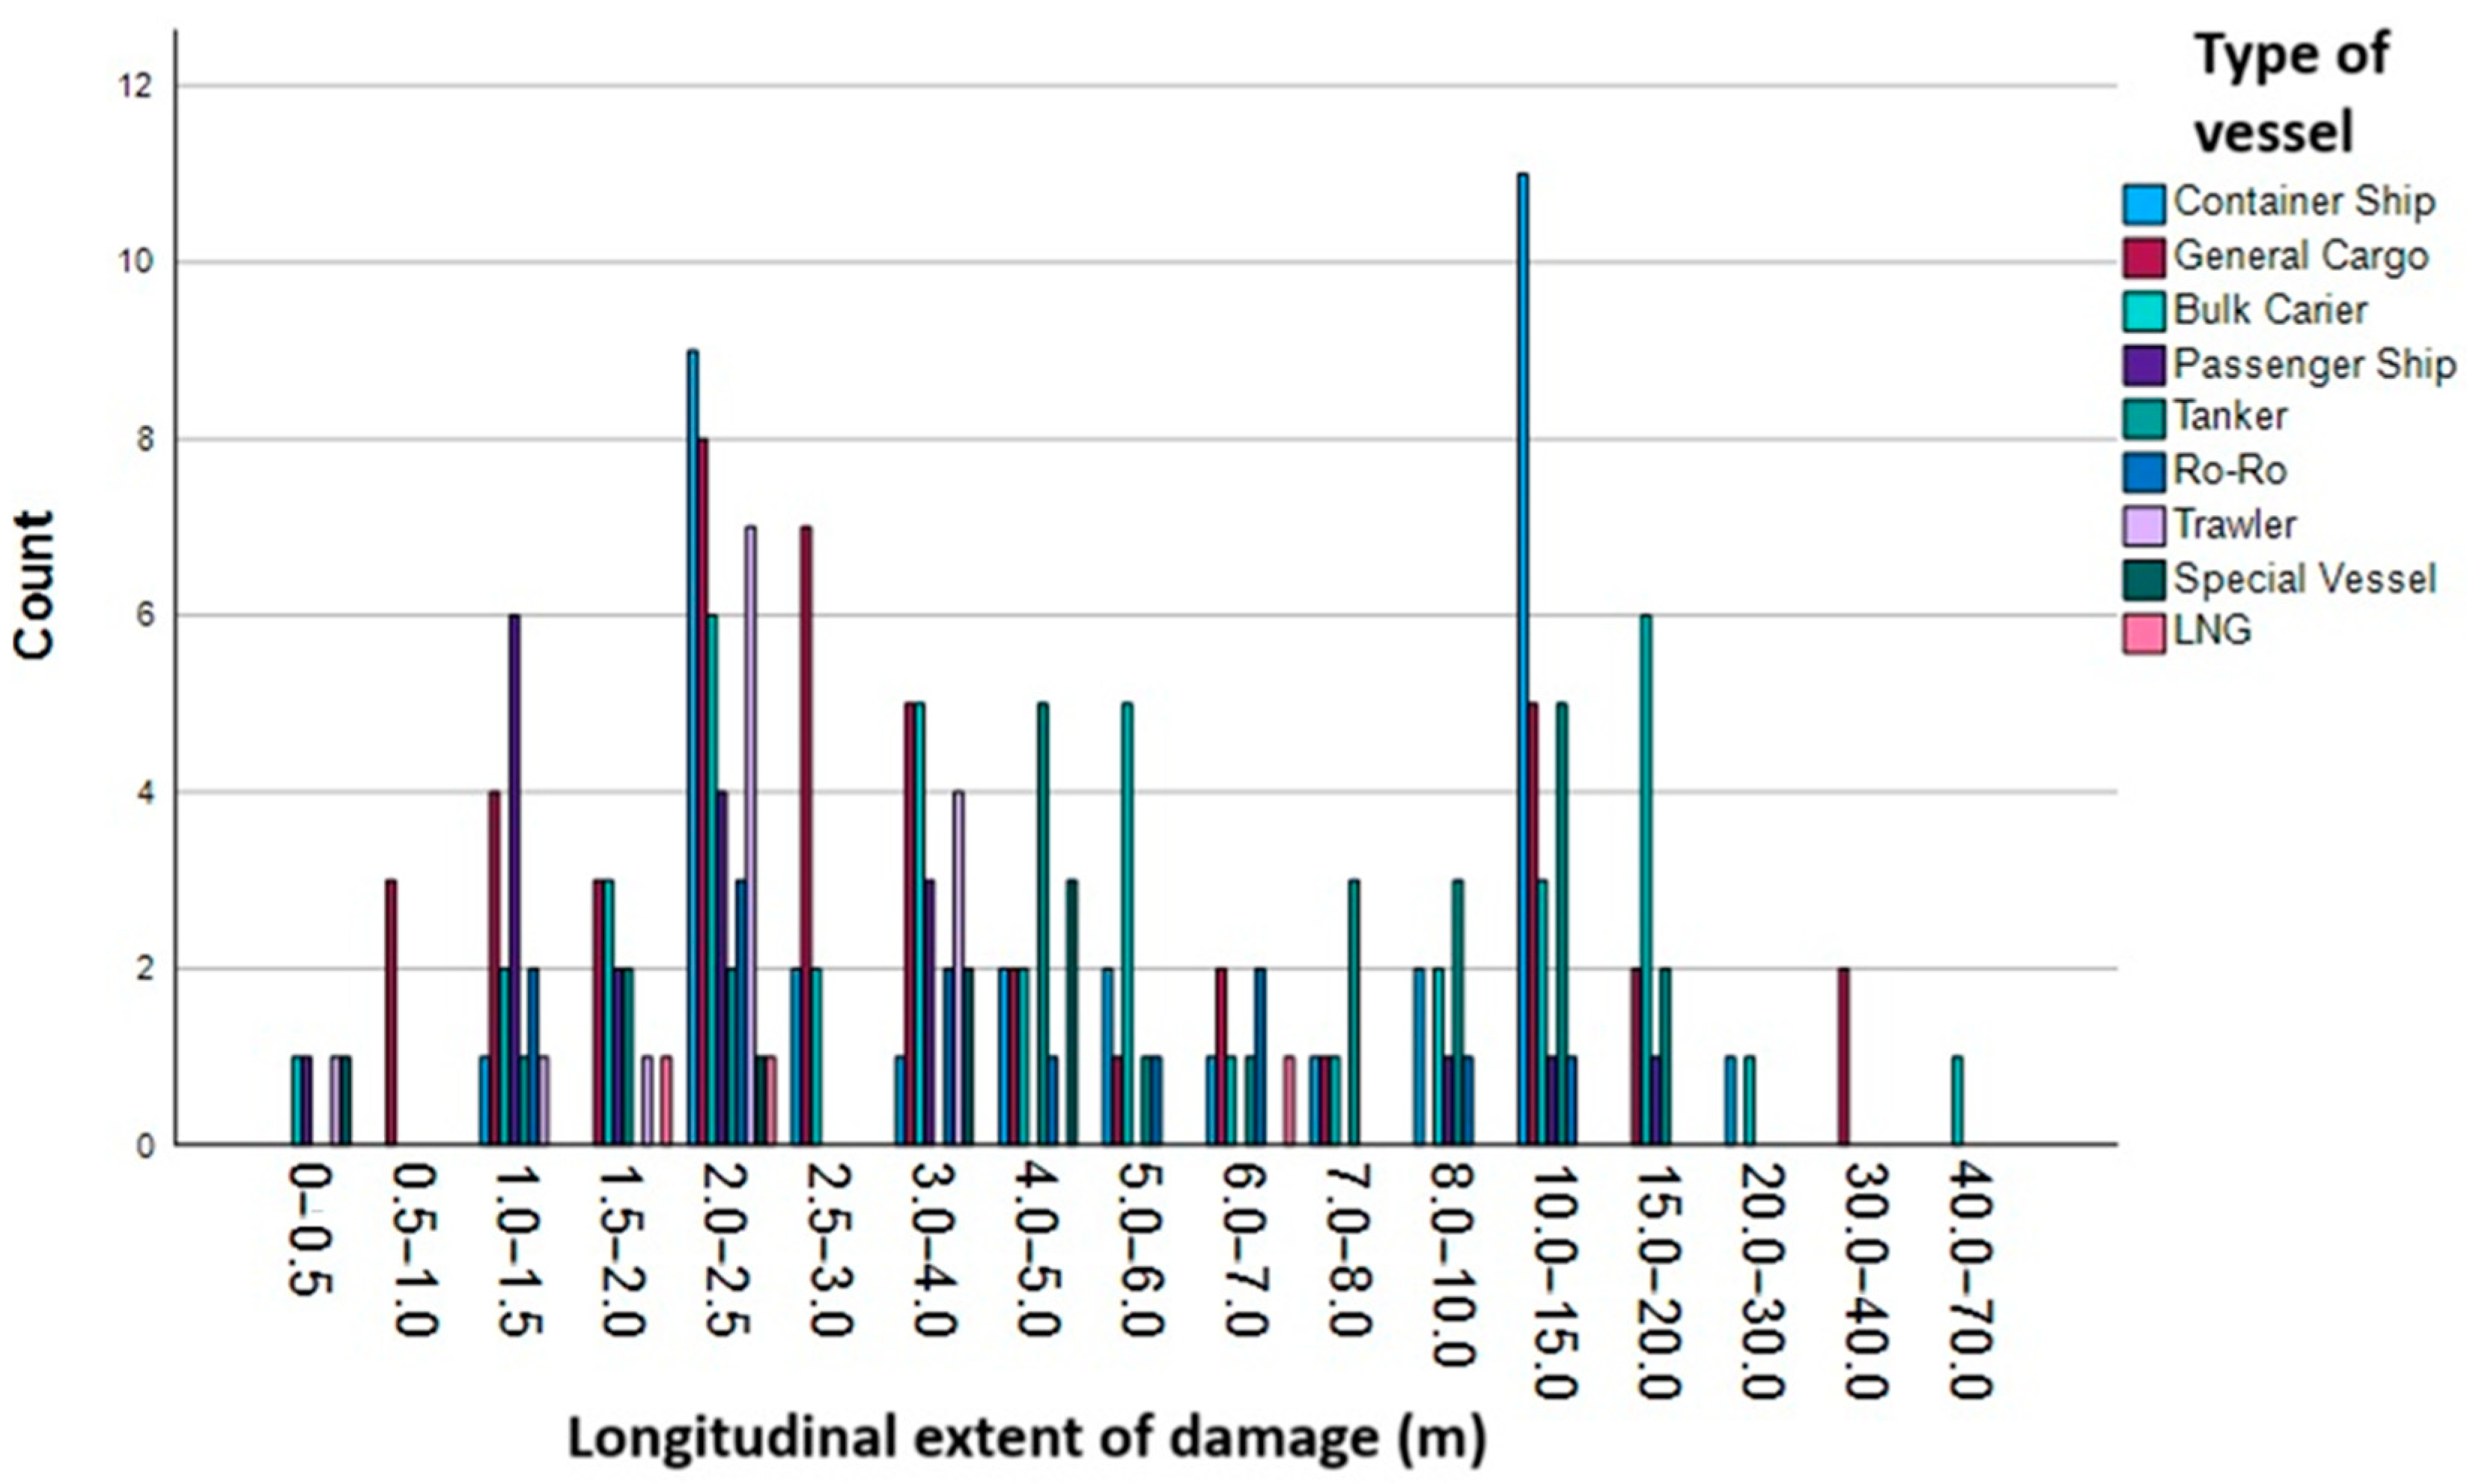
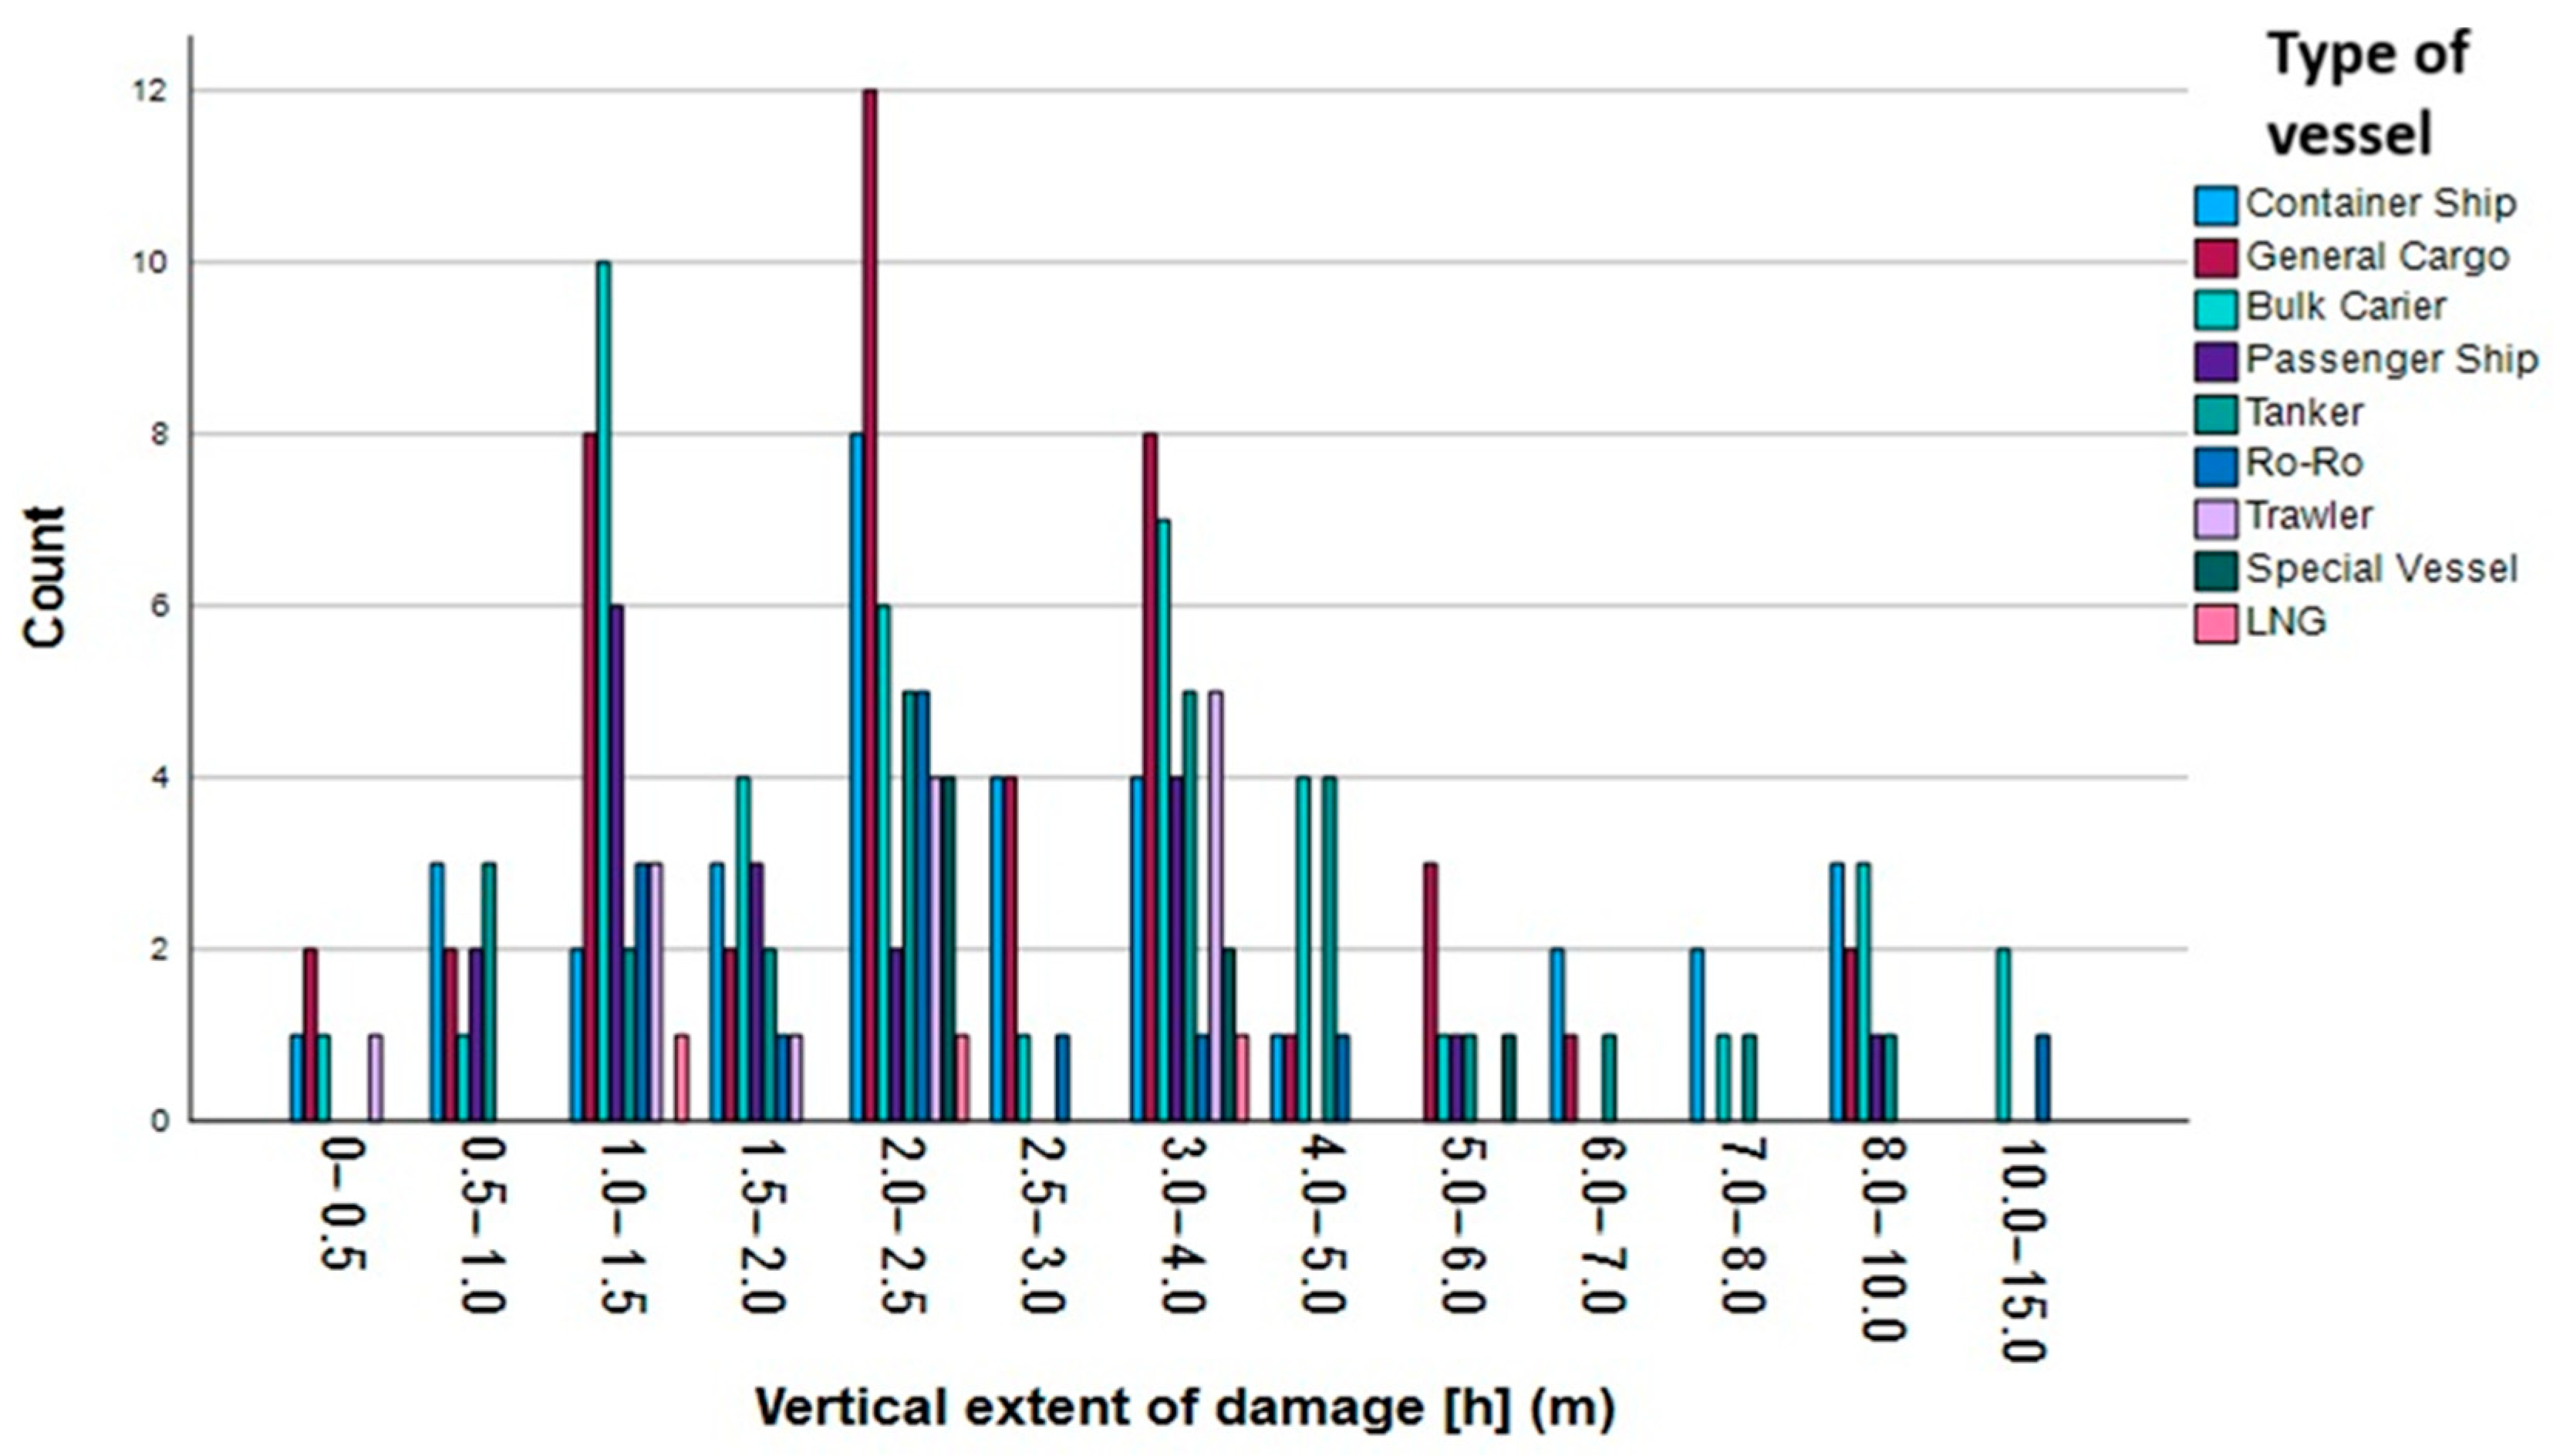
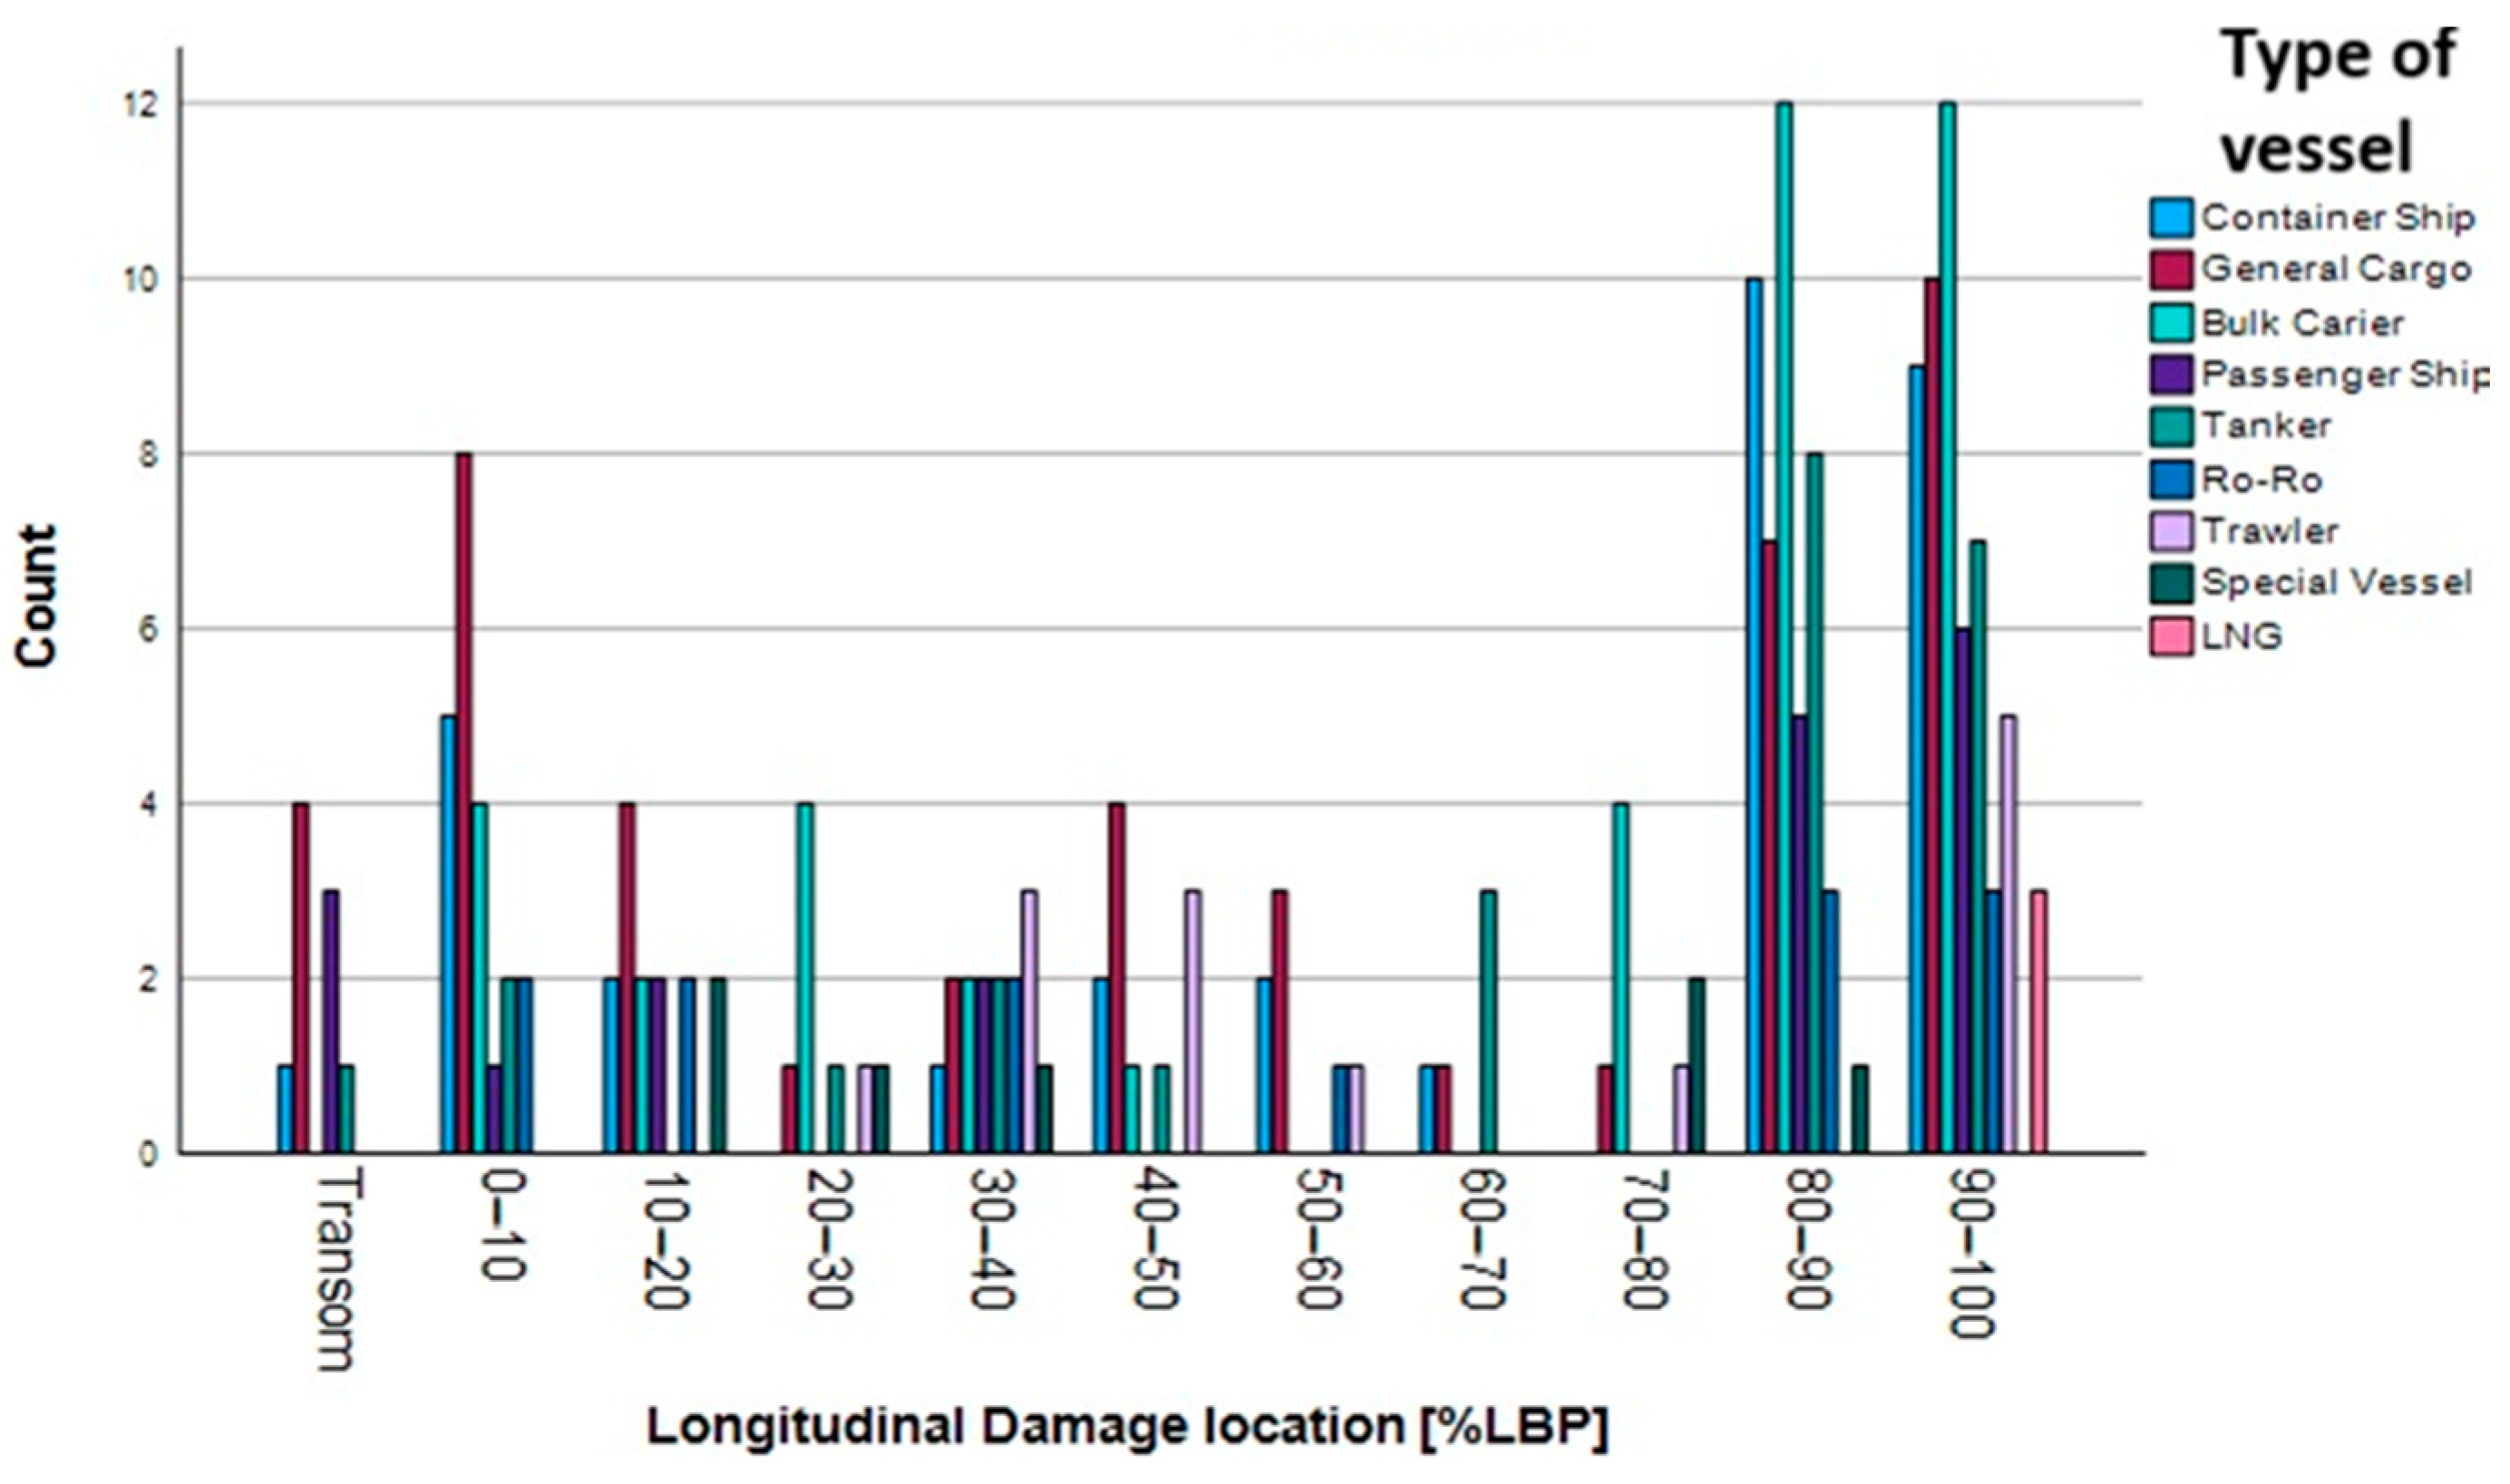
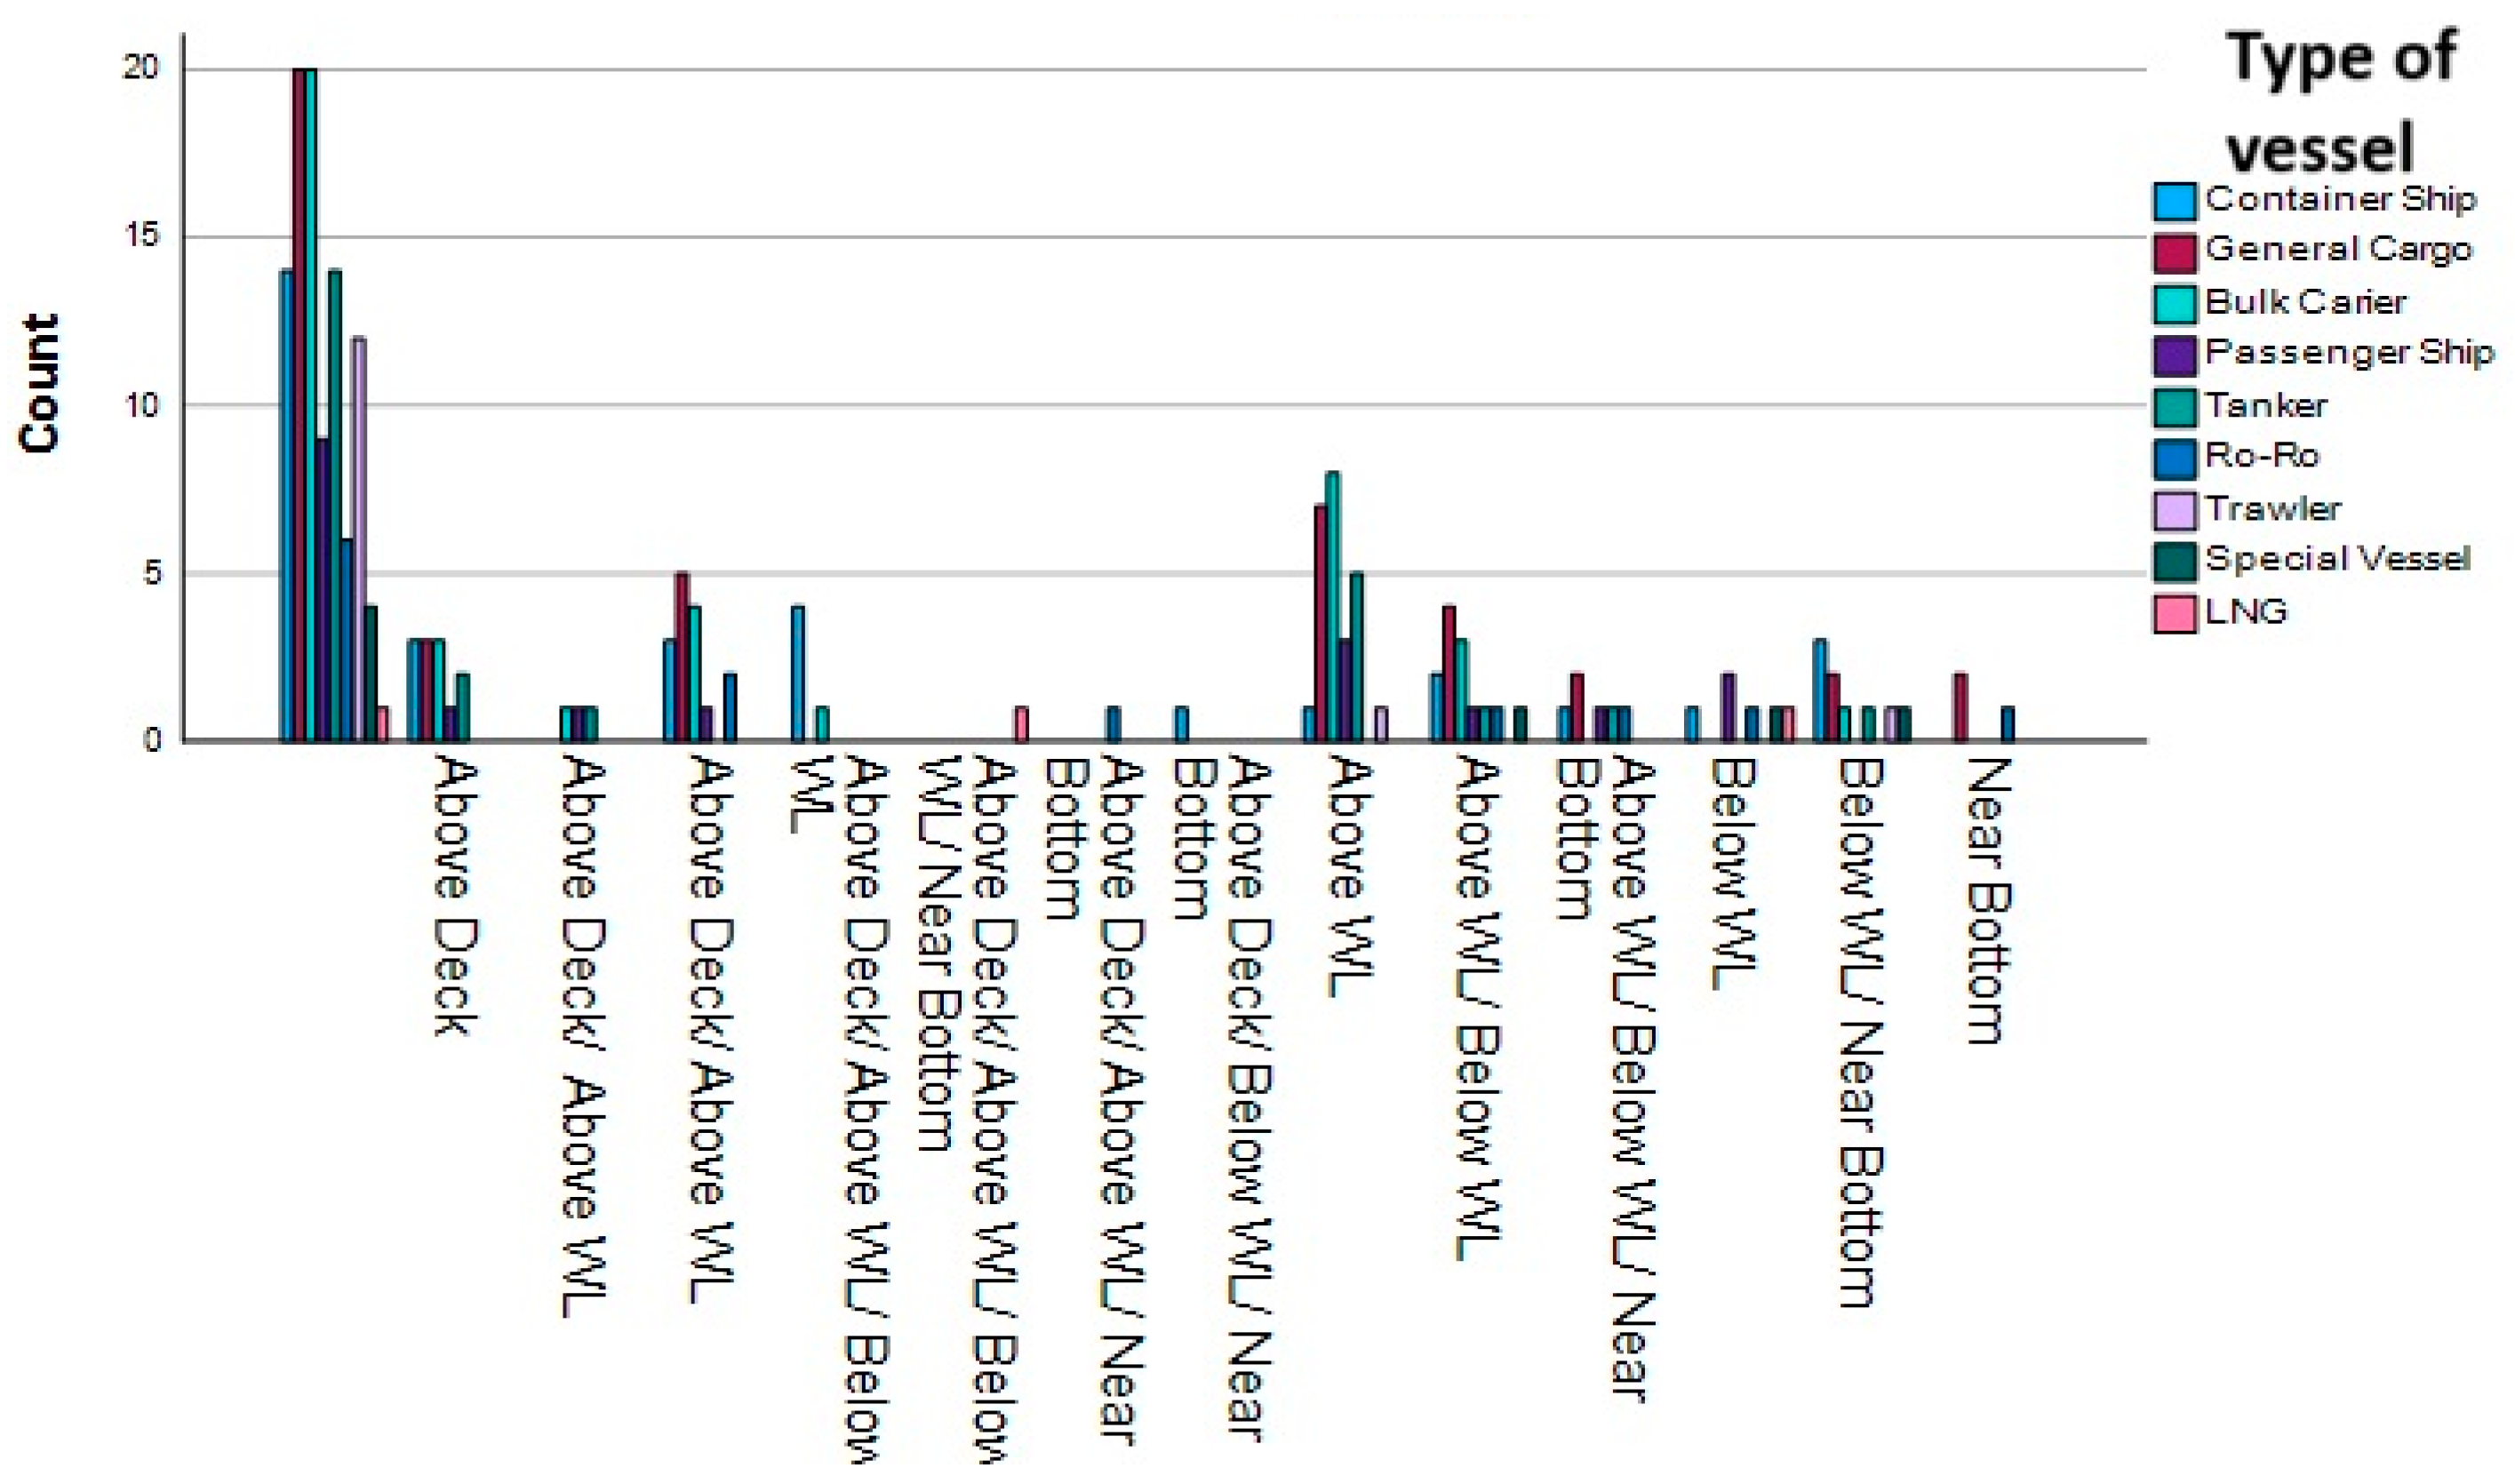
4.2.1. Collision
- -
- Longitudinal extent of damage: 10 m–15 m; ship type: containers;
- -
- Vertical extent of damage: 2 m–2.5 m; ship type: general cargo;
- -
- Vertical location: above deck; ship type: general cargo and bulk carrier;
- -
- Impact of accident: the damages were repaired; longitudinal location: 90–100% LBP;
- -
- Type of casualty: serious marine; longitudinal location: 90–100% LBP and 100%—FE;
- -
- Impact of accident: the damage was repaired; vertical damage location: above WL;
- -
- Type of casualty: serious marine; vertical damage location: above WL.
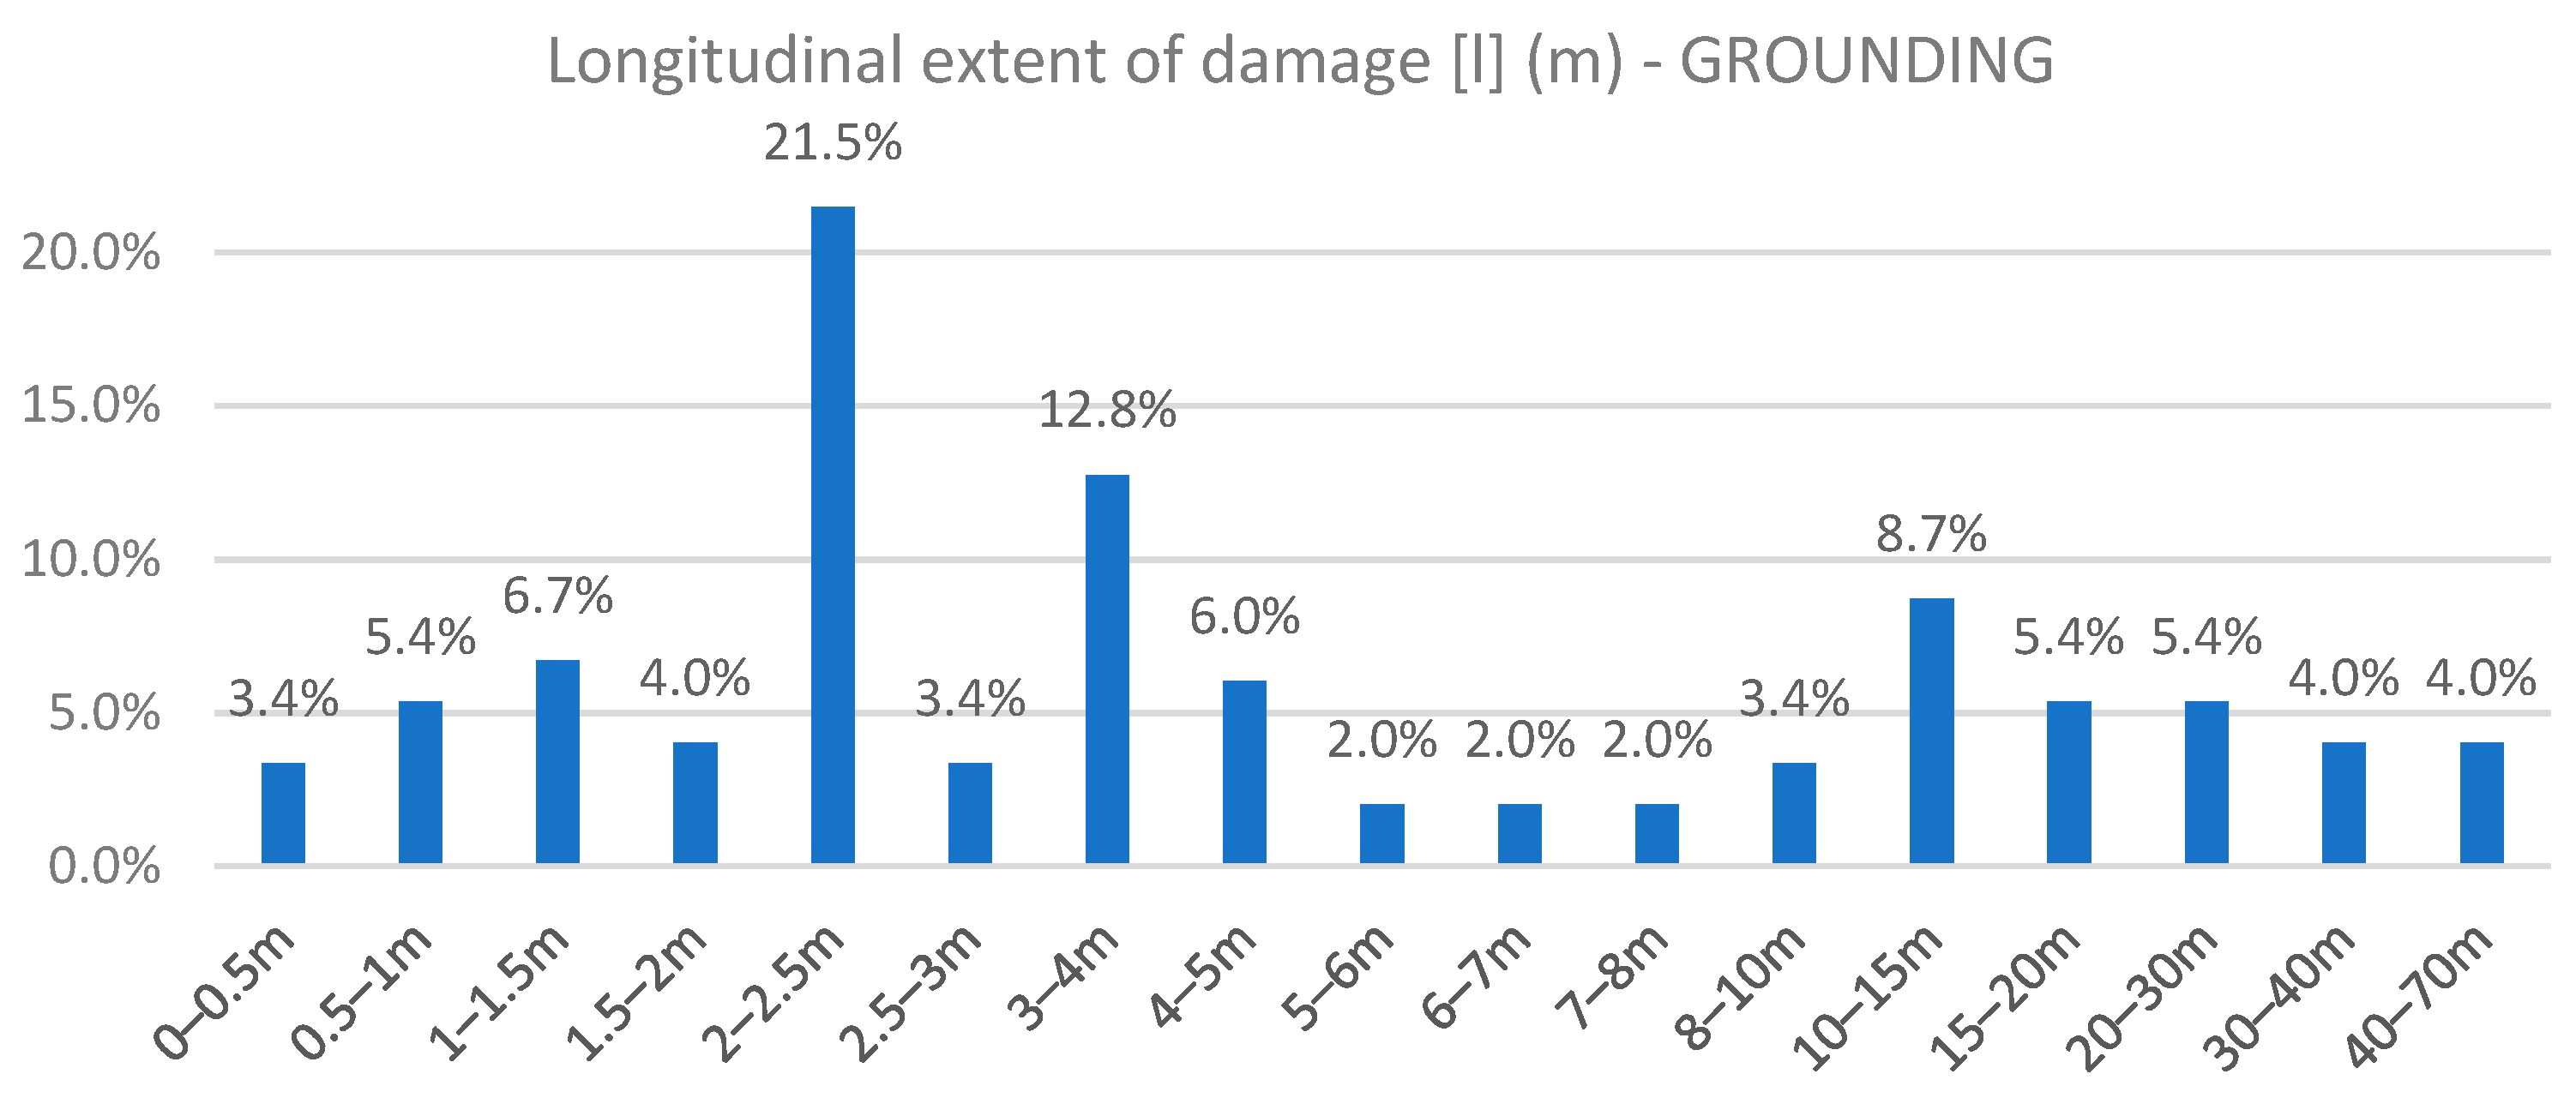
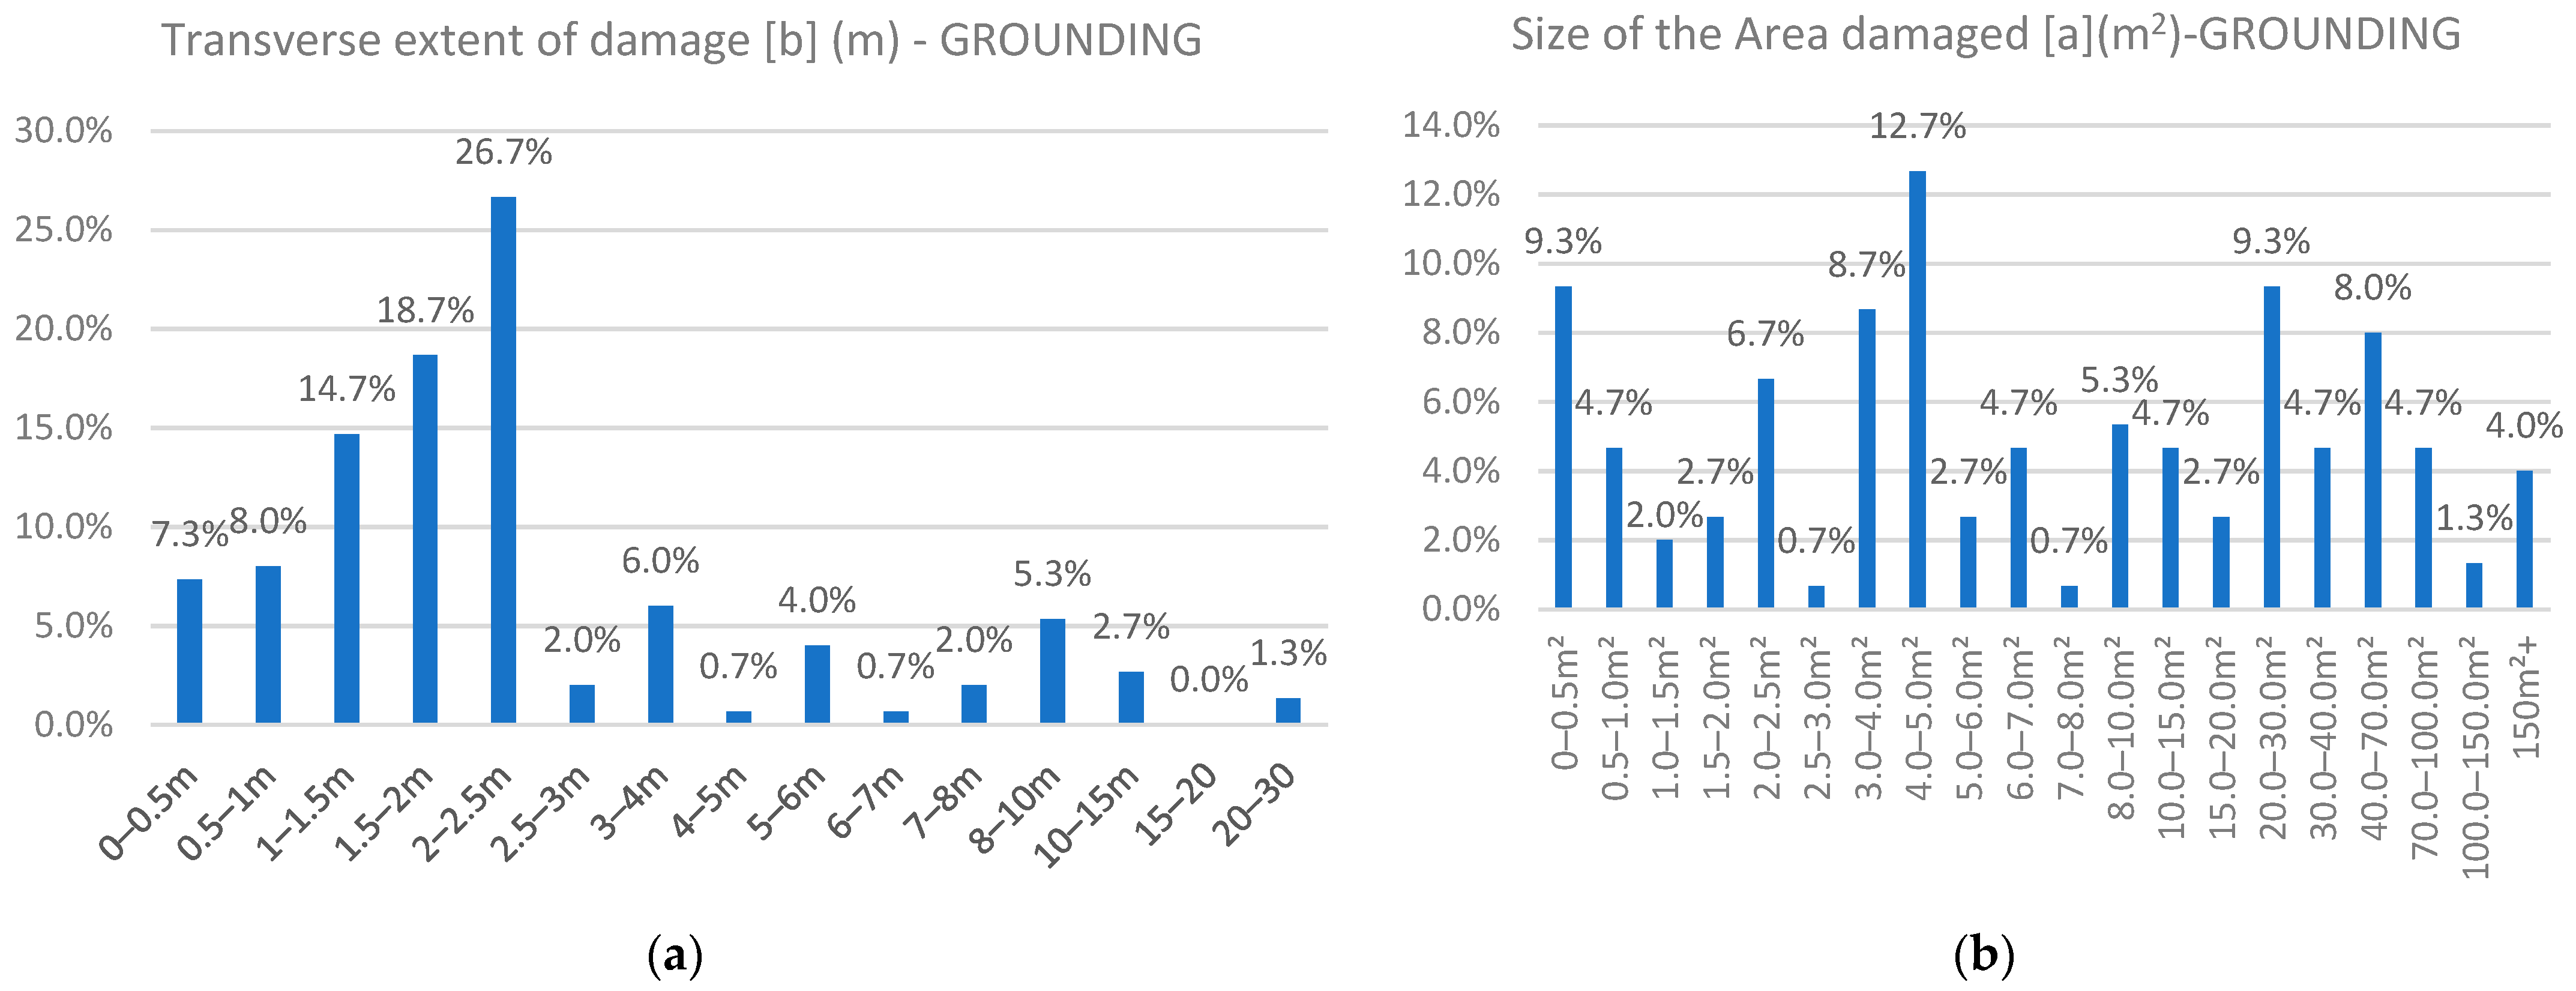
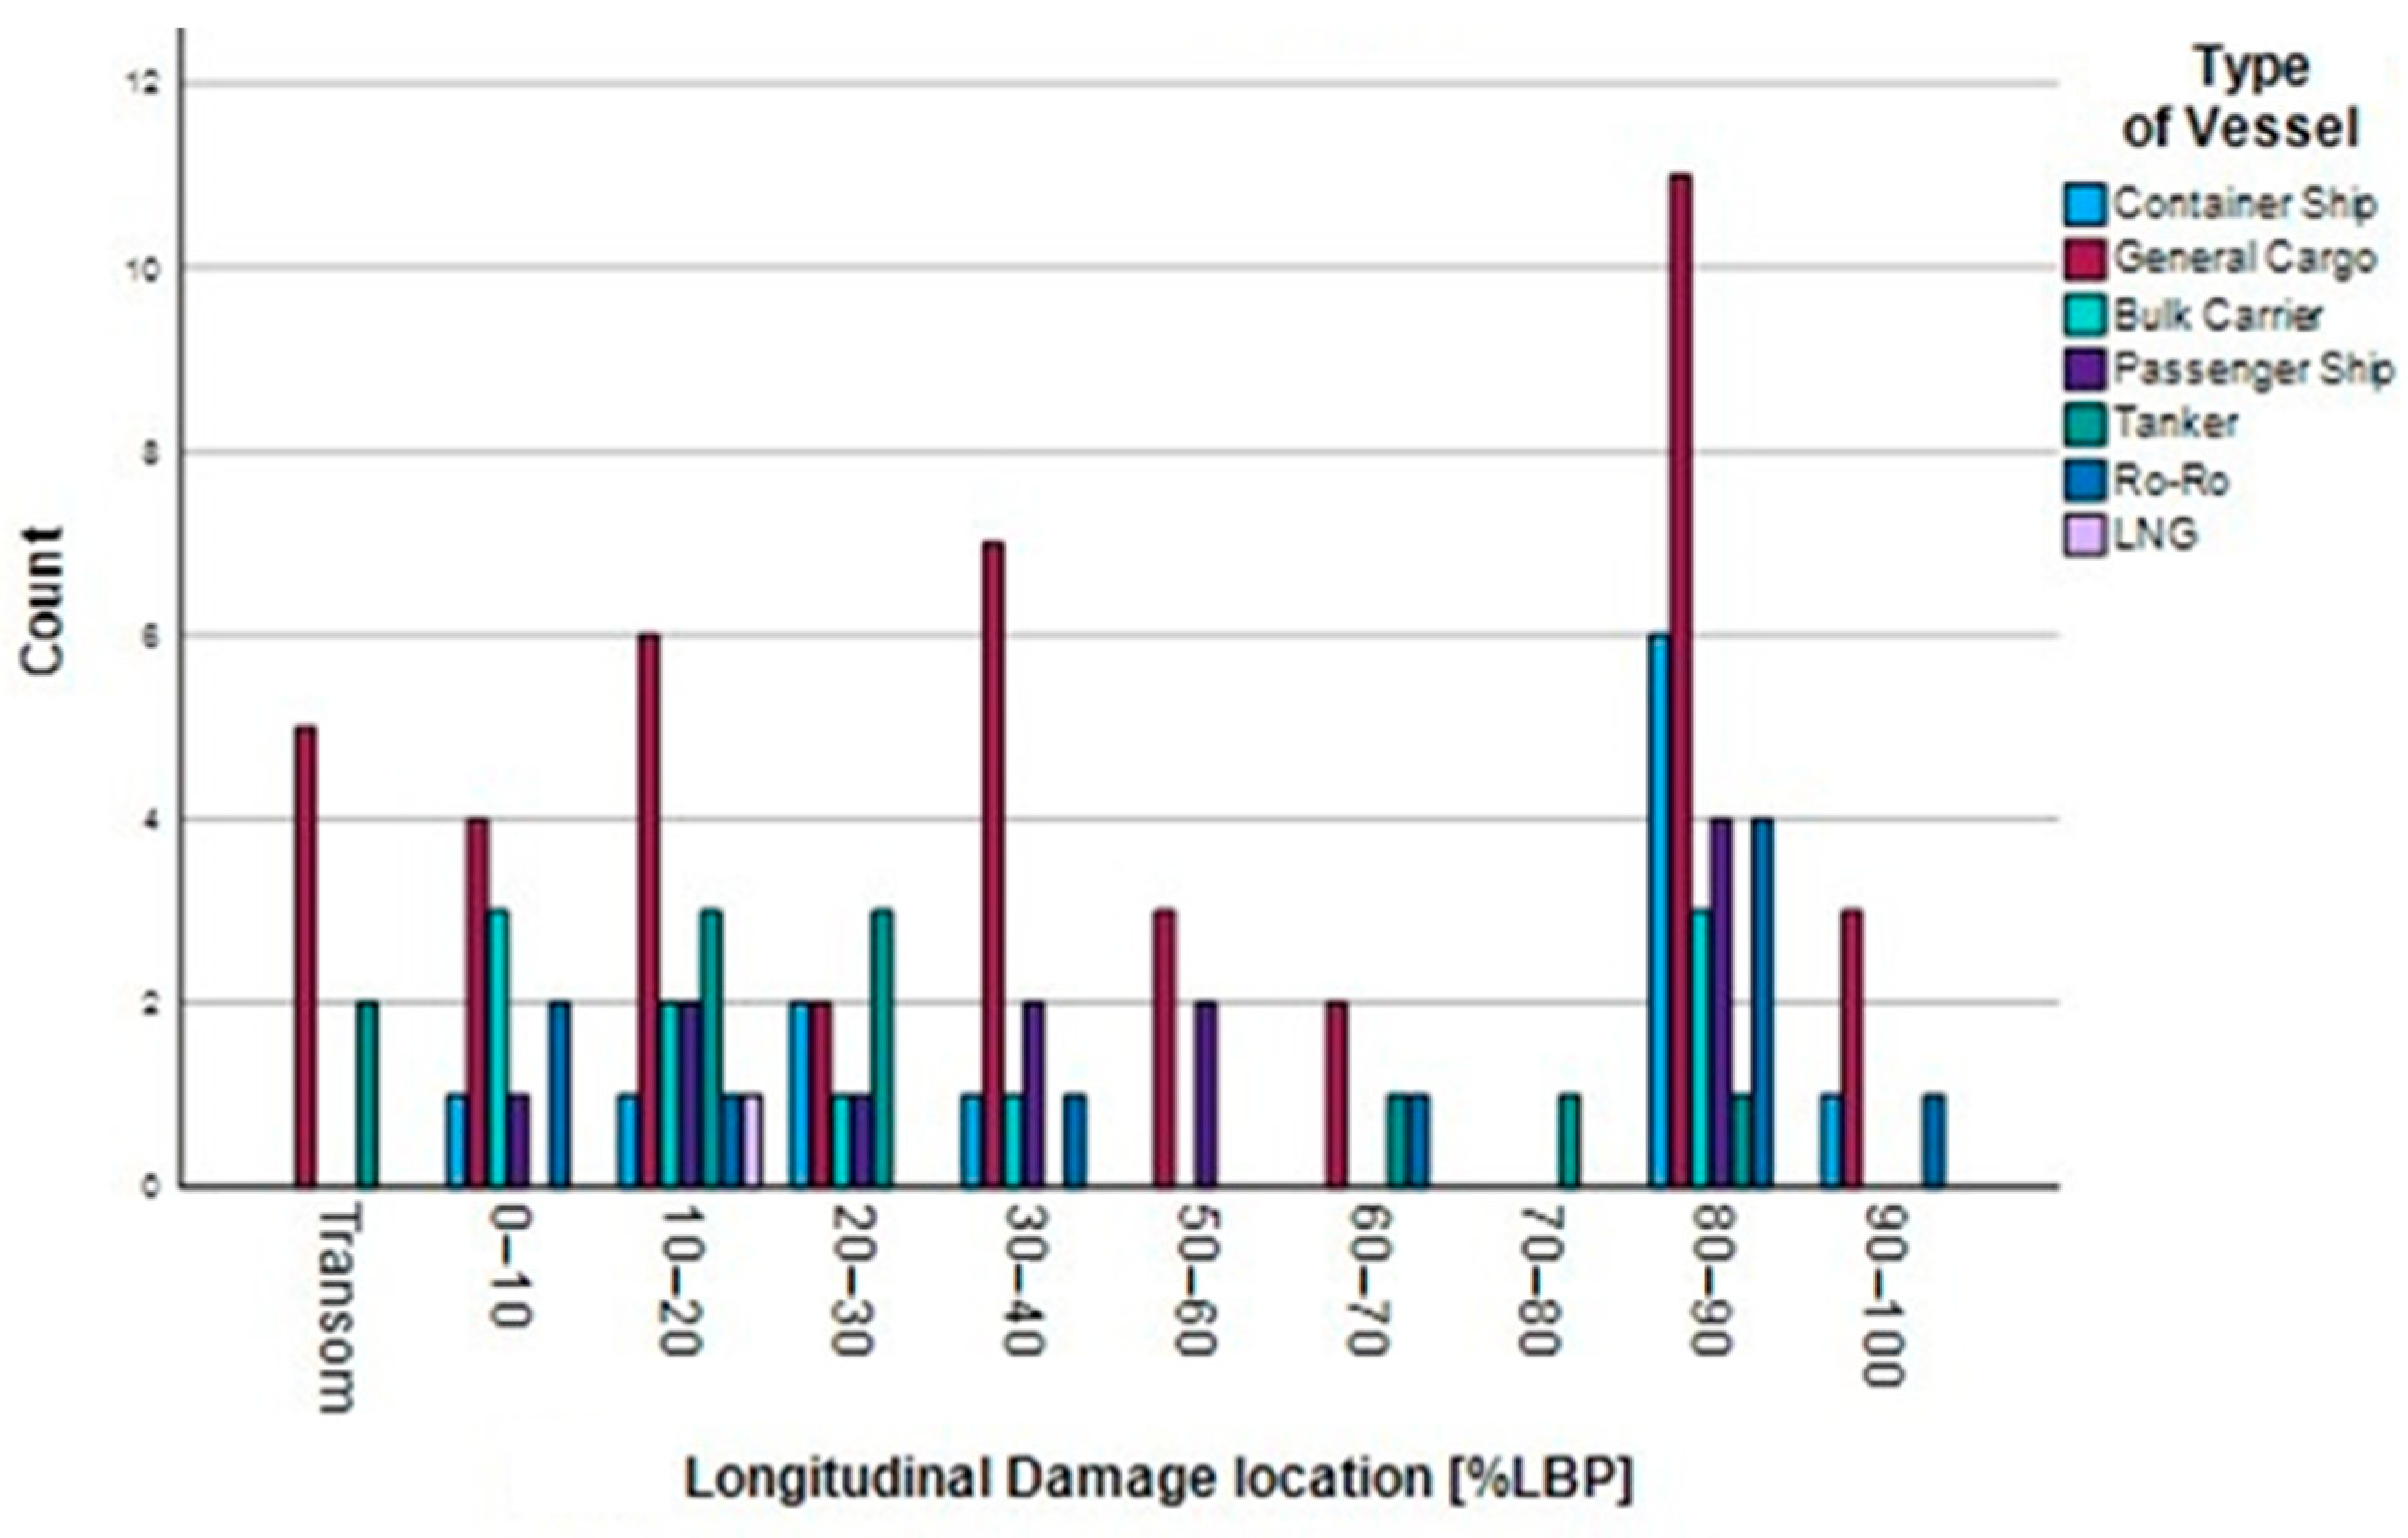
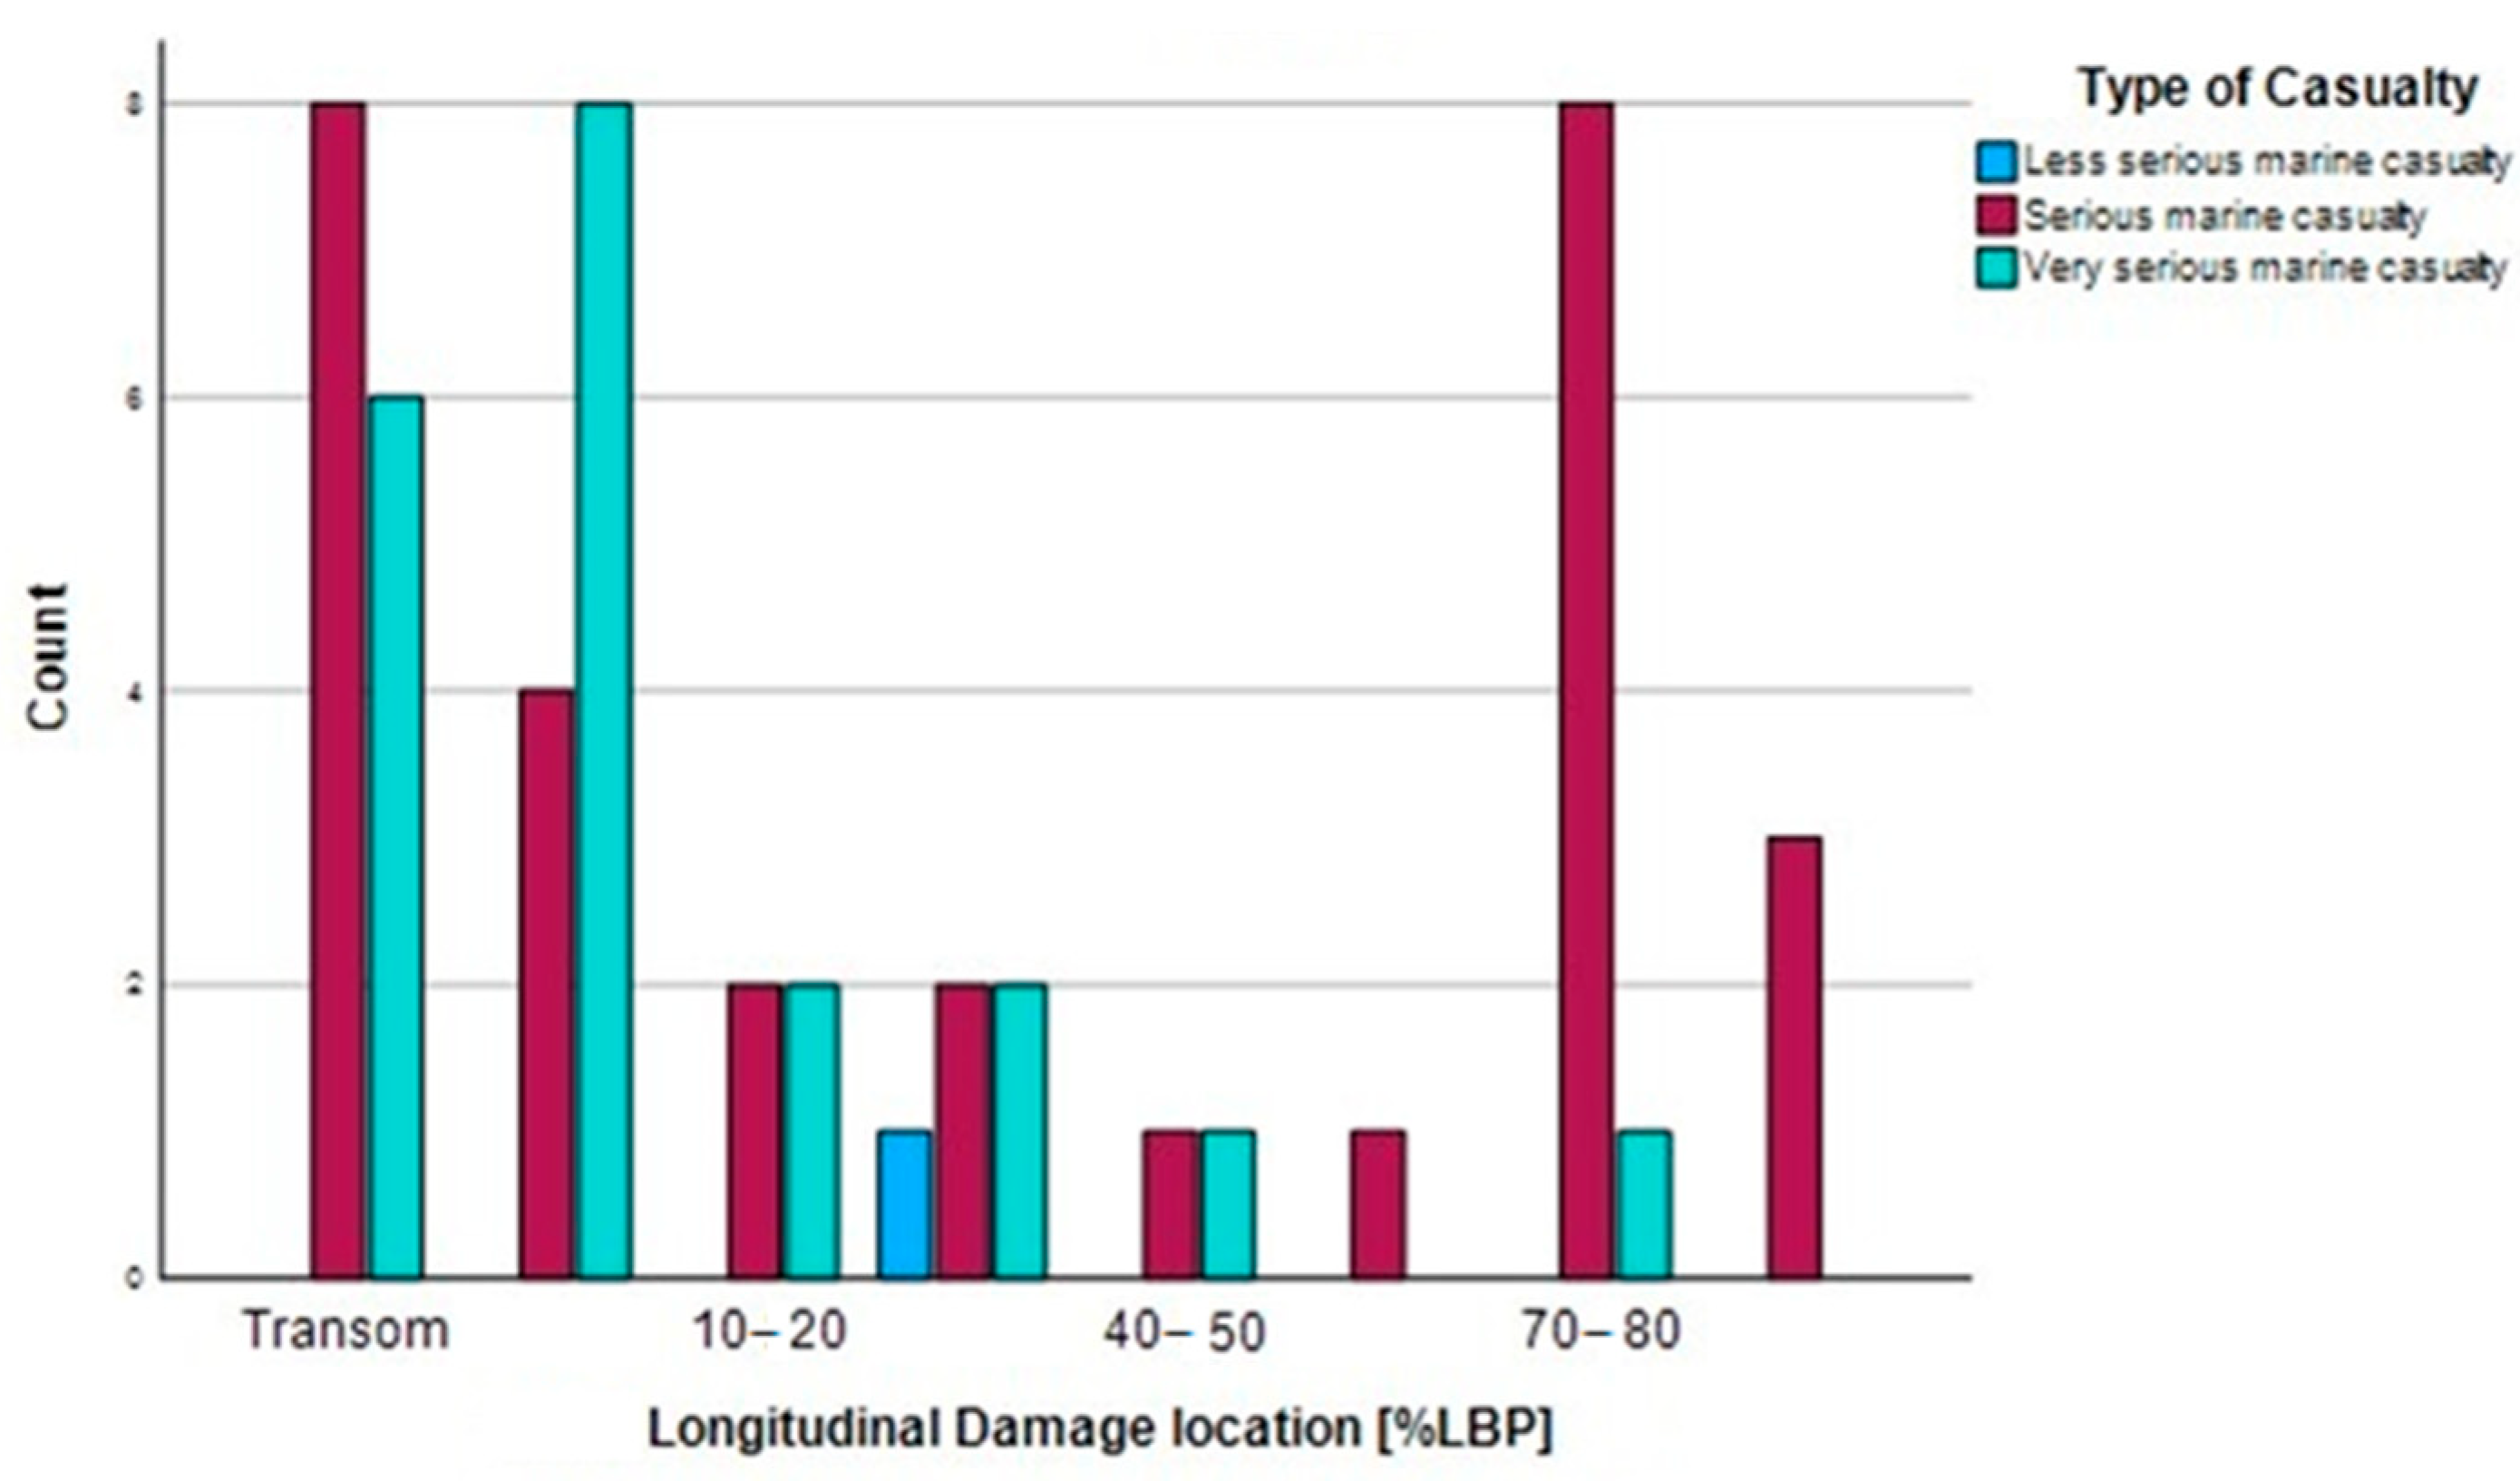
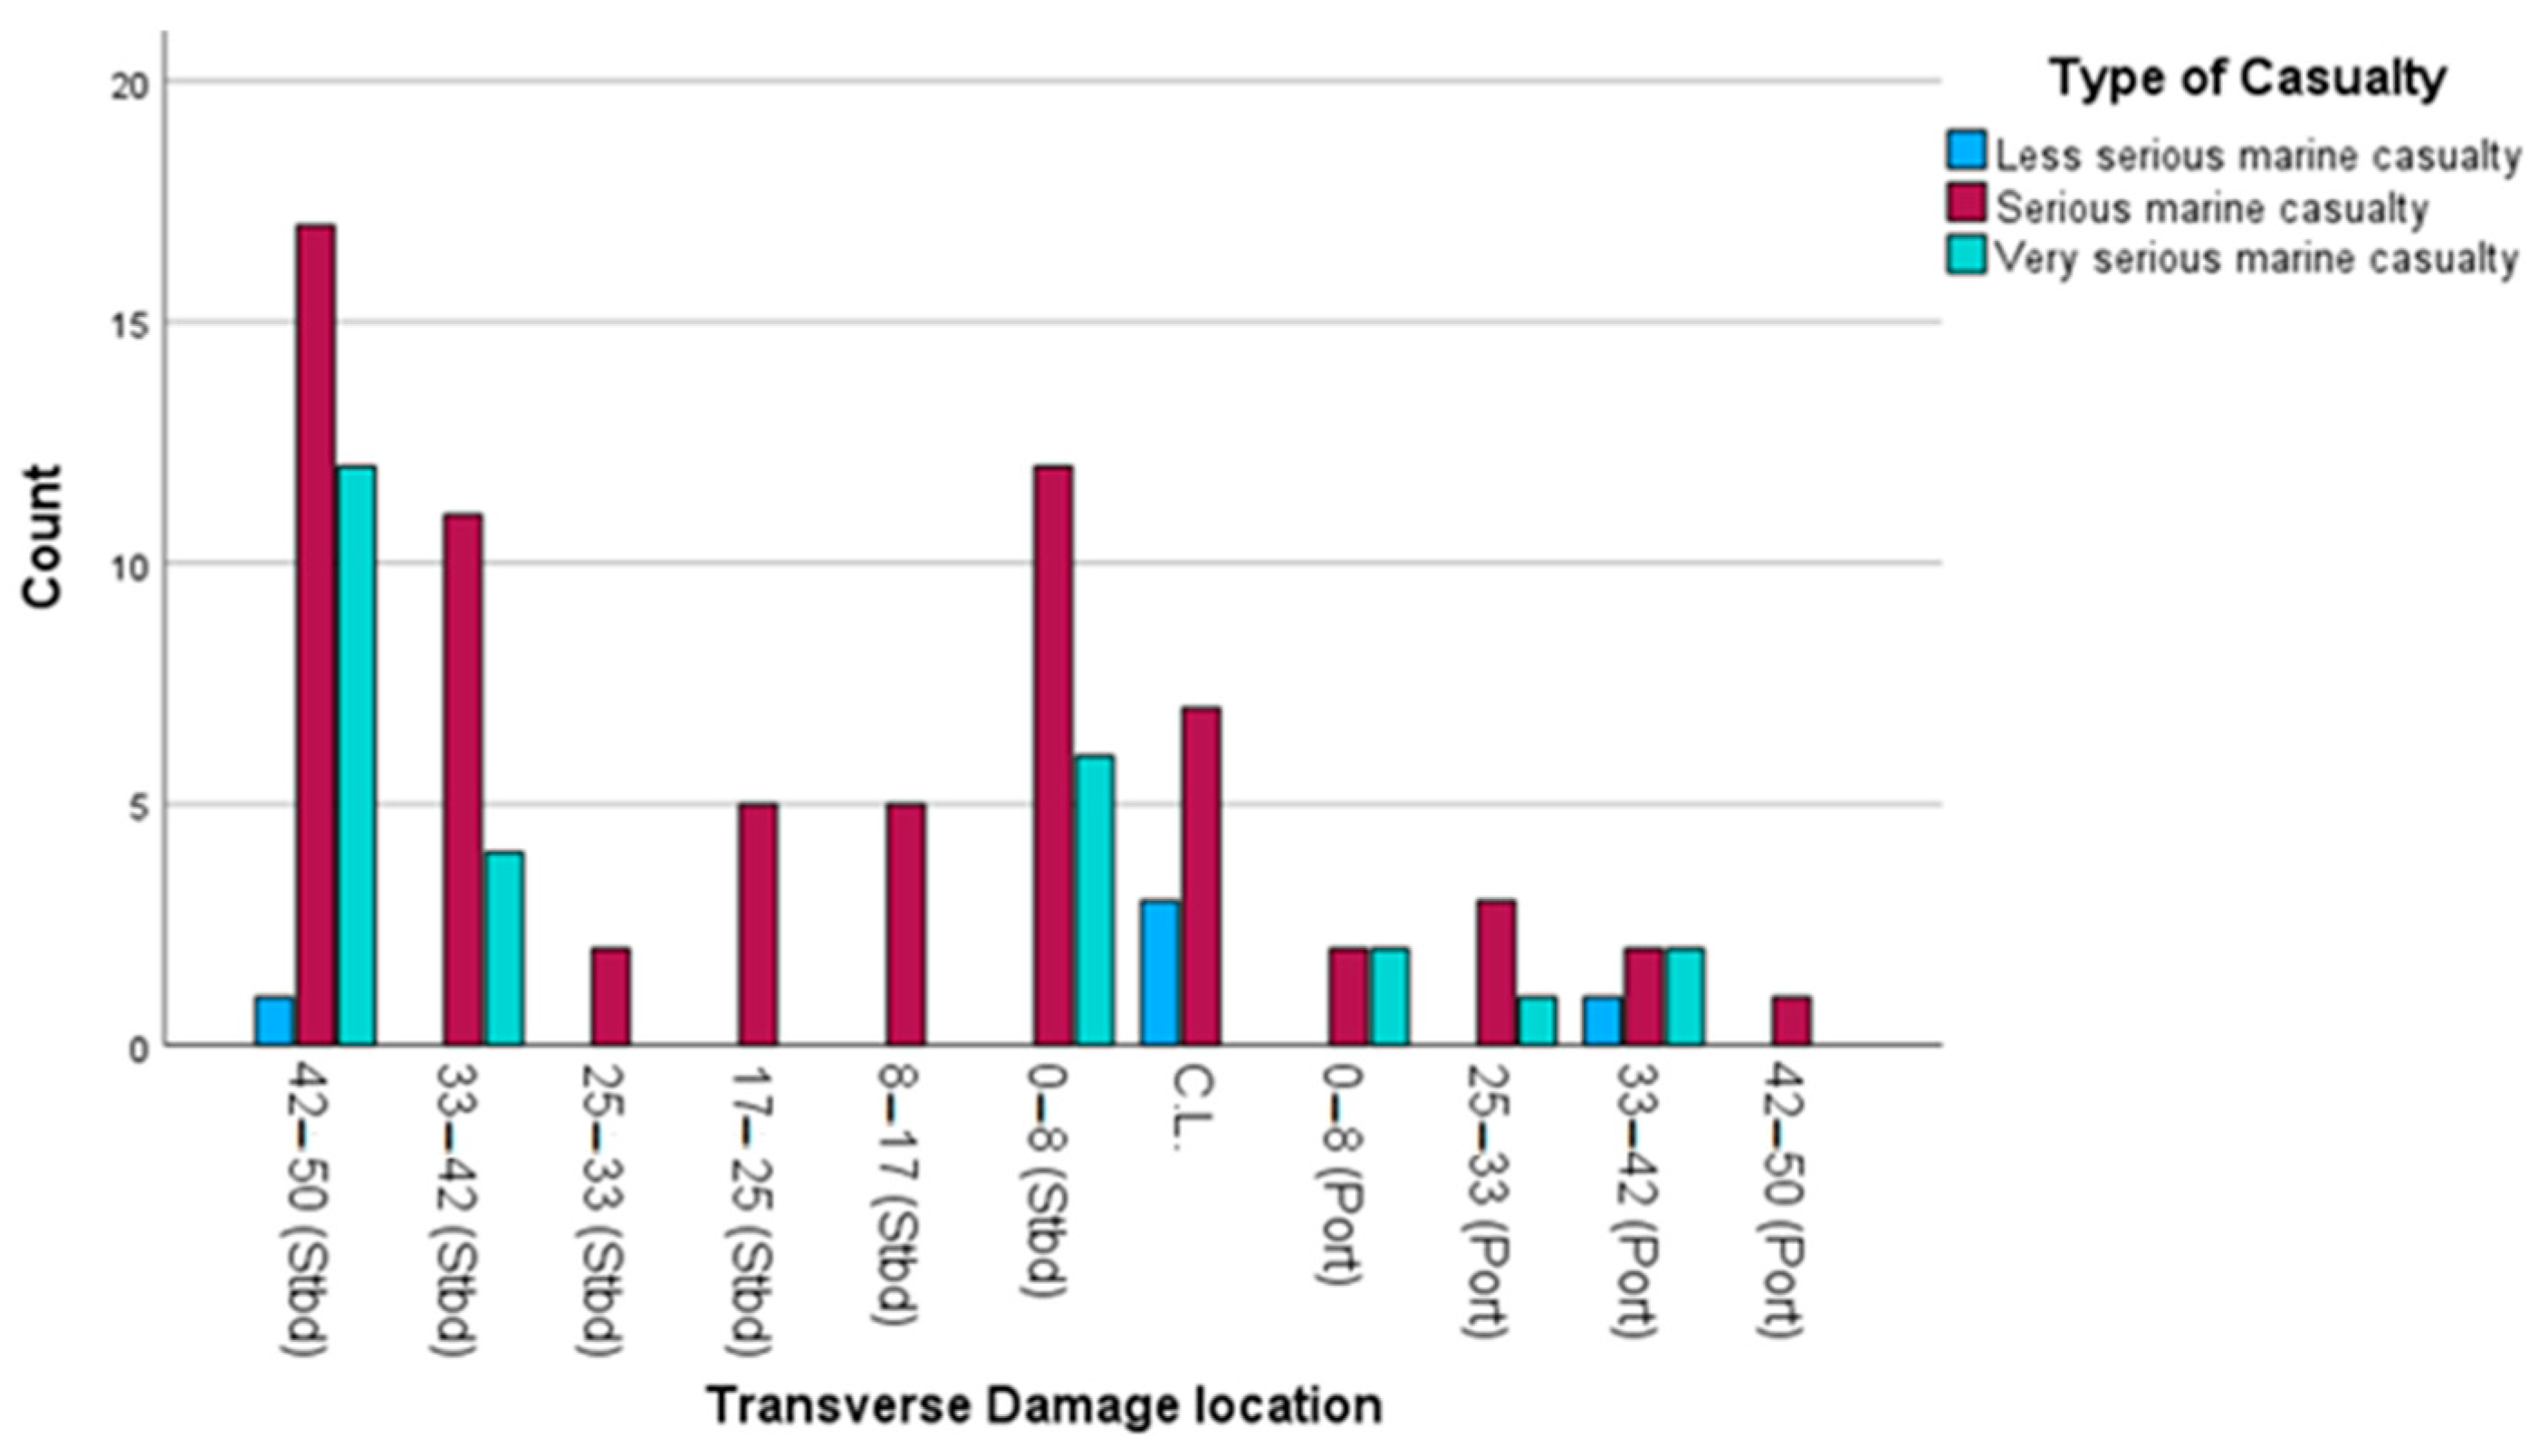
4.2.2. Grounding
- -
- Longitudinal extent of damage: 3 m–4 m; ship type: general cargo;
- -
- Transverse extent of damage: 2 m–2.5 m; ship type: general cargo;
- -
- Longitudinal damage location: 80–90% LBP; ship type: general cargo;
- -
- Impact of accident: the damages were repaired; longitudinal location: transom;
- -
- Type of casualty: serious marine; longitudinal location: transom and 70–80% LBP; and type of casualty: very serious; longitudinal location: 0–10% LBP;
- -
- Type of casualty: serious marine casualty; transverse location: 42–50% B (starboard).
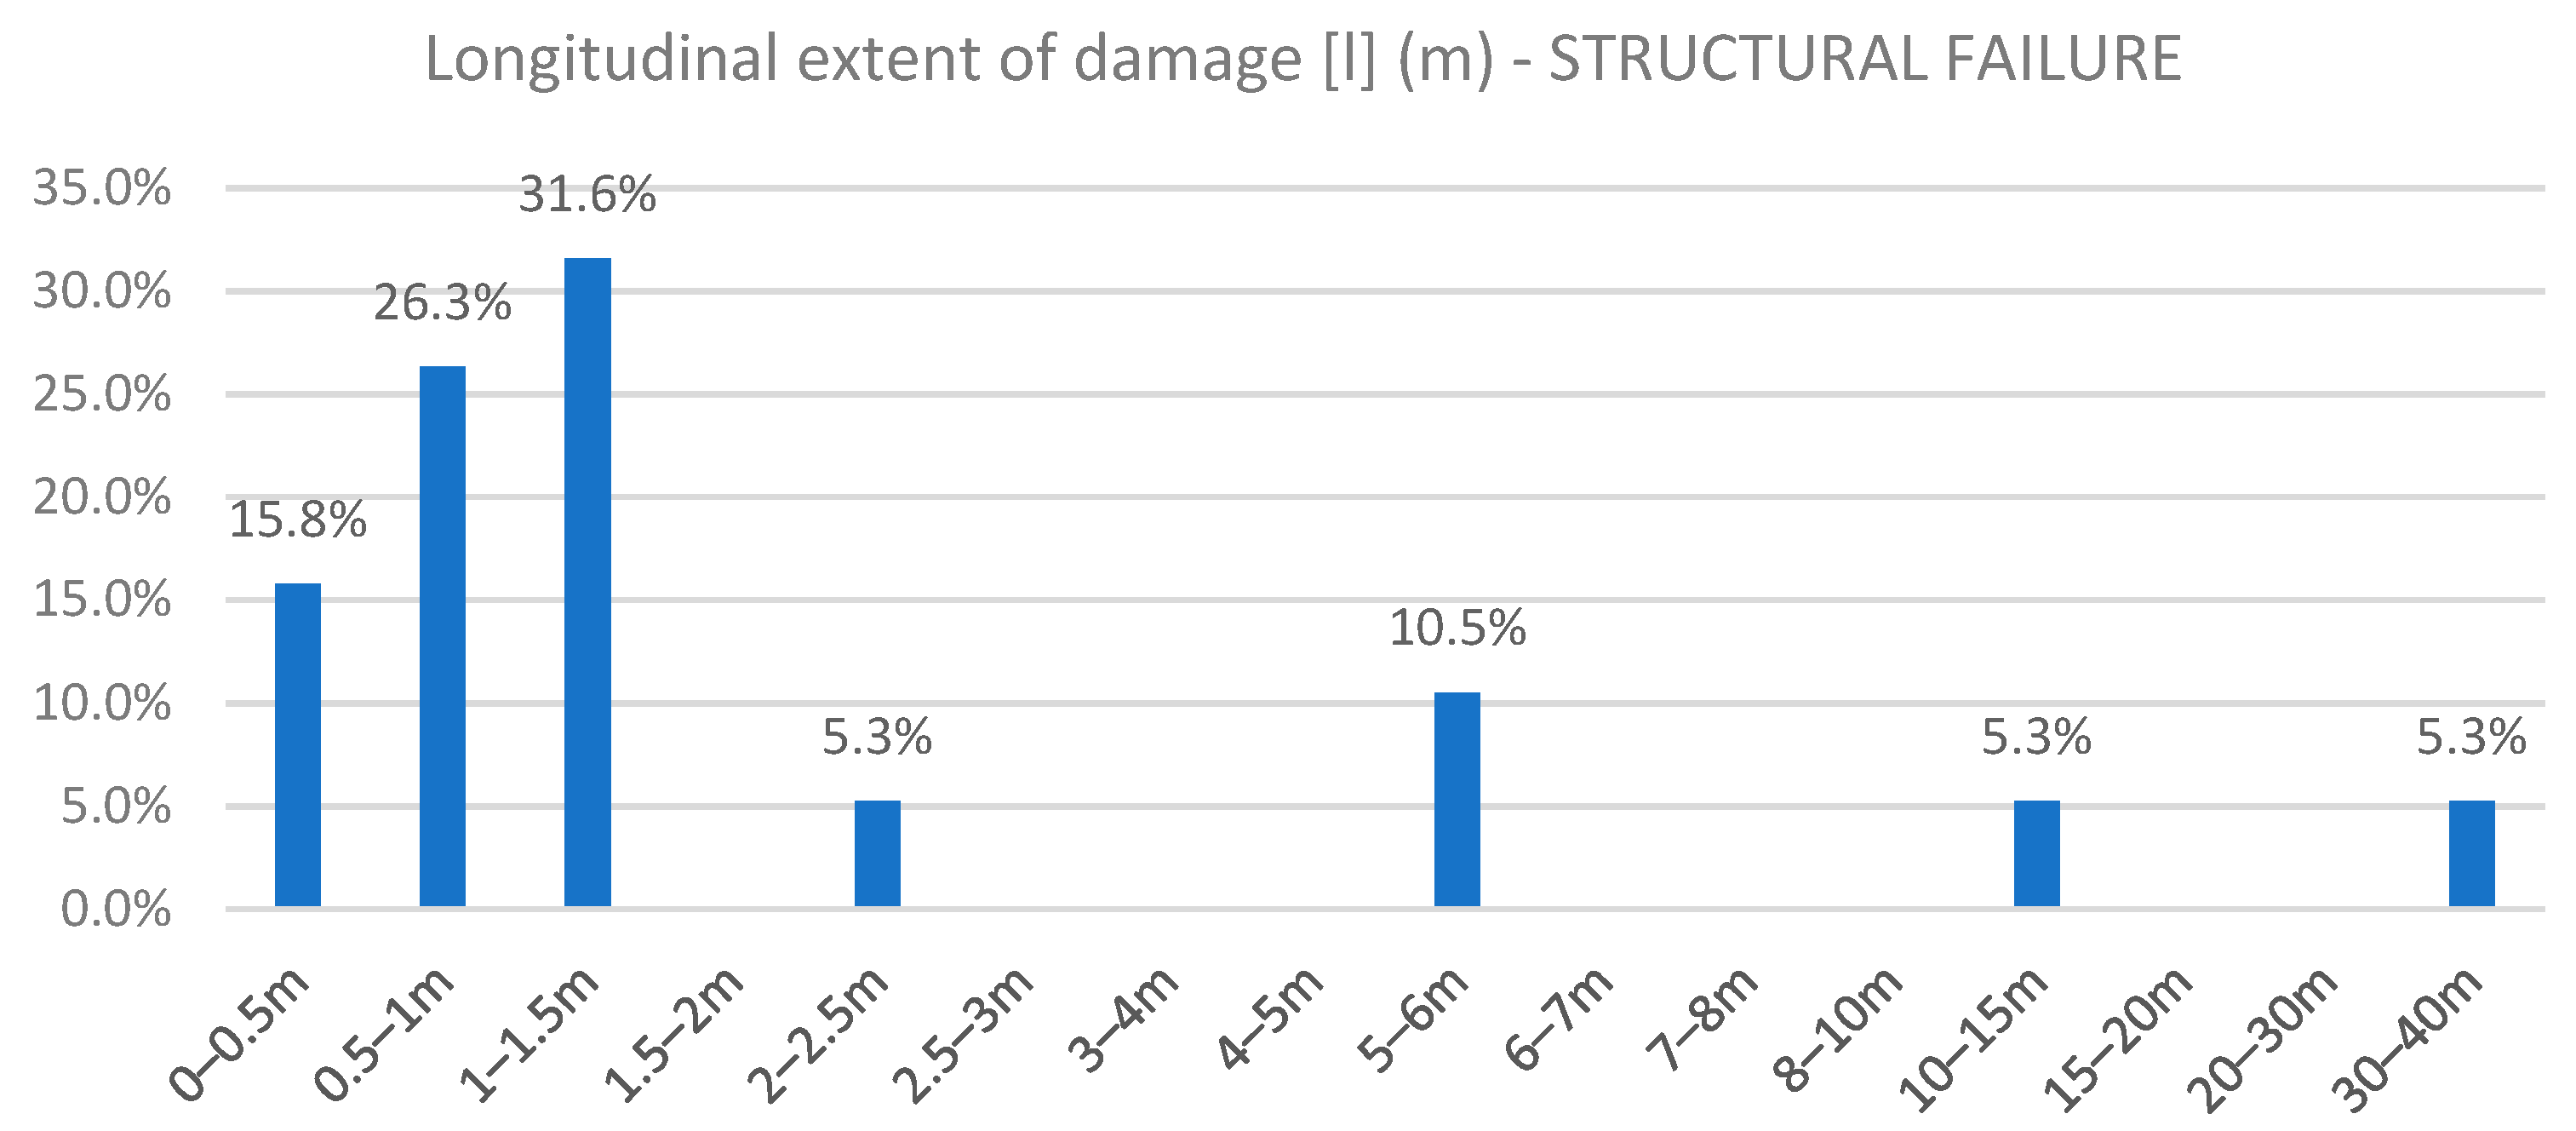
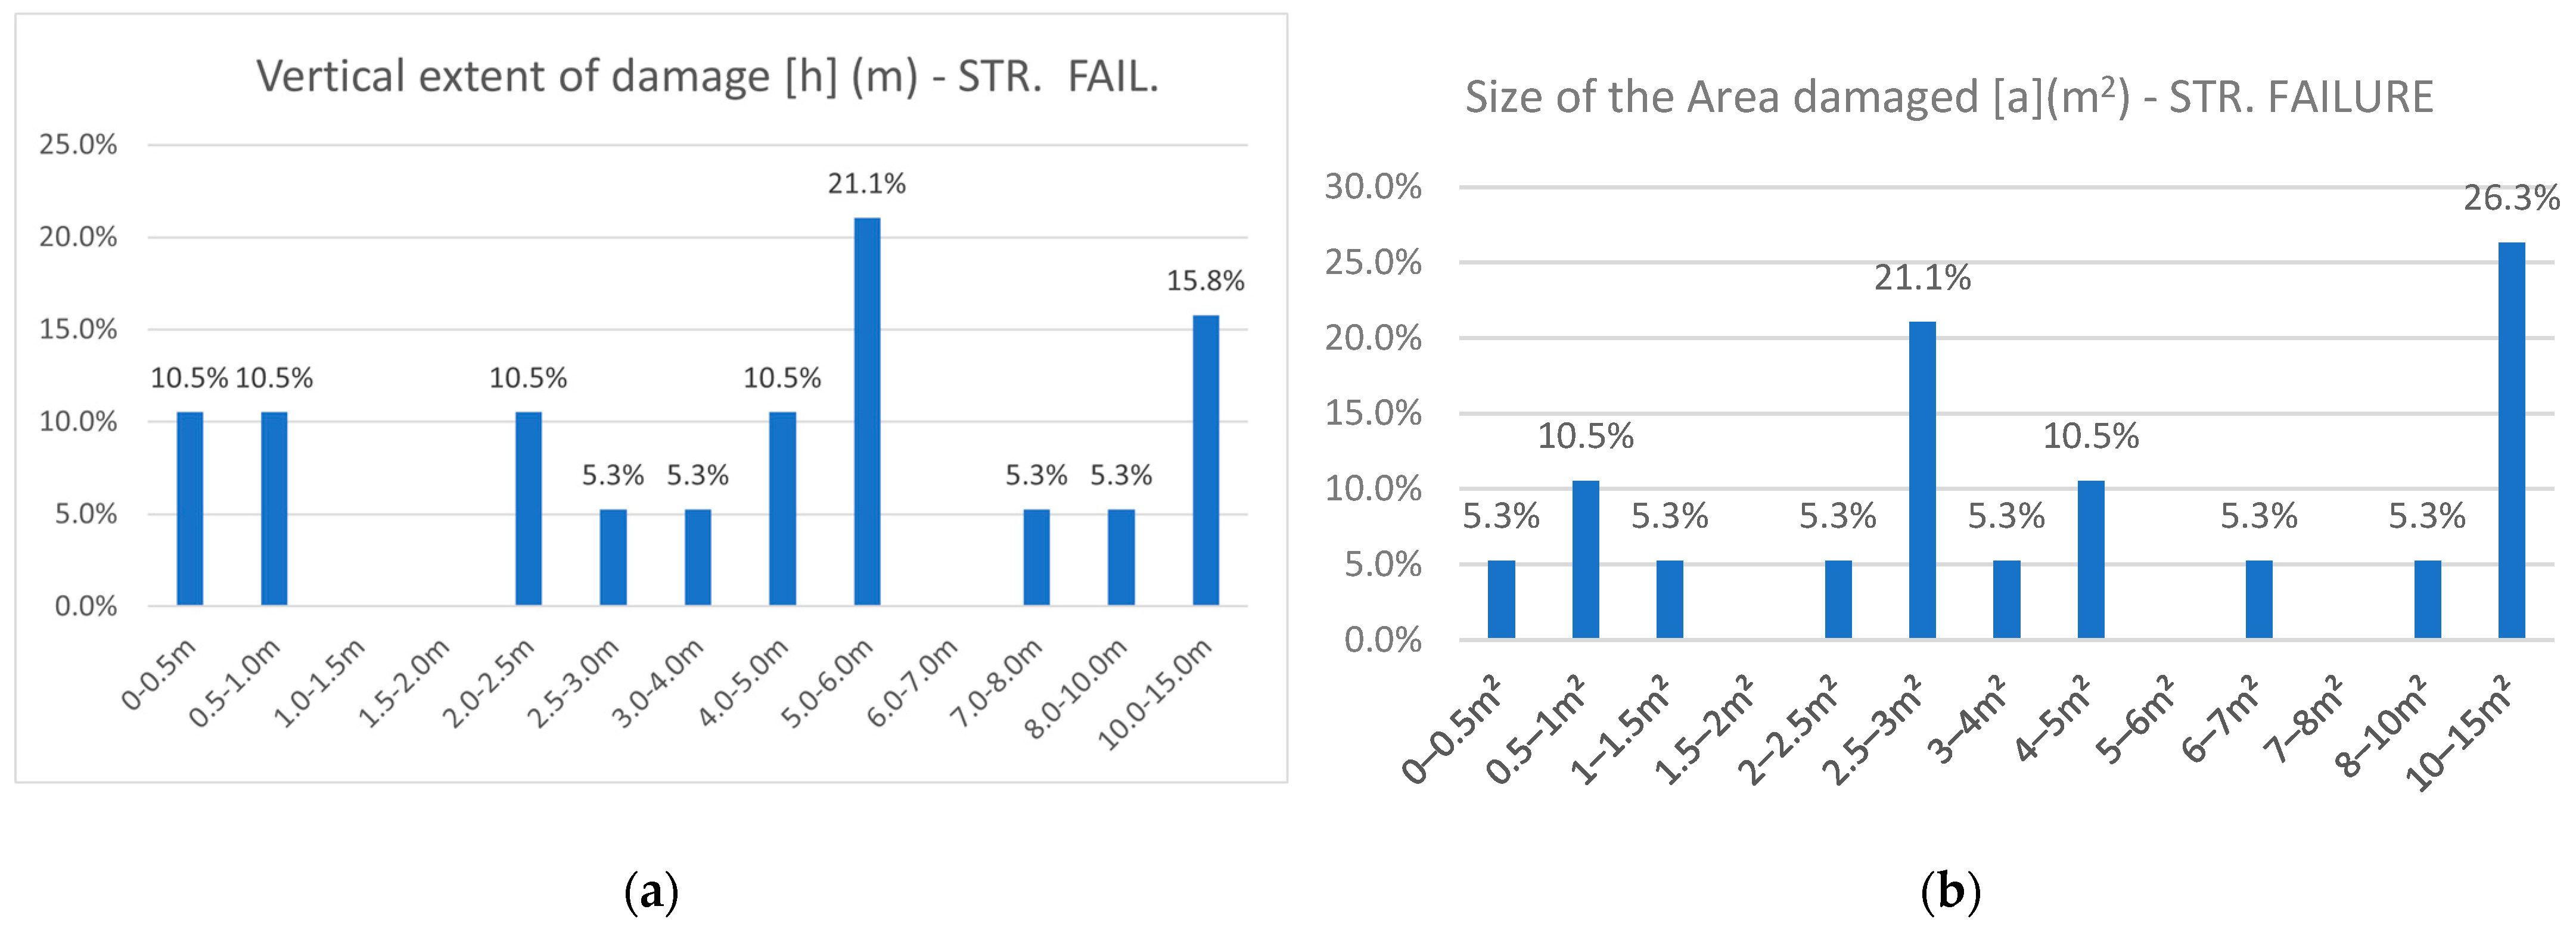
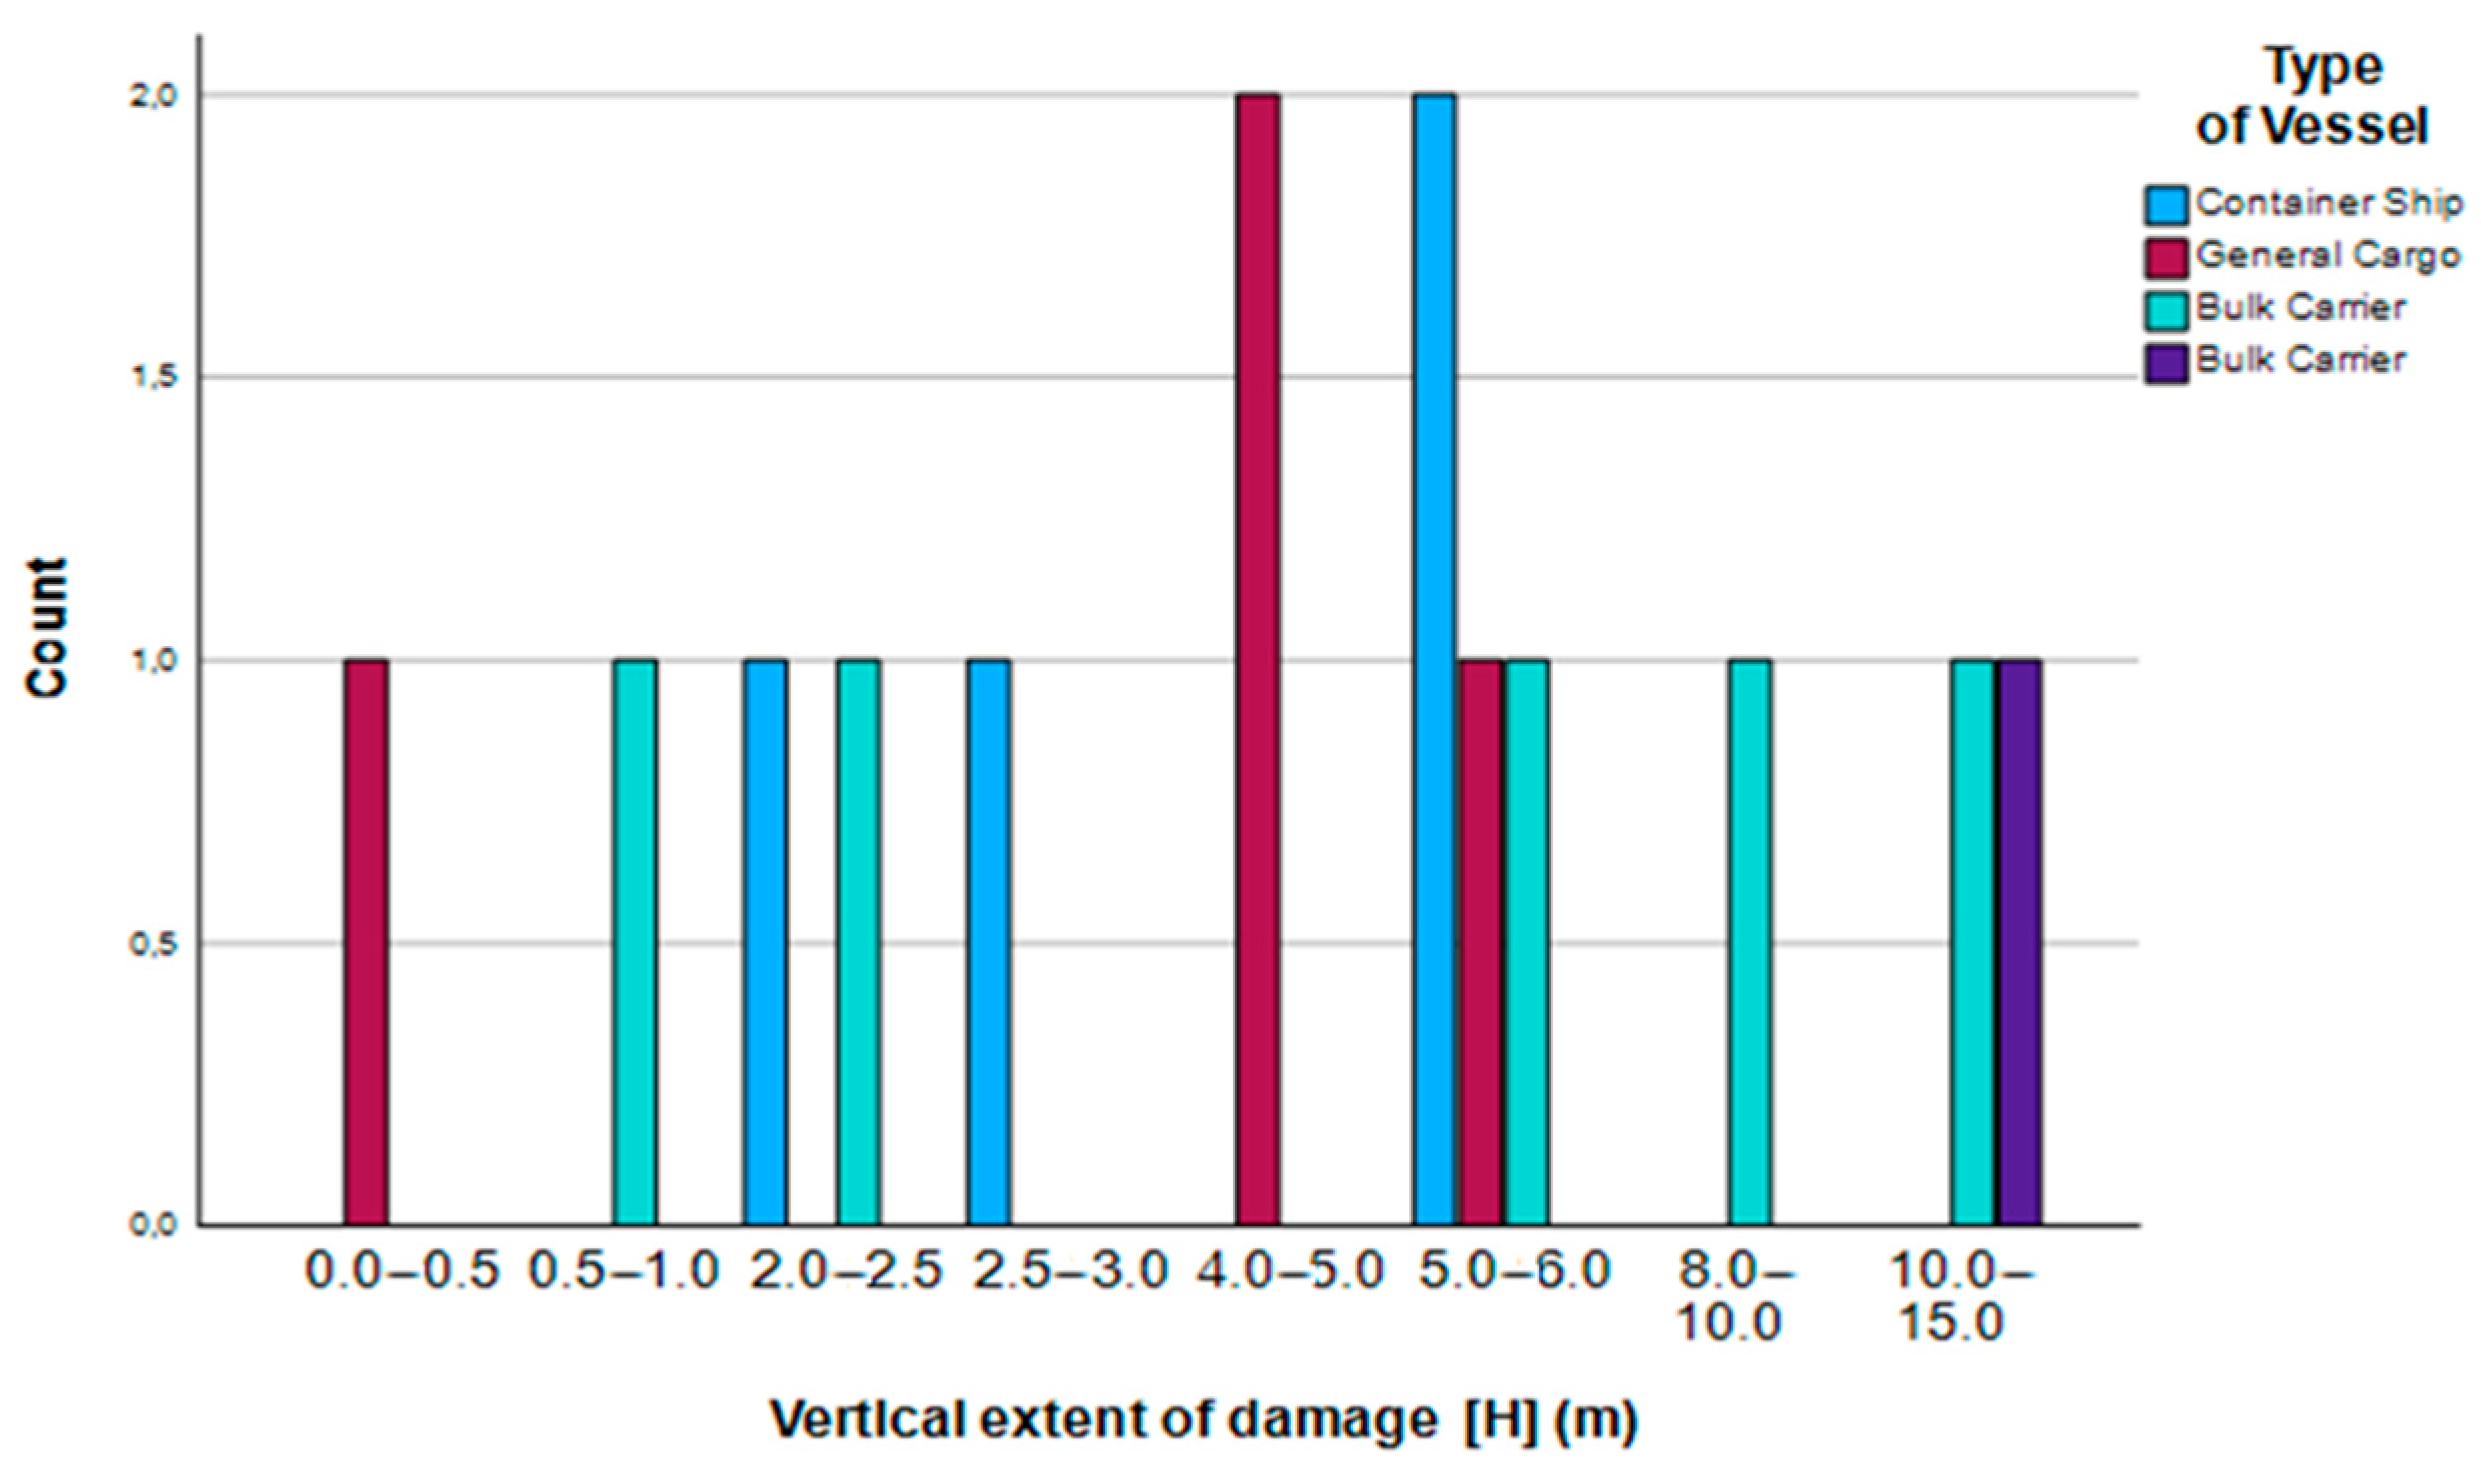
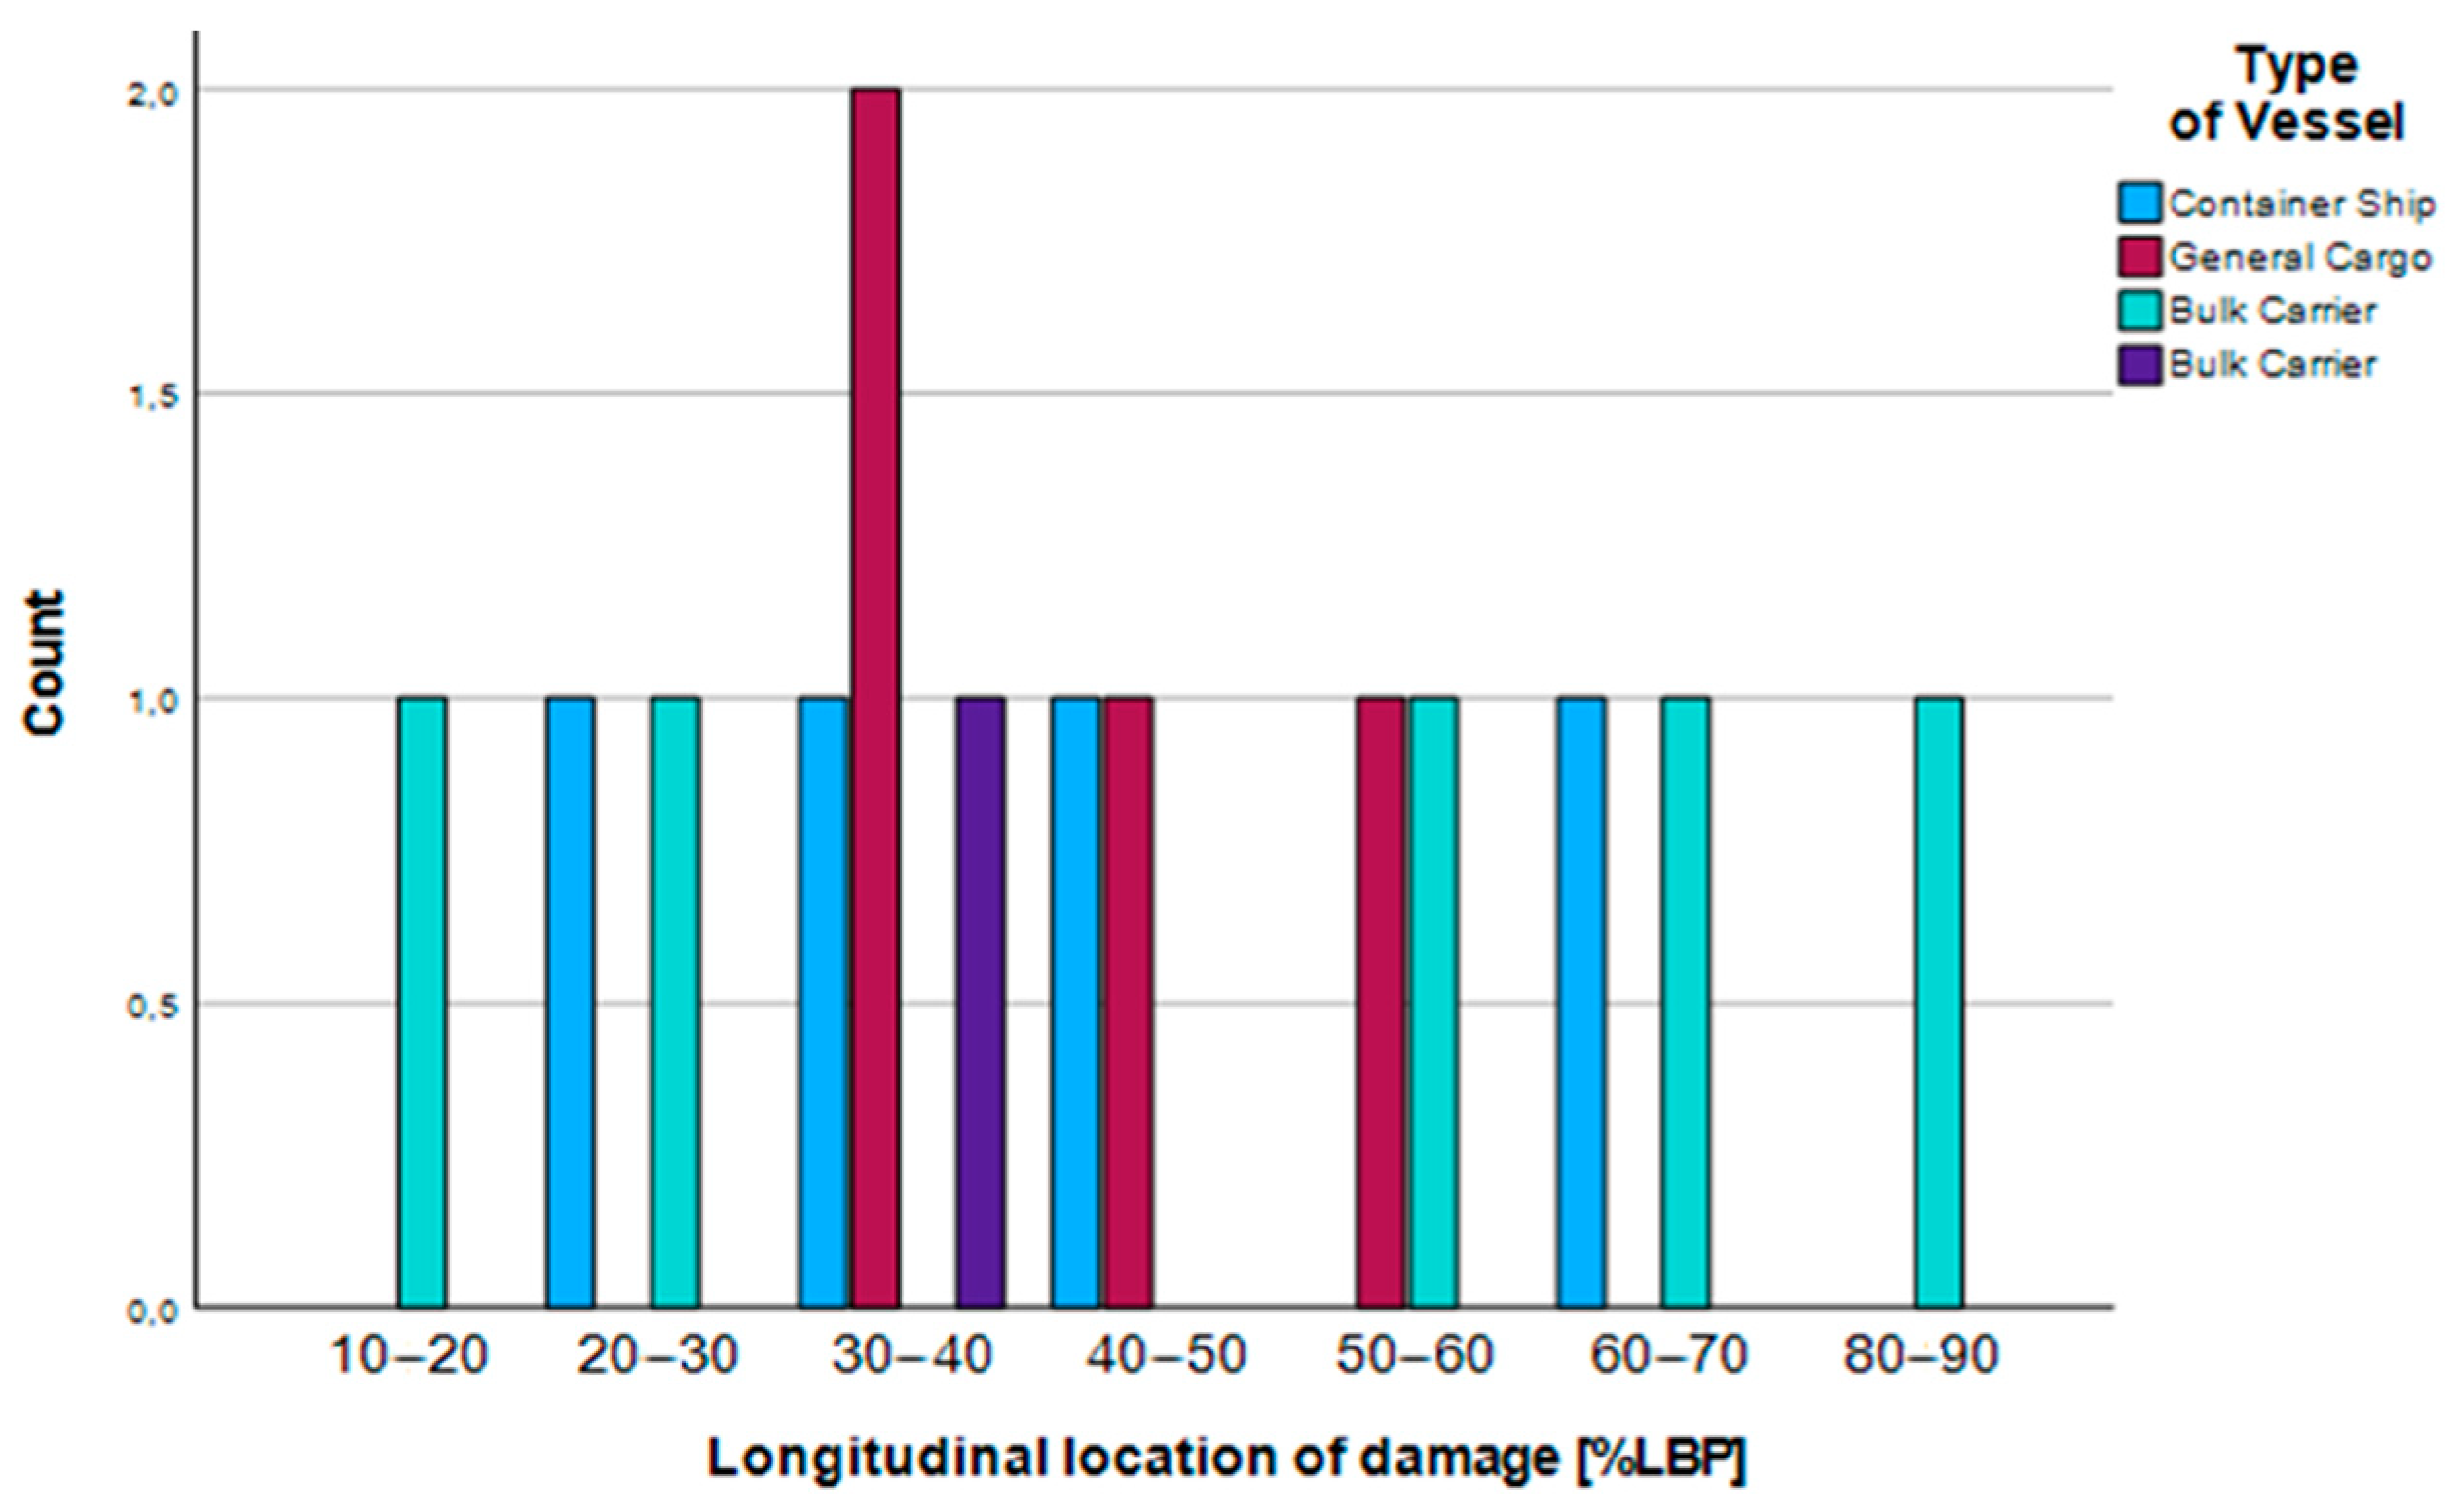
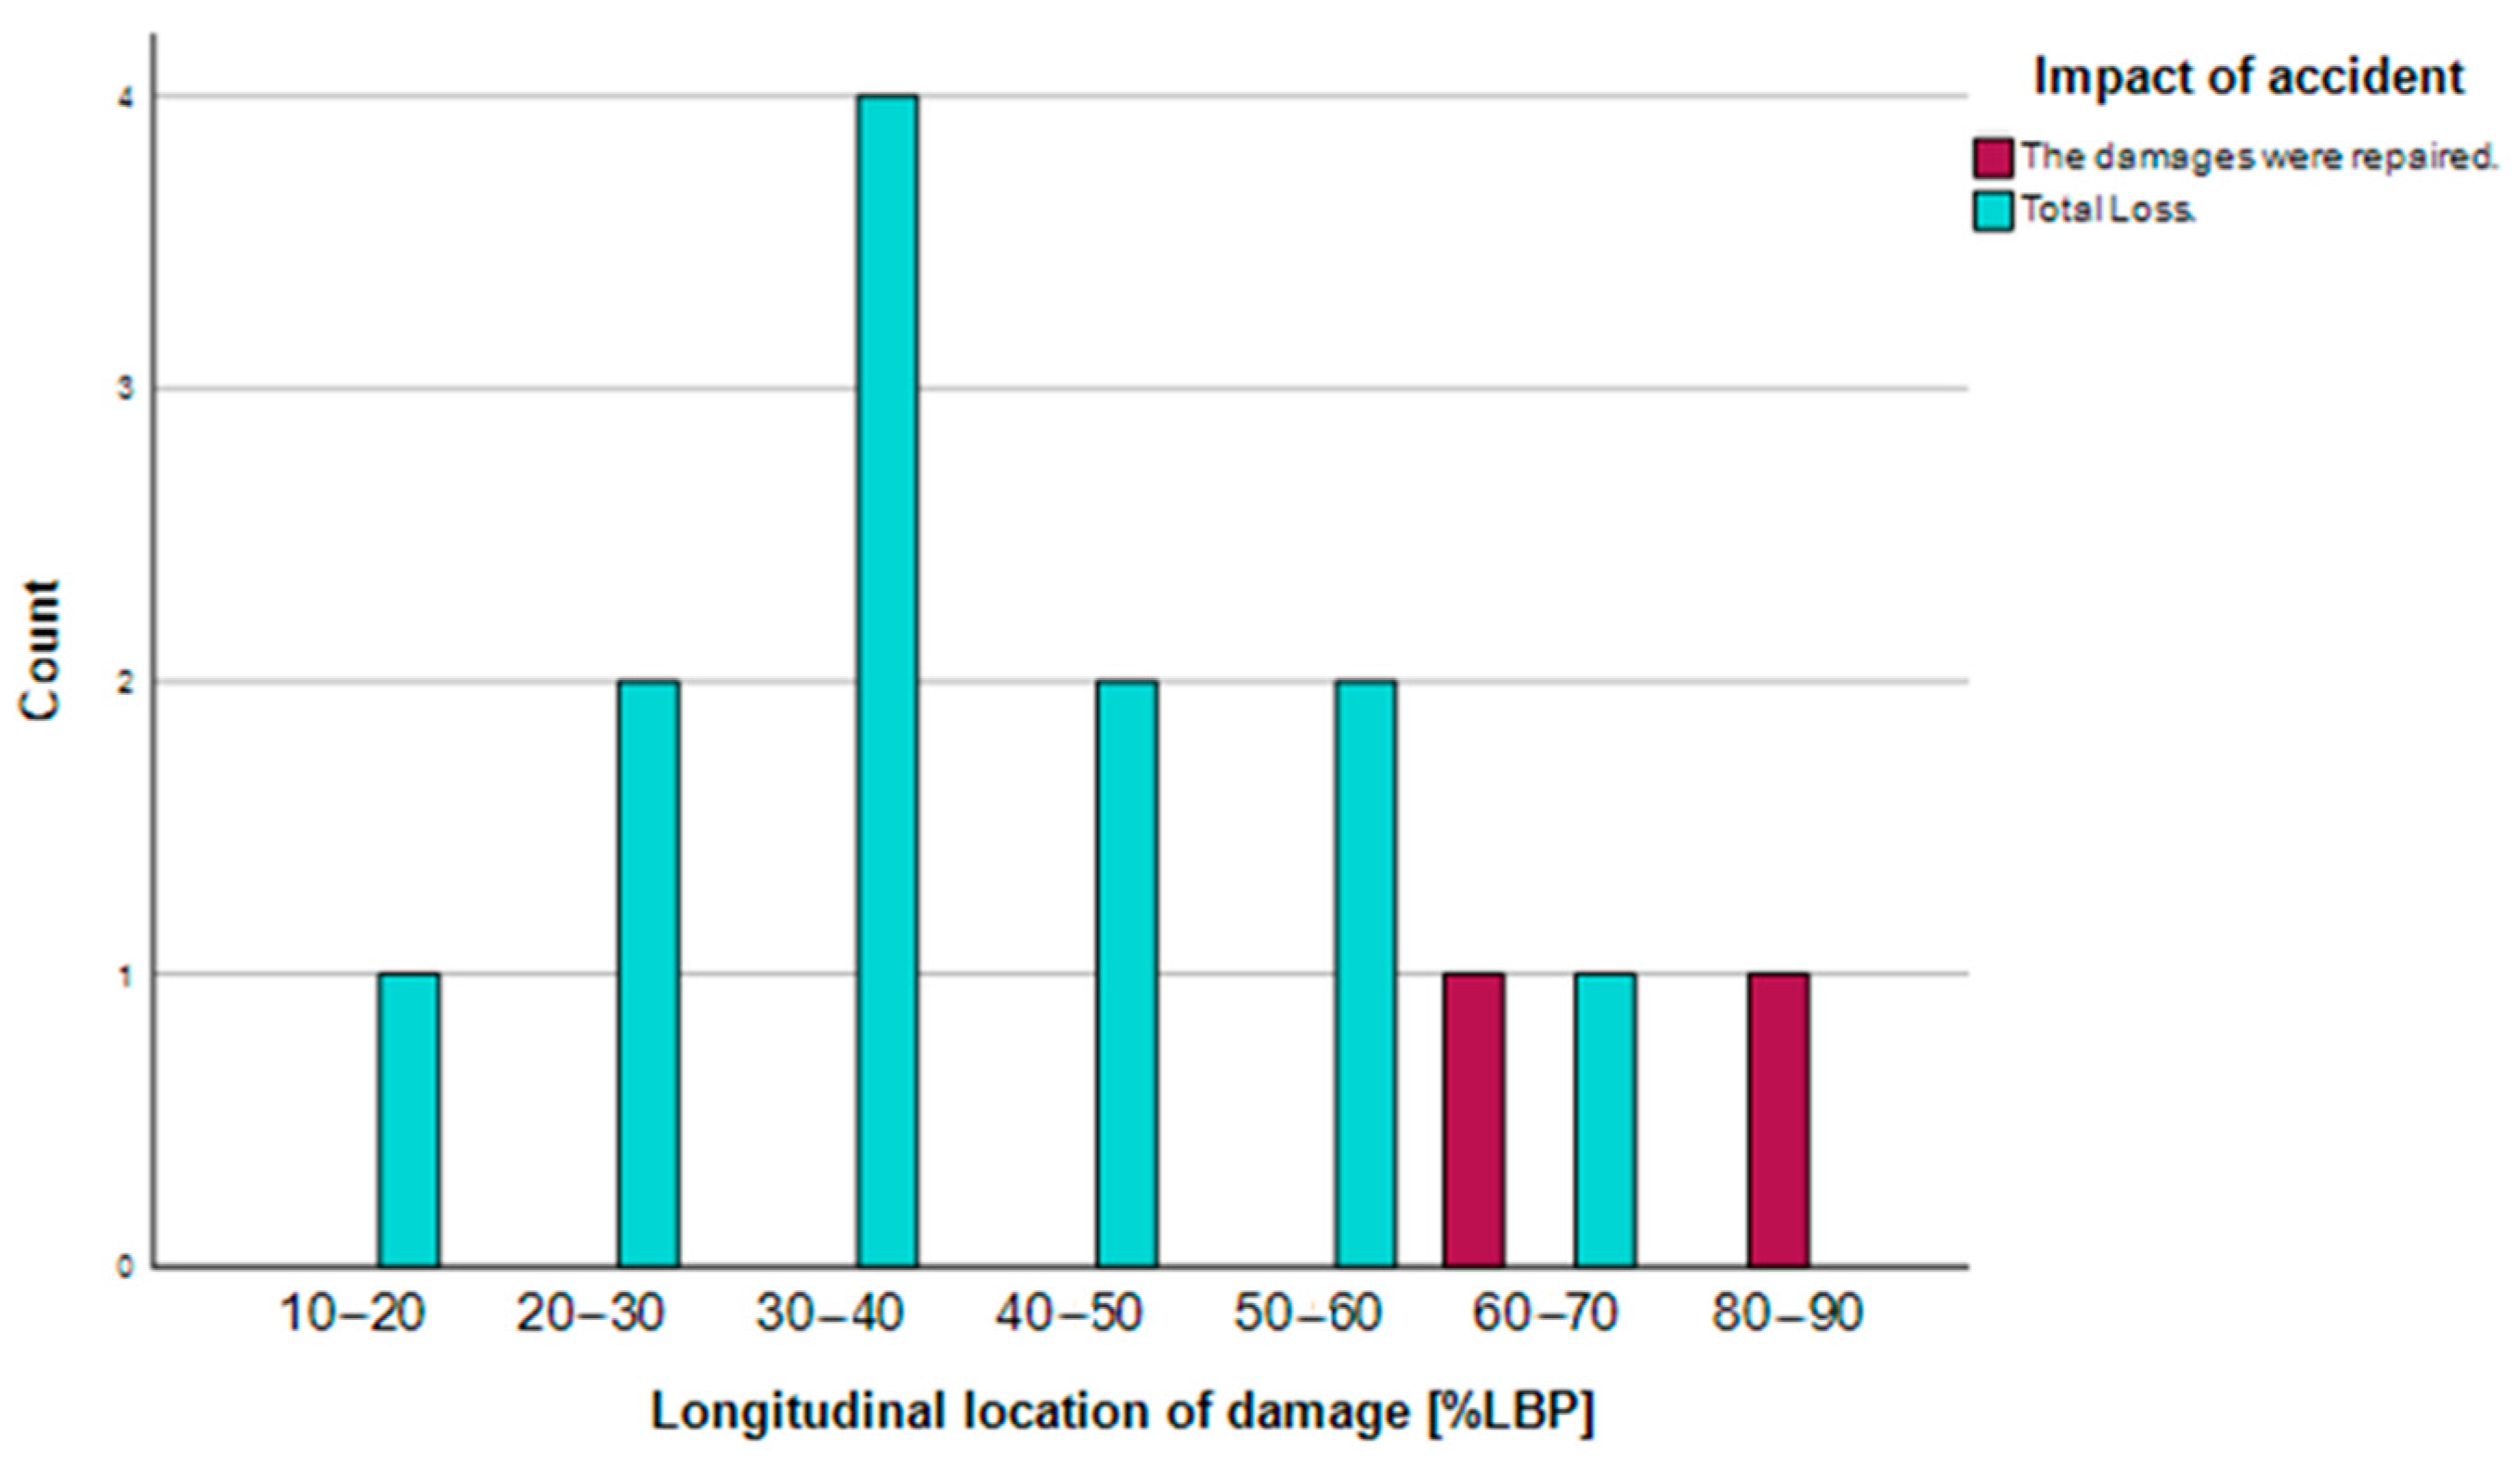
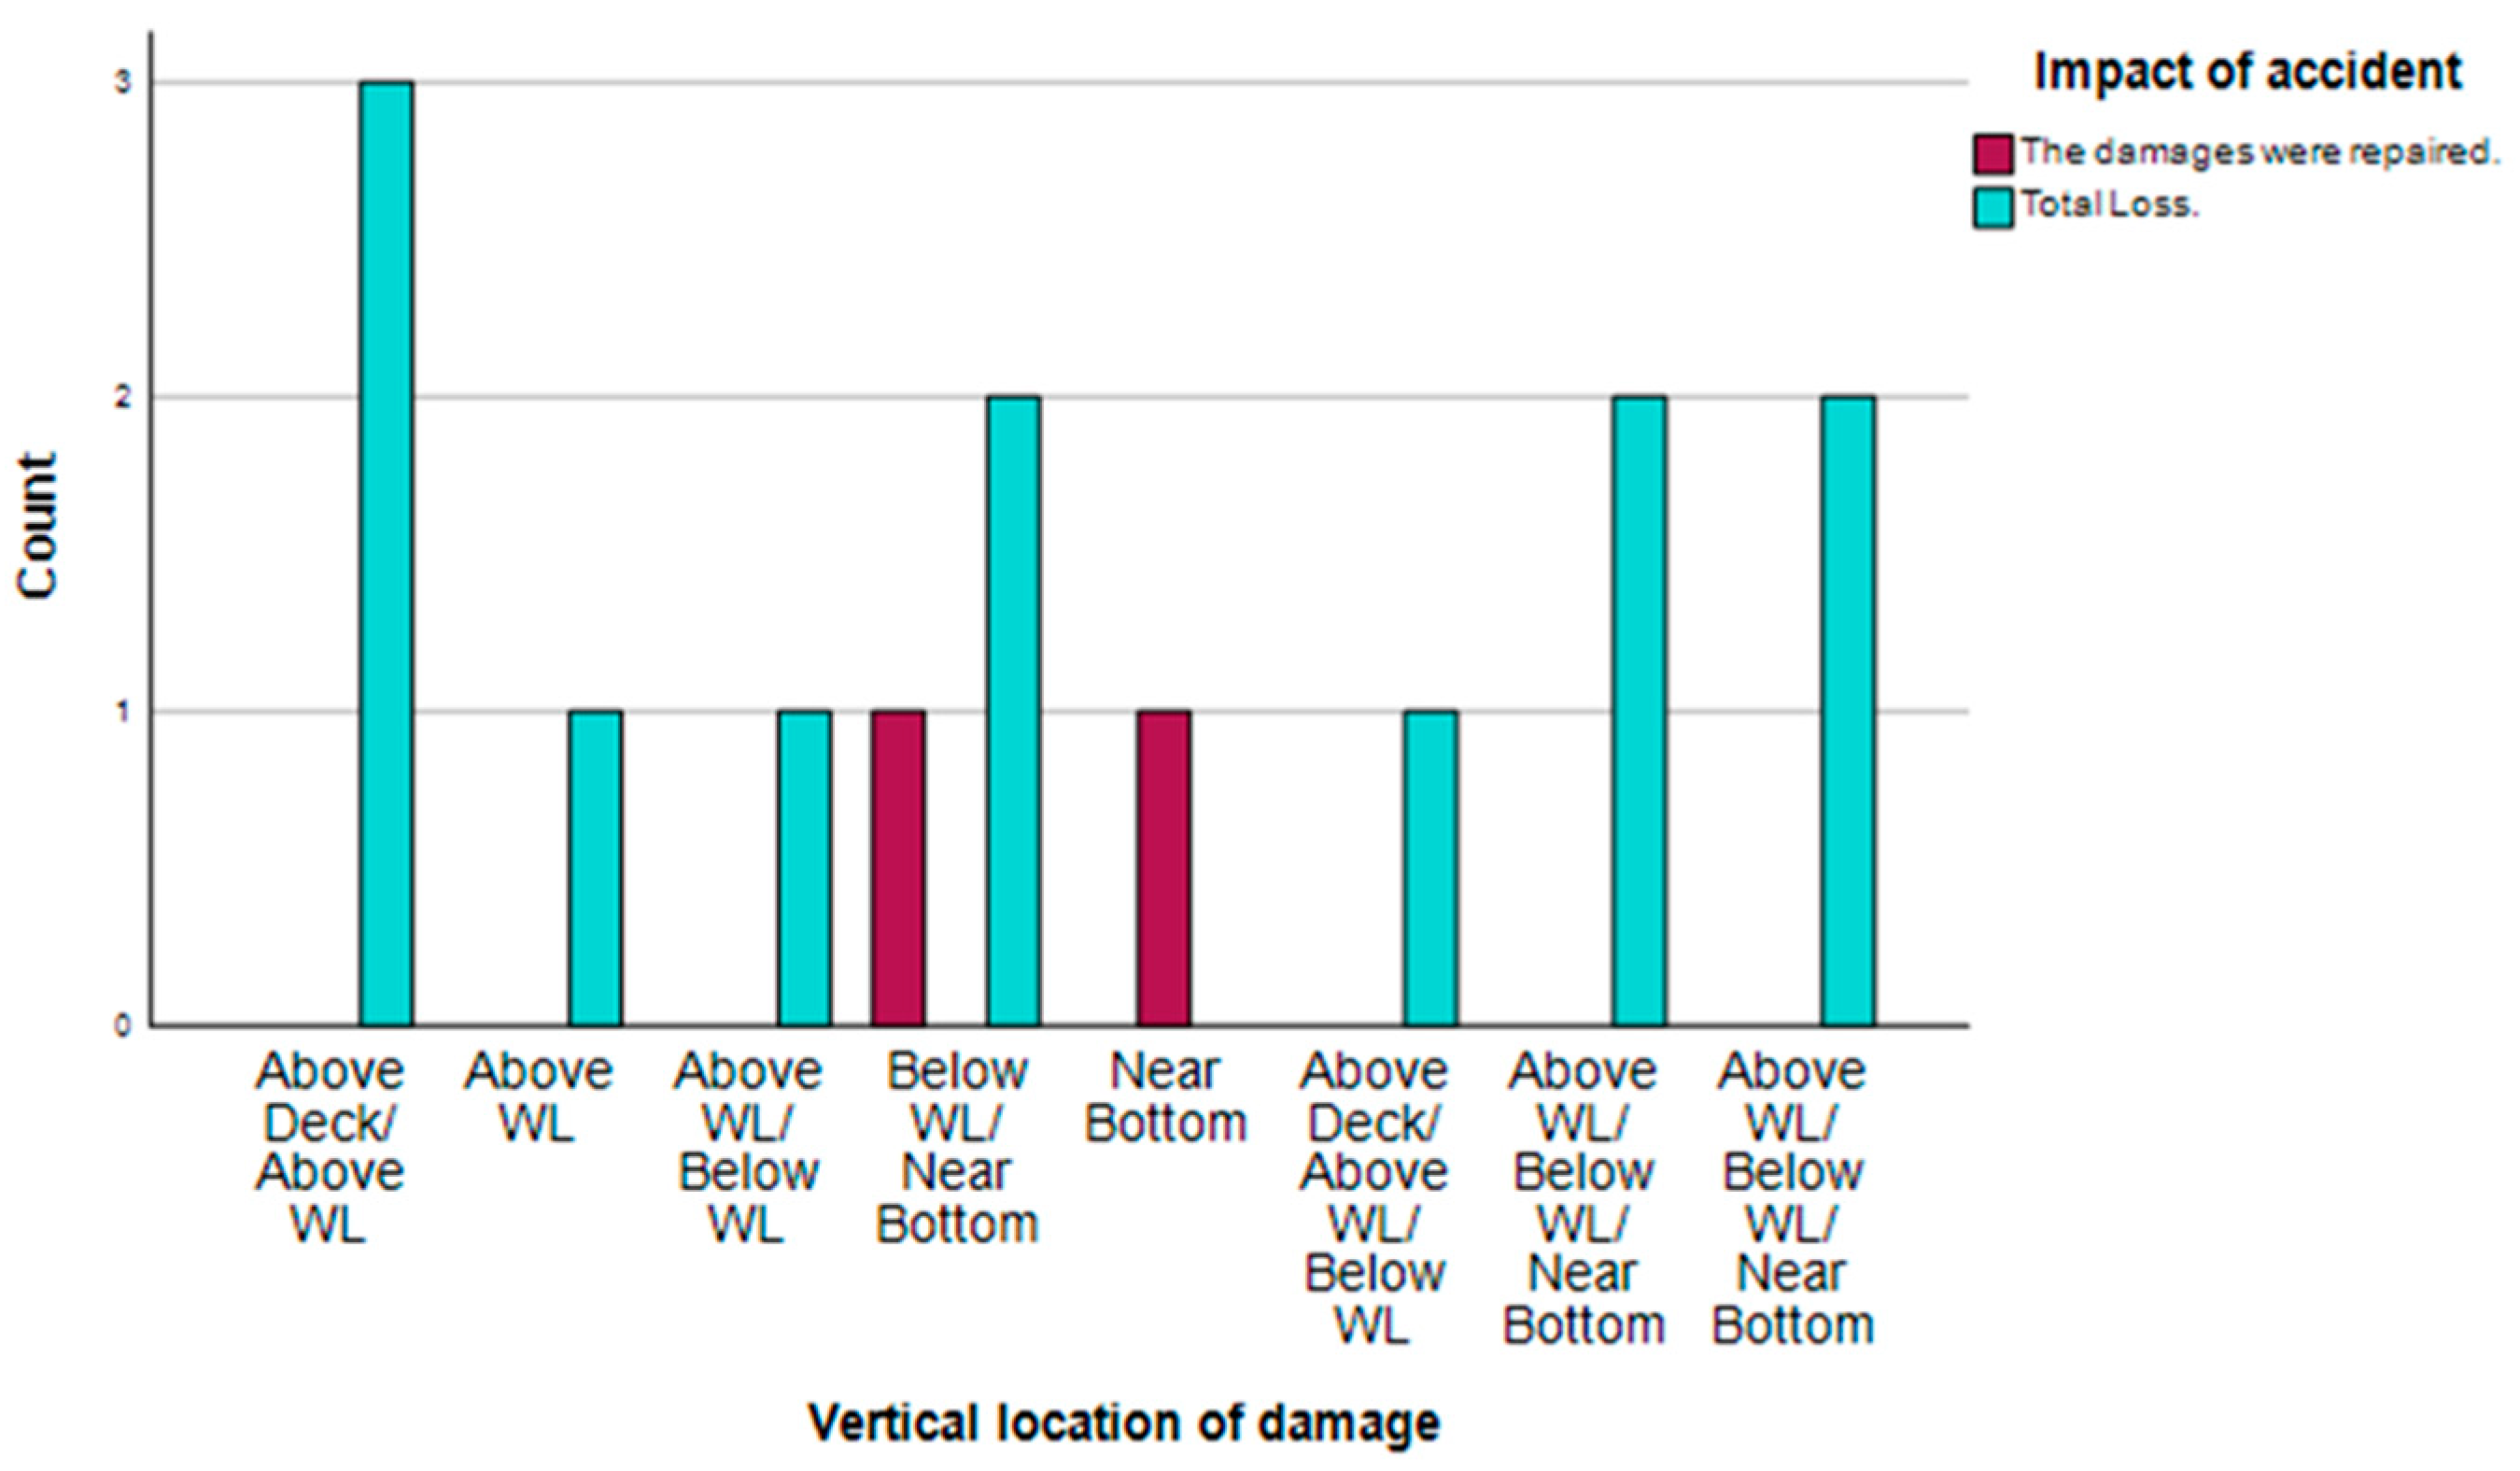
4.2.3. Structural Failure
- -
- Longitudinal extent of damage: 0.5 m–1.0 m; ship type: container ship and longitudinal extent of damage: 1 m–1.5 m; ship type: general cargo and bulk carrier;
- -
- Vertical extent of damage: 4 m–5 m; ship type: general cargo and vertical extent of damage: 5 m–6 m; ship type: container ship;
- -
- Vertical damage location: above WL/below WL/near bottom; ship type: bulk carrier;
- -
- Longitudinal damage location: 30 m–40 m; ship type: general cargo;
- -
- Impact of accident: total loss; longitudinal location: 30–40% LBP;
- -
- Type of casualty: very serious marine casualty; longitudinal location of damage: 30–40% LBP;
- -
- Impact of accident: total loss; vertical location: above deck/above WL;
- -
- Type of casualty: very serious marine casualty; vertical location: above deck/ above WL.
4.2.4. Chi-Square Tests
5. Discussion
6. Conclusions
Author Contributions
Funding
Institutional Review Board Statement
Informed Consent Statement
Data Availability Statement
Acknowledgments
Conflicts of Interest
Appendix A
- -
- Marine Accident Investigation Branch reports—GOV.UK https://www.gov.uk/maib-reports (accessed on 7 November 2022).
- -
- Marine Investigation Report—NTSB (National Transportation Safety Board)—USA.gov.
- -
- https://www.ntsb.gov/investigations/AccidentReports/Pages/Reports.aspx (accessed on 18 November 2022).
- -
- Marine Accidents and Incidents Investigation Committee Cyprus (MAIC) http://www.maic.gov.cy/mcw/dms/maic/maic.nsf/page03_en/page03_en?OpenDocument&Start=1&Count=1000&Expand=1 (accessed on 21 November 2022).
- -
- Marine safety investigation—Ministry of Transport and Communications—REPUBLIC OF BULGARIA
- -
- https://www.mtc.government.bg/en/category/198/marine-safety-investigation (accessed on 28 November 2022).
- -
- Danish Maritime Accident Investigation Board (DMAIB)
- -
- https://dmaib.com/ (accessed on 1 December 2022).
- -
- Danish Maritime Authority https://dma.dk/ (accessed on 5 December 2022).
- -
- Reports published—Bureau d’enquêtes sur les événements de mer (BEA MER)—FRANCE
- -
- https://www.bea-mer.developpement-durable.gouv.fr/reports-published-a586.html?lang=fr (accessed on 12 December 2022).
- -
- Federal Bureau of Maritime Casualty Investigation (BSU)—German Maritime Casualty Investigation
- -
- https://www.bsu-bund.de/EN/Home/home_node.html;jsessionid=666CC4F546C7F9EE7FAB1EBF018A4F12.live21304 (accessed on 16 December 2022).
- -
- Investigation Reports—Hellenic Bureau for Marine Casualties Investigation (HBMCI) https://www.hbmci.gov.gr/indexEng.htm (accessed on 19 December 2022).
- -
- Marine Casualty Investigation Board (MCIB)—Ireland https://www.mcib.ie/ (accessed on 22 December 2022).
- -
- Marine Investigation Reports—Transport Accident and Incident Investigation Bureau—Republic of Latvia
- -
- https://www.taiib.gov.lv/en/marine-investigation-reports (accessed on 27 December 2022).
- -
- Marine Safety Investigation Unit (MSIU)—Merchant Shipping (Accident and Incident Safety Investigation) MALTA
- -
- https://mtip.gov.mt/en/Pages/MSIU/Marine-Safety-Investigation-Unit.aspx (accessed on 29 December 2022).
- -
- Dutch Safety Board.
- -
- https://www.onderzoeksraad.nl/en/page/12061/shipping#eyJoYXNvYmplY3RzIjpbXSwiYW55a2V5d29yZCI6W10sInR5cGUiOiJsaXN0IiwiZmFjZXRzIjp7fX0= (accessed on 30 December 2022).
- -
- State Marine Accident Investigation Commission (SMAIC)—POLAND https://pkbwm.gov.pl/en/home/ (accessed on 2 January 2023).
- -
- Civil Maritime Transport—Swedish Accident Investigation Authority (SHK) https://www.havkom.se/en/om-shk/civil-sjoefart (accessed on 5 January 2023).
- -
- Transport Accident Investigation Commission (TAIC)—NEW ZEALAND https://www.taic.org.nz/inquiries?keyword=Collision&mode%5B5%5D=5&occurrence_date%5Bmin%5D=&occurrence_date%5Bmax%5D=&publication_date%5Bmin%5D=&publication_date%5Bmax%5D=&page=0 (accessed on 9 January 2023).
References
- IMO Publication. Casualty Investigation Code (Code of the International Standards and Recommended Practices for a Safety Investigation into a Marine Casualty or Marine Incident), 2008 ed.; IMO Publication: London, UK, 2008. [Google Scholar]
- EMSA European Maritime Safety Agency. Available online: https://www.emsa.europa.eu/ (accessed on 15 November 2022).
- IMO Casualty Analysis Procedure (Document FSI 17/WP.1, Annex 2). Available online: https://wwwcdn.imo.org/localresources/en/OurWork/MSAS/Documents/CASUALTY%20ANALYSIS%20PROCEDURE.pdf (accessed on 15 November 2022).
- Kristiansen, S.; Koster, E.; Schmidt, W.F.; Olofsson, M.; Guedes Soares, C.; Caridis, P. A New Methodology for Marine Casualty Analysis Accounting for Human and Organisational Factors. In Proceedings Conference on Learning from Marine Incidents; Paper No.14; Royal Institution of Naval Architects: London, UK, 1999; pp. 1–14. [Google Scholar]
- Graziano, A.; Teixeira, A.P.; Soares, G.C. Classification of human errors in grounding and collision accidents using the TRACEr taxonomy. Saf. Sci. 2016, 86, 245–257. [Google Scholar] [CrossRef]
- IACS International Association of Classification Societies. Available online: https://iacs.org.uk/membership/iacs-members (accessed on 27 December 2023).
- ABS. Guidance Notes on the Investigation of Marine Incidents; Updated 1 February 2014; American Bureau of Shipping: Houston, TX, USA, 2005. [Google Scholar]
- EMSA Annual Overview of Marine Casualties and Incidents 2022. Available online: https://emsa.europa.eu/csn-menu/items.html?cid=14&id=4867 (accessed on 30 December 2023).
- IBM SPSS Statistics. Available online: https://www.ibm.com/products/spss-statistics?lnk=ushpv18ct7 (accessed on 15 November 2022).
- Eliopoulou, E.; Papanikolaou, A.; Voulgarellis, M. Statistical analysis of ship accidents and review of safety level. Saf. Sci. 2016, 85, 282–292. [Google Scholar] [CrossRef]
- Soares, G.C.; Teixeira, A.P. Risk assessment in maritime transportation. Reliab. Eng. Syst. Saf. 2001, 74, 299–309. [Google Scholar] [CrossRef]
- Wu, B.; Yip, T.L.; Yan, X.; Soares, G.C. Review of techniques and challenges of human and organizational factors analysis in maritime transportation. Reliab. Eng. Syst. Saf. 2022, 219, 108249. [Google Scholar] [CrossRef]
- Kim, S.J.; Taimuri, G.; Kujala, P.; Conti, F.; Sourne, H.S.; Pineau, J.F.; Looten, T.; Bae, H.; Mujeeb-Ahmed, M.P.; Vassalos, D.; et al. Comparison of numerical approaches for structural response analysis of passenger ships in collisions and groundings. Mar. Struct. 2022, 81, 10325. [Google Scholar] [CrossRef]
- Taimuri, G.; Ruponen, P.; Yan, X.; Hirdaris, S. A novel method for the probabilistic assessment of ship grounding damages and their impact on damage stability. Struct. Saf. 2023, 100, 102281. [Google Scholar] [CrossRef]
- Hasanspahic, N.; Vujicic, S.; Francic, V.; Campara, L. The Role of the Human Factor in Marine Accidents. J. Mar. Sci. Eng. 2021, 9, 261. [Google Scholar] [CrossRef]
- Youssef, E.A.; El-Sayed, S.F.; Abdelkader, S. Maritime Accidents Analysis Using Maritime Human Factors and Analysis Model. Marit. Res. Technol. 2023, 2, 44–60. [Google Scholar] [CrossRef]
- Olgaç, T.; Bayazit, O. An investigation of the maritime accident in the Aegean Sea Turkish search and rescue region. Aquat. Res. 2023, 6, 83–96. [Google Scholar] [CrossRef]
- Wang, H.; Liu, Z.; Wang, X.; Graham, T.; Wang, J. An analysis of factors affecting the severity of marine accidents. Reliab. Eng. Syst. Saf. 2021, 210, 107513. [Google Scholar] [CrossRef]
- Lan, H.; Ma, X.; Ma, L.; Qiao, W. Pattern investigation of total loss maritime accidents based on association rule mining. Reliab. Eng. Syst. Saf. 2023, 229, 108893. [Google Scholar] [CrossRef]
- Ece, N.J. Analysis of Ship Accidents in the Strait of Istanbul. DSpace Repository. 2012. Available online: http://hdl.handle.net/20.500.12397/855 (accessed on 13 November 2023).
- Liu, X.; Yu, Q.; Hu, Y.; Lu, W.; Zhanga, A.; Bo, X. Cause Analysis of Ship Accidents Based on Chi-Square Test. In Proceedings of the 2nd International Conference on Big Data Economy and Digital Management, BDEDM 2023, Changsha, China, 6–8 January 2023. [Google Scholar] [CrossRef]
- Antao, P.; Su, S.; Teixeira, A.P.; Soares, C.G. Quantitative assessment of ship collision risk influencing factors from worldwide accident and fleet data. Reliab. Eng. Syst. Saf. 2023, 234, 109166. [Google Scholar] [CrossRef]
- Ventikos, N.P.; Stavrou, D.I.; Andritsopoulos, A. Studying the marine accidents of the Aegean Sea: Critical review, analysis and results. J. Mar. Eng. Technol. 2017, 16, 103–113. [Google Scholar] [CrossRef]
- International Chamber of Shipping. Shipping Industry Flag State Performance Table 2022/2023. Available online: https://www.ics-shipping.org/wp-content/uploads/2023/01/Shipping-Industry-Flag-State-Performance-Table-2022-2023.pdf (accessed on 1 November 2023).
- Deng, J.; Liu, S.; Xie, C.; Liu, K. Risk Coupling Characteristics of Maritime Accidents in Chinese Inland and Coastal Waters Based on N-K Model. J. Mar. Sci. Eng. 2022, 10, 4. [Google Scholar] [CrossRef]
- Zhou, X.; Ruan, X.; Wang, H.; Zhou, G. Exploring spatial patterns and environmental risk factors for global maritime accidents: A 20-year analysis. Ocean. Eng. 2023, 286, 115628. [Google Scholar] [CrossRef]
- Primorac, B.B.; Parunov, J.; Soares, C.G. Structural Reliability Analysis of Ship Hulls Accounting for Collision or Grounding Damage. J. Mar. Sci. Appl. 2020, 19, 717–733. [Google Scholar] [CrossRef]
- Özkan, U.; Umut, Y.; Ersan, B. Analysis of Grounding Accidents Caused by Human Error. J. Mar. Sci. Technol. 2015, 23, 19. [Google Scholar] [CrossRef]
- Zhang, Y.; Zhai, Y.; Chen, J.; Xu, Q.; Fu, S.; Wang, H. Factors Contributing to Fatality and Injury Outcomes of Maritime Accidents: A Comparative Study of Two Accident-Prone Areas. J. Mar. Sci. Technol. 2022, 10, 1945. [Google Scholar] [CrossRef]
- Eliopoulou, E.; Alissafaki, A.; Papanikolaou, A. Statistical Analysis of Accidents and Review of Safety Level of Passenger Ships. J. Mar. Sci. Eng. 2023, 11, 410. [Google Scholar] [CrossRef]
- Dominguez-Péry, C.; Tassabehji, R.; Corset, F.; Chreim, Z. A holistic view of maritime navigation accidents and risk indicators: Examining IMO reports from 2011 to 2021. J. Shipp. Trade 2023, 8, 11. [Google Scholar] [CrossRef]
- Kasyk, L.; ElizaWolnowska, A.; Pleskacz, K.; Kapuscinski, T. The Analysis of Social and Situational Systems as Components of Human Errors Resulting in Navigational Accidents. Appl. Sci. 2023, 13, 6780. [Google Scholar] [CrossRef]
- Yan, K.; Wang, Y.; Jia, L.; Wang, W.; Liu, S.; Geng, Y. A content-aware corpus-based model for analysis of marine accidents. Accid. Anal. Prev. 2023, 184, 106991. [Google Scholar] [CrossRef] [PubMed]
- Kim, S.-H.; Ryu, K.-J.; Lee, S.-H.; Lee, K.-H.; Kim, S.-H.; Lee, Y.-W. Analysis of Frequent Marine Accidents in Commercial Fishing Vessels: Focus on Fatal Accidents in Trap Boats and the Development of Preventive Guidelines. Preprints (www.preprints.org). 11 July 2023. Available online: https://www.preprints.org/manuscript/202307.0641/v1 (accessed on 4 December 2023).
- Demirci, S.M.E.; Elçiçek, H. Scientific awareness of marine accidents in Europe: A bibliometric and correspondence analysis. Accid. Anal. Prev. 2023, 190, 107166. [Google Scholar] [CrossRef] [PubMed]
- Cao, Y.; Wang, X.; Wang, Y.; Fan, S.; Wang, H.; Yang, Z.; Liu, Z.; Wang, J.; Shi, R. Analysis of factors affecting the severity of marine accidents using a data-driven Bayesian network. Ocean. Eng. 2023, 269, 113563. [Google Scholar] [CrossRef]
- Akhtar, M.J.; Utne, I.B. Human fatigue’s effect on the risk of maritime groundings—A Bayesian Network modeling approach. Saf. Sci. 2014, 62, 427–440. [Google Scholar] [CrossRef]
- Liao, S.; Weng, J.; Zhang, Z.; Li, Z.; Li, F. Probabilistic Modeling of Maritime Accident Scenarios Leveraging Bayesian Network Techniques. J. Mar. Sci. Eng. 2023, 11, 1513. [Google Scholar] [CrossRef]
- Kapoor, P.; Kapoor, Y.; Siddique, A. Towards a Harmonized Approach: Understanding Data Sources for Marine Incident and Accident Analysis. IIRE J. Marit. Res. Dev. 2023, 7. Available online: https://ojsiire.com/index.php/IJMRD/article/view/235 (accessed on 18 December 2023).
- Mehta, C.R.; Patel, N.R. IBM SPSS Exact Tests. Available online: https://www.ibm.com/docs/en/SSLVMB_27.0.0/pdf/en/IBM_SPSS_Exact_Tests.pdf (accessed on 5 November 2023).
- U.S. Energy Information Administration. Oil Tanker Sizes Range from General Purpose to Ultra-Large Crude Carriers on AFRA Scale. Available online: https://www.eia.gov/todayinenergy/detail.php?id=17991 (accessed on 15 November 2022).
- Paris MoU on Port State Control Inspection. Available online: https://www.parismou.org/ (accessed on 15 November 2022).
- Beaufort Wind Scale. Available online: https://www.researchgate.net/publication/306316637_Beaufort_Wind_Scale (accessed on 2 February 2022).
- Douglas Sea Scale (Adapted from World Meteorological Organization). Available online: https://www.researchgate.net/figure/3-Douglas-Sea-Scale-adapted-from-World-Meteorological-Organization_tbl1_289828752 (accessed on 15 November 2022).
- IMO. Casualty-Related Matters Reports on Marine Casualties and Incidents. Visibility (Table 9). MSC-MEPC.3/Circ.4/Rev.1. 18 November 2014. Available online: https://wwwcdn.imo.org/localresources/en/OurWork/MSAS/Documents/MSC-MEPC3/MSC-MEPC.3-Circ.4%20Rev%201%20%20Revised%20harmonized%20reporting%20procedures%20-%20Reports%20required%20under%20SOLAS%20regulations%20I21.pdf (accessed on 21 August 2023).
- Mindrila, D.; Balentyne, P. The Chi Square Test. In The Basic Practice of Statistics, 6th ed.; W. H. Freeman and Company: New York, NY, USA, 2013; Chapter 23; Available online: https://www.westga.edu/academics/research/vrc/assets/docs/ChiSquareTest_LectureNotes.pdf (accessed on 25 August 2023).
- Cochran, W.G. Some methods for strengthening the common χ2 tests. Biometrics 1954, 10, 417–451. [Google Scholar] [CrossRef]


| BULK CARRIERS | TANKERS | CONTAINER | PASSENGERS |
|---|---|---|---|
| Handysize Handymax | Small product Chemical tankers General purpose (GP) Medium range (MR) | Feeder Feedermax Early container ships Fully cellular | Small ships Small-midsize ships |
| Supramax Ultramax Panamax Kamsarmax | Long range | Panamax Panamax Max | Midsize ships |
| Post-Panamax | Aframax, Long Range 2 Suezmaz | Post Panamax I and II | Large ships |
| Capesize VLOC | VLCC ULCC | New-Panamax VLCS ULSCS | Mega-ships |
| Νο | Wind Force State | Sea State | Visibility | Natural Light |
|---|---|---|---|---|
| 1 | Calm | Calm | Good | Dark |
| 2 | Light Air | Smooth | Moderate | Light |
| 3 | Light Breeze | Slight | Poor | |
| 4 | Gentle Breeze | Moderate | Fog | |
| 5 | Moderate Breeze | Rough | ||
| 6 | Fresh Breeze | Very Rough | ||
| 7 | Strong Breeze | High | ||
| 8 | Near Gale | Very High | ||
| 9 | Gale | |||
| 10 | Severe Gale | |||
| 11 | Storm | |||
| 12 | Violent Storm | |||
| 13 | Hurricane |
| Variable A | Variable B |
|---|---|
Type of ship:
| Ship characteristics:
|
|
|
|
|
|
|
|
|
|
|
| DEADWEIGHT (T) | COLLISION (%) | GROUNDING (%) | STRUCTURAL FAILURE (%) |
|---|---|---|---|
| 0–1500 | 21.5 | 12.1 | 6.7 |
| 1500–2500 | 4.0 | 11.1 | 6.7 |
| 2500–5000 | 9.5 | 26.3 | 6.7 |
| 5000–10,000 | 12.5 | 20.2 | 6.7 |
| 10,000–15,000 | 6.0 | 3.0 | 0.0 |
| 15,000–20,000 | 3.0 | 5.1 | 0.0 |
| 20,000–30,000 | 5.0 | 5.1 | 6.7 |
| 30,000–40,000 | 9.0 | 4.0 | 6.7 |
| 40,000–50,000 | 7.0 | 5.1 | 6.7 |
| 50,000–60,000 | 3.5 | 2.0 | 6.7 |
| 60,000–100,000 | 11.0 | 3.0 | 26.7 |
| 100,000–150,000 | 2.5 | 2.0 | 0.0 |
| 150,000–200,000 | 3.0 | 0.0 | 6.7 |
| 200,000–500,000 | 1.5 | 1.0 | 6.7 |
| Not specified | 1.0 | 0.0 | 0.0 |
| SIZE OF VESSELS | COLLISION (%) | GROUNDING (%) | STRUCTURAL FAILURE (%) |
|---|---|---|---|
| Small | 69.5 | 78.8 | 40.0 |
| Medium | 20.0 | 15.2 | 33.3 |
| Large | 8.5 | 3.0 | 13.3 |
| Very Large | 1.5 | 3.0 | 6.7 |
| Ultra Large | 0.5 | 0.0 | 0.0 |
| AGE OF VESSELS | COLLISION (%) | GROUNDING (%) | STRUCTURAL FAILURE (%) |
|---|---|---|---|
| New (1–5 years) | 18.5 | 12.1 | 13.3 |
| Middle (5–25 years) | 64.5 | 58.6 | 53.3 |
| Old (25+ years) | 17.0 | 29.3 | 26.7 |
| FLAG RISK OF VESSELS | COLLISION (%) | GROUNDING (%) | STRUCTURAL FAILURE (%) |
|---|---|---|---|
| Low | 92.5 | 91.9 | 73.3 |
| Medium | 6.5 | 3.0 | 0.0 |
| High | 0.5 | 4.0 | 13.3 |
| Very high | 0.0 | 1.0 | 6.7 |
| Not registered | 0.5 | 0.0 | 0.0 |
| COLLISION (Characteristic/Factor—Corresponding Percentage) | GROUNDING (Characteristic/Factor—Corresponding Percentage) | STRUCTURAL FAILURE (Characteristic/Factor—Corresponding Percentage) | |
|---|---|---|---|
| DIMENSIONS OF SHIPS | |||
| Size | Small—70% | Small—79% | Small—40% |
| Deadweight | 0–1500T—22% | 2500–3000T—26% | 60,000–100,000T—27% |
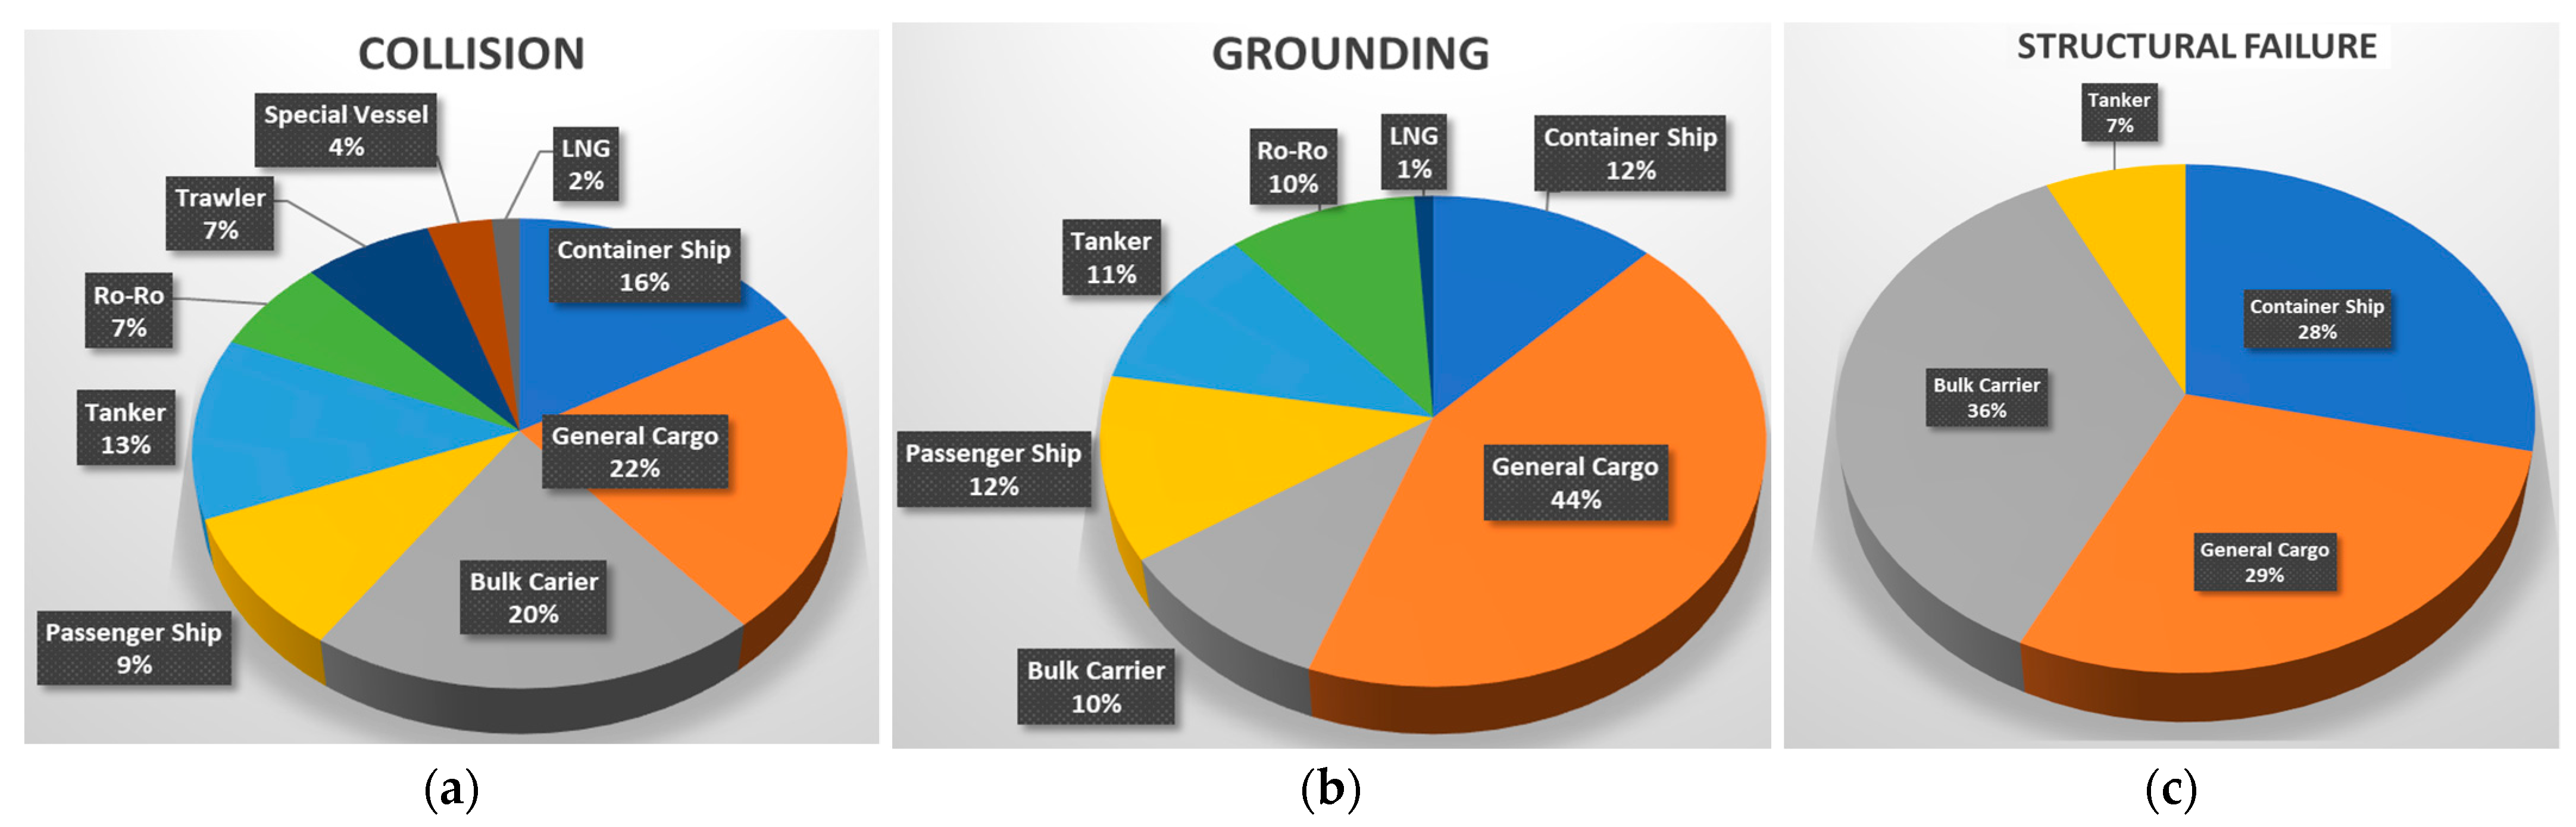
| TYPE OF SHIP | General cargo—23% & Bulk carriers—21% | General cargo—43% | Bulk carriers—40% |
| AGE OF SHIP | Middle—65% | Middle—59% | Middle—53% |
| FLAG RISK | Low—93% | Low—92% | Low—73% |
| CONDITIONS DURING THE ACCIDENT | |||
| Wind force | Gentle breeze—25% | Calm—30% | Fresh Breeze—27% |
| Sea state | Slight—35% and Moderate—30% | Moderate—22.2% and Slight Rough—22% | Rough—27% |
| Visibility | Good—61% | Good—75% | Good—60% |
| Natural light | Dark—59% | Dark—67% | Dark—50%/light—50% |
| EXTENT OF DAMAGE | |||
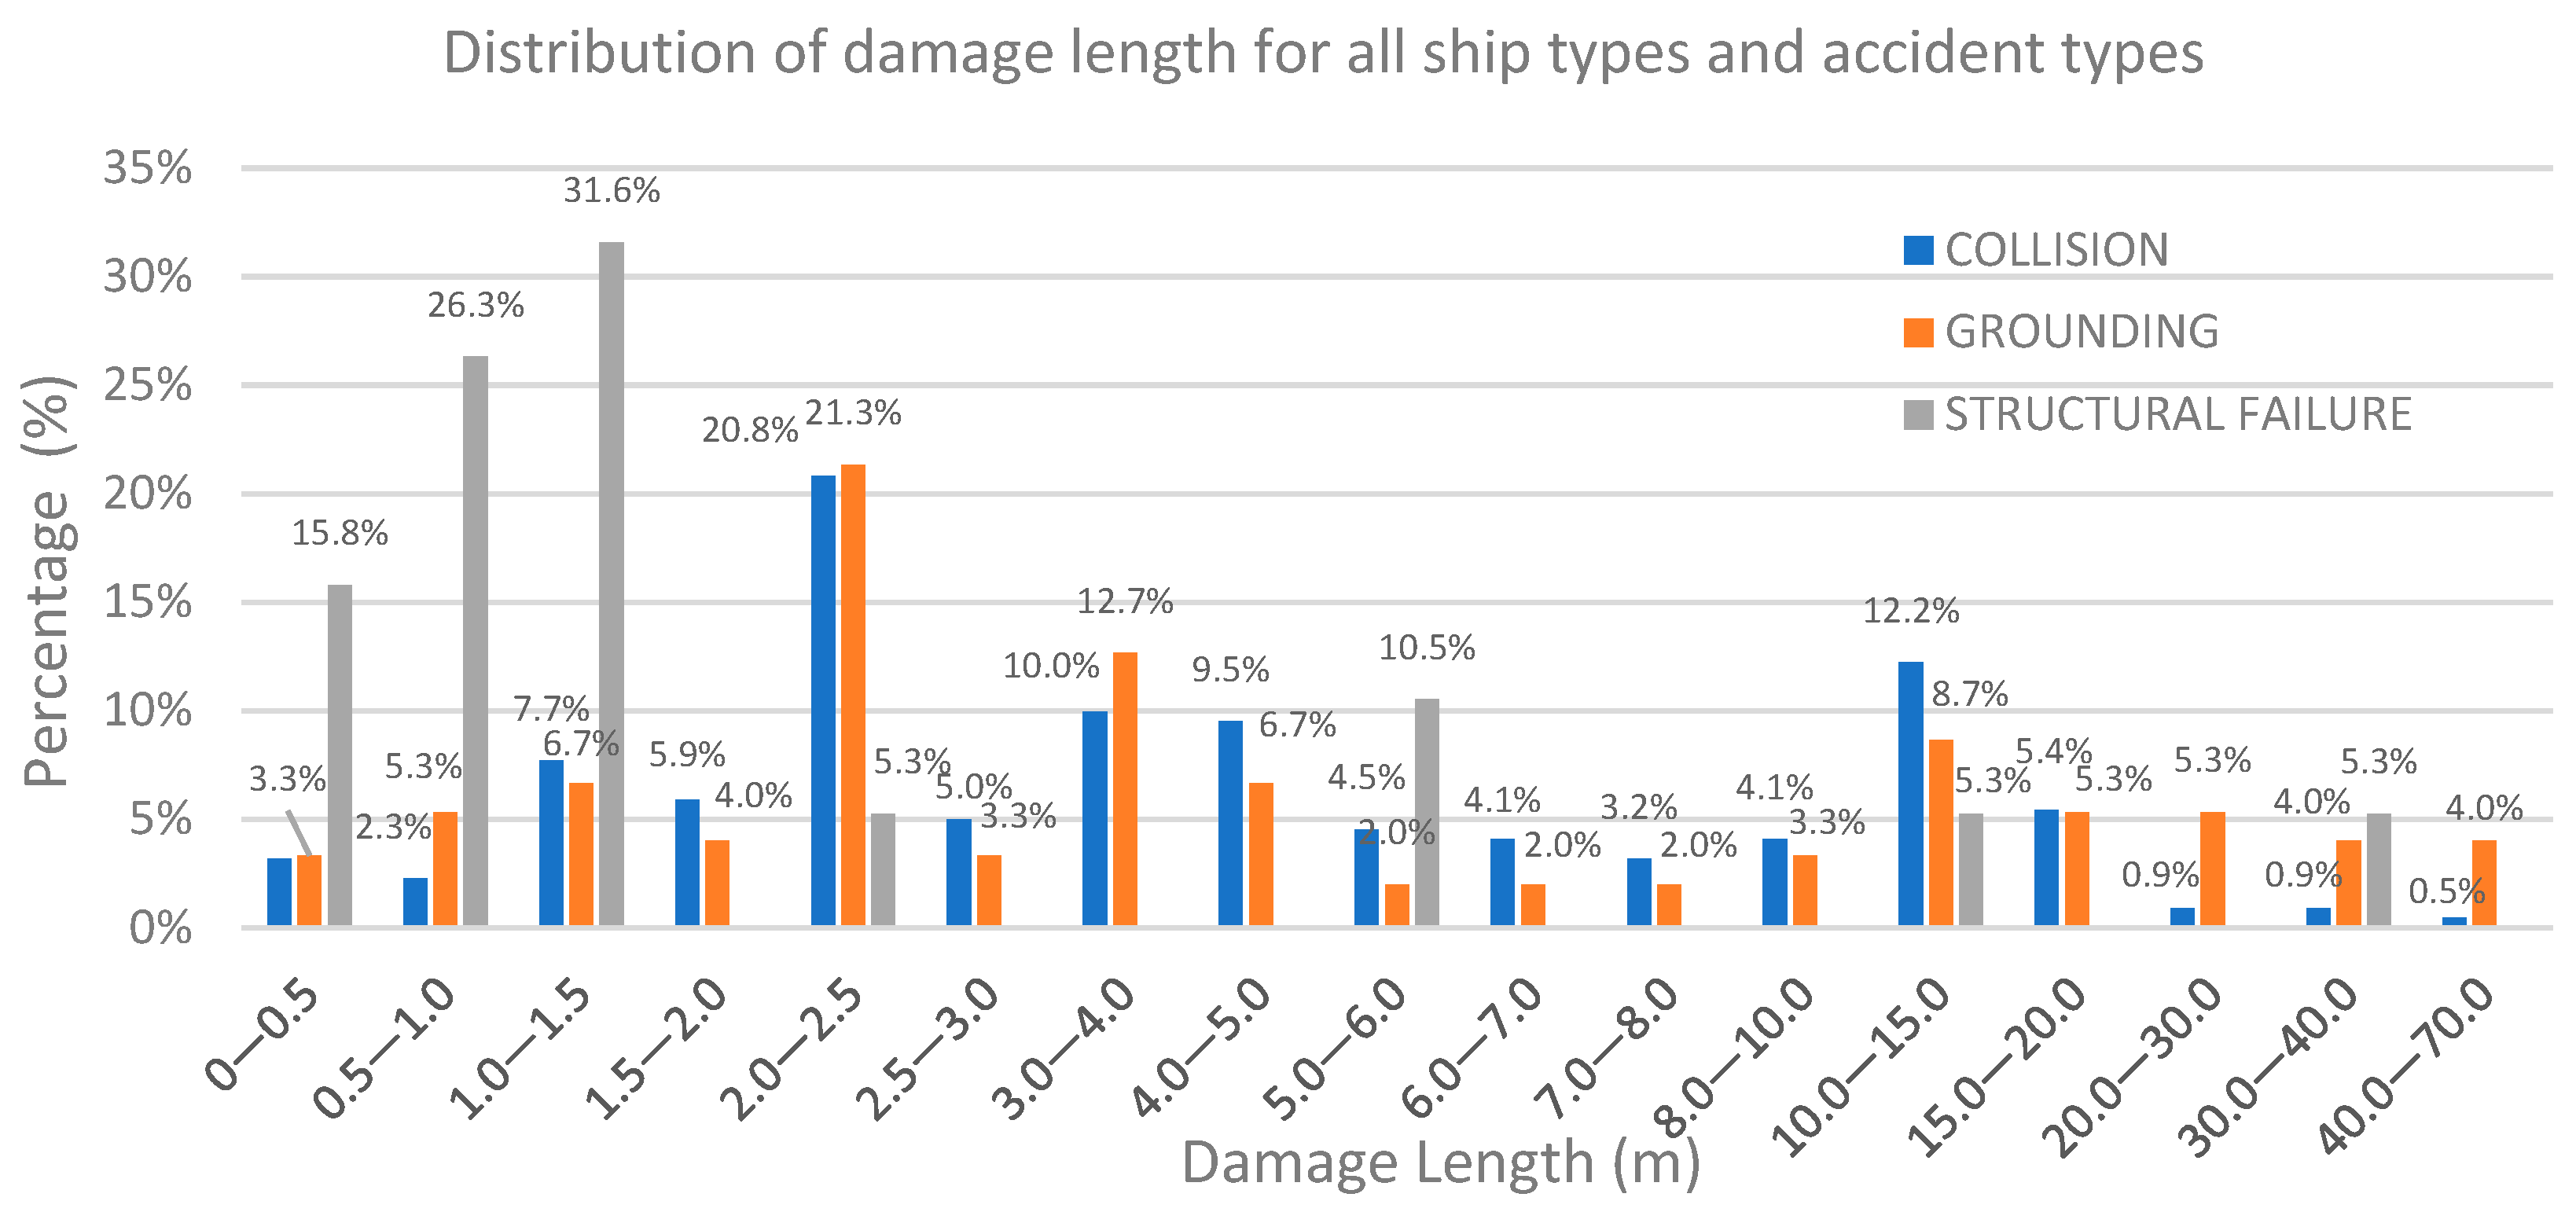
| Longitudinal | 2–2.5 m—21% | 2–2.5 m—22% | 1–1.5 m—32% |
| Vertical or transverse | 2–2.5 m—23% | 2–2.5 m—27% | 5–6 m—21% |
| Area | 10–15 m2—14% | 4–5 m2—13% | 10–15 m2—26% and 2.5–3 m2—21% |
| LOCATION OF DAMAGE | |||
| Longitudinal | 90–100% LBP—28% and 100% LBP-F.E.—24% | 90–100% LBP—19% | 40–50% LBP—29% |
| Vertical or transverse | Above waterline—22% and Above deck—19% | C.L.—12% and 0–8% (1/2B) starboard—12% | Above deck/above WL and below WL/near bottom—21%. |
| Side | Port side—39% | Starboard + CL + port side—23% | Starboard + CL + port—23% and center—18% |
| EMSA CAUSE ANALYSIS | Crew’s operational mistake—38% | Crew’s operational mistake—50% | Crew’s operational mistake—50% |
| Correlation Elements | Asymptotic Significance (2-Sided) | Monte Carlo Significance (2-Sided) |
|---|---|---|
| Type of vessel vs. size of vessel | 0.008 (a) 0.031 (b) | 0.005 (a) 0.027 (b) |
| Type of vessel vs. vertical size of damage | 0.022 (a) | 0.018 (a) |
| Type of vessel vs. longitudinal location of damage | <0.001 (a) | <0.001 (a) |
| Type of vessel vs. visibility | 0.018 (a) | 0.014 (a) |
| Type of vessel vs. age | 0.022 (a) 0.004 (b) | 0.018 (a) 0.003 (b) |
| Longitudinal location of damage vs. after damage (damages were repaired) | <0.001 (a) 0.016 (b) | <0.001 (a) 0.013 (b) |
| Vertical location of damage vs. type of casualty (serious marine casualty) | <0.001 (a) 0.049 (b) | 0.000 (a) 0.043 (b) |
| Vertical location of damage vs. after damage (damages were repaired) | 0.020 (a) 0.002 (b) | 0.016 (a) 0.001 (b) |
| Correlation Elements | Asymptotic Significance (2-Sided) | Monte Carlo Significance (2-Sided) |
|---|---|---|
| Type of vessel vs. size of vessel | <0.001 | 0.041 |
| Type of vessel vs. day/night period | 0.036 | 0.023 |
| Type of vessel vs. width of damage | 0.013 | 0.047 |
| Transverse damage location vs. impact of accident | 0.021 | 0.004 |
| Type of casualty vs. EMSA cause analysis | 0.016 | 0.012 |
Disclaimer/Publisher’s Note: The statements, opinions and data contained in all publications are solely those of the individual author(s) and contributor(s) and not of MDPI and/or the editor(s). MDPI and/or the editor(s) disclaim responsibility for any injury to people or property resulting from any ideas, methods, instructions or products referred to in the content. |
© 2024 by the authors. Licensee MDPI, Basel, Switzerland. This article is an open access article distributed under the terms and conditions of the Creative Commons Attribution (CC BY) license (https://creativecommons.org/licenses/by/4.0/).
Share and Cite
Pilatis, A.N.; Pagonis, D.-N.; Serris, M.; Peppa, S.; Kaltsas, G. A Statistical Analysis of Ship Accidents (1990–2020) Focusing on Collision, Grounding, Hull Failure, and Resulting Hull Damage. J. Mar. Sci. Eng. 2024, 12, 122. https://doi.org/10.3390/jmse12010122
Pilatis AN, Pagonis D-N, Serris M, Peppa S, Kaltsas G. A Statistical Analysis of Ship Accidents (1990–2020) Focusing on Collision, Grounding, Hull Failure, and Resulting Hull Damage. Journal of Marine Science and Engineering. 2024; 12(1):122. https://doi.org/10.3390/jmse12010122
Chicago/Turabian StylePilatis, Aggelos N., Dimitrios-Nikolaos Pagonis, Michael Serris, Sofia Peppa, and Grigoris Kaltsas. 2024. "A Statistical Analysis of Ship Accidents (1990–2020) Focusing on Collision, Grounding, Hull Failure, and Resulting Hull Damage" Journal of Marine Science and Engineering 12, no. 1: 122. https://doi.org/10.3390/jmse12010122