1. Introduction
This effort is an expansion of work presented at Oceans 2022 Hampton Roads [
1] where a design concept for a near-surface wave energy converter (WEC) profiling float was proposed with simulations and tank testing to explore the feasibility of the concept. Here, we expand on the methods used for tank testing, modeling, and simulations. Additionally, we propose a design methodology for the float and propose a final design with dimensions to be used in a future prototype.
Autonomous floats play an important role throughout the ocean sciences [
2,
3,
4]. To extend deployments beyond battery life limitations, some floats employ environmental energy harvesting such as solar [
3], wind [
5], and wave [
6] energy. Data buoys represent a small-scale application for WECs [
7].
Recent developments in wave power show that, for the scale of scientific floats, oscillating body style WECs have the highest efficiencies [
8]. Many oscillating body WECs harvest energy from the bobbing motion caused by buoyancy in oscillating flow for a semi-submerged body [
9]. However, that design requires an exposed surface expression to create variable buoyant force. Two-body systems can employ a buoyant surface float to drive a power take-off (PTO) system far below in the relatively still water [
6]. Drifting wave-energy harvesting robotic systems of this format have been shown to be capable of generating power [
10], holding station [
11], and traversing long distances [
12].
In [
13], the authors report an operational two-body WEC similar to the design presented here in that it employs a surface-tracking element and a sub-sea heave-plate connected with a compliant tether. Our work differs from this approach by virtue of the surface-tracking element being necessarily submerged. This adds the complication of requiring an active means of holding depth and creates an inherent trade-off between control authority and surface tracking fidelity. The cited WEC has been operationally deployed, whereas the present work is a design study.
Surface expressions are also not always feasible or desired due to environmental considerations. Extreme weather such as high winds or breaking waves can cause damage to fragile parts [
14,
15]. Even at a small distance below the surface, a device can acquire significant protection from damage. Locations at high latitudes such as the Irminger Sea are often of high interest for observation [
16,
17,
18]. Bio-fouling is also reduced at even a small depth from the surface. Unlike solar and wind, wave energy can be harvested from below the surface. However, most existing free-floating WECs rely on floating surface structures.
Additionally, without a surface expression, floats can operate without risk of detection. Such deployments may have data gathering applications for scientific, military, and industrial purposes. Military applications include adversary-controlled waters. Scientific and industrial applications include locations at risk of theft or vandalism.
Currently, few examples exist of a fully submerged free-floating WEC. A typical design for a free-floating WEC [
6] with a submerged heave-plate supplying the reaction force might employ a floating buoy to couple the system to the incident wave field. A typical subsurface WEC design might employ an anchor [
8] to supply the reaction force. In the first case, a strong coupling can be achieved via buoyancy. In the latter, an anchor provides an excellent ground. A trade-off exists in the present design between strong coupling to the orbital wave velocity and the device’s ability to control its depth and remain near the surface where available energy is highest.
A submerged WEC must also overcome the exponential loss of wave energy with depth [
19], so the device must operate close enough to the surface to harvest the required energy. However, due to the unpredictable nature of ocean waves, the risk of a surface breach increases with proximity to the surface requiring an active control system.
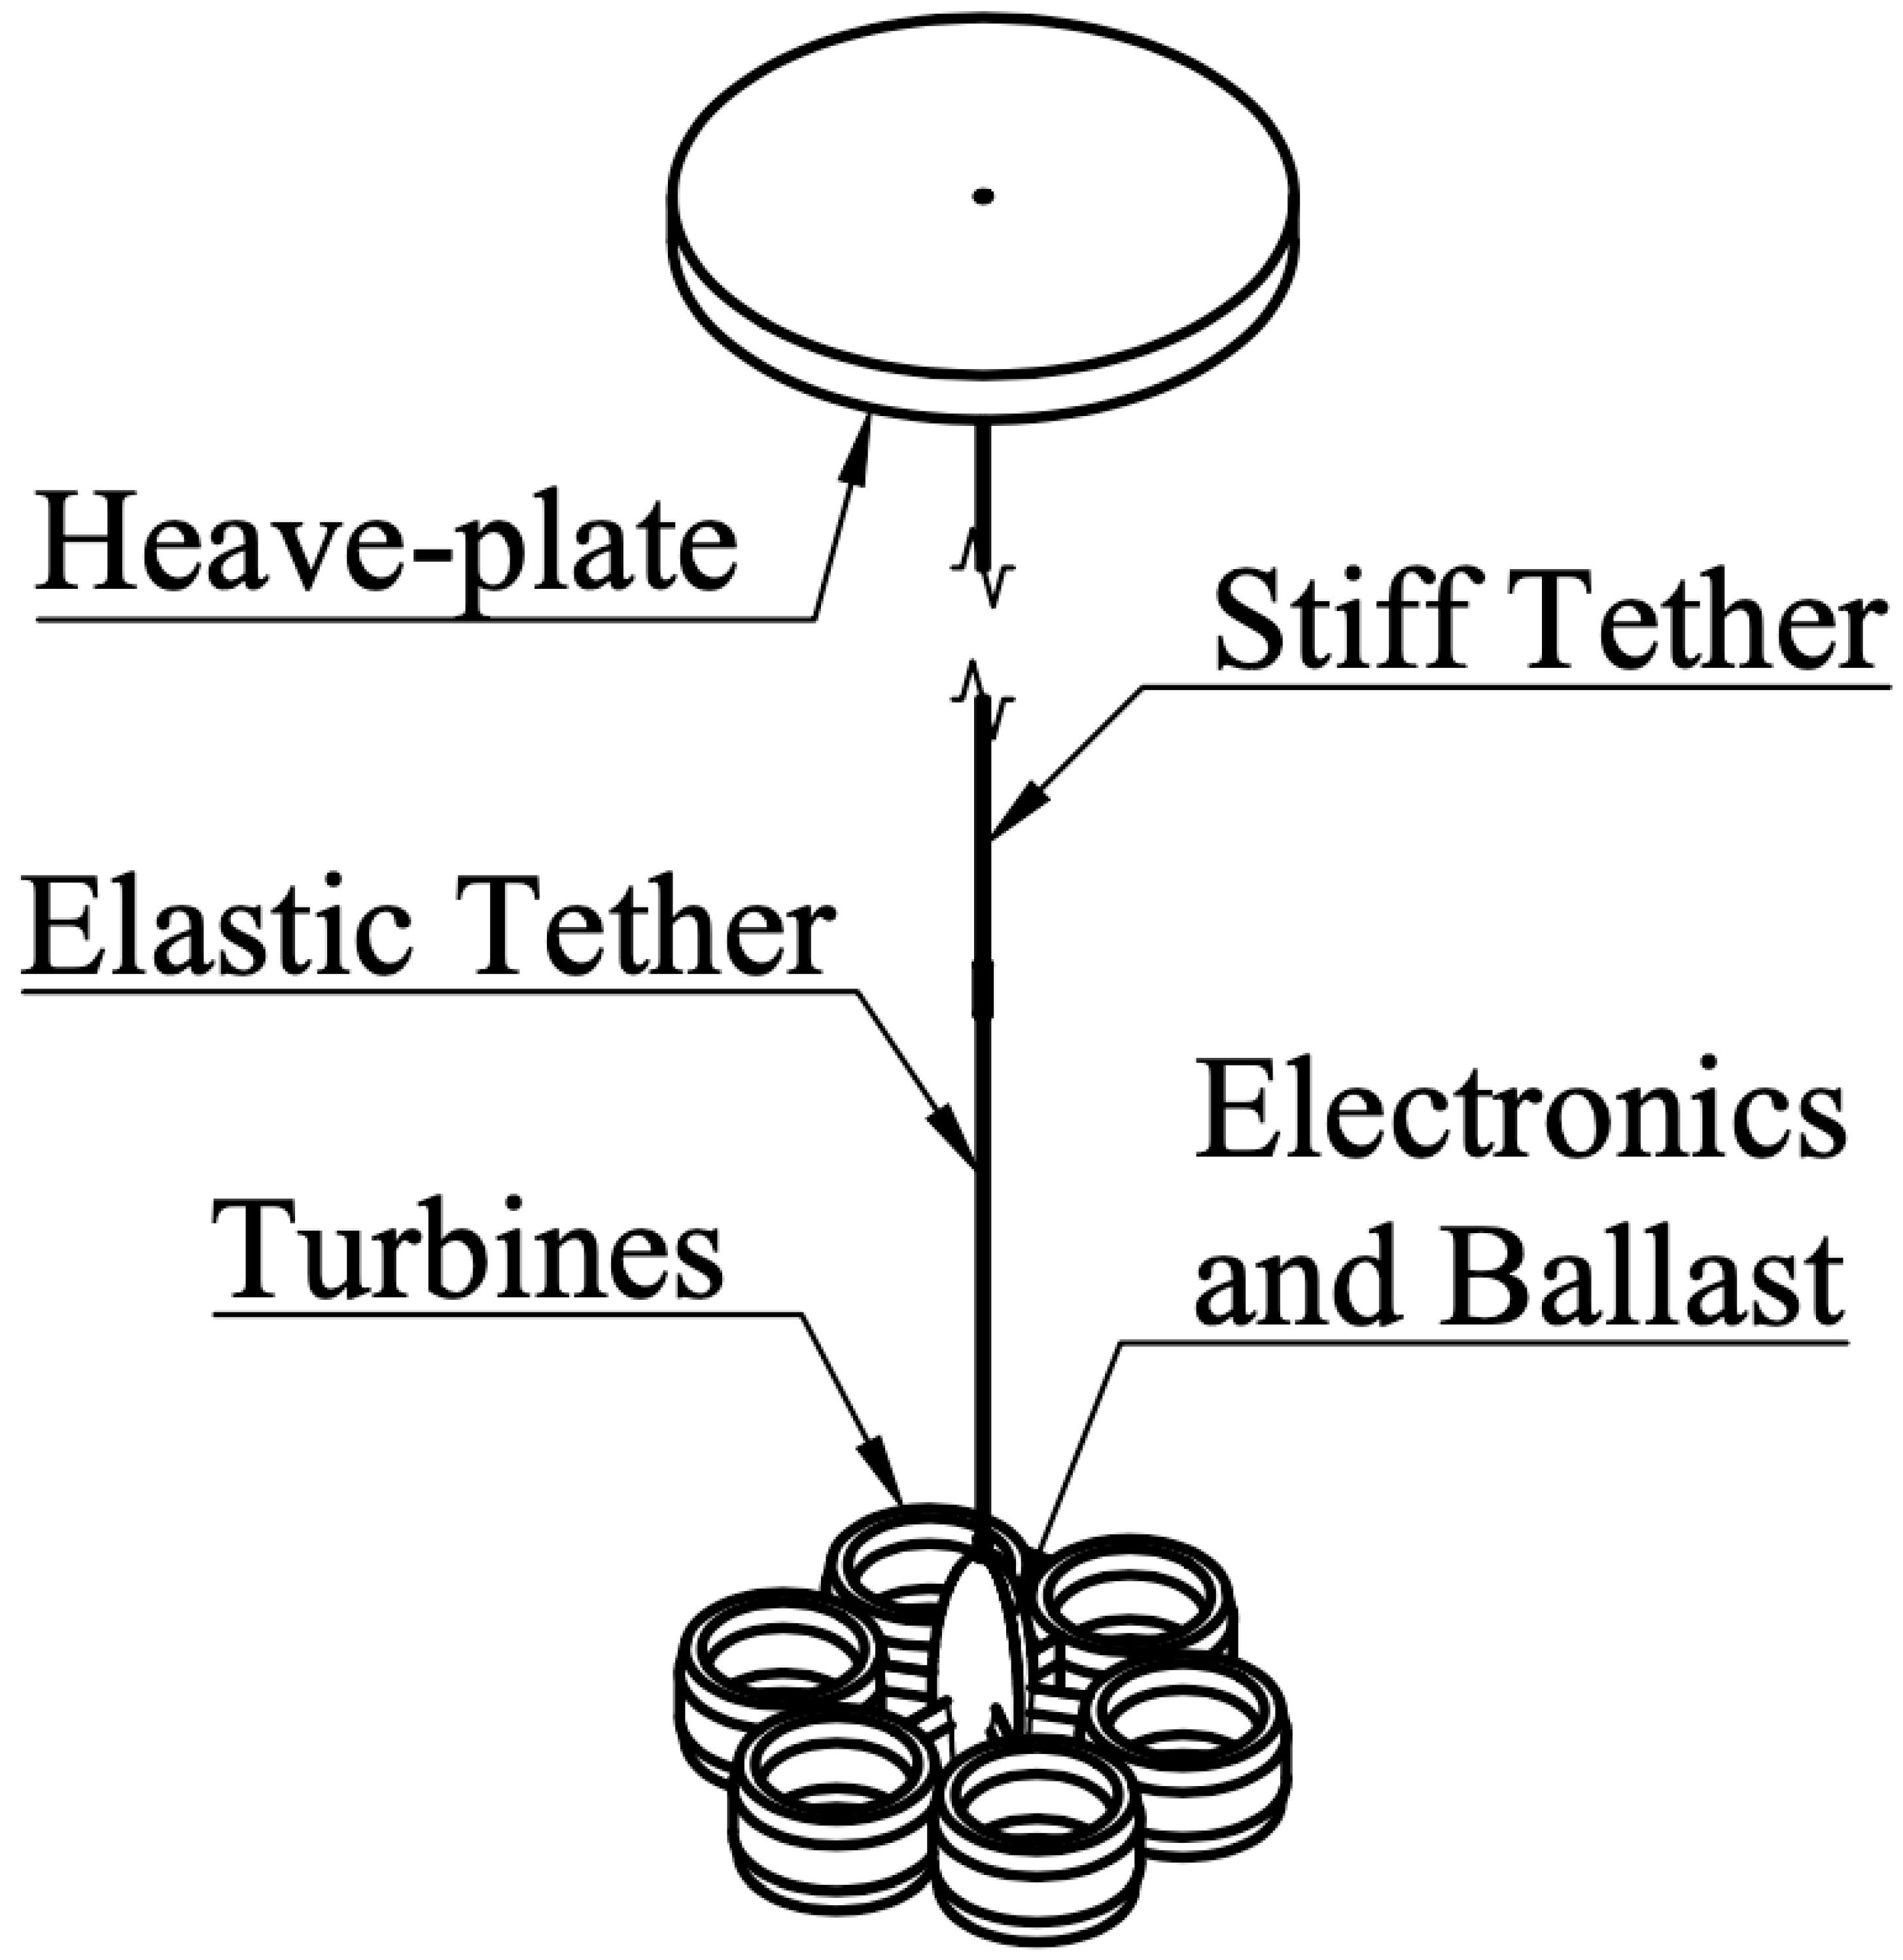
Our proposed design (
Figure 1) exploits the difference in the orbital velocities between near-surface and deep water. The device operates entirely submerged. A heave-plate transmits near-surface wave forcing through the long flexible tether into turbines attached to a negatively buoyant electronics pod. The pod’s turbines generate power through the flow caused by the oscillations of the pod through the deep water where wave-driven orbital motion is attenuated. To control depth, the turbines vary power extraction to vary system drag in sync with the pod velocity ratcheting the WEC up or down in water column.
The sizing of the proposed WEC depends on both power requirements and the expected wave environment. Depth control must be sufficient to avoid breaching while operating in proximity to the surface. Additionally, the device must be designed to avoid the tether going slack which would lower power generation and potentially cause damage from snap loads. A compliant tether could assist to damp out large oscillations without slacking and could also potentially exploit resonance.
This study explores the feasibility of the proposed design through the experimental validation of a model, exploring design parameters, and finally developing optimization guidelines for an operational device. Based on the power consumption of common floats [
20,
21], a feasible device would likely need to produce power of the order of several watts to charge a battery capable of powering the device. For example, assuming a float uses approximately 4
per 10 day cycle [
22], a WEC capable of harvesting just 1
of power could recharge the battery in just 4 h. A feasible design must generate sufficient power across a range of wave environments without breaching the surface or slacking the tether. Additionally, the dimensions of a feasible design must be buildable using commercially available materials.
We tested a prototype electronics pod which generated up to 1 of power in tank tests with small scale waves while matching expected motion using a model with fitted coefficients. Through further model simulations, we develop a design process based on non-dimensional parameters for creating feasible designs for different wave environments. We then use our design process to arrive at parameters for a full-scale device. We then analyze the performance of the full-scale device in simulation to show adequate power generation and depth control across a range of wind speeds. Finally, we report a potential design with major dimensions and simulation results showing the feasibility of the proposed design in a range of wave environments.
3. Tank Testing
We conducted tank tests to validate our mathematical model, explore the design space related to system resonance, and show the feasibility of generating power and control from the oscillating turbines on an elastic tether. For the tests, a prototype pod was suspended in a vertical test tank and oscillated using a custom-built testing apparatus (
Figure 5) designed to simulate, through force-feedback, the effect of suspending the pod beneath the heave-plate using an elastic tether.
We conducted tank tests to validate our mathematical model, to explore the design space related to system resonance, and to show the feasibility of power generation and depth control of the concept. For the tests, a prototype pod was suspended vertically in the test tank and oscillated using a custom-built apparatus (
Figure 5) designed to simulate, through force-feedback, the effect of suspending the pod beneath the heave-plate on an elastic tether in a wave field.
3.1. Testing Apparatus
We designed and fabricated an experimental apparatus (
Figure 5) consisting of a 4 m vertical slide (Bosch, Stuttgart, Germany) driven by a 5 hp Clearpath servo motor (Teknic, Inc., Victor, NY, USA) with the pod or various test articles suspended below in a 4 m deep tank at WHOI. Initially, the device was commanded to follow a closed-loop position trajectory, either a monochromatic wave-form or a realization of the PM spectrum. These tests simulated an inextensible tether. Physical springs of sufficiently low elasticity to excite resonance proved unworkably long. To simulate the effect of an elastic tether, we instead measured vertical force on the pod and fed the result into a controller that issued torque commands to the motor.
1A load cell between the sliding stage and a stiff polypropylene rope attached to the submerged device provided the measurement of vertical force on the pod.
The essential idea was to mimic the effect of a physical spring by closing the loop on force such that the measured force
was driven to the theoretical (desired) force
created by a virtual linear spring between the virtual surface, specified as a time-varying waveform
, and the actual, measured pod depth
z:
where
denotes a spring constant altered in software for each experiment.
A naive implementation of the controller would command motor torque
according to
where
K denotes a proportional gain that also captures the mechanical conversion between motor torque and the force applied to the stage.
Actual implementation required compensating for preload, inertia, and non-linear Coulomb friction in the apparatus, while also attenuating control action at high frequencies to limit the excitation of structural resonances in the physical system. Coulomb friction compensation was necessary to prevent the system from occasionally stalling when reversing direction. Feed-forward compensation improved the dynamic response.
Figure 6 shows performance and internal control signals from an example run. Overall, tracking between the ideal virtual tether force (
15) and force measured by the load cell was satisfactory; however, the first mechanical mode of the apparatus was sufficiently low in frequency that we were unable to completely eliminate exciting this mode without also compromising tracking performance. Attenuating control action at frequencies above the virtual surface wave frequency was effective at preventing the amplification of these oscillations and potential system instability. The impact on the turbine performance measurements is small; the oscillations in force are small relative to the virtual spring forces and are further attenuated in the pod’s velocity.
3.2. Prototype Pod
A prototype pod was suspended in the vertical tank from a load cell on the test apparatus arm, as seen in (
Figure 5). The prototype consists of an aluminum frame holding a cylindrical electronics housing and ballast. The frame has two arms, each supporting a WaterLily Turbine
2 (Seaformatics Systems Inc., St. John’s, NL, USA). The WaterLily Turbine is a three-bladed ducted propeller turbine with a 150 mm diameter duct. It is designed for uni-directional flow, resulting in an asymmetrical design. It is expected to have inconsistent results depending on the direction of flow. Its asymmetrical design results in variable performance that depends on flow direction (
Figure 7). WaterLily turbines were selected for the tests because the turbines are commercially available, waterproof, and appropriately sized. Waterlilies have high solidity resulting in high drag when stalled. The three phases of each turbine were connected to an electronic commutation circuit that included the ability to duty cycle the combined output between open-circuit and across a resistor. Power across the resistor was measured throughout testing. To alter the turbine power extraction, the duty cycle could be altered between 100% and 0%, with 100% corresponding to maximum power extraction somewhat below peak and 0% corresponding to minimum power extraction. Maximum power generation is expected to occur between these extremes; however, in this work, we consider a bang-bang controller switching between only an open or closed circuit across the turbine windings, resulting in high and low (but not necessarily maximum and minimum) modes for control drag and power extraction. The high-solidity turbine has higher drag with the closed circuit. Under the closed circuit, current is passed through a resistor allowing for a measurement of power extraction. This effort focuses on switching an open and closed circuit for concept development.
3.3. Testing Procedure
All tests used the same prototype, and the virtual surface input was a consistent monochromatic spectrum. Wave amplitude was limited by the height of the tank and amplitude gain at resonance. The spectrum had wave height and period corresponding to the wave energy period and significant wave height of a PM spectrum at a wind speed of 4 and a theoretical wave power of 235 . Using the PTO duty cycles, tests were performed with the turbines at maximum and minimum (free-wheeling) resistance. For each configuration, we tested the prototype across a range of virtual tether stiffnesses, representing designs with different natural frequencies including values significantly above and below the forcing frequency.
3.4. Tank Test Model
For the purpose for tank testing, we simplified the model to ignore heave-plate dynamics and assumed perfect coupling between the heave-plate and surface heave (Equation (
17)), resulting in a somewhat higher power output than the same prototype would have operating with a real heave-plate. Model input is the heave velocity
, which is a function of time
t based on the wave spectrum.
The simplified model has two additional parameters: pod added mass
and pod (parasitic) drag constant
. This differed from the base model (Equation (
13)) where pod mass and added mass are lumped together and parasitic drag is assumed to be insignificant. However, the prototype has relatively small turbines compared to pod size, resulting in significant parasitic drag. Additionally, the model input is heave-plate velocity
as a function of time
t, which is assumed to perfectly track the wave-field. The modified equation of state
can be integrated and rearranged (Equation (
18)) into the format of a quadratically damped harmonic oscillator.
3.5. Test Results
The system was tested with a single pair of turbines across a range of tether stiffnesses to determine the effects of resonance. Tests conducted at the maximum and minimum turbine drags show controllability potential. High drag tests were conducted at maximum power takeoff, while low drag tests were conducted with freewheeling turbines. Comparison tank simulations use the fitted coefficients for drag, added mass, turbine thrust, and power. Additional ideal simulations showed comparisons for a Betz limited turbine.
Parameters (
Table 1) were fit to tests using Equations (
19) and (
20). The power and thrust coefficients are then calculated using Equations (
22) and (
23). Tether force
is derived from Morison’s equation (Equation (
2)) to include pod mass and parasitic drag for motion in a still fluid. The first tank run was performed with the turbines freewheeling
to isolate added mass
and parasitic drag
. For the second run, the Pulse Width Modulated (PWM) control signal was set to 100% duty cycle resulting in both power extraction and increased turbine resistance. The influence of turbine resistive thrust
is calculated (Equation (
21)) using the difference between the RMS values of the high-power extraction runs (Equation (
19)) and the low-power extraction runs (Equation (
20)). The power coefficient
is computed from measured power
. Pod mass
was measured in air and used to calculate the other parameters. All the coefficients are susceptible to over-fitting due to the limited data set. To mitigate over-fitting, the values are fitted to data for individual runs and the median values are used. Finally, we simulated the system using both the fitted parameters and ideal parameters and compared the simulated results to measured results.
The two WaterLily turbines each have a diameter of 150 resulting in a total turbine area of . The thrust coefficient and power coefficient are each a single value for the entire period. Both are very low due to the use of an inefficient turbine. Scaling the control signal through the PTO system’s PWM duty cycle scales both these values. In the tank test, we only used 0% and 100% duty cycles.
The model (Equation (
17)) was then simulated using fitted coefficients (
Table 1) and the same input heave velocity
from each run to compare how the model matched the measured results. An example (
Figure 7) from the tank testing showing a single tether stiffness
K of the high-power extraction run shows a close match between simulated results using fitted parameters and measured results, which is consistent throughout the tests. In all tests, measured turbine power slightly lags the simulated results and the velocity. This is likely due to the high rotational inertia of the test turbines which place the rotating magnetic coil in the turbine rim. Additionally, the measured power results are asymmetric, showing greater power generation for positive velocity, likely due to the turbine ducting which is designed for single directional flow.
The results from the tank tests (
Figure 8) show a resonant peak for both power and gain observed at a tether stiffness around 150 N/m. At lower stiffnesses, gain and power drop off quickly to zero, while at higher stiffnesses, both gain and power appear to converge with gain approaching one as expected. Across all tank tests, the results show the close correlation between the simulated results from fitted parameters and the measured results. However, the tests showed lower gain than predicted by the simulations using fitted parameters, especially at resonance. The simulations using ideal parameters show much higher damping at especially near-resonance. The increased damping will theoretically increase system controllability. The power extraction values from the ideal turbine simulations are about an order of magnitude higher than the fitted and measured simulations.
When plotted against turbine KC number (
Figure 9), gain becomes approximately linear and power extraction becomes approximately quadratic.
Figure 10 shows the RMS values for measured and ideal turbine thrust and extracted power as a function of the pod RMS velocity and the fitted coefficients for power and thrust. Across the measured pod RMS velocities, the coefficient values are within a factor of two except for two outliers in the thrust coefficient at low velocities.
Simulations based on the final fitted parameter values (
Table 1) are shown compared to the measured data for an example tank run time series (
Figure 7) and in the summary (
Figure 8) of all tank data. The assumption of constant turbine coefficients is a significant simplification of turbine performance. However, the good match between our model and the measured data suggests that the model may be used for recommendations of a full-scale version of a similar design.
Particularly for the measured results and simulations from fitted parameters, the difference in velocity gain from low to high power extraction is not very large. The prototype is dominated by parasitic drag from the pod due to both the high drag of the prototype pod and the low thrust of the small total turbine area. The tank simulations using ideal turbine parameters show much higher turbine thrust and significantly greater velocity damping, especially at resonance. Effective system control relies on turbine thrust dominating overall system drag and is obtainable through larger turbine areas and/or higher thrust coefficients.
The tank tests validated the technique of fitting pod and turbine characteristics to our simplified model to predict a dynamic response and power generation. However, the tests were limited to a single prototype design under small wave amplitudes limited by the height of the tank. The tests also used the simplified model (Equation (
17)), which does not take into account the heave-plate’s impact on both power conversion and control. The tank test is equivalent to the full system model with an infinitely large heave-plate. The large parasitic drag of the prototype significantly impacted the power generated; however, the power generated was measurable and corresponded well to predictions from model, suggesting that further development of a deployable system could be carried out analytically and in simulation.
4. Simulation Results
4.1. Approach
To evaluate a wider range of design parameters consisting of tether stiffness, pod mass, total turbine area, and heave-plate diameter, simulations were performed of the dynamic model (Equation (
13)). Inclusion of the heave-plate dynamics increases model complexity compared to the tank tests. This complexity is important to capture because the imperfect surface tracking of the heave-plate contributes to both power conversion and controllability.
Full system simulations were performed for 5000 uniformly randomly selected parameter sets using the dynamic model (Equation (
13)) developed earlier. Simulations set the power coefficient
to the fitted coefficients from the tank tests while at maximum turbine power extraction, along with other simplifying assumptions, and therefore present an inefficient case for power output. Optimized turbines can be expected to perform much better. Large parameter value ranges beyond reasonable limits ensured that extrema were for the model. Simulations were forced with a monochromatic wave-field having the same significant wave height and energy period as a PM spectrum of equivalent wind speed. The initial simulations were limited to monochromatic spectrum at a single wind speed (8
). Selected designs were also simulated across a range of wind speeds and using a full PM spectrum to confirm performance in a more realistic environment.
The simulations use a bang-bang controller (
Figure 3) which defaults to maximum power extraction and thrust except when the turbines are moving in the opposite direction as heave-plate depth error
. For all simulations, the device starts with the heave-plates at the surface and the controller is given a desired depth
equal to the significant wave height of the wave spectrum. Devices unable to exert any control remain at the surface.
4.2. Non-Dimensionalized Results
Summary results from all simulations are presented (
Figure 11) in a non-dimensional form. The independent non-dimensionalized design parameters (discussed separately below) are the frequency ratio, the heave-plate KC number, a drag ratio of turbines to heave-plate, and a mass ratio between pod mass and heave-plate-added mass. Several examples (
Table 2) to be discussed in more detail are marked on the plots.
The system can be described by just three of these non-dimensional ratios. However, a fourth is shown as these values all represent physically understandable relationships between the design and environment as well as the designs of the upper and lower bodies. Descriptions of the four non-dimensional ratios follow.
4.2.1. Frequency Ratio
The ratio of a design’s natural frequency of oscillation to the inverse of the wave period (
Figure 11 col. 1) is given by
. This quantity is referred to as the frequency ratio for the sake of brevity. Power extraction efficiency shows a peak at resonance. At frequencies above resonance, the power extraction efficiency falls off very quickly. Some broadband devices are able to produce high power but slacking is common in this region. Resonance also decreases controllability due to the phase delay reducing time where the turbines can effectively exert control.
4.2.2. KC Number
The heave-plate KC number (
Figure 11 col. 2), given by
, is a comparison of the inertial versus drag forces on the heave-plate. High KC numbers, representing undersized heave-plates, cause power extraction efficiency to drop off quickly because small heave-plates experience less wave forcing. Low KC numbers, representing oversized heave-plates, track the surface very closely from the combined effect of large added mass and increased drag. If wave forcing is very large, turbine resistive thrust may not be large enough to effectively exert control over device depth. Lower KC numbers also experience an increased risk of tether slacking. The imperfect surface tracking of smaller heave-plates may provide additional damping for large wave oscillations at the expense of reduced power generation. The device as a whole is neutrally buoyant and the heave-plate always submerged, thus the buoyancy of the heave-plate itself does not impact performance. The heave-plate model employed here is appropriate for heave-plates with a characteristic diameter much smaller than the forcing wavelength (wave diffraction and radiation are assumed negligible and the pressure field from orbital wave motion uniform).
4.2.3. Drag Ratio
The turbine to heave-plate drag ratio (
Figure 11 col. 3), given by
, compares total turbine resistive thrust to heave-plate drag. Controllability depends heavily on this ratio. Excessively high drag ratios, representing high drag turbines, fail to produce power because the high drag stifles the motion required to generate flow for power generation. Excessively low drag ratios, representing undersized turbines, also fail to generate power and are unable to exert control over a large heave-plate. Exceptions exist, including Ex. 2, which are all highly resonant designs which are sensitive to design parameters and therefore likely difficult to build. Effective turbine area can be reduced by electronically decreasing power take-off.
While drag ratio could be further simplified to an area ratio, the drag ratio more accurately represents the physical realities by incorporating the drag and power coefficient into the non-dimensional parameters allowing comparisons across turbine designs.
4.2.4. Mass Ratio
The mass ratio
compares pod inertia to heave-plate inertia (
Figure 11 col. 4). Excessively high mass ratios, representing undersized heave-plates compared to device size, produce little power or control since the large pod inertia is not significantly affected by heave-plate forcing. Excessively low mass ratios, representing undersized pod masses, cause the pod to have little effect on the dynamics of the system unless the turbine resistive thrust is very large. These designs only generate significant power and control when operating as drag-dominated broadband devices and are susceptible to tether slacking.
We evaluated the simulations based on the RMS power extraction efficiency and an RMS error ratio of depth error to significant wave height. In all cases, power extraction efficiency values are low. Therefore, the system must rely on the high energy density of waves. The error ratio represents the inability of a design to achieve and maintain depth control. Since the control depth for each simulation is set equal to the significant wave height, an error ratio of represents a completely uncontrollable device. Simulations where the tether went slack at any point are disregarded as invalid.
4.3. Parameter Optimization
Using the non-dimensional relationships shown as point clouds (
Figure 11), we are able to gain insight into the individual and combined effects of each design parameter. In particular, the upper edge of the power-gain point cloud and the lower edge of the error ratio cloud show the best case given a set value for the corresponding parameter, assuming all other parameters are well chosen. Even one relationship being poorly balanced could result in a design unable to generate power or control.
Once the non-dimensional parameters are chosen, we can solve for the dimensional parameters for a given wave environment defined by the wind speed.
To select dimensional design parameters for a device, we first calculate significant wave height
and energy period
for the target wind speed. These environmental parameters and the chosen non-dimensional parameters are used to solve for the final dimensional parameters. Finally, a real device can be designed to meet the target parameters. This design process relies on simulation results produced using the simplified lumped-parameter dynamical model and with turbines operating fitted turbine coefficients described in
Section 2. Actual power output can be expected to be much higher since tested turbines were very inefficient. We return to a consideration of the validity of this approach after presenting examples of its application.
The example designs are representative of the different responses to forcing. The anti-resonant example produces little power or control in simulation. Both broadband and resonant designs can be made viable. They each appear in separate regions of each point cloud (
Figure 11) and display different behavior in the time-series data (
Figure 12).
4.3.1. Ex. 1: Broadband Design Results
In the broadband example, the pod oscillates with the same magnitude and phase as the heave-plate. The device is closely matched to surface wave oscillations but is able to quickly reach and maintain the control depth. The tether force is closely matched to the turbine force but also undergoes some rapid oscillations especially around control signal changes where the turbines rapidly change thrust. The broadband design relies on large turbines and a small ballast allowing very responsive control and good power generation without large oscillations. However, the system is prone to slacking due to the small pre-load caused by the small ballast. If operated in higher wind speeds or in a realistic wave spectrum, large oscillations can cause excessive slacking resulting in snap loading and potential damage.
4.3.2. Ex. 2: Resonant Design Results
In the resonant example, the pod oscillates ~90 out of phase with the heave-plate and at a much greater magnitude. The heave-plate is closely matched to the surface wave oscillations, but the device is able to reach and stay near the control depth. Tether force is much greater than turbine resistive thrust and not significantly affected by control signal changes. Additionally, the tether compliance allows for significantly larger waves without slacking. The resonant design relies on small turbines and a large ballast allowing good power generation from large oscillations. The smaller turbines produce sufficient power and thrust through higher velocities. However, the influence of the controller is limited by the pod phase lag. As a result, the heave-plate oscillates around the control depth, and the turbine power extraction is set low for about half of the cycle.
4.3.3. Ex. 3: Anti-Resonant Design Simulation Results
In the anti-resonant example, the pod oscillates ~180 out of phase when the heave-plate is at a much smaller magnitude. The heave-plate is closely matched to the surface wave oscillations, but the device is able to quickly reach and maintain the control depth. However, pod oscillations remain small resulting in insignificant power.
4.3.4. Ex. 4: Proposed Design Simulation Results
The non-dimensional parameters for Ex. 4 (
Table 2) were chosen manually to create a weakly resonant design in order to find a good compromise between the broadband and resonant designs. Then, the dimensional parameters were solved using a wind speed of 8
.
The results for the proposed design (
Figure 13) show the pod oscillating with a slight phase lag and at a slightly larger magnitude than the heave-plate. The heave-plate is closely matched to surface wave oscillations, but the device is able to reach and stay near the control depth. Compared to the resonant example, the proposed design only sets the turbine power extraction low for a small portion of each cycle once close to control depth. The design also reaches control depth in fewer cycles than previous examples. Compared to the broadband example, the proposed design is significantly less prone to slacking due to the compliant tether.
When simulated across a range of wind speeds using PM spectra (
Figure 14), all four examples have peak energy extraction efficiency at 8
. However, at higher wind speeds, efficiency is less important due to the general increase in available wave power. The anti-resonant design (Ex. 3) performs worst at all wind speeds, and the broadband design (Ex. 1) experiences tether slacking even at relatively low wind speeds. The strongly (Ex. 2) and weakly (Ex. 4) resonant designs have similar performance at higher wind speeds with slacking remaining rare. However, at lower wind speeds, the weakly resonant design significantly outperforms the strongly resonant design for both power and control. For all four examples, depth error increases significantly with wind speed, potentially increasing the risk of a surface breach. This risk could be mitigated by setting a deeper control depth and relying on the greater depth penetration of wave power at higher wind speeds. The resonant and weakly resonant designs show heightened amplitude gain over the design wind speed.
4.4. Additional Design Considerations
With the dimensional design parameters chosen (
Figure 15), we can design each component to meet the chosen parameters. This process may require multiple iterations based on materials, component sourcing, and other influences that could change the design parameters.
Turbines must be sourced which match the total turbine resistive thrust while minimizing parasitic drag. Multiple smaller turbines will operate at higher KC number relative to large turbines, which should align better with the quasi-steady state assumption made in our modeling but this does not preclude the unexplored possibility of good performance in unsteady flows. Smaller turbines are less efficient and require more support structure producing more parasitic drag. Additionally, the number of turbines must be even to provide counter-rotating pairs to prevent the pod from spinning.
In the simulations, turbine thrust and power coefficient conversion are defined by the measured values from the tank tests. Actual values must be determined empirically and will determine the total turbine area and therefore the number of turbines for the final design. We expect to utilize much higher performing turbines in future designs. More sophisticated control of turbine power extraction, e.g., maximum power point tracking (MPPT) [
32], could improve power extraction. However, such methods would require modification to accommodate the additional function of depth control. Finally, turbines should maximize the difference between minimum and maximum thrust. Depending on turbine design features, such as solidity, minimum and maximum thrust may occur at high or low TSRs. The final design and control algorithm will be dependent on turbine specifications.
The pod consists of the electronics housing, turbines with mounts, and ballast. These components and their added masses contribute to the pod mass parameter. Additional ballast could be added as necessary. The wet-weight of the pod can be determined empirically or estimated. If the pod wet-weight is excessively high, buoyancy foam could be added to the pod to reduce the overall specific gravity. The pod will also have some parasitic drag which should be kept to a minimum. Measures such as hydrodynamic fairings will need to be taken to ensure a relatively streamlined profile.
While total tether length must be greater than the largest target wavelength based on wave energy period for deep water waves, the flexible section L of the tether can be shorter. An elastic material must be chosen with elastic modulus E and yield stress sized to cross-sectional area A and length L such that it provides the correct stiffness without yielding under the maximum required tension . The maximum tension can be approximated from the simulations. The tether stiffness also determines the amount of pre-stretch in the tether.
Additionally, the heave-plate must displace enough volume to achieve neutral buoyancy for the entire device. The diameter is already fixed by the design parameters, so volume is proportional to thickness. The material density will determine the heave-plate wet-weight. For neutral buoyancy, the total device wet-weight must be zero. The heave-plate may need to be structurally reinforced which could increase overall wet-weight and mass. Heave-plate thickness must be insignificant for the drag to be modeled as a flat plate. Otherwise, the analysis will lose validity because an overly thick heave-plate will have different drag characteristics. Additionally, the simulations assume heave-plate mass to be insignificant compared to added mass based on it being a thin disk.
Finally, additional losses may occur during power conversion. Losses can be mitigated through impedance matching of the PTO electronics and the device mechanical properties to ensure the resonant characteristics match [
33].
5. Discussion
The final proposed design is supported by tank testing and full system modeling. The tank testing found that constant values for thrust and power coefficients fitted measured data for power and gain well in oscillating flow. The constant values are calculated using the RMS values for power, force, and flow velocity. The calculations were performed across the entire data set to attempt to reduce over-fitting errors. Then, simulations were carried out of the tank tests using the calculated coefficients. Additional simulations were then performed using ideal coefficients based on the Betz limit. Comparison plots of both individual runs and summaries show reasonable agreement between the results for simulations of the fitted coefficients and the measured data. Despite being a significant simplification of turbine performance, the model reasonably predicts the experimental data from the tank tests, showing applicability within the narrow focus of this study.
We compared the fitted coefficients to idealized turbine coefficients based on the Betz limit. As expected, the prototype’s turbines produced significantly less power than an ideal turbine of equivalent area. The prototype’s turbines also provided significantly less thrust than an ideal turbine. A more complete model of turbine performance would show the dependence of the key coefficients as functions of TSR. Furthermore, the oscillating flow of interest here exposes the turbines to a large range of TSR. A full characterization of the turbines was not possible with the data collected. The included design study utilizes the fitted constant coefficients for power and thrust. Because turbine selection for the prototype was based primarily on cost and convenience rather than optimization, we believe significant improvements could be made both for power extraction and control through turbine selection. The full design simulations and final turbine design selection were based on the measured power coefficients for the WaterLily turbine. The coefficients are low (about an order of magnitude below the Betz limit), and this reflects both the averaging over a wave period applied and probably also operation in flows being significantly slower than the river flows the device was intended for. Future improvements in the turbine selection for control algorithms would require additional analysis, including the determination of the performance coefficients as a function of TSR. Further improvements could be made using a MPPT algorithm.
The heave-plate dynamics rely on Morison’s equation for an oscillating body in an oscillating flow that can only be applied to bodies significantly smaller than the wavelengths. Our design proposals are centered around an optimal wind speed of 8 , which corresponds to a peak wavelength of 56 for the PM spectrum. We believe an order of magnitude difference is sufficient to justify the use of Morison’s equation; nevertheless, we acknowledge that heave-plate dynamics in actuality would be more complex.
These simulations rely on two types of wave spectra: monochromatic and PM. When used, the monochromatic spectra uses the wave energy period and total power for a PM spectrum of equivalent wind speed. As a result, both spectra are definable through a single parameter, wind speed. This single parameter dependence facilitated our design study by keeping the parameter space small, resulting in a limited number of non-dimensional parameters. The design of a fieldable device would benefit from considering a spectrum tuned to the intended area of operation; in this case, the simplified approach here would provide a starting point.
6. Conclusions
We developed a model for a novel design for a near-surface free-floating WEC and validated key elements of the design and our model for the full system using a turbine-equipped prototype pod and purpose-built experimental apparatus. We developed a design process using a set of non-dimensional parameters and proposed a feasible design. The primary advantage of the design is the potential for stealthy operations due to the lack of surface expression.
The insights from this exploratory study suggest that an untethered autonomous float could be designed that harnesses near-surface wave power for extended operations. Enough power exists in the near-surface wave-field to power or recharge an autonomous float. The wave energy could be harvested using a submerged heave-plate in the oscillating wave-field tethered to an energy harvesting turbine hanging below in relatively still water. Such a device could exert control over its depth through temporally lowering turbine power extraction and therefore drag.
The proposed design operates in the near-surface wave field without grounding to the sea floor or the free surface. This concept is under-explored in the literature concerning WECs, which generally operated with one or both ends grounded. While similar to free-floating two-body WECs, our design does not rely on buoyant restoring forces for power extraction or depth control. This analysis shows the feasibility of an ungrounded near-surface WEC relying on drag and inertia within the wave field for power extraction and depth control. A compliant tether allows such a device to exploit resonance for increased power extraction efficiency while also absorbing large wave fluctuations that might otherwise slack the tether and result in snap-loading. The study shows the considerations and relationships required for designing a device for a range of applications and conditions. It remains to develop and deploy an ocean-going prototype.
We have proposed a fully submerged WEC design which can be built from realistic materials and theoretically produces adequate power for small-scale applications such as data floats. We believe the proposed system is feasible for a test prototype provided care is taken to deal with the sensitivity and interdependence of the design parameters and reduce parasitic drag. The system has successfully passed an experimental proof of concept. The simulations were performed using fitted parameters from a small (150 mm) consumer-grade submersible turbine and no parasitic drag. An improved design and more comprehensive testing of the prototype could inform more realistic simulations.


