Article

Global Path Planning for Autonomous Ship Navigation Considering the Practical Characteristics of the Port of Ulsan

1
Autonomous Ship Verification & Evaluation Research Center, Korea Research Institute of Ship and Ocean Engineering, Ulsan 44055, Republic of Korea
2
Advanced-Intelligent Ship Research Division, Korea Research Institute of Ship and Ocean Engineering, Daejeon 34103, Republic of Korea
3
Department of Intelligent Mechatronics Engineering, Sejong University, Seoul 05006, Republic of Korea
*
Author to whom correspondence should be addressed.
J. Mar. Sci. Eng. 2024, 12(1), 160; https://doi.org/10.3390/jmse12010160
Submission received: 30 November 2023 / Revised: 6 January 2024 / Accepted: 7 January 2024 / Published: 13 January 2024
(This article belongs to the Special Issue Smart Shipping and Maritime Transportation)

Abstract

:
This study introduces global path planning for autonomous ships in port environments, with a focus on the Port of Ulsan, where various environmental factors are modeled for analysis. Global path planning is considered to take place from departure to berth, specifically accounting for scenarios involving a need to navigate via anchorage areas as waypoints due to unexpected increases in port traffic or when direct access to the berth is obstructed. In this study, a navigable grid for autonomous ships was constructed using land, breakwater, and water depth data. The modeling of the Port of Ulsan’s traffic lanes and anchorage areas reflects the port’s essential maritime characteristics for global path planning. In this study, an improved A* algorithm, along with grid-based path planning, was utilized to determine a global path plan. We used smoothing algorithms to refine the global paths for practical navigation, and the validation of these paths was achieved through conducting ship maneuvering simulations from model tests, which approximate real-world navigation in navigational simulation. This approach lays the groundwork for enhanced route generation studies in complex port environments.

1. Introduction

1.1. Research Background

The maritime industry is currently undergoing significant changes due to advancements in digitalization, decarbonization, and autonomy [1]. These changes are particularly evident in the development of autonomous ship voyages, which show great potential for the future [2,3,4,5]. At present, most ordinary ships in service depend on navigational officers for path planning and vessel operation. According to the European Maritime Safety Agency’s (EMSA) 2022 report [6], a notable 70.5% of marine accidents and incidents reported from 2014 to 2021 involved a European Union State as the coastal state, and these incidents, mainly caused by human error, often resulted in grounding, leading to substantial financial and environmental impacts. Therefore, with the growing complexity and potential of autonomous ship technology, there is an urgent need for enhanced research and development in autonomous navigation systems to mitigate such risks and augment navigational safety.
The International Maritime Organization (IMO) defines Maritime Autonomous Surface Ships (MASS) as vessels operating on the surface with minimal or no human intervention. For the commercialization of autonomous ships, it is essential to develop cooperative technologies such as situational awareness systems, path planning systems, collision avoidance systems, condition-based monitoring systems, etc. [7]. Additionally, sufficient data communication via satellite in the open ocean and network systems in coastal areas is important [8]. Furthermore, these ships have to be integrated with the technologies emerging in smart port systems, as ship operations are extensively linked with port data [9,10].
The integration of maritime safety regulations such as SOLAS and COLREGs is crucial in the development of autonomous ships for ensuring safe navigation, especially with the reduced human intervention in autonomous vessels. Additionally, the roles of VTS and AIS are crucial in modern navigation, providing critical support for situational awareness and communication. Their relevance extends to autonomous ships, where AIS can offer virtual navigation aids [11].
This study focuses on incorporating global path planning with complex port considerations for the forthcoming era of autonomous ships. It specifically addresses both partial and full automation in the context of future maritime navigation. Although considerable research has been conducted on global path planning in the ocean, including research on the optimal routes for fuel efficiency and the incorporation of weather data, there has been less emphasis on in-port global path planning [12]. This study specifically addresses the creation of paths within ports, considering anchorage areas and traffic lanes to determine the most feasible paths for autonomous ships. This study particularly focuses on the Port of Ulsan [13], the modeling factors that have to be considered in this port, and the creation of comprehensive paths to aid in the decision-making process for global path planning in port sea areas. It specifically considers sudden changes in traffic congestion or external factors requiring anchorage, contributing to the overall study of global path generation for autonomous ships.

1.2. Contributions

This study distinguishes itself by making unique contributions in three key areas:
  • Global Route Planning for Autonomous Ships in Port Sea Areas: This study specifically focuses on global route planning in the Port of Ulsan sea area, Republic of Korea. We utilized public information on traffic lanes and anchorage areas [14], in conjunction with ENC data pertaining to coastlines and water depth, to model the navigable area for MASS. The improved A* algorithm, augmented with an additional cost function, is applied to differentiate between traffic lanes and anchorage areas. An additional cost function is integrated to facilitate right-side navigation in traffic lanes, and an algorithm suitable for smoothing is employed to create more realistic global path planning route.
  • A New Approach to Managing and Finding Anchorage Areas: To manage unexpected port traffic congestion and berthing challenges, this study proposes modeling broad group anchorage areas into small and specific circular anchorages. This enables the automatic establishment of global path planning routes that include stopovers at anchorages.
  • Path Planning Considering Ship Maneuverability: This study derives realistic paths that reflect the dynamic characteristics of a particular ship, specifically an autonomous testbed ship constructed by the KASS (Korea Autonomous Surface Ship) project [15], and the feasibility of the generated routes are validated through maneuvering simulations. The target ship applied in this study was simulated based on hydrodynamic coefficients of the autonomous testbed ship built by the KASS project. These simulations take into account the ship’s properties, engine speed, and steering, effectively integrating them into global route generation. This approach provides practical guidelines for the operation of autonomous ships within the Port of Ulsan by comparing the optimized routes of the improved A* algorithm, integrating ships’ dynamic properties into the route planning process.

2. Related Works

The field of autonomous ship path planning is diverse and continually evolving, utilizing a variety of algorithms, including graph search, sampling-based algorithms, genetic algorithms, ant colony optimization, artificial neural networks, and reinforcement learning [16,17]. These algorithms are becoming advanced with respect to enhancing the efficiency and robustness of path planning strategies.
Graph search algorithms, particularly the Dijkstra algorithm [18] and the A* algorithm [19], are fundamentally basic algorithms used to identify the shortest path on grid-based maps. The Dijkstra algorithm systematically calculates distances from the starting node to all others, selecting the nearest node at each step to expand the path. The A* algorithm advances this approach by integrating a heuristic estimate of the distance to the goal, thereby improving search speed and path efficiency [20,21].
The authors of [22] utilized visibility graph techniques and the Dijkstra algorithm for static obstacle avoidance, as well as the A* algorithm for navigating around dynamic obstacles in Unmanned Surface Vessels (USVs). Studies have also evaluated the A* algorithm’s effectiveness in varying directions, from four to thirty-two, to optimize global path planning in areas near wind farms [23]. The authors of another study considered motion characteristics and ENCs of areas such as those near the port sea area using a route planning algorithm [24]. The A* algorithm and dynamic window methods are instrumental in complex port terrains, focusing on comprehensive path planning and collision avoidance [25]. Further studies have integrated the improved Artificial Potential Field (APF) algorithm in hybrid path planning methods [26]. The authors of [27] conducted a phased route planning study. They began by determining an initial route using the Dijkstra algorithm, followed by the creation and normalization of environmental constraints. Subsequently, these constraints were integrated into a cost function to identify the optimal path, considering various constraints.
Research on various global path planning algorithms, sampling-based methods like RRT and RRT*, and genetic algorithms is ongoing. Different approaches, like the Bald Eagle Search Algorithm, have also been explored, drawing inspiration from animal behavior for path creation [28]. Comparative studies have been conducted to compare path planning methods such as the A* algorithm and the RRT* algorithm [29].
Recent studies have expanded the scope of ship path planning to include port integration. Initiatives are being taken to improve port efficiency by utilizing smart port data to manage congestion effectively [30]. Economic assessments have been conducted to evaluate the cost-effectiveness and environmental advantages of using autonomous ships in maritime transport [31]. These studies have primarily focused on optimizing route planning in major shipping lanes, aiming to reduce fuel consumption and emissions in autonomous ships [32,33]. Additionally, research has been carried out on developing safe path planning for autonomous ships using a GIS-data-driven method which involves converting maps from color to binary images [34]. More recently, a ship path planning approach that considers multiple safety factors has been developed. This approach enhances ship navigation safety by taking into account environmental impacts, traffic regulations, and ship maneuvering constraints [35].
For this study, we incorporated the Maneuvering Mathematical Group (MMG) ship maneuvering equation into our methodology [36,37]. The MMG equation, widely adopted in numerous studies, was used to compare maneuvering simulation trajectories with an optimized global path derived from using the improved A* algorithm.

3. Materials and Methods

3.1. Grid Modeling of Port of Ulsan

To facilitate research on graph-based path planning, a foundational grid of the Port of Ulsan sea area was modeled. This section presents basic information related to the Port of Ulsan, including information in the form of detailed coastline, breakwater, and water depth data extracted from ENCs.
The Port of Ulsan is located in the southeastern part of the Republic of Korea, as shown in Figure 1a. For the purpose of grid-based path planning, the Ulsan port sea area has been modeled to non-navigable areas. These areas, which include land and breakwater regions, are designated as ‘obstacle_land’ and ‘obstacle_breakwater’, respectively. And water depth data is also modeled from ENCs and applied to ‘obstacle_waterdepth’ to find navigational areas.
In the Port of Ulsan sea area, traffic lanes and anchorage areas are crucial for the safe and efficient operation of ships, and path planning is especially crucial for effective maritime operations. The traffic lanes in the port sea area are sometimes densely packed for both large and small ships, often leading to considerable traffic congestion. Moreover, the port’s adjacency to industrial areas requires careful attention to maintain maritime safety and efficiency.
The Vessel Traffic Service (VTS) Center in the Port of Ulsan works in conjunction with the Ulsan Port Authority to play an important role in maintaining the safety of maritime operations. They provide a suite of facilities and services designed to smooth the operational adjustment of the port, including navigation and anchoring support. The VTS Center is the essential authority for the port, monitoring maritime traffic and ship positions continuously and offering directives in times of emergency or potential danger to mitigate the risk of accidents. And the established traffic lanes and anchorage areas within the port, designed to facilitate smooth vessel movement and comprehensive traffic management, are essential for ship operations.
For autonomous vessels operating in the Port of Ulsan, it is crucial to develop algorithms that generate global routes compatible with existing traffic management protocols. This involves the systematic mapping of traffic flows and anchorage fields to confirm their conformity within the permitted maritime zones. The precise grid mapping of these domains is essential for the accurate analysis of ship routes within the Port of Ulsan. The accurate depiction of these areas is crucial for the path planning algorithm to reflect the actual operational conditions of the Port of Ulsan, an important step in ensuring navigational safety and operational efficiency in this complex and diverse maritime environment.
Information on the traffic lanes and anchorage areas currently in operation at the Port of Ulsan can be accessed through the Ulsan Port Authority website [14], and the details of the traffic lanes and anchorage areas are shown in Figure 1b. This study focuses on specific traffic lanes within the Port of Ulsan, namely Passageway1 through Passageway5, which help to clearly define the routes for path planning. Group anchorage areas E1, E2, and E3 are located to the east of Passageway1 and are categorized based on the size of the ship that they accommodate. Circular anchorages, designated as W1, T1, T2, and T3, are also in operation, alongside dedicated bunkering anchorages B1-1, B1-2, B2-1, B2-2, B3-1, and B3-2, which facilitate fueling activities within the group anchorage. There are also extra anchorage zones, M1 to M7, intended for smaller ships within the harbor. Each anchorage is characterized by the ship size that it can accommodate, as detailed in Table 1 [38].
The grid-based model created for this study was designed to consider the movement of ships within the anchorage areas, taking into account the radii of divided small anchorage areas to mark the specific waypoints in anchorage areas that are to be automatically selected by the algorithm, which generates their global navigation paths.

3.2. Global Path Planning Algorithms

In this study, the A* algorithm was applied to advance path planning research, which it is capable of doing due to its effectiveness in reflecting grid-based characteristics in the Port of Ulsan. For the modeling of grid-based port sea areas, we applied an improved A* algorithm to establish polygon areas of traffic lanes and anchorage areas, shaping polygon regions for cost functions that comply with COLREGs and avoiding unintended anchorage areas for safe voyages.
The A* algorithm employs a heuristic function to navigate cost-effectively, estimating the cost to the goal from each node to predict and select the most efficient path. This study specifically applies the improved A* algorithm by applying a weight factor in the heuristic function to generate efficient routes in complex maritime zones, such as the Port of Ulsan, to ensure the safety of vessel navigation.
The improved A* algorithm is based on Equation (1).
F(n) = G(n) + H(n) + C(n)
C(n) = (K_anchorage + K_trafficlane) × H(n)
Here, F(n) is the total estimated cost function from the start to the goal node, G(n) represents the actual cost function from the start to the current node, and H(n) is the heuristic cost function estimated cost to the goal node. C(n) is applied as an additional cost function that considers port characteristics. In Equation (2), the function related to these characteristics is proposed to be proportional to the heuristic function, employing weight factors within specific polygon regions, particularly in anchorage areas and traffic lanes. This approach is designed to effectively identify intended routes through these specified zones. In port areas, a specific approach to route planning is required to minimize the risk of collision with stationary vessels. To facilitate this, the introduction of a weight factor of K_anchorage increases the cost associated with anchorage grids. This approach effectively makes ships avoid anchorage zones, reducing the risk of collisions. During route planning, if the ship is needed via an anchorage area, the K_anchorage for that anchorage area is not applied, allowing ships to find a path through that anchorage area.
The navigation route in the Port of Ulsan, as shown in Figure 1b, consists of a single lane, which may lead to the generation of routes that do not comply with COLREGs when selecting optimal paths in global route planning. To address this issue, each traffic lane is divided based on a virtual central line, with the right side designated as trafficlane_in and the left as trafficlane_out, as per the direction of entry into the port. A weight factor of K_trafficlane is introduced to increase the cost of grids outside the traffic lane to find a global path within the trafficlane. When a ship enters the port, grids within the trafficlane_in polygon do not apply the K_trafficlane, and during departure, the K_trafficlane is not applied to grids within the trafficlane_out polygon. This approach generates routes that comply with COLREGs.
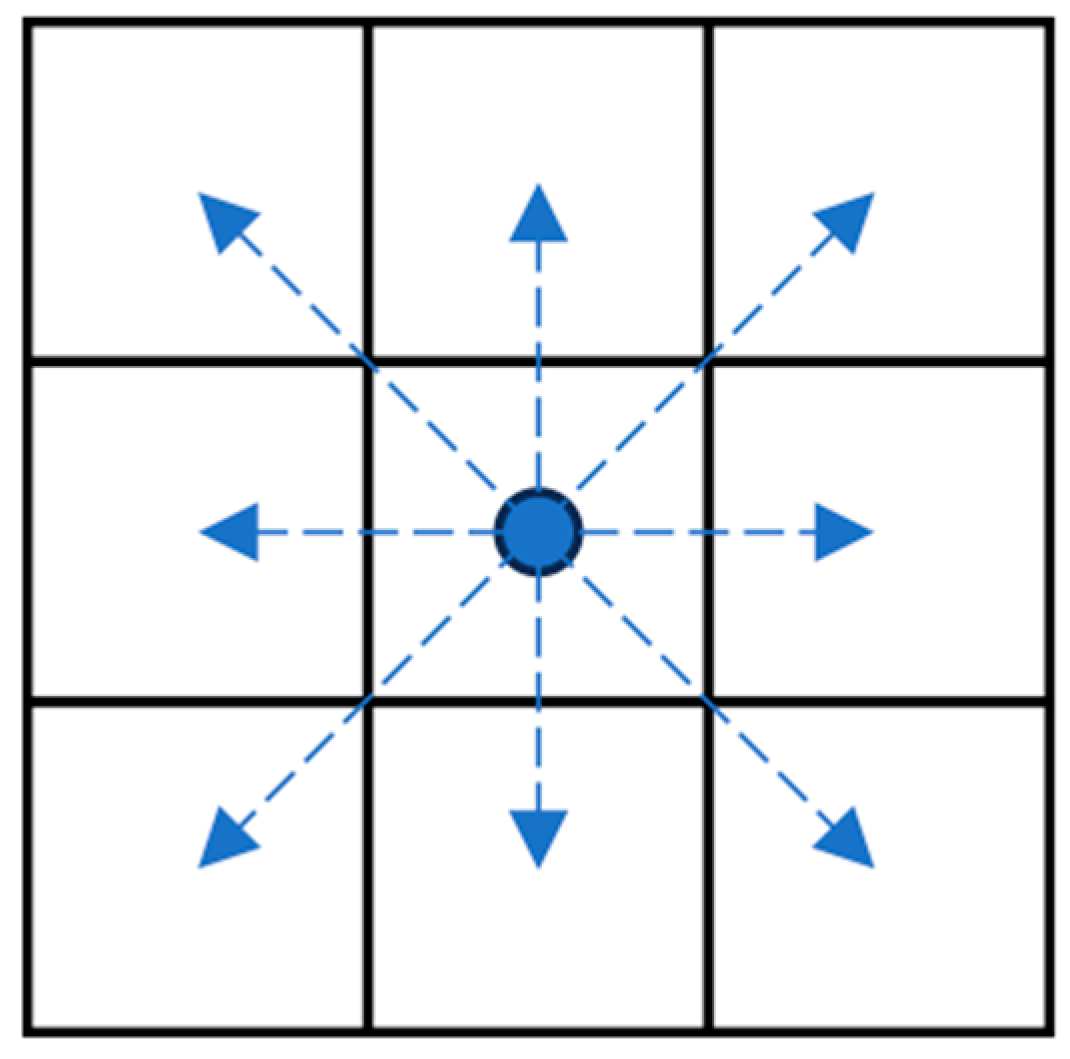
The A* algorithm functions across eight directions: up, down, left, right, and diagonally. These directions are selected through grid-based calculations, as depicted in Figure 2. It effectively applies the raster grid-based navigable areas derived from the ENCs, ensuring efficient computational times.
This study adopts a line-of-sight approach based on the Bresenham algorithm for smoothing, which is used to create obstacle-free linear paths. This method ensures realistic and direct routes for ships [39]. It is implemented to refine the ship’s navigational path within the port, aligning it with routes free from obstacles, thereby reflecting a realistic navigation approach that a ship would typically follow in open waters. This algorithm is applied to each segment, such as the open sea, traffic lanes, and anchorage areas, taking into account the specific constraints of each segment.
This study focuses on a scenario where autonomous ships navigate from outside to inside the port, operating through traffic lanes and anchorage areas. The A* algorithm establishes the primary route, and route optimization algorithms are subsequently applied to refine the ship’s navigational path for more realistic routing. These algorithms adapt and enhance the ship’s operational route to align with the specific environments of port sea areas.

3.3. Post-Processing Method for Route Optimization

This subsection outlines the methodology of applying Bresenham’s line algorithm for post-processing and smoothing the global path planning routes obtained from the improved A* algorithm, with a focus on rendering these routes more realistic. Among various algorithms, a line-of-sight algorithm based on the Bresenham algorithm is applied for the post-processing of the routes. Bresenham’s line algorithm is widely used in computer graphics for drawing lines based on pixels [40]. The major advantages of this algorithm are its efficiency and simplicity. The path found by the A* algorithm may often contain many abrupt turns, but through using the Bresenham algorithm, we can check whether a straight path is possible between two points on the path, allowing for path optimization. If a straight path is viable between two points, intermediate points can be removed to further simplify and optimize the path. A list of grid coordinates located between two points is generated and utilized by the check for obstacles, ensuring that the path is clear if all points along it are obstacle-free.
The Dynamic Time Warping (DTW) algorithm is a highly utilized and well-suited technique used for comparing and measuring similarities between two sequences which may vary in their timing or speed [41,42]. For instances where it is challenging to compare two routes which have a different number of points, the DTW algorithm is an advantageous algorithm, as it can align the sequences without altering the actual data, thus providing a meaningful measure of their similarity. In this study, the DTW algorithm is employed to compare the similarity between the paths post-processing with the paths derived from the simulation results gleaned from applying the maneuvering equation.

3.4. Maneuvering Simulation

Ship maneuvering equations provide a dynamic model for maritime operations, offering a high degree of mechanical reliability for route planning and navigational path prediction of ships. For this study, we applied the MMG model to establish a precise operational model for ships. The MMG model comprehensively incorporates various elements affecting a ship’s steering performance, specifically by applying hydrodynamic force coefficients obtained from model ship tests. This ensures a high level of accuracy in the prediction of ship movement, facilitating the verification of navigational paths for autonomous ships incorporating reliable and efficient path planning algorithms, particularly for autonomous ships that require a high degree of precision in their navigational systems.
The target ship in this study is an autonomous testbed ship that was constructed by the KASS project and designed to perform sea trials with various autonomous algorithms and equipment. The ship is 26.5 m in length, 5.4 m in width, and has a draft of 1.35 m, with a displacement of approximately 69 tons. It is equipped with two 440 kW main engines with twin-screw propulsion and a steering system, and its design speed is 12 knots. The hydrodynamic coefficients derived from the model tests of this vessel were used to conduct the maneuvering simulation.
The coordinate system for ship movement includes a space-fixed coordinate system (O0-X0Y0) and a body-fixed coordinate system (O-XY) that moves with the ship. The origin point O, positioned at the midship and the x-axis, is directed towards the bow of the ship, while the y-axis is oriented towards the starboard. The heading angle, denoted as psi, is defined by the angle between the X0 axis of the space-fixed coordinate system and the moving X axis of the ship coordinate system. The rudder angle, represented by the variable delta, and the yaw rate, indicated by the variable r, are pivotal dynamic variables related to the ship’s directional control. Furthermore, the variables u and v represent the surge (forward) velocity and sway (lateral) velocity, respectively, in the ship coordinate system. This is illustrated through Figure 3.
In this study, the MMG model applied subscribes to the fundamental maneuvering equations of motion in Equation (3).
m u ˙ v r x G r 2 = X H + X P + X R m v ˙ + u r + x G r ˙   = Y H + Y R I z z r ˙ + m x G v ˙ + u r = N H + N R
Here, m represents the mass, Izz represents the moment of inertia, and x G is the longitudinal distance to the ship’s center of gravity. The terms X, Y, and N represent the forces and moments in the surge, sway, and yaw directions, respectively. The subscripts H, P, and R indicate forces and moments arising from the hull, propeller, and rudder.
The forces acting on the hull are expressed in Equation (4), along with the hydrodynamic force coefficients determined from model tests conducted in towing tanks.
X H = X u ˙ u ˙ + X v v v 2 + X v r v r + X r r r 2 + X v v v v v 4 R Y H = Y v ˙ v ˙ + Y r ˙ r ˙ + Y v v + Y r r + Y v v v v 3 + Y r r r r 3 + Y v v r v 2 r + Y v r r v r 2 N H = N v ˙ v ˙ + N r ˙ r ˙ + N v v + N r r + N v v v v 3 + N r r r r 3 + N v v r v 2 r + N v r r v r 2
The thrust generated by the propellers is defined through the advance ratio JP and propeller thrust open water characteristic KT. Propeller force is expressed in Equation (5), and the external force terms reflecting the characteristics of a twin-screw, twin-rudder configuration are defined to derive the maneuvering motion equations. The expressions for the port and starboard are expressed through the superscripts (P) and (S), respectively, and t P is the thrust deduction factor, ρ is water density, D is the diameter of the propeller, and n is propeller revolution.
X P = 1 t P ρ   D 4   ( n p 2 K T P J P P + n S 2 K T S J P S )
Rudder force is defined in Equation (6), where delta is the rudder angle, t R is the steering resistance deduction factor, aH is the rudder force increase factor, x R is the distance to rudder position, x H is the longitudinal coordinate of the acting point of the additional lateral force, and FN is the normal force acting on the rudder.
X R = 1 t R   F N P + F N S sin δ Y R = 1 + a H   F N P + F N S cos δ N R = x R + a H x H   F N P + F N S cos δ

3.5. Analysis Procedure

This chapter represents a systematic analysis procedure and a specific schema for creating global routes for autonomous ships in the Port of Ulsan sea area. To generate a global route for autonomous ships, first, the starting and destination points are set, followed by port sea area modeling using ENC information. This modeling includes physical structures such as coastlines, breakwaters, and islands, as well as other obstacles. After considering these structures, the process continues with modeling the water depth, traffic lanes, and anchorage areas for route planning algorithms to map the navigable grid areas for ships.
This study introduces an assessment of the need to wait at anchorage as a decision point in the process in cases where it may be difficult for autonomous ships to directly enter their berth in the port. If waiting at anchorage is required, the anchorage area point identified in this study is chosen at specific locations for automatic path planning, and the improved A* algorithm is applied to create a global route.
This route is then smoothed through post-processing to refine the route. Optimized post-processing waypoints are used to simulate the path considering ship maneuvering dynamics, and the simulation route obtained from this process is used to validate post-processing paths, resulting in the final expected global path. If waiting at anchorage is not required, the route planning algorithm continues to create a global route by using the improved A* algorithm procedure and following the subsequent steps.
At present, ships are required to request anchorage and report to the Ulsan Port VTS center [43] before anchoring in designated areas. Reflecting this, a ‘Report to port authority and VTS center’ step is included in Figure 4. However, with the anticipated advancements in smart port technologies, it is expected that autonomous ships will eventually be able to autonomously select anchorage points in the future.

4. Results and Discussion

4.1. Port of Ulsan Sea Area Modeling

This section explains how to create detailed maps of the Port of Ulsan’s layout and water depth, which are necessary to create global routes for autonomous ships. Utilizing a grid-based mapping approach, this modeling approach incorporates operational areas within the port, along with specific areas like traffic lanes and anchorage areas. Detailed modeling that reflects the unique characteristics of specific regions is important for autonomous ships to effectively generate and navigate their routes within the port’s complex environment.
First, it is necessary to identify the grid-based navigable areas within the Port of Ulsan to apply the path planning algorithm. In this study, the boundaries of the Port of Ulsan sea area are defined by a geographical scope spanning a latitude ranging from 35.233 to 35.550 degrees and a longitude ranging from 129.200 to 129.458 degrees. Coastal boundaries are modeled using shapefile data from ENCs, and information on breakwaters and islands are also incorporated. The grid size, determined to balance the precision required for global route generation for the autonomous ships and computational efficiency, taking into consideration the size of the test ships and their maneuvering characteristics, is set at 0.001 degrees.
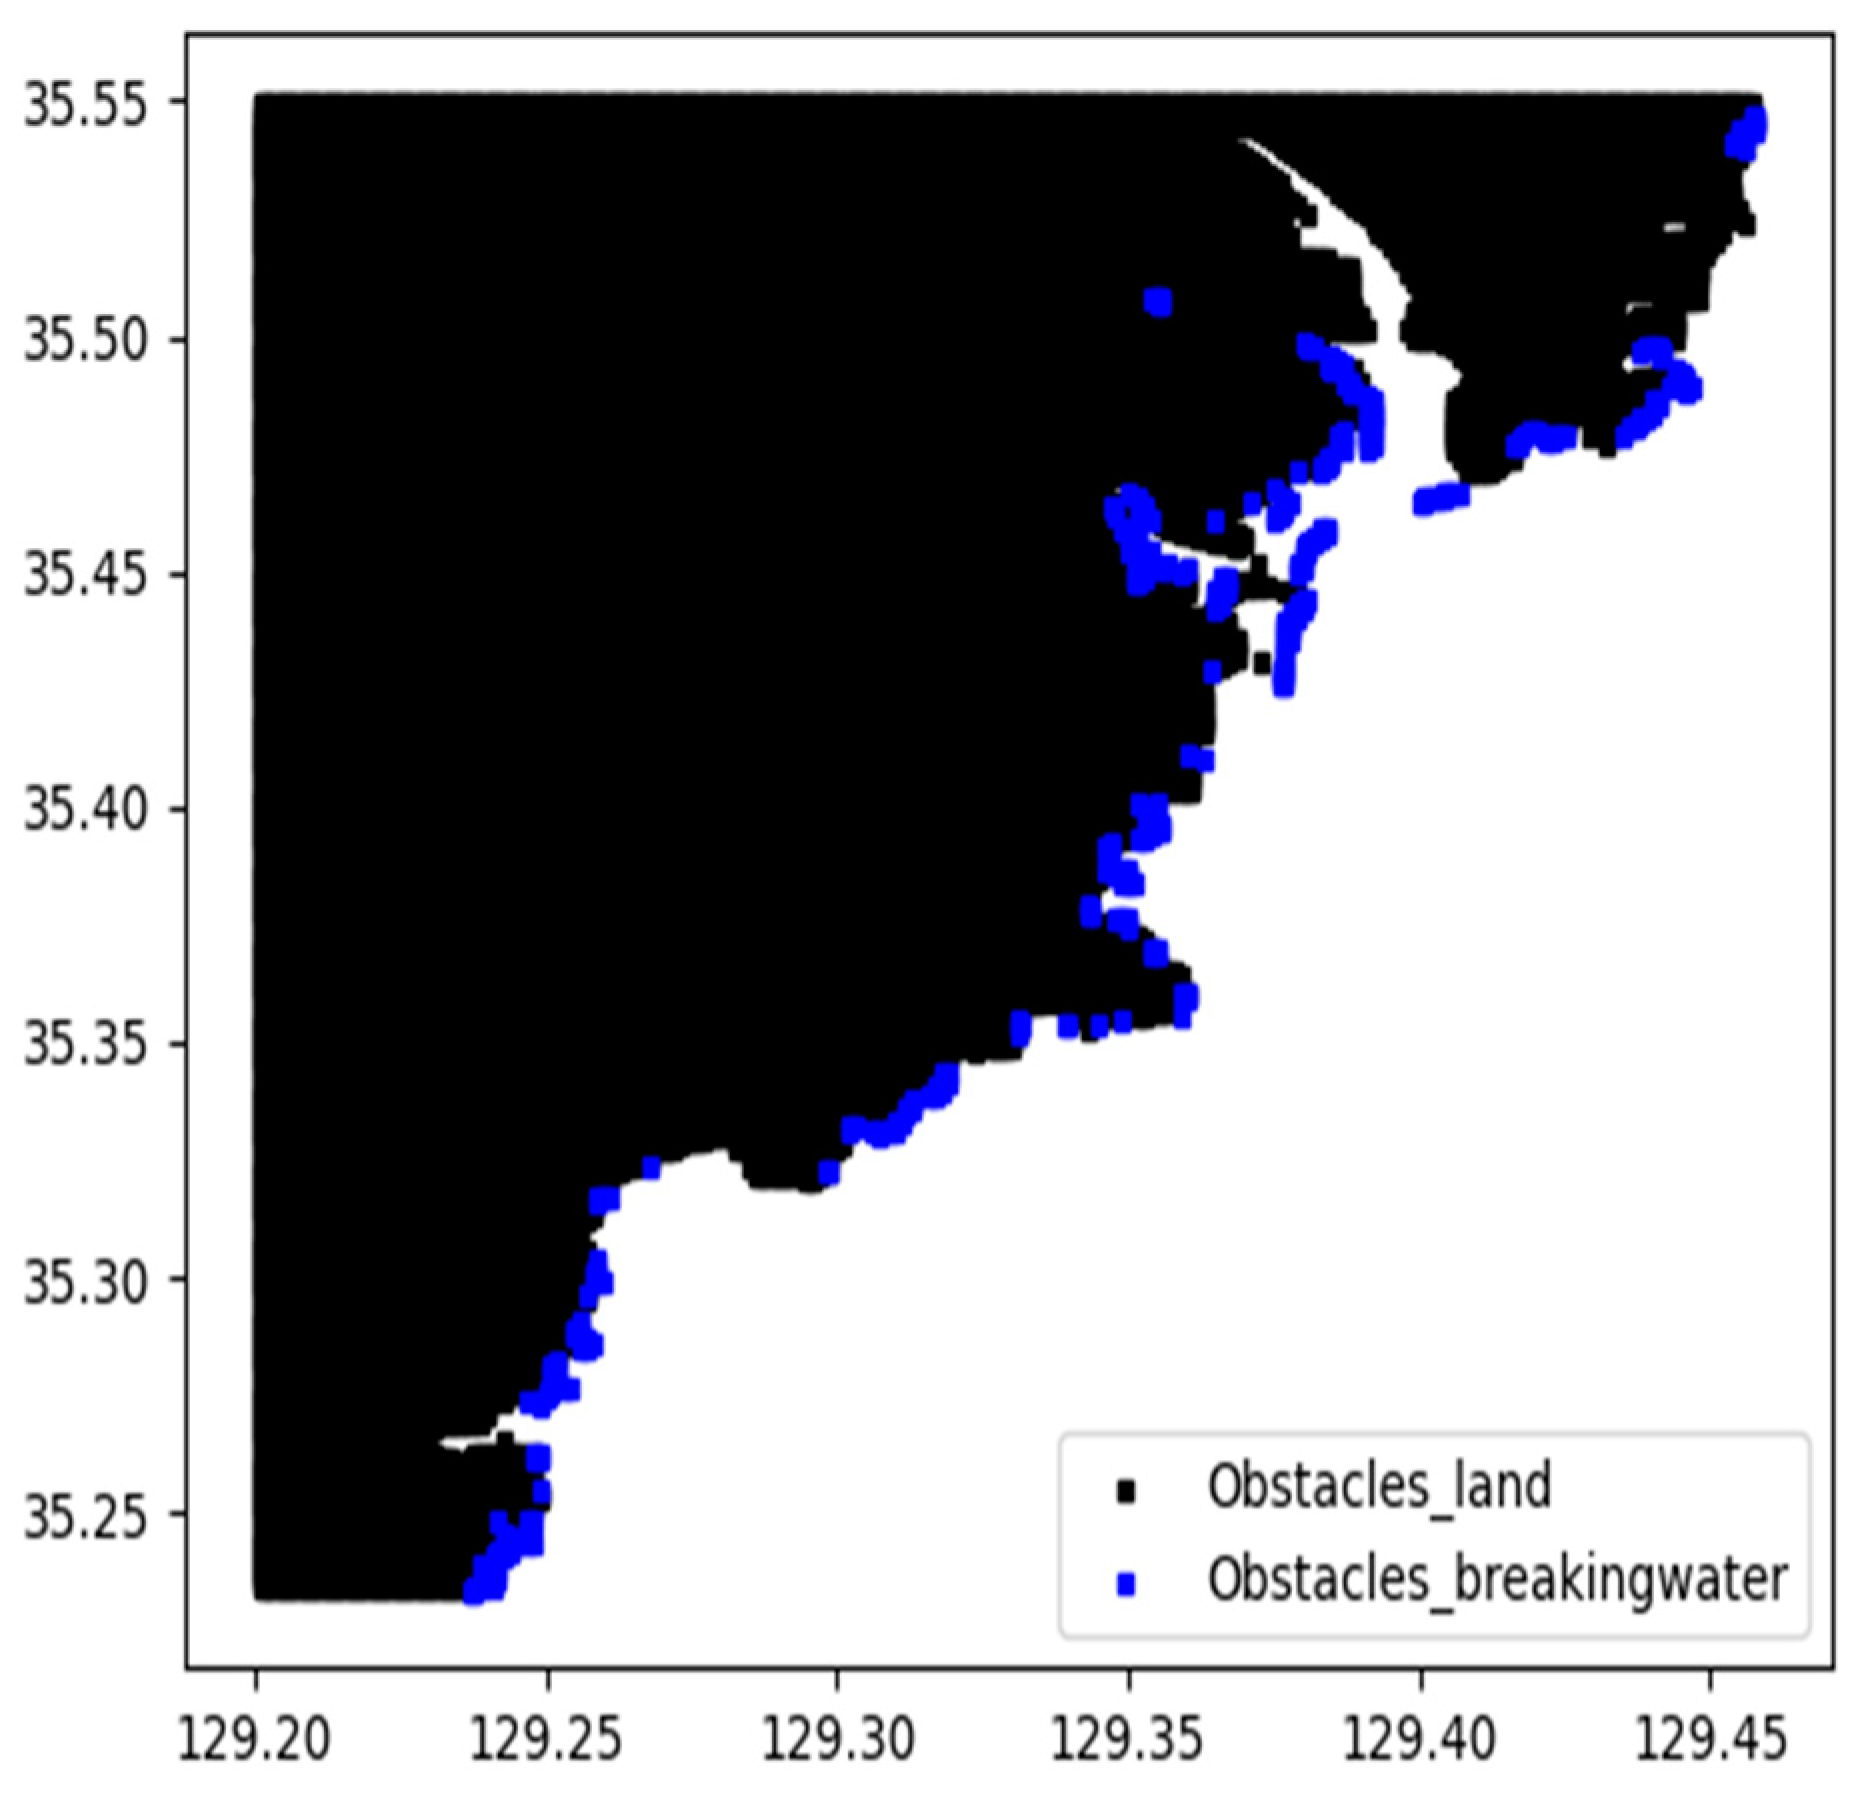
The land areas outlined by coastline are labeled as ‘Obstacle_land’, and areas encompassing breakwaters and islands which are non-navigable regions are defined as ‘Obstacle_breakwater’. Both of these elements have been modeled and are collectively visualized and presented in Figure 5.
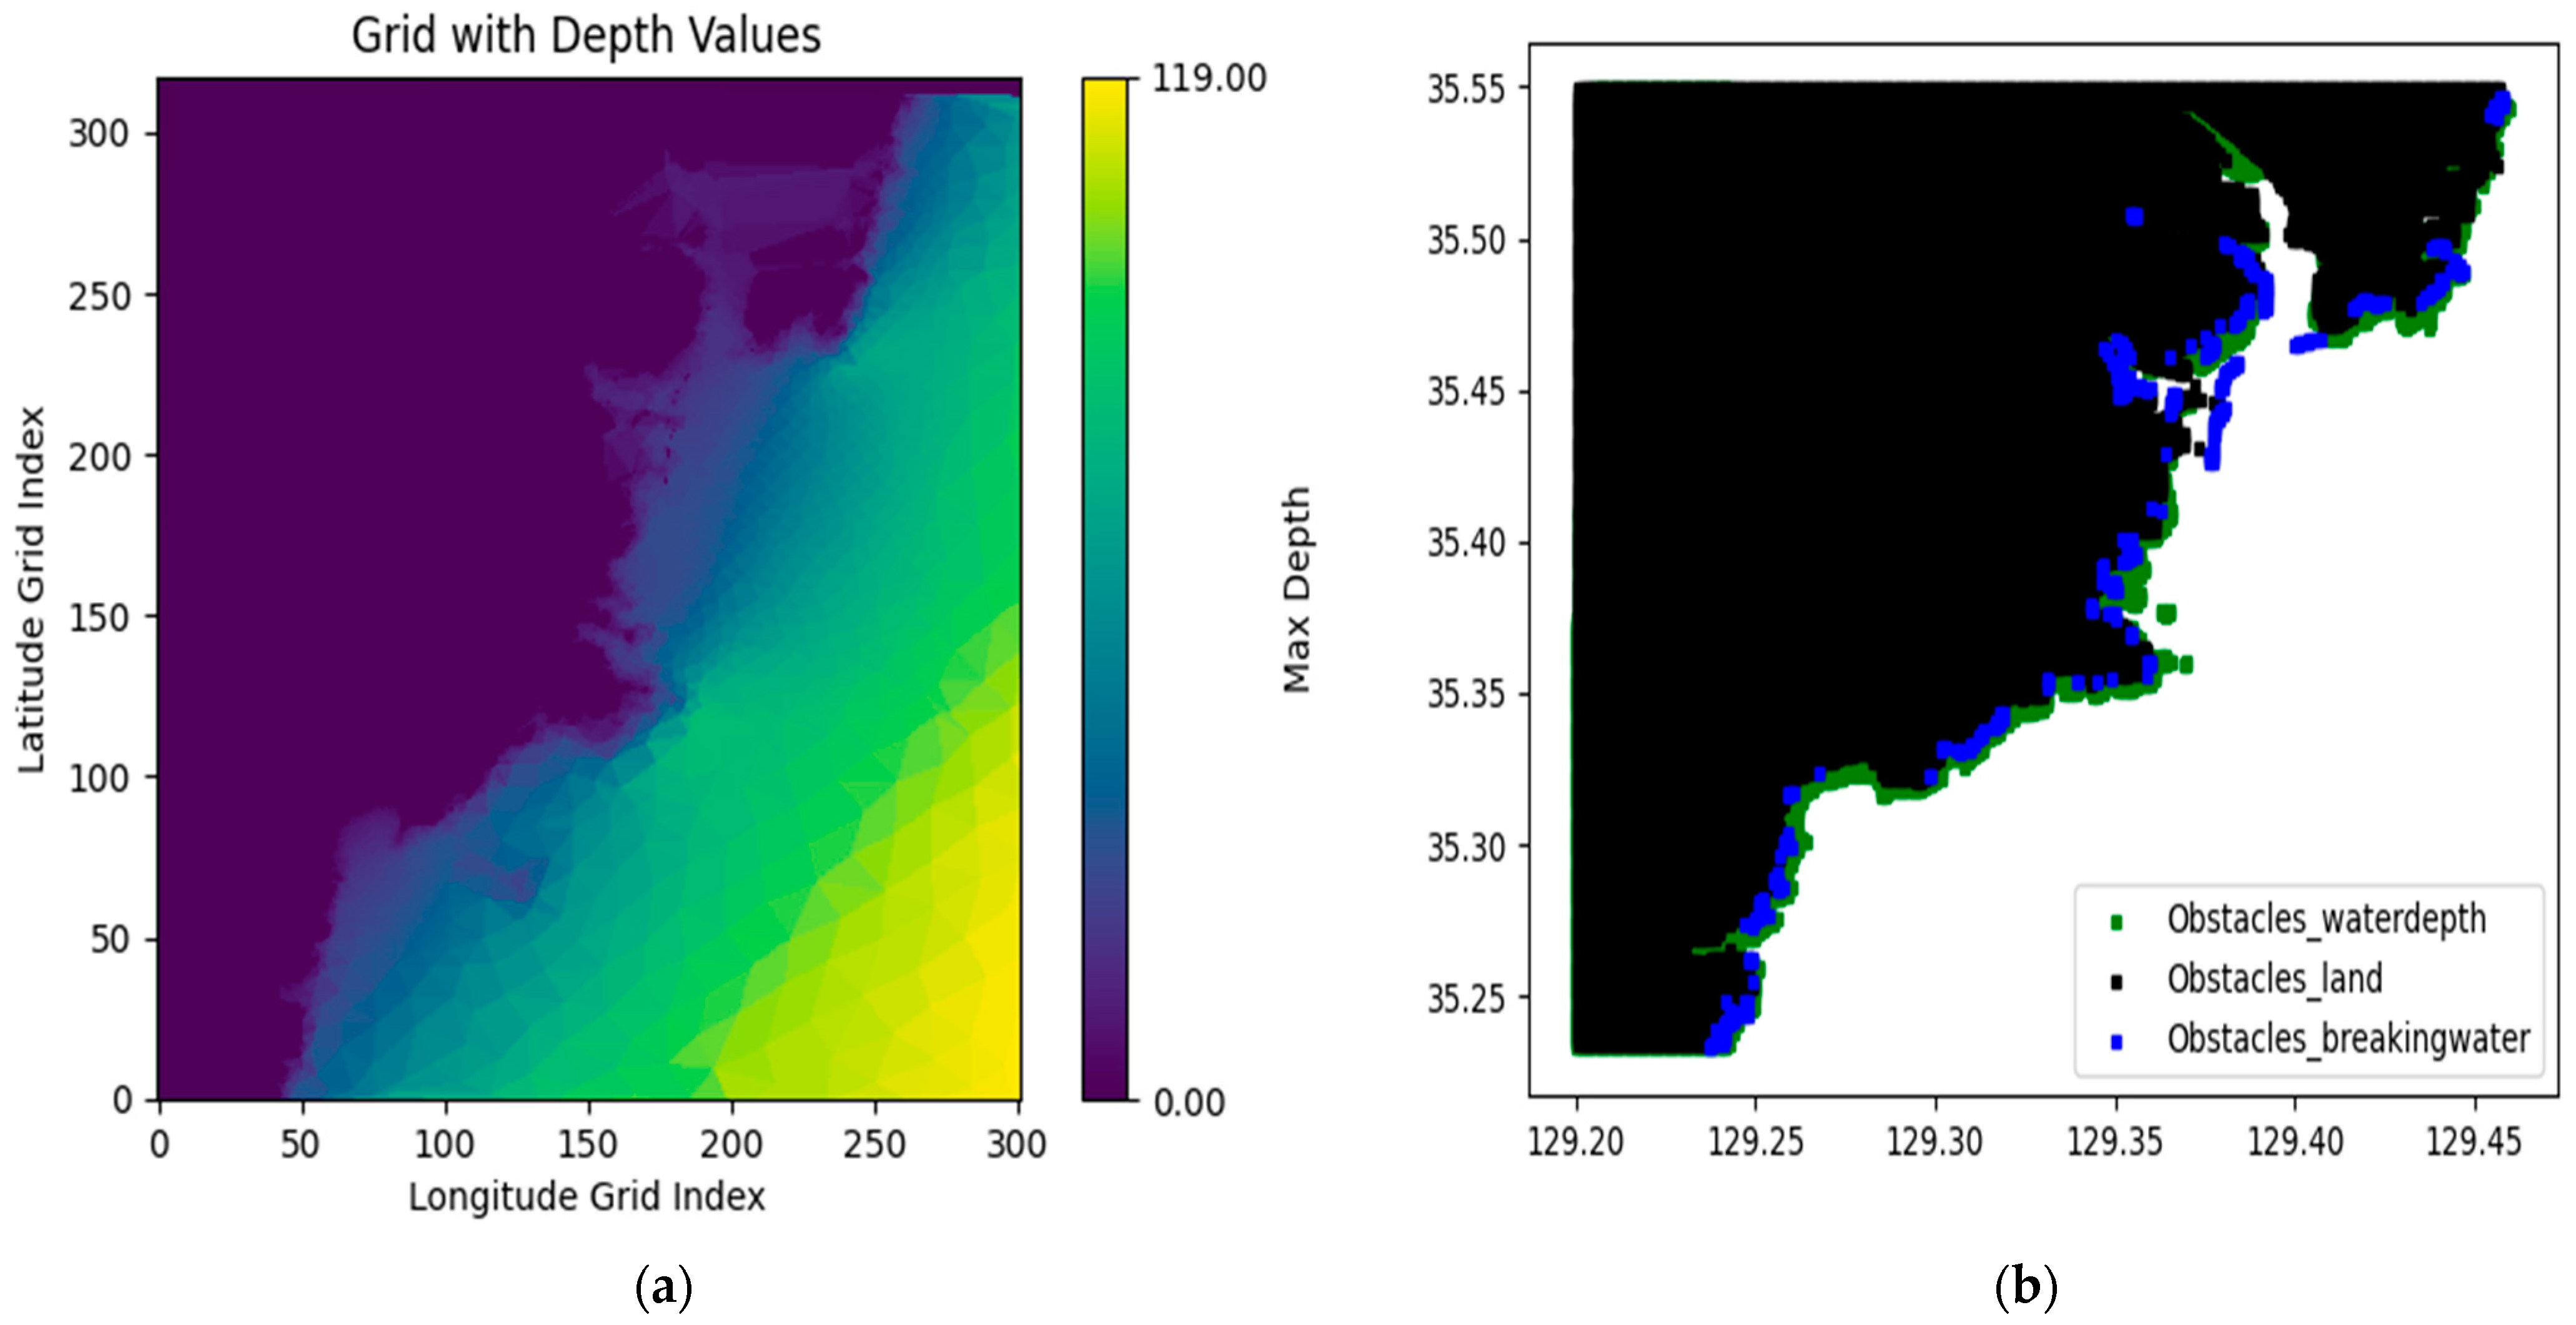
Figure 6a displays a color-coded map of the water depths near the Port of Ulsan, which are critical for ensuring safe navigation. The map uses different colors to clearly show land and progressively deeper water areas. Water depth limitations within the grid have been conservatively established based on the ship’s draft. An additional margin of 3 m is included to accommodate the effect of wave-induced motions like heave, pitch, and roll, which could affect underkeel clearance. The safety margin is crucial for ensuring that the navigable sea areas within the port are free from the risk of grounding, even under significant wave-induced ship movements.
Grid areas with water depths below the defined threshold are labeled as ‘Obstacle_waterdepth’, classifying them as non-navigable regions. And Figure 6b shows the whole obstacle region in the specified Port of Ulsan sea area.

4.2. Modeling Characteristic Regions of the Port of Ulsan

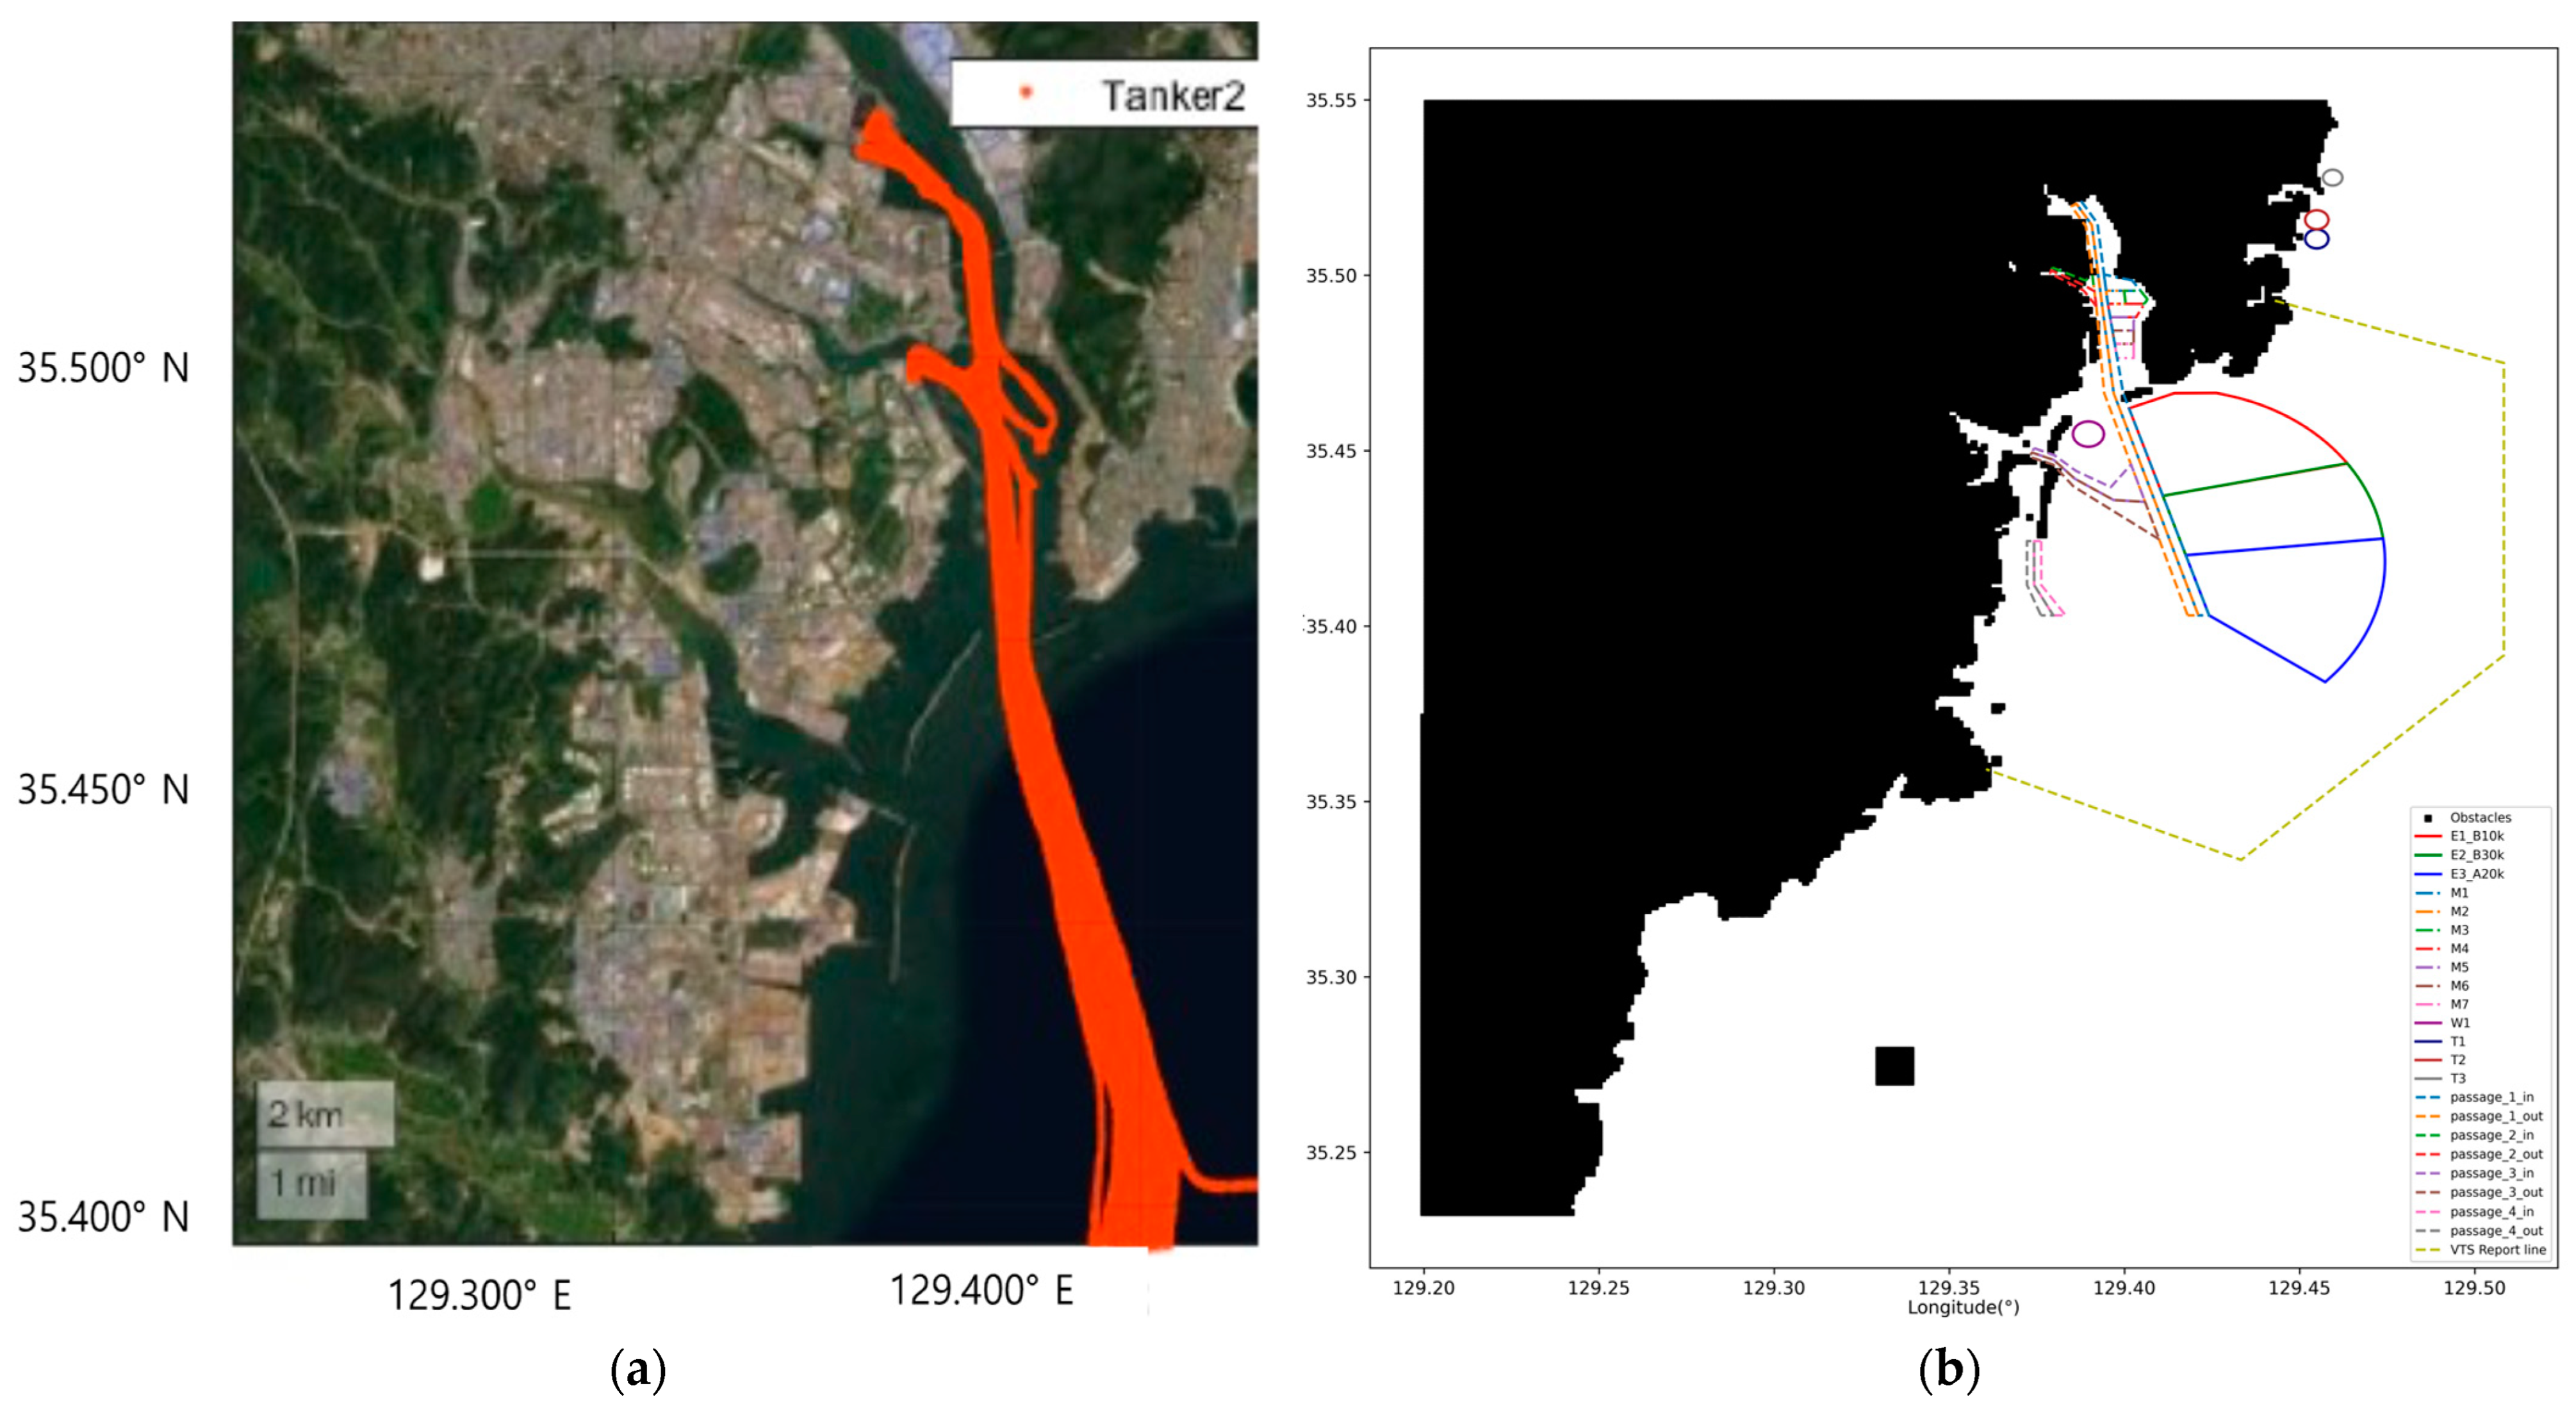
This section describes how characteristic regions of the Port of Ulsan are mapped for subsequent application in the path planning algorithm. Figure 7a represents a graph based on AIS data analysis showing the trajectory of tanker ships operating within the Port of Ulsan, and this graph reveals a pattern of navigation along designated traffic lanes. Additionally, scenarios requiring ships to wait at anchorage points due to immediate berthing challenges, such as heavy traffic lane congestion, berth schedule alterations, or operational issues like supply and maintenance, have to be considered.
For this purpose, traffic lanes and anchorage areas have been modeled, as depicted in Figure 7b. As detailed in Section 3.1, total obstacle areas are marked in black, and the anchorage areas are depicted using polygons. To comply with COLREGs, each traffic lane is split down the center, distinguishing inbound and outbound paths. For instance, ‘Passage1’, representing ‘Trafficlane1’, is distinctly modeled into ‘Passage1 _in’ and ‘Passage1 _out’ using polygonal shapes.
Additionally, the ‘obstacle_specified’ region concept is introduced to model and designate areas such as military training zones or fishing grounds, allowing ships to effectively avoid these specified regions. In this study, this ‘obstacle_specified’ area, located between a latitude ranging from 35.270 to 35.280 degrees and a longitude ranging from 129.330 to 129.340 degrees, is designated to ensure that the route connects the origin and destination while avoiding the ‘obstacle_specified’ area.
Furthermore, a VTS report line is established and set as a polygon in the Port of Ulsan. This line, a mandatory maritime traffic service, requires ships to report their identification, position, and other relevant information to the VTS authority when entering or departing specific areas. The latitude and longitude of a ship’s origin and destination are utilized in conjunction with this VTS report line to automatically determine whether a ship is inbound or outbound. This determination is then integrated into the algorithm to facilitate accurate navigation for ships entering or leaving the port.
The polygon sets, composed of tuples of latitude and longitude, are represented in Equation (7). These polygons are modeled to represent specific anchorages, including group anchorages E1, E2, and E3; circular anchorages W, T1, T2, and T3; and smaller anchorages M1 to M7. Additionally, the inbound and outbound areas of the traffic lanes are also represented as polygons in a similar manner to find a global path based on COLREGs. Also, the VTS report line is depicted as a polygon encompassing the entire maritime area of the Port of Ulsan.
P o l y g o n c h a r a c t e r i s t i c s = [ c h a r a c t e r 1 l a t 1 , l o n 1 , l a t 2 , l o n 2 , ,   c h a r a c t e r 2 l a t 1 , l o n 1 , l a t 2 , l o n 2 , ]
It is necessary for ships to receive permission from the Ulsan Port Authority to access the anchorage areas. Following this, ships can be anchored at the appointed positions in group anchorages, as directed by the Ulsan Port VTS center, using precise latitude and longitude coordinates.
From the perspective of autonomous ships, standardized anchorage positions are needed to generate automatic path planning and ensure safe and effective routes within the port. Manually managing group anchorages can become inefficient, especially if the number of ships increases and unused spaces start to emerge, highlighting the necessity for a more flexible approach in placing ships for enhanced operational efficiency.
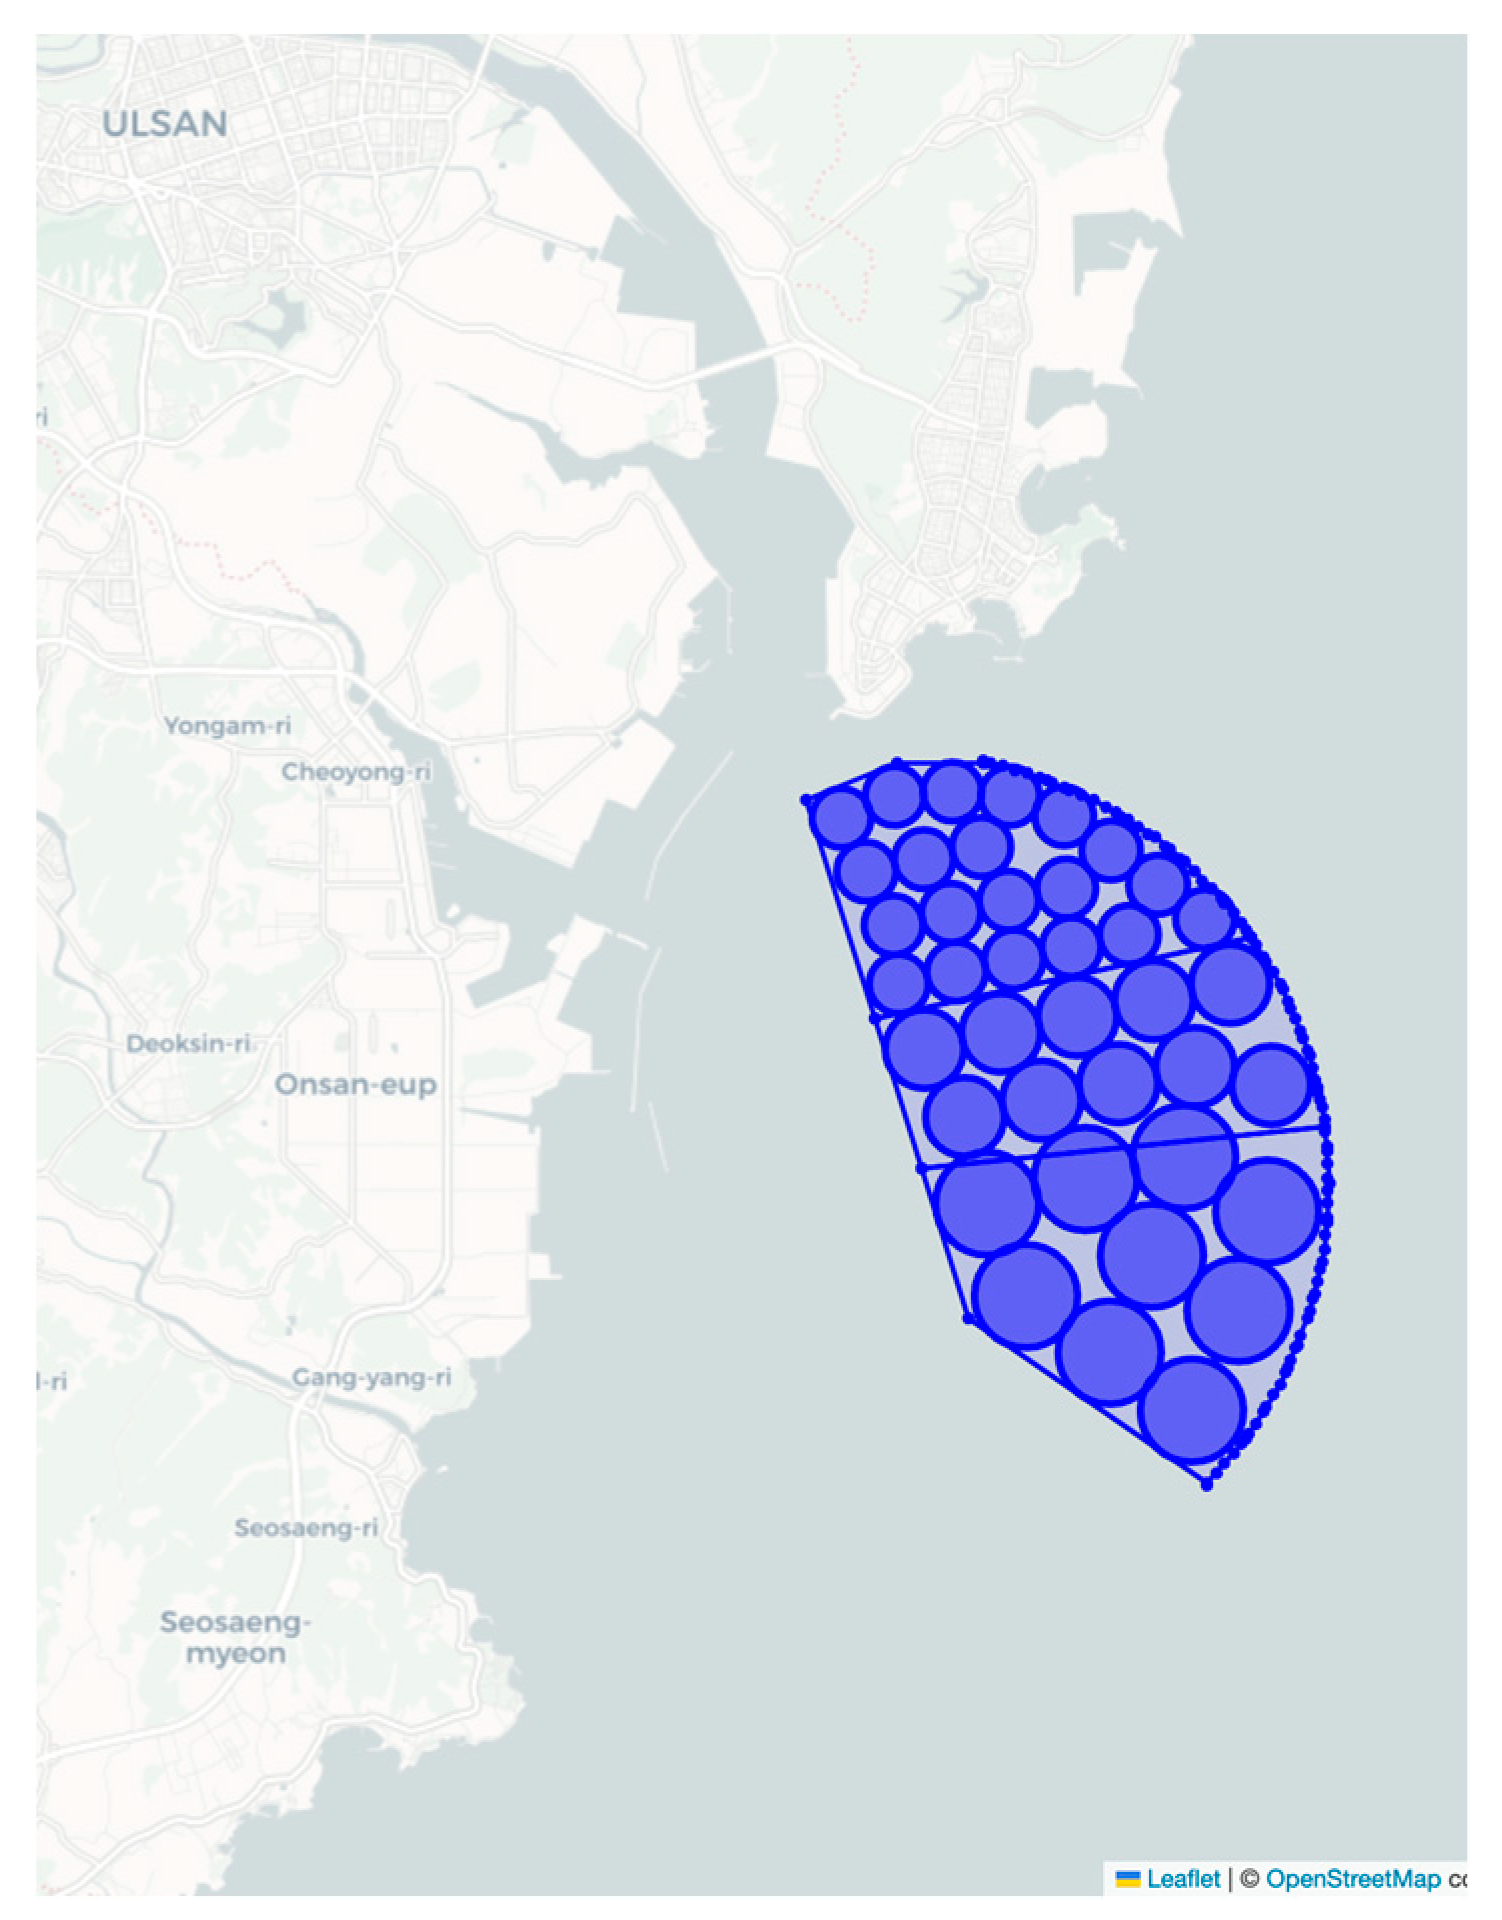
This study focused on subdividing the Port of Ulsan’s primary group anchorage zones—E1, E2, and E3—into smaller circular areas to better integrate stopovers into the routes of autonomous ships. The subdivision was based on the DWT of ships suitable for each anchorage, with E1 for ships up to 10,000 tons, E2 for up to 30,000 tons, and E3 for those over 20,000 tons. The dimensions of these circular anchorages were determined proportionally to the target ships’ specifications [44], derived from a survey of vessels operating in the Port of Ulsan.
Following the “Port and Harbor Design Criteria” [44], the circular anchorages’ radius is calculated using Equation (8), the ship length (L), and water depth (D), and the results are displayed in Table 2. These calculations take into account the criteria for single-anchor scenarios and favorable sediment conditions, specifically the mud found in the Port of Ulsan. The radius ensures safe anchoring distances to prevent collisions between ships. A previous study, ref. [45], showed that under Beaufort 7 wind conditions, when considering factors like ship length, water depth, and anchoring chain length, the radius is smaller than the radius derived from calculations involving the rule-based methods determined by Equation (8). Therefore, using the rule-based radius, as evident from the more conservative results presented in this paper, is considered a reasonable approach.
Radius = L + 6D
The circular anchorage radius is established as follows: Anchorage E1 is set to 367 m for ships up to 10,000 tons, Anchorage E2 is set to 490 m for ships up to 30,000 tons, and Anchorage E3 is set to 693 m for ships up to 300,000 tons [46,47].
Based on these criteria, the latitude and longitude coordinates for each anchorage area are derived, resulting in the configuration of 20 circular anchorages for E1, 10 for E2, and 9 for E3, which are displayed with their coordinates in Table 3. A detailed graphical of the locations and radii of the circular anchorage areas within the grouped anchorage zones is presented in Figure 8.
The coordinates of the circular anchorages were established according to the standard for global route generation for the autonomous ships considered in this study and used solely for the purpose of this study. As smart port technologies become more advanced, it is anticipated that efficient and adaptive anchoring points will need to be developed to meet the operational demands of port management, and the contents of this paper could act as a reference for developments in this context.

4.3. Global Path Planning Results

4.3.1. Improved A* Algorithm

This section summarizes the results of generating global path plans within the port. The overall navigation map is rasterized by a grid size of 0.001 degrees and divided into 318 × 259 grids.
The starting location is established at coordinates (35.240, 129.300), the southwest region where numerous harbors provide access to the Port of Ulsan. The designated destination location is set at coordinates (35.510, 129.389), where we simulated the scenarios of ships entering the Port of Ulsan, specifically the Ulsan port VTS berth location near the end of trafficlane1. To explore the global routes passing through the anchorages discussed in this paper, a waypoint is established at a circular anchorage within group E1, located at the coordinates Latitude (16), Longitude (16) in the E1_circle_anchorage, as listed in Table 3.
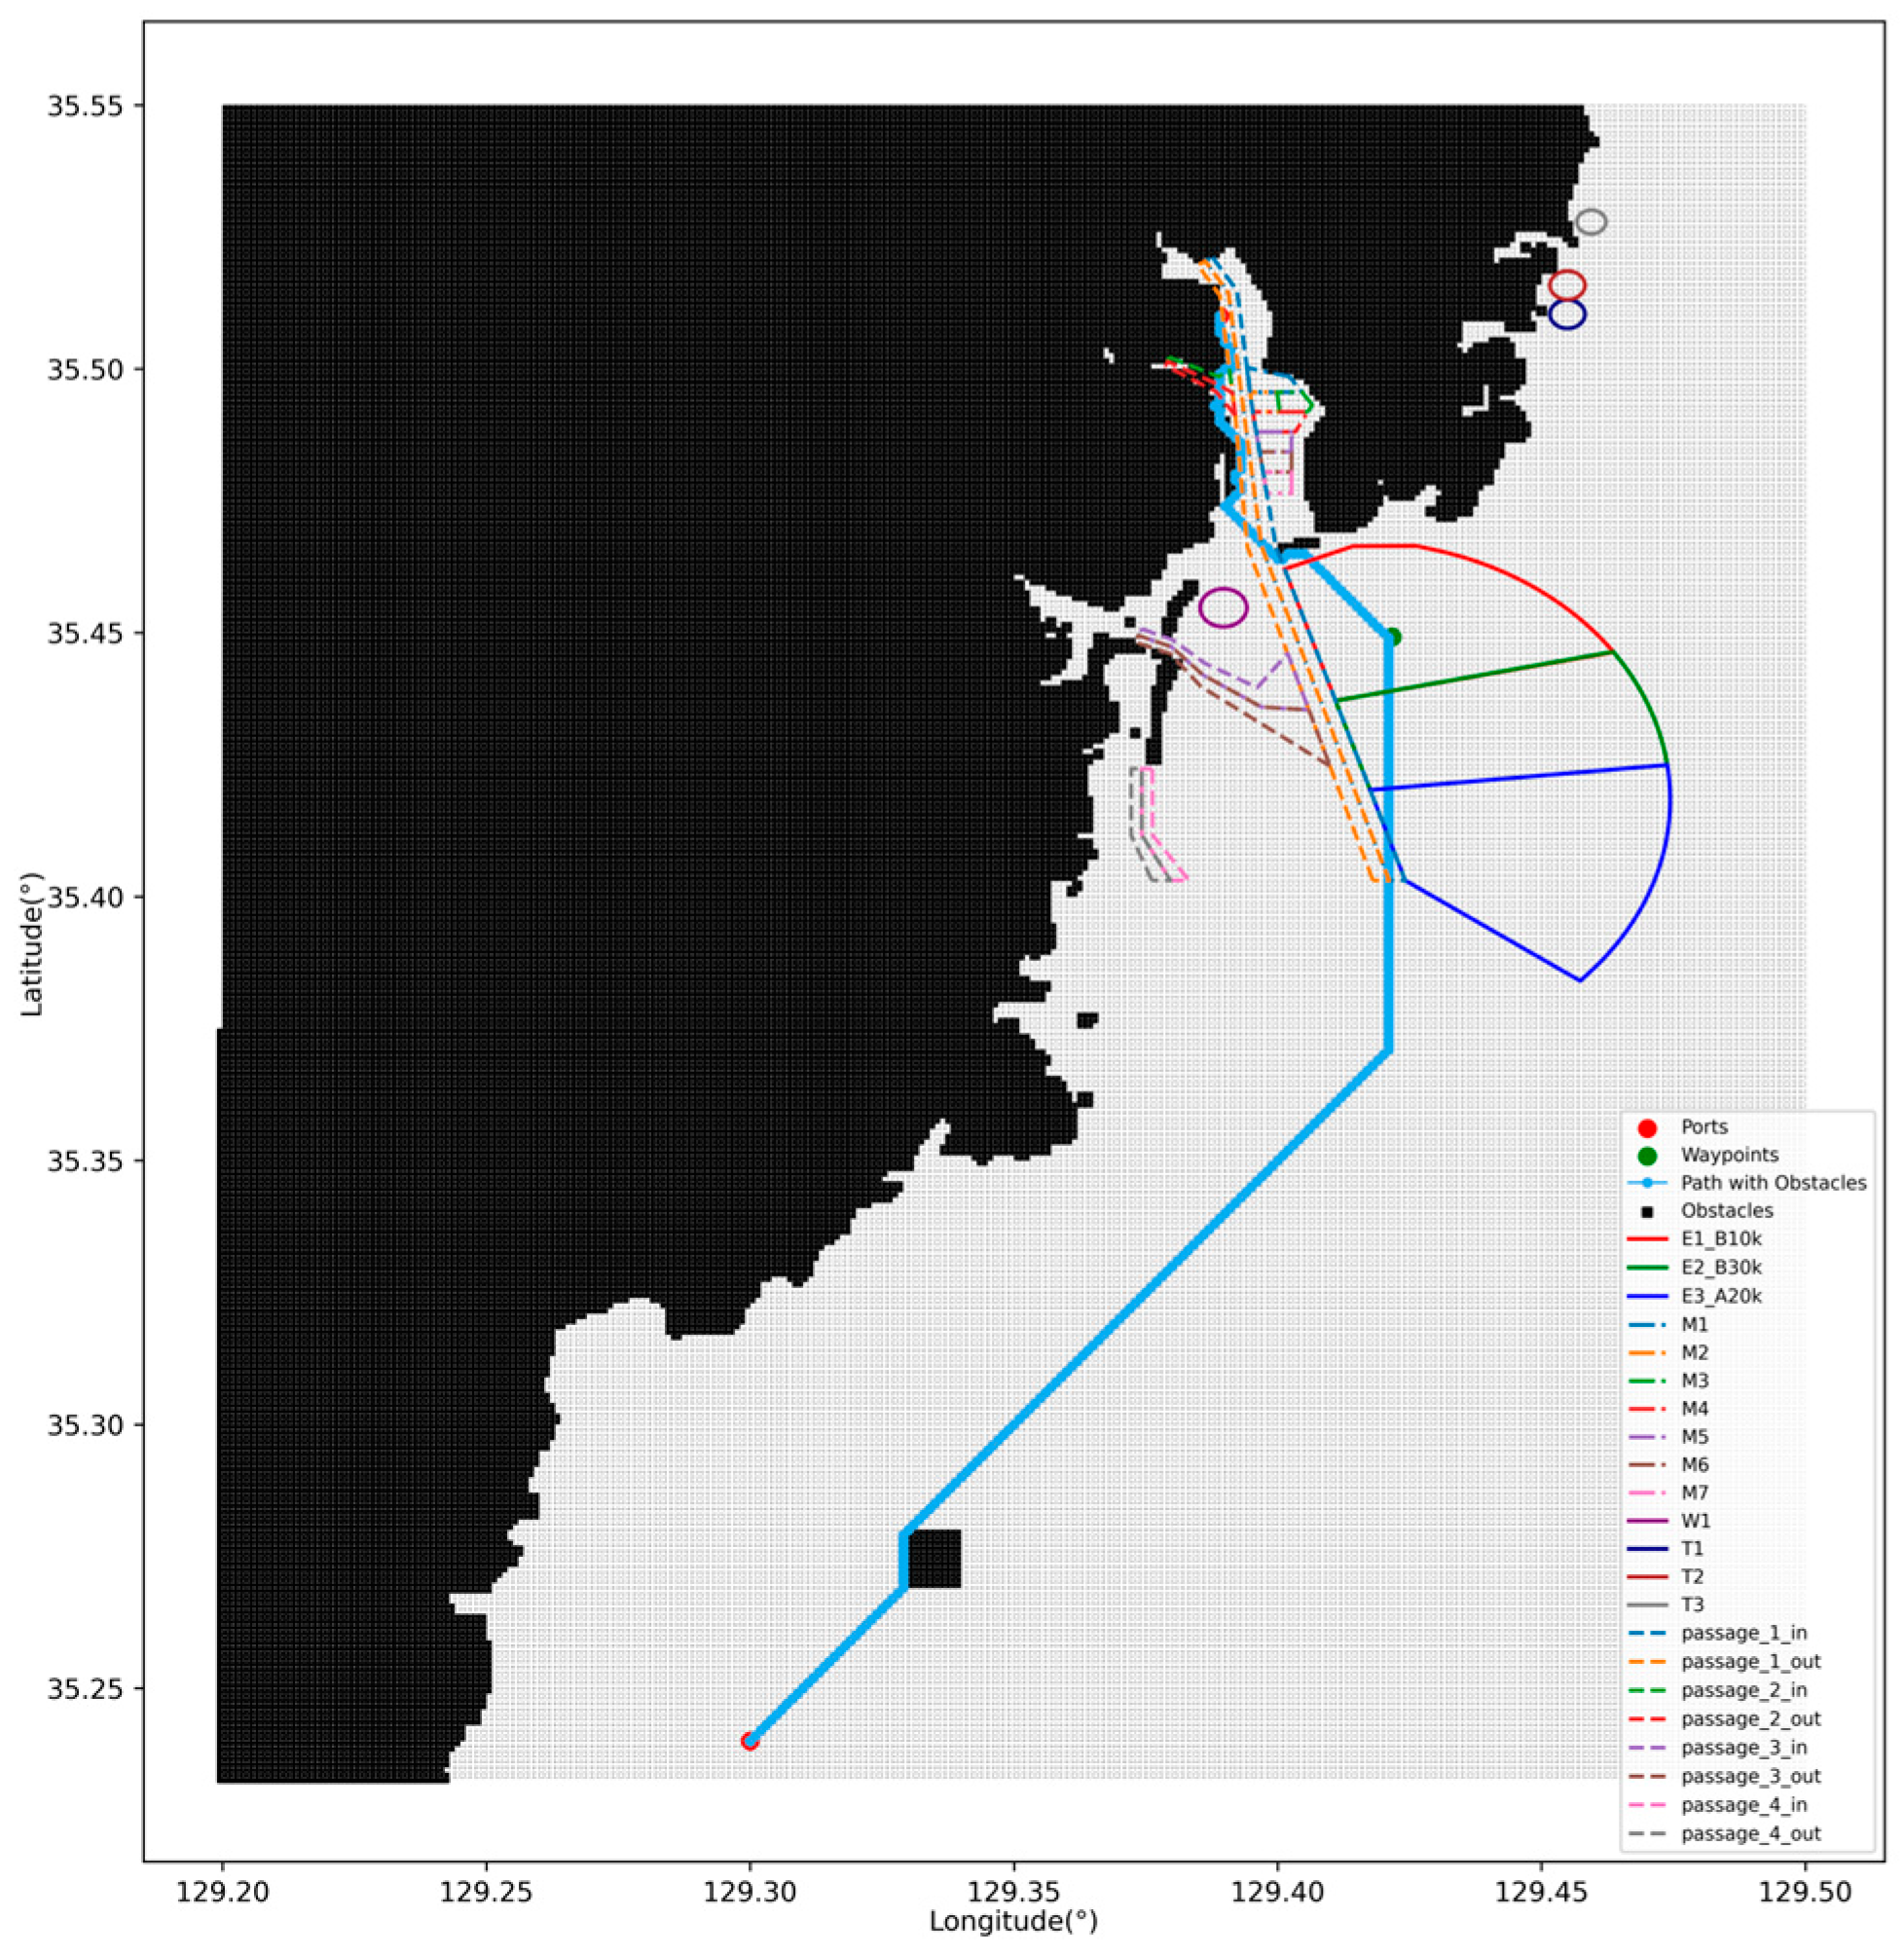
The results of applying the standard A* algorithm are shown in Figure 9. The route does not take into account traffic lanes and anchorage areas. As a result, the algorithm’s path passes through the E2 and E3 anchorage areas to reach the E1 anchorage area while avoiding the ‘obstacle_specified’ areas. Although the algorithm selects the shortest path from its current position, we observed that the algorithm elected to follow along the land near the destination without accounting for traffic lane boundaries.
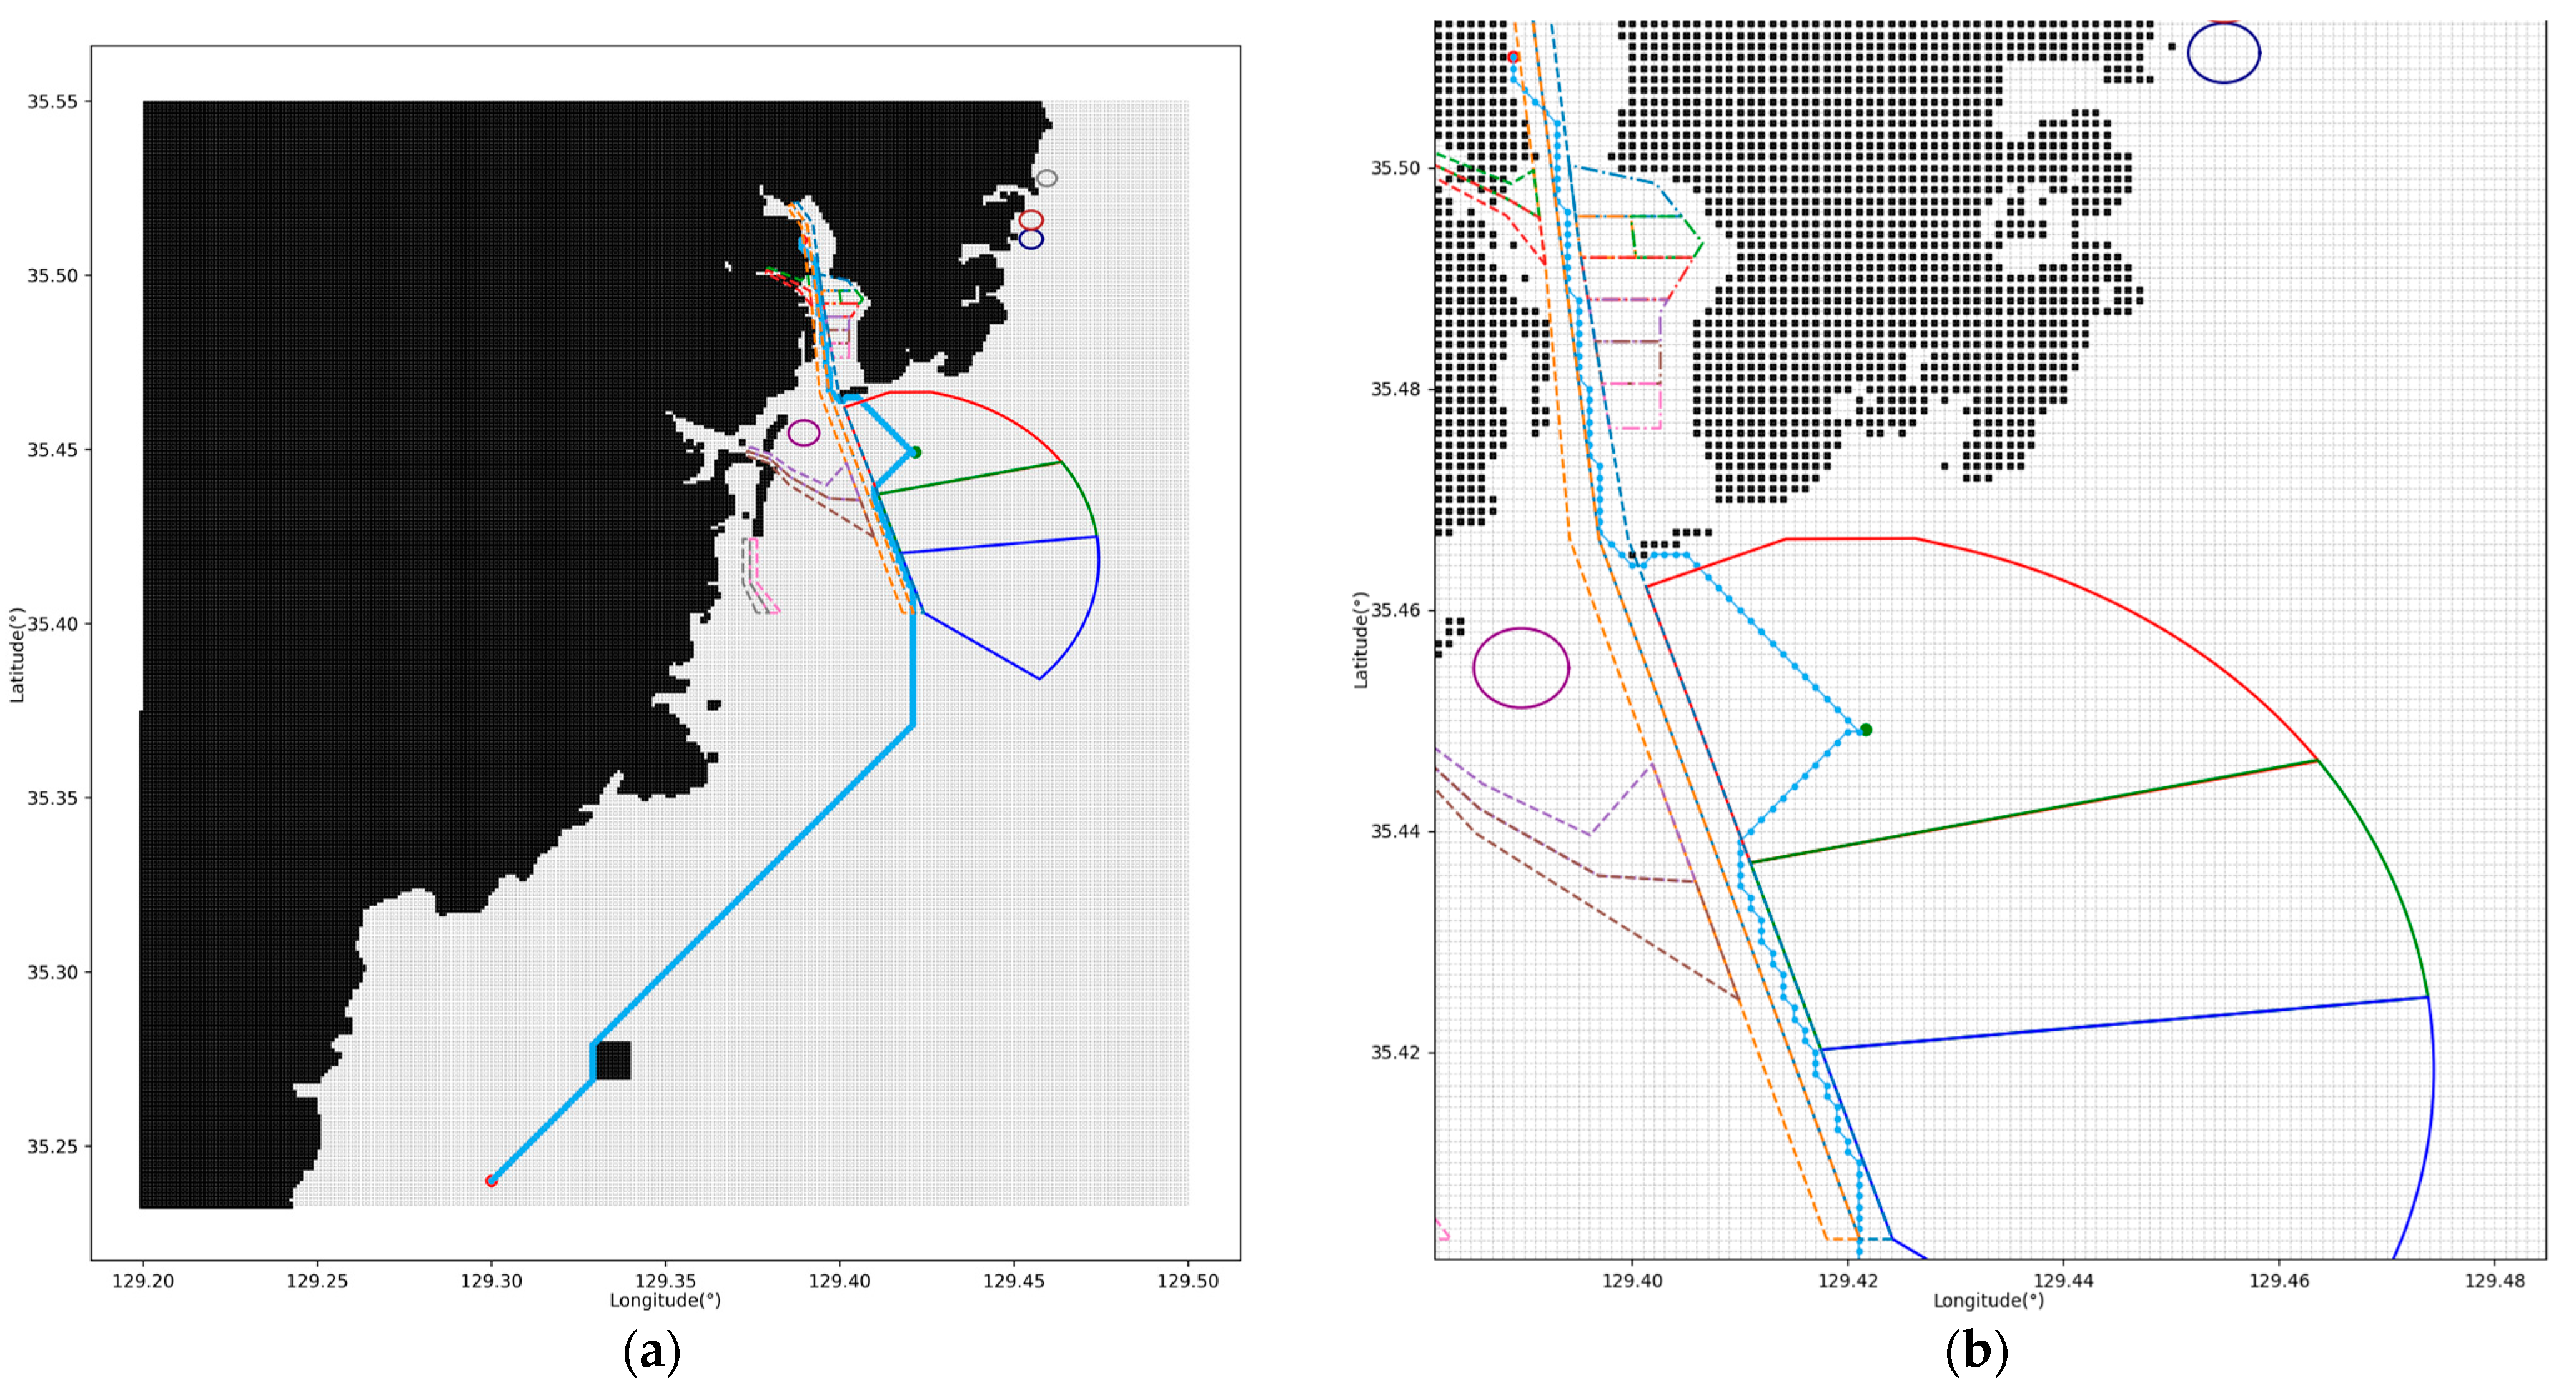
The A* algorithm was modified by incorporating an additional cost function which is proportional to its heuristic function and weight factor to enhance the safety of global route planning within the port. This adjustment specifically targets the grid within the E2 and E3 polygon areas of the port when a waypoint is set within the E1 anchorage. Figure 10 illustrates the results of this modification, a route to the E1 anchorage that strategically bypasses the E2 and E3 anchorage areas. However, it can be observed that the path from the anchorage waypoint to the final destination tends to comprise the shortest route, often coming close to land without considering traffic lanes.
To address these challenges, we enhanced the algorithm by integrating a cost function and a weight factor related to traffic lanes. First, it is necessary to determine whether a voyage is arriving at or departing from the Port of Ulsan, which is based on the positions of the starting and destination points relative to the VTS report line. A voyage is categorized as inbound if it starts outside and arrives within the VTS report line. For such scenarios, we added a cost function to increase the total cost for areas outside the ‘in’ polygon of the traffic lane. This setup minimizes the cost for planned routes passing through the ‘in’ area of the traffic lane. As a result, it was possible to derive a global path that follows the traffic lanes, and this path can be found in Figure 11.

4.3.2. Smoothing the Global Path

This section covers the application of a smoothing algorithm which was applied to global paths derived from the improved A* algorithm to optimize navigation and aid in the development of efficient shipping routes by employing Bresenham’s line algorithm.
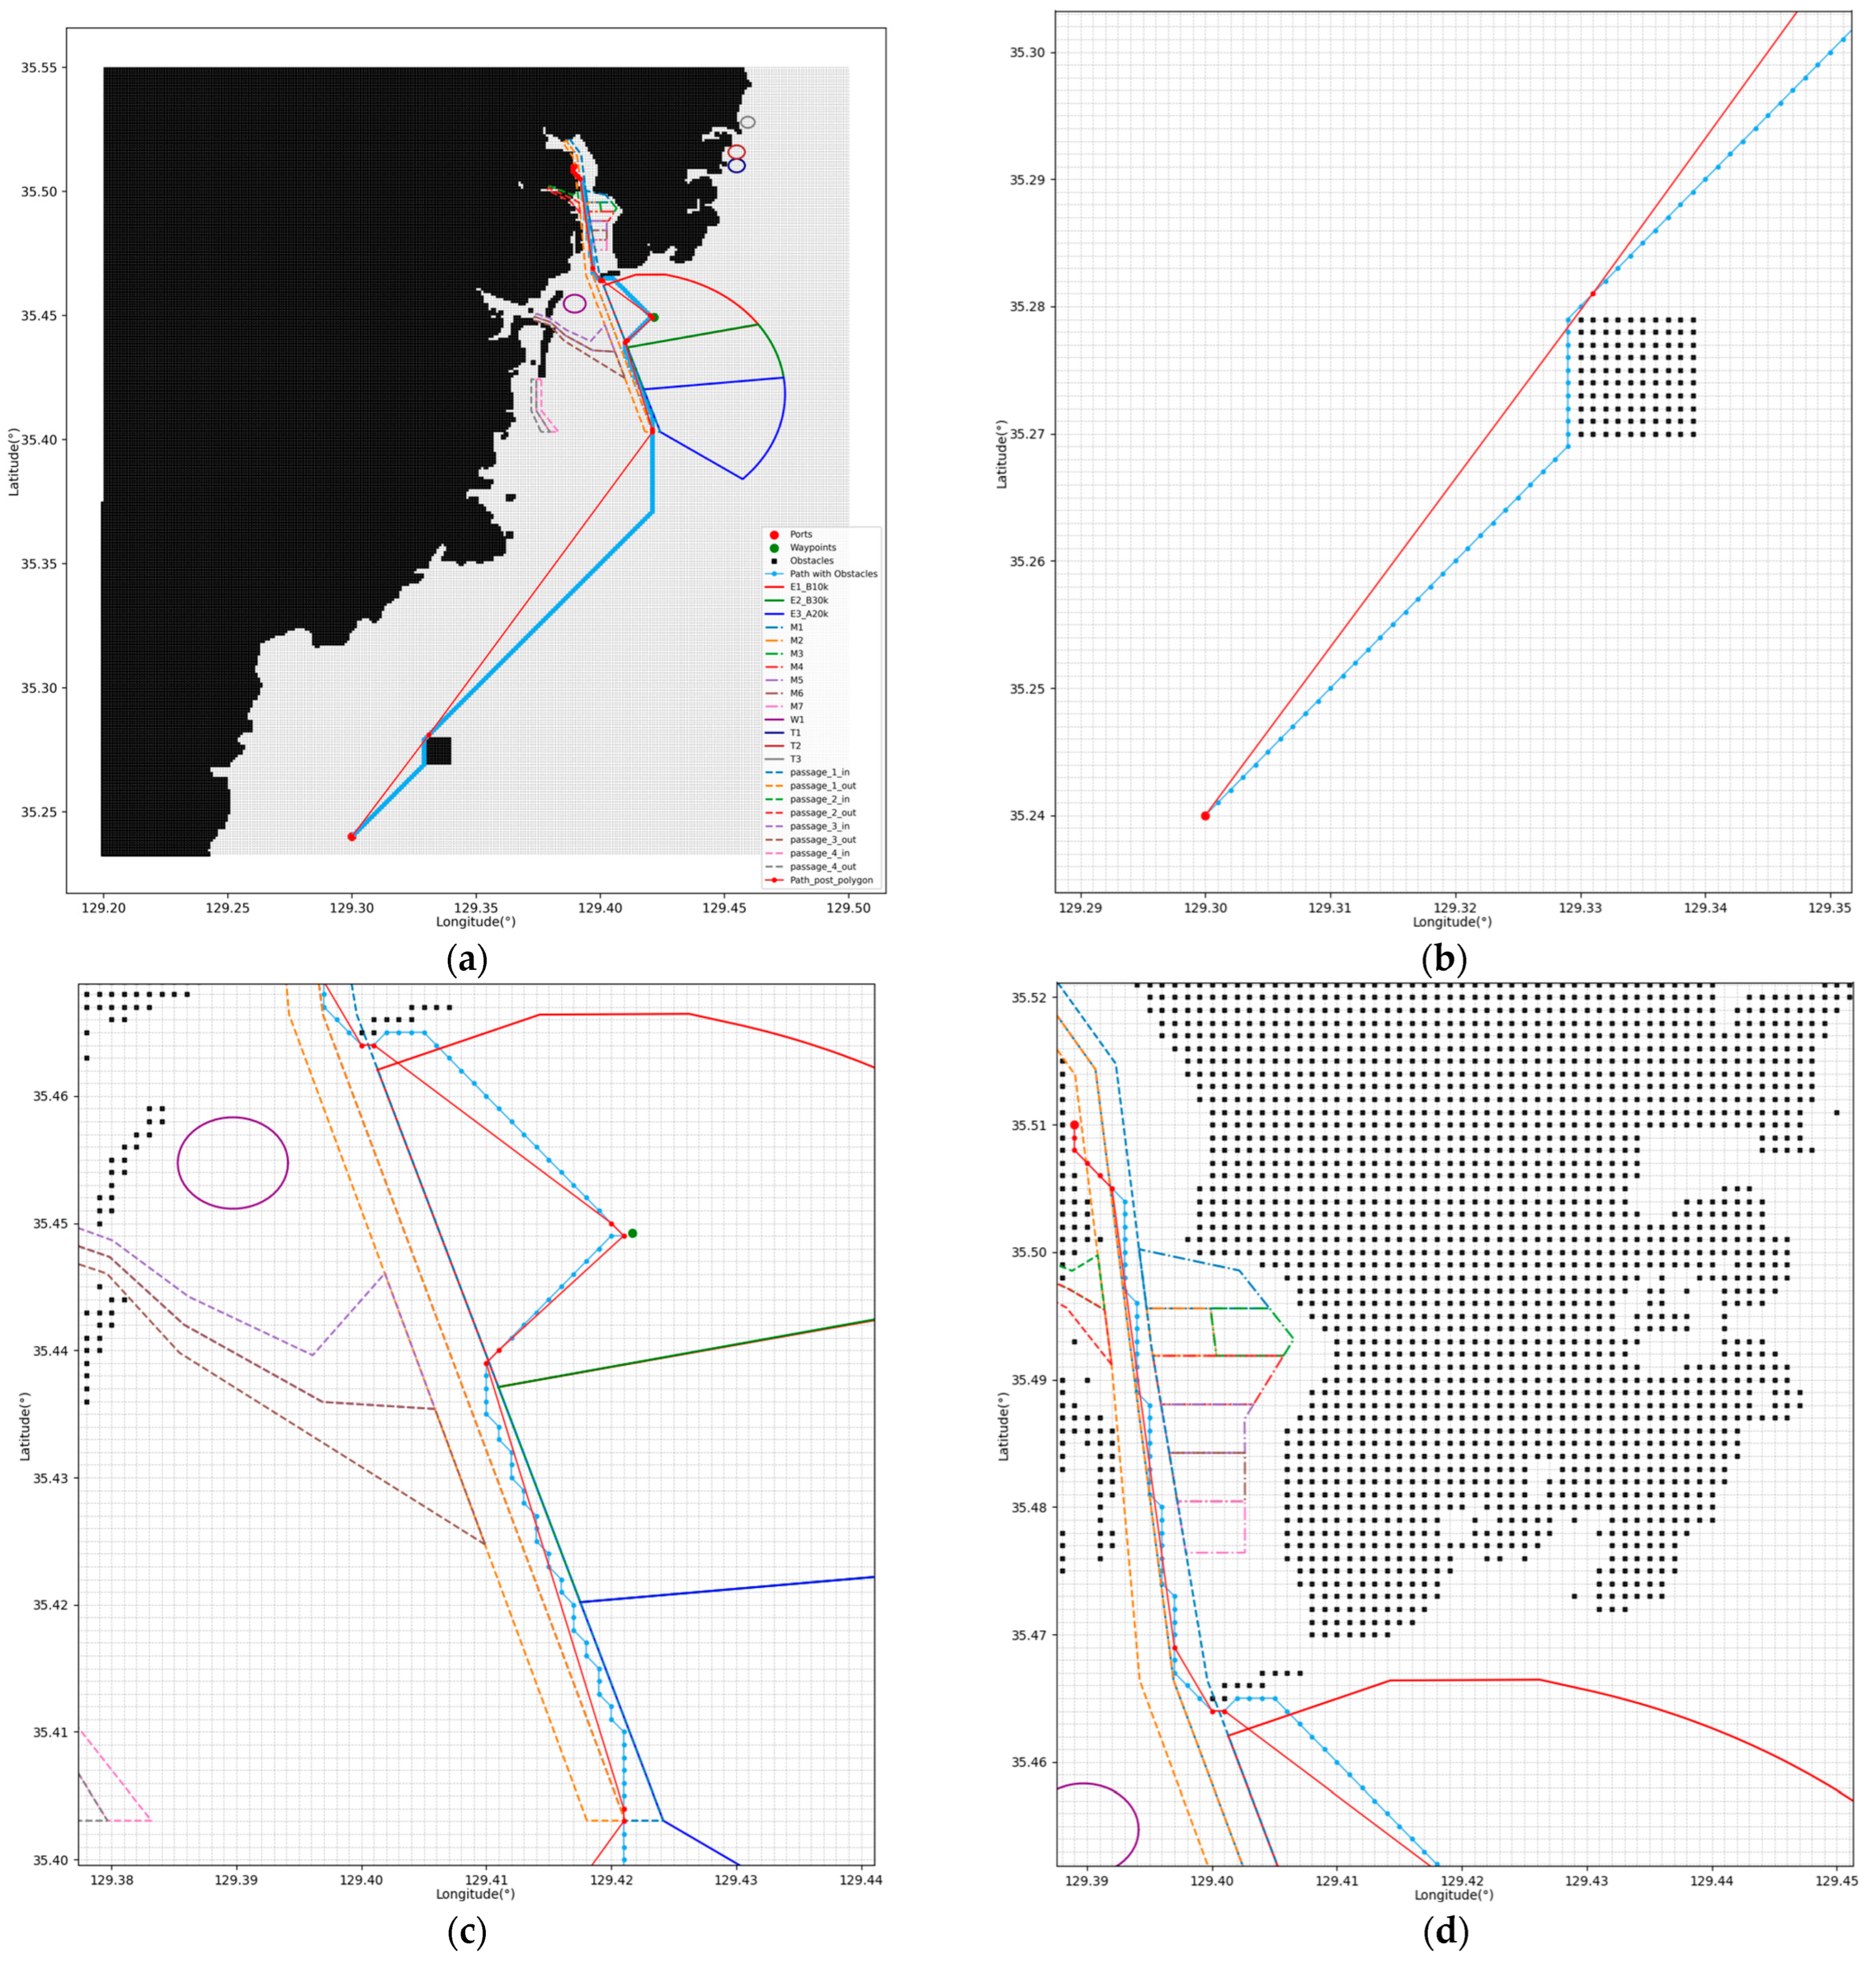
The improved A* algorithm’s results indicate that the total route length is 36.188 km, with 43 turns, as shown by the blue line in Figure 12. However, the route features a high frequency of turns, especially near the narrow sections of the traffic lane polygons, which may lead to potential operational inefficiencies. These frequent adjustments increase the risk of incidents, cause a reduction in speed due to excessive rudder usage, and result in energy wastage during navigation.
The smoothing algorithm is implemented to refine the improved A* algorithm path, taking into account the specific characteristics of traffic lanes and anchorage areas. To maintain the overall path trends of the improved A* algorithm, the path within each polygon area is segmented by each polygon region. This smoothing is distinctly established in each polygon region, as shown via the red line in Figure 12. Furthermore, during post-processing, the final point of the improved A* algorithm within one polygon segment and the initial point within the subsequent polygon are processed as a distinct segment to mitigate excessive directional changes at segment boundaries. This method also effectively prevents collisions with obstacles near the boundaries of polygon regions.
Table 4 presents a comparison between the total route lengths and the number of turns from the global paths generated by the improved A* algorithm and those refined by the smoothing algorithm. The smoothed routes are shorter, measuring 34.667 km, which reflects a 4.2% reduction compared to the original paths derived from the improved A* algorithm. Additionally, the number of turns has been reduced from 43 to 12, marking a significant 72% decrease and indicating a more streamlined path within the traffic lanes. This optimization, through the strategic placement of waypoints, likely leads to shorter navigational routes and reduced rudder movement, thus enhancing the operational efficiency of vessels.

4.4. Validation through Simulation Results

To verify the reliability of the path planning results, the waypoints of the smoothing algorithm were applied in the MMG model for simulations, and the results of these simulations were compared with the test ship’s tracking routes following the proposed waypoints. The simulations used hydrodynamic coefficients from model tests to ensure a realistic ship trajectory. The waypoint tracking was designed so that when a ship approaches an area within twice its length from a waypoint, it transitions to the next waypoint for efficient tracking.
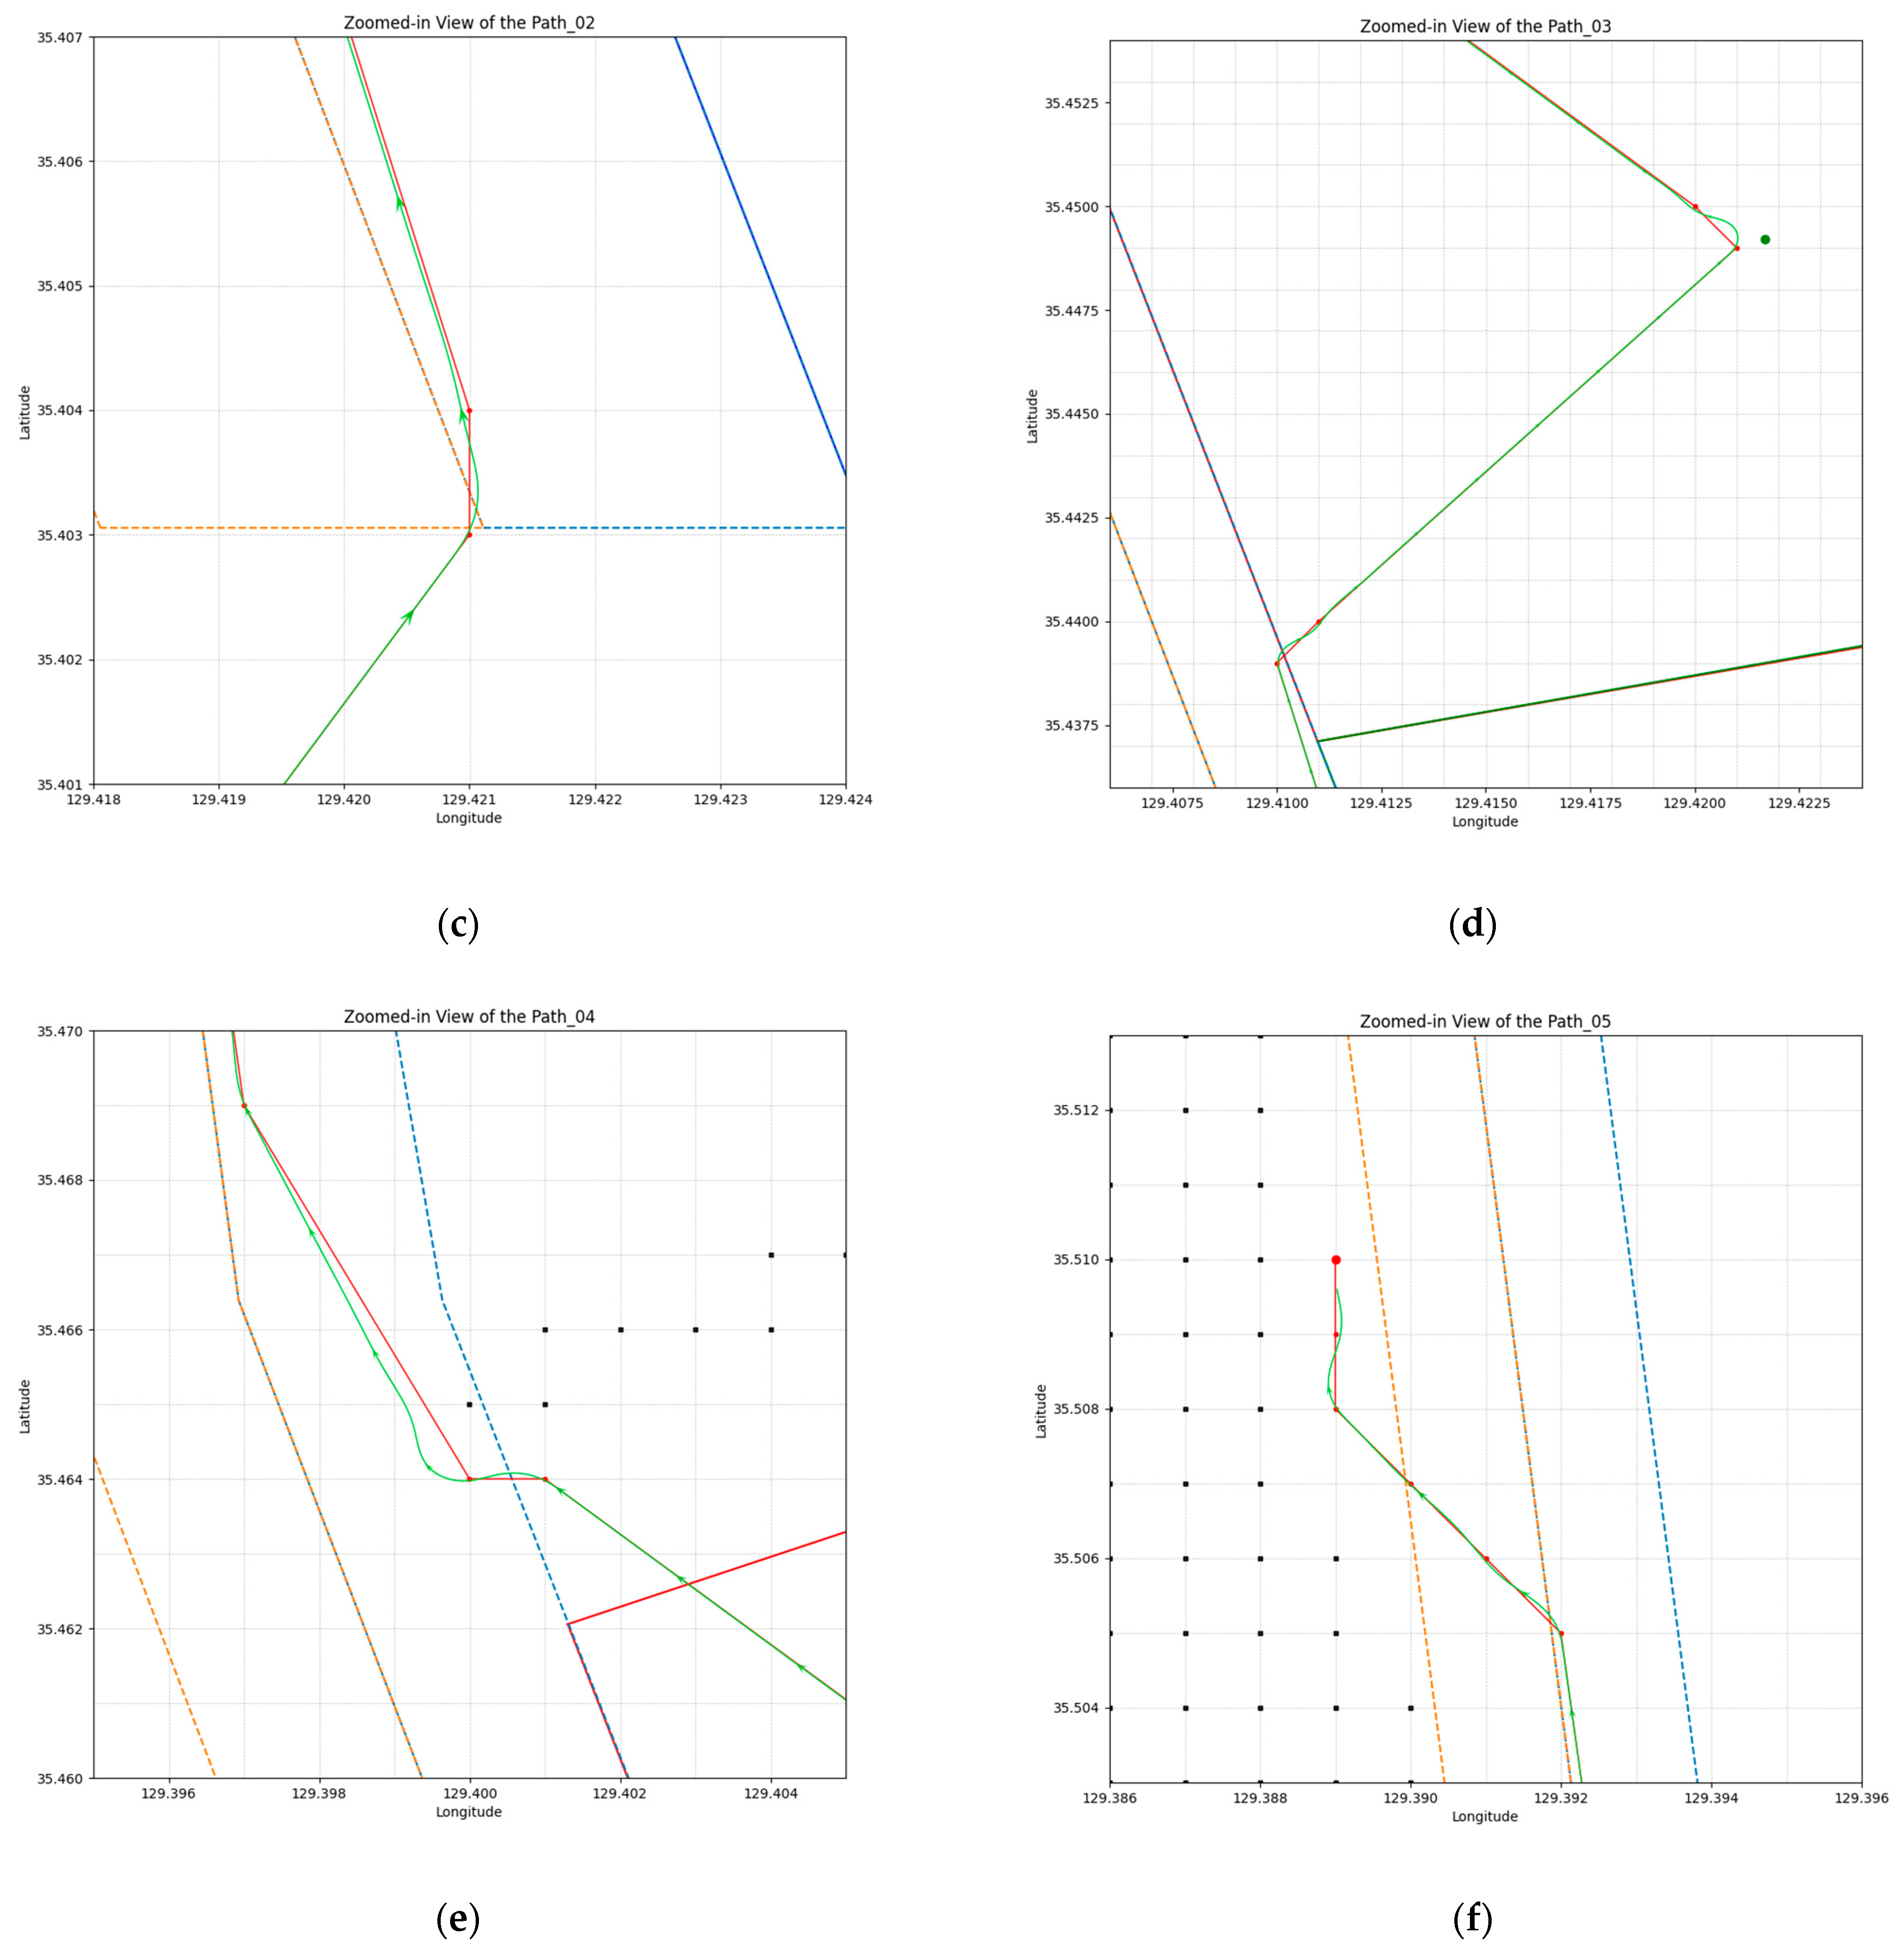
Figure 13 illustrates these paths, with red indicating waypoints derived from the smoothing algorithm routes and green representing the results of simulations based on ship maneuvering equations. The ship starts at the route’s beginning, heading true east to assess how effectively it follows the waypoints. The ship’s speed is set to 6 knots, suitable for in-harbor navigation, and simulations are conducted at intervals of 0.01 s. Rudder control is based on the heading error, calculated as the difference between the angle to the next waypoint and the current heading, and rudder control is managed through proportional derivative (PD) control.
In Figure 13b, a deviation between the two routes occurs due to initial heading differences and the significant gap between waypoints. This distance causes the maneuvering simulation’s trajectory to align slowly with the red line. Additionally, this deviation is attributed to the ship’s inertia and the time taken to steer the rudder angle. The green line, showing the maneuvering simulation results, reflects the ship’s trajectory under these conditions.
In Figure 13c,d, at the traffic lane entrance and near the anchorage turn, the simulation closely follows the waypoints. This is because the waypoints are closely spaced in these regions, and the algorithm developed herein takes into account the boundaries of each polygon to generate realistic global paths. In Figure 13e, as the ship exits the anchorage and enters the traffic lane, a second overshoot in the trajectory can be observed due to the continuous changes in waypoints, which are designed to avoid obstacles. The larger spacing between waypoints in the traffic lane leads to a delay in the maneuvering trajectory aligning with the red line. However, the maneuvering simulation trajectory confirms that the route remains within the traffic lane, validating the effectiveness of the route. In Figure 13f, the route crosses the opposite traffic lane towards the destination, indicating a path close to the destination within the traffic lane. Overall, the simulation adheres well to the post-processed waypoints, validating the effectiveness of our global path planning approach.
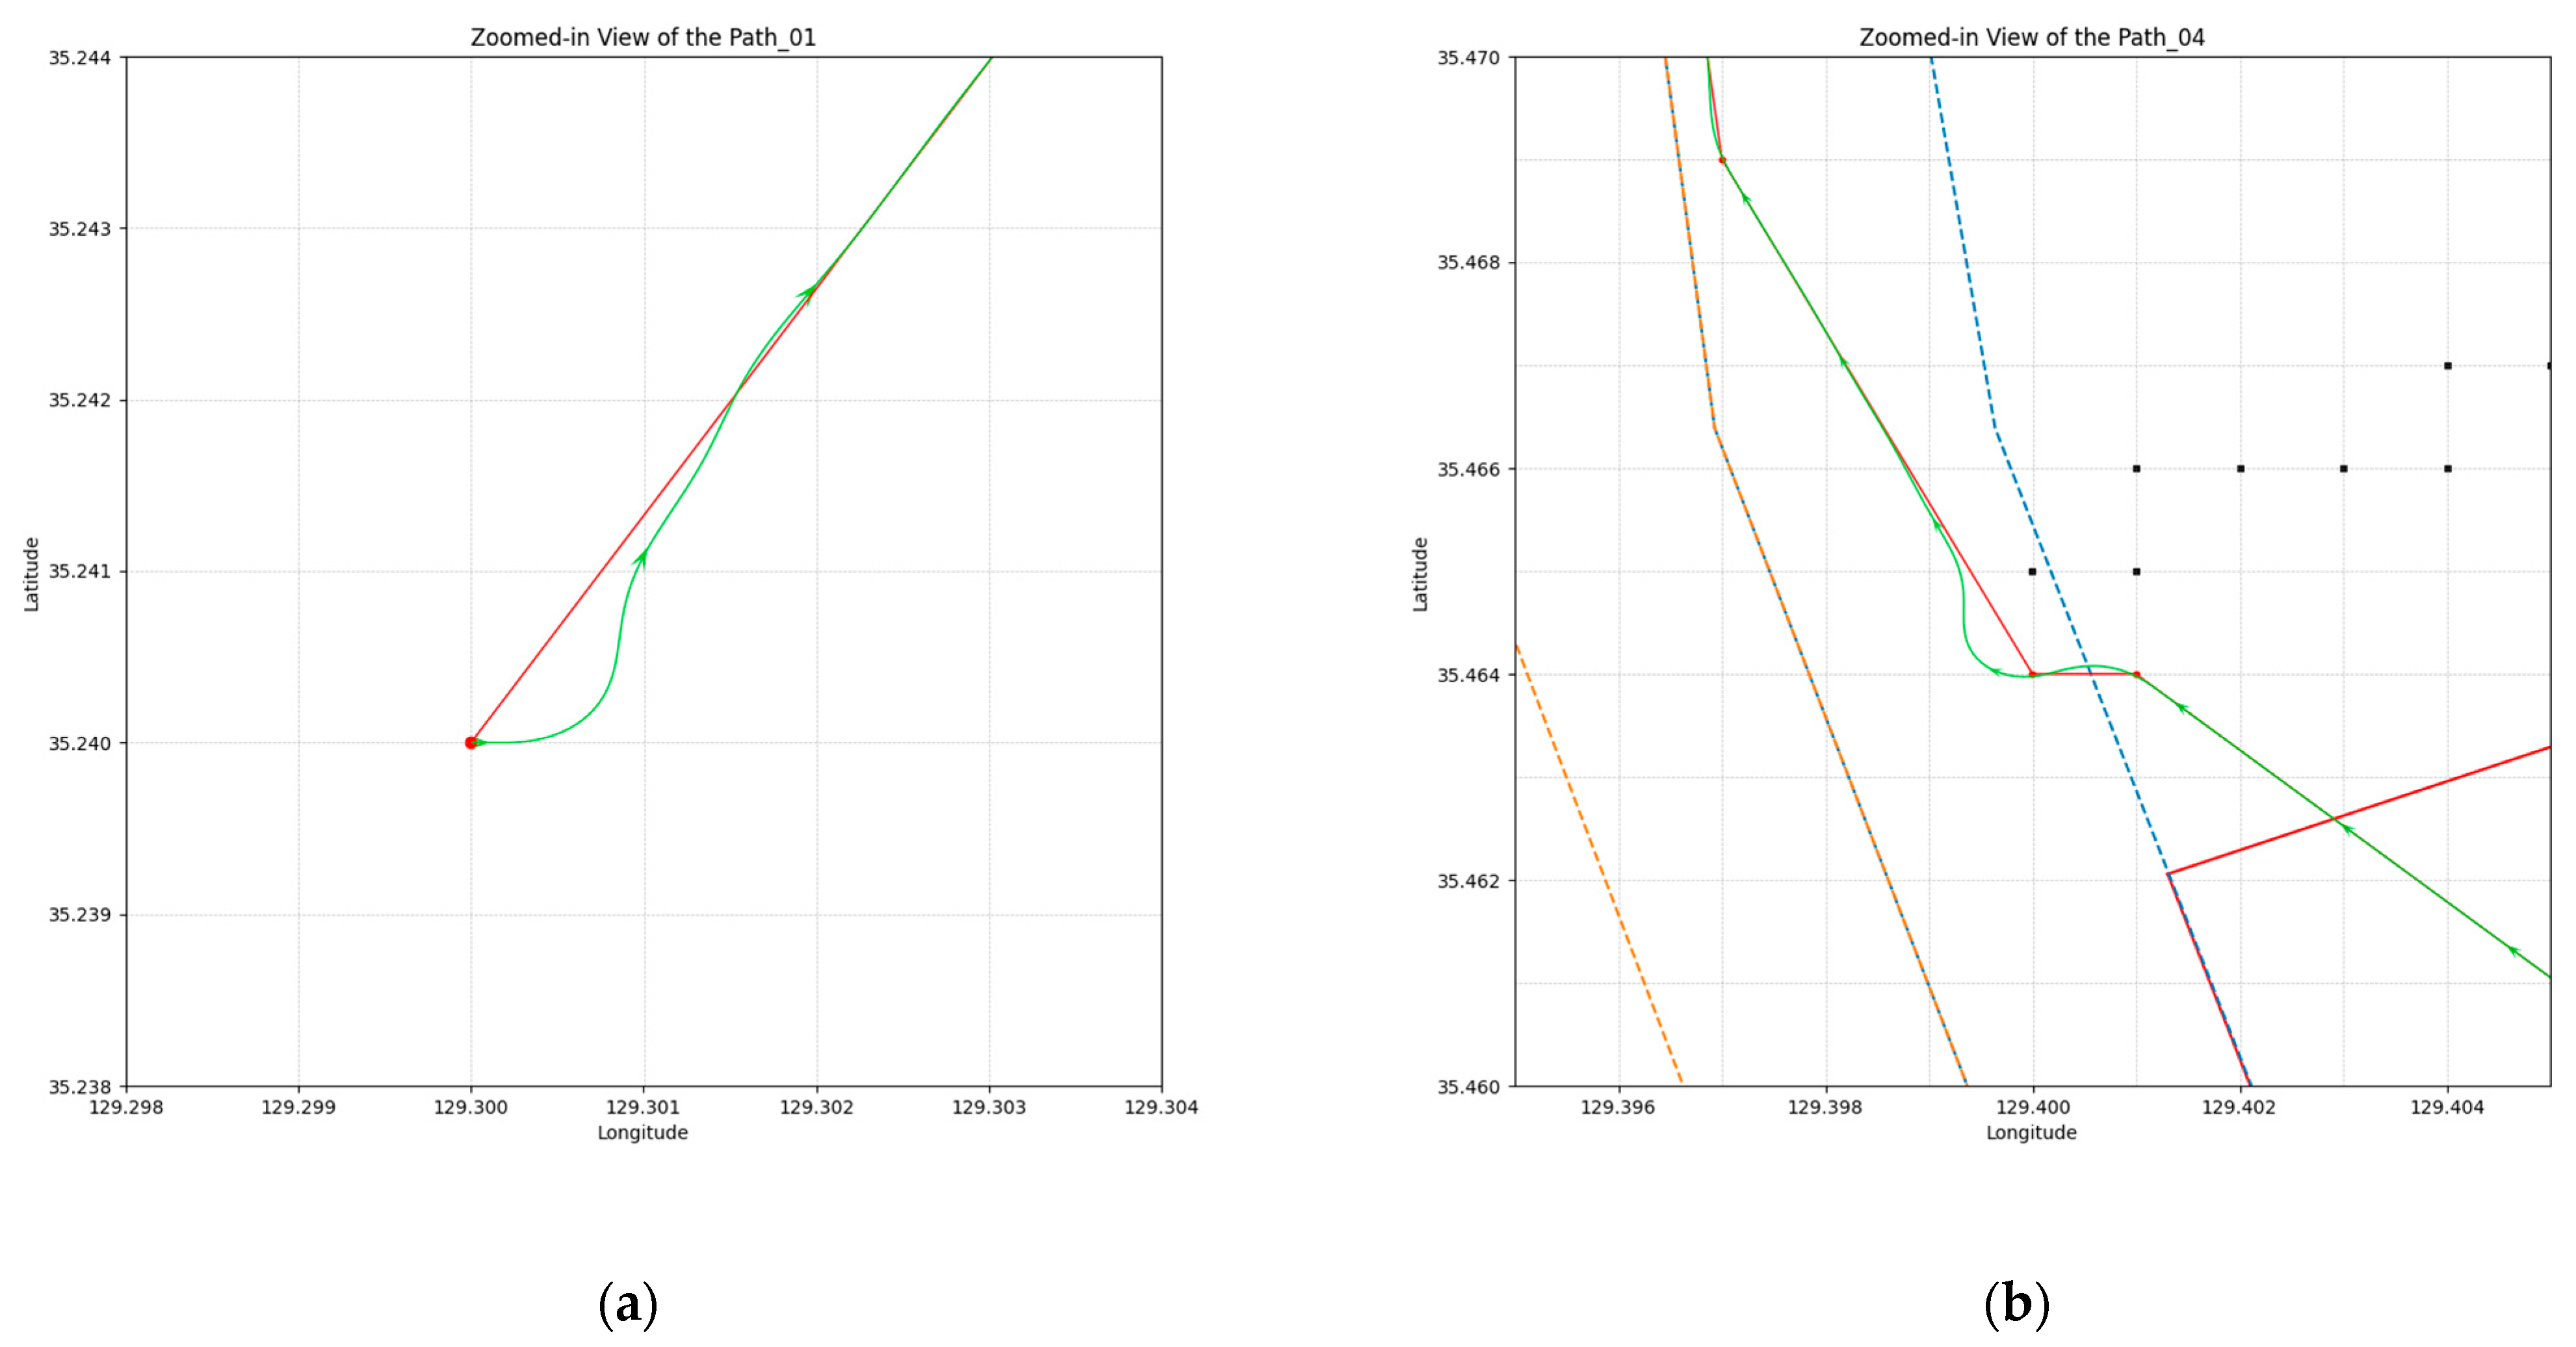
To address the discrepancies in the ship maneuvering model simulation (caused by distant waypoints), we increased the number of waypoints through interpolation. This adjustment was made by interpolating the number of waypoints, considering that with a ship speed of 6 knots, it would take 147 min to reach the destination, thereby ensuring the creation of one waypoint per minute throughout the simulation. As a result, the number of waypoints increased from 17 to 147 in the interpolated set. Then, we conducted a maneuvering simulation using these 147 waypoints for comparison. In Figure 14a,b, the simulation results following the interpolated waypoints prompt an immediate return to the proximity of the original waypoint routes due to their closeness to the next waypoint.
The DTW algorithm was applied to evaluate the similarity between the paths illustrated in each graph (Figure 13 and Figure 14). To facilitate a precise evaluation using the DTW algorithm, the number of points in the graph with fewer points was increased to match the one with more points. This step ensured that both graphs have an equal number of coordinates, allowing for a direct and accurate comparison to analyze the differences in their respective paths. Following this adjustment, the DTW algorithm was utilized to compute the distance between the two graphs.
Table 5 presents a comparison of two navigational paths. The first set of results compares the smoothing routes of 17 waypoints from the starting position to the destination, depicted in Figure 13, with the maneuvering simulations that track these waypoints. The second set, illustrated in Figure 14, compares routes using 147 interpolated smoothing route waypoints, the waypoints which the maneuvering simulations followed. The route lengths from the smoothing routes are consistent across both sets due to the interpolation based on the 17 original waypoints. The maneuvering simulations measure 34.735 km and 34.751 km for the first and second sets, respectively, with the marginal length difference of 0.016 km being negligible for overall navigation.
The DTW metrics, 0.474 degrees for the first set and 0.141 degrees for the second set, indicate that the simulation following the second set of waypoints aligns more closely with the smoothing path. This marked reduction in DTW distance implies that the denser set of interpolated waypoints results in a simulated route that more precisely reflects the actual navigational path than the sparser original waypoint set. This finding emphasizes the importance of a well-formulated waypoint framework for accurately guiding vessels along their intended paths and minimizing route deviations.

5. Conclusions

This study has developed a global path planning framework for autonomous ships, applying an improved A* algorithm with additional cost functions to reflect the specific characteristics in the Port of Ulsan. For this purpose, a grid-based map was modeled to identify navigational areas including traffic lanes, anchorage areas, the VTS report line, and specified circle anchorage areas, which are crucial for global path planning in the Port of Ulsan. With this grid-based map, a global path planning simulation wherein an autonomous ship navigated inbound to port via circular anchorage point waypoints was conducted. The suitability of this algorithm was assessed, confirming the necessity and effectiveness of incorporating these characteristics into the algorithm’s design.
The global routes derived from the improved A* algorithm were evaluated for their effectiveness within the Port of Ulsan area. It was found that due to the fact that the algorithm’s movement was limited to eight predetermined directions, some routes are not optimal. This was particularly evident in areas with a high frequency of turns, especially near the narrow sections of the traffic lane polygons. To improve this, a Bresenham smoothing algorithm was applied to each segment, leading to the derivation of optimized routes within the port. The suitability of these optimized routes was compared by conducting maneuvering simulations using the MMG model. This process effectively validated the methodology of this study, which was mainly based on the use of global route planning algorithms. Additionally, the DTW algorithm was employed to compare the similarity between the two routes. This allowed for a comparison of the ship maneuvering simulation results based on the waypoint intervals of the global routes obtained through the smoothing algorithm, thereby identifying effective methods to follow the generated global routes.
This study marks an early-stage contribution to the field of autonomous maritime navigation, particularly within port environments. By proposing a comprehensive approach, it enhances safety and efficiency in this domain. The results lay the groundwork for future developments in global path planning algorithms and their integration into maritime navigation systems. Although this study incorporated characteristics that have to be considered within ports into the algorithm, it is necessary to apply detailed considerations related to current port operations and VTS centers in conjunction with smart port research. This approach is expected to further advance the study of global route generation within port environments, ensuring it incorporates a broader spectrum of relevant factors and aligns closely with the evolving dynamics of maritime operations.

Author Contributions

Conceptualization, methodology, software, writing original draft preparation, visualization, S.-W.Y.; resource, data curation, D.-H.K.; writing—review and editing, S.-W.K.; validation, D.-J.K.; supervision, funding acquisition, H.-J.K. All authors have read and agreed to the published version of the manuscript.

Funding

This research was supported by a grant from a National R&D Project, “Development of Smart Port-Autonomous Ships Linkage Technology”, funded by the Ministry of Oceans and Fisheries, Republic of Korea (1525014528).

Institutional Review Board Statement

Not applicable.

Informed Consent Statement

Not applicable.

Data Availability Statement

Data available on request due to restrictions.

Conflicts of Interest

The authors declare no conflicts of interest.

Abbreviations

IMOThe International Maritime Organization
MASSMaritime Autonomous Surface Ships
SOLASInternational Convention for the Safety of Life at Sea
COLREGsConvention on the International Regulations for Preventing Collisions at Sea
VTSVessel Traffic Services
AISAutomatic Identification System
KASSKorea Autonomous Surface Ship
ENCElectronic Navigational Chart
DTWDynamic Time Warping
DWTDead Weight Tonnage
MMGManeuvering Mathematical Group

References

  1. Kim, S.; Yun, S.; You, Y. Eco-Friendly Speed Control Algorithm Development for Autonomous Vessel Route Planning. J. Mar. Sci. Eng. 2021, 9, 583. [Google Scholar] [CrossRef]
  2. Campbell, S.; Naeem, W.; Irwin, G.W. A Review on Improving the Autonomy of Unmanned Surface Vehicles through Intelligent Collision Avoidance Manoeuvres. Annu. Rev. Control 2012, 36, 267–283. [Google Scholar] [CrossRef]
  3. Perera, L.P.; Ferrari, V.; Santos, F.P.; Hinostroza, M.A.; Guedes Soares, C. Experimental Evaluations on Ship Autonomous Navigation and Collision Avoidance by Intelligent Guidance. IEEE J. Ocean. Eng. 2015, 40, 374–387. [Google Scholar] [CrossRef]
  4. Liu, Z.; Zhang, Y.; Yu, X.; Yuan, C. Unmanned Surface Vehicles: An Overview of Developments and Challenges. Annu. Rev. Control 2016, 41, 71–93. [Google Scholar] [CrossRef]
  5. Hu, L.; Naeem, W.; Rajabally, E.; Watson, G.; Mills, T.; Bhuiyan, Z.; Raeburn, C.; Salter, I.; Pekcan, C. A Multiobjective Optimization Approach for COLREGs-Compliant Path Planning of Autonomous Surface Vehicles Verified on Networked Bridge Simulators. IEEE Trans. Intell. Transp. Syst. 2020, 21, 1167–1179. [Google Scholar] [CrossRef]
  6. EMSA Agency. Annual Overview of Marine Casualties and Incidents; European Maritime Safety Agency: Lisbon, Portugal, 2022. [Google Scholar]
  7. Kim, M.; Joung, T.H.; Jeong, B.; Park, H.S. Autonomous Shipping and Its Impact on Regulations, Technologies, and Industries. J. Int. Marit. Safety Environ. Aff. Shipp. 2020, 4, 17–25. [Google Scholar] [CrossRef]
  8. Guo, W.; Zhang, X.; Wang, J.; Feng, H.; Tengecha, N.A. Traffic Organization Service for Maritime Autonomous Surface Ships (MASS) with Different Degrees of Autonomy. J. Mar. Sci. Eng. 2022, 10, 1889. [Google Scholar] [CrossRef]
  9. Othman, A.; El Gazzar, S.; Knez, M. Investigating the Influences of Smart Port Practices and Technology Employment on Port Sustainable Performance: The Egypt Case. Sustainability 2022, 14, 14014. [Google Scholar] [CrossRef]
  10. Yoon, J.H.; Kim, D.H.; Yun, S.W.; Kim, H.J.; Kim, S. Enhancing Container Vessel Arrival Time Prediction through Past Voyage Route Modeling: A Case Study of Busan New Port. J. Mar. Sci. Eng. 2023, 11, 1234. [Google Scholar] [CrossRef]
  11. Di Ciaccio, F.; Menegazzo, P.; Troisi, S. Optimization of the maritime signaling system in the lagoon of venice. Sensors 2019, 19, 1216. [Google Scholar] [CrossRef]
  12. Ma, Y.; Chang, D.; Wang, H.; Tang, M. Optimal Shipping Path Algorithm Design for Coastal Port. Procedia Comput. Sci. 2019, 162, 375–382. [Google Scholar] [CrossRef]
  13. Yun, G.H.; Kim, B.Y.; Park, J.S.; Lee, Y.S. Enlargement of Harbour Limit and Anchorages According to the Development of New Ulsan Port. J. Navig. Port Res. 2010, 34, 487–492. [Google Scholar] [CrossRef]
  14. Ulsan Port Authority Website. Available online: https://upa.or.kr/contents.do?mId=001004005001000000 (accessed on 29 November 2023).
  15. Korea Autonomous Surface Ship Project. Available online: https://kassproject.org/en/main.php (accessed on 29 November 2023).
  16. Ozturk, U.; Cicek, K. Individual Collision Risk Assessment in Ship Navigation: A Systematic Literature Review. Ocean Eng. 2019, 180, 130–143. [Google Scholar] [CrossRef]
  17. Öztürk, Ü.; Akdağ, M.; Ayabakan, T. A Review of Path Planning Algorithms in Maritime Autonomous Surface Ships: Navigation Safety Perspective. Ocean Eng. 2022, 251, 111010. [Google Scholar] [CrossRef]
  18. Dijkstra, E.W. A Note on Two Problems in Connexion with Graphs. In Edsger Wybe Dijkstra: His Life, Work, and Legacy; Association for Computing Machinery and Morgan & Claypool Publishers: New York, NY, USA, 2022; pp. 287–290. [Google Scholar]
  19. Liang, C.; Zhang, X.; Watanabe, Y.; Deng, Y. Autonomous Collision Avoidance of Unmanned Surface Vehicles Based on Improved A Star and Minimum Course Alteration Algorithms. Appl. Ocean Res. 2021, 113, 102755. [Google Scholar] [CrossRef]
  20. Hart, P.E.; Nilsson, N.J.; Raphael, B. A Formal Basis for the Heuristic Determination of Minimum Cost Paths. IEEE Trans. Syst. Sci. Cybern. 1968, 4, 100–107. [Google Scholar] [CrossRef]
  21. Tang, G.; Tang, C.; Claramunt, C.; Hu, X.; Zhou, P. Geometric A-Star Algorithm: An Improved A-Star Algorithm for AGV Path Planning in a Port Environment. IEEE Access 2021, 9, 59196–59210. [Google Scholar] [CrossRef]
  22. Casalino, G.; Turetta, A.; Simetti, E. A Three-Layered Architecture for Real Time Path Planning and Obstacle Avoidance for Surveillance USVs Operating in Harbour Fields. In Oceans 2009-Europe; IEEE: Piscataway, NJ, USA, 2009; pp. 1–8. [Google Scholar]
  23. Xie, L.; Xue, S.; Zhang, J.; Zhang, M.; Tian, W.; Haugen, S. A Path Planning Approach Based on Multi-Direction A* Algorithm for Ships Navigating Within Wind Farm Waters. Ocean Eng. 2019, 184, 311–322. [Google Scholar] [CrossRef]
  24. He, Q.; Hou, Z.; Zhu, X. A Novel Algorithm for Ship Route Planning Considering Motion Characteristics and ENC Vector Maps. J. Mar. Sci. Eng. 2023, 11, 1102. [Google Scholar] [CrossRef]
  25. Hu, S.; Tian, S.; Zhao, J.; Shen, R. Path Planning of an Unmanned Surface Vessel Based on the Improved A-Star and Dynamic Window Method. J. Mar. Sci. Eng. 2023, 11, 1060. [Google Scholar] [CrossRef]
  26. Zhang, L.; Mou, J.; Chen, P.; Li, M. Path Planning for Autonomous Ships: A Hybrid Approach Based on Improved APF and Modified VO Methods. J. Mar. Sci. Eng. 2021, 9, 761. [Google Scholar] [CrossRef]
  27. Xu, Y.; Guan, G.; Song, Q.; Jiang, C.; Wang, L. Heuristic and random search algorithm in optimization of route planning for Robot’s geomagnetic navigation. Comput. Commun. 2020, 154, 12–17. [Google Scholar] [CrossRef]
  28. Chen, Y.; Wu, W.; Jiang, P.; Wan, C. An Improved Bald Eagle Search Algorithm for Global Path Planning of Unmanned Vessel in Complicated Waterways. J. Mar. Sci. Eng. 2023, 11, 118. [Google Scholar] [CrossRef]
  29. Braun, J.; Brito, T.; Lima, J.; Costa, P.; Costa, P.; Nakano, A. A Comparison of A* and RRT* Algorithms with Dynamic and Real Time Constraint Scenarios for Mobile Robots. In SIMULTECH 2019; Scitepress: Setúbal, Portugal, 2019; pp. 398–405. [Google Scholar]
  30. Son, J.; Kim, D.H.; Yun, S.W.; Kim, H.J.; Kim, S. The Development of Regional Vessel Traffic Congestion Forecasts Using Hybrid Data from an Automatic Identification System and a Port Management Information System. J. Mar. Sci. Eng. 2022, 10, 1956. [Google Scholar] [CrossRef]
  31. Dantas, J.L.; Theotokatos, G. A Framework for the Economic-Environmental Feasibility Assessment of Short-Sea Shipping Autonomous Vessels. Ocean Eng. 2023, 279, 114420. [Google Scholar] [CrossRef]
  32. Lee, S.W.; Jo, J.; Kim, S. Leveraging the 4th Industrial Revolution Technology for Sustainable Development of the Northern Sea Route (NSR)—The Case Study of Autonomous Vessel. Sustainability 2021, 13, 8211. [Google Scholar] [CrossRef]
  33. Zheng, J.; Sun, W.; Li, Y.; Hu, J. A Receding Horizon Navigation and Control System for Autonomous Merchant Ships: Reducing Fuel Costs and Carbon Emissions Under the Premise of Safety. J. Mar. Sci. Eng. 2023, 11, 127. [Google Scholar] [CrossRef]
  34. Hu, X.; Hu, K.; Tao, D.; Zhong, Y.; Han, Y. GIS-Data-Driven Efficient and Safe Path Planning for Autonomous Ships in Maritime Transportation. Electronics 2023, 12, 2206. [Google Scholar] [CrossRef]
  35. Zhen, R.; Gu, Q.; Shi, Z.; Suo, Y. An Improved A-Star Ship Path-Planning Algorithm Considering Current, Water Depth, and Traffic Separation Rules. J. Mar. Sci. Eng. 2023, 11, 1439. [Google Scholar] [CrossRef]
  36. Yasukawa, H.; Yoshimura, Y. Introduction of MMG Standard Method for Ship Maneuvering Predictions. J. Mar. Sci. Technol. 2015, 20, 37–52. [Google Scholar] [CrossRef]
  37. Yasukawa, H.; Zaky, M.; Yonemasu, I.; Miyake, R. Effect of engine output on maneuverability of a VLCC in still water and adverse weather conditions. J. Mar. Sci. Technol. 2017, 22, 574–586. [Google Scholar] [CrossRef]
  38. Vessel Traffic Service Center Website. Available online: https://www.kcg.go.kr/kcg/si/sub/info.do?page=2836&num=13&mi=2836 (accessed on 29 November 2023).
  39. Luo, Y.; Qin, Q.; Hu, Z.; Zhang, Y. Path Planning for Unmanned Delivery Robots Based on EWB-GWO Algorithm. Sensors 2023, 23, 1867. [Google Scholar] [CrossRef] [PubMed]
  40. Bresenham, J.E. Algorithm for Computer Control of a Digital Plotter. In Seminal Graphics: Pioneering Efforts That Shaped the Field; Association for Computing Machinery and Morgan & Claypool Publishers: New York, NY, USA, 1998; pp. 1–6. [Google Scholar]
  41. Myers, C.S.; Rabiner, L.R. A comparative study of several dynamic time-warping algorithms for connected-word recognition. Bell Syst. Tech. J. 1981, 60, 1389–1409. [Google Scholar] [CrossRef]
  42. Choi, W.; Cho, J.; Lee, S.; Jung, Y. Fast constrained dynamic time warping for similarity measure of time series data. IEEE Access 2020, 8, 222841–222858. [Google Scholar] [CrossRef]
  43. Tsou, M.C. Discovering Knowledge from AIS Database for Application in VTS. J. Navig. 2010, 63, 449–469. [Google Scholar] [CrossRef]
  44. Park, J.M.; Kim, S. Improvement Plans for Anchorage at Masan Port. J. Korean Soc. Mar. Environ. Saf. 2018, 24, 637–645. [Google Scholar] [CrossRef]
  45. Cao, L.; Wang, X.; Zhang, W.; Gao, L.; Xie, S.; Liu, Z. Research on Intelligent Detection Algorithm of the Single Anchored Mooring Area for Maritime Autonomous Surface Ships. Appl. Sci. 2022, 12, 6009. [Google Scholar] [CrossRef]
  46. Lee, Y.S. A Study on the Anchoring Safety Assessment of E-Group Anchorage in Ulsan Port. J. Korean Soc. Mar. Environ. Saf. 2014, 20, 172–178. [Google Scholar] [CrossRef]
  47. Park, J.M. A Study on the Establishment of Design Criteria for Anchorage According to Port Characteristics. J. Korean Soc. Mar. Environ. Saf. 2017, 23, 279–286. [Google Scholar] [CrossRef]
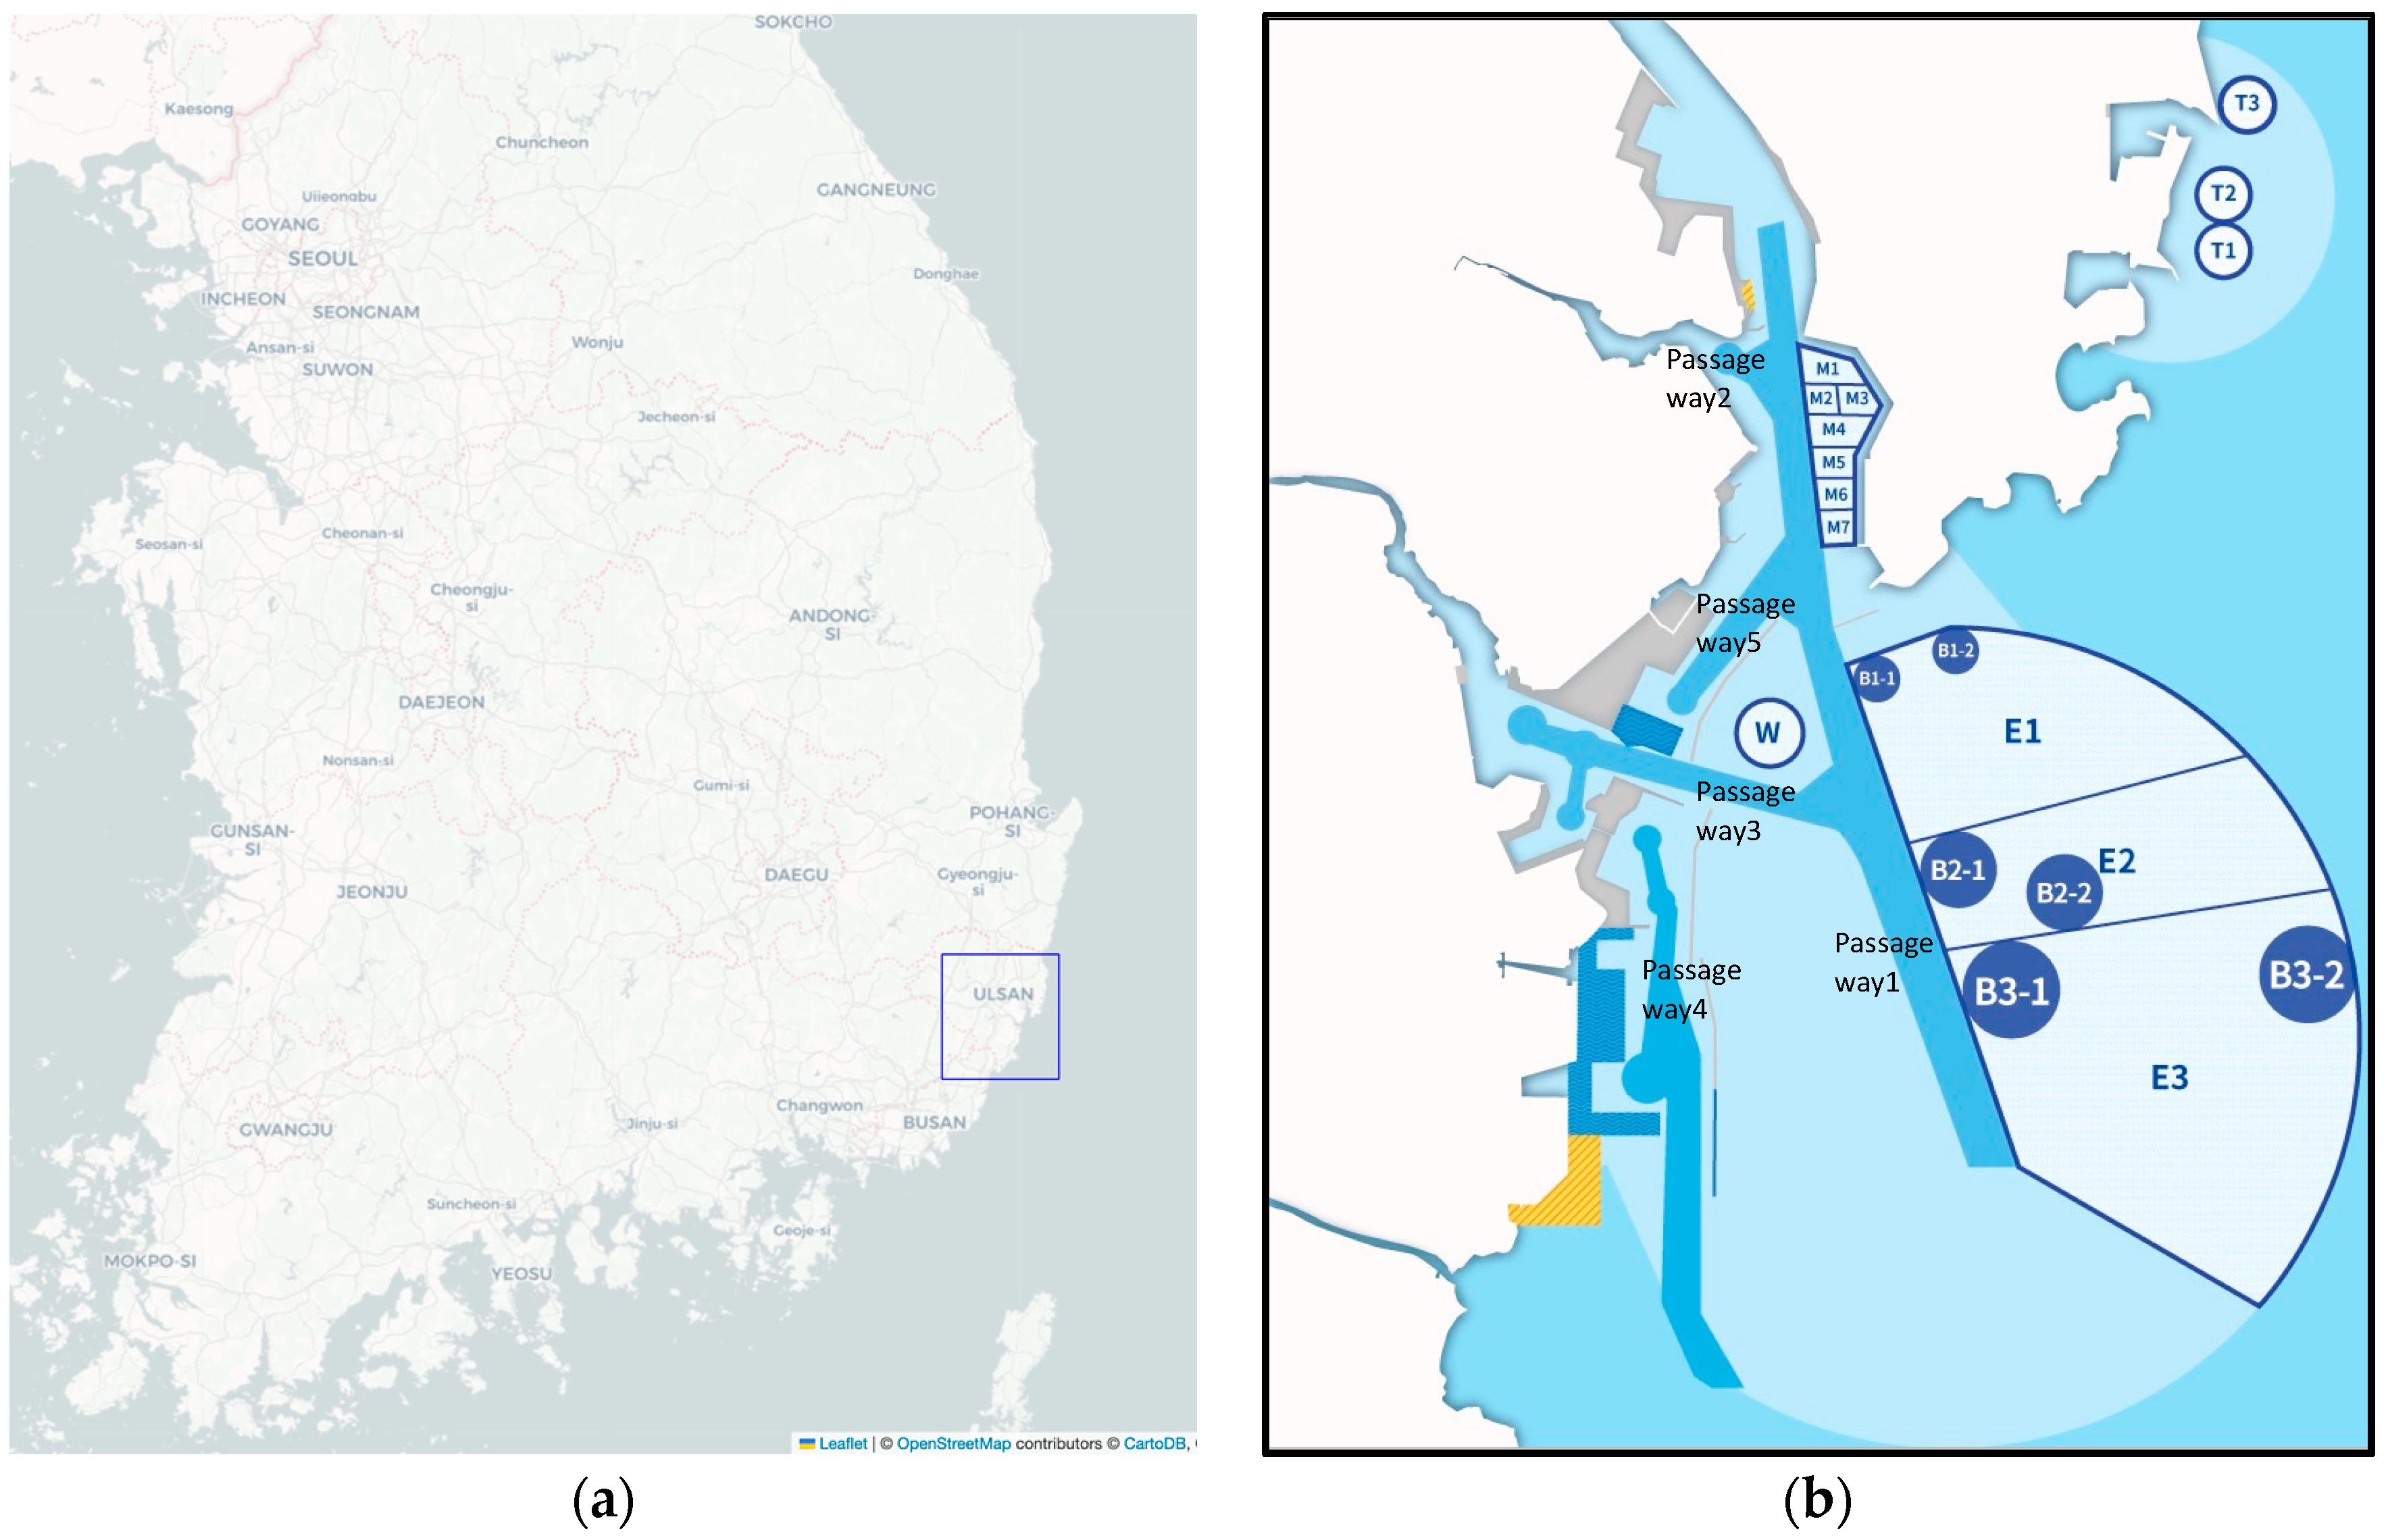
Figure 1. The Port of Ulsan in the Republic of Korea. (a) The location of Ulsan city; (b) traffic lanes and anchorage areas in the Port of Ulsan [14].
Jmse 12 00160 g001
Figure 2. A schematic diagram of the 8-direction neighborhood.
Jmse 12 00160 g002
Figure 3. Coordinate systems.
Jmse 12 00160 g003
Figure 4. Algorithm procedures for global route planning.
Jmse 12 00160 g004
Figure 5. A grid-based map of ‘Obstacle_land’ and ‘Obstacle_breakwater’.
Jmse 12 00160 g005
Figure 6. Grid-based water depth modeling. (a) Color-based visualization of water depth; (b) combined configuration of total obstacles.
Jmse 12 00160 g006
Figure 7. (a) AIS-based tanker routes in the Port of Ulsan [20]; (b) map derived from the modeling of the characteristic regions of the Port of Ulsan.
Jmse 12 00160 g007
Figure 8. The allocation of temporary circular anchorages from the grouped anchorage zones.
Jmse 12 00160 g008
Figure 9. Global route of the standard A* algorithm.
Jmse 12 00160 g009
Figure 10. Global routes incorporating the weight factors of anchorage areas: (a) layout of all the routes in the Port of Ulsan; (b) a detailed view of the routes in the anchorage areas.
Jmse 12 00160 g010
Figure 11. Global routes of the improved A* algorithm: (a) Route layout in the Port of Ulsan; (b) detailed view of routes the in anchorage areas.
Jmse 12 00160 g011
Figure 12. Smoothing algorithm routes: (a) Route layout in the Port of Ulsan, The blue line represents routes of improved A* algorithm and the red line represents routes after smoothing algorithms; (b) detailed view of routes near the starting region; (c) detailed view of routes near the anchorage area; (d) detailed view of routes near the destination region.
Jmse 12 00160 g012
Figure 13. Maneuvering simulation routes: (a) Route layout in the Port of Ulsan, The red line represents routes after smoothing algorithms and the green line represents routes from maneuvering simulation; (b) detailed view of routes in the starting point; (c) detailed view of routes in the entering passageway point; (d) detailed view of routes in the anchorage point; (e) detailed view of routes in the returning passageway point; (f) detailed view of routes in the destination point.
Jmse 12 00160 g013aJmse 12 00160 g013b
Figure 14. Simulation routes of the interpolated smoothing waypoints: (a) detailed view of routes near the starting region; (b) detailed view of routes near the returning passageway point.
Jmse 12 00160 g014
Table 1. Specifications of each anchorage area.
TypeAnchorage AreaAllowed Displacement
Group anchorageE1Up to 10,000 tons
E2Up to 30,000 tons
E3Over 20,000 tons
Circular anchorageW1Up to 20,000 tons
T1/T2Up to 5000 tons
T3Up to 2000 tons
Bunkering exclusiveB1-1/B1-2Up to 10,000 tons
B2-1/B2-2Up to 30,000 tons
B3-1Over 20,000 tons, Up to 50,000 tons
B3-2Over 50,000 tons
Small anchorageM1~M7Below 2000 tons
Table 2. Turning radii of target ships at group anchorages in the Port of Ulsan.
DWT (ton)Loa (m)Breath (m)Draft (m)Water Depth (m)Radius (m)
30009414.65.6E1, 40334
500010916.86.5E1, 40349
10,00012720.87.9E1, 40367
30,00019022.610.7E2, 50490
50,000215.43212.3E3, 60575.4
150,000277.44617E3, 60637.4
300,0003335822.5E3, 60693
Table 3. Specific coordinates of temporary circular anchorages for E1, E2, and E3.
E1_Circle_AnchorageE2_Circle_AnchorageE3_Circle_Anchorage
NumberLatitudeLongitudeLatitudeLongitudeLatitudeLongitude
135.4485 129.4571 35.4411 129.4607 35.4152 129.4658
235.4524 129.4506 35.4392 129.4500 35.4214 129.4542
335.4563 129.4440 35.4374 129.4393 35.4189 129.4405
435.4602 129.4375 35.4355 129.4286 35.4161 129.4267
535.4625 129.4299 35.4337 129.4180 35.4040 129.4618
635.4630 129.4219 35.4296 129.4664 35.4102 129.4497
735.4625 129.4138 35.4317 129.4558 35.4056 129.4321
835.4600 129.4064 35.4298 129.4450 35.3925 129.4553
935.4467 129.4465 35.4279 129.4343 35.3991 129.4438
1035.4453 129.4385 35.4260 129.4236
1135.4439 129.4304
1235.4425 129.4224
1335.4411 129.4144
1435.4520 129.4378
1535.4506 129.4297
1635.4492 129.4217
1735.4478 129.4136
1835.4567 129.4259
1935.4553 129.4179
2035.4539 129.4098
Table 4. Comparison between global routes after smoothing.
Route NamesLength (km)Turns
Improved A* algorithm route36.18843
Smoothing algorithm route34.66712
Table 5. Comparison of datasets.
SetComparing RoutesWaypoints: ManeuveringLength of Smoothing Routes (km)Length of Maneuvering Simulation Routes (km)DTW Results (deg)
1Smoothing routes with maneuvering (Figure 13)1734.66734.7350.474
2Interpolated smoothing routes with maneuvering (Figure 14)14734.66734.7510.141
Disclaimer/Publisher’s Note: The statements, opinions and data contained in all publications are solely those of the individual author(s) and contributor(s) and not of MDPI and/or the editor(s). MDPI and/or the editor(s) disclaim responsibility for any injury to people or property resulting from any ideas, methods, instructions or products referred to in the content.