Abstract
The vertical ice breaking of marine structures in ice-covered areas involves the deformation and failure of an ice sheet. Different from the existing conventional scenarios where the ice sheet is used as a transportation and support medium, the damage to the ice sheet will be more severe when a structure penetrates the ice sheet from below, due to the lack of elastic support from the fluid above the ice sheet. In order to investigate the failure mode of the ice sheet and the ice load characteristics during vertical penetration, a mesh-free bond-based peridynamic method is used in this paper to simulate the mechanical behaviors of the ice sheet. The cracks simulated in this study exhibit a higher level of similarity to experimental results, which improves the accuracy of the ice load. The numerical model established shows satisfactory applicability for the analysis of penetration failure of an ice sheet. In addition, the influence of ice thickness, impact velocity, and cylinder diameter on the failure characteristics of the ice sheet and breakthrough load are analyzed. The results of a parametric study indicate that the relationship between ice thickness and breakthrough load, as well as the relationship between load area and breakthrough pressure, can both be fitted using quadratic functions.
1. Introduction
The upward motion of a marine structure below the ice surface will cause the vertical penetration of an ice sheet, and the deformation and failure of the ice sheet in this scenario exhibit more complexity. As a matter of fact, the ice sheet in ice-covered areas could be used as a supporting medium for the storage of goods/materials and vehicle transportation. When a load is exerted on the upper surface of the ice sheet, the deformation of the ice sheet will generate bending stress. The fluid below the ice surface could be regarded as an elastic foundation, and the downward deflection of the ice sheet will also cause an increase in the water pressure at the lower surface of the ice sheet. Critical tensile stress usually occurs on the lower surface of the ice sheet within the load range [1]. When the ice sheet fails under a vertical load, the cracks will first start from the load area and propagate outward in the radial direction. Circumferential cracks will then initiate and significant damage/penetration of the ice will occur. The load at this moment is much higher than that when radial cracks first appear [2].
In Kerr’s [3] review article, early theoretical research on the penetration failure of ice sheets were mainly based on elastic theory, plasticity theory and viscoelastic theory, and subsequent theoretical research mainly focuses on these three. Korunov used the analogy method to establish a linear relationship between the allowable load of the ice sheet and the square of the ice thickness [3]. However, Kerr and Palmer [4] pointed out that the bending stress of the floating ice plate is usually not linearly distributed along the thickness, so the rationality of the initial assumption in this derivation is doubtful. However, due to its simple form and good agreement with some test data, this linear relationship has also been widely used. Gold [5,6] proposed that the range for this linear coefficient is between 35 t/mm2 and 70 t/mm2. Moreover, Zubov [3] introduced the influence of temperature, salinity and other factors to further correct the coefficient. In addition, some analyzes based on elastic thin plate theory were mostly carried out with the consideration of strength criteria, which are categorized into two types by Kerr. One is to calculate the extreme load when the first crack initiates in the ice sheet and establish the relationship between the breakthrough load and extreme load. The other is to directly determine the extreme load by analyzing the wedge fracture of the ice plate [3]. Bažant et al. [7] calculated the energy release rate caused by radial crack propagation based on linear elastic fracture mechanics and thin plate theory and established the relationship between the radial crack length and load. Persson and Assur [8] solved the breakthrough load of the ice sheet using yield line theory [3], while Meyerhof [9] and Coon and Mohaghegh [10] used the ultimate load theory. Based on a plastic limit analysis, Sodhi [11] calculated the breakthrough load by equating the rate of work carried out by the load and the energy dissipation rate caused by the compression of radial and circumferential wedges during the deformation of ice sheets. The results of the theoretical calculation showed good agreement with the test data, when the energy dissipation caused by radial deformation along the circumferential crack is ignored. As a matter of fact, there is no universally acknowledged conclusion for the selection of the yield criterion, and different yield criteria will cause remarkable differences in the results. In studies based on viscoelastic theory, the creep of the ice material under a long-term load was emphasized, and the relationship between the breakthrough load and the fracture time was considered [3,12,13,14].
Theoretical research often requires simplifications and assumptions, which are more suitable for more ideal situations. However, due to the extremely complicated mechanical properties of ice materials, experimental methods have been widely applied in the study of vertical penetration of ice sheets. Frankenstein [15] and Lichtenberger et al. [15,16,17] determined the breakthrough load based on full-scale experimental studies and pointed out that the penetration of the ice sheet is related to the fracture of the circumferential crack closest to the load area. In addition, Lichtenberger [16] also carried out creep tests under vertical loading conditions. Many related experimental studies also provide the basis for the parameters required for load prediction and failure criteria in theoretical research. By investigating the failure of floating ice plates with fixed boundaries under a vertical load, Sodhi [2] obtained the relationship between the load and deflection at the moment when different types of cracks appear. Furthermore, the influence of boundary conditions on the breakthrough load was analyzed, and it was found that the breakthrough load of a fixed ice plate was approximately twice that of an ice plate with free boundaries, which is considered to be related to the movement patterns of wedges during deformation.
The failure criteria of ice when penetration occurs mainly focus on stress, strain and strain energy density. The strength criterion is often used in some analyzes based on elastic theory, and the bending failure of ice sheets occurs when the maximum stress inside the ice plate reaches the ultimate stress [3]. Frederking and Gold [18] and Sodhi [11] proposed a failure criterion based on deflection and stated that the maximum deflection when failure occurs is a function of the ice thickness. In the numerical algorithm developed by Bažant et al. [19] for a model of a small object penetrating an ice sheet, the initiation of cracks on the ice sheet is determined based on the yield criterion with a fracture-based flow rule. Failure criteria based on stress, strain and other parameters are mainly suitable for short-term loading conditions [20]. Based on the test results of 40 prototype loadings, Beltos [21,22] proposed a failure criterion based on strain energy density with a consideration of the viscoelastic behavior of ice, which could be used to predict the initial damage of floating ice sheets under sustained loads.
In general, the above-mentioned studies based on theoretical and experimental methods are mostly suitable for scenarios where the ice sheet floats on water and the load is vertically downward. When a marine structure penetrates the ice sheet upward, no additional fluid pressure is exerted on the lower surface of the ice plate, and the extreme load-bearing capacity of the ice sheet will be weakened. Wang et al. [23] performed a vertical penetration test of an ice sheet with no influence of water below the ice plate. It was found that the breakthrough load of the ice sheet also conforms to a quadratic relationship with the ice thickness, and the cracks propagate from the center to the boundary, which is consistent with the conclusion in the aforementioned studies. Wang et al. [24] also simulated the penetration of ice sheets caused by the vertical motion of a cylinder using LS-DYNA software, and the numerical results showed that the damage range under a concentrated load is smaller than that under a uniform load, and the tensile limit was reached faster to cause fracture. In addition, the effects of vertical speed and contact angle on the failure mode and breakthrough load of the ice sheet were also discussed. Wang et al. [25] conducted a numerical study with the influence of a fluid below the ice sheet, using a fluid–structure coupling method based on structured arbitrary Lagrangian Euler (S-ALE) in LS-DYNA. The comparison of the results with or without water foundation showed that the water cushion effect has a significant impact on the failure mode of the ice sheet, while its effect on the breakthrough load is weak. It should be noted that establishing an adequate numerical model is useful and effective for solving such problems. Besides the widely used finite element methods mentioned above, some meshless methods (such as the discrete element method) gradually show a higher level of capability for simulating crack propagation in ice sheets [26,27,28], which further ensures the computational accuracy of the ice load. Meanwhile, since the mechanical properties of ice are complicated, the numerical modelling of vertical penetration of ice sheets still faces major challenges.
Peridynamic (PD) theory was first proposed by Professor Silling in 2000, and the corresponding numerical algorithm was proposed in 2005 [29,30]. Different from classical continuum mechanics, it is based on non-local interactions and uses integral equations for solution. It avoids the continuity assumption and the difficulty of solving partial differential equations in traditional numerical methods [31]. It has obvious advantages in solving discontinuous problems such as crack propagation in materials and has achieved great results in the analysis of damage problems such as concrete and composite materials [31]. Considering the brittleness of ice, the peridynamic method has gradually become an important simulation tool for the description of the fracture of ice materials, and agreeable numerical results could be obtained in the simulation of the interaction between ice and marine structures [32,33,34,35,36]. Based on state-based peridynamics, Liu et al. [37] investigated the failure of an ice sheet caused by a horizontally moving cylinder and analyzed the repetitive nature of the ice force and the relationship between the damage zone length and ice thickness. Though this study primarily emphasized the crushing failure of ice sheets, it showed a possible applicability of peridynamics for solving the propagation of radial or circumferential cracks in ice sheets under a vertical load, which is conducive to a deeper understanding of penetration failure mechanisms.
In this paper, the vertical penetration of ice sheets caused by an ascending rigid cylinder is simulated using a bond-based peridynamic method. Ice is simplified as an elastic-brittle material, conforming to a linear elastic constitutive relation. The crack initiation and propagation are simulated, and the vertical load exerted on the cylinder is recorded. In addition, for the purpose of deeply exploring the penetration failure mechanism of ice sheets, the variations of failure mode and breakthrough load with ice thickness, vertical velocity and loading area are discussed in detail.
2. Peridynamic Framework
In the peridynamic framework, the material is discretized into a series of points with a certain mass and volume. As shown in Figure 1, it is assumed that the interactions only exist between a material point and those within a certain distance from it, and a pair of material points with interaction are connected by virtual bonds.
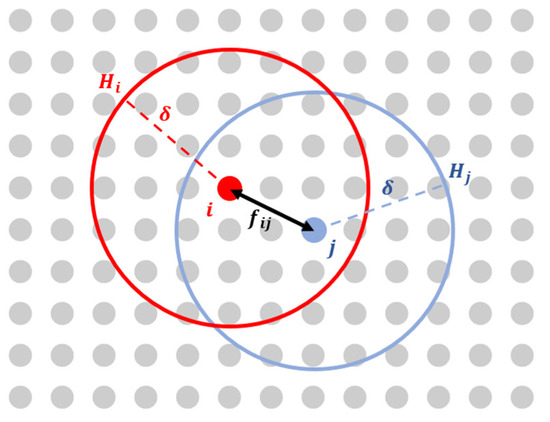
Figure 1.
The description of interaction in peridynamic framework.
The equation of motion for material point is
where is a material point whose initial position is located in the peridynamic horizon of (). The motion of material point is governed by the resultant force of the interactions () with other material points within peridynamic horizon and external forces (). The interaction force is described by the displacement () and initial coordinates of the material points. And and are the mass density and volume of , respectively. For more details, please refer to [29].
The interaction force for a PMB material can be expressed as follows [38]:
where and represent the relative position and relative displacement, respectively, between material points and . is a constant that describes the elasticity of the material, which can be obtained based on the bulk modulus as [30]
where is the radius of the peridynamic horizon. In order to further represent the varying degrees of interaction imposed by the material points at different positions, the bond constant can be revised as [39]
where is the elastic modulus. And the bond stretch rate s is defined as [30]
It is noteworthy that the sign of indicates the stretch state of the bond (tension or compression). And the bond is assumed to be broken if exceeds a critical value , and a scalar quantity is constructed to describe the damage state of the bond as [40]
According to [40], the critical stretch rate should be obtained based on the energy release rate of the fracture surface () as
Moreover, it can also be roughly approximated as [41]
where is the tension strength. Furthermore, another coefficient is defined to describe the local damage as [40]
3. Numerical Implementation
3.1. Constitutive Model of Ice
Under different freezing temperatures, durations and water conditions, the physical properties of ice (salinity, density, porosity, grain structure, etc.) are different [42], which further leads to differences in its mechanical properties (elastic modulus, flexural strength, compression strength, etc.). When the loading rate is high, the ice material exhibits brittle failure [43]. Considering the thickness of the ice specimen and the ascending speed of the rigid cylinder in this paper, ice is regarded as an elastic-brittle material in the numerical model and satisfies the linear elastic constitutive relationship.
In addition, the ice material shows an obvious strength difference in tension and compression. Relevant test data show that the compressive strength of ice is generally 3 to 5 times the tensile strength [44]. Therefore, a relationship of sc = −4·st is induced in the numerical model, where st and sc represent the critical tensile stretch and compressive strength, respectively. The peridynamic material constitutive relationship of ice is shown in Figure 2.
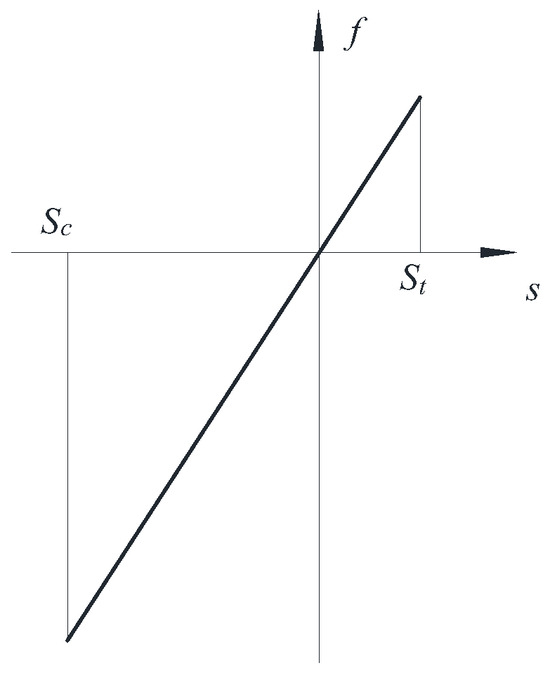
Figure 2.
Constitutive relationship of ice in peridynamics.
3.2. Contact Algorithm
The interaction between a rigid impactor and a deformable target object controlled by peridynamics is solved according to [40]. As shown in Figure 3a, the impactor initially moves towards the target object at velocity v. At the end of the next time step , a material point enters the interior of the rigid impactor. To prevent interpenetration between the rigid impactor and the target object, the material point is moved to a position on the outer surface of the impactor closest to its initial position, as shown in Figure 3c. The new position of the material point is usually determined based on the geometric characteristics of the rigid impactor.
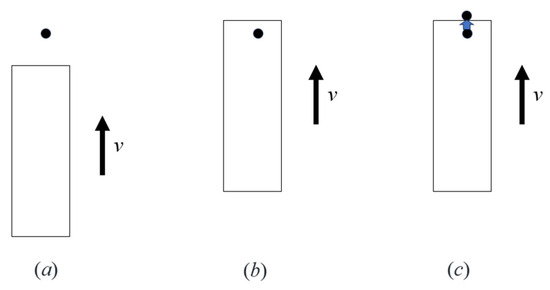
Figure 3.
The position adjustment of a material point penetrated into the target object: (a) Time t. (b) Time (origin). (c) Time (adjusted).
Therefore, the velocity of the material point is [40]
where is the adjusted displacement in the current time step, and is the displacement in the last time step. The contact force caused by the penetration of a material point into the rigid impactor can be obtained as [40]
where is the velocity before the position adjustment. By summing up the contact forces exerted by all material points located inside the rigid impactor, the resultant force on the rigid impact body can be expressed as [40]
3.3. Numerical Algorithm
The peridynamic equation of motion for the numerical implementation is
where is a material point located within the peridynamic horizon of in the initial state, and m is the total number of material points within the horizon.
The acceleration, velocity and displacement of the material point are calculated as follows:
And the stability criterion on the time step size can be expressed as [40]
where
3.4. Numerical Validation
The peridynamic model of ice is numerically validated based on the three-point bending test. As shown in Table 1, the main parameters are taken according to [45]. The material point size Δx is 0.007 m, and there are 9300 material points in total. The peridynamic horizon is 3·Δx and the time step Δt is 2.5 × 10⁻⁶ s. Three layers of material points are placed near the two simple supports at the bottom of the ice sample and are set as rigid fixed. A vertical downward velocity of 0.763 mm/s is applied at the center of the upper surface of the ice specimen.

Table 1.
Computation parameters.
The crack initiation and propagation in the ice specimen are shown in Figure 4.
Figure 4.
Numerical results of three-point bending test: (a) t = 0.4550 s; (b) t = 0.5175 s.
As shown in Figure 5a, the simulated midpoint deflection before the ice specimen breaks agrees well with the test result. Considering the initial defects in the test specimen and the influence of the test measurement accuracy, the fracture calculated based on the idealized numerical model occurs later. Furthermore, as illustrated in Figure 5b, the experimentally measured bending stress agrees well with the numerical result. Since there exist accuracy errors in the experimental measurement, and the unloading in numerical simulation is mainly related to the fracture of the particles at the center of the bottom, the unloading moment is slightly advanced.
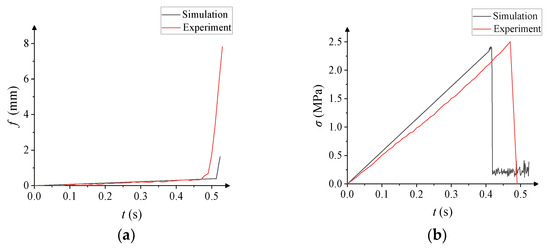
Figure 5.
Comparison of numerical and test results: (a) deflection of midpoint; (b) stress at the midpoint.
As shown in Table 2, the comparison shows that the fracture time, midpoint deflection and bending strength of the ice beam sample obtained with peridynamic simulation are in good agreement with the test results.
Table 2.
Comparison of numerical results and test results.
4. Numerical Result
The main parameters in the numerical simulation are consistent with the experimental conditions in [23], as shown in Table 3. The edges of the ice in the thickness direction are divided into six material points, with an interparticle distance of 0.005 m. Since the material points have the same scale in all directions, the number of discrete material points in the length and width direction is 100. The peridynamic horizon δ is 3·Δx, and the time step Δt is 2.0 × 10⁻⁶ s. In addition, the surroundings of the ice sheet are rigid fixed. The rigid cylinder is moving towards the ice sheet at a constant speed, as shown in Figure 6.
Table 3.
Computation parameters.
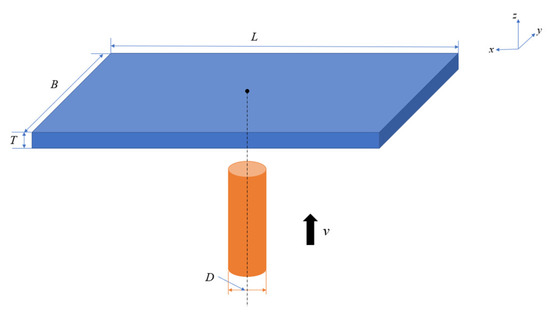
Figure 6.
Schematic diagram of the motion of the cylinder.
As shown in Figure 7, the crack propagation in the ice sheet obtained with numerical simulation is similar to that in the experimental observations. The cracks are primarily distributed radially, initiating from the center of the ice sheet and gradually propagating towards the edges. Eventually, a series of wedge-shaped bodies are formed with the fracture of radial cracks. The test results show that both the number of cracks formed in the ice sheet and the number of wedge-shaped bodies are seven, while these amounts are both eight in the simulation results. The main reason for this difference lies in the effects introduced by the experimental operations, such as minor shape errors in the ice sheet and the presence of air bubbles inside caused by the freezing conditions. In contrast, the ice sheet model in the numerical simulation is relatively ideal, and the calculated damage distribution exhibits agreeable symmetry. The generation of circumferential cracks is observed, which only appears around the loading area and at the corners of the ice sheets, due to factors such as the size limitation and boundary conditions of the ice sheet.
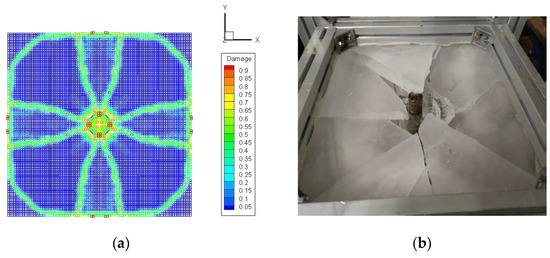
Figure 7.
The distribution of cracks after the penetration of ice sheet: (a) numerical result; (b) test result.
The history of the ice load on the rigid cylinder obtained from the numerical simulation is shown in Figure 8. During the interaction between the cylindrical structure and the ice sheet, the ice load gradually increases. The ice sheet is fully penetrated at 0.924 s and the ice load is rapidly unloaded. The numerical simulation shows a good agreement with the experimental results in the variation trend of the ice load. Since the time step in the numerical calculation is smaller, it can capture more details in the loading phase than the experimental method. It seems that the ice load history can be roughly divided into three stages according to the slope of the ice load over time. During the first stage, low-level contact between the two occurs, and few obvious cracks are formed in the ice sheet. Therefore, the ice sheet can be approximately considered to be elastic deformed, and the ice load shows a linearly increasing trend. In the second stage, accompanied by the generation of radial cracks, the ice load shows “jagged” fluctuations compared with the previous stage. The existence of radial cracks weakens the load-bearing capacity of the ice sheet, and the load slope in the second stage decreases compared with that in the first stage. In the third stage, accompanied by the generation of circumferential cracks around the loading area and at the corners of the ice sheet, the ice sheet is further damaged and the load slope further decreases.
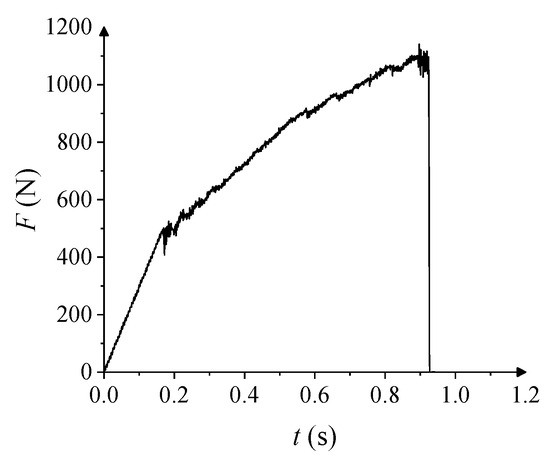
Figure 8.
The history of ice load on the rigid cylinder.
As shown in Table 4, the simulated fracture time and breakthrough load agree well with the experimental data in [23].
Table 4.
Comparison of numerical results and test results.
In order to mitigate the influence of the material point spacing on the calculation results, the ice loads are further computed for material point spacings of 0.0025 m and 0.01 m under identical conditions. As shown in Figure 9, the ice load curves almost overlap for material point spacings of 0.0025 m and 0.005 m, while a noticeable difference exists when the material point spacing is 0.01 m. It can be proved that a material point spacing of 0.005 m is sufficient to achieve a high level of computational accuracy.
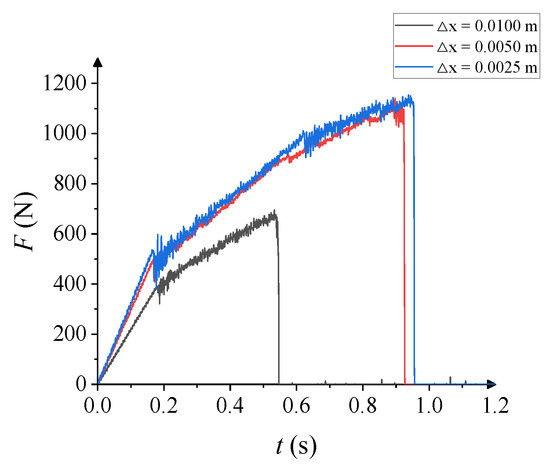
Figure 9.
Ice load for different material point spacings.
5. Parametric Analysis
In this section, the influence of ice thickness, impact velocity and cylinder diameter on the failure characteristics and breakthrough load of an ice sheet is investigated in detail. The computation parameters are shown in Table 5.
Table 5.
Computation parameters.
5.1. Ice Thickness
The crack initiation and propagation in the ice sheet under different thicknesses are shown in Figure 10. It can be seen that there are eight radial cracks in the ice sheet, and their distribution shows obvious diagonal symmetry. For a thinner (T = 0.015 m) ice sheet, the distribution of radial cracks in the two diagonal directions is different. Studies have shown that two approximately vertical cracks will appear in the initial stage when a vertical load is exerted on an ice sheet. Combined with the results calculated in this article, it can be concluded that the failure of square ice plates with a low thickness under a vertical load is not diagonally isotropic. When the ice thickness is 0.020 m or 0.025 m, the distribution of radial cracks is generally “X”-shaped, and all four branches are composed of two radial cracks a small distance apart. As the ice thickness increases, the stiffness of the ice sheet gradually increases. The curvature of the radial cracks in the 0.025 m thick ice sheet is smaller than that in the 0.020 m thick one. If the ice thickness reaches 0.030 m, the radial cracks transform into a cross-shaped distribution. When the ice thickness further increases, instead of bending, crashing becomes the key factor during the failure of the ice sheet. None of the radial cracks propagate to the edge of the ice sheet, and the spacing between each crack is roughly the same.
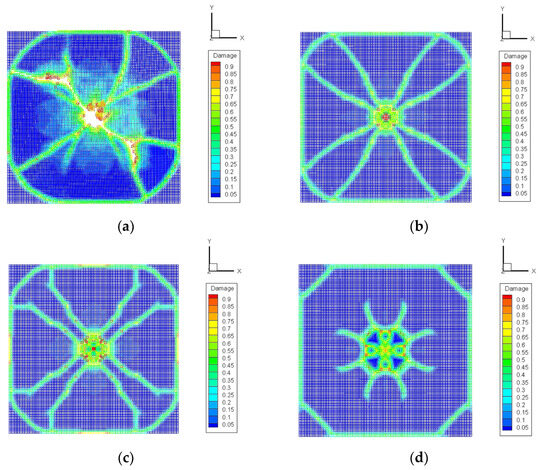
Figure 10.
The distribution of cracks after penetration for different ice thicknesses: (a) T = 15 mm; (b) T = 20 mm; (c) T = 25 mm; (d) T = 35 mm.
Two circumferential cracks are formed in the upper surface of the ice sheet for the scenarios with different thicknesses in this paper. According to the curvature of the outer circumstantial cracks at the four corners, it can be concluded that the radius of the outer circumstantial cracks will increase with the ice thickness. However, this increase is not very pronounced due to the influence of the rigid boundary. When the ice thickness is in the range of 0.015–0.030 m, the diameter of the inner circumferential crack is roughly equivalent to that of a rigid cylinder. Considering the obvious change in the cause of damage to the 0.035 m thick ice sheet, its central penetration area increases significantly. It is worth noting that the curvature of the outer circumferential crack is significantly reduced at this time, and the part of the ice sheet around these cracks is obviously damaged but does not break.
The breakthrough load for different ice thicknesses is shown in Figure 11. It can be seen from the numerical results that the breakthrough load increases with the ice thickness, which is related to the higher stiffness of the thicker ice sheet. The numerical results are in good agreement with the test data measured in [23], and a large deviation occurs only in the case where the ice thickness is 0.025 m. A quadratic relationship between the breakthrough load and ice thickness is determined based on both the numerical results in this paper and the experimental data in [23]. Since the test measurements may be interfered with by the test operations or other uncontrollable factors, the experimental results exhibit more discreteness than the numerical results. Therefore, the numerical model established in this paper can more accurately evaluate the breakthrough load of an ice sheet and avoid strong discrete results, which is conducive to in-depth analysis of the penetration damage mechanism of the ice sheet. Gold [6] proposed that the breakthrough load of the ice sheet is 350 to 7000 times the square of the ice thickness, where the units of penetration load and ice thickness are kN and m, respectively. However, in their study, there was a fluid foundation below the ice sheet, and the deformation of the ice sheet was smaller than that without a fluid foundation, so the load-bearing capacity was relatively large. According to the results calculated in this article, the multiple range of the penetration load of the ice sheet and the square of the ice sheet thickness is between 1012.22 and 1267.56, which is still in the range presented by Gold [6].
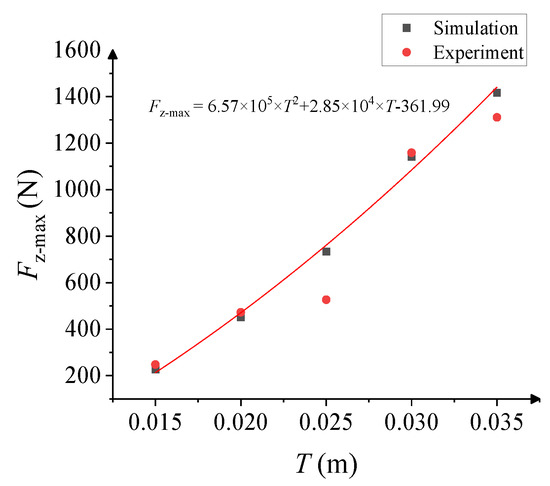
Figure 11.
The variation of breakthrough load with ice thickness.
5.2. Impact Velocity
The crack initiation and propagation in the ice sheet under different impact velocities are shown in Figure 12. If the ice sheet is loaded at low speed (0.002 m/s), only four radial cracks are formed, with a cross-shaped distribution. When the impact velocity is in the range of 0.004–0.008 m/s, although the overall distribution of radial cracks is still cross-shaped, each branch is composed of two cracks, which results in an increase in the total number of radial cracks to eight. Interestingly, when the impact velocity is 0.006 m/s, the distance between the two radial cracks on each branch of the “cross” is the largest. However, the interval of eight radial cracks is very uniform when the impact velocity is 0.010 m/s.
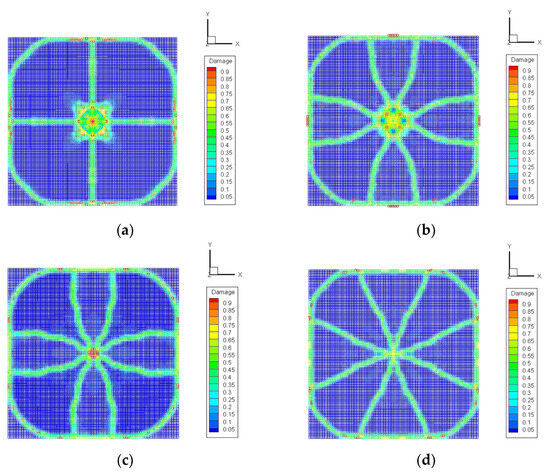
Figure 12.
The distribution of cracks after penetration at different impact velocities: (a) v = 2 mm/s; (b) v = 6 mm/s; (c) v = 8 mm/s; (d) v = 10 mm/s.
Moreover, it is found that the influence of velocity on the circumferential crack radius at the edge of the ice plate is very limited. In low-speed scenarios, the inner circumferential crack is approximately square, and its length is similar to the diameter of the rigid cylinder. When the impact velocity is 0.004 m/s or 0.006 m/s, the inner circumferential crack is consistent with the circumference of the top surface of the rigid cylinder. As the impact speed increases, the material points on the lower surface/contact area are more susceptible to crushing failure, so the circumferential crack area formed on the upper surface is significantly reduced or even disappears.
The breakthrough load under different impact velocities is shown in Figure 13. The numerical results show that when the impact velocity increases from 0.002 m/s to 0.010 m/s, the breakthrough load first increases and then decreases and reaches a minimum value when the impact velocity is 0.006 m/s. It should be noted that the contact between the rigid cylinder and ice sheet is more of a quasi-static loading when the impact velocity is low. At the same moment of loading, the deformation of the ice sheet is small and the load exerted on the ice sheet is relatively small, which directly leads to the slow propagation of cracks in the ice sheet and the later appearance of the fracture. Therefore, long-term full contact increases the load when the ice sheet is actually penetrated. When the speed reaches a certain level, the higher speed will cause the ice sheet to deform significantly and the upper surface and lower surface of the ice sheet will reach the tensile strength and compressive strength, respectively, in a short time, which causes the earlier brittle fracture of the ice sheet. Due to the limited range of impact velocities in the calculation conditions, the difference between the maximum and minimum values of the breakthrough load is only 65.5 N. However, the results still indicate that there might be a relatively safe speed within a certain range, and the load on the structure is lower when vertical penetration occurs.
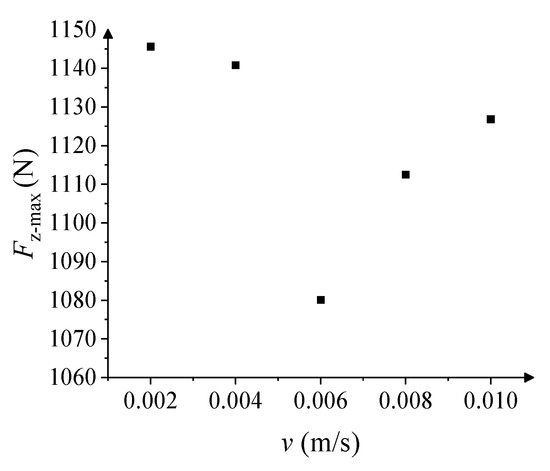
Figure 13.
The variation of breakthrough load with impact velocity.
5.3. Cylinder Diameter
The crack initiation and propagation in the ice sheet under different cylinder diameters are shown in Figure 14. It reveals that the cylinder diameter has a significant influence on the distribution of cracks in the ice sheet. If the cylinder diameter is 0.0225 m, there are a total of eight radial cracks in the ice sheet, and the spacing between each crack is approximately the same. Due to the small load-bearing area, the ice sheet undergoes compression failure more rapidly. And as a result, the radial cracks do not propagate to the edge of the ice sheet. When the cylinder diameter is 0.03 m, the radial cracks exhibit a cross-shaped distribution. As the cylinder diameter continues to increase to 0.0375 m, the radial cracks exhibit an “X”-shaped distribution. When the cylinder diameter increases to 0.045 and above, the number of radial cracks decreases to four.
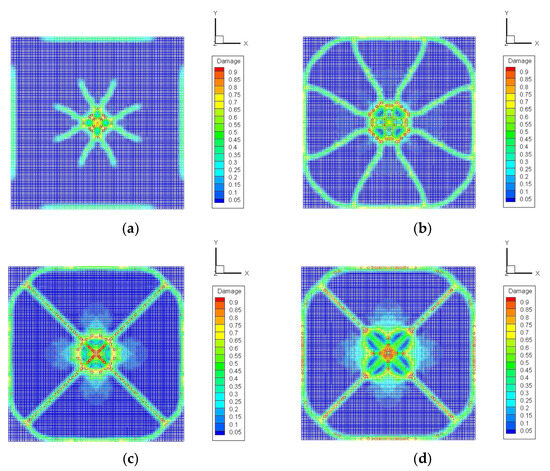
Figure 14.
The distribution of cracks after penetration with different cylinder diameters: (a) D = 22.5 mm; (b) D = 37.5 mm; (c) D = 45.0 mm; (d) D = 52.5 mm.
The loading area has a certain influence on the distribution of circumferential cracks as well. When the load action area is small, compressive failure leads to a certain degree of damage at the middle part of each edge, and no circumferential cracks form at the corners of the ice sheet. A comparative analysis of the outer circumferential crack indicates that its diameter is less sensitive to the load action area. In addition, it can be seen from the figure that the radius of the inner circumferential crack will gradually increase as the cylinder diameter increases.
The breakthrough load for different cylinder diameters is shown in Figure 15. It can be seen that as the cylinder diameter increases, the breakthrough load of the ice plate gradually increases, but the rate of increase will gradually decrease. When the cylinder diameter is smaller, the ice sheet is subjected to a load similar to a concentrated force, and the upper surface of the ice sheet will crack faster due to the tensile effect, so the breakthrough load is relatively small. Frankenstein’s research results show that when the ratio of the diameter of the (circular) loading area to the ice thickness is less than 2.0, the effect of a uniformly distributed load can be regarded as a concentrated force. Therefore, based on the combinations of ice thickness and cylinder diameter in this section, the vertical load applied to the ice sheet can be considered a concentrated force. When the loading is more concentrated, the ice sheet is more likely to undergo crushing failure in a short period of time, which leads to a pronounced increase in breakthrough load with cylinder diameter. In addition, Figure 16 shows that the smaller the cylinder diameter, the higher the pressure imposed by the breakthrough load on the upper surface of the ice sheet. And the relationship between the penetration pressure and contact area can also be fitted with a quadratic function.
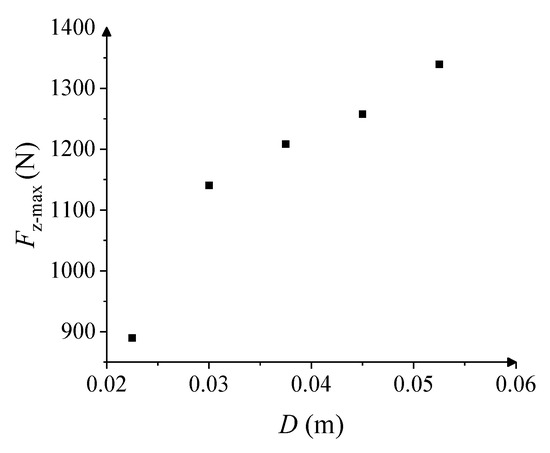
Figure 15.
The variation of breakthrough load with cylinder diameter.
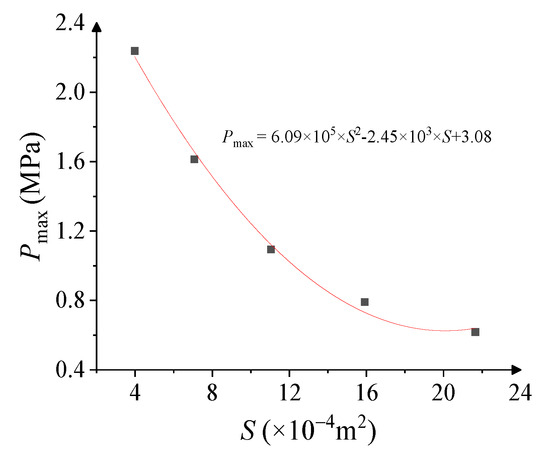
Figure 16.
The relationship between breakthrough pressure and contact area.
6. Conclusions
In this paper, a numerical model to describe the interaction between an ice sheet and a vertically ascending rigid cylinder is established using the peridynamic method. It has been proved that the numerical model shows a higher accuracy in simulating the crack distribution in ice sheets and calculating the ice load, which can provide strong support for the study of failure characteristics in ice sheets due to vertical penetration in different scenarios. Based on the numerical model, the influence of ice thickness, impact velocity and cylinder diameter on the crack propagation in the ice sheet and breakthrough load are discussed in detail. The main conclusions are as follows:
- (1)
- As the ice thickness increases, the cracks will change from only diagonal symmetry to complete symmetry, and the role of crushing as the cause of failure will be more prominent. The breakthrough load is positively related to the ice thickness, and the relationship can be fitted with a quadratic function.
- (2)
- If the impact velocity is within a certain range, there is no obvious difference in the crack distribution in the ice sheet. There might be an impact velocity within this range, and the structure will experience a minimal ice load when vertically penetrating the ice sheet with it.
- (3)
- As the cylinder diameter increases, the number of radial cracks in the ice sheet gradually decreases and gathers diagonally, and the breakthrough load gradually increases. The breakthrough pressure is inversely proportional to the contact area, and the relationship between the two can also be described using a quadratic function.
The range of calculation parameters (such as ice thickness and cylinder diameter) selected in this paper is limited and should be expanded appropriately in subsequent studies to improve the accuracy of the fitted curves. In addition, the boundary of the ice plate also has an impact on the crack propagation and ice load, so the effects of the size of fixed ice plates and boundary conditions should be further investigated in the future.
Author Contributions
Conceptualization, B.J.; methodology, B.J.; software, B.J.; validation, R.Z.; formal analysis, B.J.; investigation, B.J.; resources, F.P.; data curation, B.J.; writing—original draft preparation, B.J.; writing—review and editing, L.J.; visualization, C.H.; supervision, Q.W.; fund acquisition, D.H.; project administration, L.J. All authors have read and agreed to the published version of the manuscript.
Funding
This research was supported by the National Natural Science Foundation of China (NSFC) [Grant Nos. 52192690; 52192695].
Institutional Review Board Statement
Not applicable.
Informed Consent Statement
Not applicable.
Data Availability Statement
Data are contained within the article.
Conflicts of Interest
The authors declare no conflicts of interest.
References
- Masterson, D.M. State of the art of ice bearing capacity and ice construction. Cold Reg. Sci. Technol. 2009, 58, 99–112. [Google Scholar] [CrossRef]
- Sodhi, D.S. Vertical penetration of floating ice sheets. Int. J. Solids Struct. 1998, 35, 4275–4294. [Google Scholar] [CrossRef]
- Kerr, A.D. The bearing capacity of floating ice plates subjected to static or quasi-static loads. J. Glaciol. 1976, 17, 229–268. [Google Scholar]
- Kerr, A.D.; Palmer, W.T. The deformations and stresses in floating ice plates. Acta Mech. 1972, 15, 57–72. [Google Scholar] [CrossRef]
- Gold, L.W. Field study on the load bearing capacity of ice covers. Pulp Pap. Can. 1960, 61, 153–158. [Google Scholar]
- Gold, L.W. Use of ice covers for transportation. Can. Geotech. J. 1971, 8, 170–181. [Google Scholar] [CrossRef]
- Bažant, Z.P.; Li, Y.N. Penetration fracture of sea ice plate: Simplified analysis and size effect. J. Eng. Mech. 1994, 120, 1304–1321. [Google Scholar] [CrossRef][Green Version]
- Assur, A. Traffic over frozen or crusted surfaces. In Proceedings of the International Conference on the Mechanics of Soil-Vehicle Systems, Torino, Italy, 12–16 June 1961; pp. 913–923. [Google Scholar]
- Meyerhof, G.G. Bearing capacity of floating ice sheets. J. Eng. Mech. Div. 1960, 86, 113–145. [Google Scholar] [CrossRef]
- Coon, M.D.; Mohaghegh, M.M. Plastic Analysis of Coulomb Plates and Its Application to the Bearing Capacity of Sea Ice; Department of Atmospheric Sciences, University of Washington: Seattle, WA, USA, 1972. [Google Scholar]
- Sodhi, D.S. Breakthrough loads of floating ice sheets. J. Cold Reg. Eng. 1995, 9, 4–22. [Google Scholar] [CrossRef]
- Kheysin, D.Y. On the problem of the elastic-plastic bending of an ice cover. Tr. Arkticheskii Antarkt. Nauchno-Issledovatel’skii Inst. 1964, 267, 143–149. [Google Scholar]
- Garbaccio, D.H. Creep of Floating Ice Sheets, Computer Calculations; Science Engineering Associates Report; Defense Technical Information Center: Fort Belvoir, VA, USA, 1968. [Google Scholar]
- Panfilov, D.F. On the Determination of the Carrying Capacity of an Ice Cover for Loads of Long Duration; Corps of Engineers, US Army Cold Regions Research and Engineering Laboratory: Vicksburg, MS, USA, 1972. [Google Scholar]
- Frankenstein, G.E. Load Test Data for Lake Ice Sheets; Technical Report; Cold Regions Research and Engineering Laboratory (U.S.): Vicksburg, MS, USA, 1963. [Google Scholar]
- Lichtenberger, G.J.; Jones, J.W.; Stegall, R.D.; Zadow, D.W. Static Ice Loading Tests, Resolute Bay—Winter 1973/74; Report No. 7458-74-14; Sunoco Science and Technology: Richardson, TX, USA, 1974. [Google Scholar]
- Lichtenberger, G.J.; Stegall, R.D.; Braun, C.; Zadow, D.W. Vertical Load Bearing Capacity Tests of Natural Ice and of Artificial-Natural Ice Laminates, Resolute Bay, Winter 1974/75; Report No. 7481-75-2; Suntech: Richardson, TX, USA, 1975. [Google Scholar]
- Frederking, R.M.W.; Gold, L.W. The bearing capacity of ice covers under static loads. Can. J. Civ. Eng. 1976, 3, 288–293. [Google Scholar] [CrossRef]
- Bažant, Z.P.; Kim, J.J.H. Size effect in penetration of sea ice plate with part-through cracks. I: Theory. J. Eng. Mech. 1998, 124, 1310–1315. [Google Scholar] [CrossRef][Green Version]
- Beltaos, S. Bearing capacity of floating ice covers: Theory versus fact. In Proceeding of the 11th Workshop on River Ice: River Ice Processes within a Changing Environment, Ottawa, ON, Canada, 14–16 May 2001; pp. 14–16. [Google Scholar]
- Beltaos, S. A strain energy criterion for failure of floating ice sheets. Can. J. Civ. Eng. 1978, 5, 352–361. [Google Scholar] [CrossRef]
- Beltaos, S. Collapse of floating ice covers under vertical loads: Test data vs. theory. Cold Reg. Sci. Technol. 2002, 34, 191–207. [Google Scholar] [CrossRef]
- Wang, C.; Fang, Y.; Wang, C.H.; Zhu, G.Y.; Guo, C.Y. Experimental Study on Ice Vertical Penetration Rupture, Proceedings of the Chinse Society of Naval Architects and Marine Engineers; Academic Committee of Ship Mechanics—Testing Technology Group: Kunming, China, 28 July 2021; pp. 89–100. [Google Scholar]
- Wang, C.H.; Zhu, G.Y.; Wang, C.; Guo, C.Y.; Wang, J.A. Analysis of ice breaking under vertical loads and its influencing factors. J. Vib. Shock. 2022, 41, 11–19. [Google Scholar]
- Wang, C.H.; Wang, J.A.; Wang, C.; Guo, C.Y.; Zhu, G.Y. Research on vertical movement of cylindrical structure out of water and breaking through ice layer based on S-ALE method. Chin. J. Theor. Appl. Mech. 2021, 53, 3110–3123. [Google Scholar]
- Li, F.; Huang, L. A review of computational simulation methods for a ship advancing in broken ice. J. Mar. Sci. Eng. 2022, 10, 165. [Google Scholar] [CrossRef]
- Long, X.; Liu, S.; Ji, S. Discrete element modelling of relationship between ice breaking length and ice load on conical structure. Ocean Eng. 2020, 201, 107152. [Google Scholar] [CrossRef]
- Long, X.; Liu, L.; Liu, S.; Ji, S. Discrete element analysis of high-pressure zones of sea ice on vertical structures. J. Mar. Sci. Eng. 2021, 9, 348. [Google Scholar] [CrossRef]
- Silling, S.A. Reformulation of elasticity theory for discontinuities and long-range forces. J. Mech. Phys. Solids 2000, 48, 175–209. [Google Scholar] [CrossRef]
- Silling, S.A.; Askari, E. A meshfree method based on the peridynamic model of solid mechanics. Comput. Struct. 2005, 83, 1526–1535. [Google Scholar] [CrossRef]
- Huang, D.; Zhang, Q.; Qiao, P.Z.; Shen, F. A review on peridynamics method and its applications. Adv. Mech. 2010, 40, 448–459. [Google Scholar]
- Vazic, B.; Oterkus, E.; Oterkus, S. Peridynamic approach for modelling ice-structure interactions. In Proceedings of the 7th International Conference on Marine Structures (MARSTRUCT 2019), Dubrovnik, Croatia, 6–8 May 2019; CRC Press: Boca Raton, FL, USA, 2019; p. 55. [Google Scholar]
- Song, Y.; Yan, J.L.; Li, S.F.; Kang, Z. Peridynamic modeling and simulation of ice craters by impact. Comput. Model. Eng. Sci. 2019, 121, 465–492. [Google Scholar] [CrossRef]
- Lu, W.; Li, M.Y.; Vazic, B.; Oterkus, S.; Wang, Q. Peridynamic modelling of fracture in polycrystalline ice. J. Mech. 2020, 36, 223–234. [Google Scholar] [CrossRef]
- Vazic, B.; Oterkus, E.; Oterkus, S. In-plane and out-of plane failure of an ice sheet using peridynamics. J. Mech. 2020, 36, 265–271. [Google Scholar] [CrossRef]
- Jia, B.; Ju, L.; Wang, Q. Numerical simulation of dynamic interaction between ice and wide vertical structure based on peridynamics. Comput. Model. Eng. Sci. 2019, 121, 501–522. [Google Scholar] [CrossRef]
- Liu, M.H.; Wang, Q.; Lu, W. Peridynamic simulation of brittle-ice crushed by a vertical structure. Int. J. Nav. Archit. Ocean Eng. 2017, 9, 209–218. [Google Scholar] [CrossRef]
- Parks, M.L.; Seleson, P.; Plimpton, S.J.; Silling, S.A.; Lehoucq, R.B. Peridynamics with Lammps: A User Guide, v0. 3 Beta; Sandia Report (2011–8253); Sandia National Laboratories: Albuquerque, NM, USA, 2011. [Google Scholar]
- Wang, Q.; Wang, Y.; Zan, Y.F.; Lu, W.; Bai, X.L.; Guo, J. Peridynamics simulation of the fragmentation of ice cover by blast loads of an underwater explosion. J. Mar. Sci. Technol. 2018, 23, 52–66. [Google Scholar] [CrossRef]
- Madenci, E.; Oterkus, E. Peridynamic Theory and Its Applications; Springer: New York, NY, USA, 2017. [Google Scholar]
- Huang, D.; Lu, G.D.; Qiao, P.Y. An improved peridynamic approach for quasi-static elastic deformation and brittle fracture analysis. Int. J. Mech. Sci. 2015, 94–95, 111–122. [Google Scholar] [CrossRef]
- Timco, G.W.; Weeks, W.F. A review of the engineering properties of sea ice. Cold Reg. Sci. Technol. 2010, 60, 107–129. [Google Scholar] [CrossRef]
- Schulson, E.M. Brittle failure of ice. Eng. Fract. Mech. 2001, 68, 1839–1887. [Google Scholar] [CrossRef]
- Karr, D.; Das, S. Ice strength in brittle and ductile failure modes. J. Struct. Eng. 1983, 109, 2802–2811. [Google Scholar] [CrossRef]
- Lu, W. The Study of the Numerical Simulation Method of Peridynamic Based on the Bending Fracture of Sea Ice. Master’s Thesis, Harbin Engineering University, Harbin, China, 2017. [Google Scholar]


Disclaimer/Publisher’s Note: The statements, opinions and data contained in all publications are solely those of the individual author(s) and contributor(s) and not of MDPI and/or the editor(s). MDPI and/or the editor(s) disclaim responsibility for any injury to people or property resulting from any ideas, methods, instructions or products referred to in the content. |
© 2024 by the authors. Licensee MDPI, Basel, Switzerland. This article is an open access article distributed under the terms and conditions of the Creative Commons Attribution (CC BY) license (https://creativecommons.org/licenses/by/4.0/).