Abstract
Wind turbines and floating platform upsizing are major trends in the current offshore wind development. However, harsh environmental conditions increase the risk of anchor dragging and mooring failure when deploying large offshore floating wind turbines. Therefore, it is necessary to design a mooring system for the specific deployment site. This study aims to perform the mooring system design of a floating offshore wind turbine (FOWT) operated in the South China Sea, which is a combination of the IEA 15 MW wind turbine and UMaine VolturnUS-S floating platform. Hydrodynamic coefficients were calculated based on the potential flow theory, considering the environmental loads in the South China Sea. Additionally, the hydrodynamic coefficients were imported into AQWA to calculate the time-domain mooring tension. The mooring design parameters, such as mooring line length, nominal sizes, and anchor point, were determined using the criterion of anchor uplift, maximum breaking strength, and fatigue life, respectively. The design criterion required that the anchor uplift is not more than the allowable value, the long-term breaking limit of mooring with a 100-year return period should be less than the maximum breaking limit, and the fatigue damage accumulation in 50 years should be safe. The mooring design procedure provides a reference for mooring system design and safe operation of large floating wind turbines in the South China Sea.
1. Introduction
The development and utilization of offshore wind energy around the world in order to promote the further development of global renewable energy and satisfy the requirements of carbon emission limitation. According to the Global Wind Report 2023, China will continue to lead the global wind energy development [1]. Without a doubt, FOWT will flourish in China. Meanwhile, the subsidy of electricity prices for offshore wind power generation is reduced. Wind turbines and floating platform upsizing are major trends in the current offshore wind development to reduce costs and improve power generation efficiency [2]. According to the statistical data of the International Energy Agency (IEA) on wind turbines in the last 30 years, the parameters such as tower height and blade length of wind turbines are constantly increasing with the increase in rated power. Firstly, the tower height is increased to capture wind resources with less turbulence and higher speed. Secondly, the larger blades can generate more electricity to reduce the power generation costs. However, the larger wind turbines and more complex environmental conditions have higher requirements for the mooring system. For the above reasons, many scholars have carried out research on floating wind turbine mooring systems. Chen et al. present a simulation technology that controls the mooring force in real time based on the displacement of mooring nodes and calculates the mooring stress response using the finite element method. It is beneficial to further investigate the impacts of the fluid loads, the mooring geometry, and material nonlinearity on the real-time structural responses of mooring lines during their service life [3]. Barrera et al. have presented a groundbreaking technique for evaluating the fatigue of mooring systems for floating offshore wind turbines that takes into account the entire lifespan of the structure [4]. Li and Choung used an artificial neural network to predict fatigue damage in the mooring lines of a floating offshore wind turbine, in which fatigue damage can be accurately predicted in the time domain [5]. Wang et al. proposed a new method for predicting mooring tension based on a neural network [6]. Campanile and colleagues study mooring design and selection for NREL 5 MW floating offshore wind turbines, considering ultimate, accidental, and fatigue limit states and providing mooring configuration selection recommendations [7]. Hall and Goupee proposed a lumped mass mooring line model, demonstrating its effectiveness in predicting the load of DeepCwind semi-submersible mooring lines [8]. Pillai and colleagues investigated the impact of single and shared anchor loads on various mooring arrangements based on the IEA 15 MW wind turbine and the VolturnUS-S reference platform subjected to environmental conditions representative of the Celtic Sea. The importance of considering operational and parked design loads is highlighted, but the fatigue analysis of mooring lines is not considered [9,10]. Xu Sheng et al. employed the T-N curve to calculate the short-term fatigue damage of point absorption wave energy devices [11]. Ahn et al. investigated the loads on a 15 MW floating wind turbine tower based on wave conditions, which in turn analyzed the relationship between the pitching moments at the top and base of the tower with the wave conditions without regard to the effect of wave conditions on the mooring system [12]. Zhao et al. analyzed the reliability of a floating wind turbine mooring system based on the environmental isoline method and studied the relationship between the extreme tension of the mooring line and environmental parameters [13]. However, harsh environmental conditions increase the risk of anchor dragging and mooring failure when deploying large offshore floating wind turbines. Therefore, it is necessary to design a mooring system for the specific deployment site [14].
The response of the floating platform determines the response of the mooring lines [15]. Chueh et al. proposed a new power control strategy. The 15 MW floating wind turbine is validated using offshore wind and wave conditions, and it was demonstrated that the control strategy can decrease the effect of platform motion on power generation [16]. Mazarakos studied the response of the 15 MW floating wind turbine under regular or irregular waves based on Mediterranean sea wave conditions [17]. Benassai et al. compared the response of semi-submersible wind turbines under catenary and tension mooring based on 5-year and 50-year return period wave data in the southern Mediterranean Sea [18]. The depth of water in the South China Sea is typically shallower compared to the North Sea in Europe, leading to distinct dynamic response features for mooring and platform [19]. For the design and safety evaluation of mooring lines, hydrodynamic dynamics analysis of the floating platform is necessary [20]. In this paper, the motion of the floating platform supporting the wind turbine is analyzed using the environmental conditions in the South China Sea. The safety of the mooring system is evaluated by the fully coupled analysis method, including current force, wind load, wave force, and mooring forces. It is important to design a reasonable mooring line length, which can effectively ensure the quasi-static response of the mooring floating structure within an acceptable level and reduce the cost of the mooring line in the overall project [21]. The mooring design parameters, such as mooring line length, nominal sizes, and anchor point, were determined by the criterion of anchor uplift, maximum breaking strength, and fatigue life, respectively. The design criterion required that the anchor uplift is zero, the long-term breaking limit of mooring with a 100-year return period should be less than the maximum breaking limit, and the fatigue damage accumulation in the full lifecycle should be safe. The mooring lines maximum tension range in the return period of 100 years is predicted using the Weibull distribution and cumulative fatigue damage based on the design life of 50 years calculated using linear cumulative damage of Miner’s rule. The mooring design procedure provides a reference for mooring system design and safe operation of large floating wind turbines in the South China Sea.
2. Methodology and Design Procedure
2.1. Methodology
2.1.1. Time Domain Motion Equation
The time domain motion response of the floating offshore wind turbine depends on the wind load, hydrodynamic load, and mooring force. The time domain motion equation is as follows [22]:
where is the structural mass matrix, is the fluid-added mass matrix at infinite frequency, , and are, respectively the acceleration, velocity, and displacement of the floating platform. is the velocity impulse function matrix, and is the total stiffness matrix, , , and are, respectively, the wind load, hydrodynamic force, and mooring force on the floating platform.
2.1.2. Weibull Distribution
The Weibull distribution is a versatile continuous probability distribution capable of fitting a wide array of distribution shapes. Similar to the normal distribution, the Weibull distribution is unimodal and describes probabilities linked to continuous data [23]. Its three parameters include shape, scale, and threshold. If the threshold is set to zero, it becomes the two-parameter Weibull distribution.
The double-parameter Weibull distribution is as follows:
where is the tension range, is the shape parameter, is the scale parameter.
2.1.3. Rain Flow Counting Method and Goodman Correction
The mooring chain tension can be obtained from the following formula:
where is the stress of the mooring chain, is the tension of the mooring chain at the fairlead point, is the mooring chain diameter is the nominal cross-sectional area of the mooring chain, which is twice the cross-sectional area of the mooring chain [4].
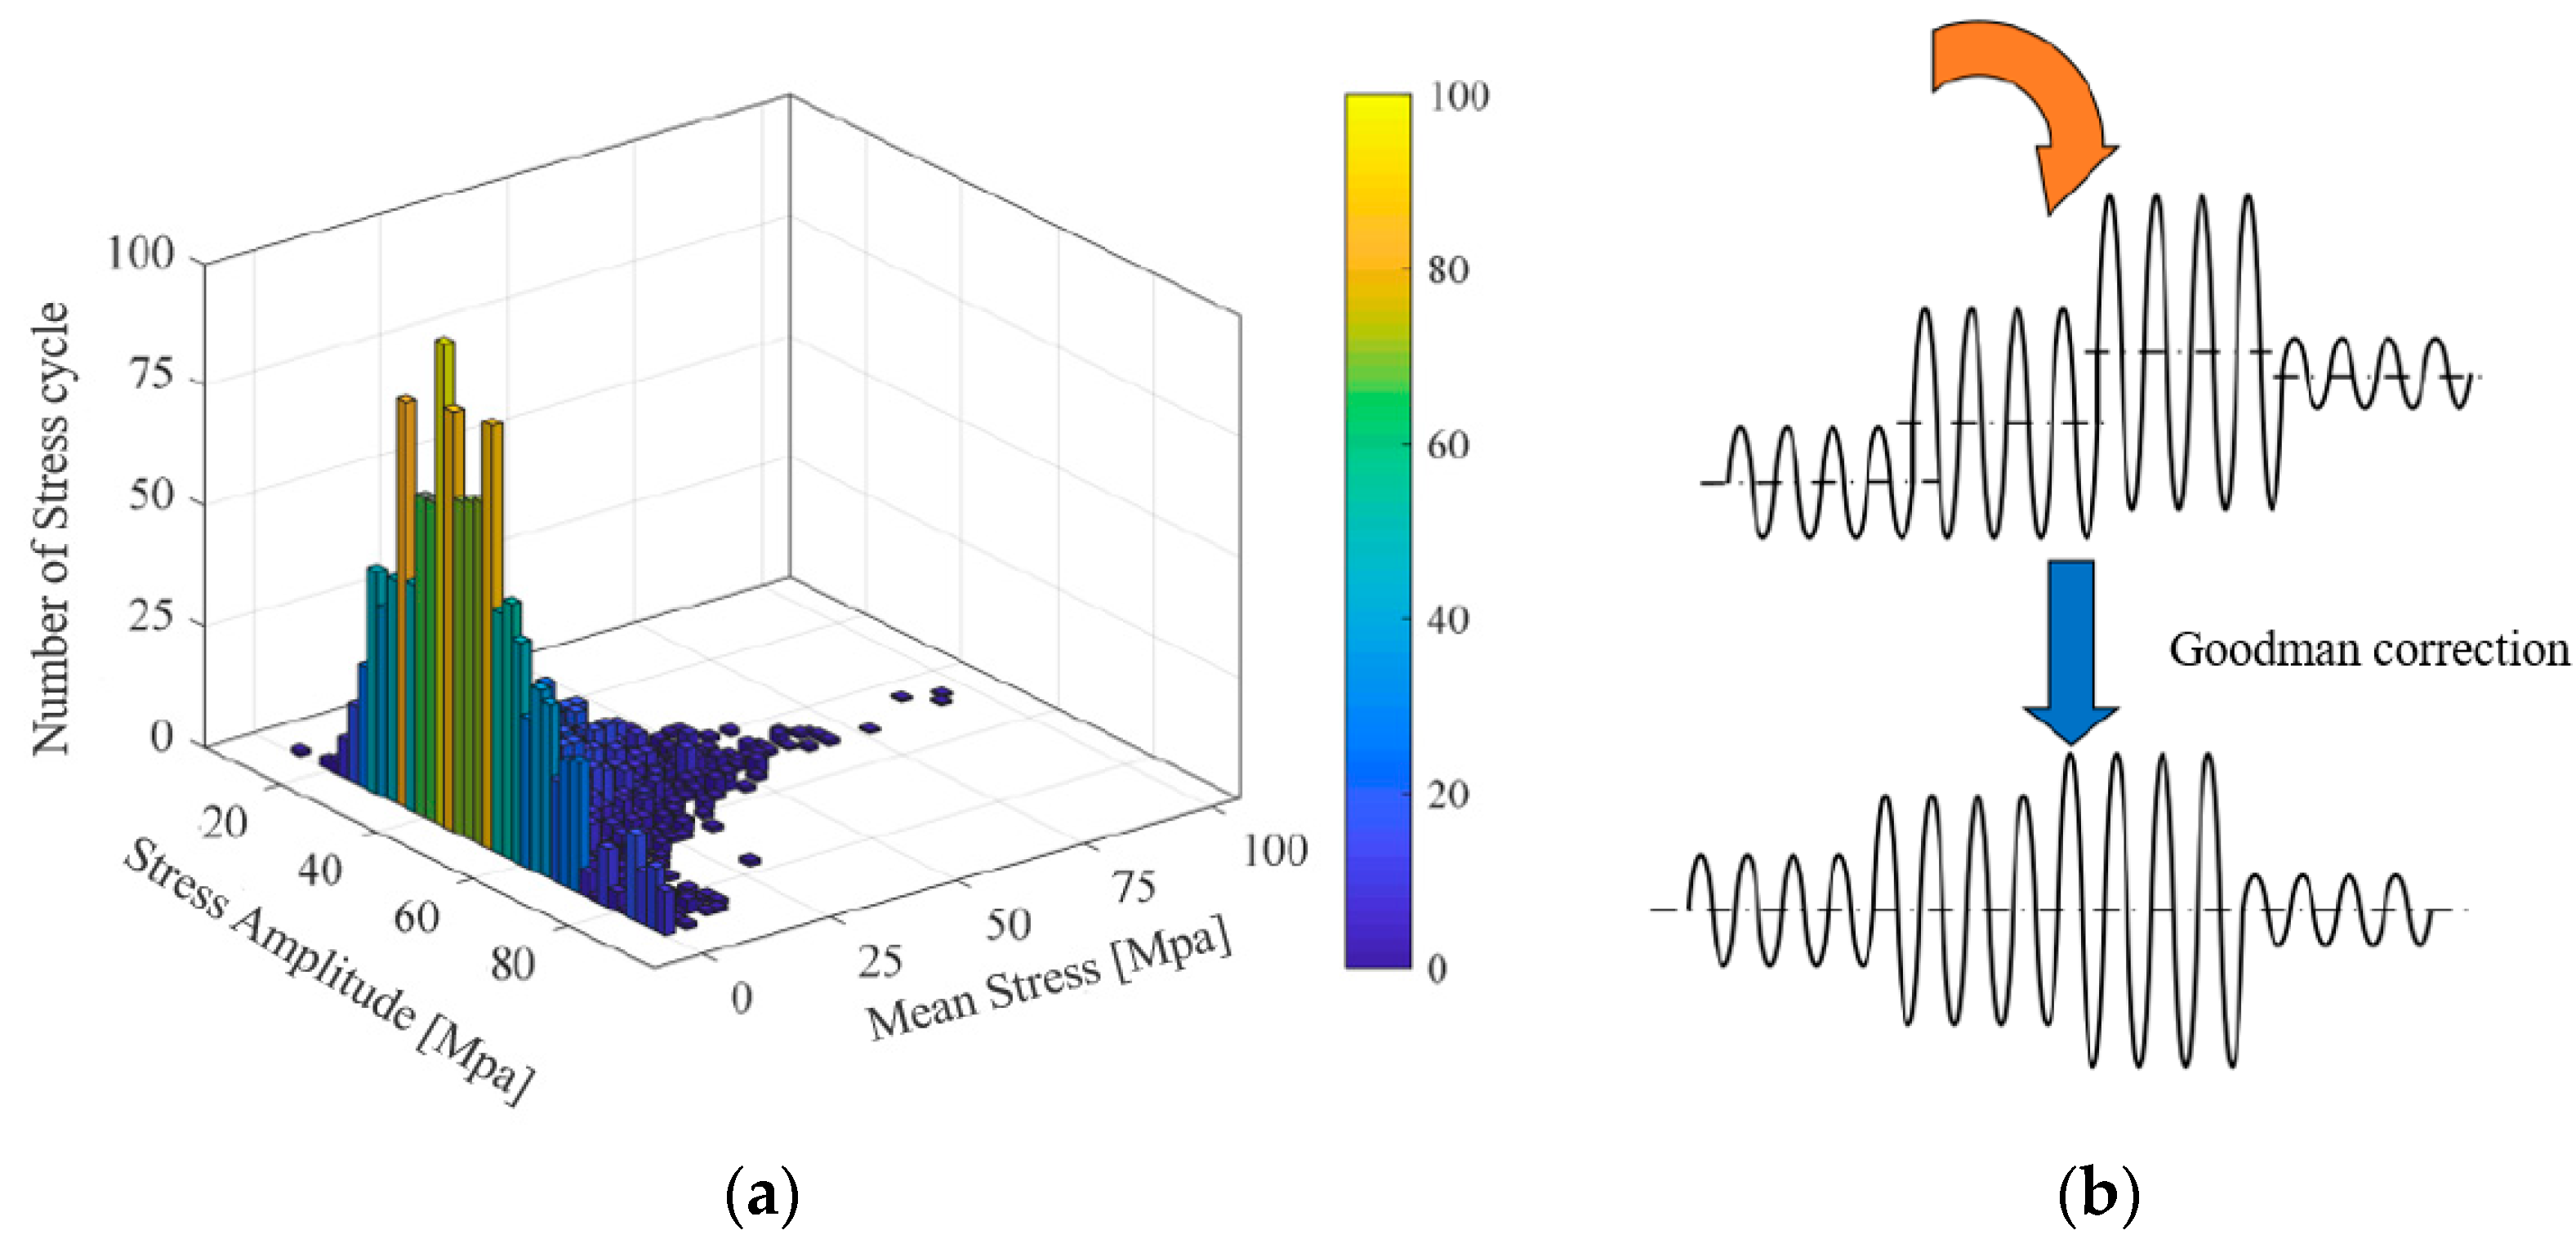
The rain flow counting method is commonly considered the most dependable approach for fatigue data analysis in engineering. The rain flow counting method simplifies stress-time data into complete cycles, using the two parameters of stress amplitude and mean stress to analyze fatigue damage. This is achieved using the double-parameter counting method [24].
Figure 1a shows the cycle of the rain flow counting method. The mean stress, stress amplitude, and corresponding cycle times are derived from the mooring tension curve calculated in the time domain by the rain flow counting method.
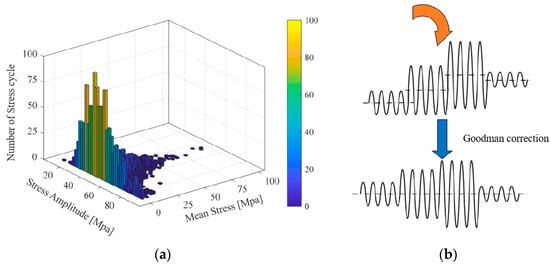
Figure 1.
The rain flow counting method (a) and Goodman correction (b).
The floating offshore wind turbine is exposed to alternating loads during its operation. Mean stress and stress amplitude greatly affect the fatigue damage to the structure. To remove the effect of non-zero mean stress, the correction known as the Goodman method is applied [25]. A visual representation of the correction process is shown in Figure 1b.
where is the stress amplitude after Goodman correction, is the ultimate stress, is the mean stress, is the mean stress in the i-th cycle, and is the stress amplitude under the mean stress of .
2.1.4. Linear Fatigue Cumulative Damage Rule
From a macroscopic perspective, it is widely accepted that fatigue failure results from the accumulation of damage caused by fluctuating loads, specifically by each hysteresis cycle in the local stress–strain diagram. These cycles typically exhibit varying mean and amplitude, necessitating the accumulation of their respective fatigue damage. At present, the primary theories for the accumulation of fatigue damage comprise linear cumulative damage theory, bilinear cumulative damage theory, nonlinear cumulative damage theory, and additional semi-empirical formulas [26].
In this study, the fatigue damage of the mooring line of the floating offshore wind turbine was evaluated using the time-domain fatigue analysis method. The advantage of this approach is that it is not based on any assumptions. In addition, it is considered to be the most accurate approach for evaluating fatigue damage and serves as a benchmark for other methods [27]. The linear fatigue cumulative damage rule ignores the influence of loading sequence on cumulative damage, and the total damage to the structure can be approximately equal to the linear accumulation of each part of structure damage [28]. First, the mooring line tension of the floating offshore wind turbine under each sea state is obtained by coupling dynamic analysis, and then the short-term fatigue damage rate under each sea state is calculated, and then the long-term fatigue damage of the mooring lines is obtained by probability accumulation.
where is the i-th stress failure cycle number, is the Wöhler index, which is taken as 4 because of the non-corrosive single slope S-N curve. is the short-term cumulative fatigue damage rate, is the i-th stress cycle number, and is the iteration number of the stress cycle. is the long-term cumulative fatigue damage, and are, respectively, the time of short-term simulation and full lifecycle, and is the probability of environmental conditions.
2.2. Design Procedure
The design process of mooring lines is shown in Figure 2. First, after determining the basic specifications of the platform, Diffraction analysis is carried out along with the verification of the model hydrodynamic coefficient. Additionally, the initial design of mooring lines considers the type of mooring lines, initial tension, and safety of mooring lines. Based on the stability analysis of the platform with mooring lines, the tension histories of mooring lines are calculated using the motion analysis in the time domain, and verification is carried out by calculating and comparing each data regarding structural strength and fatigue strength. Finally, the mooring lines are optimized by changing the anchor point position, the mooring lines radius, and length.
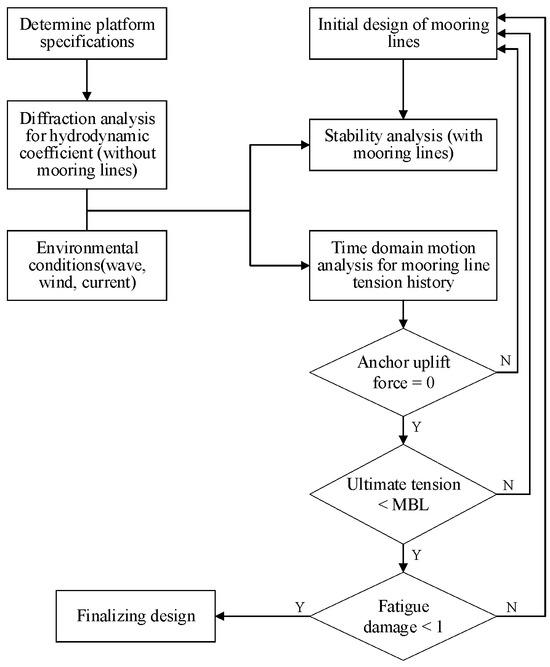
Figure 2.
Design procedure of mooring lines.
3. Numerical Model and Hydrodynamic Coefficient Verification
3.1. Turbine and Platform Characteristics
In this paper, 15 MW wind turbine was selected in the wind technology cooperation project Task 37 of the International Energy Agency. Similar to the NREL 5 MW turbine, this IEA 15 MW turbine, based in part on the DTU 10 MW reference turbine, is completely defined, including the control system and using new blade construction technologies. Table 1 shows the main features of this turbine [29].

Table 1.
Parameters of the IEA 15 MW Turbine.
The floating platform of the present study on a four-column steel semi-submersible platform, which was developed by the University of Maine and NREL, is applied. Table 2 shows the basic characteristics of structure [30]. The hull arrangement consists of three buoyant columns with a diameter of 12.5 m, spaced radially and with centers located 51.75 m away from the vertical axis of the tower. At the center of the platform in the surge-sway plane, there is a fourth buoyant column where the platform-tower interface is located. This central column connects to the outer columns via three rectangular bottom pontoons measuring 12.5 m in width and 7.0 m in height, as well as three radial struts measuring 0.9 m in diameter, attached to the bottom and top of the buoyant columns, respectively. The floating platform model considers the quasi-static drag force on the wind turbine blade and does not consider the aerodynamic load because AQWA mainly calculates the motion of the floating platform. The mass and inertial moment of the platform are designated. The left diagram of Figure 3 shows the VolturnUS-S platform and IEA 15 MW turbine, and the right diagram shows the model of a floating platform with a mesh size of 0.8 m.
Table 2.
The main characteristics of the VolturnUS-S Platform.
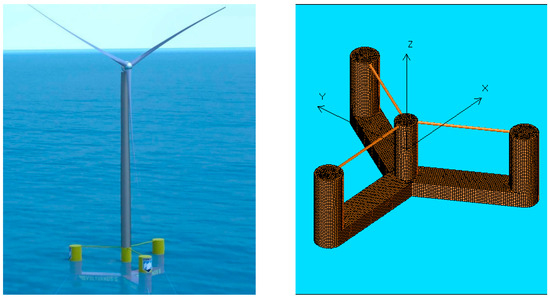
Figure 3.
VolturnUS-S platform and IEA 15 MW turbine.
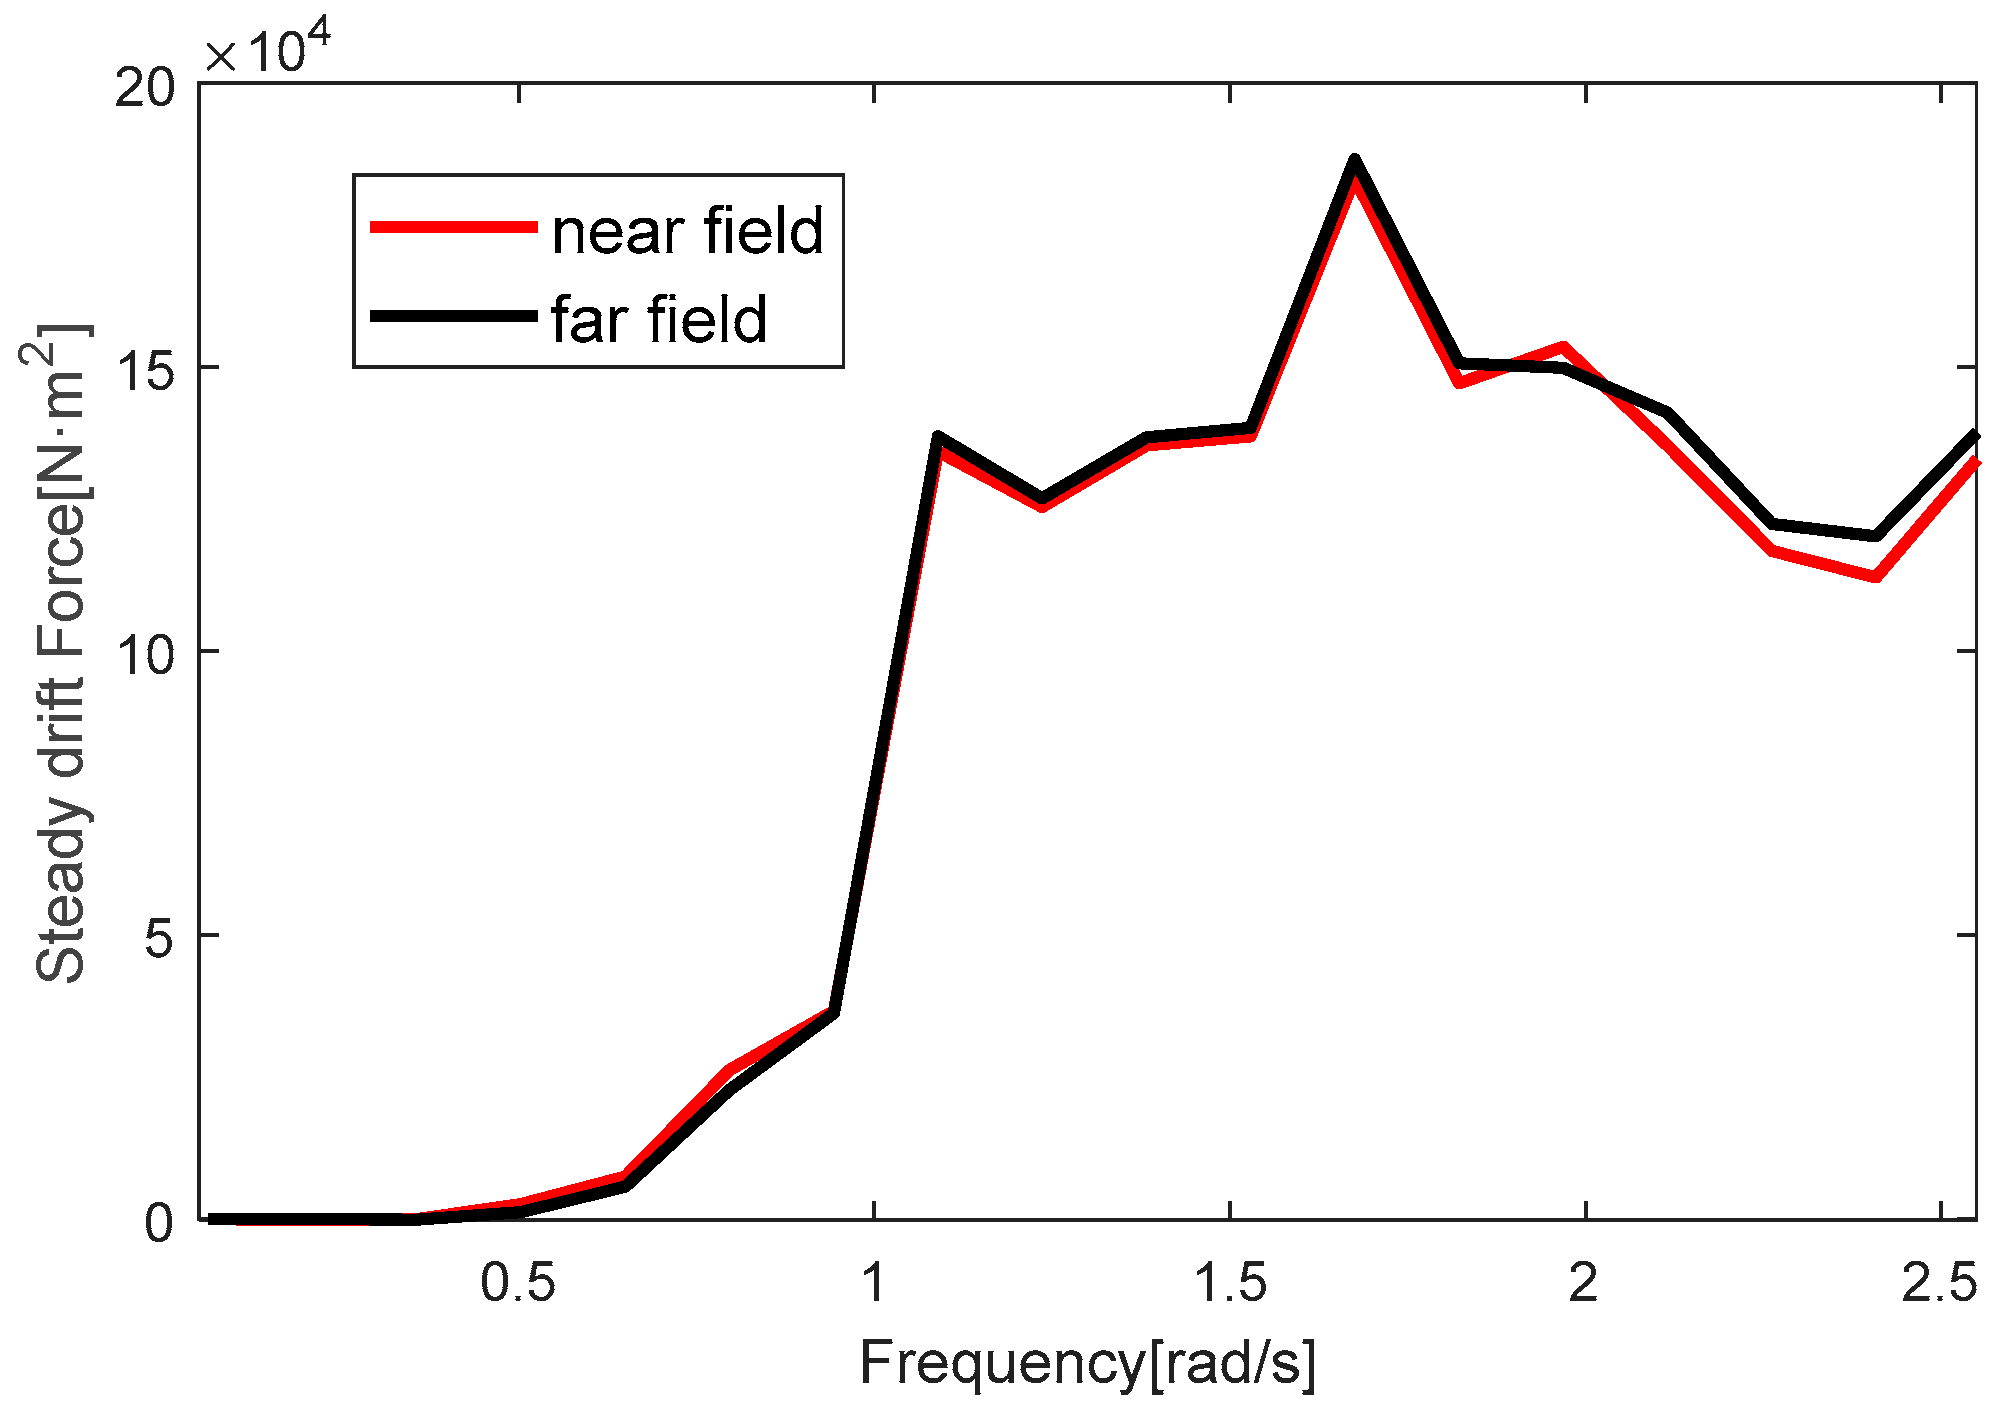
Figure 4 is the mesh quality validation; a comparison of near-field and far-field is carried out in this paper. In the frequency domain range of 0.05–2.55 rad/s, 25 wave frequency domains were selected with 0.1 rad/s as the discrete step, and the results of the near-field and far-field methods were carried out, respectively.
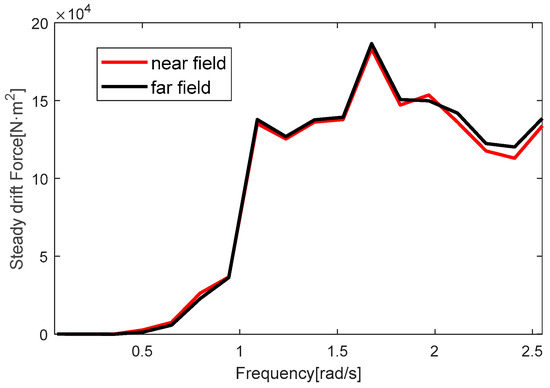
Figure 4.
Mesh quality validation.
From the above figure, it can be seen that the steady drift force of the platform in the surge direction has an excellent tendency under both the near-field method and far-field method, which indicates that the platform with a mesh size of 0.8 m has better mesh quality.
3.2. Initial Mooring Design
In this paper, the depth of the water is set to 70 m, and the chain’s nominal diameter is considered to be 185 mm. The mooring system selected is a studless chain, and detailed specifications are given in Table 3. According to DNV rules, the offshore structure drag coefficient of studless chain for the longitudinal and transverse 2 and 1.15 is encouraged to apply [31]. The 120-degree interval mooring line configuration is shown in Figure 5.
Table 3.
Parameters of the Mooring System.
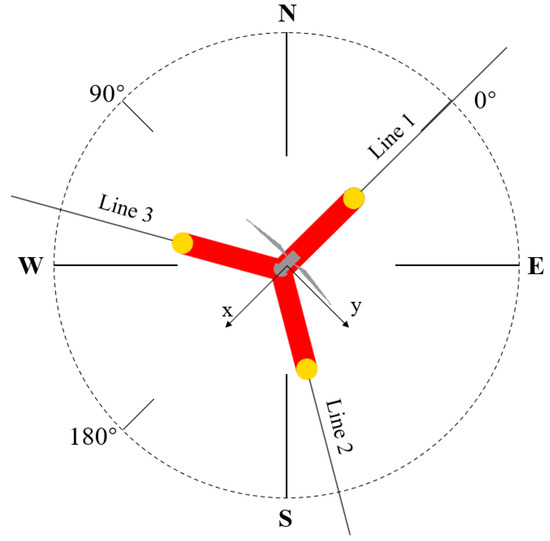
Figure 5.
The configuration of mooring lines.
To determine the initial length, the equation for the catenary is applied, and the proof load of chain grade R3 is selected to determine the maximum tension according to DNV rules [20]. The initial mooring lines configuration shown in Table 4 is derived from Hazelton’s guidance and iterative design using the methodology outlined in Connolly and Hall [32,33]. Additionally, the target declination angle is maintained by extending the anchor radial distance and adjusting the lengths of the lines.
Table 4.
The initial Mooring configuration.
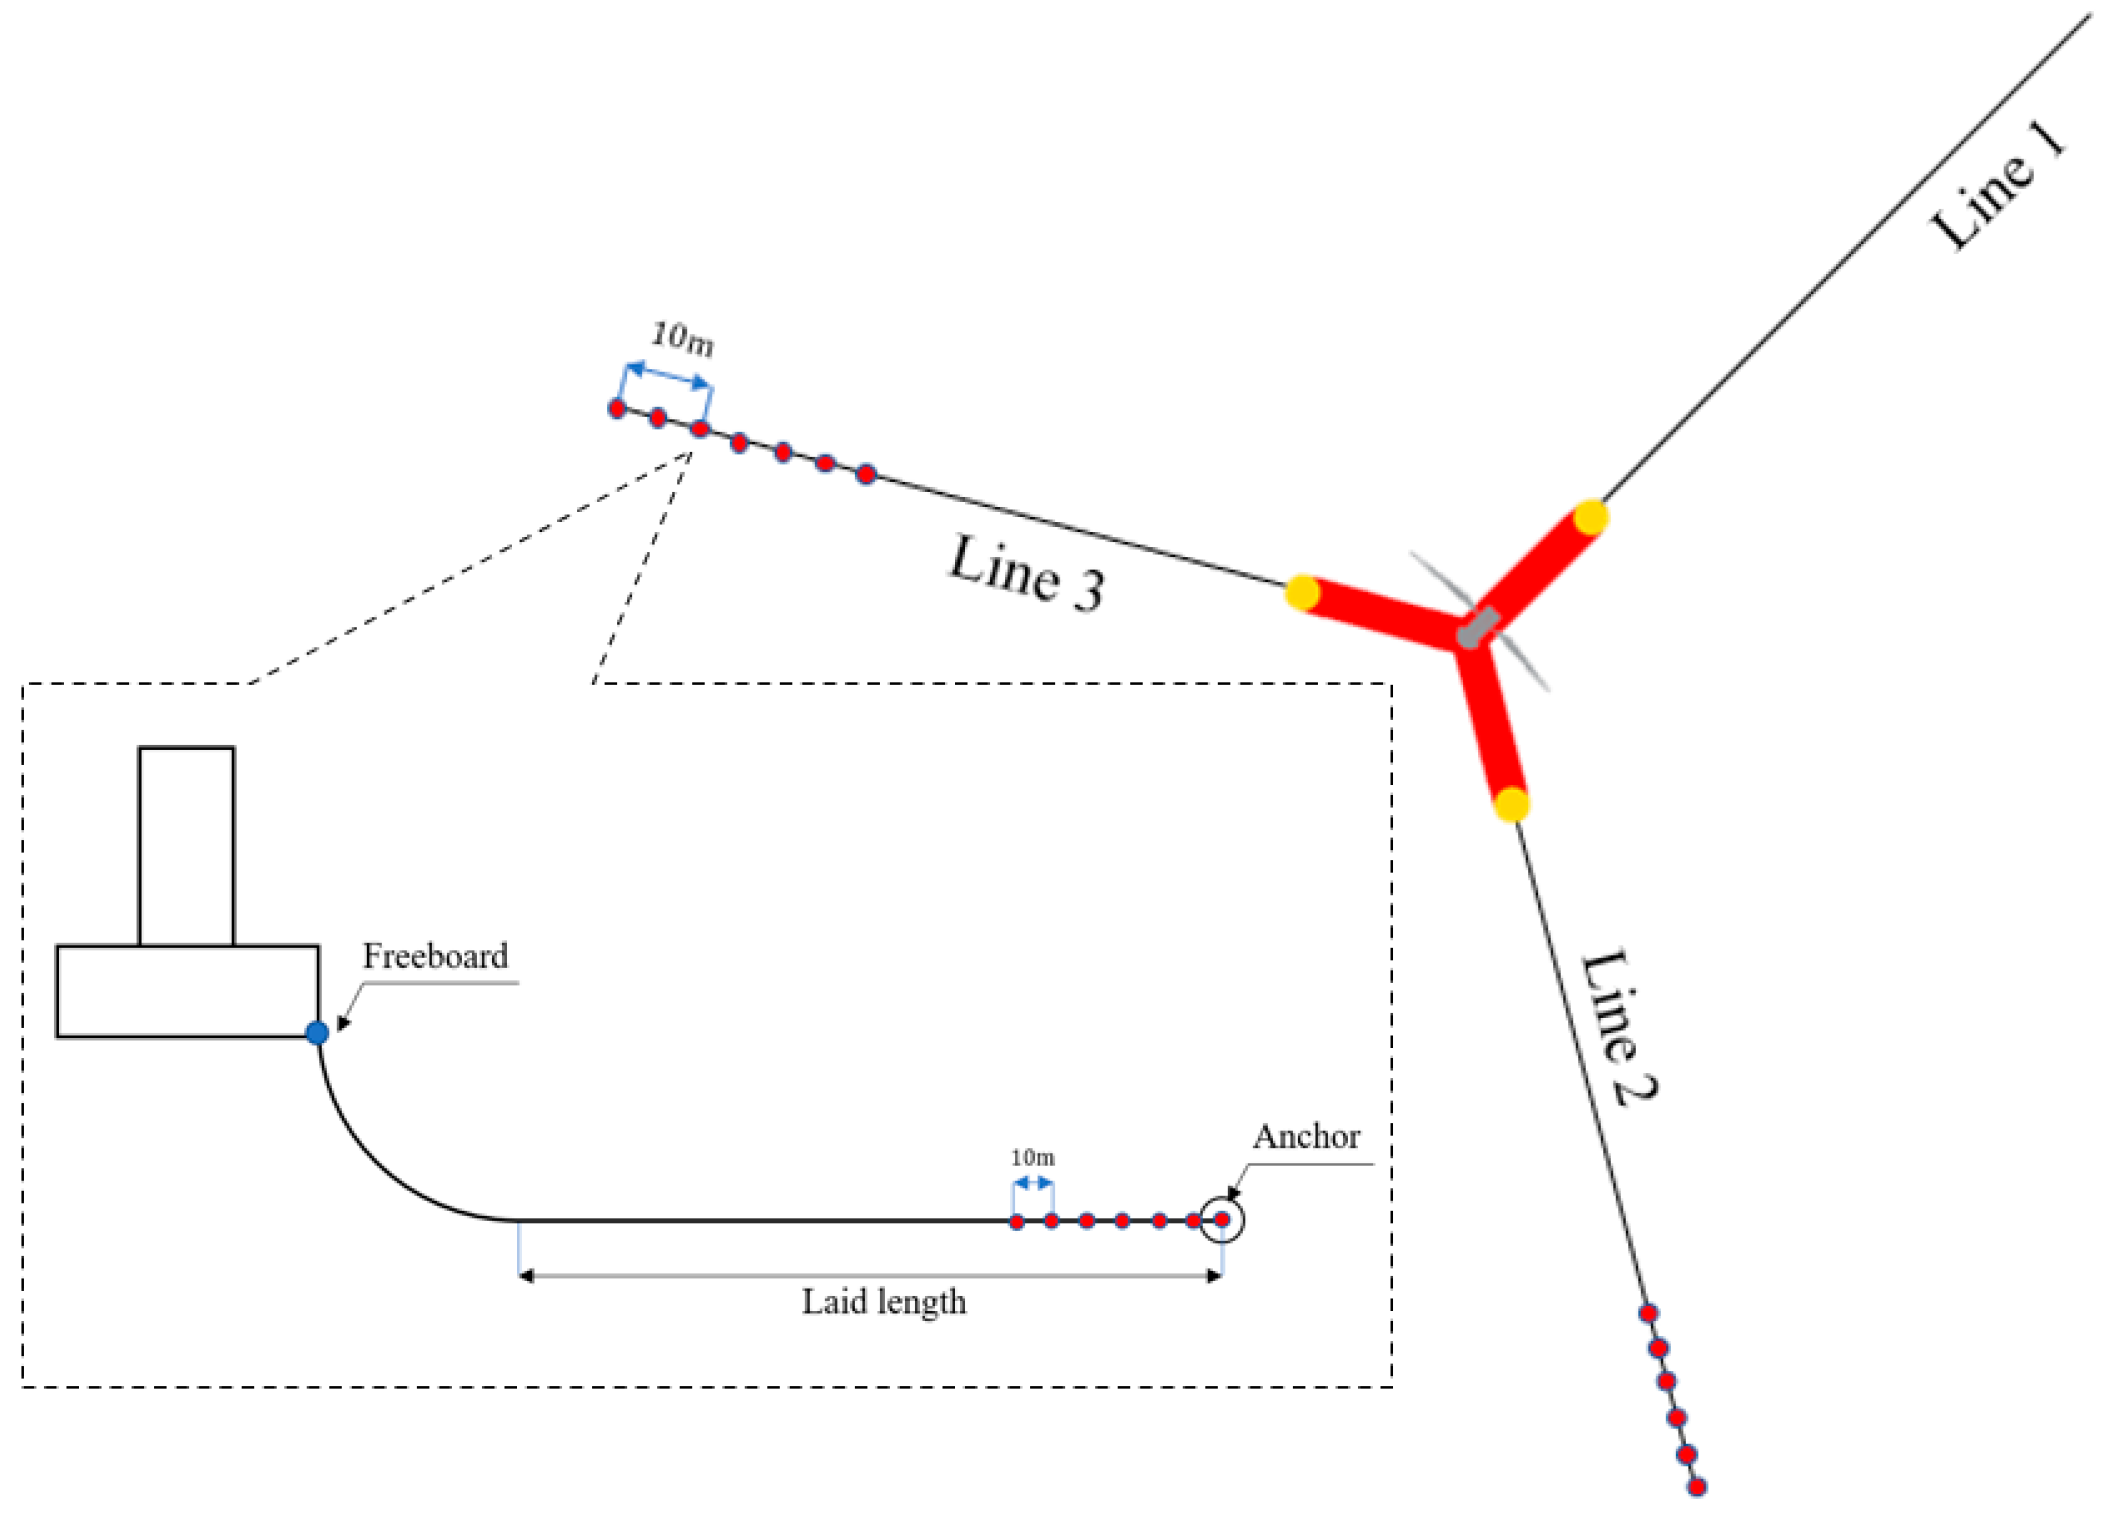
The distance between the initial contact point between the mooring line and the seabed and its anchor point is known as the laid length of the mooring line. According to DNV regulations, the laid length should be designed long enough to safeguard against anchor uplift force at the anchoring point. Hence, the laid length is adjusted to prevent the anchor uplift force from being greater than the anchor gravity when environmental loads are applied. The anchor uplift force is generally stipulated not to be greater than one-fiftieth of the total gravity of the anchor and the laid mooring lines [34].
4. Mooring Design and Optimization
4.1. Environmental Condition
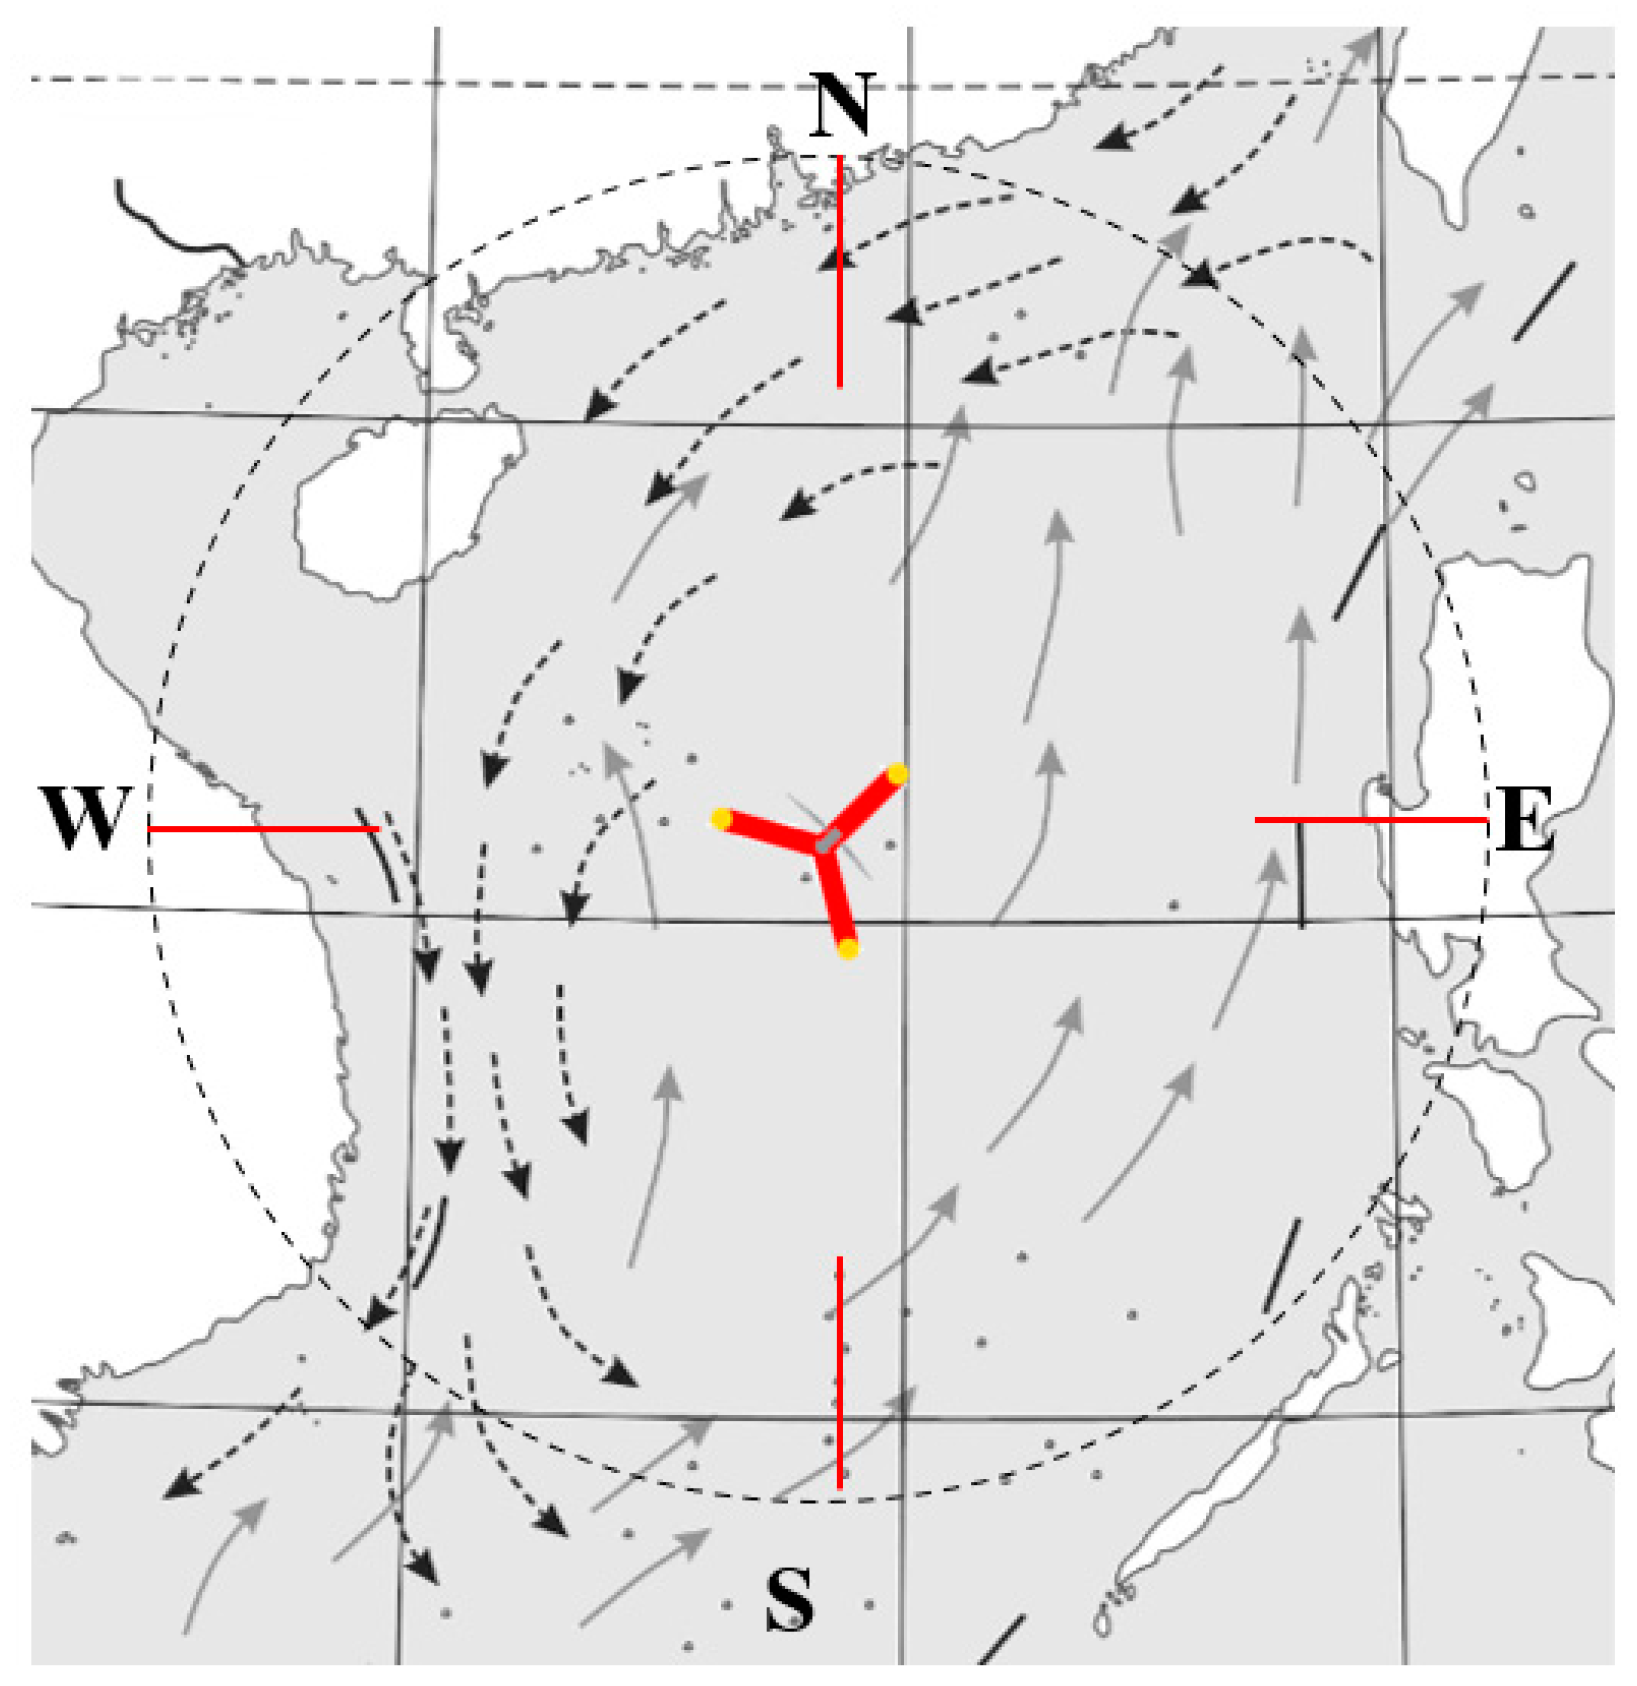
According to the long-term wind direction data statistics, the South China Sea is northeast wind from October to March, southwest wind from May to August, and April and September are the transition months of monsoon; the wind direction in the South China Sea is shown in Figure 6. In order to improve the efficient power of floating offshore wind turbines, it is expected to be highly utilized of the wind condition when installing wind turbines. It is most reasonable to design an angle of zero between the wind turbines and the prevailing wind direction and take the northeast as the direction of 0°. Therefore, the possibility of incident direction is set as follows: 50% of the northeast wind, 33.33 of the southwest wind, and other wind directions have the same probability, which is 8.33%. The wind direction distribution and its occurrence probability are shown in Table 5.
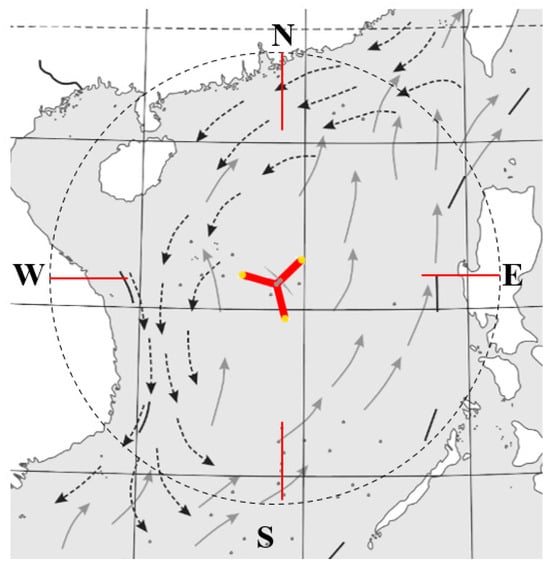
Figure 6.
The wind direction in South China Sea.
Table 5.
The wind direction and probability.
For an offshore platform operating in a specific sea area, the long-term distribution of sea conditions can be determined from the wave scatter diagram of the sea area [35]. Table 6 shows the wave scatter diagram in the South China Sea. Based on the wave scatter diagram obtained from long-term observation, significant wave height and zero-crossing period are divided into 33 girds. Each significant wave height corresponds to multiple zero-crossing periods, and the number of occurrences during the observation period is entered into the wave scatter diagram.
Table 6.
Wave scatter diagram of South China Sea.
Waves and currents are usually caused by wind loads. To simplify the simulation calculation, it is assumed that the direction of the wind, wave, and current is the same, and the wind speed is taken as the rated wind speed of 10.59 m/s when the 15 MW wind turbine is in normal operation. Additionally, the current is a constant flow with a velocity of 1 m/s.
4.2. Optimization Based on Mooring Maximum Breaking Limit and Fatigue Damage
Due to the intricacy of the multi-body system, it is necessary to come up with comprehensive time domain simulation and statistical analysis for obtaining dependable outcomes [36]. After a high volume of time-domain simulations of the irregular waves, the extreme distribution model is employed for assessing the extreme responses. Time domain analysis was carried out using AQWA. In the wave scatter diagram of the South China Sea, a total of 33 short-term sea states exist. As a result, 264 time analyses were conducted with eight kinds of wind directions. Simulation of external forces using the floating platform motion is carried out for 3600 s, and the initial 400 s were eliminated to avoid the startup effects. Finally, the time history of mooring tension is drawn by applying the time domain analysis.
The peak of ultimate tension leads to structural failure or greatly shortens the service life [37,38]. In order to investigate ultimate strength, the effective range of mooring line tension is calculated from the tension history using the rain flow cycle counting method. Tension ranges for long-term wave conditions are extended from the probability of the wave scatter diagram. The Weibull distribution and linear regression model are used to calculate the maximum tension for a 100-year return period, and the maximum tension of each mooring line is summarized in Table 7.
Table 7.
Maximum tension for a return period of 100 years.
The cumulative fatigue damage can be assessed using tension range data, linear damage accumulation rules, and S-N curves. Assuming a 50-year design life, each mooring line’s accumulation damage is calculated for 50 years and summarized in Table 8. According to the prediction results, the maximum mooring tension for a 100-year return period is less than the mooring breaking force, and the fatigue damage is far less than 1, so the structure is safe and can be optimized further.
Table 8.
Accumulative damage for 50 years.
4.3. Mooring Optimization—Anchor Point
For the initial mooring design, the maximum tension range for a return of 100 years and the fatigue damage for a lifetime of 50 years are in the safe range. Keeping a fixed angle for the configuration of mooring lines, the reanalysis is performed by changing the anchor point location and mooring line laid length. As shown in Figure 7, mooring lines 2 and 3 are taken as the research objects, and the environmental conditions condition with the maximum mooring tension are selected for optimization. The optimization method is to shorten the length of the mooring lines laid length towards the floating platform, which is 5 m of the length of the mooring lines, and the iterative calculation is carried out with the anchor uplift force as the optimization parameter. The length of each mooring line is optimized using an iterative process until the anchor uplift force does not satisfy the condition the total length of the end moorings is established.
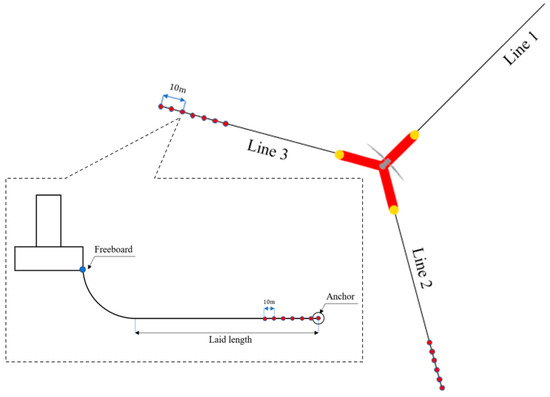
Figure 7.
Iterative diagram of mooring.
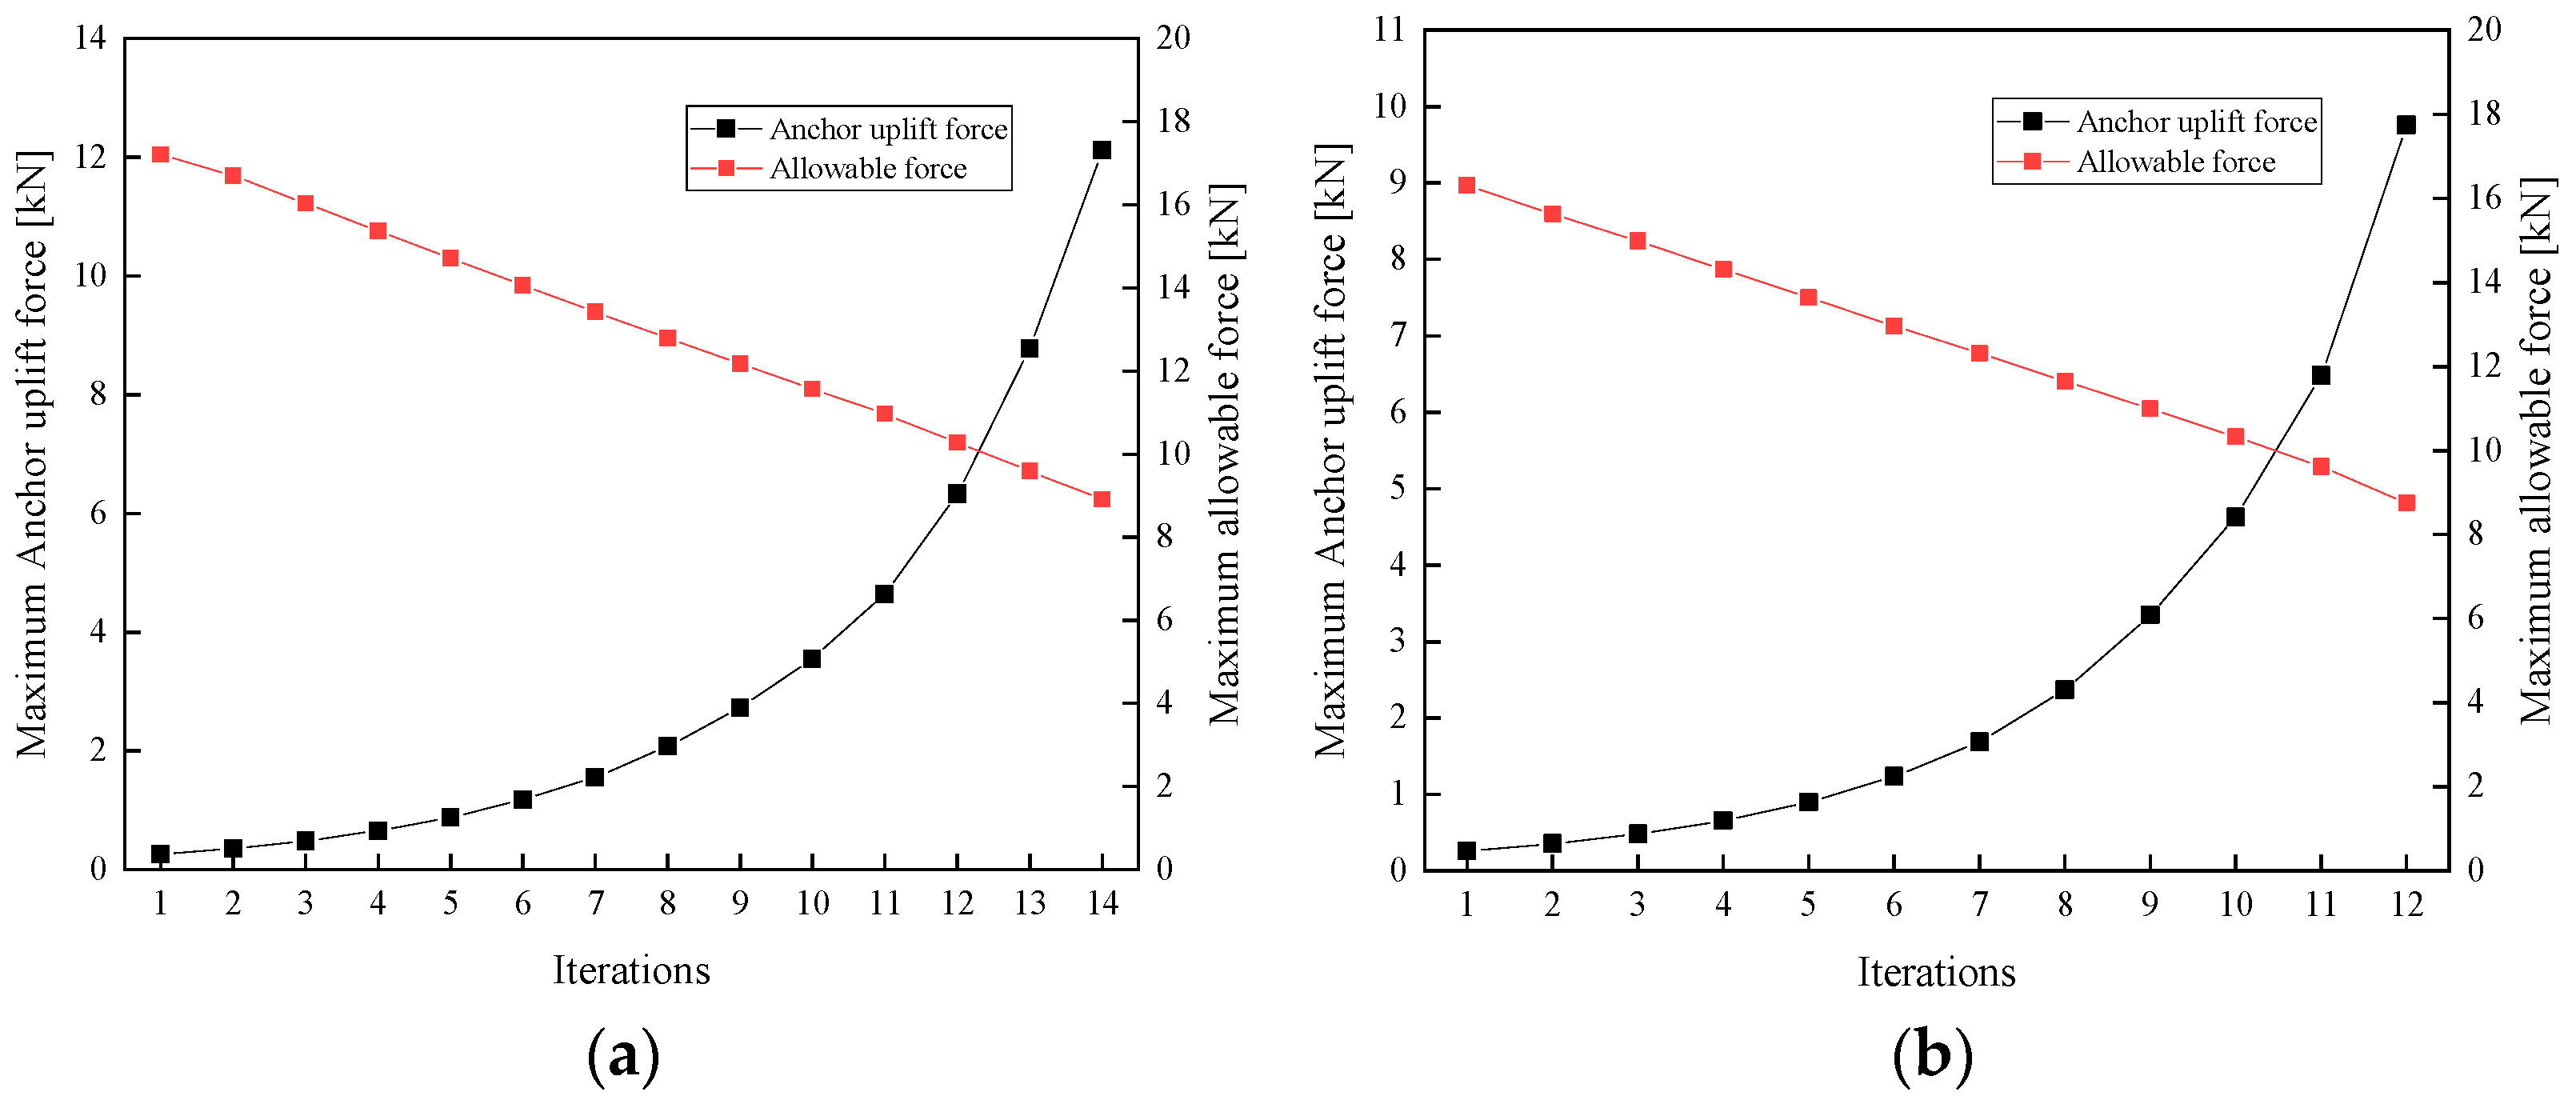
As shown in Figure 8, the optimization result of the anchor point is obtained through many iterations, and the allowable force is calculated using the total gravity of the anchor and the laid mooring line. Considering the cost and safety, the intersection point is taken as the anchor point to optimize the optimal solution. The final mooring lines configuration is shown in Table 9.
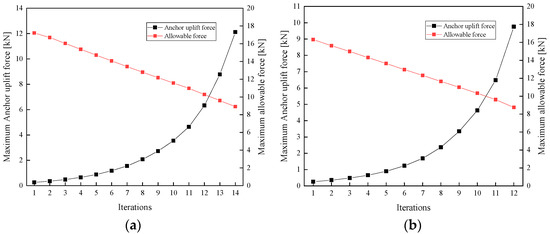
Figure 8.
The optimization iterative process of mooring lines (a) Mooring line 2 (b) Mooring line 3.
Table 9.
The final Mooring configuration.
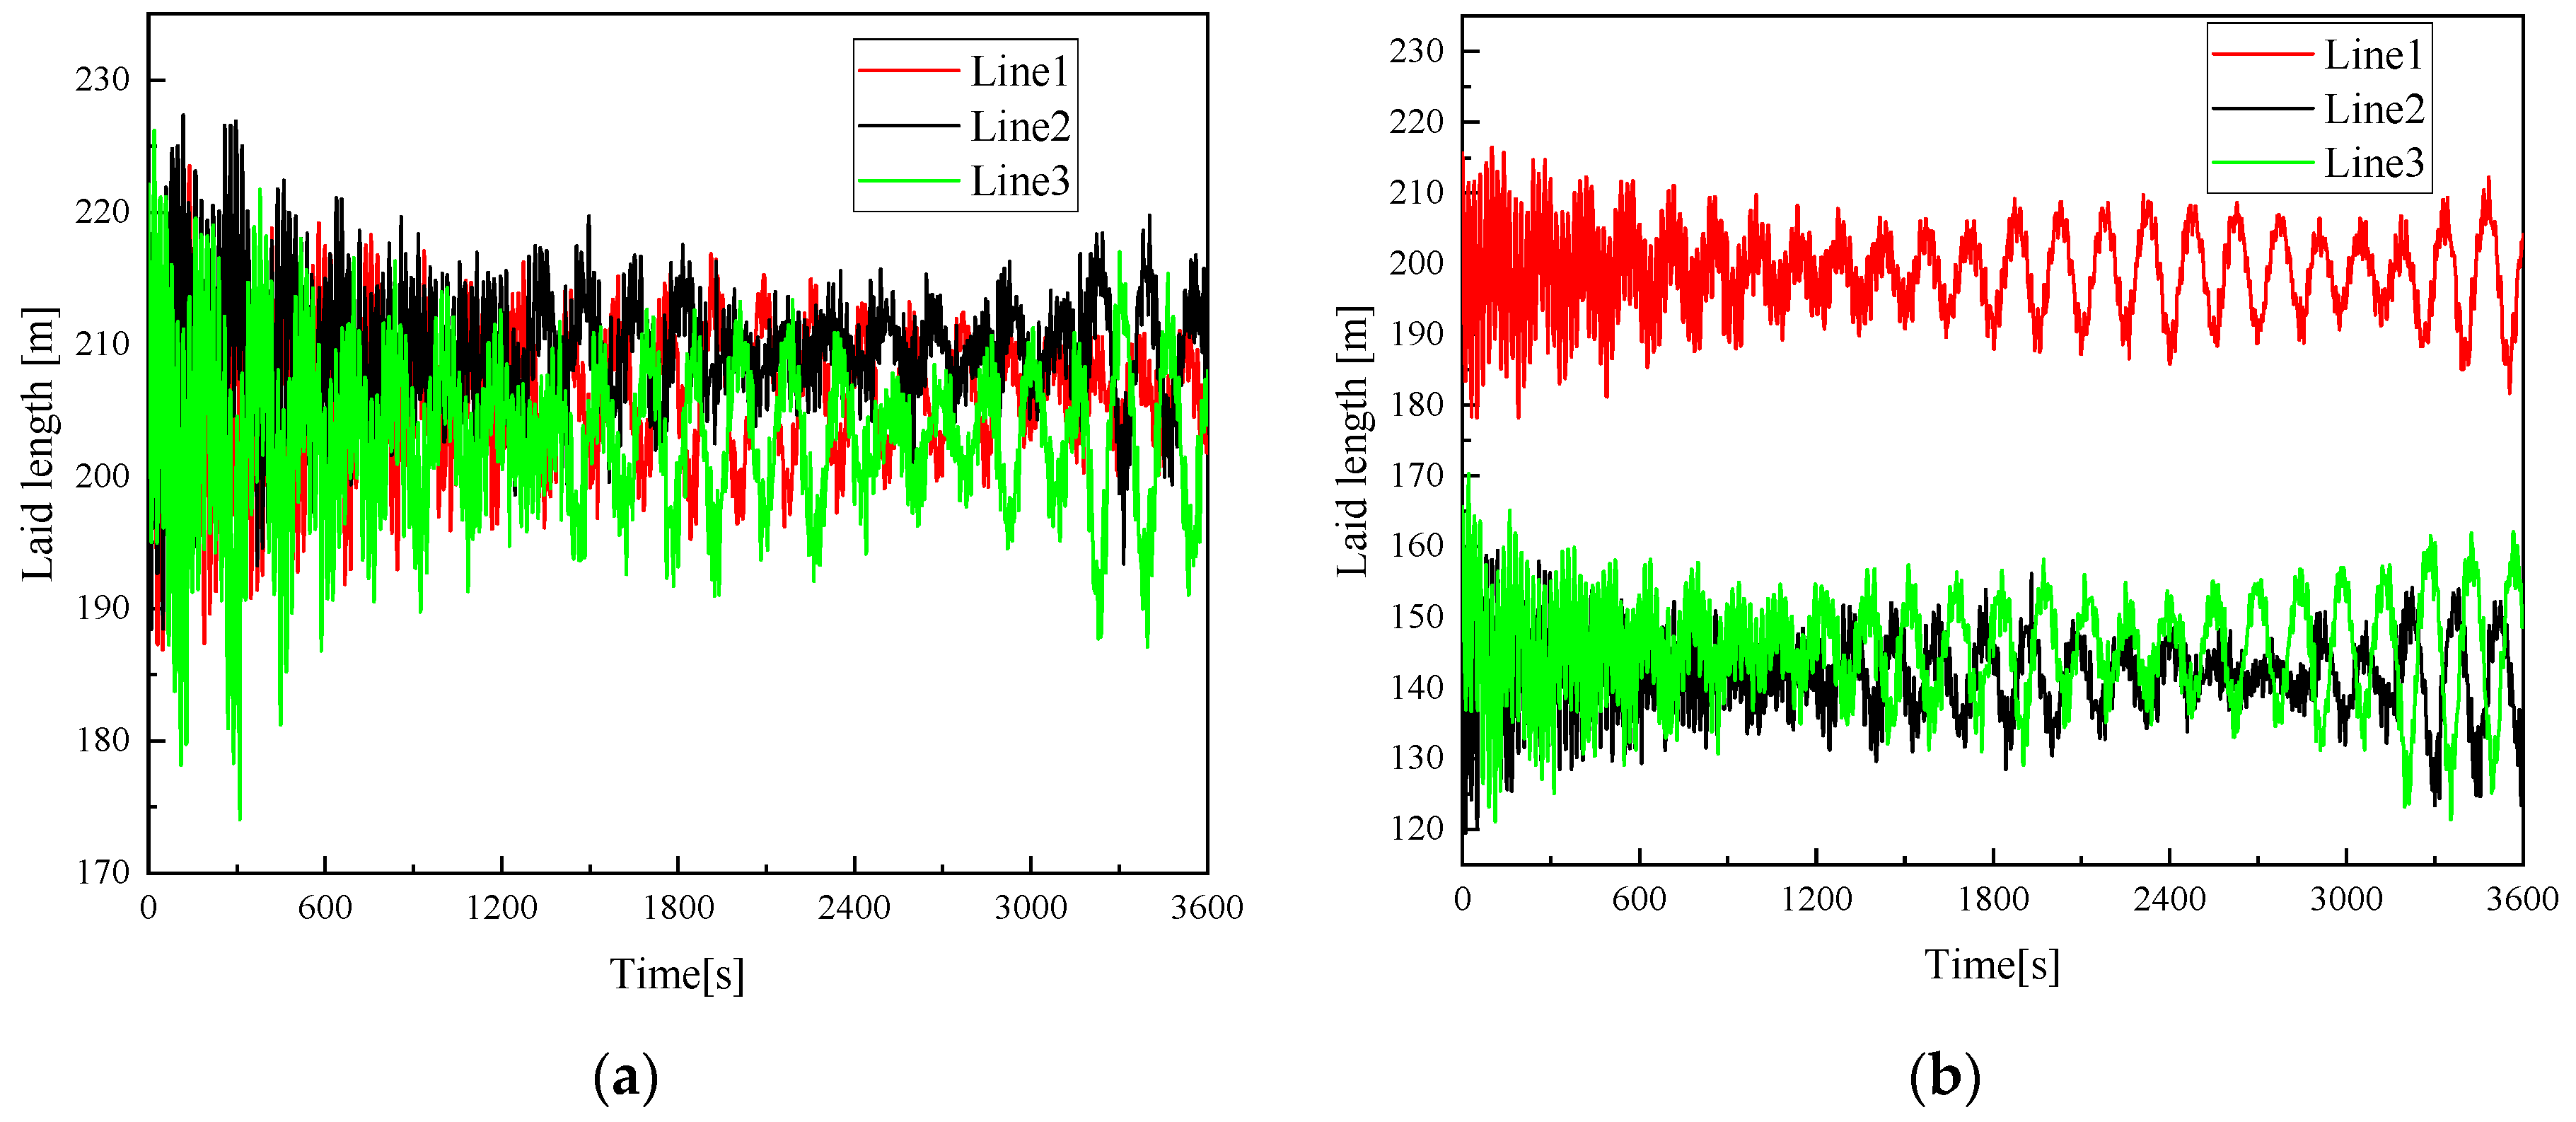
Figure 9 shows the change of the mooring lines laid length with the optimization of the anchor point position. With the change in the total length of mooring line 2 and mooring line 3, the laid length of mooring line 1 was reduced by 10 m due to the greater horizontal tension, while the laid lengths of other mooring lines had little change.

Figure 9.
The laid length of mooring lines (a) Initial laid length (b) Final laid length.
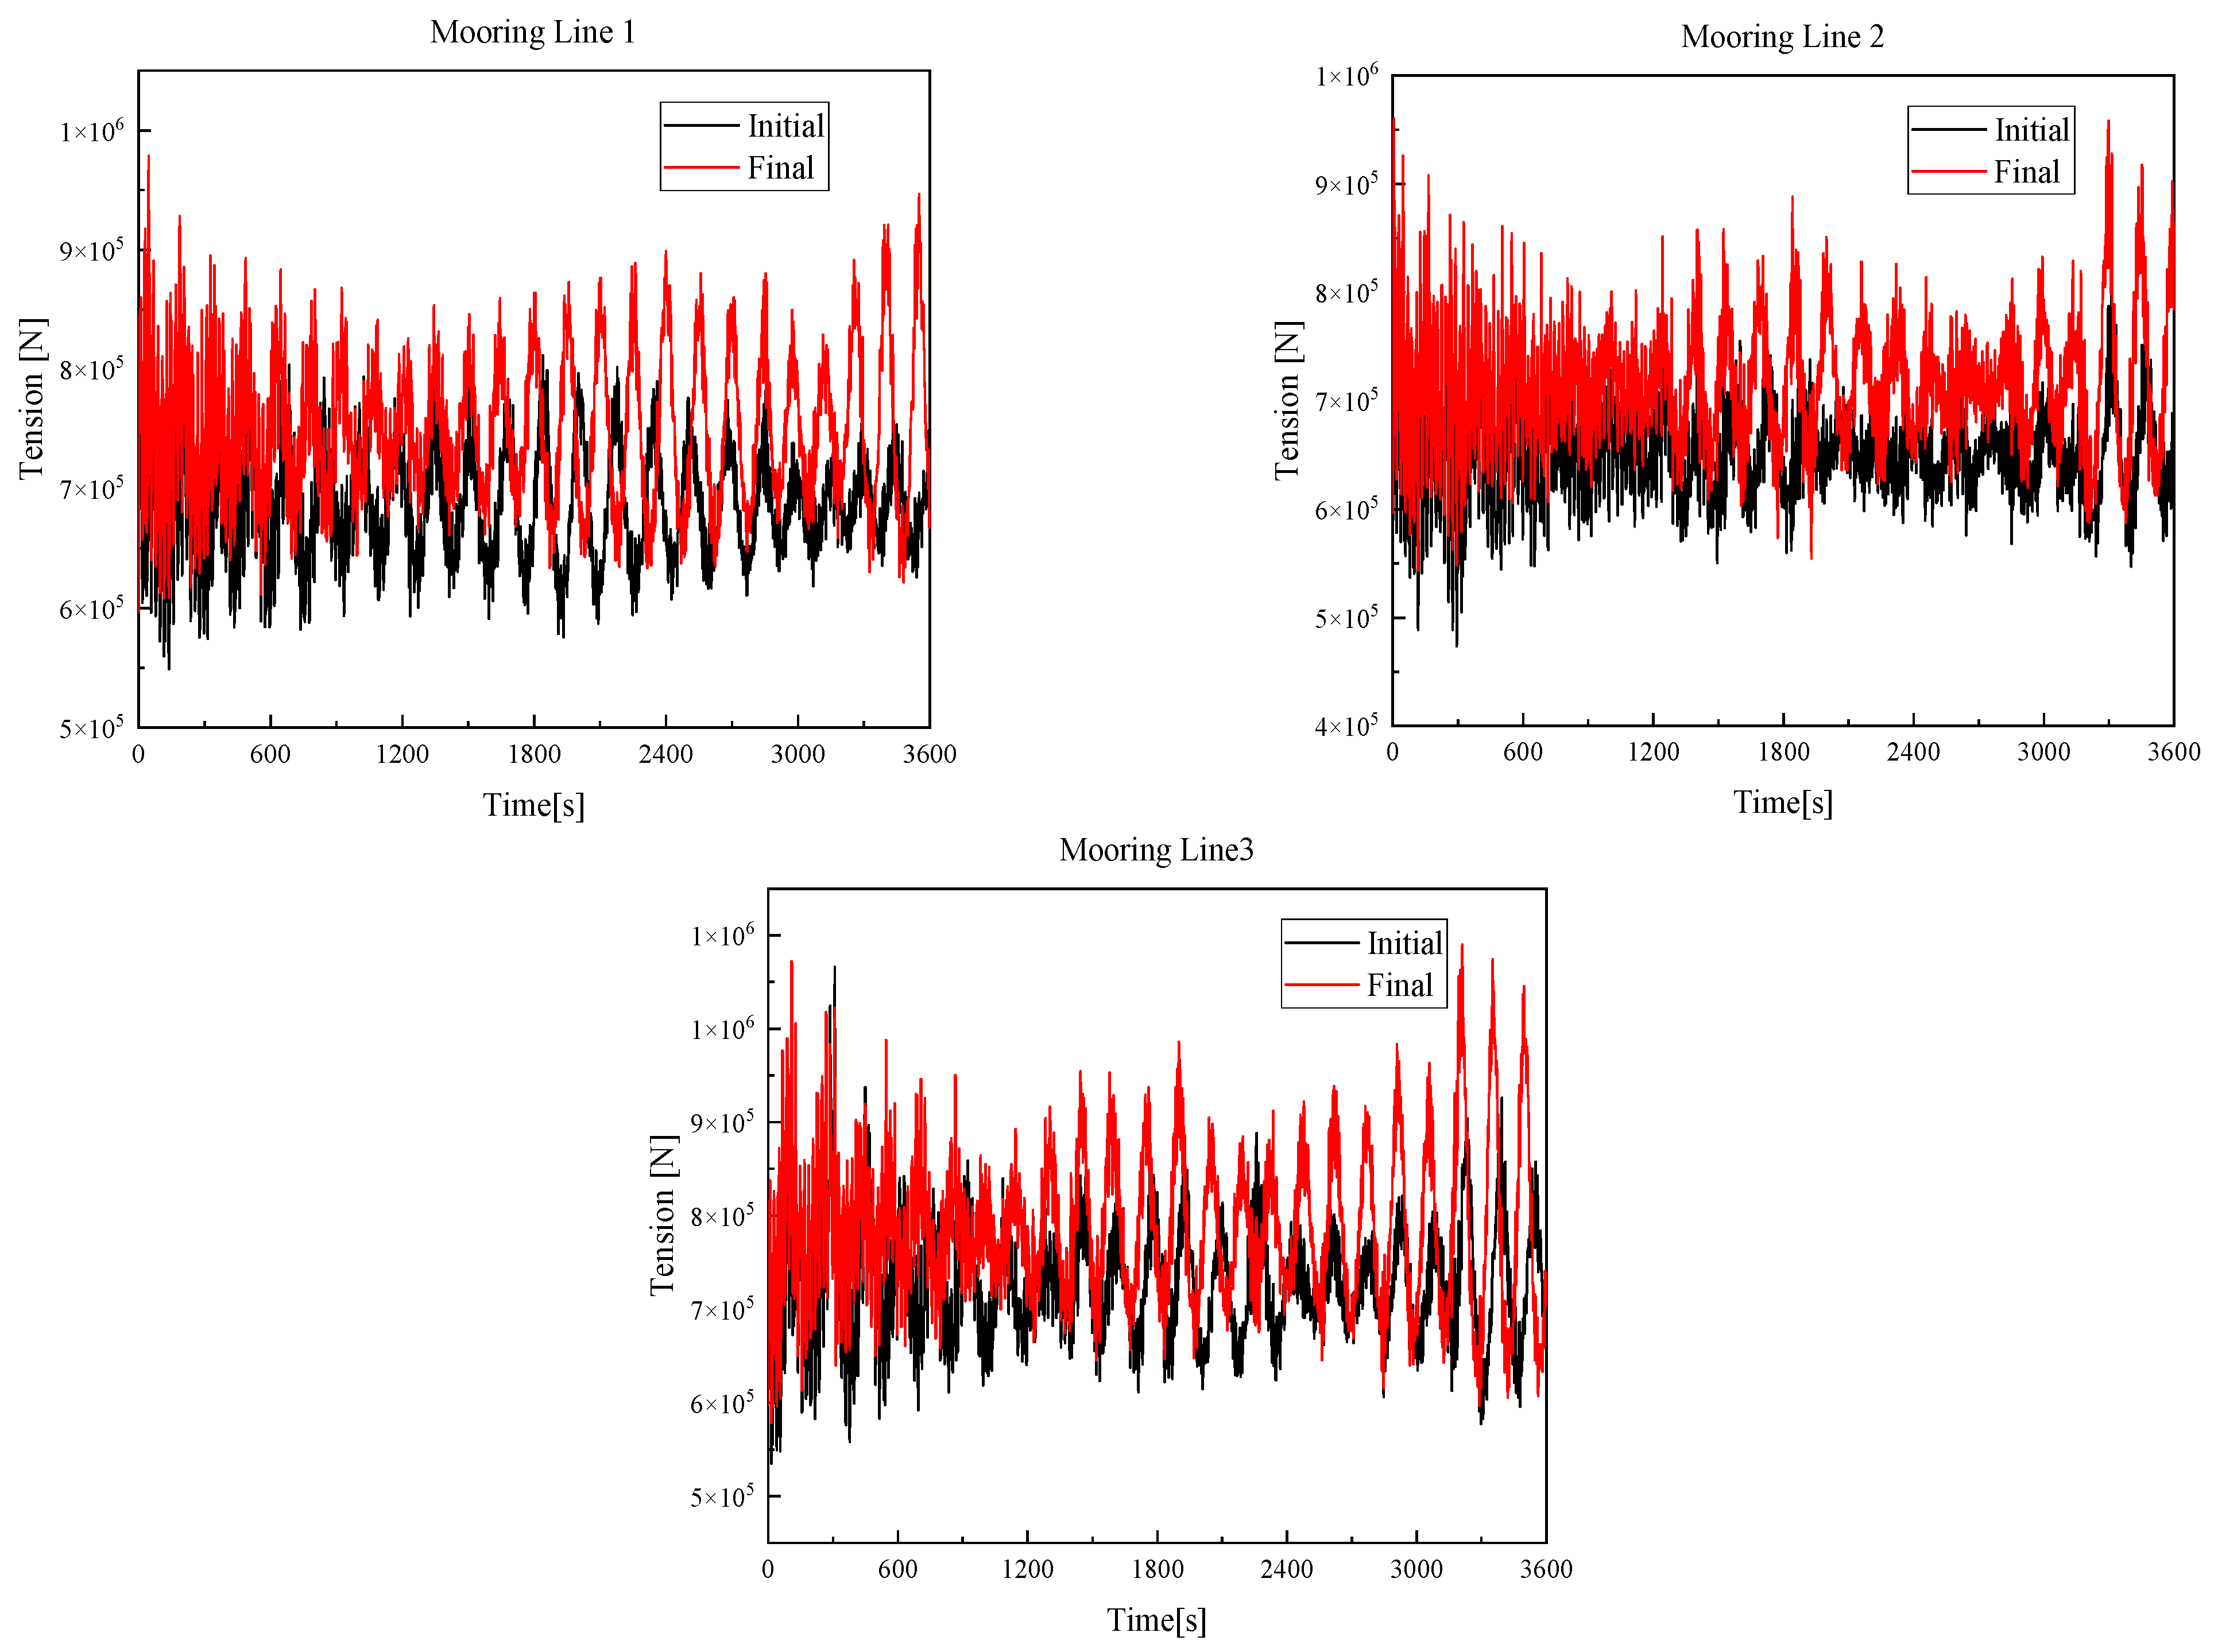
As shown in Figure 10, the mooring line tension increases with the optimization of the mooring anchor point position and the decrease in mooring line length. The previous research shows that when the chain characteristics and pretension of mooring lines remain the same, the shorter mooring lines lead to stronger nonlinearity of mooring resilience and stiffness. The results of this paper are similar [39,40]. In the normal operation of floating wind turbines, the platform motion is required to be less than 5% of the water depth, and the increase in mooring line tension helps to reduce the floating platform motion. In addition, the mooring line tension and the anchor uplift force in the final design of the mooring satisfied the design requirements. The mooring line tension is less than the minimum breaking force of mooring lines, and the anchor uplift force is within a safe range.

Figure 10.
The tension of Moring lines.
4.4. Mooring Optimization—Nominal Diameter
In mooring optimization, three kinds of nominal chain diameter, 152 mm, 185 mm, and 210 mm, are considered to determine the influence of mooring diameter on the ultimate strength and fatigue damage. For different nominal diameters of mooring chain lines, the effective elastic modulus and breaking load can be found in the DNV OS E302 and ISO 20438 [41,42]. Three kinds of mooring lines with studless chain detailed specifications are given in Table 10.
Table 10.
Parameters of the Mooring chain lines.
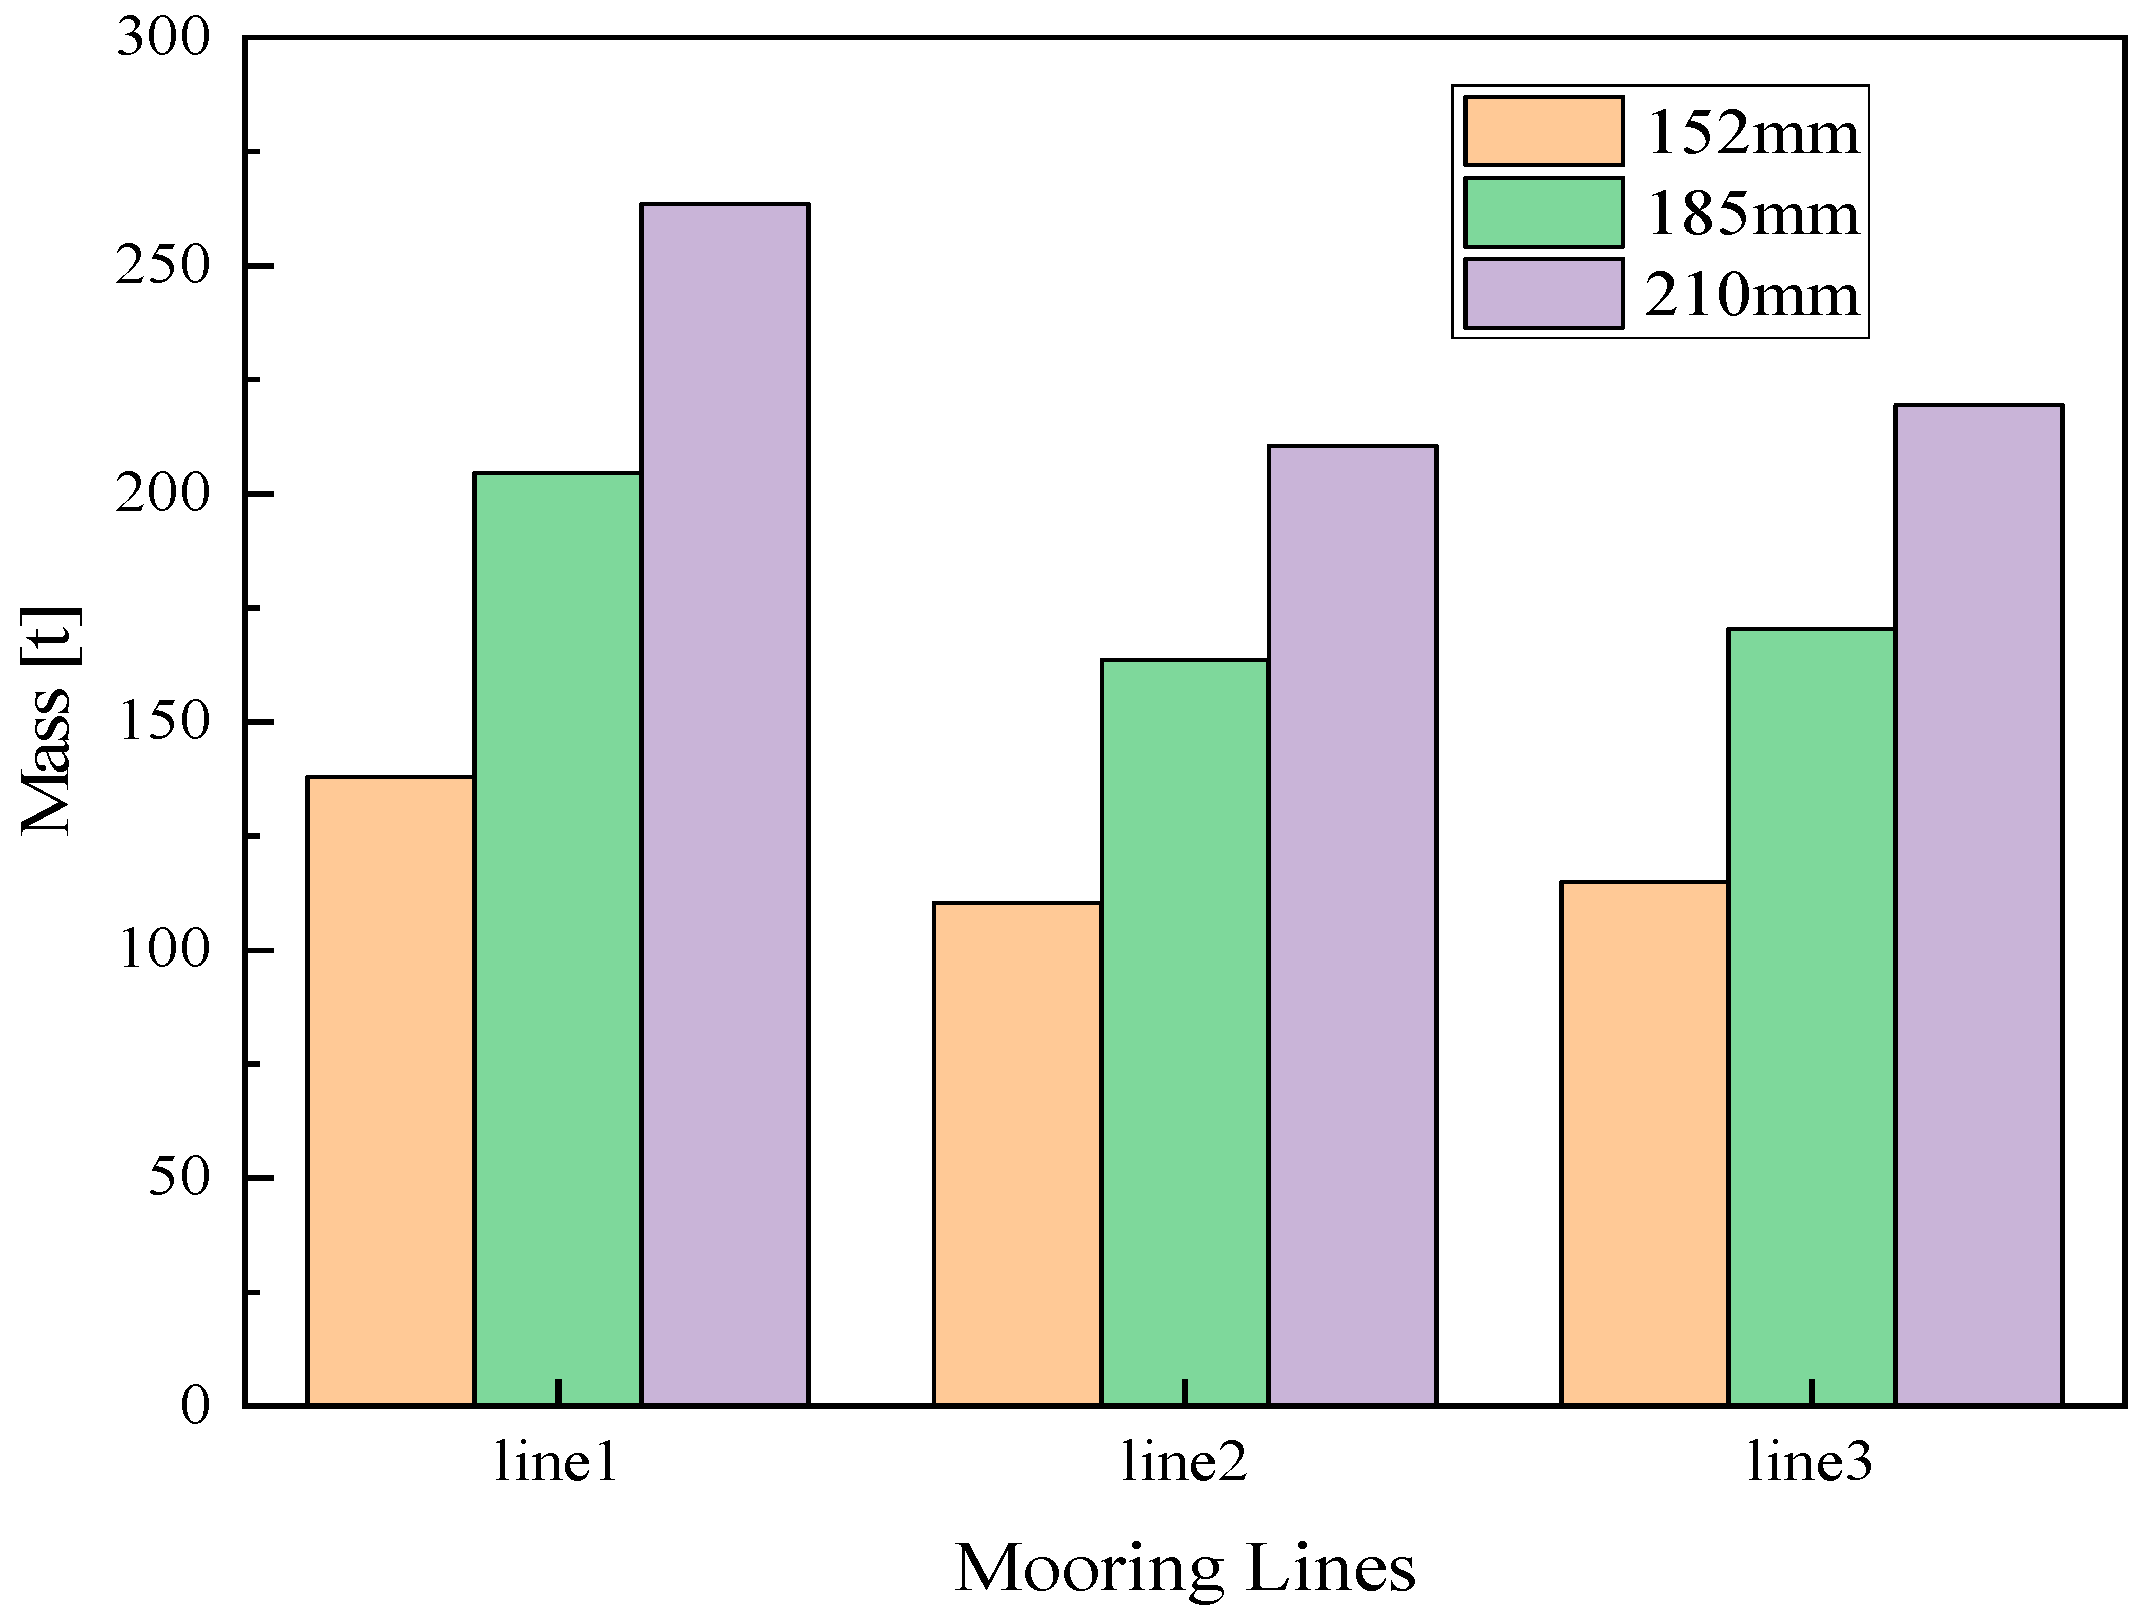
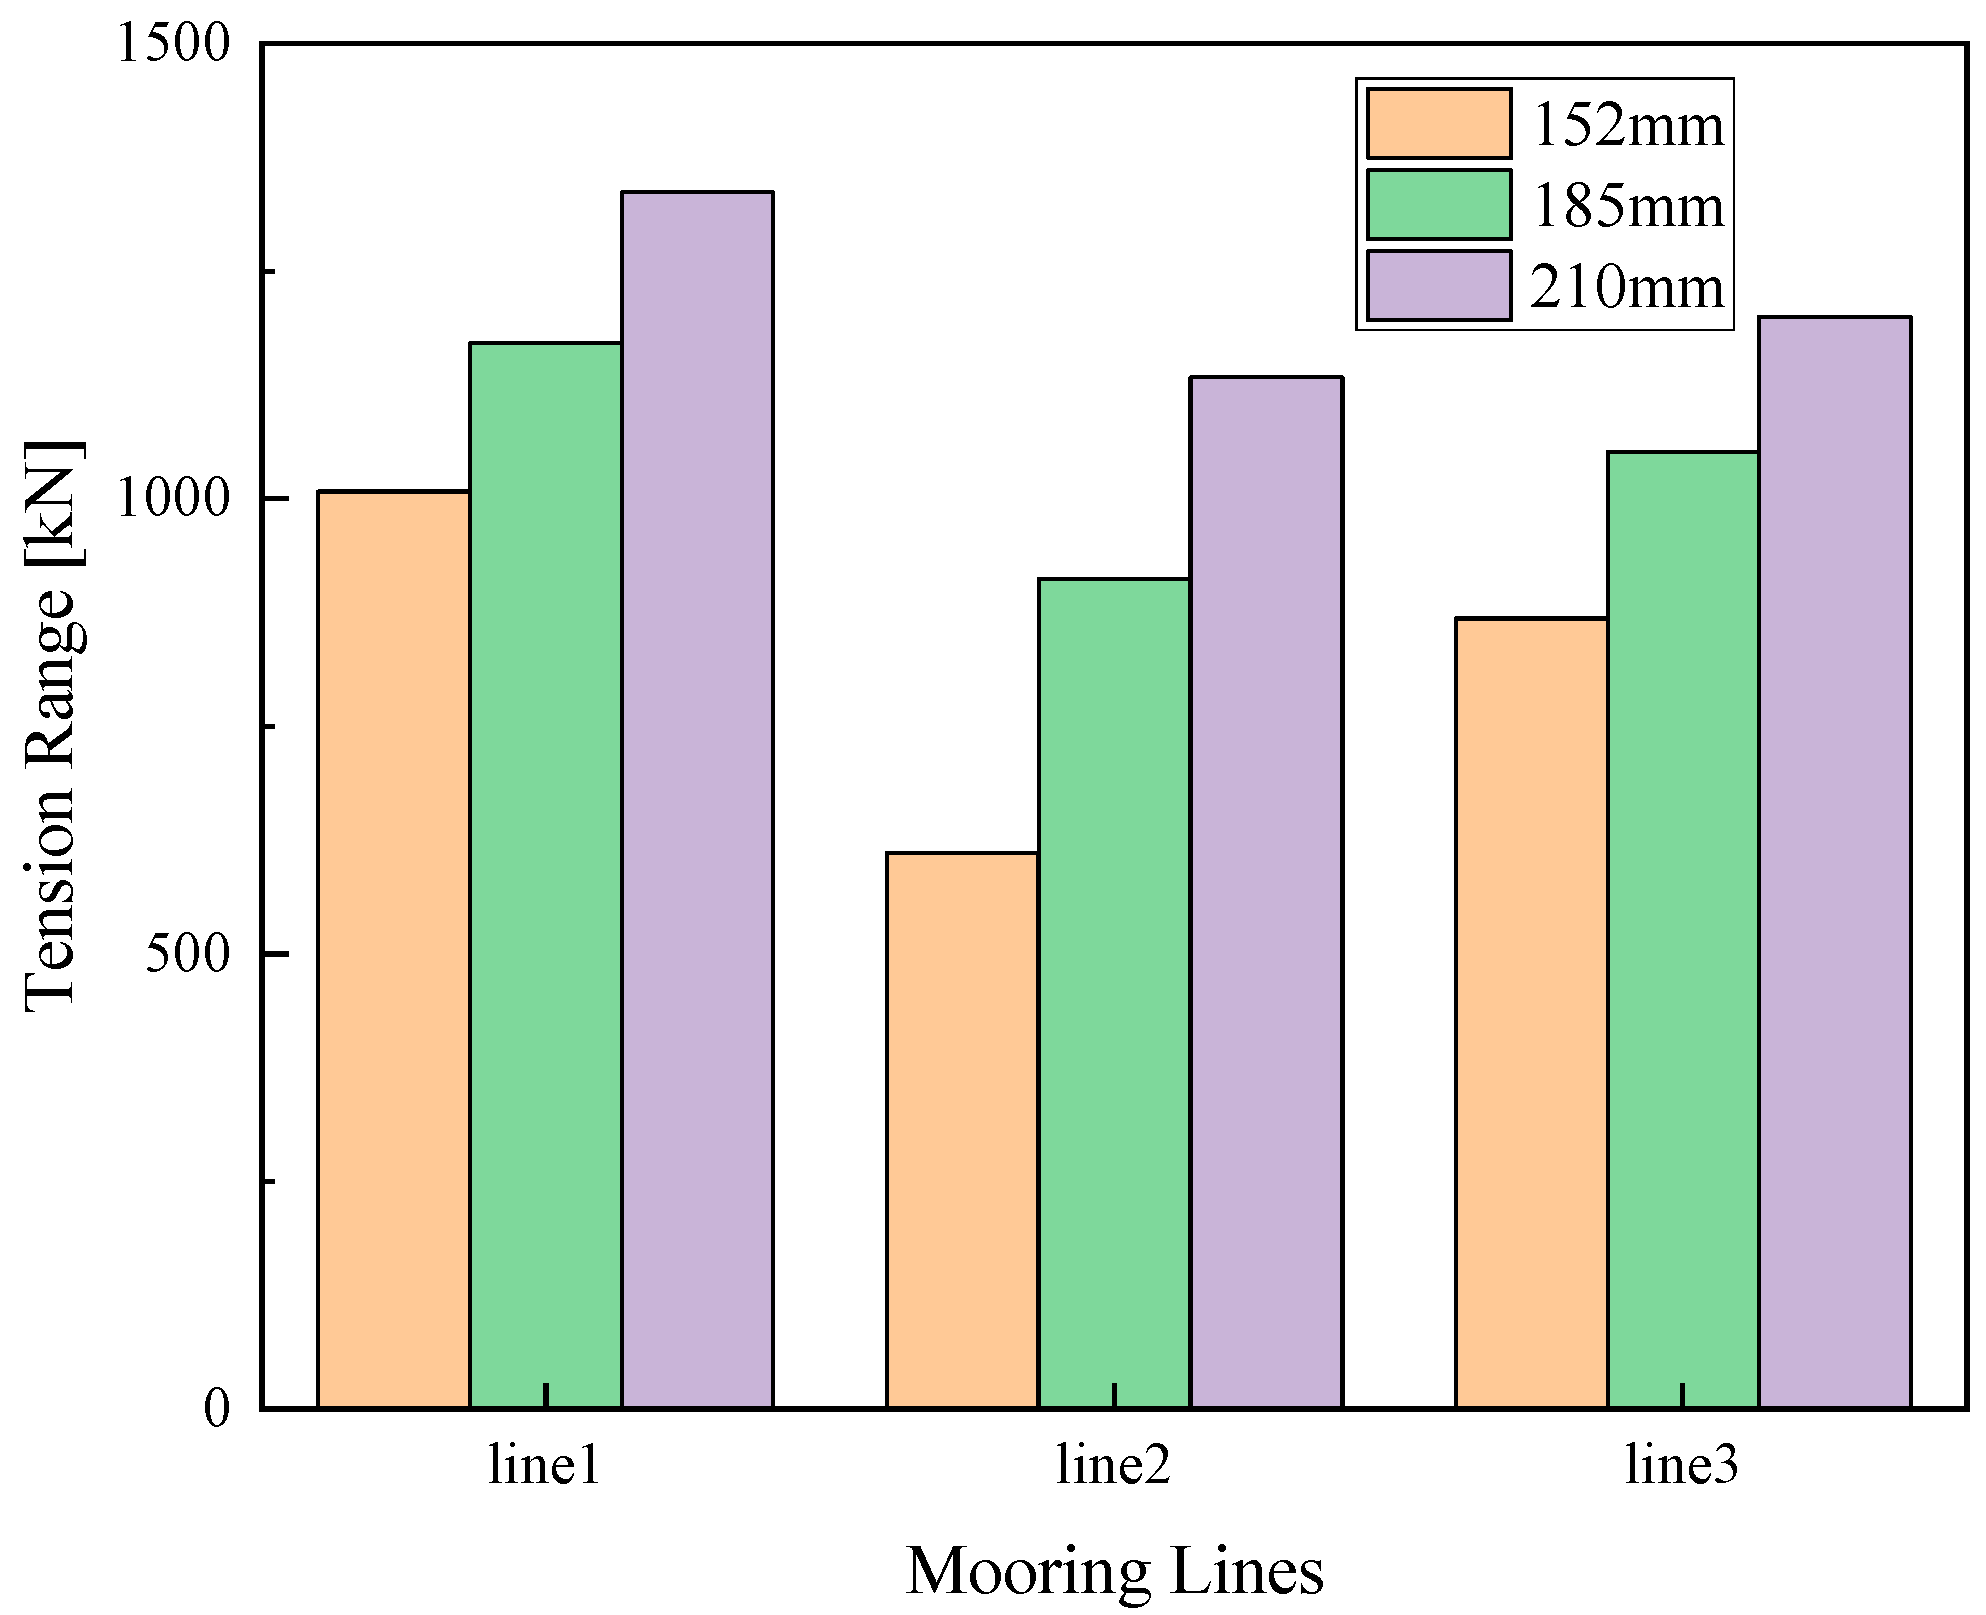
Regarding the nominal diameters of three types of mooring lines, a comparison and examination of total weight and maximum tension at a 100-year return period were conducted. The results are shown in Figure 11 and Figure 12; the total mass and the maximum tension increase with the increase in the chain’s nominal diameter while keeping the chain length unchanged.
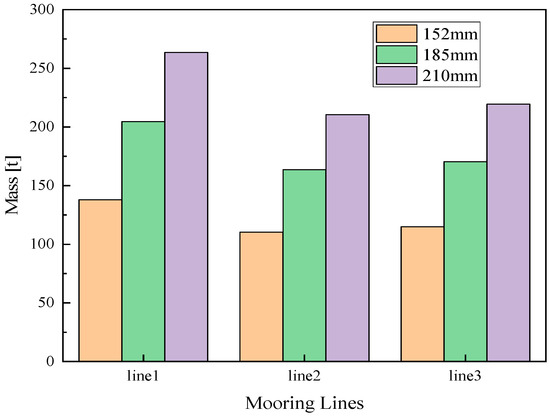
Figure 11.
The total mass of Mooring lines.
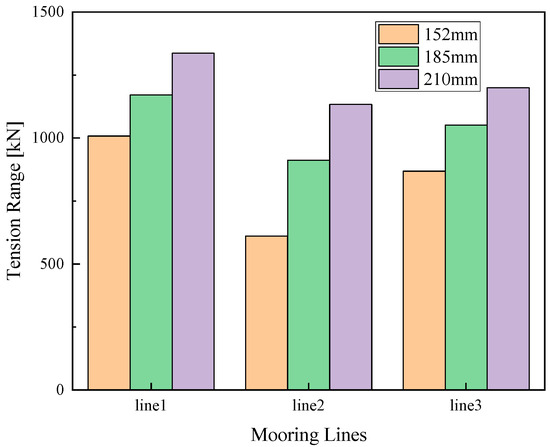
Figure 12.
The 100-year return period maximum tension range.
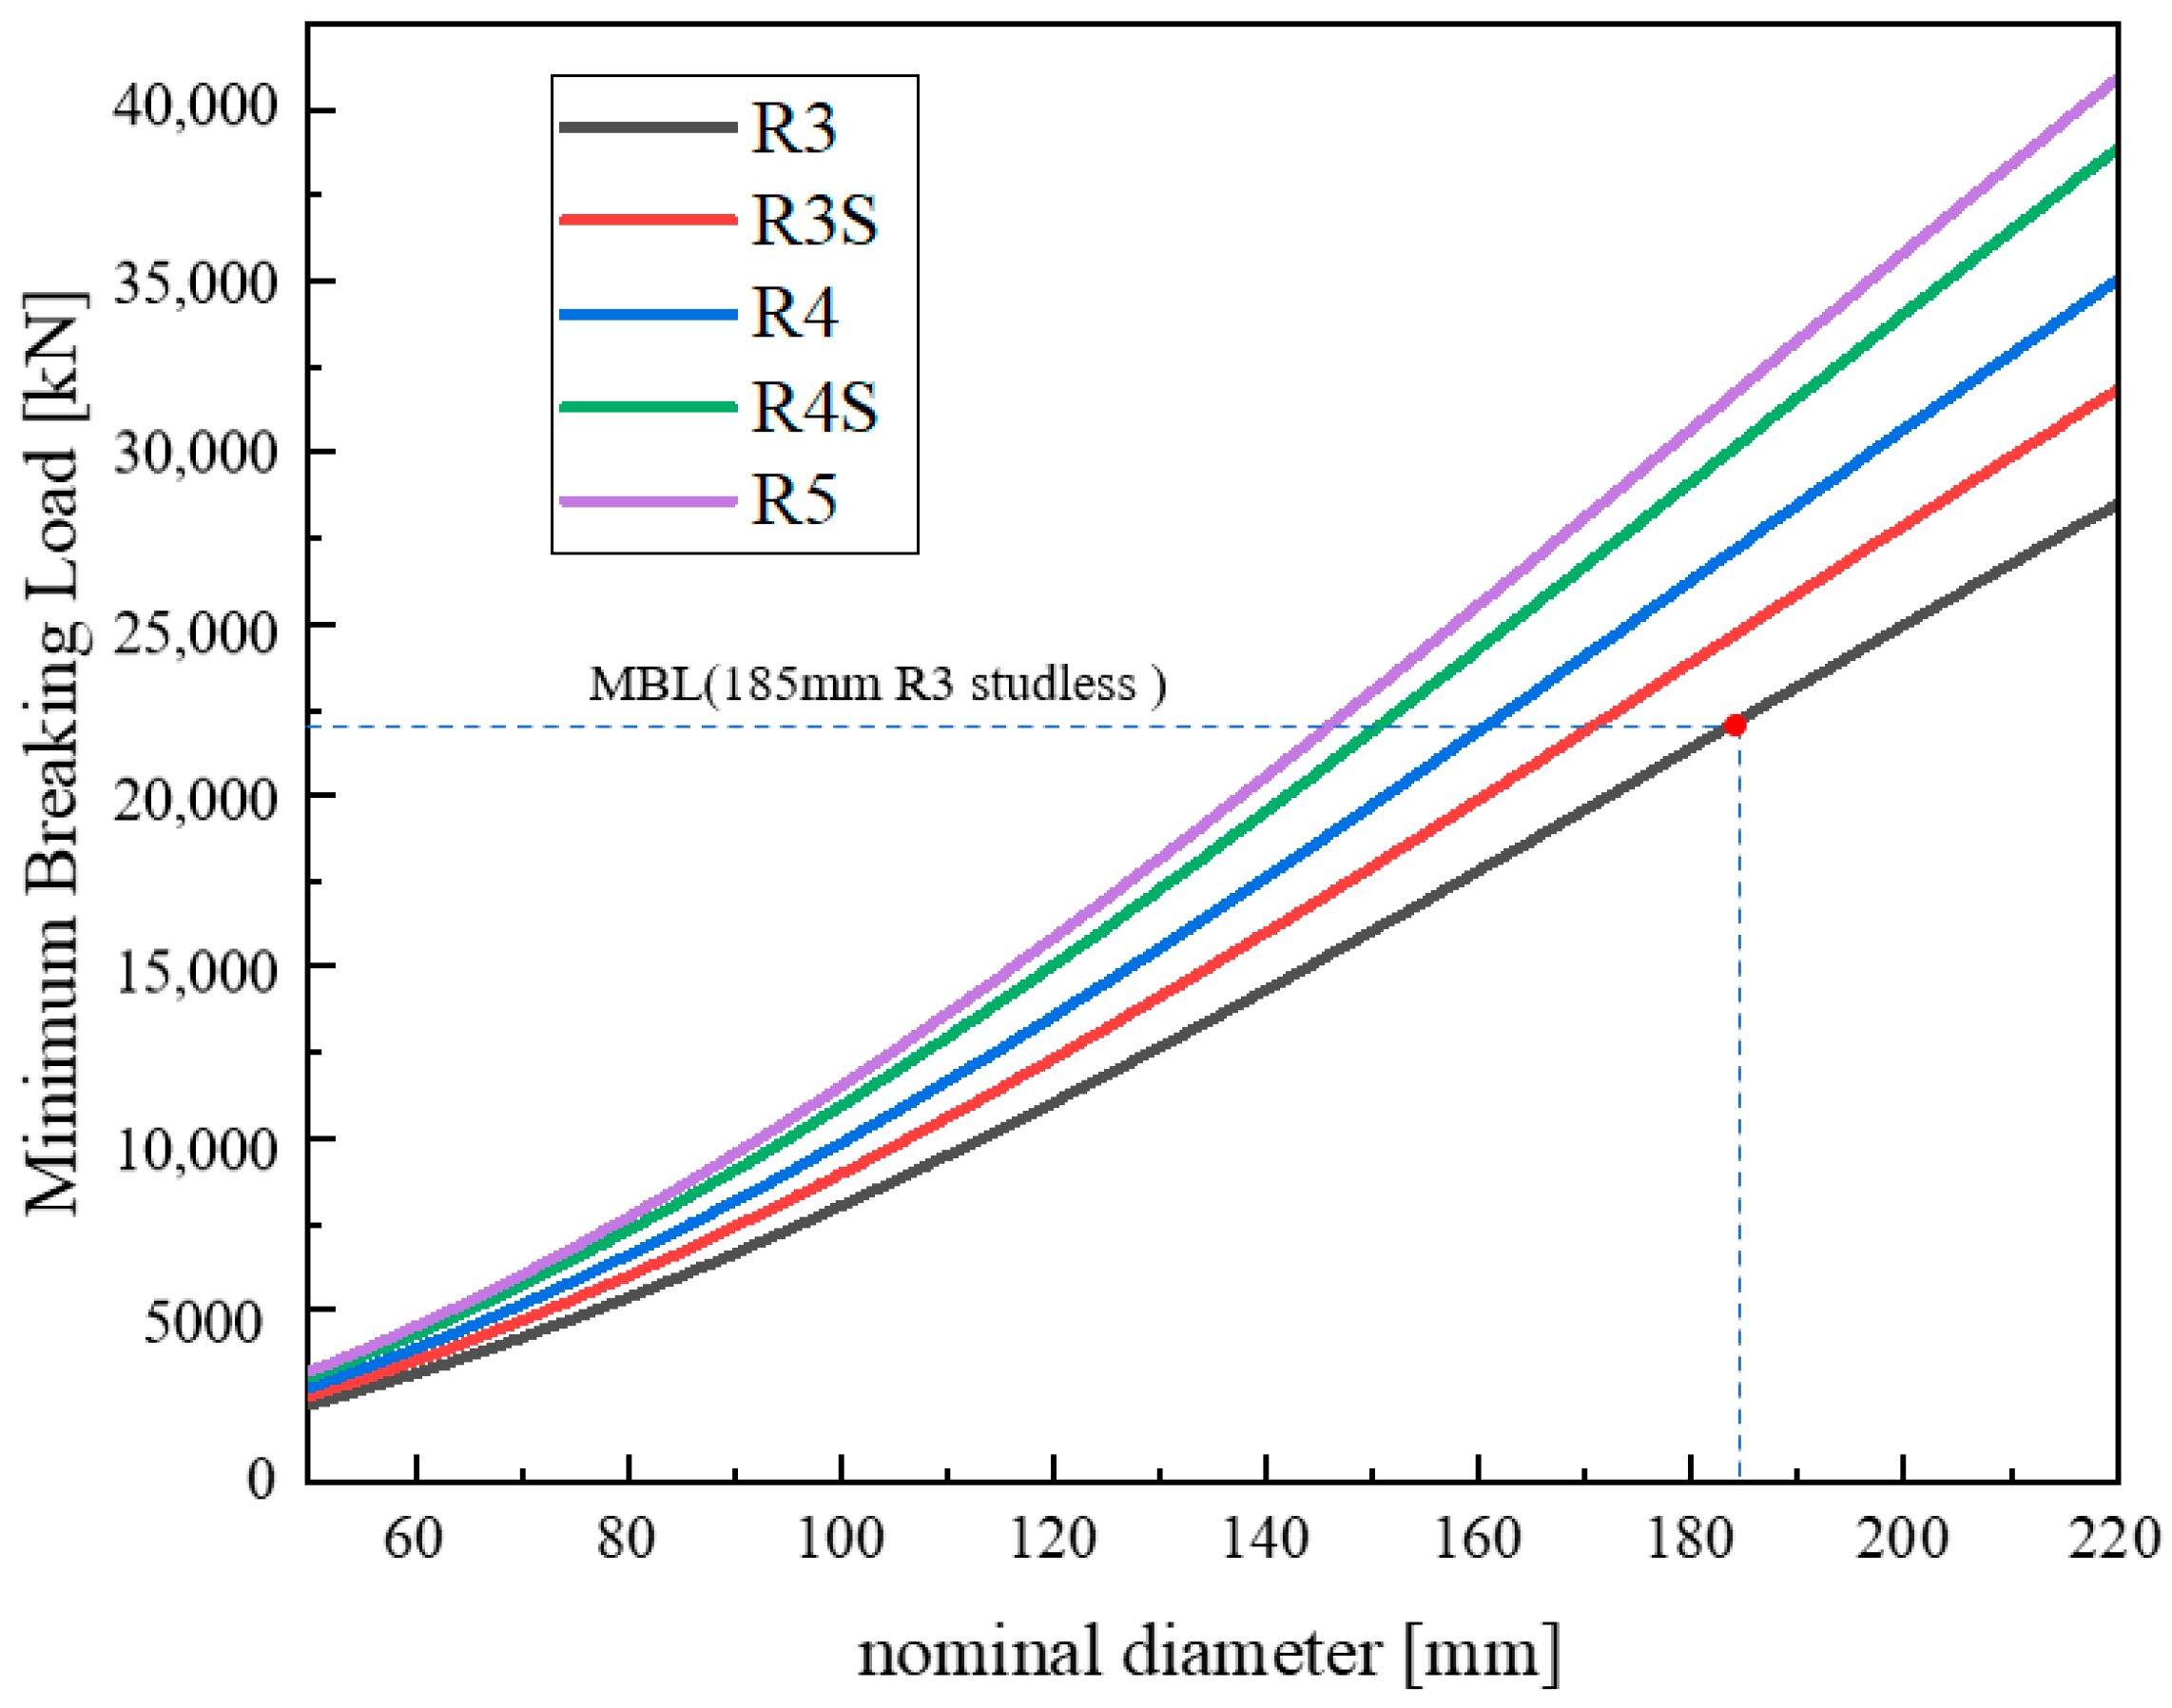
Offshore mooring chains are available in various grades, including R3, R3S, R4, R4S and R5. Out of these grades, R5 offers the highest strength. Figure 13 illustrates the minimum breaking loads (MBL) against chain diameter for studless chains [43]. Keeping the same safety factor, the minimum breaking load of mooring chains of different grades is compared. For ultimate limit state considerations, the R5 grade chain is recommended. Because it is the most economical model, and the nominal diameter of the chain is only 147 mm. In addition, when using the R4S chain, the chain with a nominal diameter greater than 152 mm should be used.
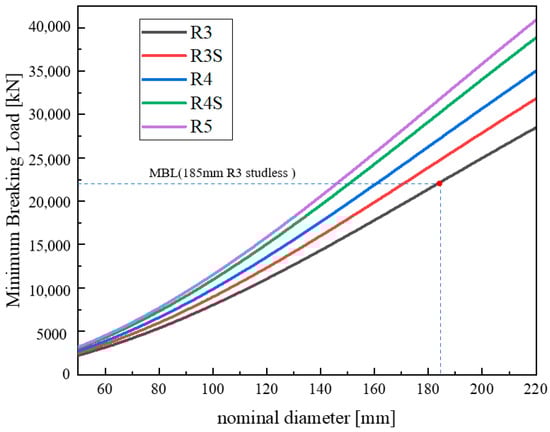
Figure 13.
The minimum breaking load of different nominal diameters.
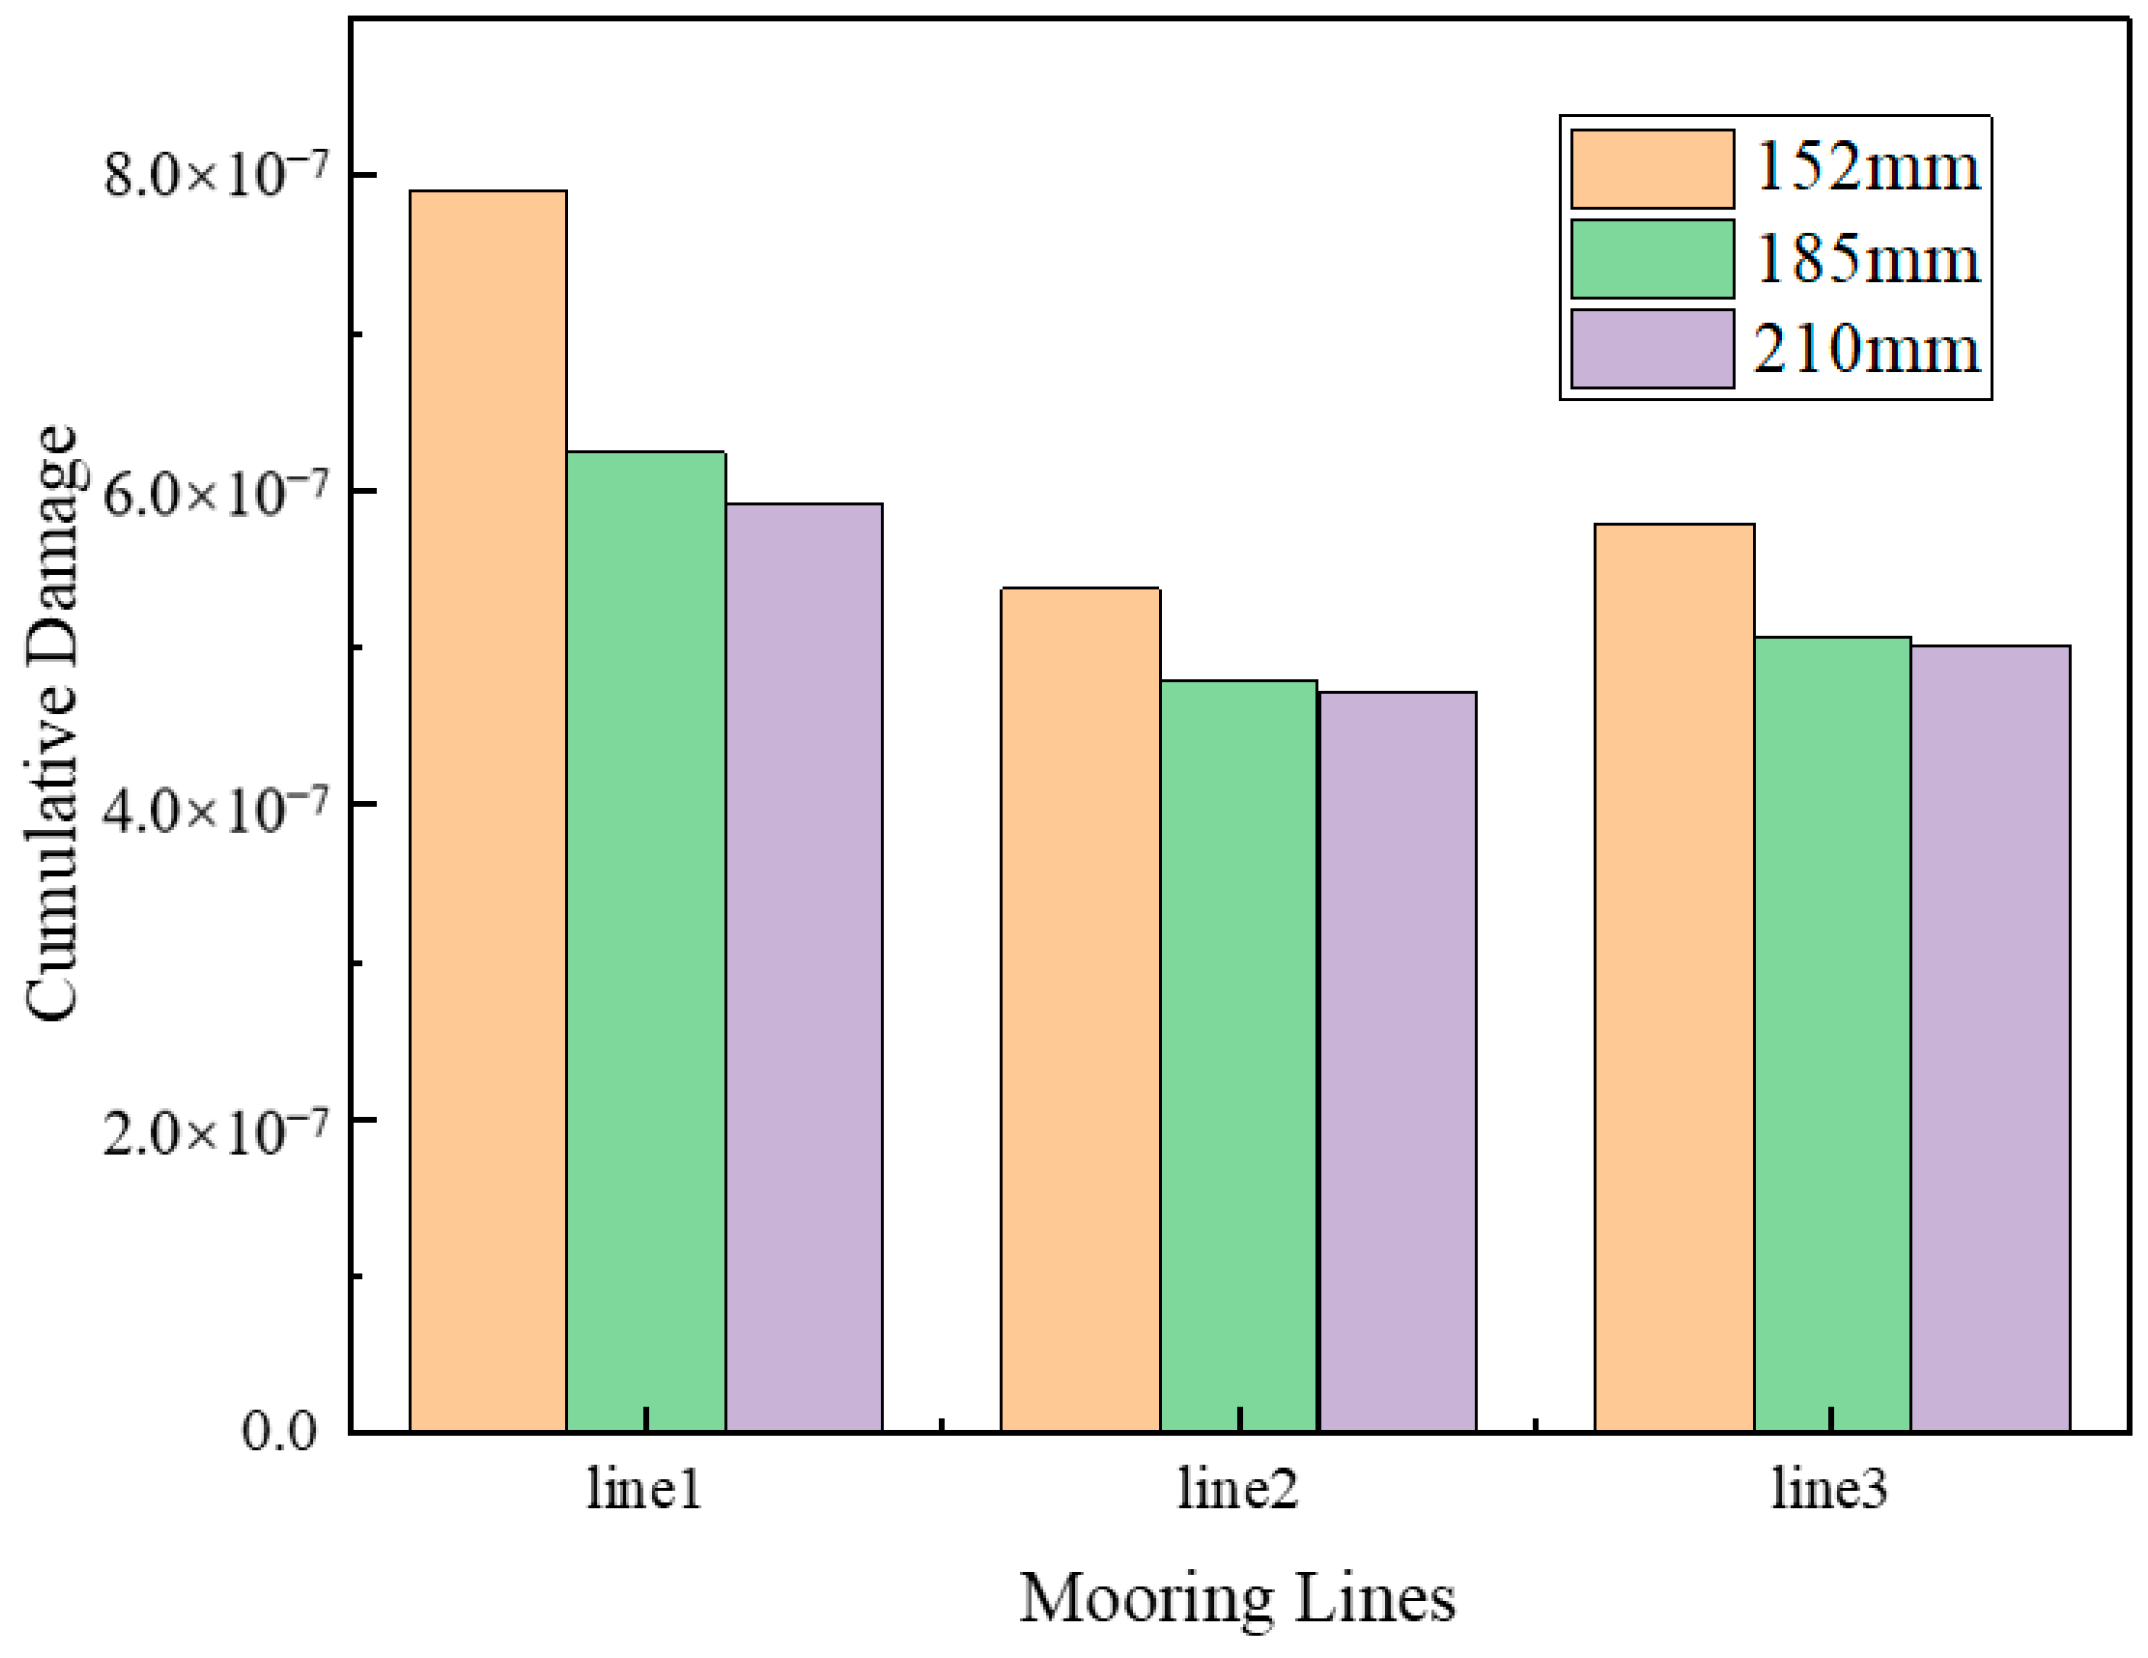
Figure 14 shows that the more the nominal diameter increases, the more cumulative fatigue damage decreases. From the cumulative fatigue damage during the 50 years of life, mooring lines of three kinds of nominal diameter are satisfied with design criteria. Therefore, it is recommended to determine the nominal diameter and grade of the chain from the point of view of fatigue damage.
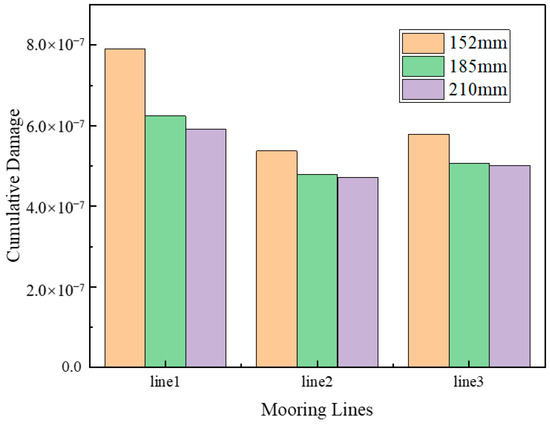
Figure 14.
The cumulative damage for 50 years.
5. Conclusions
In this paper, the wind, wave, and current data in the South China Sea are collected as environmental conditions because the South China Sea has abundant wind energy. IEA 15 MW wind turbine and UMaine VolturnUS-S floating platform are selected as research models, and the accuracy of the model is verified by comparing the hydrodynamic coefficient between AQWA and the technical report. The R3 class studless chain is selected as the design mooring type, and the nominal diameter, anchor uplift force, and total length of the mooring lines are used as the design parameters. Thus, the catenary equation is applied to determine the initial length of mooring lines. Using time domain hydrodynamic analysis, the anchor uplift force at the anchor point under the initial mooring line design will be checked, and the mooring line tension time history will be output on the premise that the anchor uplift force satisfies the design requirements. In the ultimate strength analysis, Weibull distribution is used to predict the maximum tension range in the return period of 100 years, and it is compared with the minimum breaking limit of mooring lines. In the fatigue damage analysis, 50 years of cumulative fatigue is determined using mooring line tension amplitude data, linear cumulative fatigue damage rules, and the S-N curve. Thus, the design and optimization program of floating wind turbine mooring lines suitable for the South China Sea is established.
This paper describes the design, optimization, and safety assessment process of a floating wind turbine mooring system. Based on this research, the influence of aerodynamic load on platform motion and mooring system will be studied using the joint simulation of OPENFAST and AQWA in future research. The combination of floating wind turbines and wave energy is also one of the ways to improve power generation in the future. Many scholars have performed relevant research, but there is little research on mooring [44,45]. In addition, more cost-effective new mooring lines are also within the scope of future research, including fatigue problems of different grades of mooring lines and new mooring materials [46,47,48].
Author Contributions
Conceptualization, C.B.L.; methodology, C.B.L. and Y.J.; software, J.J. and H.Z.; validation, J.J. formal analysis, J.J.; investigation, W.Z. and X.S.; resources, C.B.L. and M.C.; data curation, W.Z. and X.S.; writing—original draft preparation, J.J.; writing—review and editing, M.C. and C.B.L.; supervision, H.Z.; project administration, M.C.; funding acquisition, M.C. All authors have read and agreed to the published version of the manuscript.
Funding
This research was funded by National Natural Science Foundation of China: 52171275.
Institutional Review Board Statement
Not applicable.
Informed Consent Statement
Not applicable.
Data Availability Statement
Data are contained within the article.
Conflicts of Interest
Authors Xinghan Sun and Wei Zhang were employed by the company Powerchina (Xi’an) Port Navigation Shipbuliding Technology Co., Ltd. The remaining authors declare that the research was conducted in the absence of any commercial or financial relationships that could be construed as a potential conflict of interest.
References
- Global Wind Report 2023. Available online: https://gwec.net/globalwindreport2023/ (accessed on 15 July 2023).
- Lantz, E.; Wiser, R.; Hand, M. IEA Wind Task 26 the Past and Future Cost of Wind Energy; Technical Report; National Renewable Energy Lab.(NREL): Golden, CO, USA, 2012. [Google Scholar]
- Chen, M.; Li, C.B.; Lee, J. A Simulation Technique for Monitoring the Real-time Stress Responses of Various Mooring Configurations for Offshore Floating Wind Turbines. Ocean. Eng. 2023, 278, 114366. [Google Scholar] [CrossRef]
- Barrera, C.; Battistella, T.; Guanche, R.; Losada, I.J. Mooring system fatigue analysis of a floating offshore wind turbine. Ocean. Eng. 2020, 195, 106670. [Google Scholar] [CrossRef]
- Li, C.B.; Choung, J. Fatigue damage analysis for a floating offshore wind turbine mooring line using the artificial neural network approach. Ships Offshore Struct. 2017, 12, 288–295. [Google Scholar] [CrossRef]
- Wang, Z.; Qiao, D.; Yan, J.; Tang, G.; Li, B.; Ning, D. A new approach to predict dynamic mooring tension using LSTM neural network based on responses of floating structure. Ocean. Eng. 2022, 249, 110905. [Google Scholar] [CrossRef]
- Campanile, A.; Piscopo, V.; Scamardella, A. Mooring design and selection for floating offshore wind turbines on intermediate and deep water depths. Ocean. Eng. 2018, 148, 349–360. [Google Scholar] [CrossRef]
- Hall, M.; Goupee, A. Validation of a lumped-mass mooring line model with DeepCwind semisubmersible model test data. Ocean. Eng. 2015, 104, 590–603. [Google Scholar] [CrossRef]
- Pillai, A.C.; Gordelier, T.J.; Thies, P.R.; Dormenval, C.; Wray, B.; Parkinson, R.; Johanning, L. Anchor loads for shallow water mooring of a 15 MW floating wind turbine—Part I: Chain catenary moorings for single and shared anchor scenarios. Ocean. Eng. 2022, 266, 111816. [Google Scholar] [CrossRef]
- Pillai, A.C.; Gordelier, T.J.; Thies, P.R.; Cuthill, D.; Johanning, L. Anchor loads for shallow water mooring of a 15 MW floating wind turbine—Part II: Synthetic and novel mooring systems. Ocean. Eng. 2022, 266, 112619. [Google Scholar] [CrossRef]
- Xu, S.; Soares, C.G. Guedes Soares. Experimental investigation on short-term fatigue damage of slack and hybrid mooring for wave energy converters. Ocean Eng. 2019, 195, 106618. [Google Scholar] [CrossRef]
- Ahn, H.; Ha, Y.-J.; Kim, K.-H. Load Evaluation for Tower Design of Large Floating Offshore Wind Turbine System According to Wave Conditions. Energies 2023, 16, 1862. [Google Scholar] [CrossRef]
- Zhao, G.; Zhao, Y.; Dong, S. System reliability analysis of mooring system for floating offshore wind turbine based on environmental contour approach. Ocean. Eng. 2023, 285, 115157. [Google Scholar] [CrossRef]
- Ding, W.-W.; Jiang, J.-Q.; Yue, W.-Z.; Li, Y.-Z.; Wang, W.-S.; Sheng, S.-W.; Chen, M. Numerical Study on Hydrodynamic Performance of a New Semi-Submersible Aquaculture Platform. Appl. Sci. 2023, 13, 12652. [Google Scholar] [CrossRef]
- Trubat, P.; Molins, C.; Gironella, X. Wave hydrodynamic forces over mooring lines on floating offshore wind turbines. Ocean. Eng. 2020, 195, 106730. [Google Scholar] [CrossRef]
- Chueh, C.-J.; Chien, C.-H.; Lin, C.; Lin, T.-Y.; Chiang, M.-H. Dynamic Co-Simulation Analysis and Control of an IEA 15MW Offshore Floating Semi-Submersible Wind Turbine under Offshore Wind-Farm Conditions of Wind and Wave. J. Mar. Sci. Eng. 2023, 11, 173. [Google Scholar] [CrossRef]
- Mazarakos, T.P. Wind Energy Calculations of a 15 MW Floating Wind Turbine System in the Mediterranean Sea. Environ. Sci. Proc. 2023, 26, 191. [Google Scholar] [CrossRef]
- Benassai, G.; Campanile, A.; Piscopo, V.; Scamardella, A. Mooring control of semi-submersible structures for wind turbines. Procedia Eng. 2014, 70, 132–141. [Google Scholar] [CrossRef]
- Chen, M.; Zhou, H.; Li, C.B. Fully Coupled Dynamic Analysis of the OO-STAR Floating Wind Turbine in Different Water Depths. In Proceedings of the 2022 ISOPE International Ocean and Polar Engineering Conference, Shanghai, China, 6–10 June 2022. [Google Scholar]
- Kim, H.; Jeon, G.-Y.; Choung, J. A Study on Mooring System Design of Floating Offshore Wind Turbine in Jeju Offshore Area. Int. J. Ocean. Syst. Eng. 2013, 3, 209–217. [Google Scholar] [CrossRef]
- Li, C.B.; Chen, M.; Choung, J. The Quasi-Static Response of Moored Floating Structures Based on Minimization of Mechanical Energy. J. Mar. Sci. Eng. 2021, 9, 960. [Google Scholar] [CrossRef]
- ANSYS Inc. ANSYS AQWA Theory Manual; ANSYS Inc.: Canonsburg, PA, USA, 2023. [Google Scholar]
- Zhao, Y.; Liao, Z.; Dong, S. Estimation of characteristic extreme response for mooring system in a complex ocean environment. Ocean. Eng. 2021, 225, 108809. [Google Scholar] [CrossRef]
- Kebir, T.; Correia, J.; Benguediab, M.; Jesus, A.M.P.D. Numerical study of fatigue damage under random loading using rainflow cycle counting. Int. J. Struct. Integr. 2021, 12, 149–162. [Google Scholar] [CrossRef]
- Yang, Y.; Bashir, M.; Wang, J.; Michailides, C.; Loughney, S.; Armin, M.; Hernández, S.; Urbano, J.; Li, C. Wind-wave coupling effects on the fatigue damage of tendons for a 10 MW multi-body floating wind turbine. Ocean. Eng. 2020, 217, 107909. [Google Scholar] [CrossRef]
- Milne, I.; Ritchie, R.O.; Karihaloo, B.L. (Eds.) Comprehensive Structural Integrity: Cyclic Loading and Fatigue. Elsevier: Amsterdam, The Netherlands, 2003; Volume 4. [Google Scholar]
- Low, Y.M. Extending a time/frequency domain hybrid method for riser fatigue analysis. Appl. Ocean. Res. 2011, 33, 79–87. [Google Scholar] [CrossRef]
- Du, J.; Wang, H.; Wang, S.; Song, X.; Wang, J.; Chang, A. Fatigue damage assessment of mooring lines under the effect of wave climate change and marine corrosion. Ocean. Eng. 2020, 206, 107303. [Google Scholar] [CrossRef]
- Gaertner, E.; Rinker, J.; Sethuraman, L.; Zahle, F.; Anderson, B.; Barter, G.; Abbas, N.; Meng, F.; Bortolotti, P.; Skrzypinski, W.; et al. Definition of the IEA Wind 15-Megsestt Offshore Reference Wind Turbine. 2020, Technical Report. Available online: https://www.nrel.gov/docs/fy20osti/75698.pdf (accessed on 15 July 2023).
- Allen, C.; Viscelli, A.; Dagher, H.; Goupee, A.; Gaertner, E.; Abbas, N.; Hall, M.; Barter, G. Definition of the UMaine VolturnUS-S Reference Platform Developed for the IEA Wind 15Megawatt Offshore Reference Wind Turbine; 2020 Technical Report; National Renewable Energy Lab.(NREL): Golden, CO, USA, 2020. [Google Scholar]
- DNV. Offshore Standard DNV_OS_E301, Position Mooring; DNV: Bærum, Norway, 2010. [Google Scholar]
- Hazelton, M. Blyth Offshore Demonstration Project Phase 2—Supporting Environmental Information Blyth Offshore Demonstrator Phase 2 Works 1 Document Control, 2020, Technical Report, EDF Renewables. Available online: https://www.edf-re.uk/ (accessed on 18 December 2023).
- Connolly, P.; Hall, M. Comparison of pilot-scale floating offshore wind farms with shared moorings. Ocean. Eng. 2019, 171, 172–180. [Google Scholar] [CrossRef]
- Guo, Y.; Wang, H.; Lian, J. Review of integrated installation technologies for offshore wind turbines: Current progress and future development trends. Energy Convers. Manag. 2022, 255, 115319. [Google Scholar] [CrossRef]
- Hsu, W.-T.; Thiagarajan, K.P.; Manuel, L. Extreme mooring tensions due to snap loads on a floating offshore wind turbine system. Mar. Struct. 2017, 55, 182–199. [Google Scholar] [CrossRef]
- Chen, M.; Ouyang, M.; Li, T.; Zou, M.; Ye, J.; Tian, X. Numerical modelling of a catamaran float-over deck installation for a spar platform with complex hydrodynamic interactions and mechanical couplings. Ocean. Eng. 2023, 287, 115905. [Google Scholar] [CrossRef]
- Wang, Z.; Zhou, L.; Dong, S.; Wu, L.; Li, Z.; Mou, L.; Wang, A. Wind wave characteristics and engineering environment of the South China Sea. J. Ocean. Univ. China 2014, 13, 893–900. [Google Scholar] [CrossRef]
- Chen, M.; Zou, M.; Zhu, L.; Ouyang, M.; Liang, Q.; Zhao, W. A Fully Coupled Time Domain Model Capturing Nonlinear Dynamics of Float-over Deck Installation. Available at SSRN 4583209. Available online: https://papers.ssrn.com/sol3/papers.cfm?abstract_id=4583209 (accessed on 18 December 2023).
- Yan, X.; Chen, C.; Yin, G.; Ong, M.C.; Ma, Y.; Fan, T. Numerical investigations on nonlinear effects of catenary mooring systems for a 10-MW FOWT in shallow water. Ocean. Eng. 2023, 276, 114207. [Google Scholar] [CrossRef]
- Ghafari, H.; Dardel, M. Parametric study of catenary mooring system on the dynamic response of the semi-submersible platform. Ocean. Eng. 2018, 153, 319–332. [Google Scholar] [CrossRef]
- DNV-OS-E302; Offshore Mooring Chain. DNV: Bærum, Norway, 2022.
- ISO20438; Ships and Marine Technology—Offshore Mooring Chains. ISO International Standards: Geneva, Switzerland, 2018.
- Ma, K.-T.; Luo, Y.; Kwan, T.; Wu, Y. Mooring System Engineering for Offshore Structures; Gulf Professional Publishing: Houston, TX, USA, 2019. [Google Scholar]
- Chen, M.; Ren, W.; Xiao, P.; Zhu, L.; Li, F.; Sun, L. Numerical analysis of a floating semi-submersible wind turbine integrated with a point absorber wave energy convertor. In Proceedings of the Thirtieth International Ocean and Polar, Virtual, 11 October 2020. [Google Scholar]
- Chen, M.; Xiao, P.; Zhou, H.; Li, C.B.; Zhang, X. Fully Coupled Analysis of an Integrated Floating Wind-Wave Power Generation Platform in Operational Sea-States. Front. Energy Res. 2022, 10, 931057. [Google Scholar] [CrossRef]
- Liu, H.; Chen, M.; Han, Z.; Zhou, H.; Li, L. Feasibility Study of a Novel Open Ocean Aquaculture Ship Integrating with a Wind Turbine and an Internal Turret Mooring System. J. Mar. Sci. Eng. 2022, 10, 1729. [Google Scholar] [CrossRef]
- Harrold, M.J.; Thies, P.R.; Newsam, D.; Ferreira, C.B.; Johanning, L. Large-scale testing of a hydraulic non-linear mooring system for floating offshore wind turbines. Ocean. Eng. 2020, 206, 107386. [Google Scholar] [CrossRef]
- Xu, S.; Wang, S.; Soares, C.G. Experimental study of the influence of the rope material on mooring fatigue damage and point absorber response. Ocean. Eng. 2021, 232, 108667. [Google Scholar] [CrossRef]


Disclaimer/Publisher’s Note: The statements, opinions and data contained in all publications are solely those of the individual author(s) and contributor(s) and not of MDPI and/or the editor(s). MDPI and/or the editor(s) disclaim responsibility for any injury to people or property resulting from any ideas, methods, instructions or products referred to in the content. |
© 2023 by the authors. Licensee MDPI, Basel, Switzerland. This article is an open access article distributed under the terms and conditions of the Creative Commons Attribution (CC BY) license (https://creativecommons.org/licenses/by/4.0/).