Article

Effects of Physical Properties and Environmental Conditions on the Natural Dispersion of Oil

1
Key Laboratory of Integrated Regulation and Resource Development on Shallow Lake of Ministry of Education, College of Environment, Hohai University, Nanjing 210098, China
2
College of Environment, Hohai University, Nanjing 210098, China
3
College of Environment and Ecology, Jiangsu Open University, Nanjing 210017, China
*
Author to whom correspondence should be addressed.
J. Mar. Sci. Eng. 2024, 12(1), 47; https://doi.org/10.3390/jmse12010047
Submission received: 6 November 2023 / Revised: 20 December 2023 / Accepted: 20 December 2023 / Published: 24 December 2023
(This article belongs to the Section Marine Pollution)

Abstract

:
The natural dispersion of oil depends on the oil types, wave-mixing energy, and the temperature and salinity of water. Laboratory experiments were conducted to investigate the effects of these factors on oil dispersion. The results demonstrated that the increase in temperature significantly enhanced the oil dispersion efficiency, particularly for low-viscosity oils. At 30 °C, the dispersion efficiency is 2 times higher than that at 15 °C, while salinity has no significant effect on dispersion efficiency. Nonlinear fitting results revealed an exponential increase in dispersion efficiency with the energy dissipation rate. Furthermore, partial correlation analysis was employed to examine the effects of oil density, viscosity, and surface tension on dispersion efficiency. The results indicated a high correlation between density, viscosity, and dispersion efficiency (r = −0.801, r = −0.812), whereas the correlation coefficient of surface tension was low (r = −0.286). Based on these findings, linear and nonlinear regression models were established between dispersion efficiency and density and viscosity, enabling a rough estimation of oil spill dispersion efficiency under low sea state conditions.

1. Introduction

With the acceleration of offshore oil production, the occurrence of oil spill accidents during oil exploration and transportation has become a persistent issue, resulting in oil becoming a predominant pollutant in the ocean. (National Academies of Sciences, Engineering, and Medicine, 2022 [1]). Significant environmental damage has been witnessed in the past few decades due to several large-scale oil spills [2]. (e.g., Yellow Sea, 2021; DHW in the Gulf of Mexico, 2010; Brazil, 2019). When an oil spill occurs, oil spreads with the current and is subsequently fragmented into smaller droplets under the influence of waves, entering the water column [3]. The floating oil on the water surface can be effectively managed and contained using collection devices such as oil booms. However, the submersible oil in the water column presents challenges in terms of visibility and tracking, thereby posing a significant and enduring threat to marine ecosystems [4].
Given the limitations of current monitoring methods in tracking submerged oil and determining its source, studying the formation conditions and influencing factors of submersible oil is urgent [5]. Multiple studies have substantiated the intricate nature of the physical process involved in oil dispersing into the water column [6,7]. These influencing factors can be categorized into three aspects: the mixing energies, the physical properties of oil, and the environmental conditions [8,9,10,11]. The exploration of the relationship between mixing energies and the generation of oil droplets continues to be of significant interest. This is attributed to the crucial role that mixing energy plays as a key factor in the production of dispersed μm-sized oil droplets [12,13,14]. Forrester (1971) demonstrated the disintegration of a portion of the oil film layer into oil droplets under the influence of breaking waves. In a study conducted by Zhao et al., (2020) [15], a baffled flask test (BFT) was employed to simulate the impact of waves with varying oscillation intensities on the dispersion of oil spills. The findings indicated a significant influence of wave intensity on both the dispersion of oil spills and the resulting dispersion stability. Chen et al., (2009) [16] studied the calculation of energy dissipation rate and applied it to the dynamics of oil droplets, quantifying the relationship between wave energy and oil droplet formation. Considering the critical variables, such as density, viscosity, and oil–water interfacial tension, Yu et al., (2019) [17] conducted physical experiments to investigate the formation and sinking of oil suspended in water. They identified oil viscosity and oil–water interfacial tension as crucial factors. Oil dispersants are frequently employed in the field and laboratory to modify the oil viscosity and the oil–water surface tension, thereby enhancing the dispersibility of oil [18,19,20,21]. Lastly, it is essential to consider environmental factors such as temperature and salinity as significant variables in the research. In previous studies, researchers have investigated the effects of salinity and temperature on the dispersion of oils [22,23,24,25]. Chandrasekar et al., (2006) [25] observed that the dispersion efficiency does not consistently follow a pattern with increasing temperature; however, the dispersion rate tends to rise with increasing salinity. The study of Li Z et al., (2010) [22] indicated that an increase in temperature significantly enhances the dispersion efficiency of oil. Three primary test methods have been utilized in oil dispersion research. The BFT is capable of providing sufficient shear force to replicate the mixing energy of breaking waves, effectively simulating oil dispersion under diverse environmental conditions [25,26,27]. Another method involves small-scale laboratory tests, primarily generating waves via agitators, allowing for precise control of environmental conditions such as water temperature and light, with a high degree of reproducibility [28,29]. Medium-scale tank tests, widely employed in the study of oil dispersion, can largely replicate on-site wave conditions [30,31]. Additionally, the method of regression analysis has often been employed to establish a mathematical relationship between oil dispersion and influencing factors, and this approach has been applied in this study [32,33].
Despite extensive research aimed at investigating the process and influencing factors of oil dispersion, several key issues remain unresolved. Previous studies have predominantly focused on a limited range of oil types, which hinders the establishment of a comprehensive mathematical relationship between physical properties and oil dispersion efficiency. Moreover, no published reports have systematically elucidated the influence of environmental factors (such as temperature, salinity, and mixing energy) on oil dispersion efficiency. Furthermore, the calculation of oil dispersion efficiency often relies on measuring oil concentration. However, the non-uniform distribution of oil concentration in the water column poses limitations to this approach.
To address the aforementioned knowledge gaps, a modified laboratory test was employed in this study to comprehensively investigate how temperature, salinity, mixing energy, and oil physical properties influence oil dispersion. Additionally, a mathematical relationship between oil dispersion efficiency and its physical properties was established based on test results from 40 oils. The findings can be applied to predict oil dispersion following an oil spill under low sea state conditions.

2. Materials and Methods

2.1. Experimental Apparatus

In this study, oil dispersion experiments were conducted in an indoor cubic container (0.5 m × 0.5 m × 0.5 m) (Figure 1). The container’s transparent glass walls allowed for easy observation of the oil dispersion. Two mechanical agitators placed on opposite sides of the container were used to generate breaking waves, and the kinetic energy produced by the breaking waves was measured using the Doppler velocimeter. A specific oil containment device (3 cm high, 4.7 cm inner diameter, 5 cm outer diameter) was fixed on the container. Oil was introduced into the apparatus and dispersed under the influence of turbulent flow. Temperature control equipment (TCDA-4132) was used to regulate the water temperature. Ultrapure water with sea salt was added as experimental water, and the salinity of the water was determined using an electrode-type laboratory salinometer.

2.2. Test Oil Characteristics

In previous studies, the density, viscosity, and surface tension distributions of the oil were reported as 0.621~0.995 g/cm3, 1.81 × 10⁻⁶~1 × 105 mm2/s, 0.024~36.2 mN/m, respectively [34]. It has been observed that highly viscous oils pose challenges in dispersion when entering the water column, rendering them difficult to observe and unsuitable as test materials [35,36]. To study the effect of physical properties on the dispersion mechanism, seven oils, including diesel fuel, castor oil, peanut oil, silicone oil (viscosity of 0.65 cst, 2000 cst, 5000 cst, respectively), and Roncador crude oil were selected and blended in different ratios to obtain 45 samples. Details of the analytical methods and results of the physical properties of the samples are provided in Table 1.

2.3. Experimental Design and Procedure

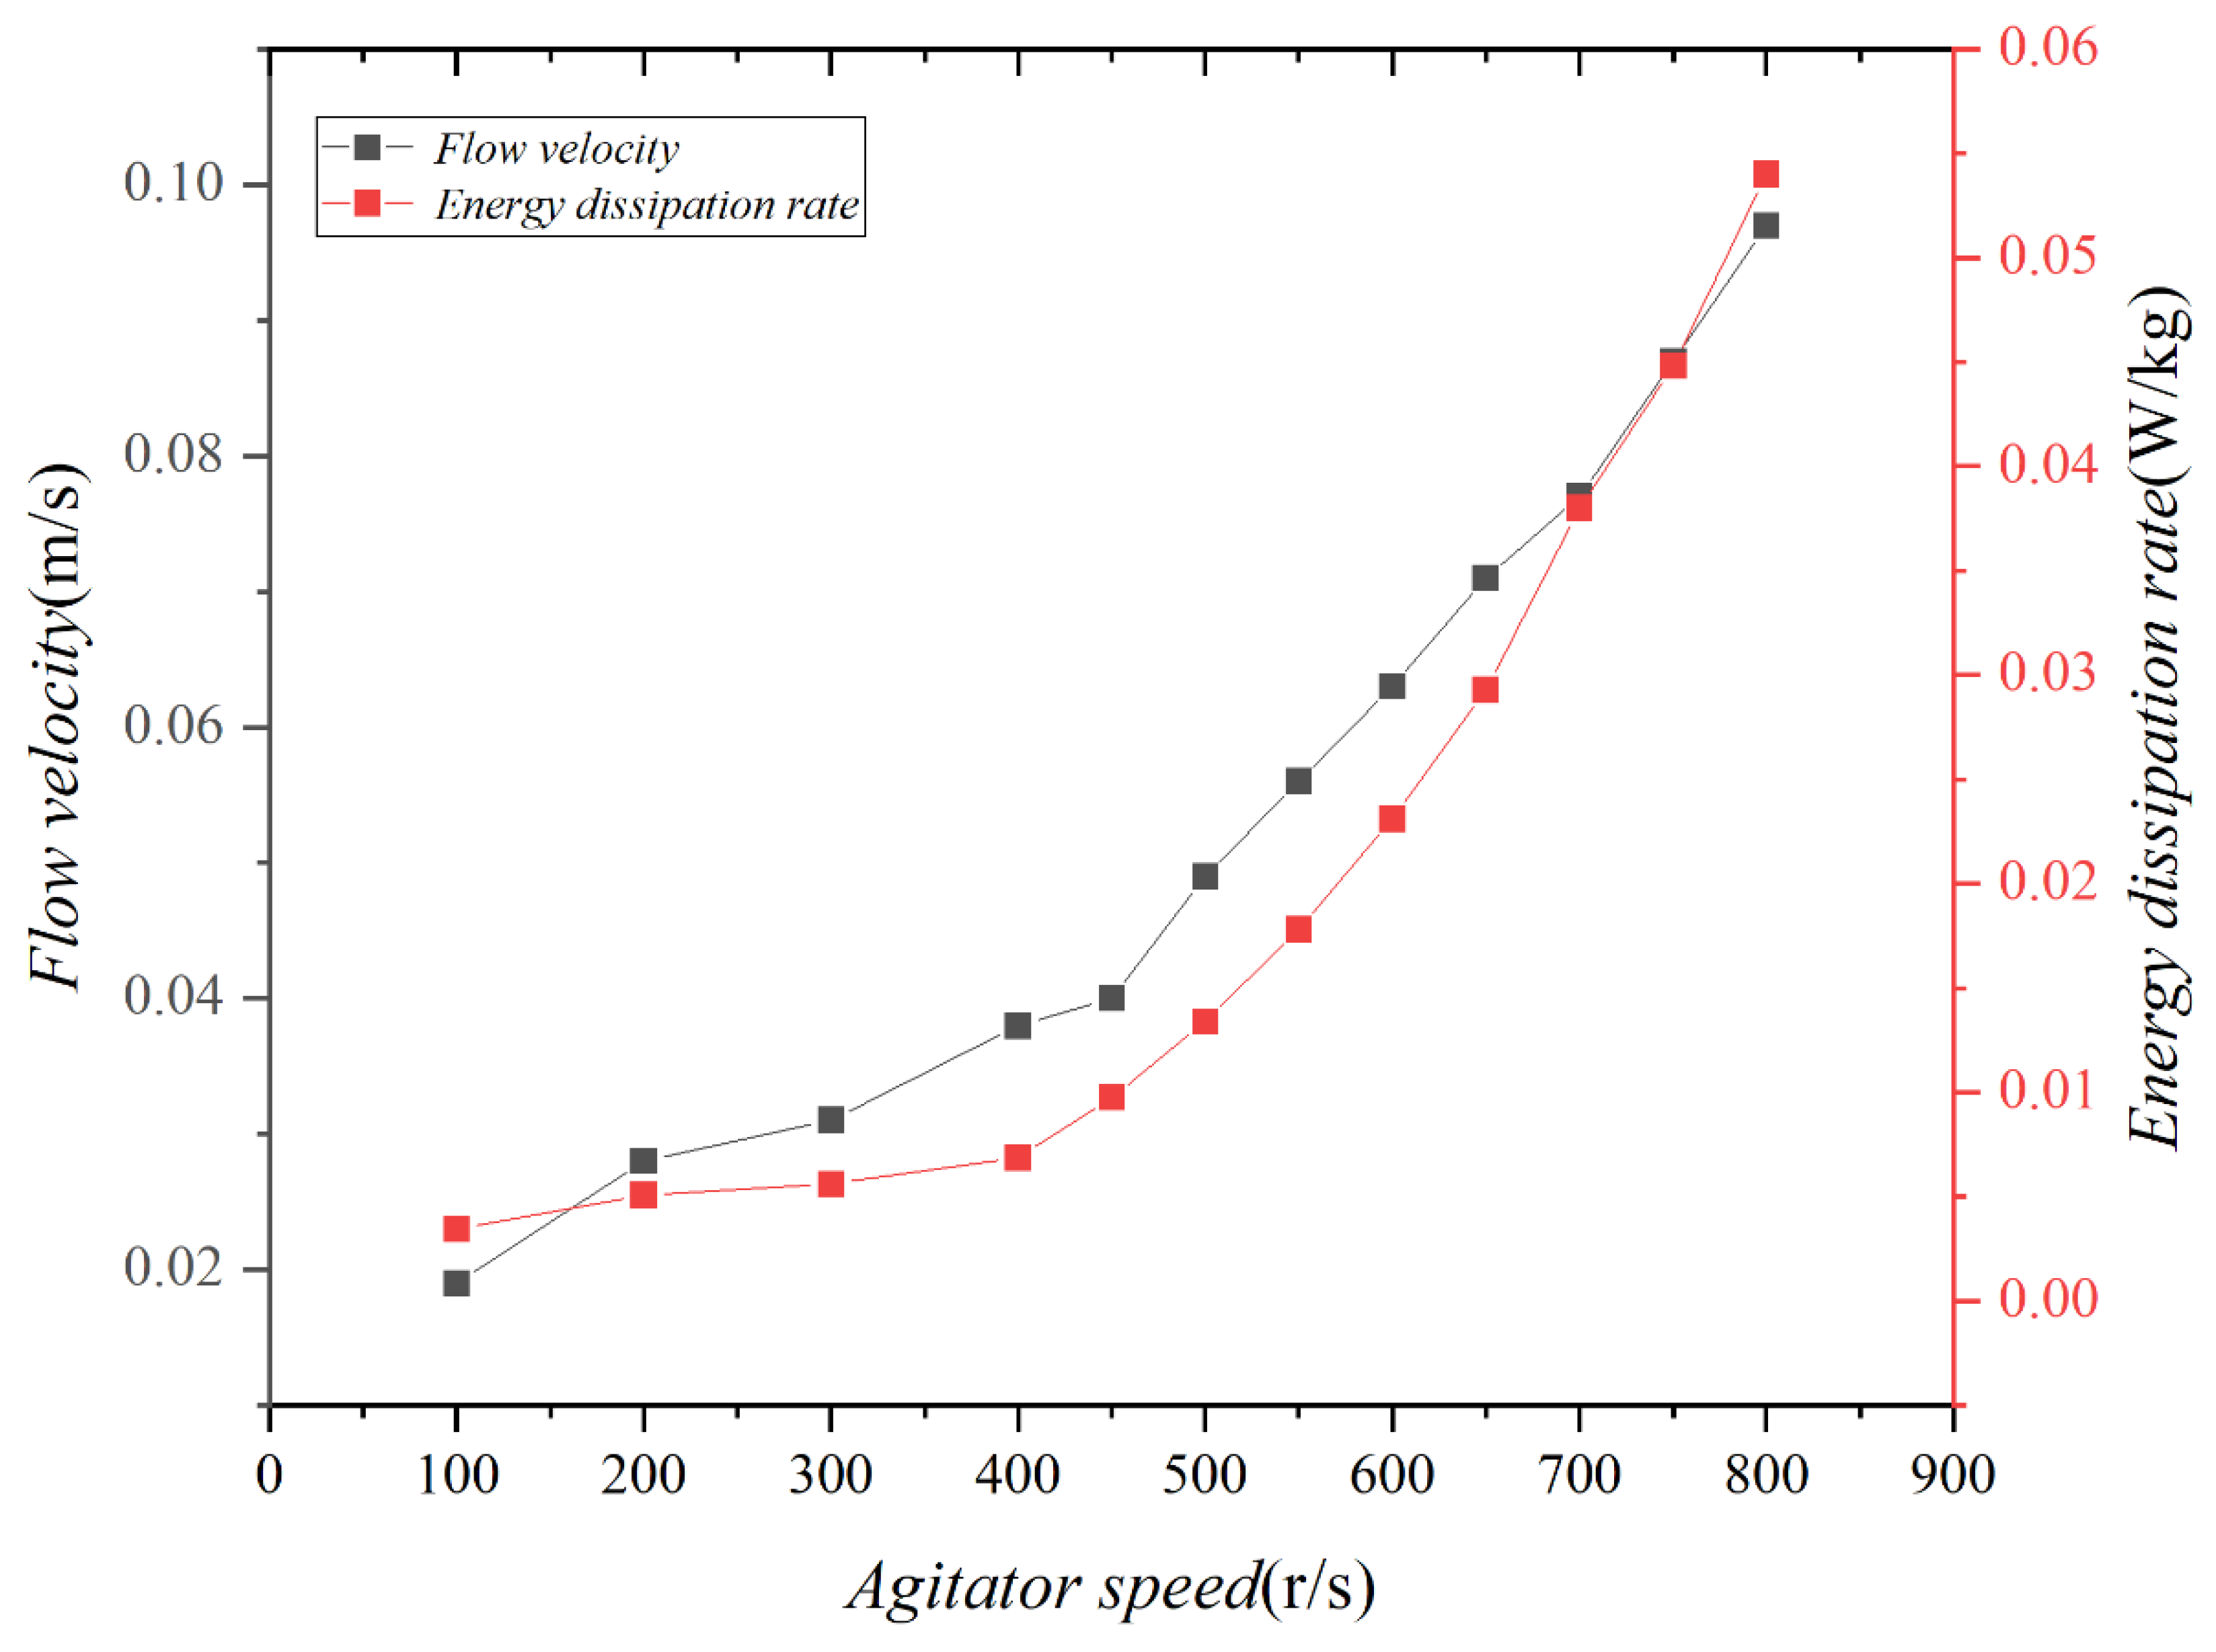
Hydrodynamic Conditions

The breaking waves in the water column were generated by the kinetic energy produced by the mechanical agitator employed in the experiment. The energy dissipation rate was used to characterize the similarity of the experimental hydrodynamics to the natural environment [37,38,39]. The energy dissipation rate was calculated by (Chen, 2014 [40]) as follows:
ε = P ρ m V
P = N p ρ m n 3 d 5
where P is the input power of stirring, W; ρm is the density of water, kg/m3; V is the volume of water, m3; Np is the power number; n is the rotation rate of the agitator, r/s; and d is the diameter of the propeller, m. According to the Rushton arithmetic diagram, the power number is determined to take the value of 1.57.
The energy dissipation rate in the test was calculated, as depicted in Figure 2. According to previous studies (Delvigne and Sweeney, 1988 [41]), the energy dissipation rate of regular waves varies between 10−3 and 10−2 W/kg. It has been determined that by operating the agitator at speeds ranging from 300 to 1000 rpm, the test could effectively simulate waves with an intensity closely resembling that of regular waves.

2.4. Temperature Conditions

The typical temperature variation range of the Earth’s ocean surface is generally 10 to 30 °C, excluding polar regions [42]. To study the effect of temperature on oil dispersion, temperature control equipment was used to regulate the water temperature in the test.

Salinity Conditions

While salinity in the ocean generally maintains a stable average of 35, it tends to be lower near estuaries. Sea salt was added to ultrapure water to achieve various salinity levels in the experiments. This allowed us to investigate the impact of salinity on oil dispersion.

2.5. Experimental Procedures

The experiment was performed at Hohai University. The experimental conditions were set as shown in Table 2. The oil dispersed into the water column under the influence of turbulence during the test is shown in Figure 3. The specific experimental steps are as follows:
(1)
Test water is gradually injected into the container until the depth reaches 0.3m. Adjust the draught depth of the oil containment device to 2 cm.
(2)
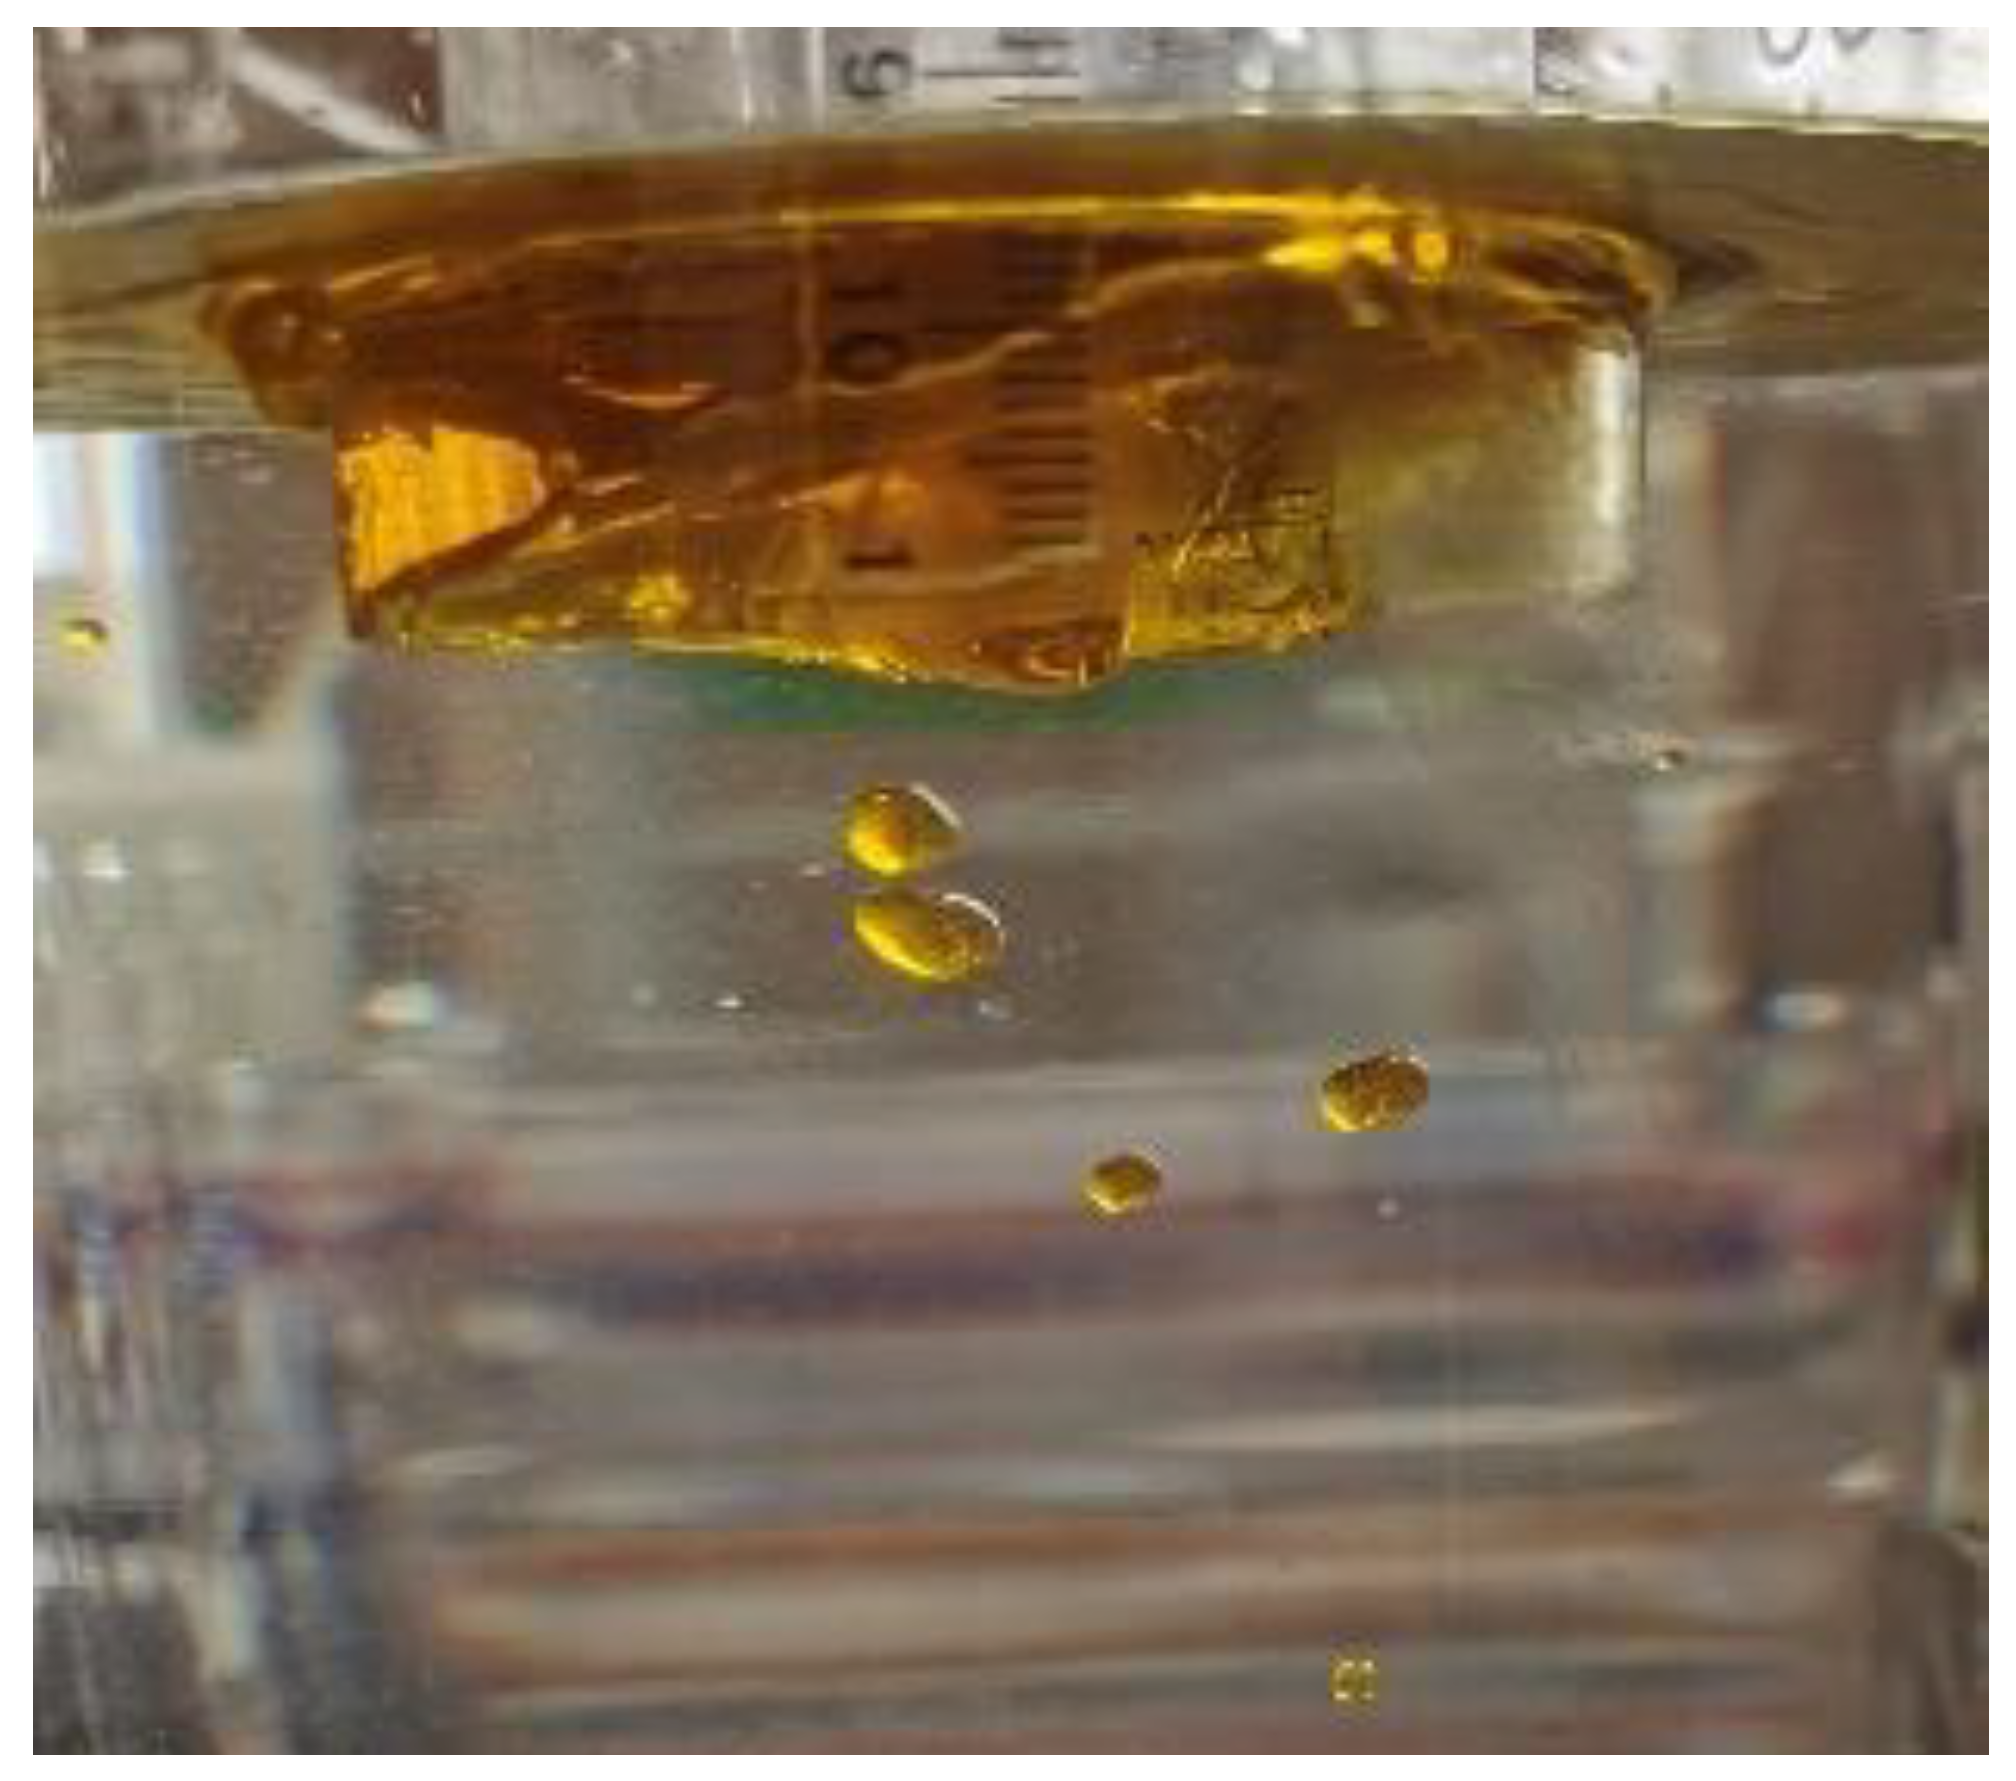
Turn on the agitator to create waves. Slowly inject 150 mL of oil into the oil containment device using a syringe after the flow stabilizes. Record the initial thickness of the oil layer as h0 (2.16 cm) and the initial volume as Voil,1.
(3)
Collect water samples from 10 cm below the oil layer at intervals of 4.5, 8, 12, 24, 31, 37, 48, 72, 96, 120, 144, and 168 min after the test begins.
(4)
Turn off the agitator after 3 h. Collect the remaining oil in the oil containment device with a syringe into volumetric flasks, fill to the mark with distilled water, and weigh. Determine the volume of the remaining oil as Voil,2 from the weight difference between the sample and the weight of pure distilled water.
(5)
After each test, clean the residue of a small amount of oil adhered to the inner wall of the oil containment device and the container using oil absorption felt, a hydrophobic material that effectively adsorbs oil. The difference in weight of the felt before and after cleaning was measured to obtain a residual volume of Voil,3. Calculate the total dispersion volume of oil during the test as Voil,1-Voil,2-Voil,3. Repeat the test three times and calculate the average value for subsequent analysis.

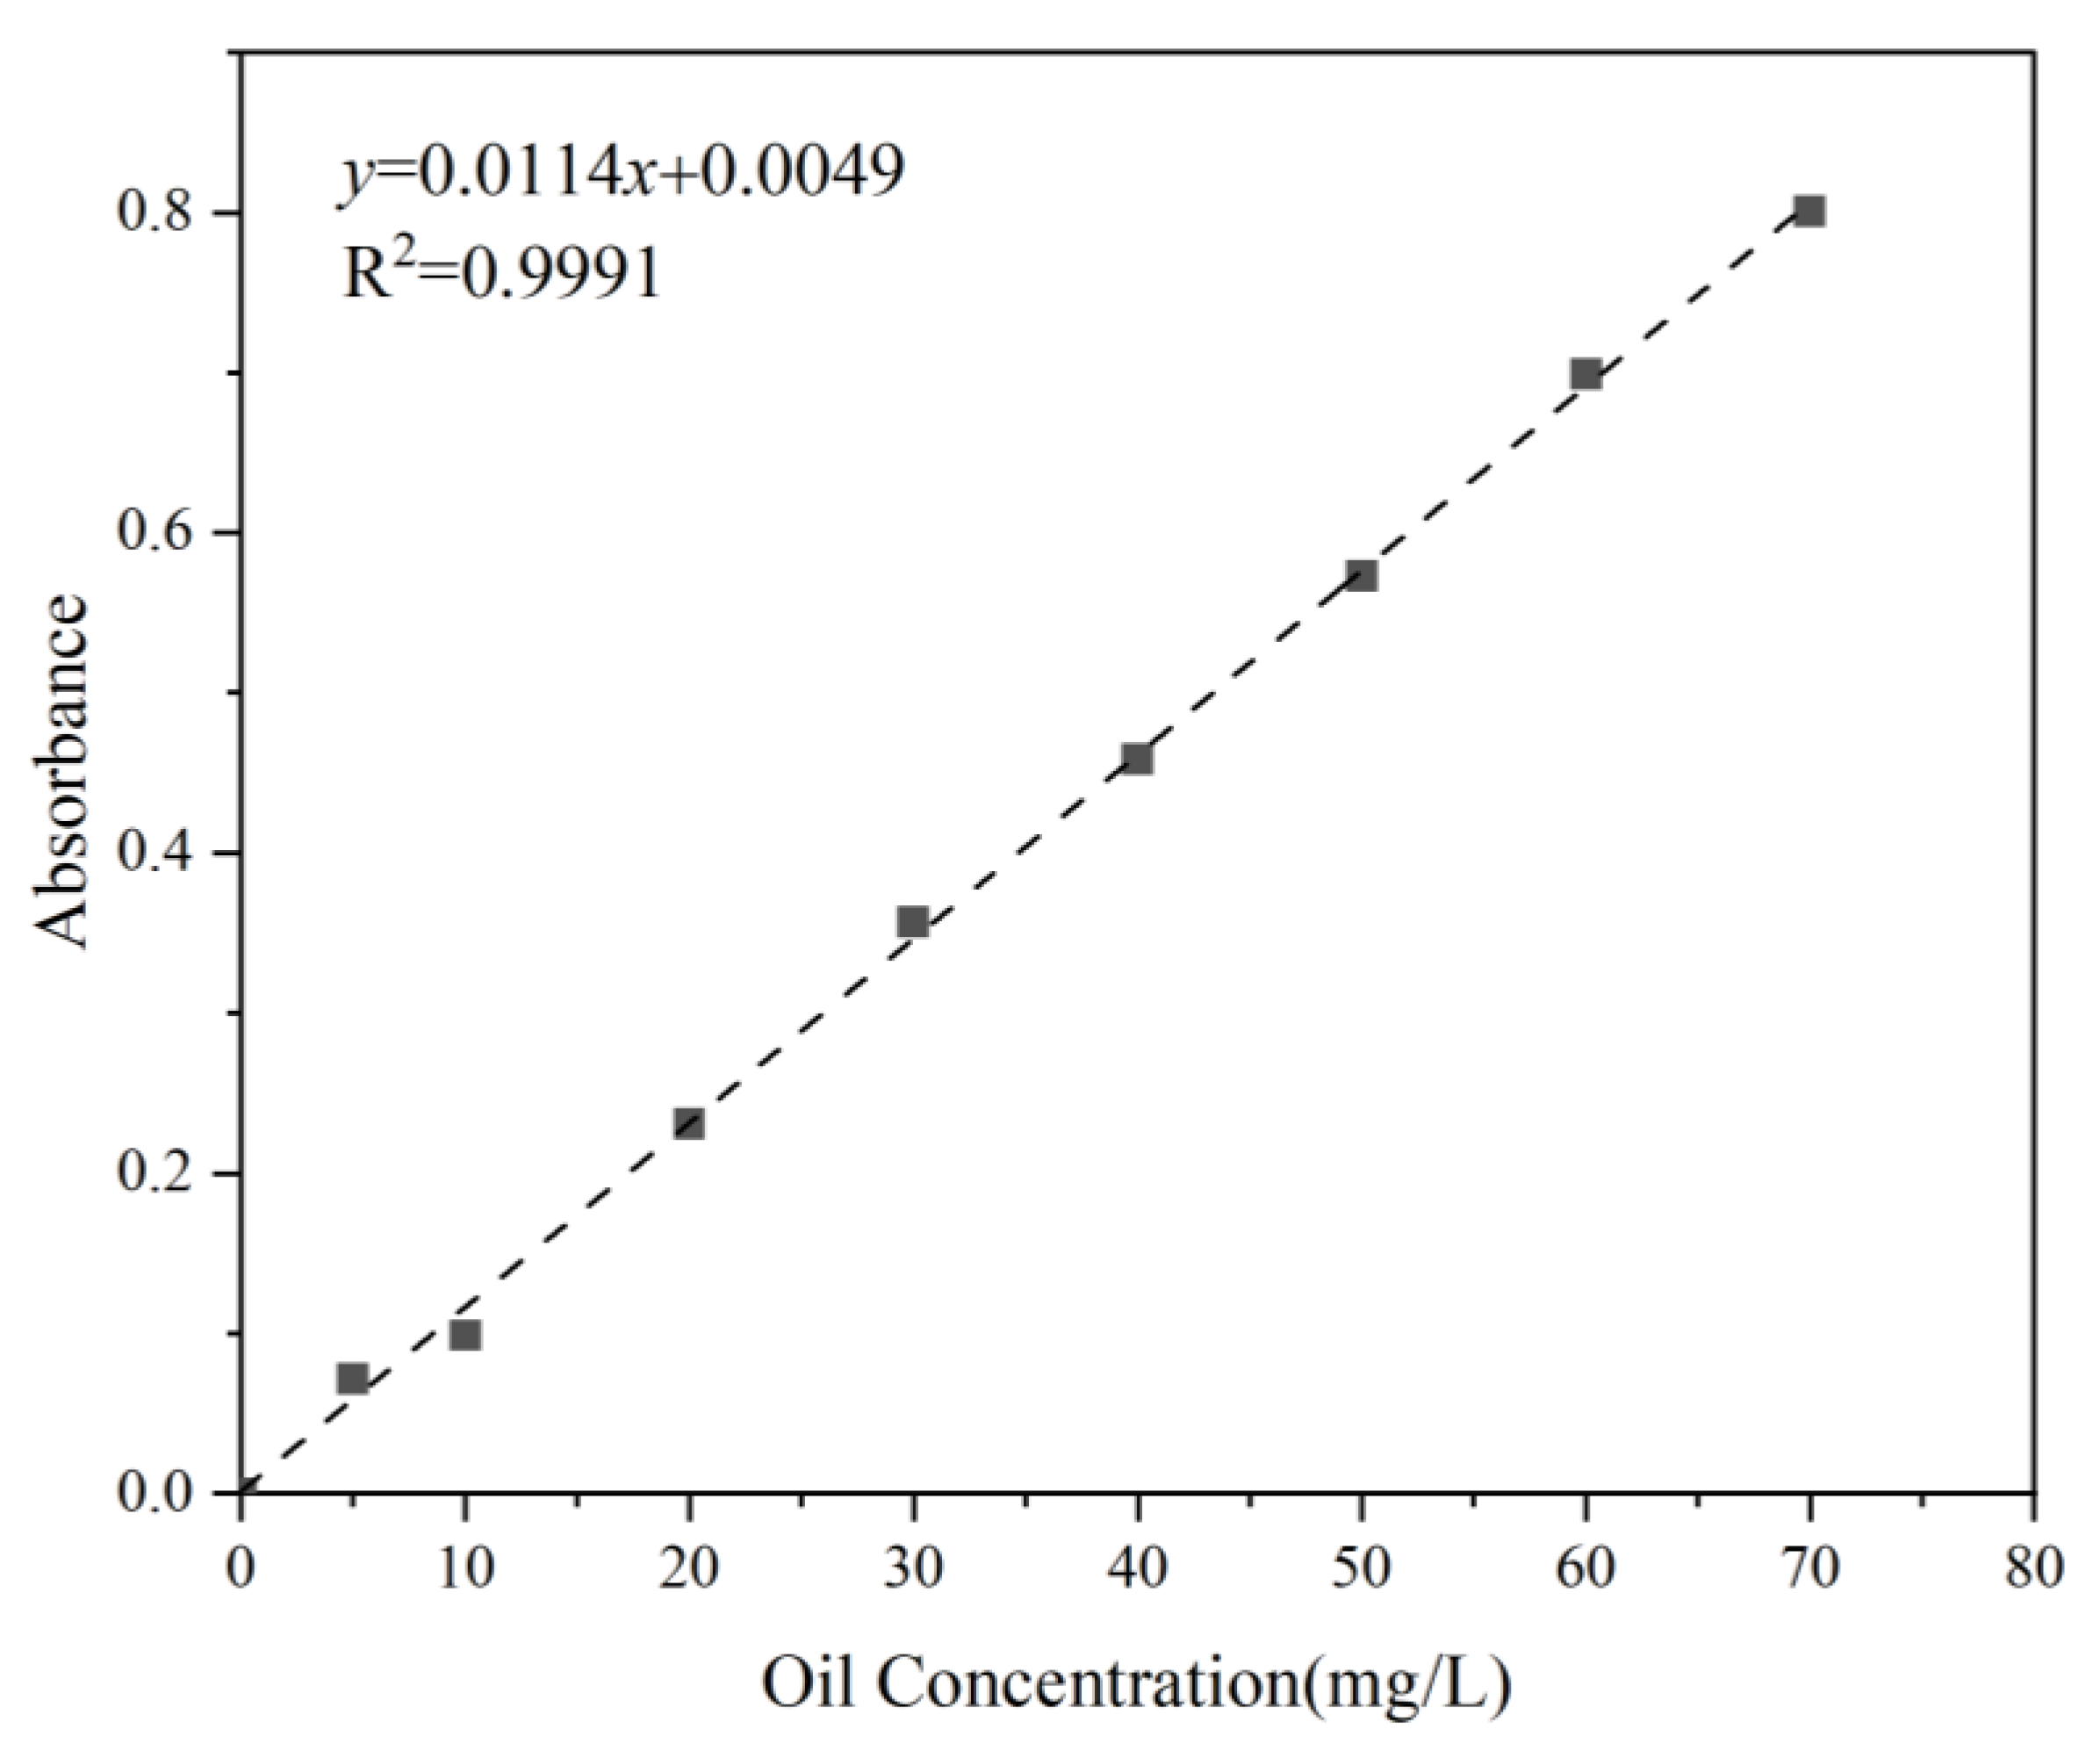
2.6. Measurements of the Oil Concentration

The extraction of petroleum hydrocarbons from the suspension was carried out using n-hexane in a 250 mL separatory funnel, following the China standard test method [43]. Subsequently, the absorbance of the test samples was measured at 225 nm. The oil concentration standard curve (Figure 4) served as a reference for comparison, enabling the calculation of oil concentration in the water samples.

2.7. Measurement of Oil Dispersion Rate and Efficiency

The dispersion rate denotes the pace at which the concentration of oil rises within the water samples. It is quantified by determining the rate of change in oil concentration over time and can be calculated as follows:
R = c oil t n c oil t n 1 t n t n 1
where tn is the sampling at the nth sampling event, and tn−1 is sampling at the immediately preceding sampling event.
The dispersion efficiency refers to the total volume of oil that entered the lower water column over the course of the entire 180 min duration of an experimental run, per unit area and per unit time, as
E = V oil , 1 V oil , 2 V oil , 3 ( t 2 t 1 ) × S
where Voil,1 and Voil,2 are volumes of oil at moments t1 and t2 of the test, mL; Voil,3 is the oil adhering to the device, mL; t1 and t2 refer to the start and end times, t1 = 0 min and t2 = 180 min in this test, min; and S is the sample contact area with water, cm2.

3. Results and Discussion

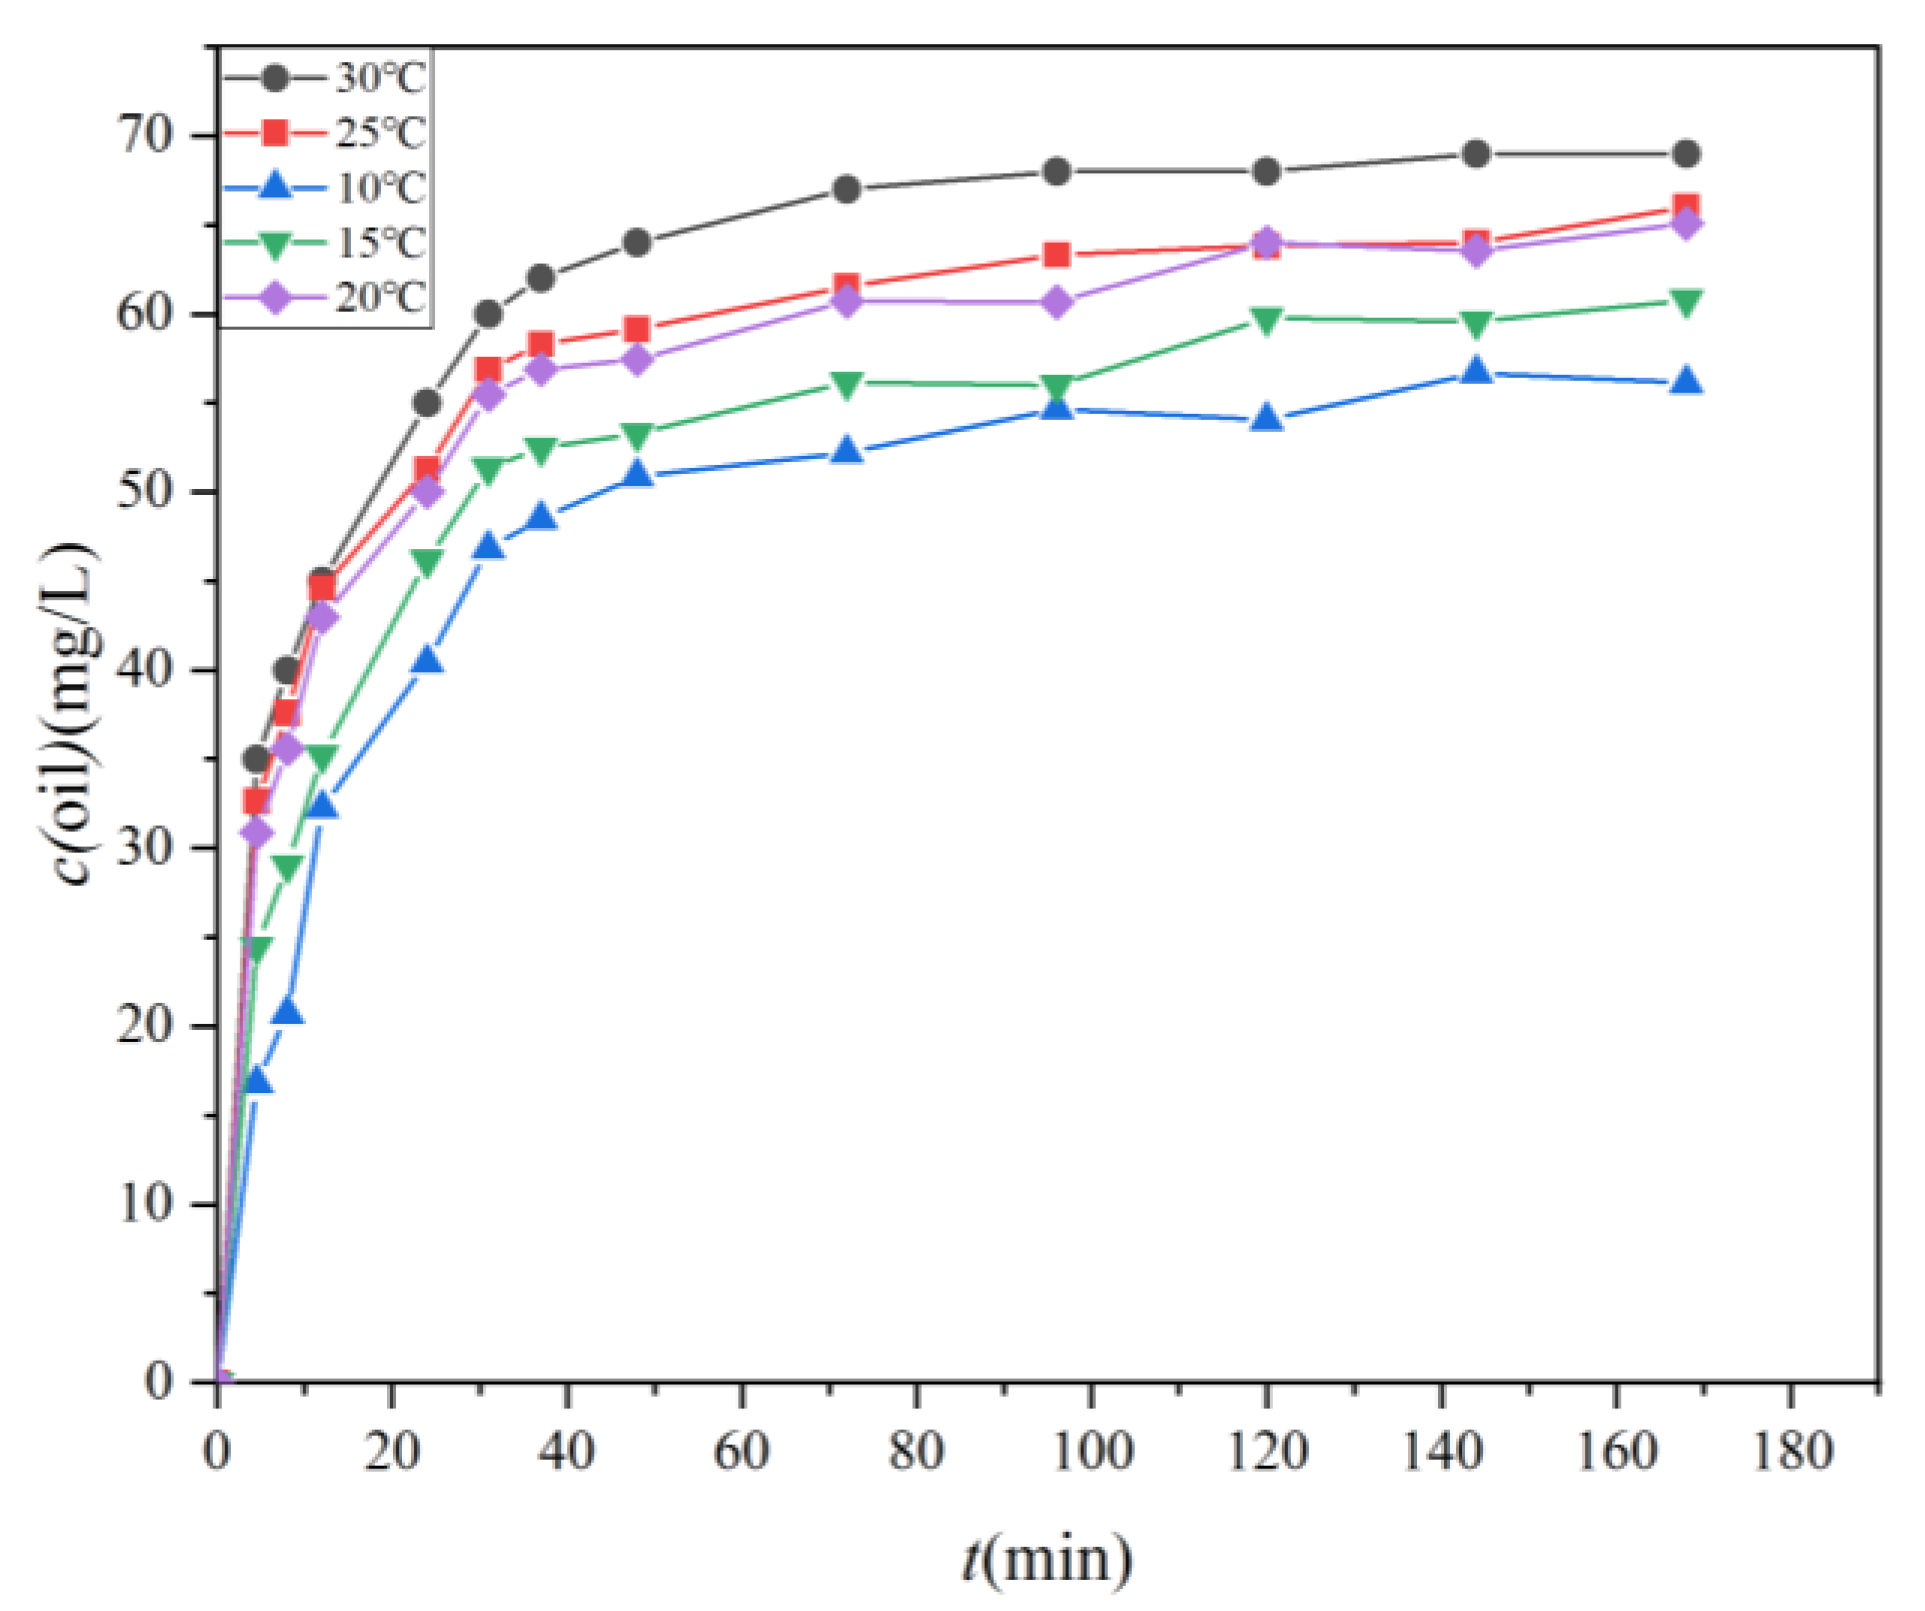
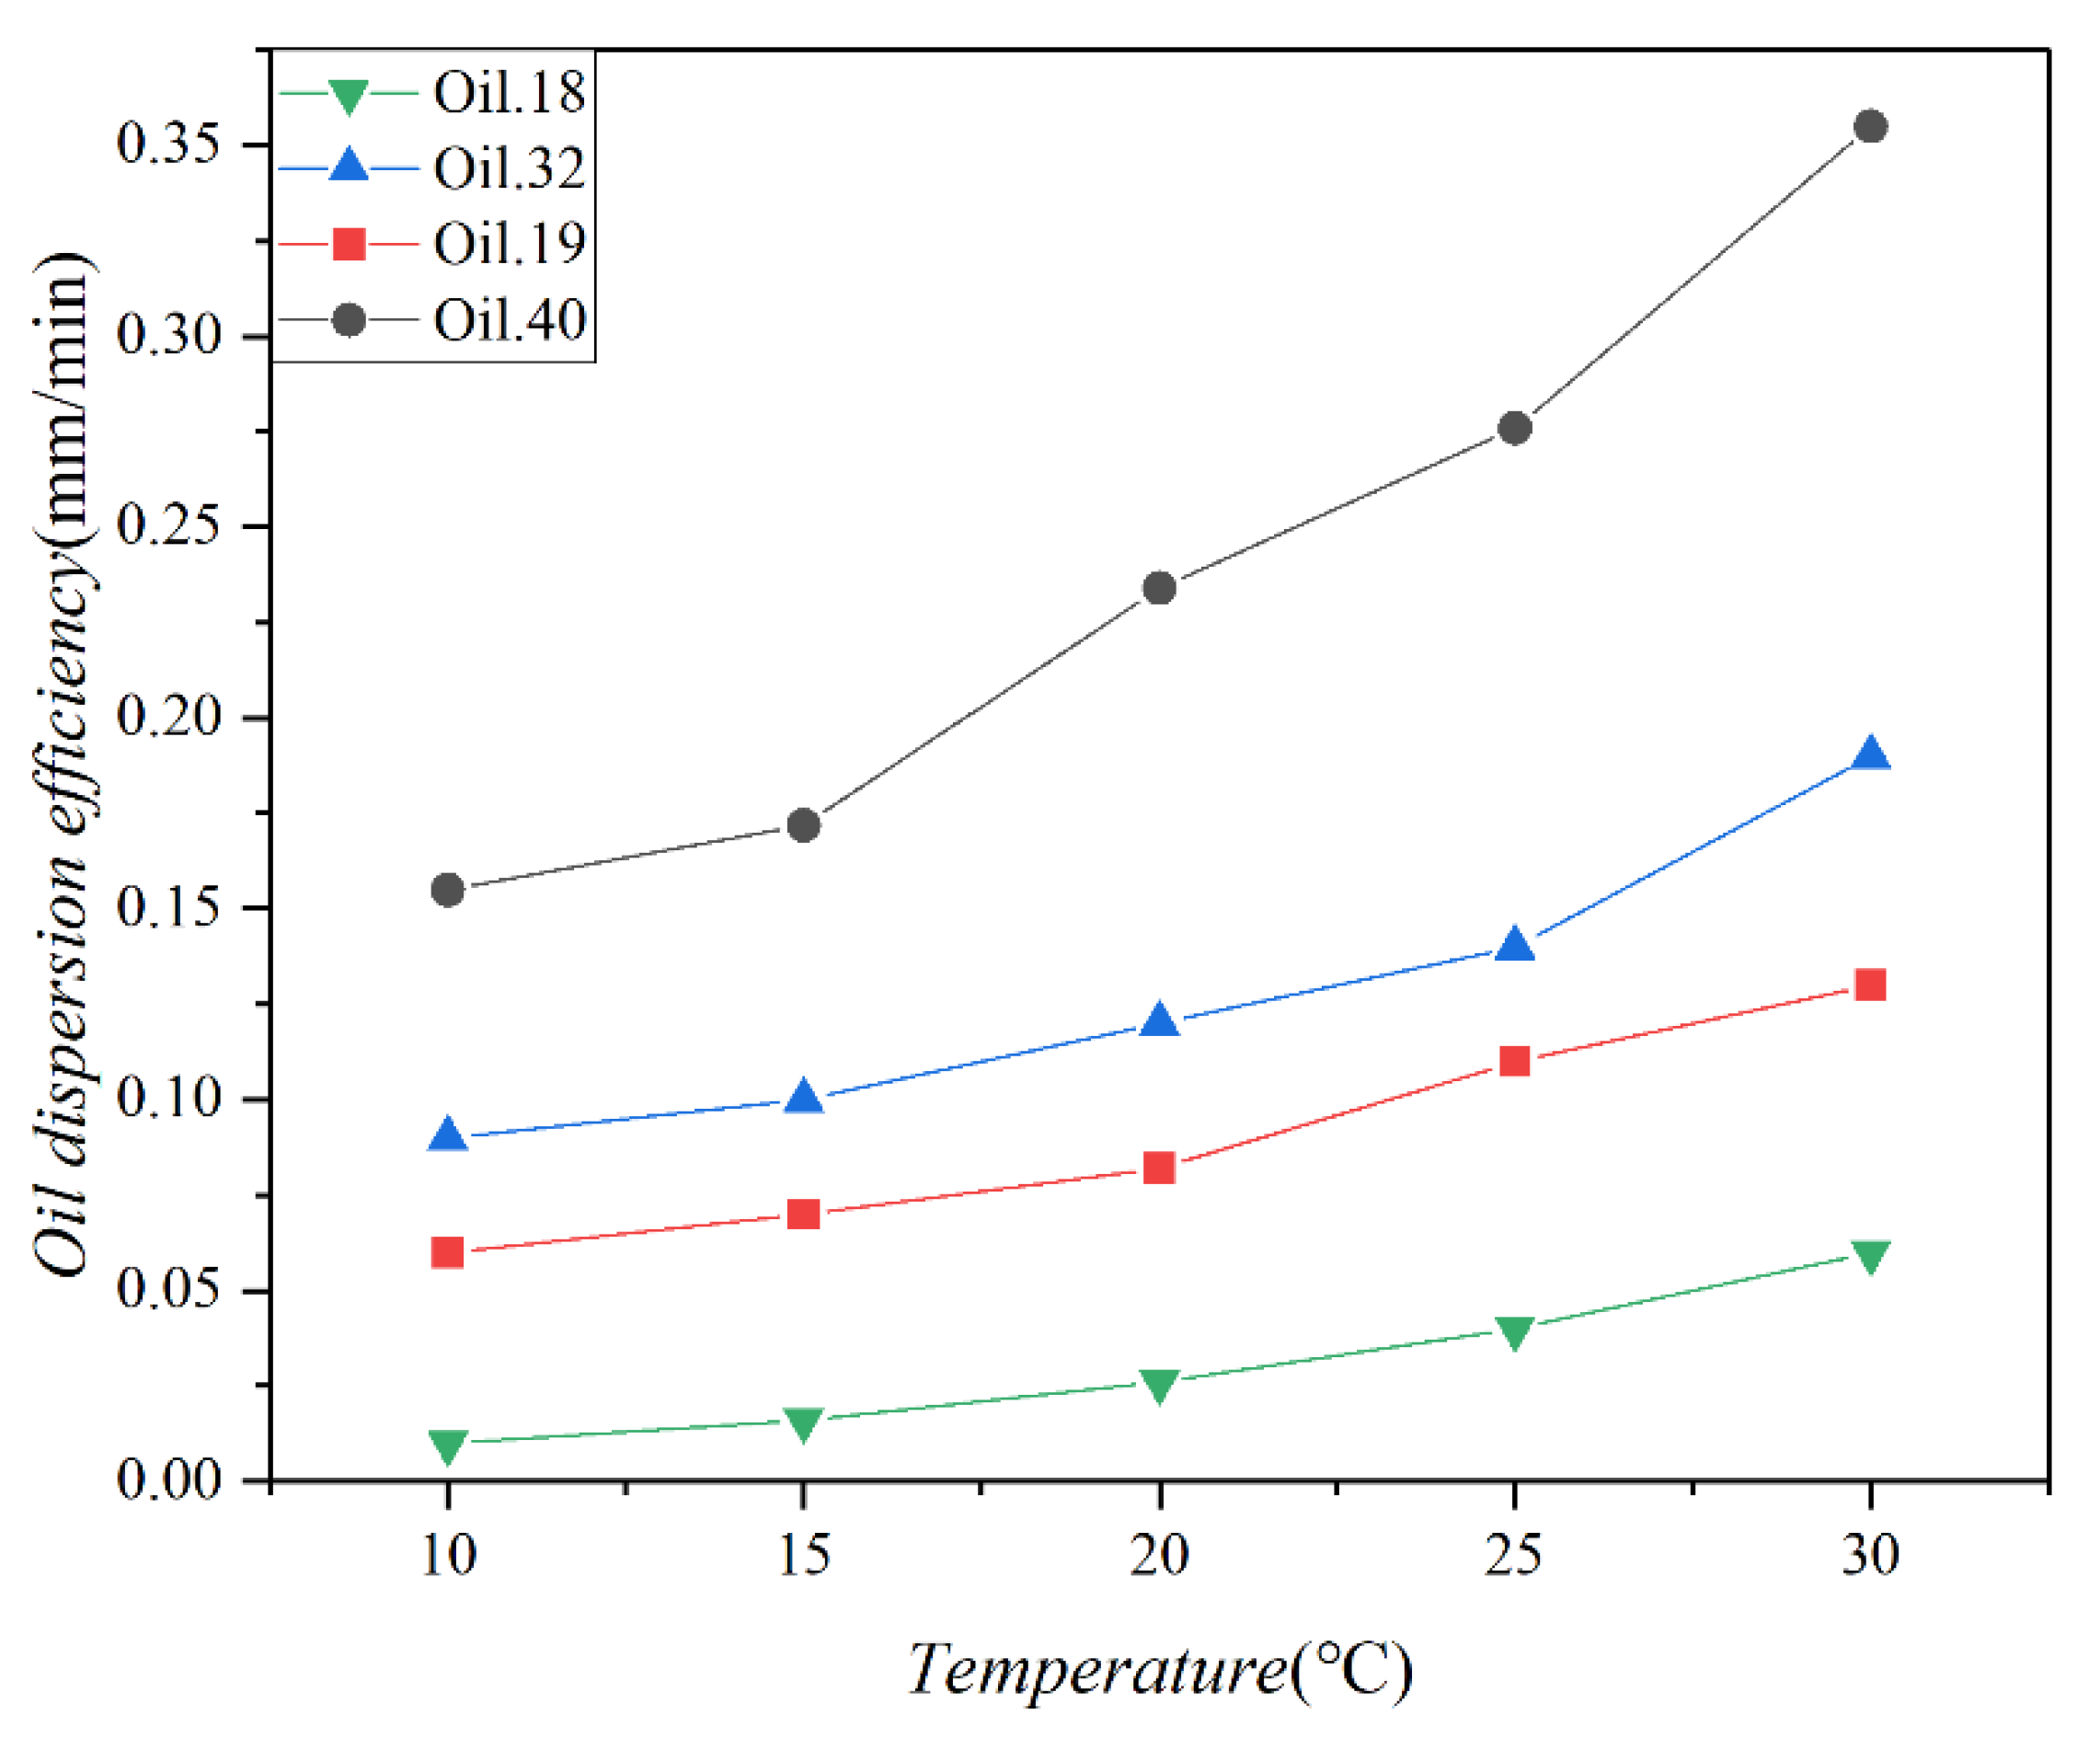
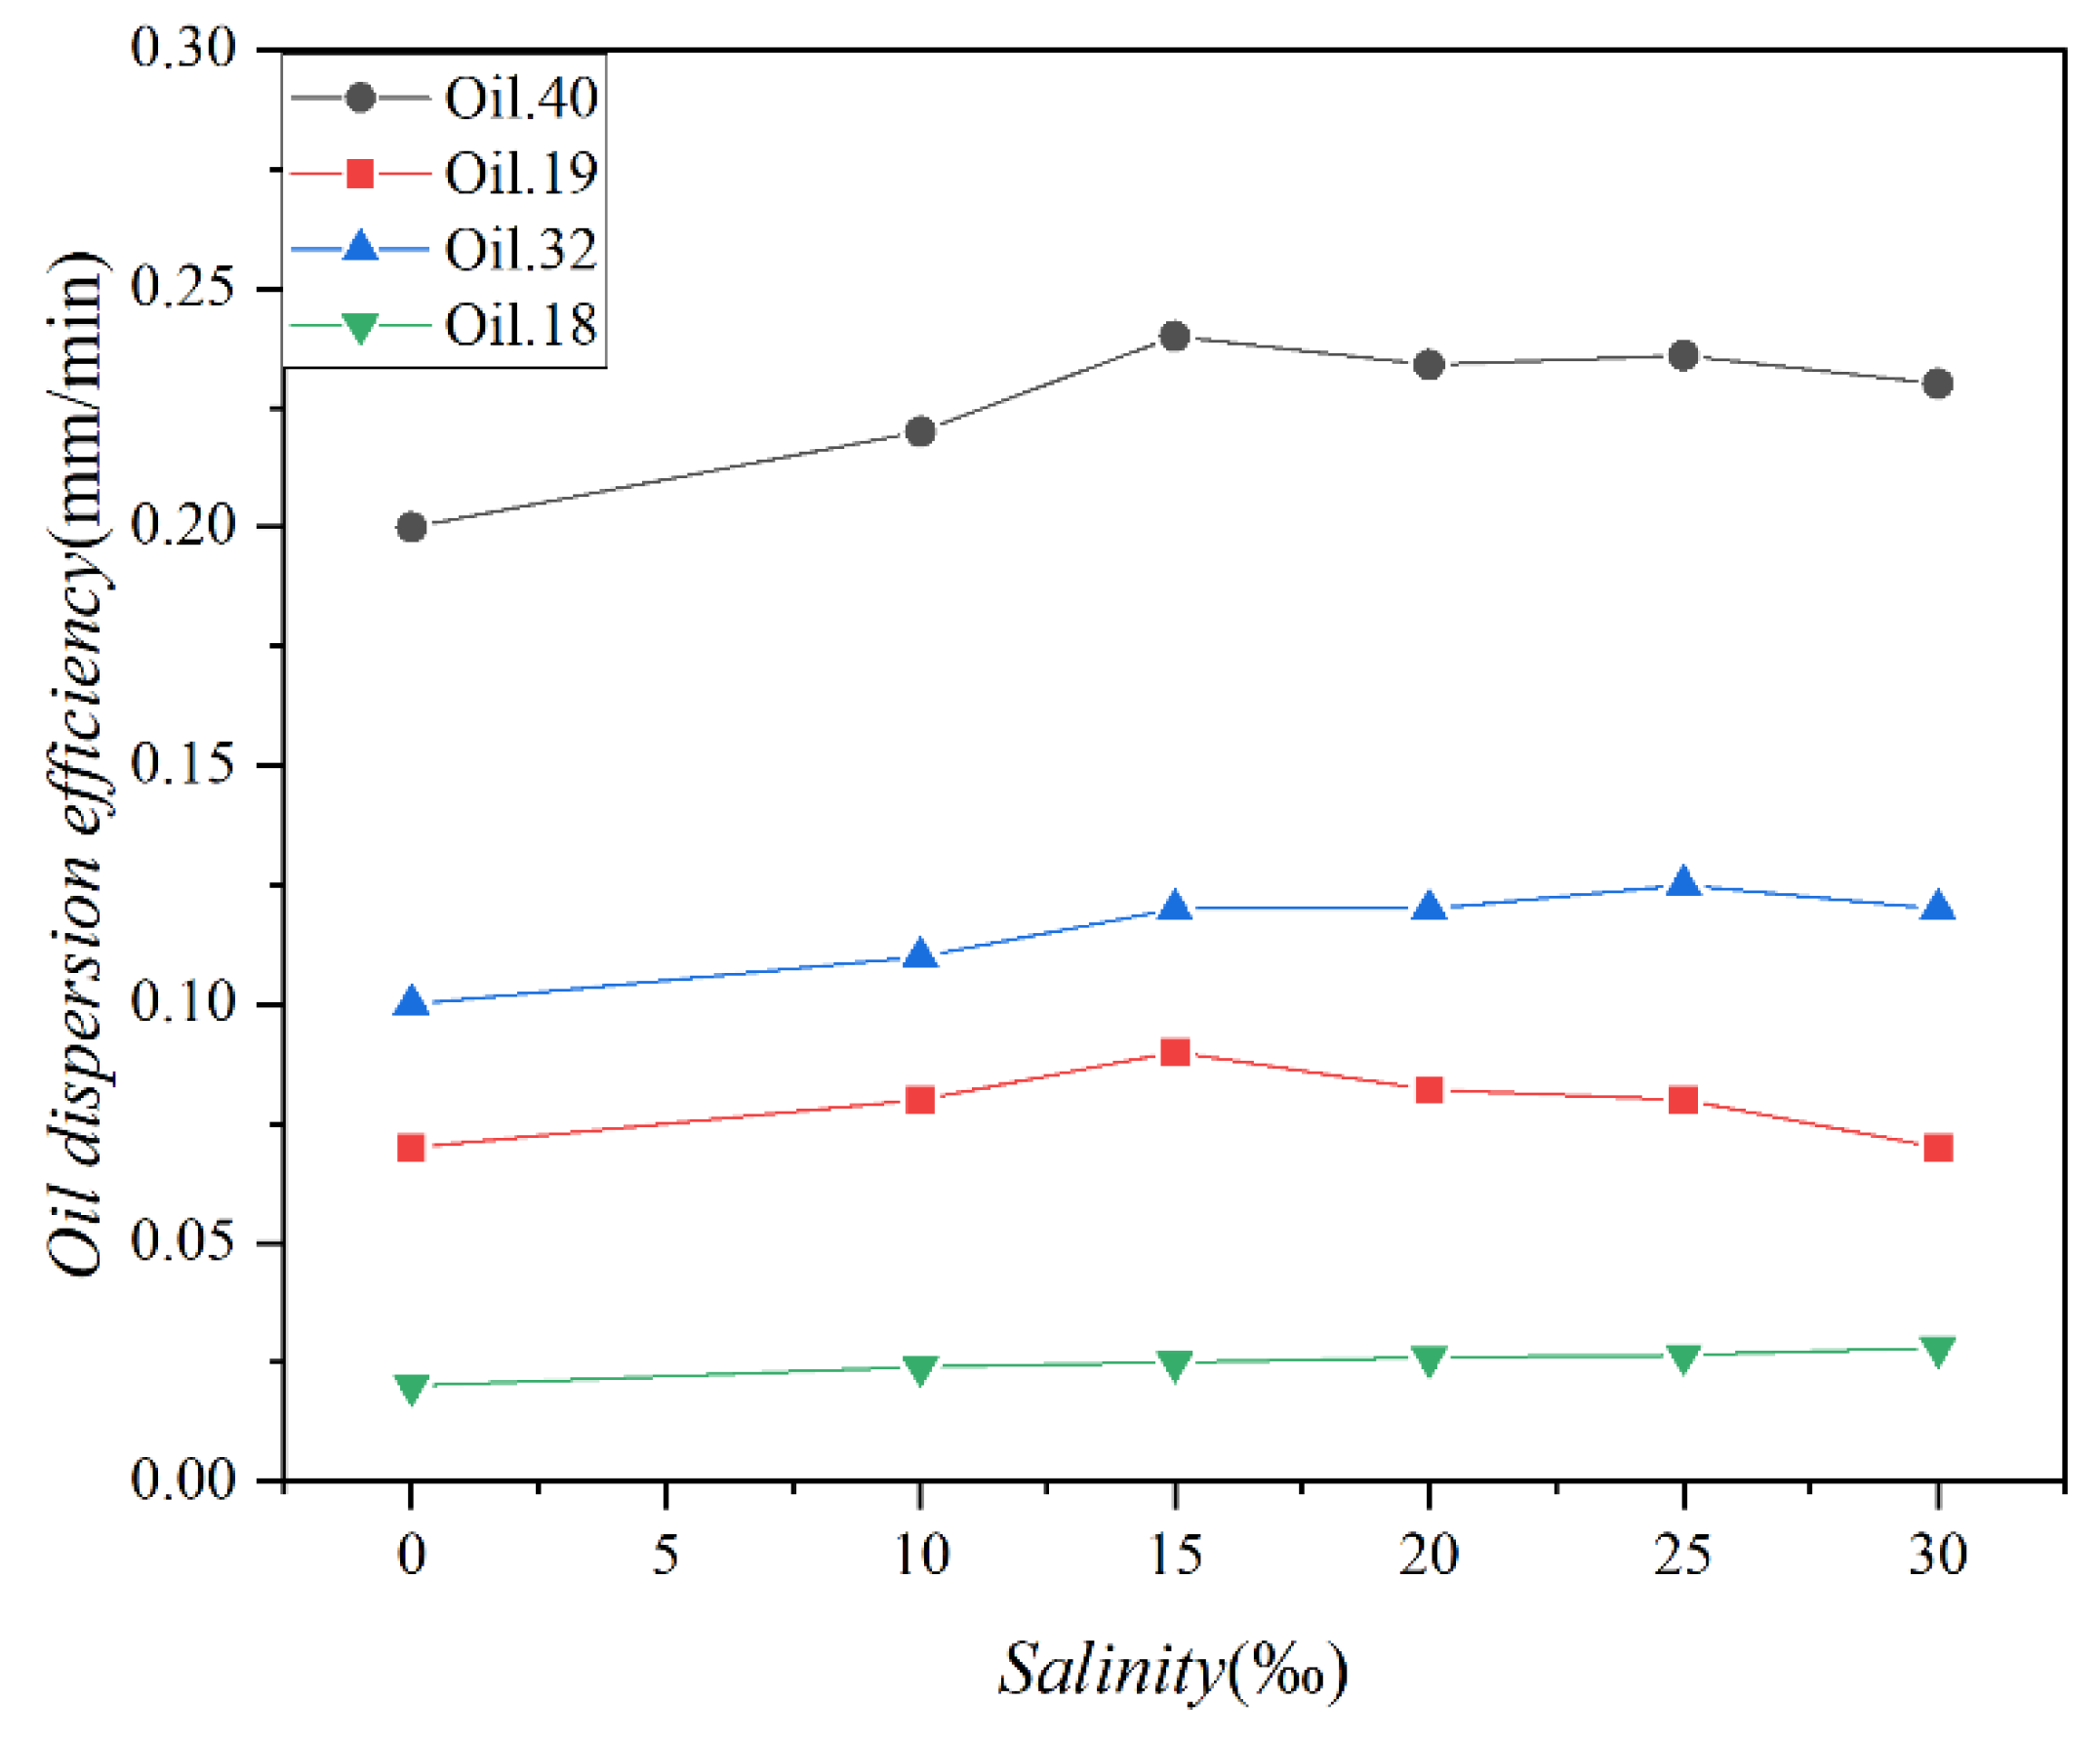
3.1. Effect of Temperature and Salinity on the Oil Dispersion

Figure 5 illustrates the temporal evolution of oil concentrations of the four test oils (numbers 18, 19, 32, and 40) in water samples positioned 10 cm below the oil film under varying water temperature conditions, ranging from 10 °C to 30 °C. Data points represent the average results from three experiments for each one of the four test oils, with an average standard deviation of 0.73. The results reveal a clear trend wherein the oil concentration in the water body increases with the duration of the oil spill. During the initial phase of the natural dispersion, the oil rapidly enters the water body, resulting in a sharp increase in oil concentration. Subsequently, there is a noticeable transition to a slower dispersion stage until a point of stabilization is reached. A threshold of 10% growth in concentration marks the commencement of the slow dispersion stage, presumed to occur after oils have been dispersed for more than 31 min. This threshold was calculated by Equation (3). In the rapid dispersion stage, the oil concentration in the water body escalates directly with the duration of the oil dispersion. For example, under different temperature conditions, the oil concentration increases from an initial 0 mg/L to 46.83 mg/L, 51.35 mg/L, 55.46 mg/L, 56.88 mg/L, and 60 mg/L, respectively. Correspondingly, the dispersion rates are 1.51 mg/(L·h), 1.656 mg/(L·h), 1.789 mg/(L·h), 1.835 mg/(L·h), and 1.934 mg/(L·h). In contrast, the slow dispersion phase exhibits a more gradual increase in oil concentration. The net increase in oil concentration during this stage is 9.29 mg/L, 9.43 mg/L, 9.62 mg/L, 9.12 mg/L, and 9.02 mg/L for different oils, with dispersion rates of 0.067 mg/(L·h), 0.069 mg/(L·h), 0.070 mg/(L·h), 0.066 mg/(L·h), and 0.065 mg/(L·h), respectively. This deceleration in dispersion rate in the later stage may be attributed to the oil concentration in the water column approaching equilibrium. The rate at which oil continues to disperse into the water column is balanced by the rate at which oil leaves the water column, either returning to the oil source reservoir or surfacing to form a surface slick. This leads to a significant reduction in oil dispersion efficiency during the later stages compared to the earlier stages.
Figure 6 illustrates the dispersion efficiencies of the four test oils at various temperatures, with a standard deviation of 0.018. A notable increase in dispersion efficiency is observed with higher temperatures, particularly for low-viscosity oils. In contrast, high-viscosity oils exhibit a relatively modest improvement in dispersion efficiency as temperatures rise. In a study by Yang et al., (1992) [44], approximately 0.52% of diesel fuel entered seawater within 48 h. In our study, diesel fuel was dispersed at proportions of 0.34%, 0.31%, 0.30%, and 0.26% of the total oil volume. This disparity in dispersion percentages may be attributed to experimental conditions characterized by a lack of wind influence and a consistent oil film area, resulting in a slightly reduced dispersion rate. Despite our experiment lasting only about 3 h, Figure 5 indicates that the oil concentration remained essentially unchanged after 80 min.
The changes in the concentration of the four oils over time under varying salinity conditions are presented in Figure 7, while Figure 8 illustrates the variations in the dispersion efficiency of the four oils in response to salinity changes. The standard deviations of the two sets of data were 0.78 and 0.012, respectively. As depicted in Figure 7, the alteration in oil concentration follows a pattern similar to that shown in Figure 5. Both figures display two distinct phases characterized by rapid and slow dispersion. It is noteworthy that the disparity in oil concentration under varying salinity conditions is minimal. Figure 7 and Figure 8 together highlight a shared observation, indicating that salinity exerts minimal influence on the magnitude of oil spill dispersion.

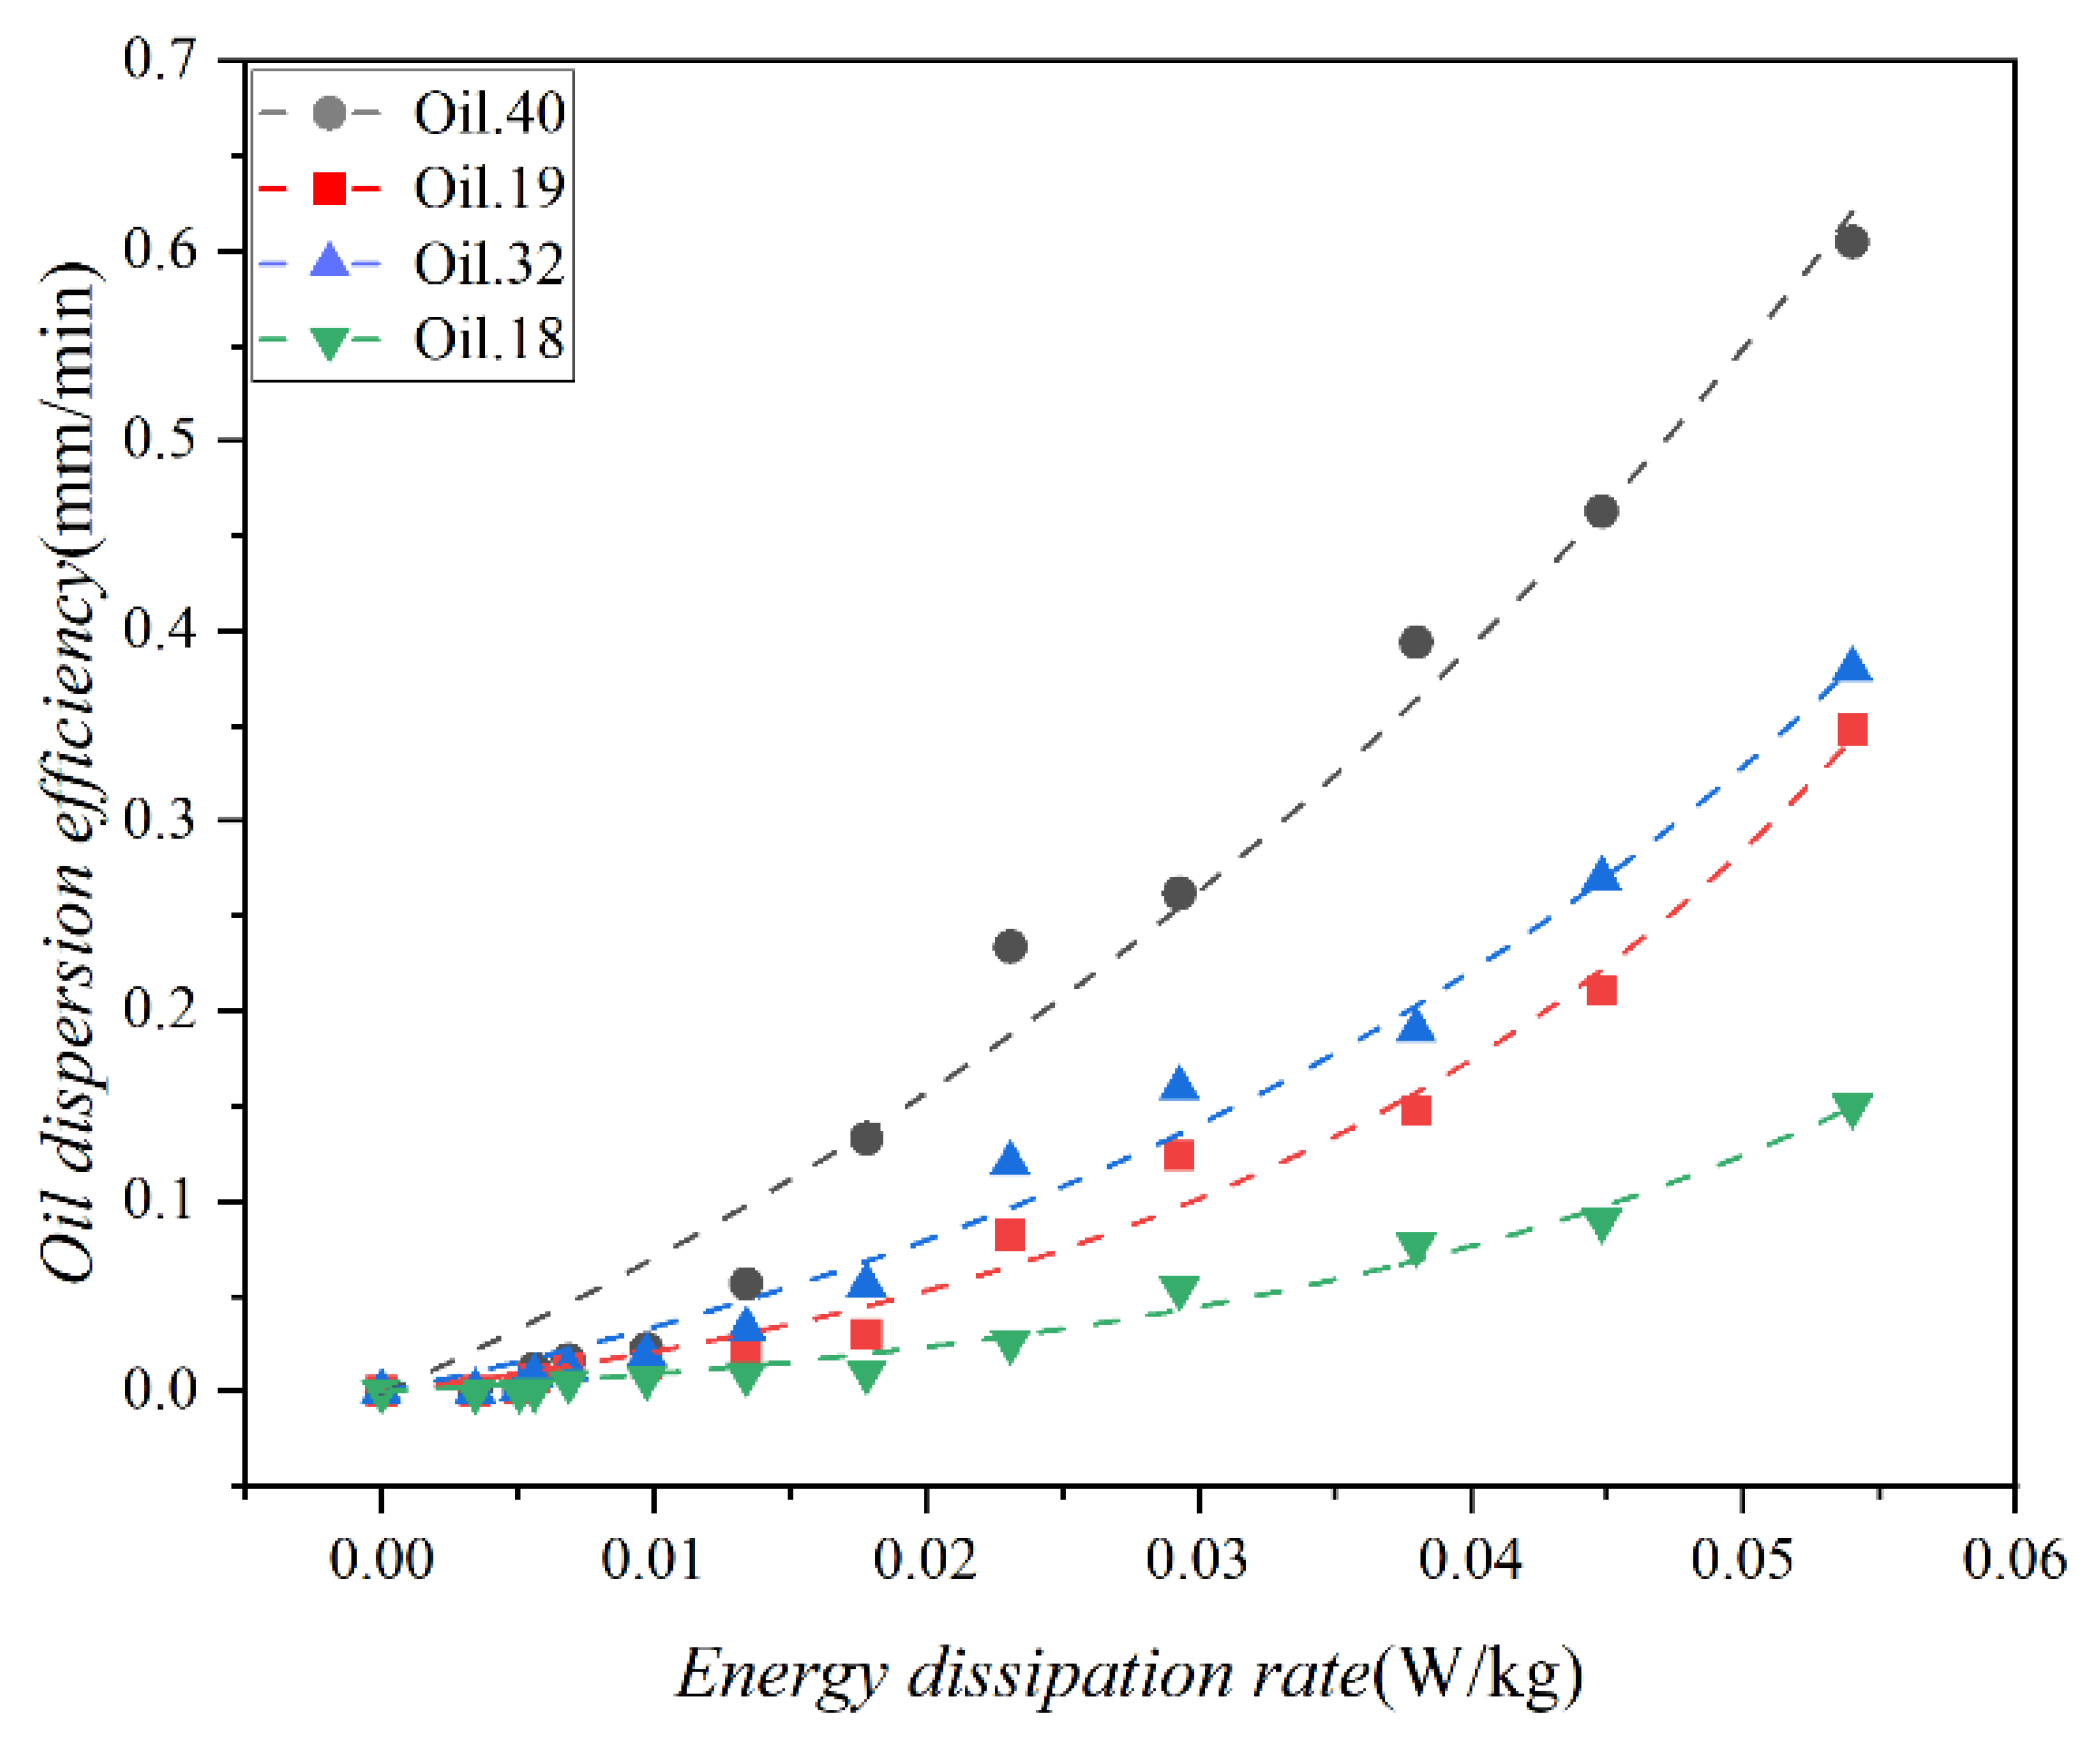
3.2. Effect of Mixing Energy on the Oil Dispersion

The effect of mixing energy on dispersion efficiency was evaluated for each of the four test oils. The Doppler velocimeter was used to obtain the flow velocity, and the relationship between dispersion efficiency and flow velocity is shown in Figure 9. The exponential function was employed to model the scattering data, resulting in R2 values of 0.97, 0.98, 0.99, and 0.97, respectively. Additionally, the standard deviation of the dispersion strength in three tests was 0.01. These findings highlight a strong correlation between oil dispersion efficiency and flow velocity, following the exponential function.
As can be seen from Figure 9, the dispersion efficiency increases with higher current speed, indicating that water flow enhances the oil dispersion rate, consistent with the findings of Li and Garrett (1998) [45]. They reported an increase in oil spill entrainment into the water body with higher levels of ocean turbulence. The evolution of dispersion efficiency with water flow rate unfolds in two distinct stages. Initially, when the flow rate is below 0.04 m/s, a slow dispersion stage is observed. During this stage, the efficiency of oil dispersed into the lower water body remains relatively stable, with minor variations as the flow velocity increases. However, once the flow velocity exceeds 0.04 m/s, a rapid dispersion stage becomes evident. This stage is characterized by a substantial escalation in oil dispersion efficiency corresponding to an increase in flow velocity. Here, the efficiency of oil dispersion accelerates notably with the rise in flow velocity. The slow dispersion stage can be attributed to relatively weak hydrodynamic forces, resulting in insufficient shear stress within the water flow to break down the oil into smaller droplets at the oil–water interface, keeping the oil relatively stable. In contrast, as the water flow rate increases, the shear force exerted by the water flow surpasses the oil–water interface tension, triggering a rapid dispersion of oil into the lower layers of the water body due to turbulence induced by the water flow.
The energy dissipation rate is a crucial metric for characterizing the mixing energy of water current, and a mathematical correlation between oil dispersion efficiency and the energy dissipation rate has been commonly established in previous research. The computation of the energy dissipation rate for the test water at various mixing speeds was enabled by Equation (2). The relationship between dispersion efficiency and the energy dissipation rate is illustrated in Figure 10. It is evident from the figure that dispersion efficiency exhibits a positive correlation with the energy dissipation rate. Specifically, when the energy dissipation rate is low, the disparity in dispersion efficiency among the four oils is not pronounced. However, as the energy dissipation rate increases, so does the difference in dispersion efficiency. The influence of wave perturbation on dispersion is notable, particularly for Oil 40, where it significantly augments dispersion. Conversely, its impact on Oil 18 is relatively minor. This discrepancy arises primarily from the considerably higher viscosity of Oil 18 compared to Oil 40. This observation underscores that the physical properties of the oil exert a more substantial influence on oil dispersion from a spill than the wave intensity.
Nonlinear fitting analysis of the observed data resulted in R2 of 0.99, 0.99, 0.99, and 0.99, respectively, with mean Square of Residual of 0.0027, 1.689 × 10⁻⁴, 3.245 × 10⁻⁴, 6.791 × 10⁻⁵. The equations are as follows:
E = 0.328 × e ( ε 0.051 ) 0.328
E = 0.104 × e ( ε 0.035 ) 0.104
E = 0.019 × e ( ε 0.025 ) 0.019
where ε is the energy dissipation rate of the test water, W/kg. In a real oil spill incident, the parameters of a specific oil dispersion can be experimentally determined to ascertain the efficiency of the dispersion under particular sea conditions.

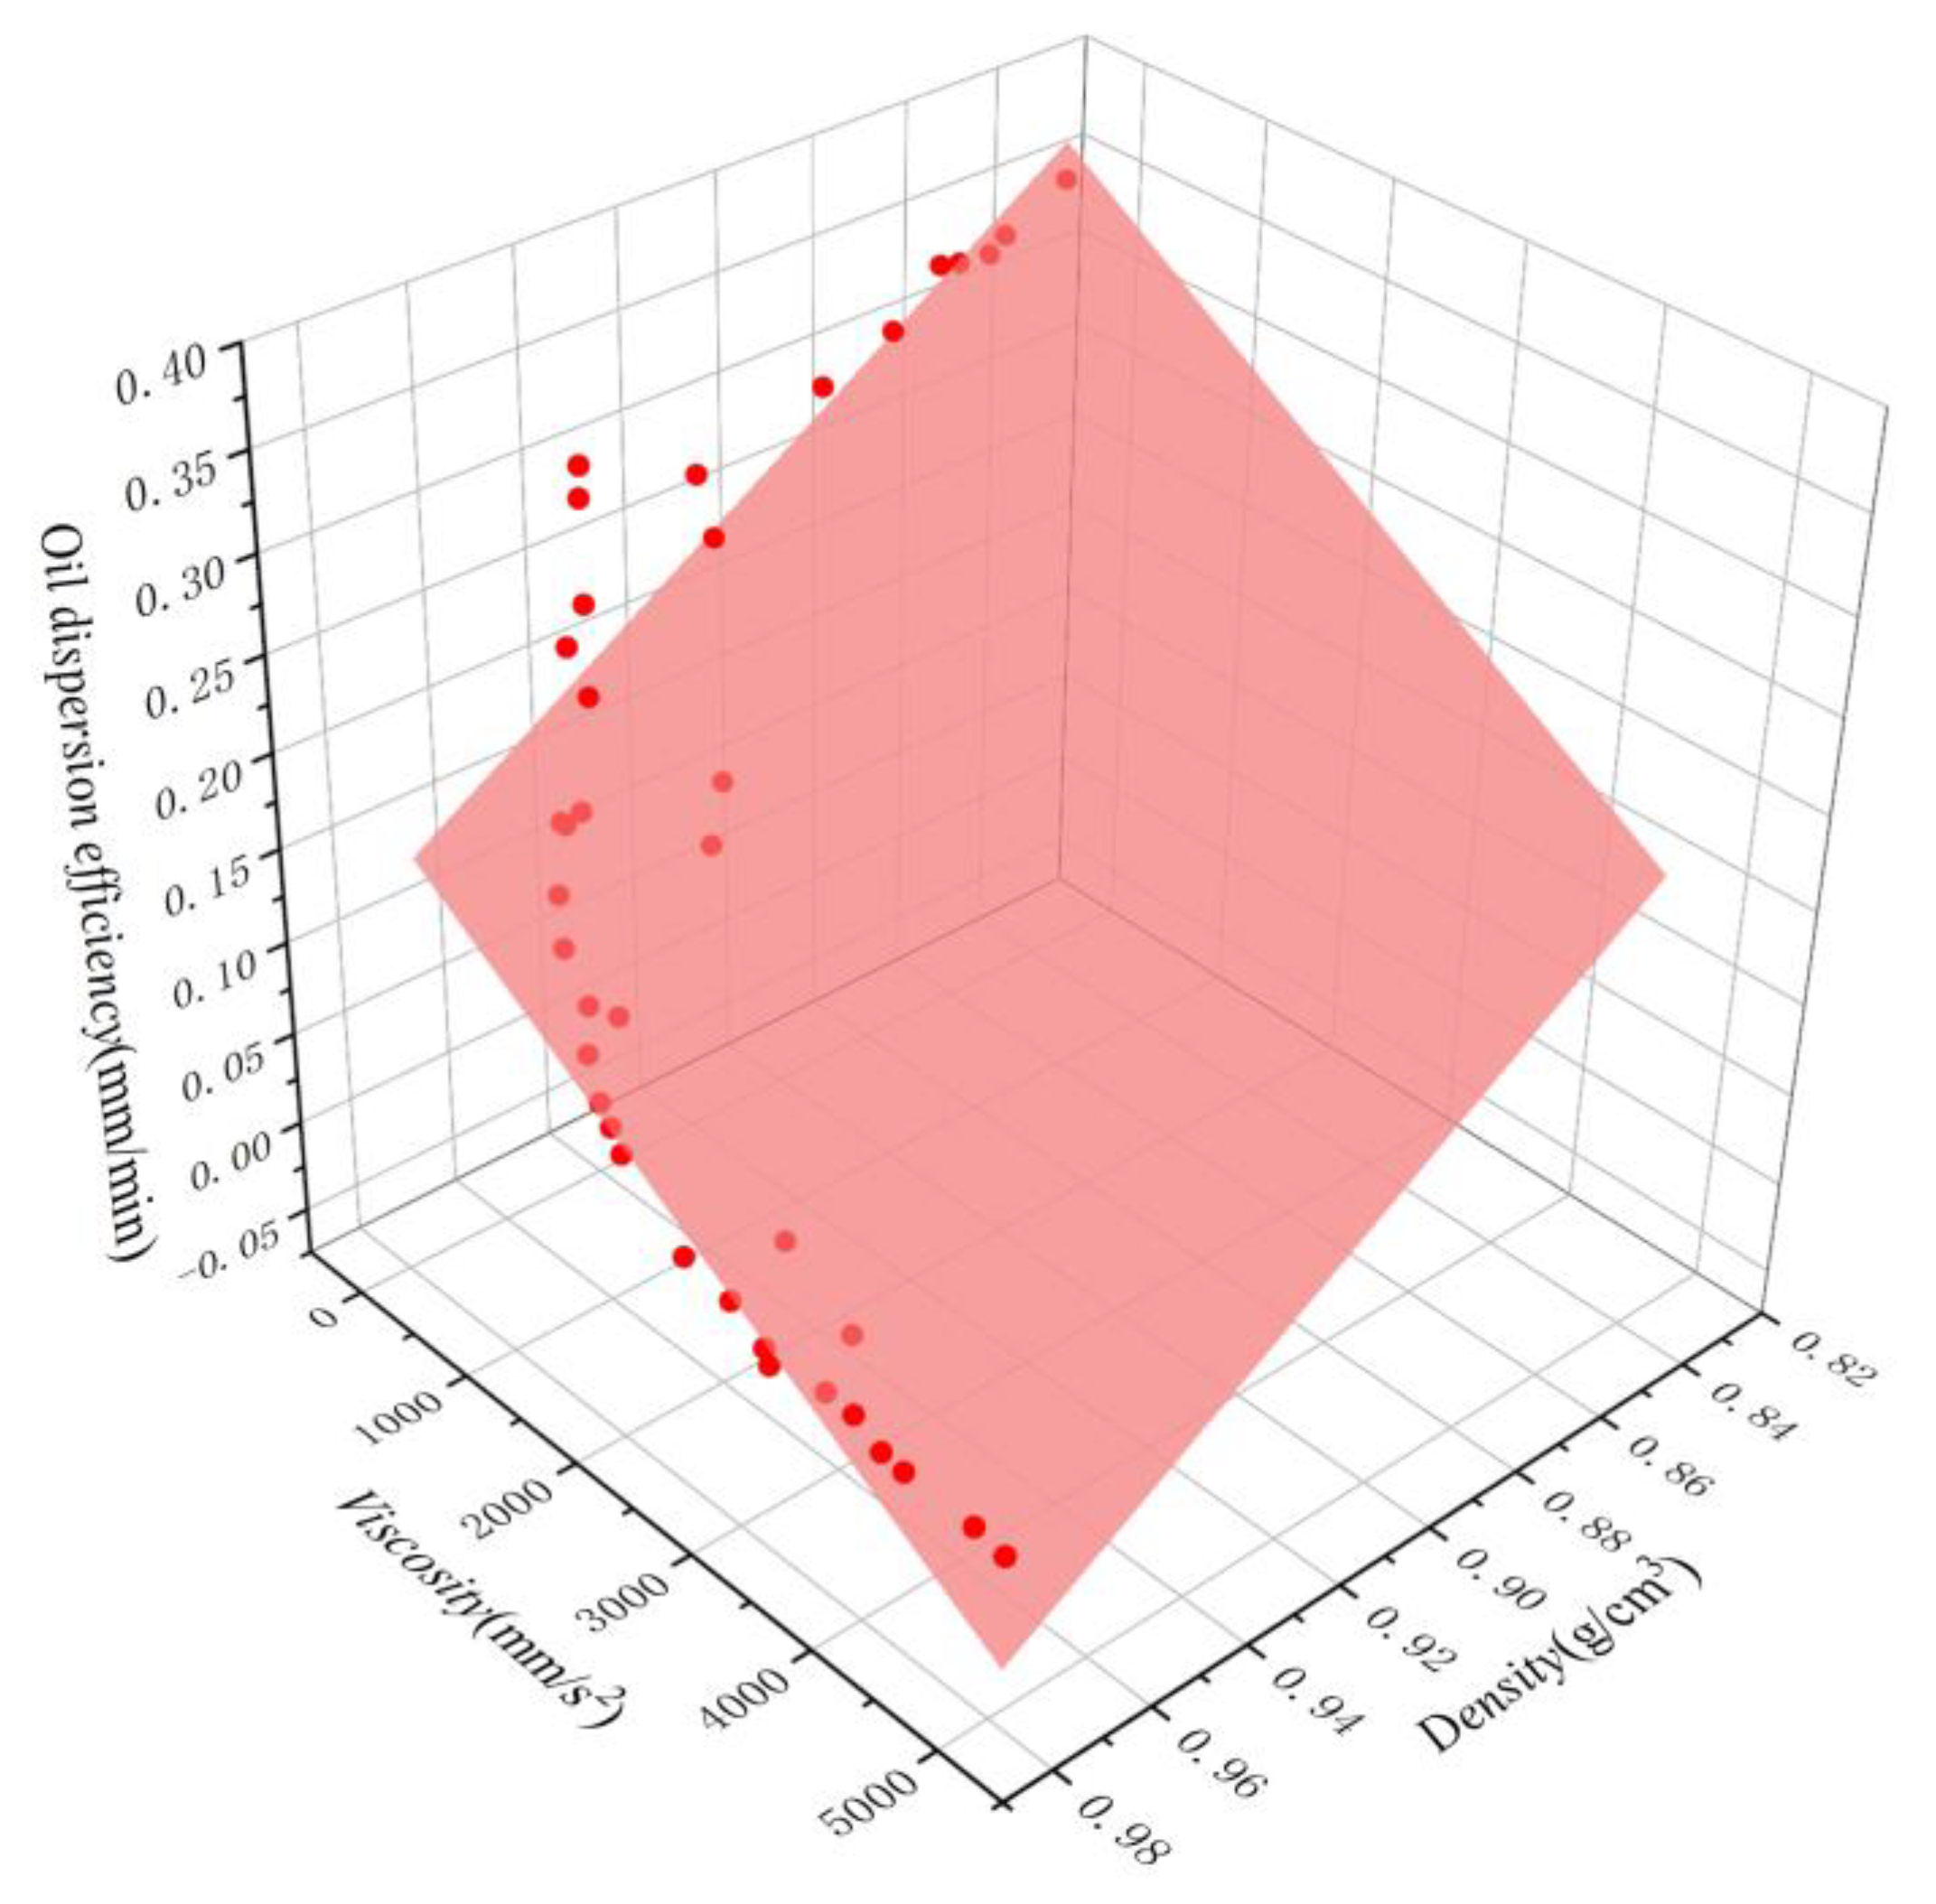
3.3. Effect of Oil Type on the Oil Dispersion

Previous studies have identified density, viscosity, and surface tension as key factors influencing the dispersion process of oil [27,46]. To establish a quantitative relationship between physical properties and dispersion efficiency, we conducted dispersion tests for 40 oils at 20 °C with an agitator speed of 800 rpm. The partial correlation analysis method was applied to identify the major influences on dispersion efficiency [47]. The results of the analysis (Table 3) revealed significant correlations between oil dispersion efficiency and both density (r = −0.801, p ˂ 0.01) and viscosity (r = −0.812, p ˂ 0.01). However, the significance value (p = 0.113 > 0.05) between dispersion strength and surface tension suggests that surface tension has a limited effect on dispersion efficiency. These conclusions align with the findings of Zeinstra Helfrich et al., (2016) [48], who observed that the interfacial tension of the oil had no significant effect on the entrainment of the oil slick on the surface. Instead, interfacial tension was found to play a crucial role in the subsequent droplet fragmentation process.
Multiple stepwise regression analysis was employed to analyze the dispersion efficiency data to obtain a linear regression equation and nonlinear regression equations between dispersion efficiency and density and viscosity. The equation is as follows:
E = 1.5831 × ρ 4.49 × 10 5 × μ + 1.6972   ( R 2 = 0.905 )
E = 0.5658 0.5781 × ρ + 0.2631 × e 0.0012 × μ   ( R 2 = 0.987 )
where ρ is the oil density (g/cm3) and μ is the oil viscosity (mm2/s). The significance test p-values of the viscosity regression coefficient, density regression coefficient, and regression equation were 1.469 × 10⁻¹⁶, 3.077 × 10⁻⁸, and 7.781 × 10⁻⁸, respectively, and they were all <0.01, indicating that the multiple regression model was statistically significant.
The fitted curves for both equations are shown in Figure 11 and Figure 12. A comparison between the simulated and experimental values of the two regression models revealed that the multiple nonlinear regression equations are better fitted and more accurate, effectively representing the quantitative relationship between dispersion efficiency and density and viscosity. To verify the reliability of the multivariate nonlinear regression model, five independent tests were conducted, and the results are shown in Table 4. It is evident that the relative errors between predicted and measured values range from 3.7% to 20.0%, with an average relative error of 9.28%. This suggests that the multivariate nonlinear regression can be utilized for the rough calculation of oil dispersion efficiency.

4. Conclusions

In this paper, the effects of temperature, salinity, oil type, and mixing energy on the dispersion of spilled oil have been studied. The results revealed a two-phase natural oil spill dispersion process: a rapid dispersion phase and a slower dispersion phase, marked by an inflection point around 31 min. Notably, temperature significantly influences oil spill dispersion dynamics, leading to increased dispersion volume and acceleration in reaching the inflection point as temperature rises. Conversely, salinity has a relatively minor impact on the oil spill dispersion process. Higher mixing energy facilitates oil spill dispersion, and dispersion efficiency shows an exponential correlation with the energy dissipation rate. Partial correlation analysis showed a negative correlation between oil dispersion efficiency and the density and viscosity of oil, while surface tension had no significant effect. Multivariate nonlinear regression models were employed to establish the connection between dispersion efficiency and the parameters of density and viscosity, resulting in well-fitting models. To verify the reliability of these models, five independent test sets were conducted, yielding an average relative error of 9.28%. This underscores the enhanced accuracy of the multivariate nonlinear regression model in describing the relationship between dispersion strength and oil physical properties. It is important to note that the conclusions in this study are applicable only to hydrodynamic conditions where the energy dissipation rate is less than 0.06 W/kg. For oil dispersion rates under breaking waves, further experimentation under conditions with higher mixing energies will be the focus of our forthcoming study.

Author Contributions

Conceptualization, C.W.; Methodology, L.H.; Software, A.J.; Formal analysis, J.W.; Resources, Y.Z.; Data curation, Y.Z., J.W. and X.N.; Writing—original draft, C.W.; Writing—review & editing, C.W.; Visualization, A.J.; Supervision, L.H. and X.N.; Project administration, L.H.; Funding acquisition, L.H. All authors have read and agreed to the published version of the manuscript.

Funding

This project was supported by the National Natural Science Foundation of China (Grant No. 51979079).

Institutional Review Board Statement

Not applicable.

Informed Consent Statement

Not applicable.

Data Availability Statement

The data presented in this study are available on request from the corresponding author.

Conflicts of Interest

The authors declare no conflict of interest.

References

  1. National Academies of Sciences, Engineering, and Medicine. Oil in the Sea IV: Inputs, Fates, and Effects; The National Academies Press: Washington, DC, USA, 2022. [Google Scholar] [CrossRef]
  2. Han, L.; Wang, C.; Jiang, A. Research progress of migration and transformation of oil pollutants from emergency spills in water. Water Resour. Prot. 2021, 37, 110–117. [Google Scholar]
  3. Zeinstra-Helfrich, M.; Koops, W.; Dijkstra, K.; Murk, A.J. Quantification of the effect of oil layer thickness on entrainment of surface oil. Mar. Pollut. Bull. 2015, 96, 401–409. [Google Scholar] [CrossRef] [PubMed]
  4. Michel, J.; Hansen, K.A. Sunken and submerged oil. In Oil Spill Science and Technology; Fingas, M., Ed.; Elsevier Inc.: Amsterdam, The Netherlands, 2017; pp. 731–758. [Google Scholar]
  5. Tkalich, P.; Chan, E.S. Vertical mixing of oil droplets by breaking waves. Mar. Pollut. Bull. 2002, 44, 1219–1229. [Google Scholar] [CrossRef] [PubMed]
  6. French-McCay, D.P.; Jayko, K.; Li, Z.; Spaulding, M.L.; Crowley, D.; Mendelsohn, D.; Horn, M.; Isaji, T.; Kim, Y.H.; Fontenault, J. Oil fate and mass balance for the Deepwater Horizon oil spill. Mar. Pollut. Bull. 2021, 171, 112681. [Google Scholar] [CrossRef] [PubMed]
  7. Ortmann, A.C.; Cobanli, S.E.; Wohlgeschaffen, G.; MacDonald, J.; Gladwell, A.; Davis, A.; Robinson, B.; Mason, J.; King, T.L. Measuring the fate of different diluted bitumen products in coastal surface waters. Mar. Pollut. Bull. 2020, 153, 111003. [Google Scholar] [CrossRef] [PubMed]
  8. Li, C.; Miller, J.; Wang, J.; Koley, S.S.; Katz, J. Size distribution and dispersion of droplets generated by impingement of breaking waves on oil slicks. J. Geophys. Res. Ocean. 2017, 122, 7938–7957. [Google Scholar] [CrossRef]
  9. Boufadel, M.C.; Bechtel, R.D.; Weaver, J. The movement of oil under non-breaking waves. Mar. Pollut. Bull. 2006, 52, 1056–1065. [Google Scholar] [CrossRef]
  10. Li, Z.; Lee, K.; King, T.; Boufadel, M.C.; Venosa, A.D. Evaluating crude oil chemical dispersion efficacy in a flow-through wave tank under regular non-breaking wave and breaking wave conditions. Mar. Pollut. Bull. 2009, 58, 735–744. [Google Scholar] [CrossRef]
  11. Holder, E.L.; Conmy, R.N.; Venosa, A.D. Comparative laboratory-scale testing of dispersant effectiveness of 23 crude oils using four different testing protocols. J. Environ. Prot. 2015, 6, 628. [Google Scholar] [CrossRef]
  12. Jiang, P.; Tong, S.; Wang, Y.; Xu, G. Modelling the oil spill transport in inland waterways based on experimental study. Environ. Pollut. 2021, 284, 117473. [Google Scholar] [CrossRef]
  13. Malarkey, J.; Davies, A.G. Modelling wave–current interactions in rough turbulent bottom boundary layers. Ocean. Eng. 1998, 25, 119–141. [Google Scholar] [CrossRef]
  14. Forrester, W.D. Distribution of suspended oil particles following the grounding of the tanker arrow. J. Mar. Res. 1971, 29, 151–170. [Google Scholar]
  15. Zhao, X.; Ya, Z.; Wang, Z.; Sun, B.; Fu, H.; Bénédicte, M.-C.J. Study on the Effects of Waves and Dispersant on the Submergence of Spilled Oil. Water Resour. 2020, 47, 95–102. [Google Scholar] [CrossRef]
  16. Chen, Z.; Zhan, C.S.; Lee, K.; Li, Z.K.; Boufadel, M. Modeling oil droplet formation and evolution under breaking waves. Energy Sources Part A Recovery Util. Environ. Eff. 2009, 31, 438–448. [Google Scholar] [CrossRef]
  17. Yu, Y.; Qi, Z.; Li, W.; Fu, S.; Yu, X.; Xiong, D. Effects of physical parameters and chemical dispersant on the formation of oil-particle aggregates (OPAs) in marine environments. Mar. Pollut. Bull. 2019, 148, 66–74. [Google Scholar] [CrossRef] [PubMed]
  18. Pan, Z.; Zhao, L.; Boufadel, M.C.; King, T.; Robinson, B.; Conmy, R.; Lee, K. Impact of mixing time and energy on the dispersion effectiveness and droplets size of oil. Chemosphere 2017, 166, 246–254. [Google Scholar] [CrossRef] [PubMed]
  19. Zhu, Z.; Merlin, F.; Yang, M.; Lee, K.; Chen, B.; Liu, B.; Cao, Y.; Song, X.; Ye, X.; Li, Q.K.; et al. Recent advances in chemical and biological degradation of spilled oil: A review of dispersants application in the marine environment. J. Hazard. Mater. 2022, 436, 129260. [Google Scholar] [CrossRef]
  20. Cao, R.; Chen, H.; Li, H.; Fu, H.; Wang, Y.; Bao, M.; Tuo, W.; Lv, X. A mesoscale assessment of sinking oil during dispersant treatment. Ocean. Eng. 2022, 263, 112341. [Google Scholar] [CrossRef]
  21. Li, W.; Yu, Y.; Xiong, D.; Qi, Z.; Wang, W.; Qi, Y. Effects of oil properties on the formation of oil-particle aggregates at the presence of chemical dispersant in baffled flask tests. J. Hazard. Mater. 2022, 436, 129227. [Google Scholar] [CrossRef]
  22. Li, Z.; Lee, K.; King, T.; Boufadel, M.C.; Venosa, A.D. Effects of temperature and wave conditions on chemical dispersion efficacy of heavy fuel oil in an experimental flow-through wave tank. Mar. Pollut. Bull. 2010, 60, 1550–1559. [Google Scholar] [CrossRef]
  23. Yu, Y.; Qi, Z.; Xiong, D.; Sun, R.; Fu, S.; Li, W. Oil dispersion and aggregation with suspended particles in a wave tank. J. Environ. Manag. 2021, 278, 111572. [Google Scholar] [CrossRef] [PubMed]
  24. El Hamouz, A. Effect of surfactant concentration and operating temperature on the drop size distribution of silicon oil water dispersion. J. Dispers. Sci. Technol. 2007, 28, 797–804. [Google Scholar] [CrossRef]
  25. Chandrasekar, S.; Sorial, G.A.; Weaver, J.W. Dispersant effectiveness on oil spills-impact of salinity. ICES J. Mar. Sci. 2006, 63, 1418–1430. [Google Scholar] [CrossRef]
  26. Riehm, D.A.; McCormick, A.V. The role of dispersants’ dynamic interfacial tension in effective crude oil spill dispersion. Mar. Pollut. Bull. 2014, 84, 155–163. [Google Scholar] [CrossRef] [PubMed]
  27. Wrenn, B.; Virkus, A.; Mukherjee, B.; Venosa, A. Dispersibility of crude oil in fresh water. Environ. Pollut. 2009, 157, 1807–1814. [Google Scholar] [CrossRef] [PubMed]
  28. Qi, Z.; Yu, Y.; Yu, X.; Li, W.; Fu, S.; Xiong, D. Effect of the concentration and size of suspended particulate matter on oil-particle aggregation. Mar. Pollut. Bull. 2020, 153, 110957. [Google Scholar] [CrossRef] [PubMed]
  29. Pacek, A.W.; Nienow, A.W. High flow, low shear impellers versus high shear impellers; dispersion of oil drops in water and other examples. Chem. Process Eng. 2021, 42, 77–90. [Google Scholar]
  30. Cui, F.; Daskiran, C.; King, T.; Robinson, B.; Lee, K.; Katz, J.; Boufadel, M.C. Modeling oil dispersion under breaking waves. Part I: Wave hydrodynamics. Environ. Fluid Mech. 2020, 20, 1527–1551. [Google Scholar] [CrossRef]
  31. Li, W.; Wang, W.; Qi, Y.; Qi, Z.; Xiong, D. Combined effects of chemical dispersant and suspended minerals on the dispersion process of spilled oil. J. Environ. Manag. 2023, 341, 118110. [Google Scholar] [CrossRef]
  32. Hoshyar, P.; Kolahdoozan, M.; Imanian, H. The effects of droplet size distribution and wave characteristics on the vertical dispersion of spilled oil due to regular non-breaking waves. J. Sea Res. 2023, 192, 102355. [Google Scholar] [CrossRef]
  33. Imanian, H.; Kolahdoozan, M. Dispersion Rate of Spilled Oil in Water Column under Non-Breaking Water Waves. Int. J. Civ. Environ. Eng. 2016, 10, 1064–1067. [Google Scholar]
  34. Cheng, N.L. Handbook of Solvents, 4th ed.; Chemical Industry Press: Beijing, China, 2007; pp. 216–218. [Google Scholar]
  35. Li, Z.; Lee, K.; King, T.; Boufadel, M.C.; Venosa, A.D. Assessment of chemical dispersant effectiveness in a wave tank under regular non-breaking and breaking wave conditions. Mar. Pollut. Bull. 2008, 56, 903–912. [Google Scholar] [CrossRef] [PubMed]
  36. Reed, M.; Johansen, Ø.; Leirvik, F.; Brørs, B. Numerical Algorithm to Compute the Effects of Breakingwaves on Surface Oil Spilled at Sea. Final Report Submitted to the Coastal Response Research Center, Report F; SINTEF Institute for Materials and Chemistry: Trondheim, Norway, 2009. [Google Scholar]
  37. Traykovski, P.; Trowbridge, J.; Kineke, G. Mechanisms of surface wave energy dissipation over a high-concentration sediment suspension. J. Geophys. Res. Ocean. 2015, 120, 1638–1681. [Google Scholar] [CrossRef]
  38. Terray, E.; Donelan, M.; Agrawal, Y.; Drennan, W.; Kahma, K.; Williams, A.; Hwang, P.; Kitaigorodskii, S. Estimates of kinetic energy dissipation under breaking waves. J. Phys. Oceanogr. 1996, 26, 792–807. [Google Scholar] [CrossRef]
  39. Kaku, V.J.; Boufadel, M.C.; Venosa, A.D.; Weaver, J. Flow dynamics in eccentrically rotating flasks used for dispersant effectiveness testing. Environ. Fluid Mech. 2006, 6, 385–406. [Google Scholar] [CrossRef]
  40. Chen, N. The Power Calculation of the Stirrer Based on CFX. Chem. Equip. Technol. 2014, 35, 27–29. [Google Scholar]
  41. Delvigne, G.A.L.; Sweeney, C.E. Natural dispersion of oil. Oil Chem. Pollut. 1988, 4, 281–310. [Google Scholar] [CrossRef]
  42. Kennedy, J.J.; Rayner, N.A.; Atkinson, C.P.; Killick, R.E. An ensemble data set of sea surface temperature change from 1850: The Met Office Hadley Centre HadSST. 4.0. 0.0 data set. J. Geophys. Res. Atmos. 2019, 124, 7719–7763. [Google Scholar] [CrossRef]
  43. GB17378.4-2007; The Specification for Marine Monitoring-Part 4: Seawater Analysis. Chinese GB Standard: Beijing, China, 2007. Available online: https://www.antpedia.com/standard/en/5158340.html (accessed on 1 November 2023).
  44. Yang, Q.; Xu, J.; Li, W. Study of the dissolution process of oil spills at sea. Mar. Environ. Sci. 1992, 11, 24–28. [Google Scholar]
  45. Li, M.; Garrett, C. The relationship between oil droplet size and upper ocean turbulence. Mar. Pollut. Bull. 1998, 36, 961–970. [Google Scholar] [CrossRef]
  46. Mukherjee, B.; Turner, J.; Wrenn, B.A. Effect of oil composition on chemical dispersion of crude oil. Environ. Eng. Sci. 2011, 28, 497–506. [Google Scholar] [CrossRef]
  47. Jekabsons, G.; Lavendels, J.; Sitikovs, V. Model evaluation and selection in multiple nonlinear regression analysis. Math. Model. Anal. 2007, 12, 81–90. [Google Scholar] [CrossRef]
  48. Zeinstra-Helfrich, M.; Koops, W.; Murk, A.J. How oil properties and layer thickness determine the entrainment of spilled surface oil. Mar. Pollut. Bull. 2016, 110, 184–193. [Google Scholar] [CrossRef] [PubMed]
Figure 1. Schematic representation of the experimental facility. (1. Oil containment device; 2. Mechanical agitators; 3. Doppler velocimeter; 4. Temperature control equipment; 5. Cubic container; 6. Syringe for adding oil; 7. Sampling point. The sampling port is a tube connected to a 100 mL syringe).
Jmse 12 00047 g001
Figure 2. Velocities and energy dissipation rates produced by the experimental agitator.
Jmse 12 00047 g002
Figure 3. Oil dispersed into water column under the influence of turbulent flow.
Jmse 12 00047 g003
Figure 4. Standard curve of Oil 1. (The rest of the oil standard curves are not listed here.)
Jmse 12 00047 g004
Figure 5. The temporal evolution of oil concentrations in water samples located 10 cm below the oil film under varying water temperatures (10 °C, 15 °C, 20 °C, 25 °C, and 30 °C).
Jmse 12 00047 g005
Figure 6. The dispersion efficiencies of 4 test oils (Oil 18, Oil 19, Oil 32, and Oil 40) at different temperatures (10 °C, 15 °C, 20 °C, 25 °C, and 30 °C).
Jmse 12 00047 g006
Figure 7. The temporal evolution of oil concentrations in water samples located 10 cm below the oil film under varying water salinity (0‰, 10‰, 15‰, 20‰, 25‰, and 30‰).
Jmse 12 00047 g007
Figure 8. The dispersion efficiencies of 4 test oils (Oil 18, Oil 19, Oil 32, and Oil 40) at different salinities (0‰, 10‰, 15‰, 20‰, 25‰, and 30‰).
Jmse 12 00047 g008
Figure 9. Variation in the dispersion efficiency of the 4 oils (Oil 18, Oil 19, Oil 32, and Oil 40) as a function of the water flow velocity, the scatter points represent the experimental results, and the curves represent the corresponding data fits.
Jmse 12 00047 g009
Figure 10. Variation in the dispersion efficiency of the 4 oils (Oil 18, Oil 19, Oil 32, and Oil 40) as a function of the energy dissipation rate, the scatter points represent the experimental results, and the curves represent the corresponding data fits.
Jmse 12 00047 g010
Figure 11. Oil dispersion efficiency of oils as a function of density and viscosity. The scatter points represent the experimental results, while the surfaces represent the corresponding linear regression.
Jmse 12 00047 g011
Figure 12. Oil dispersion efficiency of oils as a function of density and viscosity. The scatter points represent the experimental results, while the surfaces represent the corresponding nonlinear regression model fitting.
Jmse 12 00047 g012
Table 1. Physical properties of experimental oils.
No.Density (20 °C) (g/cm3)Viscosity (20 °C) (mm2/s)Surface Tension (20 °C) (mN/m)
10.97535329.1921.1
20.9754911.8921.3
30.97443016.4820.9
40.97434647.4621.2
50.97434099.0921
60.97423917.1421.2
70.97262899.5221.1
80.9722196.9221
90.97182582.1321.2
100.97181660.5421.1
110.97183597.4321.1
120.97163362.2121.1
130.97031504.621
140.97031413.7820.8
150.96951283.5420.7
160.96431063.5120.6
170.9641849.620.6
180.96111184.1429.9
190.9607659.8520.7
200.96013109.8921.2
210.9562384.3222.3
220.9541439.1920.2
230.954394.7820.5
240.95396.5529.3
250.9467159.4520
260.9434190.9926.9
270.941899.2619.8
280.94147.6319.5
290.9411.5719.7
300.9312721.0327.1
310.9247547.4925.2
320.918381.8625.5
330.915291.8730.7
340.890728.4725.7
350.875517.9925.7
360.865212.1226
370.8619.8423.1
380.85439.223.5
390.85087.8323.0
400.83735.2924.3
410.9742425.6321.1
420.862010.6223.2
430.9481400.0025.6
440.9423688.5320.5
450.97051621.5321.2
Table 2. Experimental conditions and factorial levels for oil dispersion experiments.
ExperimentRPMTemperature (°C)SalinityOil Type (No.)
Effect of temperature on the oil dispersion60010, 15, 20, 25, 3020‰18, 19, 32, 40
Effect of salinity on the oil dispersion6002020‰18, 19, 32, 40
Effect of mixing energy on the oil dispersion100, 200, 300, 400, 450, 500, 550, 600, 650, 700, 750, 8002020‰18, 19, 32, 40
Effect of oil type on the oil dispersion6002020‰1~40
Table 3. Results of partial correlation analysis between dispersion efficiency and density, viscosity, and surface tension.
DensityViscositySurface Tension
Partial correlation coefficient (PCE)−0.801−0.812−0.286
Statistical significance3.63 × 10−81.69 × 10−80.113
Table 4. Validation of a multiple nonlinear regression model for oil dispersion efficiency and its relationship with density and viscosity.
No.Experimental Results (mm/min)Calculated Results (mm/min)Relative Error (%)
410.00350.00362.9
420.33740.32503.7
430.15700.180214.8
440.13650.12975.0
450.06030.048220.0
Disclaimer/Publisher’s Note: The statements, opinions and data contained in all publications are solely those of the individual author(s) and contributor(s) and not of MDPI and/or the editor(s). MDPI and/or the editor(s) disclaim responsibility for any injury to people or property resulting from any ideas, methods, instructions or products referred to in the content.

