Article

Applicability Evaluation of the Global Synthetic Tropical Cyclone Hazard Dataset in Coastal China

1
First Institute of Oceanography, Ministry of Natural Resources of China, Qingdao 266061, China
2
College of Oceanography and Space Informatics, China University of Petroleum (East China), Qingdao 266580, China
3
Duyun Power Supply Bureau of Guizhou Power Grid Co., Ltd., Duyun 558000, China
*
Author to whom correspondence should be addressed.
J. Mar. Sci. Eng. 2024, 12(1), 73; https://doi.org/10.3390/jmse12010073
Submission received: 4 November 2023 / Revised: 16 December 2023 / Accepted: 19 December 2023 / Published: 27 December 2023
(This article belongs to the Special Issue Coastal Disaster Assessment and Response)

Abstract

:
A tropical cyclone dataset is an important data source for tropical cyclone disaster research, and the evaluation of its applicability is a necessary prerequisite. The Global Synthetic Tropical Cyclone Hazard (GSTCH) dataset is a dataset of global tropical cyclone activity for 10,000 years from 2018, and has become accepted as a major data source for the study of global tropical cyclone hazards. On the basis of the authoritative Tropical Cyclone Best Track (TCBT) dataset proposed by the China Meteorological Administration, this study evaluated the applicability of the GSTCH dataset in relation to two regions: the Northwest Pacific and China’s coastal provinces. For the Northwest Pacific, the results show no significant differences in the means and standard deviations of landfall wind speed, landfall pressure, and annual occurrence number between the two datasets at the 95% confidence level. They also show the cumulative distributions of central minimum pressure and central maximum wind speed along the track passed the Kolmogorov–Smirnov (K-S) test at the 95% confidence level, thereby verifying that the GSTCH dataset is consistent with the TCBT dataset at sea-area scale. For China’s coastal provinces, the results show that the means or standard deviations of tropical cyclone characteristics between the two datasets were not significantly different in provinces other than Guangdong and Hainan, and further analysis revealed that the cumulative distributions of the tropical cyclone characteristics in Guangdong and Hainan provinces passed the K-S test at the 95% confidence level, thereby verifying that the GSTCH dataset is consistent with the TCBT dataset at province scale. The applicability evaluation revealed that no significant differences exist between most of the tropical cyclone characteristics in the TCBT and GSTCH datasets, and that the GSTCH dataset is an available and reliable data source for tropical cyclone hazard studies in China’s coastal areas.

1. Introduction

Tropical cyclones (TCs), also referred to as typhoons, are one of the most severe types of natural disasters [1], and usually manifest as strong destructive winds and heavy precipitation that can severely impact people, economies and the environment in coastal areas when they make landfall [2,3]. The damage caused by TCs includes wind-induced damage and storm surges risk due to rising water levels [4]. Storm surges, which are the main secondary disaster hazard triggered by TCs, present high disaster intensity [5], and are often the greatest threat to life and property [6,7]. With rising sea levels and rapid economic development in coastal areas, the losses caused by TCs have dramatically increased and will pose an increasing and extreme hazard around the globe [8,9]. It is therefore crucial to study TC hazards for TC risk assessments and corresponding TC risk management.
A reliable TC dataset is of great importance both for TC hazards research and for sustainable development in coastal areas [10,11,12]. Currently, the most commonly used TC dataset resources include the China Meteorological Administration (CMA) dataset, the Japan Meteorology Agency (JMA) dataset, and the Joint Typhoon Warning Center (JTWC) dataset [13]. According to TC records, approximately 90 (±10) TCs per year are formed globally [14], of which 16, on average, make landfall with wind speeds greater than 33 m/s [15]. It is thus clear that the amount of TC data available for regional hazard research is limited, and that this problem must be addressed by the establishment of suitable datasets.
To expand the TC data resource, many studies have used historical tropical cyclone data (HTCD) to generate a large amount of synthetic tropical cyclone data (STCD) using various methods. One method is to create STCD through statistical resampling and the modeling of historical TC tracks and intensities of meteorological datasets from climate patterns [16,17,18,19,20,21]. This method, which has been explored widely, has been used by Bloemendaal et al. to create the Global Synthetic Tropical Cyclone Hazard (GSTCH) dataset [2]. The GSTCH dataset, which includes information on TC track, intensity, and size, is particularly useful for TC risk assessment because it serves as input for storm surge and wave impact modeling and has characteristics that are important for wind damage assessment [22]. At the same time, the dataset length of 10,000 years enables it to perform proper statistical analysis of the return periods of various landfalling TCs.
Before a dataset can be applied to a specific area and a specific research purpose, its availability and reliability must be evaluated. Many previous studies have shown that the mean, standard deviation, frequency distribution and cumulative distribution of the TC features can be used to assess the consistency of STCD with HTCD. Bloemendaal et al. compared the means and standard deviations of TC features, believing that a mean value within the standard deviation verified the consistency of STCD with HTCD [2]. Vickery et al. performed a T-test on the mean and an F-test on the standard deviation of each TC feature to evaluate whether statistically significant differences existed between STCD and HTCD. Then, for those TC features whose mean or standard deviation values did not pass the test, a Chi-squared test was used to examine the frequency distribution [16]. Similarly, Nakajo et al. [23] and Lee et al. [24] also compared the frequency distribution and the cumulative distribution of TC features in STCD and HTCD to evaluate the performance of STCD. Additionally, the degree of consistency between STCD and HTCD was analyzed for specific study areas by applying the path assessment method to the paths of TCs in both datasets [2,13,23,24]. In summary, the mean, standard deviation, frequency distribution, cumulative distribution, and corresponding hypothesis tests have primarily been used to evaluate the degree of consistency between STCD and HTCD.
Because of the global coverage and the large number of TCs, the GSTCH dataset is also a crucial data source for TC hazard assessment and TC risk management in coastal China. The objective of this study is to evaluate the applicability of the GSTCH dataset for further research and application in coastal China. The standard dataset for the evaluation is the Tropical Cyclone Best Track (TCBT) dataset proposed by the CMA [25,26]. The TC characteristics used include the central maximum wind speed along the track, central minimum pressure along the track, landfall wind speed, landfall pressure, annual occurrence number, and annual landfall number. The Northwest Pacific is the sea area with the highest frequency, strongest intensity, and greatest impact on China in terms of global TCs [27,28]. Over one third of global TCs occurred in this area, and approximately nine TCs made landfall in the coastal areas of China per year from 1950 to 2019 [29]. Therefore, the applicability evaluation of the GSTCH dataset in this study is performed in relation to two regions—the Northwest Pacific and the provinces of coastal China.

2. Materials and Methods

2.1. The GSTCH Dataset

The GSTCH dataset on TC characteristics on a global scale was presented by Bloemendaal et al. using a newly developed synthetic resampling algorithm called the Synthetic Tropical cyclOne geneRation Model (STORM). TC characteristics in the GSTCH dataset comprise the time of occurrence (year and month), order of occurrence, longitude, latitude, central minimum pressure, central maximum wind speed, radius of maximum wind speed, whether landfall occurred and distance from land. These characteristics were extracted from the global historical dataset International Best Track Archive for Climate Stewardship (IBTrACS) for the time period 1980–2018 (38 years of data), and were statistically extended to 10,000 years of TC activity under present climate conditions [2,30]. The IBTrACS dataset was developed under the auspices of the World Data Center for Meteorology of the National Oceanic and Atmospheric Administration by collecting and integrating TC datasets from 12 national meteorological offices that included those of China, Japan, the United States, and Australia [31,32]. Bloemendaal et al. validated the performance of the GSTCH dataset by demonstrating that the mean values of various TC characteristics are within one standard deviation from those found in the IBTrACS dataset and showed that this dataset can be used by anyone interested in studying the different aspects of TCs and the wind and storm surge hazards they trigger [2,22].

2.2. The TCBT Dataset

The TCBT dataset is a multi-source, multi-time-scale, multi-spatial-scale, and comprehensive TC database, and includes relevant features of all TCs that passed across the Northwest Pacific during 1949–2021, e.g., the time of occurrence (year, month, day, and hour), central longitude and latitude, central minimum pressure, and central maximum wind speed of each TC [26,29]. The CMA overseen the compilation and release of the TCBT dataset, and it has developed strict procedures and rules to ensure that the dataset incorporates long temporal coverage, wide spatial coverage, various observational elements, and high accuracy [33]. The TCBT dataset has been passed through rigorous quality control and has always been considered to be the most authoritative TC dataset for the coastal areas of China [9]. Therefore, this study selects the TCBT dataset as the benchmark to evaluate the GSTCH dataset’s applicability in coastal China.
This study considered a 32 year (1990–2021) TCBT dataset. For comparability, 10 different sets of 32 year periods were selected randomly from the GSTCH dataset, and the statistical averages of the evaluation indicators of those 10 sets were taken as the evaluation indicators of TC characteristics. Finally, for the Northwest Pacific, 7122 TCs were selected from the GSTCH dataset, and 802 TCs were selected from the TCBT dataset. For coastal China provinces, 2230 TCs were selected from the GSTCH dataset, and 234 TCs were selected from the TCBT dataset.

2.3. TC Characteristics for Evaluation

TC intensity (peak intensity and landfall intensity), annual occurrence frequency, and annual landfall frequency are key TC characteristics [23]. The central maximum wind speed along the track and the central minimum pressure along the track represent the peak intensity of a TC. The landfall wind speed and landfall pressure represent the intensity of a TC when it makes landfall. The annual occurrence and landfall numbers represent the annual occurrence frequency and annual landfall frequency, respectively. Therefore, this study considered the central maximum wind speed along the track, central minimum pressure along the track, landfall wind speed, landfall pressure, annual occurrence number, and annual landfall number as typical TC characteristics for evaluation to verify the degree of consistency between the GSTCH and TCBT datasets.

2.4. Indicators for Evaluation

The degree of consistency between the GSTCH and TCBT datasets was evaluated using the mean, standard deviation, frequency distribution, cumulative distribution, and the corresponding T-test, F-test, Chi-squared test, and Kolmogorov–Smirnov (K-S) test. The mean and standard deviation reflect the average level and fluctuation of the TC characteristics of the GSTCH and TCBT datasets. The frequency distribution and the cumulative distribution indicate the overall distribution of the TC characteristics. T-test, F-test, Chi-squared test, and K-S test can determine whether statistically significant differences exist between the mean, standard deviation, frequency distribution, and cumulative distribution of the TC characteristics in the GSTCH and TCBT datasets.
The formulas for the calculation of the mean, standard deviation, T-test statistic, and F-test statistic [16] are as follows:
X 1 ¯ = i = 1 n 1 X i 1 n 1
X 2 ¯ = i = 1 n 2 X i 2 n 2
S 1 = i = 1 n 1 X i 1 X 1 ¯ 2 n 1 1
S 2 = i = 1 n 2 X i 2 X 2 ¯ 2 n 2 1
t = X 1 ¯ X 2 ¯ n 1 1 S 1 2 + n 2 1 s 2 2 n 1 + n 2 2 1 n 1 + 1 n 2
f = S 1 2 S 2 2
where X 1 ¯ and X 2 ¯ are the means of the TC characteristics in the TCBT dataset and the GSTCH dataset, respectively; S 1 and S 2 are the standard deviations of the TC characteristics in the TCBT dataset and the GSTCH dataset, respectively; t is the T-test statistic; f is the F-test statistic; X i 1 and X i 2 are the values of the TC characteristics in the TCBT dataset and the GSTCH dataset respectively, read directly from the two datasets; and n 1 and n 2 are the numbers of TC characteristics included in the TCBT dataset and the GSTCH dataset, respectively.
The formulas for the calculation of the frequency distribution and the Chi-squared test statistic [34] are as follows:
P 1 = f i 1 n 1 i = 1 , 2 , , m
P 2 = f i 2 n 2 i = 1 , 2 , , m
X d f 2 = i = 1 m f i 1 f i 2 2 f i 1
where P 1 and P 2 are the frequency distributions of the TC characteristics in the TCBT dataset and the GSTCH dataset, respectively; X d f 2 is the Chi-squared test statistic; f i 1 and f i 2 are the frequencies of the different values of TC characteristics falling into each group i (the groups are incremented according to the index i ) in the TCBT dataset and the GSTCH dataset, respectively; and m is the statistical grouping of the values of TC characteristics in the TCBT and GSTCH datasets into m groups. The m value is determined by the group spacings of the frequency distribution histograms and the magnitude of the values of TC characteristics. The group spacings of the frequency distribution histograms of central maximum wind speed along the track and landfall wind speed refer to the notice of the CMA: “About the Implementation of the National Standard of Tropical Cyclone Rating” GB/T 19201-2006 [35], and the group spacings of the frequency distribution histograms of the central minimum pressure along the track and landfall pressure refer to the Saffir–Simpson Hurricane Wind Scale [36]. The maximum and minimum values of the abscissa of the frequency distribution histogram are determined from the maximum and minimum values of the TC characteristics in the TCBT and GSTCH datasets.
The formulas for the calculation of the cumulative distribution and the K-S test statistics [37] are as follows:
F 1 ( X i 1 ) = P X i 1 Χ i = 1 , 2 , , m
F 2 ( X i 2 ) = P X i 2 Χ i = 1 , 2 , , m
D = s u p F 1 ( X i 1 ) F 2 ( X i 2 )
where F 1 ( X i 1 ) and F 2 ( X i 2 ) are the cumulative distributions of the TC characteristics in the TCBT dataset and the GSTCH dataset, respectively. On the basis of the grouping of the values of the TC characteristics in the TCBT and GSTCH datasets into m groups, the cumulative distribution is the probability that X i 1 is less than X in the TCBT dataset, and that the X i 2 is less than Χ in the GSTCH dataset. The groupings and maximum values of the TC characteristics determine the Χ . The groupings of the central maximum wind speed along the track and landfall wind speed are referred to in the notice of the CMA: “About the Implementation of the National Standard of Tropical Cyclone Rating” GB/T 19201-2006 [35], and the groupings of the central minimum pressure along the track and landfall pressure refer to the Saffir–Simpson Hurricane Wind Scale [36]. In Equation (12), D is the K-S test statistic, and s u p represents the upper-bound function. If set A of real numbers exists such that no number in A exceeds a minimum real number M, then M is the upper bound of set A. According to the definition of the upper bound function, the K-S test statistic in this study took the absolute value of the maximum difference of the cumulative distributions of the TCBT and GSTCH datasets.
The outcomes of the T-test, F-test, Chi-squared test, and K-S test are statistical hypothesis tests. Their original hypotheses are that the means, standard deviations, frequency distributions, and cumulative distributions of the TC characteristics in the GSTCH and TCBT datasets are not statistically significantly different. In this study, the confidence level of the hypothesis test is set at 95% (α = 1 − 95% = 0.05), indicating a 95% probability that the original hypothesis is correct. SPSS software (version: v28.0.1.1) is used to obtain the T-test statistics (and the corresponding p values), F-test statistics (and the corresponding p values), and Chi-squared test statistics (and the corresponding p values). PyCharm software (version: 2022.1.4) is used to obtain the K-S test statistics and the corresponding p values. Comparison of p value and α value can reveal whether the original hypotheses of the T-test, F-test, Chi-squared test, and K-S test are valid. The relationship between the p value and α value is shown in Table 1.

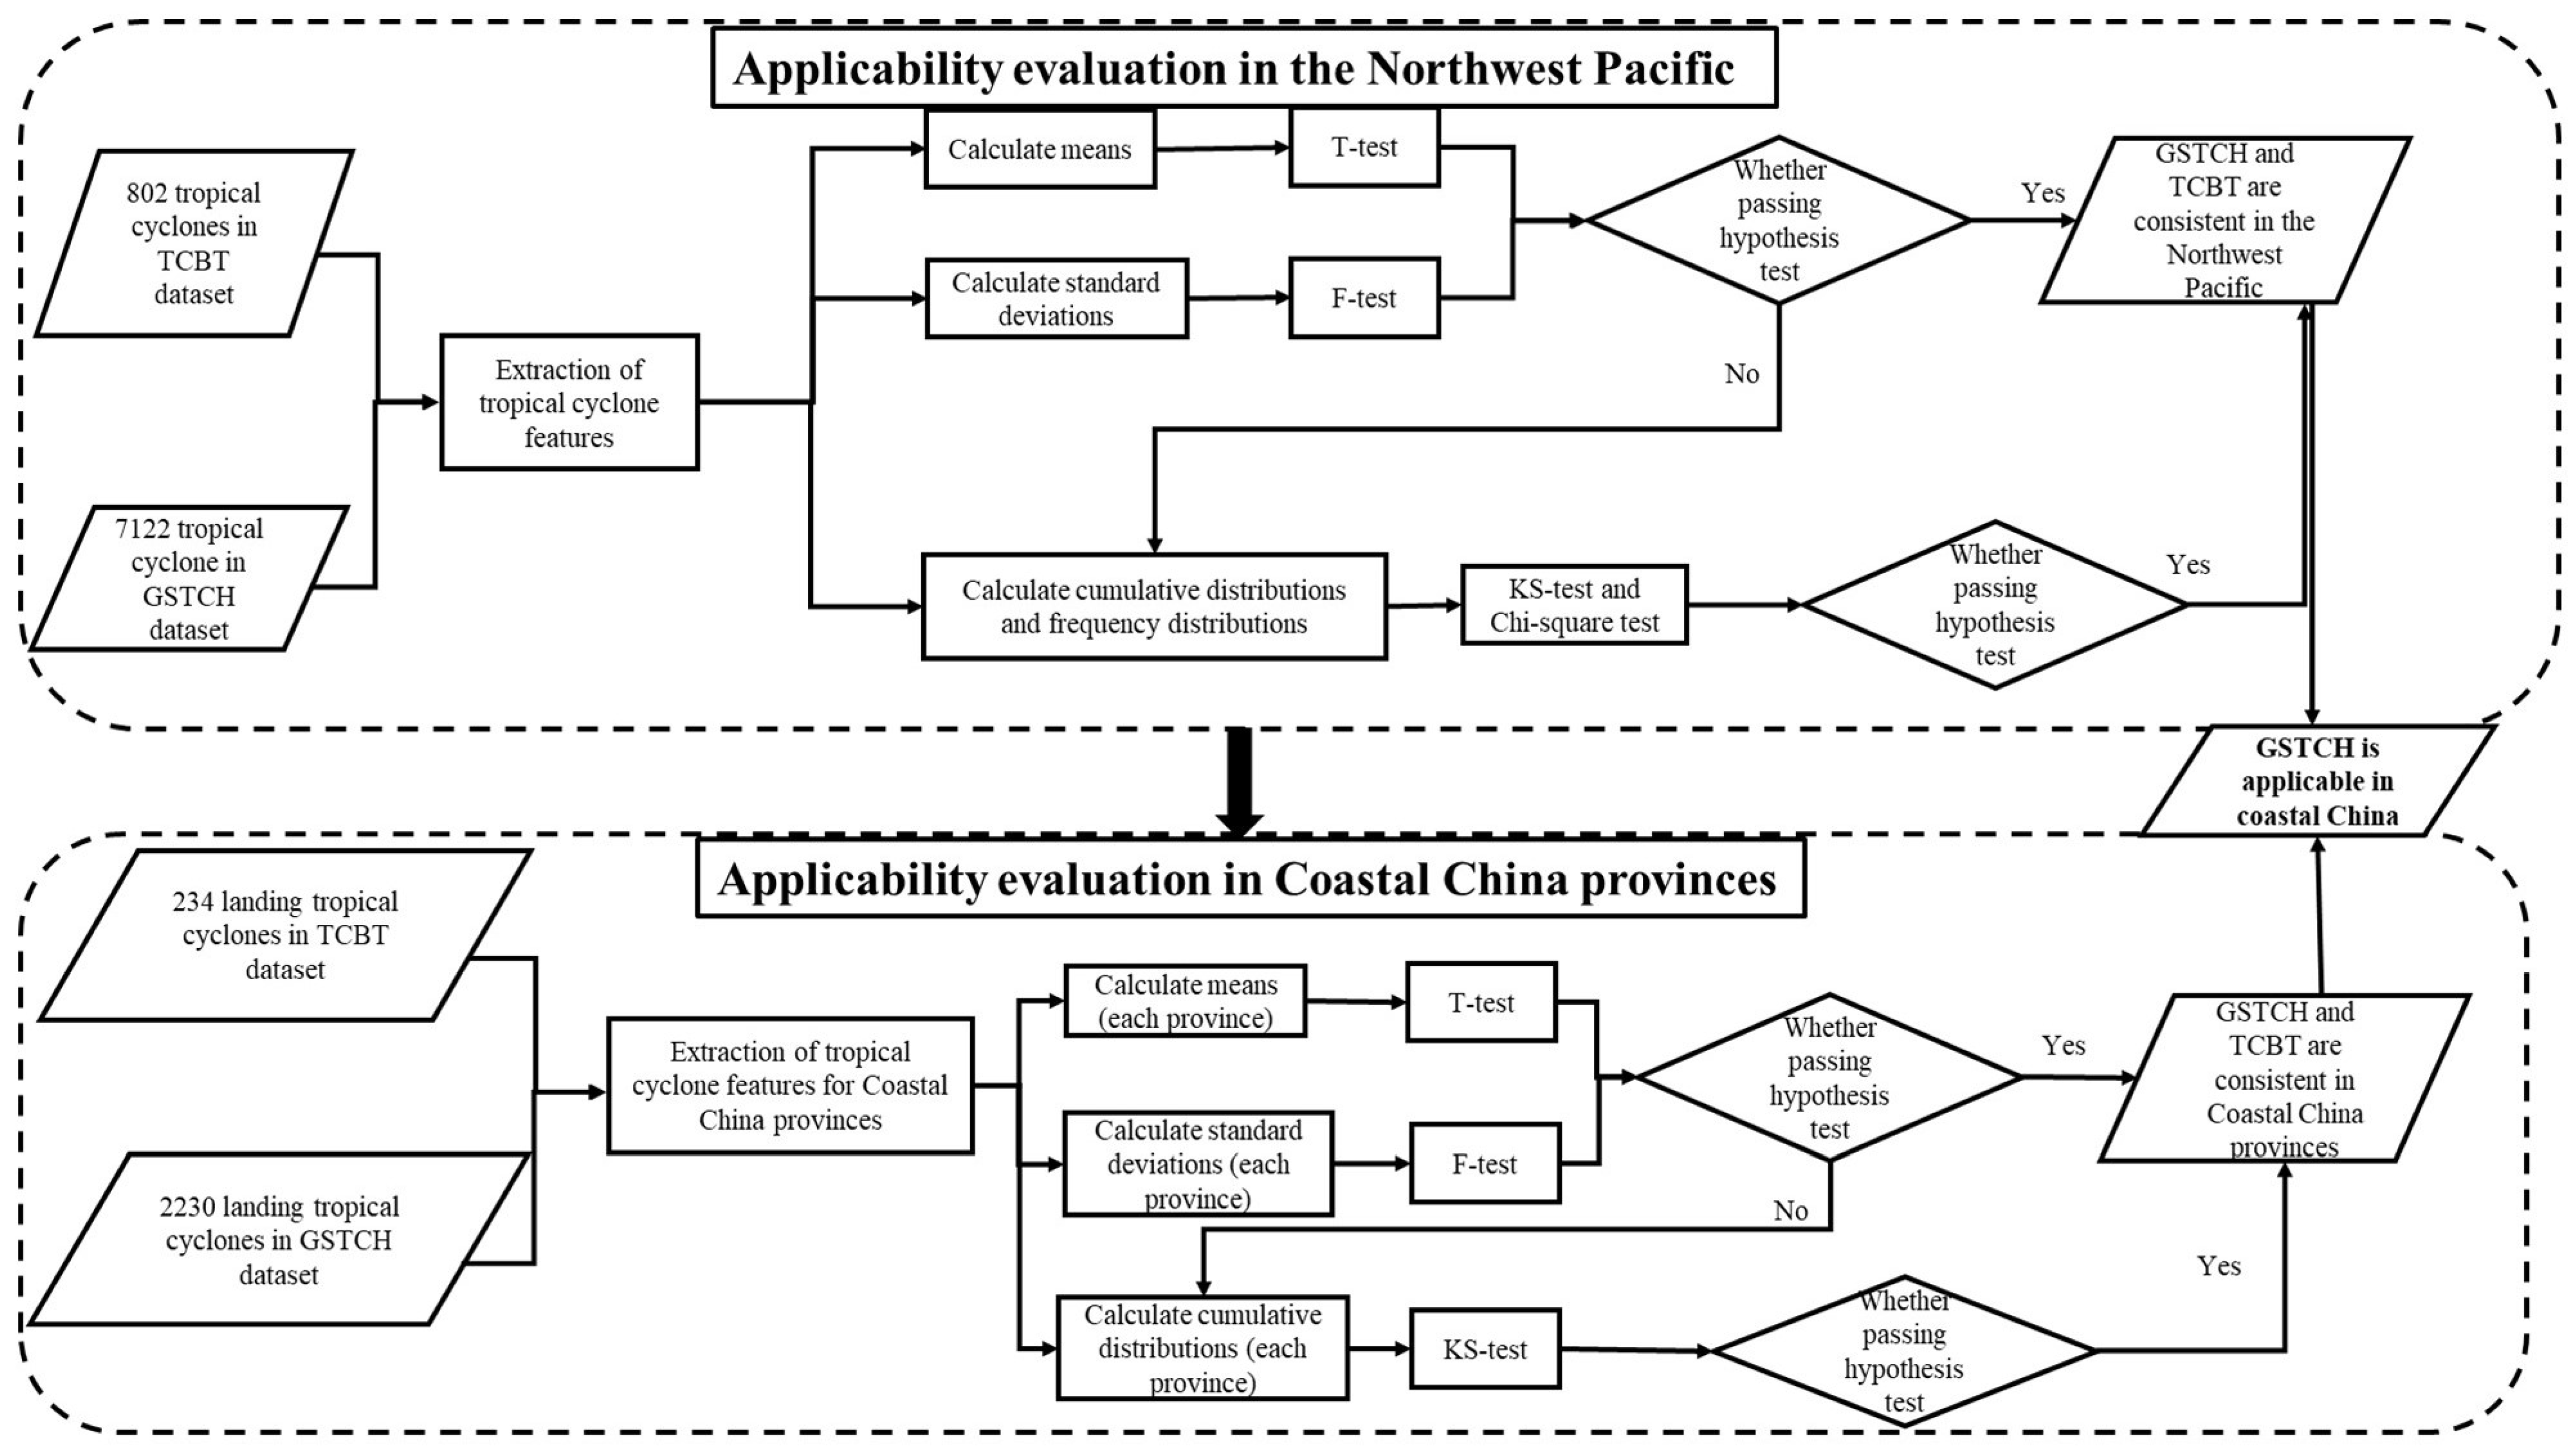
2.5. Specific Process for Evaluation

The applicability evaluation of the GSTCH dataset in coastal China focuses on two regions: the Northwest Pacific and China’s coastal provinces. The specific steps of the research framework are shown in Figure 1. First, the means and standard deviations of the TC characteristics in the GSTCH and TCBT datasets are calculated for the two study regions. Then, T-tests and F-tests with 95% confidence intervals are performed on the means and standard deviations, respectively. If the means are within the standard deviations of each other, and if the means and standard deviations pass the T-tests and the F-tests, respectively, the consistency between the GSTCH and TCBT datasets is considered verified for the coastal areas of China. If the means of the TC characteristics in the GSTCH and TCBT datasets are not within the standard deviations, and if the means or standard deviations of the TC features are statistically significantly different, further analysis is performed on their frequency and cumulative distributions. If the frequency distributions of the TC characteristics pass the Chi-squared test at the 95% confidence level or if the cumulative distributions pass the K-S test at the 95% confidence level, the consistency between the GSTCH and TCBT datasets is considered verified for the coastal areas of China.

3. Results

3.1. The Northwest Pacific

3.1.1. Means and Standard Deviations

Table 2 and Figure 2 compare the means and standard deviations of the central maximum wind speed along the track, landfall wind speed, central minimum pressure along the track, landfall pressure, annual occurrence number, and annual landfall number of the TCs in the Northwest Pacific in the GSTCH and TCBT datasets. The differences between the means and the standard deviations of the landfall pressure, landfall wind speed, and annual occurrence number are small. The mean of the central minimum pressure along the track in the GSTCH dataset is lower than that in the TCBT dataset, and the mean of the central maximum wind speed along the track in the GSTCH dataset is higher than that in the TCBT dataset. Nevertheless, all of these fall within the standard deviation of each other. Except for the annual landfall number, the means of TC characteristics in the GSTCH and TCBT datasets are within the standard deviations of each other. In summary, the GSTCH dataset successfully reproduces the intensity and annual occurrence frequency of TCs in the Northwest Pacific.
The T-tests and F-tests were performed to determine whether the means and standard deviations of the TC characteristics in the GSTCH and TCBT datasets are equivalent. As shown in Table 2, the means of the central minimum pressure along the track and the annual landfall number failed the T-test at the 95% confidence level, and the standard deviation of the central maximum wind speed along the track failed the F-test at the 95% confidence level. Therefore, the frequency distributions and cumulative distributions of the central maximum wind speed along the track, central minimum pressure along the track, and annual landfall number of the TCs in the GSTCH and TCBT datasets were further compared and analyzed.

3.1.2. Frequency Distributions and Cumulative Distributions

Figure 3 shows that the frequency distributions of the central maximum wind speed along the track, central minimum pressure along the track, and annual landfall number of the TCs in the GSTCH and TCBT datasets are not in good agreement. Comparison of the cumulative distributions of the TC characteristics is another way to verify the degree of consistency between the GSTCH and TCBT datasets. The cumulative distributions of the central maximum wind speed and the central minimum pressure along the track of the GSTCH and TCBT datasets are in good agreement. However, the cumulative distributions of the annual landfall number are less consistent (Figure 3). The Chi-squared test results on the frequency distributions and the K-S test results on the cumulative distributions are listed in Table 3. The cumulative distributions of the central maximum wind speed along the track and the central minimum pressure along the track in the GSTCH dataset pass the K-S test at the 95% confidence level.
In sum, the applicability evaluation results in the Northwest Pacific reveal that there is no statistically significant difference between the means and standard deviations of the landfall wind speed, landfall pressure, and annual occurrence number of the GSTCH dataset and the TCBT dataset at the 95% confidence level. The cumulative distributions of the central minimum pressure and central maximum wind speed along the track pass the K-S test at the 95% confidence level, verifying that the GSTCH dataset is consistent with the TCBT dataset at the sea-area scale.

3.2. China’s Coastal Provinces

3.2.1. Means and Standard Deviations

Figure 4 shows the number of TCs in the TCBT and GSTCH datasets that made landfall in each province. The study period of the TCBT and GSTCH datasets is 32 years, with the former ranging from 1990 to 2021 and the latter being the ensemble average of 10 different sets of 32 year periods which are selected at random from the GSTCH dataset.
Figure 4 clearly shows that the trend of the number of TCs making landfall in each province in the GSTCH and TCBT datasets is broadly consistent. The landfalling TCs are concentrated mainly in Fujian, Guangdong, Hainan, Taiwan, and Zhejiang provinces, accounting for approximately 97% of the total number of TCs making landfall along the coast of China. In descending order, the provinces with the highest frequency of landfalling TCs are Guangdong, Taiwan, Hainan, Zhejiang, and Fujian. The TCs making landfall in the provinces of Guangdong, Taiwan, and Hainan, that are in the coastal area of southern China, account for 60.4% of the total number of landfalling TCs annually. The TCs making landfall in the provinces of Zhejiang and Fujian, in the coastal area of eastern China, account for 37.5% of the total number of landfalling TCs annually.
Overall, the GSTCH dataset underestimates the number of TCs that make landfall in Guangdong, Hainan and Taiwan provinces, and overestimates the number of TCs that make landfall in Fujian and Zhejiang provinces. The TCBT dataset only includes TC data for a period of 32 years, and some provinces have very few TCs, making it ineffective when comparing the number of TC landfalls within each province (Figure 4). Therefore, further analysis of the annual number of landfalling TCs in the GSTCH and TCBT datasets was performed in the provinces of Fujian, Guangdong, Hainan, Taiwan, and Zhejiang. On the basis of the TCs that made landfall in the above provinces in the GSTCH and TCBT datasets, the means and standard deviations of the TC characteristics relevant to each province are listed in Table 4 and illustrated in Figure 5.
The results show that the means of the TC characteristics all fall within the standard deviations of each other within each province in the GSTCH and TCBT datasets. Moreover, the mean deviations of all of the TC characteristics are small, i.e., the largest mean deviation of the central maximum wind speed along the track, central minimum pressure along the track, annual landfall number, landfall wind speed, and landfall pressure is 1.994 m/s, 9.866 hpa, 1 item, 4.959 m/s, and 3.489 hpa, respectively. Thus, the GSTCH dataset successfully reproduces the intensity and annual landfall frequency of those TCs that made landfall in each province.
As shown in Figure 5, the landfall wind speed of the TCs making landfall in Hainan and Guangdong provinces is lower than that of the TCs making landfall in Zhejiang, Taiwan, and Fujian provinces, which is consistent with the fact that TCs with low landfall wind speed that make landfall in Guangdong and Hainan provinces are most numerous. The relatively large standard deviations in the TC characteristics in both the GSTCH and the TCBT datasets indicate that TC intensity has case-by-case differences, and that the annual number of landfalling TCs has interannual variability. Standard statistical tests (i.e., the T-tests and F-tests) were performed to verify that the means and the standard deviations of the TC characteristics between the GSTCH and TCBT datasets are equivalent, as presented in Table 4.
Table 4 clearly shows that TCs with characteristics that failed the T-test or the F-test (i.e., central minimum pressure along the track, landfall wind speed, and annual landfall number) are concentrated in Guangdong and Hainan provinces. The following sections further investigate the cumulative distributions of the landfall wind speed and the annual landfall number of TCs that made landfall in Guangdong and Hainan provinces, as well as the central minimum pressure along the track of TCs that made landfall in Guangdong province.

3.2.2. Landfall Wind Speed

Figure 6A shows the cumulative distributions of the landfall wind speed of the TCs in the GSTCH and TCBT datasets in Guangdong and Hainan provinces. In comparison with the cumulative distribution of the landfall wind speed of the TCs in the TCBT dataset, the cumulative distribution of the landfall wind speed of the TCs in the GSTCH dataset passes the K-S test at the 95% confidence level, as presented in Table 5.
Figure 6A indicates that the landfall wind speed of TCs in Guangdong province in the TCBT dataset is mainly within the range of [12, 41.5), i.e., approximately 85%, and that the landfall wind speed probability of TCs in Guangdong province in the GSTCH dataset within this range is approximately 95%. Overall, the landfall wind speed of TCs in Guangdong and Hainan provinces is underestimated in the GSTCH dataset, which might be related to the fact that the TCs in the GSTCH dataset include tropical depressions [2]. A tropical depression is the weakest category of TC, able to cause damage to vegetation and unsecured mobile homes but posing no real threat to other structures [36]. Therefore, verifying whether the landfall wind speeds in the GSTCH and TCBT datasets are reliable without considering tropical depressions is appropriate.
As shown in Figure 6B, the cumulative distributions of the landfall wind speed of TCs in the GSTCH and TCBT datasets are consistent when neglecting tropical depressions. In comparison with the cumulative distribution of the landfall wind speed of TCs in the TCBT dataset, the cumulative distributions of the landfall wind speed of TCs in the GSTCH dataset pass the K-S test at the 95% confidence level, as listed in Table 5.

3.2.3. Annual Landfall Number

Changes in the annual landfall number of TCs directly affect the mean and standard deviation of the annual landfall number. Figure 7 shows the number of TCs that made landfall in Guangdong and Hainan provinces annually during 1990–2021.
Figure 7 clearly shows that the annual landfall number reflects long-term change in Guangdong and Hainan provinces, affecting the mean and standard deviation of the annual landfall number. Therefore, in addition to the mean and standard deviation, consideration of the cumulative distribution is important when verifying the degree of consistency between the annual landfall numbers of Guangdong and Hainan provinces in the GSTCH and TCBT datasets. The cumulative distributions of the annual landfall numbers of Guangdong and Hainan provinces in the GSTCH and TCBT datasets are shown in Figure 8.
Figure 8 shows that the annual landfall numbers of Guangdong province is mainly concentrated in the range [0, 3]. In this range, the probability for Guangdong province in the GSTCH dataset is up to 96.88%, while the probability in the TCBT dataset is 86.21%. The annual landfall numbers of Hainan province are mainly concentrated in the range [0, 2], and the probability in the GSTCH dataset is up to 90.63%, while the probability in the TCBT dataset is 84.38%. In comparison with the cumulative distributions of the annual landfall numbers in Guangdong and Hainan provinces in the TCBT dataset, the cumulative distributions of the annual landfall numbers in Guangdong and Hainan provinces in the GSTCH dataset pass the K-S test at the 95% confidence level, as presented in Table 5.

3.2.4. Central Minimum Pressure along the Track

The cumulative distributions of the central minimum pressure along the track of TCs that made landfall in Guangdong province in the TCBT and GSTCH datasets are shown in Figure 9. It can be seen that the GSTCH dataset overestimates the ratio of TCs that made landfall in Guangdong province with the central minimum pressure along the track in the range [905, 980). Moreover, the p value of the K-S test statistic of the cumulative distribution in Guangdong province is 0.002, i.e., much lower than 0.05. Thus, the central minimum pressure of TCs in Guangdong province in the GSTCH dataset does not pass the K-S test at the 95% confidence level, and there is a significant difference between the two datasets.
Guangdong is the province with the most frequent occurrence of TCs making landfall along the coast of China, and the landfall period is concentrated mainly between June and October. Differences in sea level pressure and sea surface temperature at different times affect the magnitude of the central minimum pressure along the track, and the central minimum pressure along the track in the GSTCH dataset considers environmental conditions (i.e., monthly mean sea level pressure and monthly mean sea surface temperature) [2]. Therefore, this study verifies the degree of consistency between the central minimum pressure along the track of TCs that made landfall in Guangdong province during June–October in the GSTCH and TCBT datasets.
As shown in Figure 10, during June–October, the mean differences in the central minimum pressure along the track of TCs that made landfall in Guangdong province are very small and within the range of standard deviation of each other. The GSTCH dataset overestimates the mean central minimum pressure along the track in September, and the standard deviation of the central minimum pressure along the track in the GSTCH dataset does not pass the F-test at the 95% confidence level (Table 6). The cumulative distributions of the central minimum pressure along the track of TCs that made landfall in Guangdong province in September in the GSTCH and TCBT datasets are shown in Figure 11.
Figure 11 clearly shows that the cumulative distributions of the central minimum pressure along the track of TCs that made landfall in Guangdong province in September are consistent between the GSTCH and TCBT datasets. The p value of the K-S test statistic of the cumulative probability distribution is 0.68, which is greater than 0.05, indicating that it passes the K-S test at the 95% confidence level. The results reveal no statistically significant difference between the GSTCH and TCBT datasets in terms of the number of TCs within each value range of the central minimum pressure along the track that made landfall in Guangdong province in September.

4. Discussion

4.1. Usage of the GSTCH Dataset in Coastal China

TCs usually induce other hazards, such as strong wind, huge waves, heavy precipitation, and storm surges [38,39,40]. They can substantially damage housing, infrastructure and ecosystems both in coastal areas and far inland. Research by Bloemendaal et al. [2,22] demonstrates that the GSTCH dataset with 10,000 years of TC activity can be used in studying the different aspects of TC hazards, including TCs and other induced hazards risk analysis over the open ocean and in coastal areas, coastal modeling, food risk assessments, and wind return periods estimation and damage assessments. In particular, the GSTCH dataset is also applicable to global small islands. Because of its global coverage and the large number of TCs, there are also enough TCs to perform the risk assessment in the aforementioned regions.
The long coastline and low-lying terrain of China’s mainland coast (the area of land below 5 m above sea level is approximately 143,900 km2) make it an area prone to frequent TC disasters. Moreover, the extended continental shelf and shallow sea areas of coastal China contribute to the development of storm surges associated with TCs that can cause substantial economic losses and serious casualties. For example, in 2017, the storm surge caused by Typhoon Hato caused direct economic losses of 5.154 billion yuan in coastal areas of Guangdong province, with six people reported killed or missing. In 2018, Super Typhoon Mangkhut caused total direct economic losses of 2.457 billion yuan in Guangdong, Guangxi, and Fujian provinces. In 2019, owing to the combined influence of the storm surge of Typhoon Lekima and nearshore waves, the direct economic losses of the eight coastal provinces stretching from Fujian to Liaoning totaled 10.288 billion yuan. To sum up, the coastal areas of China are frequently affected by TCs and their induced storm surges, and the caused disaster losses are very serious.
Applicability evaluation of this study verifies that the GSTCH dataset provides a critical data source for the relevant research on TCs and their induced hazards in the coastal areas of China. It is hoped that this will contribute to disaster risk assessment, proposal of disaster prevention and reduction actions, and disaster emergency response plan.

4.2. Some Limitations

In previous sections, this study has demonstrated that the GSTCH dataset is well consistent with the TCBT dataset in China’s coastal areas. There are, however, some limitations regarding the subsequent usage of this dataset, which are briefly reflected upon here. In this section we shall also give future research directions.
First, the GSTCH dataset is based on average present-day climate conditions (1980–2017) [2], and the TC activities represented by GSTCH may be biased by the phases of multi-decadal variability contained in the 38 year period of record that was used to generate the dataset [22]. Therefore, the GSTCH dataset cannot be used to assess the climate trends over longer timescales.
Second, the TC characteristics in the TCBT dataset selected in this study are derived from satellite observations, high-density ground observations, ground-based radar, weather maps, and satellite cloud pattern recognition [25,26]. They are considered highly accurate. However, the 32 year (1990–2021) TC data in the TCBT dataset represent only a limited temporal range. Future research could extend the temporal scale of the available TC data by e.g., collecting more historical TCs data and conducting data reanalysis. They may then be applied to the accurate evaluation of new synthetic TC datasets and to the study of different aspects of TC hazards. In addition, issues such as changes in observation methods, data homogeneity, and data quality over time should also be addressed, to ensure the reliability of the consistency analysis.
Last, landfall wind speed and landfall pressure in this study refer to the initial landfall wind speed and landfall pressure of a TC, for which the value of the former is usually the largest and the value of the latter is the lowest [25,26]. TCs might make landfall twice or even three times. Nevertheless, after the first landfall, the intensity of a TC diminishes rapidly owing to the combined effects of ground friction and insufficient energy supply. Therefore, the wind speed at the time of the first landfall is a better representation of the TC intensity. For the period 1990–2021, the TCBT dataset includes 56 TCs with twice landfalls and 16 TCs with thrice landfalls, but they have little supporting data. Therefore, the lack of TC data available for the second and third landfalls means that verifying the degree of consistency between the GSTCH and TCBT datasets is impossible in such a case. Future research could extend the TC data for second and third landfalls by statistical resampling or modeling.

5. Conclusions

This study evaluated the applicability of the GSTCH dataset in coastal China in relation to two regions: the Northwest Pacific and China’s coastal provinces. The TC characteristics for evaluation include central maximum wind speed along the track, central minimum pressure along the track, landfall wind speed, landfall pressure, annual occurrence number, and annual landfall number. The evaluation indicators are the mean, standard deviation, frequency distribution, and cumulative distribution, together with their corresponding hypothesis tests (T-test, F-test, Chi-squared test, and K-S test).
For the Northwest Pacific, the comparison results showed no significant differences in the means and standard deviations of landfall wind speed, landfall pressure, and annual occurrence number between the GSTCH and TCBT datasets at the 95% confidence level. In addition, the cumulative distributions of central minimum pressure and central maximum wind speed along the track passed the K-S test at the 95% confidence level. These verified that the GSTCH dataset is consistent with the TCBT dataset at the sea-area scale.
For China’s coastal provinces, the comparison results show that the means or standard deviations of TC characteristics between the two datasets were not significantly different in provinces other than Guangdong and Hainan. Further analysis revealed that the cumulative distributions of the TC characteristics in Guangdong and Hainan provinces passed the K-S test at the 95% confidence level, verifying that the GSTCH dataset is consistent with the TCBT dataset at the province scale.
In general, the TCBT dataset is considered to be the most authoritative TC dataset for the coastal areas of China, and it can be used as a benchmark for evaluating the applicability of the GSTCH dataset in coastal China. Therefore, the excellent agreement between the GSTCH and TCBT datasets for the Northwest Pacific and China’s coastal provinces verifies that the GSTCH dataset is an available and reliable data source for TC hazard studies in China’s coastal areas.

Author Contributions

Conceptualization, X.L. and J.Z.; methodology, X.L. and Q.H.; data collection, Q.H., S.Z., X.D. and T.Z.; data curation, Q.H.; writing—original draft, X.L. and Q.H.; writing—review and editing, J.Z. and S.Z.; project administration, X.L. and J.Z.; funding acquisition, J.Z. All authors have read and agreed to the published version of the manuscript.

Funding

This research was funded by the National Key R&D Program of China (2022YFC3105100).

Institutional Review Board Statement

Not applicable.

Informed Consent Statement

Not applicable.

Data Availability Statement

Global Synthetic Tropical Cyclone Hazard dataset was developed in Bloemendaal et al. [2] and is available from the 4TU. Centre for Research Data repository [30]: https://doi.org/10.4121/uuid:82c1dc0d-5485-43d8-901a-ce7f26cda35d (accessed on 25 May 2022). The Tropical Cyclone Best Track dataset is available from the China Meteorological Administration Tropical Cyclone data center [25,26]: https://tcdata.typhoon.org.cn/zjljsjj.html (accessed on 7 June 2022).

Acknowledgments

The Global Synthetic Tropical Cyclone Hazard dataset provided by the 4TU Centre and the Tropical Cyclone Best Track dataset provided by the China Meteorological Administration Tropical Cyclone data center are highly appreciated.

Conflicts of Interest

Xuexue Du was employed by Duyun Power Supply Bureau of Guizhou Power Grid Co., Ltd. The remaining authors declare that the research was conducted in the absence of any commercial or financial relationships that could be construed as a potential conflict of interest.

References

  1. Emanuel, K. Tropical cyclones. Annu. Rev. Earth Planet. Sci. 2003, 31, 75–104. [Google Scholar] [CrossRef]
  2. Bloemendaal, N.; Haigh, I.D.; de Moel, H.; Muis, S.; Haarsma, R.J.; Aerts, J.C.J.H. Generation of a global synthetic tropical cyclone hazard dataset using STORM. Sci. Data 2020, 7, 40. [Google Scholar] [CrossRef]
  3. Chan, K.T.F.; Chan, J.C.L.; Wong, W.K. Rainfall asymmetries of landfalling tropical cyclones along the South China coast. Meteorol. Appl. 2018, 26, 213–220. [Google Scholar] [CrossRef]
  4. Zheng, M.L.; Mu, L.; Li, W.J.; Wang, F.; Li, Y. Regime shifts in the damage caused by tropical cyclones in the Guangdong–Hong Kong–Macao Greater Bay area of China. J. Mar. Sci. Eng. 2023, 11, 1889. [Google Scholar] [CrossRef]
  5. Shi, X.W.; Tan, J.; Guo, Z.X.; Liu, Q.Z. A review of risk assessment of storm surge disaster. Adv. Earth Sci. 2013, 28, 866–874. [Google Scholar]
  6. Seo, N.S.; Bakkensen, L.A. Is tropical cyclone surge, not intensity, what kills so many people in South Asia. Weather Clim. Soc. 2017, 9, 71–81. [Google Scholar] [CrossRef]
  7. Zhu, P.J.; Luo, N.X.; Zhao, Q.S. Forecast of maximum water increase in typhoon storm surge based on random forest model. Bull. Sur. Map. 2021, 12, 71–74+82. [Google Scholar]
  8. Peduzzi, P.; Chatenoux, B.; Dao, H.; De Bono, A.; Herold, C.; Kossin, J.; Mouton, F.; Nordbeck, O. Global trends in tropical cyclone risk. Nat. Clim. Chang. 2012, 2, 289–294. [Google Scholar] [CrossRef]
  9. Velden, C.; Burton, A.; Kuroiwa, K. The first international workshop on satellite analysis of tropical cyclones: Summary of current operational methods to estimate intensity. Trop. Cycl. Res. Rev. 2012, 1, 469–481. [Google Scholar]
  10. Yang, G.S. Historical change and future trends of storm surge disaster in China’s coastal area. J. Nat. Dis. 2000, 9, 23–30. [Google Scholar]
  11. Yang, X.X.; Liu, Q. Economic loss assessment of storm-surge disasters based on the KPCA-RBF model. Mar. Sci. 2021, 45, 32–39. [Google Scholar]
  12. Hao, J.; Liu, Q. Pre-assessment of typhoon storm surge disaster loss based on the SSA-ELM model. Mar. Sci. 2022, 46, 55–63. [Google Scholar]
  13. Zhong, J.; Zhou, Q.; Gu, S.D.; Wang, L.Q.; Sun, Y.M.; Han, M.M. Analysis of the different characteristics of tropical cyclogenesis among different best track data in the northwest Pacific. Mar. For. 2019, 42, 114–119. [Google Scholar]
  14. Emanuel, K. The hurricane-climate connection. Bull. Am. Meteorol. Soc. 2008, 5, ES10–ES20. [Google Scholar] [CrossRef]
  15. Weinkle, J.; Maue, R.; Pielke, R., Jr. Historical global tropical cyclone landfalls. J. Clim. 2012, 25, 4729–4735. [Google Scholar] [CrossRef]
  16. Vickery, P.J.; Skerlj, P.F.; Twisdale, L.A. Simulation of hurricane risk in the US using empirical track model. J. Struct. Eng. 2000, 126, 1222–1237. [Google Scholar] [CrossRef]
  17. Emanuel, K.; Ravela, S.; Vivant, E.; Risi, C. A statistical deterministic approach to hurricane risk assessment. Bull. Am. Meteorol. Soc. 2006, 87, 299–314. [Google Scholar] [CrossRef]
  18. Powell, M.D.; Soukup, G.; Cocke, S.; Gulati, S.; Morisseau-Leroy, N.; Hamid, S.; Dorst, N.; Axe, L. State of Florida hurricane loss projection model: Atmospheric science component. J. Wind Eng. Ind. Aerod. 2005, 93, 651–674. [Google Scholar] [CrossRef]
  19. Haigh, I.D.; Wijeratne, E.M.S.; MacPherson, L.R.; Pattiaratchi, C.B.; Mason, M.S.; Crompton, R.P.; George, S. Estimating present day extreme water level exceedance probabilities around the coastline of Australia: Tides, extra-tropical storm surges and mean sea level. Clim. Dyn. 2014, 42, 121–138. [Google Scholar] [CrossRef]
  20. Casson, E.; Coles, S. Simulation and extremal analysis of hurricane events. J. R. Stat. Soc. 2000, 49, 227–245. [Google Scholar] [CrossRef]
  21. Lin, N.; Emanuel, K.; Oppenheimer, M.; Vanmarcke, E. Physically based assessment of hurricane surge threat under climate change. Nat. Clim. Chang. 2012, 2, 462–467. [Google Scholar] [CrossRef]
  22. Bloemendaal, N.; de Moel, H.; Muis, S.; Haigh, I.D.; Aerts, J.C.J.H. Estimation of global tropical cyclone wind speed probabilities using the STORM dataset. Sci. Data 2020, 7, 377. [Google Scholar] [CrossRef] [PubMed]
  23. Nakajo, S.; Mori, N.; Yasuda, T.; Mase, H. Global stochastic tropical cyclone model based on principal component analysis and cluster analysis. J. Appl. Meteorol. Clim. 2014, 53, 1547–1577. [Google Scholar] [CrossRef]
  24. Lee, C.Y.; Tippett, M.K.; Sobel, A.H.; Camargo, S.J. An environmentally forced tropical cyclone hazard model. J Adv. Model. Earth Syst. 2018, 10, 223–241. [Google Scholar] [CrossRef]
  25. Ying, M.; Zhang, W.; Yu, H.; Lu, X.; Feng, J.; Fan, Y.; Zhu, Y.; Chen, D. An overview of the China Meteorological Administration tropical cyclone database. J. Atmos. Ocean. Technol. 2014, 31, 287–301. [Google Scholar] [CrossRef]
  26. Lu, X.Q.; Yu, H.; Ying, M.; Zhao, B.K.; Zhang, S.; Lin, L.M.; Bai, L.N.; Wan, R.J. Western North Pacific tropical cyclone database created by the China Meteorological Administration. Adv. Atmos. Sci. 2021, 38, 690–699. [Google Scholar] [CrossRef]
  27. Yang, Y.X.; Xia, J.D. Characteristics of Northwest Pacific tropical cyclones. Nav. Chin. 2019, 42, 114–119. [Google Scholar]
  28. Lv, S.; Sun, Y.; Zhong, Z.; Shen, Y.X. Possible reasons for the migration of tropical cyclone track over the western north pacific: Interdecadal pacific oscillation modulation. Front. Earth Sci. 2022, 10, 994876. [Google Scholar] [CrossRef]
  29. Yu, Q.; Wang, X.W.; Fang, Y.J.; Ning, Y.Z.; Yuan, P.Q.; Xi, B.R.; Wang, R.Z. Comprehensive investigation on spatiotemporal variations of tropical cyclone activities in the Western North Pacific, 1950–2019. J. Mar. Sci. Eng. 2023, 11, 946. [Google Scholar] [CrossRef]
  30. Bloemendaal, N.; Haigh, I.D.; de Moel, H. STORM IBTrACS Present Climate Synthetic Tropical Cyclone Tracks; 4TU.Centre for Research Data: Delft, The Netherlands, 2019. [Google Scholar] [CrossRef]
  31. Knapp, K.R.; Kruk, M.C.; Levinson, D.H.; Diamond, H.J.; Neumann, C.J. The International Best Track Archive for Climate Stewardship (IBTrACS): Unifying tropical cyclone best track data. Bull. Am. Meteorol. Soc. 2010, 91, 363–376. [Google Scholar] [CrossRef]
  32. Knapp, K.R.; Diamond, H.J.; Kossin, J.P.; Kruk, M.C.; Schreck, C.J. International Best Track Archive for Climate Stewardship (IBTrACS) Project, Version 4. NOAA National Centers for Environmental Information. 2018. Available online: https://www.ncei.noaa.gov/products/international-best-track-archive (accessed on 25 May 2022).
  33. Lu, X.Q.; Lei, X.T.; Yu, H.; Zhao, B.K. An objective TC intensity estimation method based on satellite data. J. Appl. Meteor. Sci. 2014, 25, 52–58. [Google Scholar]
  34. Lomax, R.G.; Hahs-Vaughn, D.L. Statistical Concepts-A Second Course; Routledge: New York, NY, USA, 2013. [Google Scholar]
  35. GB/T 19201-2006; Grade of Tropical Cyclones. Standardization Administration of the People’s Republic of China: Beijing, China, 2006.
  36. Simpson, R.H.; Saffir, H.J.W. The hurricane disaster potential scale. Weatherwise 1974, 27, 169. [Google Scholar]
  37. Knuth, D.E. The Art of Computer Programming; Pearson Education: New York, NY, USA, 1997. [Google Scholar]
  38. Cerveny, R.S.; Newman, L.E. Climatological relationships between tropical cyclones and rainfall. Mon. Weather. Rev. 2000, 128, 3329–3336. [Google Scholar] [CrossRef]
  39. Phadke, A.C.; Martino, C.D.; Cheung, K.F.; Houston, S.H. Modeling of tropical cyclone winds and waves for emergency management. Ocean Eng. 2003, 30, 553–578. [Google Scholar] [CrossRef]
  40. Bloemendaal, N.; Muis, S.; Haarsma, R.J.; Verlaan, M.; Apecechea, M.I.; de Moel, H.; Ward, P.J.; Aerts, J.C.J.H. Global modeling of tropical cyclone storm surges using high-resolution forecasts. Clim. Dyn. 2019, 52, 5031–5044. [Google Scholar] [CrossRef]
Figure 1. The research framework of this study.
Jmse 12 00073 g001
Figure 2. Means and standard deviations of Tropical cyclone (TC) characteristics. (A) Central maximum wind speed along the track, and Landfall wind speed. (B) Central minimum pressure along the track, and Landfall pressure. (C) Annual occurrence number, and Annual landfall number) in the Northwest Pacific.
Jmse 12 00073 g002
Figure 3. Frequency and cumulative distributions of the central maximum wind speed along the track (A), the annual landfall number (B), and the central minimum pressure along the track (C) in the Northwest Pacific (broken lines represent GSTCH data; bar charts represent TCBT data).
Jmse 12 00073 g003
Figure 4. Number of TCs that made landfall in China’s coastal provinces (item).
Jmse 12 00073 g004
Figure 5. (AC) Means and standard deviations of the TC characteristics in China’s coastal provinces (orange color represents the central maximum wind speed along the track; red color represents landfall wind speed; purple color represents annual landfall number; blue color represents central minimum pressure along the track; green color represents landfall pressure. Solid color fills represent TCBT data; pattern fills represent GSTCH data).
Jmse 12 00073 g005
Figure 6. Cumulative distributions of the landfall wind speeds considering (A) and ignoring (B) tropical depressions in Guangdong and Hainan provinces (broken lines represent GSTCH data; bar charts represent TCBT data).
Jmse 12 00073 g006
Figure 7. Annual landfall number of TCs in Guangdong and Hainan provinces during 1990–2021.
Jmse 12 00073 g007
Figure 8. Cumulative distributions of the annual landfall number of TCs in Guangdong (A) and Hainan (B) provinces.
Jmse 12 00073 g008
Figure 9. Cumulative distributions of central minimum pressure along the track of TCs in Guangdong province.
Jmse 12 00073 g009
Figure 10. Means and standard deviations of the central minimum pressure along the track of TCs in Guangdong province from June to October.
Jmse 12 00073 g010
Figure 11. Cumulative distributions of central minimum pressure along the track of TCs in Guangdong province in September.
Jmse 12 00073 g011
Table 1. Relationship between the p value and α value.
p-ValueWhether the Original Hypothesis Is EstablishedStatistical Significance
p > αEstablishedThe evaluation indicators of TC characteristics in the TCBT dataset and the GSTCH dataset do not show a significant difference
p < αNot EstablishedThe evaluation indicators of TC characteristics in the TCBT dataset and the GSTCH dataset show a significant difference
Table 2. Means and standard deviations of TC characteristics in the Northwest Pacific.
TC CharacteristicsDatasetMeantP (t)Standard DeviationfP (f)
Central maximum wind speed along the track (m/s)TCBT37.315−0.0490.96114.14933.3290
GSTCH42.80513.801
Landfall wind speed (m/s)TCBT31.2320.3120.75510.7576.7320.1
GSTCH30.9729.135
Central minimum pressure along the track (hpa)TCBT964.0415.0750.00126.3630.7540.385
GSTCH956.49128.335
Landfall pressure (hpa)TCBT974.5181.5230.12818.6911.5450.214
GSTCH972.09619.03
Annual occurrence number (item)TCBT25.0631.6120.1124.4720.2560.614
GSTCH22.2564.424
Annual landfall number (item)TCBT7−8.317021.890.174
GSTCH11.3353.135
Table 3. Results of the Chi-squared test and Kolmogorov–Smirnov (K-S) test in the Northwest Pacific.
TC Characteristics X d f 2 P   ( X d f 2 ) D P   ( D )
Central maximum wind speed along the track (m/s)18.410.0010.12540.0789
Central minimum pressure along the track (hpa)57.64500.12370.0946
Annual landfall number (item)51.46300.56255.223 × 10−5
Table 4. Means and standard deviations of TC characteristics in China’s coastal provinces.
ProvinceTC CharacteristicsDatasetMeantP (t)Standard
Deviation
fP (f)
GuangdongCentral maximum wind speed along the track (m/s)TCBT35.089−0.9350.35211.7850.6670.416
GSTCH37.0089.958
Central minimum pressure
along the track (hpa)
TCBT968.0892.4840.01420.8860.5740.45
GSTCH958.22322.657
Landfall wind speed (m/s)TCBT29.4941.1540.2519.8086.4760.012
GSTCH27.6087.002
Landfall pressure(hpa)TCBT977.063−0.4760.63516.3370.480.51
GSTCH978.35111.403
Annual landfall number (item)TCBT2.4693.1830.0021.5026.2210.015
GSTCH1.4690.95
HainanCentral maximum wind speed along the track (m/s)TCBT32.2710.6530.51614.8222.640.108
GSTCH30.2779.765
Central minimum pressure
along the track (hpa)
TCBT971.6460.2920.77126.3190.650.422
GSTCH970.00720.127
Landfall wind speed (m/s)TCBT26.5830.9910.3259.98.6460.004
GSTCH24.6435.143
Landfall pressure(hpa)TCBT980.896−0.1290.89816.7820.640.45
GSTCH981.3279.249
Annual landfall number (item)TCBT1.52.1430.0361.0161.1170.295
GSTCH0.9670.967
TaiwanCentral maximum wind speed along the track (m/s)TCBT42.0530.4680.64114.0431.9130.17
GSTCH40.90111.157
Central minimum pressure
along the track (hpa)
TCBT955.6671.6290.10625.7380.5720.451
GSTCH947.4826.455
Landfall wind speed (m/s)TCBT34.3860.7030.48311.8652.7730.099
GSTCH32.958.974
Landfall pressure(hpa)TCBT969.4210.5350.59320.8420.4460.506
GSTCH967.37118.713
Annual landfall number (item)TCBT1.7810.6180.5391.2890.5160.475
GSTCH1.5941.132
ZhejiangCentral maximum wind speed along the track (m/s)TCBT45.1050.5380.59310.6190.070.792
GSTCH43.49810.031
Central minimum pressure
along the track (hpa)
TCBT951.0531.1690.2484.7691.6920.2
GSTCH942.8684.629
Landfall wind speed (m/s)TCBT38.7371.8250.0748.6780.1550.696
GSTCH33.7789.692
Landfall pressure(hpa)TCBT963.053−0.6040.54914.8832.0340.16
GSTCH966.54222.29
Annual landfall number (item)TCBT0.594−1.7290.0890.6153.1090.083
GSTCH0.9691.062
FujianCentral maximum wind speed along the track (m/s)TCBT390.1370.89115.0232.0150.163
GSTCH38.5129.266
Central minimum pressure
along the track (hpa)
TCBT961.550.7790.4429.5520.8420.364
GSTCH955.75621.512
Landfall wind speed (m/s)TCBT32.250.180.85910.1090.4780.493
GSTCH31.768.553
Landfall pressure(hpa)TCBT974.20.0340.85516.3790.4390.662
GSTCH971.93718.199
Annual landfall number (item)TCBT0.6250.8520.361.07−0.9070.368
GSTCH0.8440.847
Table 5. Results of the K-S test of the cumulative distributions of the landfall wind speed and the annual landfall number in Guangdong and Hainan provinces.
TC CharacteristicsProvince D P   ( D )
Landfall wind speed (considering tropical depression) (m/s)Guangdong0.2130.239
Landfall wind speed (ignoring tropical depression) (m/s)0.2270.207
Annual landfall number (item)0.2550.093
Landfall wind speed (considering tropical depression) (m/s)Hainan0.2670.239
Landfall wind speed (ignoring tropical depression) (m/s)0.1820.465
Annual landfall number (item)0.3130.088
Table 6. Results of the T-test of means and the F-test of standard deviations of the central minimum pressure along the track of TCs in Guangdong province from June to October.
MonthtP (t)fP (f)
60.5890.5610.3740.546
70.6450.5233.10.087
80.8540.3972.5770.115
9−1.5810.1237.7370.009
10−0.3190.7580.1690.692
Disclaimer/Publisher’s Note: The statements, opinions and data contained in all publications are solely those of the individual author(s) and contributor(s) and not of MDPI and/or the editor(s). MDPI and/or the editor(s) disclaim responsibility for any injury to people or property resulting from any ideas, methods, instructions or products referred to in the content.

