Article

Numerical Investigation into the Dynamic Responses of Floating Photovoltaic Platform and Mooring Line Structures under Freak Waves

1
College of Civil Engineering, Fuzhou University, Fuzhou 350116, China
2
Fujian Yongfu Power Engineering Co., Ltd., Fuzhou 350108, China
*
Author to whom correspondence should be addressed.
J. Mar. Sci. Eng. 2024, 12(1), 96; https://doi.org/10.3390/jmse12010096
Submission received: 23 November 2023 / Revised: 28 December 2023 / Accepted: 29 December 2023 / Published: 3 January 2024
(This article belongs to the Section Ocean Engineering)

Abstract

:
Floating photovoltaics (PVs) are progressively constructed in the ocean sea; therefore, the effect that freak waves have on their structural design needs to be considered. This paper developed a dedicated numerical model coupling the floating PV platform and mooring line structures to investigate their dynamic responses under freak waves. A feasible superposition approach is presented to generate freak wave sequences via the combination of transient waves and random waves. A large floating PV platform moored by twenty lines for a water depth of 45 m was designed in detail according to the actually measured ocean environmental and geological conditions. The global time domain analyses of the floating PV mooring structures were implemented to obtain dynamic responses, including PV platform motions and the mooring line configuration and tension under freak waves. A comparison of the response results with those caused by random waves was conducted to illustrate the intuitive evidence of the freak wave effects, which offer a significant reference for the preliminary design of the floating PV platform and mooring line structures.

1. Introduction

The photovoltaic (PV) power station is a significant method to diminish greenhouse gas emissions and promote the development of renewable energy. Recently, the floating photovoltaic (PV) project in the oceans has attracted more and more attention from industrial investors and researchers for its particular advantages, such as its low ambient temperature, high power efficiency, and effective avoidance of land-use conflicts [1,2]. With the development of the photovoltaic from inland water to the ocean sea, higher requirements for the floating photovoltaic platform and mooring line structures are required to resist complex ocean environments [3]. The freak wave is representative of extreme environmental condition that happens unexpectedly far away in the open sea with an extremely huge wave height. A series of immense ocean accidents, including shipwrecks and offshore structure destruction caused by freak waves, have been reported over the past few decades [4,5]. It is noted that freak waves are also a potential threat to the floating PV power station during the service period. Thus, accurately evaluating the dynamic responses of the PV platform and mooring line structures under freak waves is valuable and crucial for structural safety design and hazard prevention.
To simulate the freak wave impact on offshore structures, a reasonable method is essential to generate a freak wave series. Fochesato et al. [6] introduced a typical simulation of an overturning freak wave and analyzed the sensitivity of its geometry and kinematics to water depth. Liu et al. [7] developed a modified phase modulation method for simulating high nonlinear freak waves, which proved to have good precision and high efficiency through the comparisons of simulated and recorded freak waves. Cui et al. [8] presented a modified formulation to predict the wavelengths of two- and three-dimensional freak waves. Zhao et al. [9,10] developed four simulation methods to generate various types of freak waves and then analyzed the wave impact on the offshore platform structures. Hu et al. [11] adopted the superposition approach to investigate the probability distribution of generating freak waves. Tang et al. [12] proposed an improved phase modulation model to simulate the freak waves and analyzed their influence on the response behaviors of the production oil storage devices and mooring systems. Qin et al. [13] simulated a freak wave by establishing a 2D numerical wave tank and explored the wave shock load under different deck clearances. Li et al. [14] investigated the influences of freak waves on semi-submersible platform motion and mooring stiffness. Xu et al. [15] and Xu and Gong [16] numerically generated a series of freak waves and obtained the response behaviors of offshore pipelines for the installation stage under a freak wave. Pan et al. [17] experimentally explored the influence of freak waves on the response characteristics of mooring square columns in the frequency domain. Chang et al. [18] conducted parametric analyses on freak waves for the force performance of the tension leg platform. Lately, Zeng et al. [19] simulated and measured the dynamic responses of an offshore wind turbine structure caused by freak waves. Hou et al. [20] employed the wave-focusing technique to obtain a series of freak waves and analyzed the induced response characteristic of the floating wind turbine.
Recently, several floating PV platform types have been proposed for the development of ocean PV energy sources. Current studies on the motion responses of the floating PV platform are relatively few and mainly focus on its response characteristics under normal random waves. Cazzaniga et al. [21] used pontoon-type structures to reinforce the offshore PV system and studied the overall floating PV responses under the action of ocean waves. Luo et al. [22] carried out a detailed investigation on the performance stability of the floating PV experimental platform system located in Singapore. Choi et al. [23] numerically simulated the wind loads of the offshore PV structure and derived the function relationship between the drag force and the lift force for the PV structure. Kaymak and Sahin [24] provided a detailed account of the existing challenges for floating PV systems and developed a new PV system to resist severe weather and ocean environmental conditions. Xu and Wellens [25] derived the third-order analytical method to investigate the nonlinear interactions between the floating PV structure and the ocean wave. Jin et al. [26] presented an innovative analytical model of the large floating PV support structure and analyzed its dynamic responses to offer an optimal solution for the structural design. The investigations of the aforementioned research on the offshore PV platform structure under normal ocean waves could provide an important reference for further exploration of the freak wave impact on the floating PV platform and mooring line structures.
In this study, a dedicated numerical model coupling the floating PV platform and mooring line structures is developed to investigate the dynamic responses caused by freak waves. The superposition technique is applied to generate freak wave sequences via the combination of transient waves and random waves. Moreover, a detailed design scheme is proposed with a large floating PV platform moored by twenty lines in a water depth of 45 m based upon the actually measured ocean environmental and geological conditions. The effectiveness of the developed model is reasonably verified by a group of comparison analyses. Finally, global time-domain simulations are implemented to explore the three-dimensional responses of the floating PV platform and mooring line structures under the generated freak waves. The induced response behaviors in terms of PV platform motions, mooring line configurations, and tensions are analyzed in contrast with corresponding response results under random waves. The intuitive evidence of freak wave effects on the PV platform and mooring line structures is comprehensively obtained to offer a rational reference for the structural design.

2. Modeling Methods

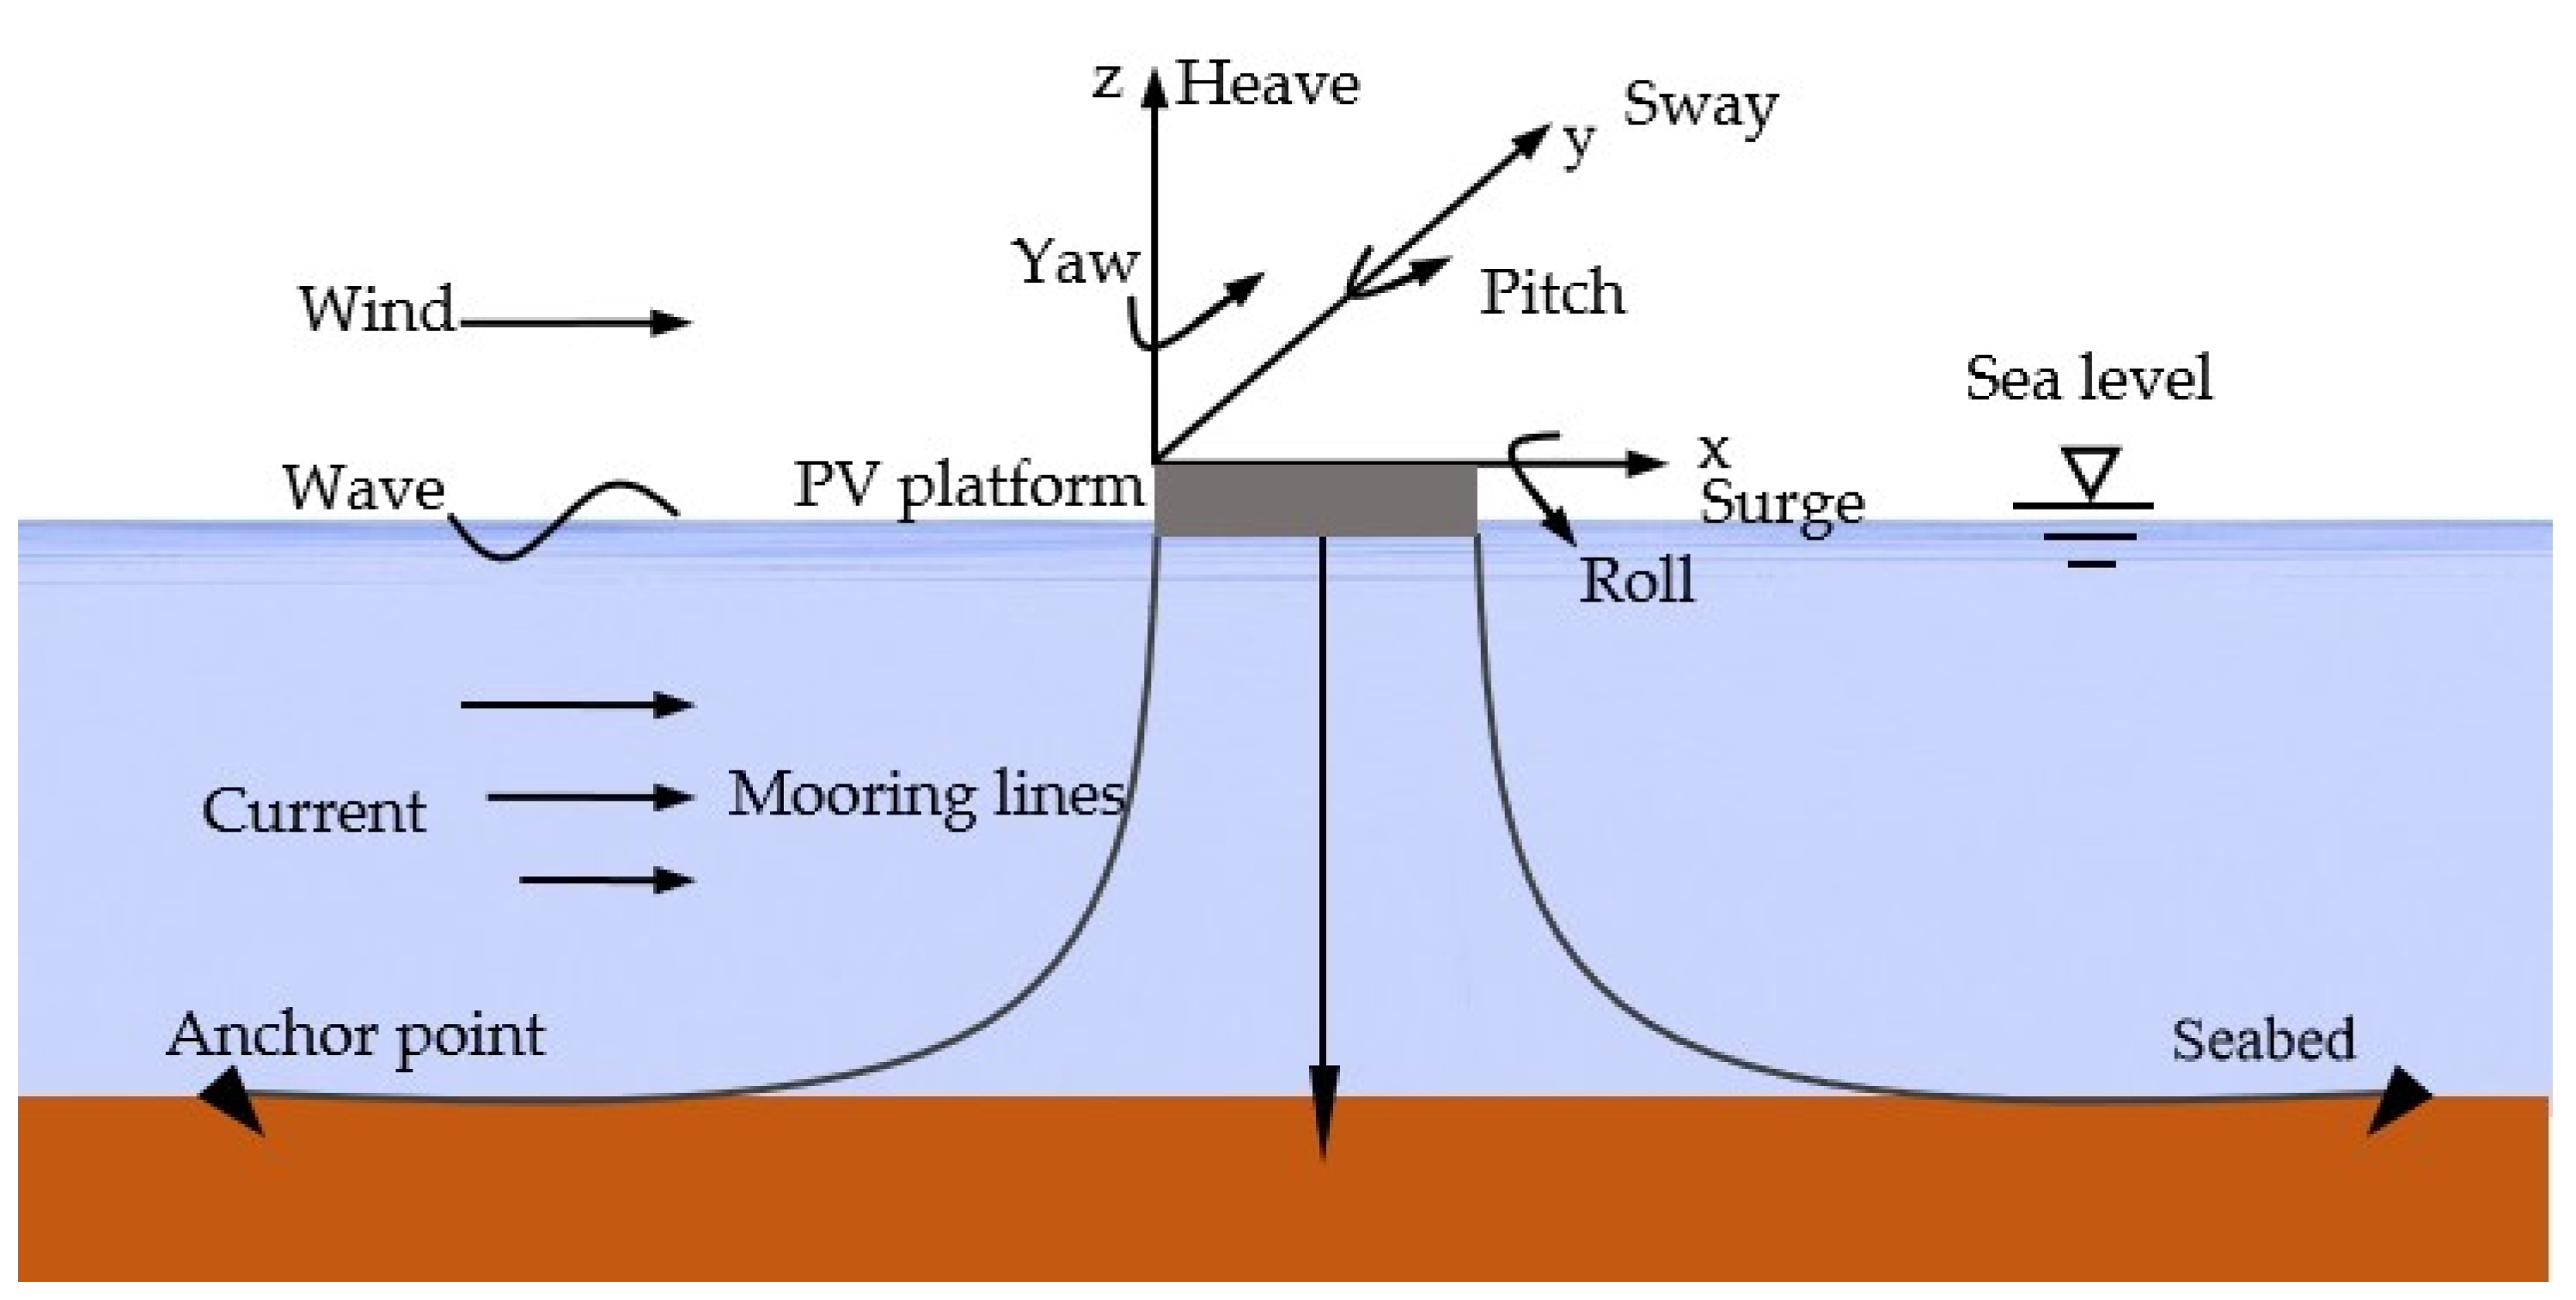
2.1. PV Platform Motion Equations

Under the combined actions of wind, wave, and current loads in the marine environment, the floating PV platform could undergo random movements with six degrees of freedom directions, including surge, sway, heave, roll, pitch, and yaw, as illustrated in Figure 1, and the motion equations of the PV platform can be established and given by
M + Δ M x ¨ t + ( B r + B v ) x ˙ t + ( K s + K m ) x t + 0 t R t τ x ˙ τ d τ = F w t + F h t + F m t
where
M and ΔM—the inertial and additional mass matrix of the PV platform, which are expressed as
M = M i M i L M i L M i L 2
Δ M = M a M a L M a L M a L 2
where Mi is the mass of the PV platform, L is the length of the PV platform, and Ma is the additional mass of the PV platform.
Br—the radiation damping matrix;
Bv—the viscous damping matrix, which is expressed as follows:
B v = μ M + λ K
where μ is the mass proportional coefficient, λ is the stiffness proportional coefficient, M is the inertia mass matrix of the PV platform, and K is the stiffness matrix of the PV platform.
Ks and Km—the hydrostatic and mooring system stiffness, which is expressed as follows:
K s = F h L F h r a d F h r a d F h L L F h L r a d F h L r a d F h L L F h L r a d F h L r a d
K m = F m L m F m r a d F m L m L m F m L m r a d
where Fh is the hydrostatic force of the PV platform, rad is the unit of radians, Fm is the forces of the mooring line, and Lm is the length of the mooring line.
R(t)—the time delay function R ( t ) = 2 π 0 t B ω c o s ( ω t ) d t where B(ω) is the additional damping factor;
x(t), x ˙ (t), and x ¨ (t)—the displacement, velocity, and acceleration of the PV platform at time t;
Fw(t) and Fm(t)—the wind loads and mooring loads enacted on the PV platform;
Fh(t)—the hydrodynamic load enacted on the PV platform, which is expressed as [27]
F h = ρ s 0 ϕ ω t n d s + s 0 ϕ d t n d s + s 0 ϕ r t n d s F c F h ( 2 )
where
ϕω—the incident potential of waves unperturbed by the PV platform;
ϕd—the wave diffraction potential after the wave crosses the PV platform;
ϕr—the radiation potential generated by the motion of the PV platform;
Fc—the viscous damping force, which is expressed as follows:
F c = c v
where c is the damping constant, and v is the motion speed of the PV platform.
Fh(2)—the second-order wave force, which is expressed as follows:
F h ( 2 ) = i = 1 n j = 1 n R e Q d ( β i , β j , τ i , τ j ) a i a j e x p [ i ( ω i ω j ) t ( f i f j ) ]
where Re denotes the real part of a complex number, Q d ( β i , β j , τ i , τ j ) represents the wave drift QTFs for the interaction of wave components i and j; β is the direction relative to the heading of the PV; a is amplitude; ϕ is the phase lag relative to the simulation time origin; τ is the period, ω i = 2 π τ i is the angular frequency.

2.2. Mooring Line Model

The mooring line is connected to the floating PV platform via the fairlead at the top and discretized into a sequence of line segments, which are simulated by straight massless spring segments with two mass nodes at the end, as shown in Figure 2. The mechanical properties and motion states, such as the mass, buoyancy, and displacement of the mooring line, are concentrated on the adjacent mass nodes, while the tensile properties of the mooring line are characterized by the spring segment. To analyze the tension behavior of each spring segment, the force equilibrium equation can be established to calculate the effective tension of the spring segment for the mooring line, which is given by [15]
T e = T w ( ε t ) + ( 1 2 ν ) · P m A e + E A n o m · ξ · ( d L / d t ) / L 0
where
Tw(εt)—the wall tension of the mooring line as a function of the axial tensile strain εt;
ν—Poisson’s ratio, where Pm is the hydrostatic pressure on the mooring line;
Ae—the equivalent cross-sectional area;
EAnom—nominal axial stiffness;
ξ—the axial numerical damping factor;
L and L0—the instantaneous and unstretched lengths of the line segment.

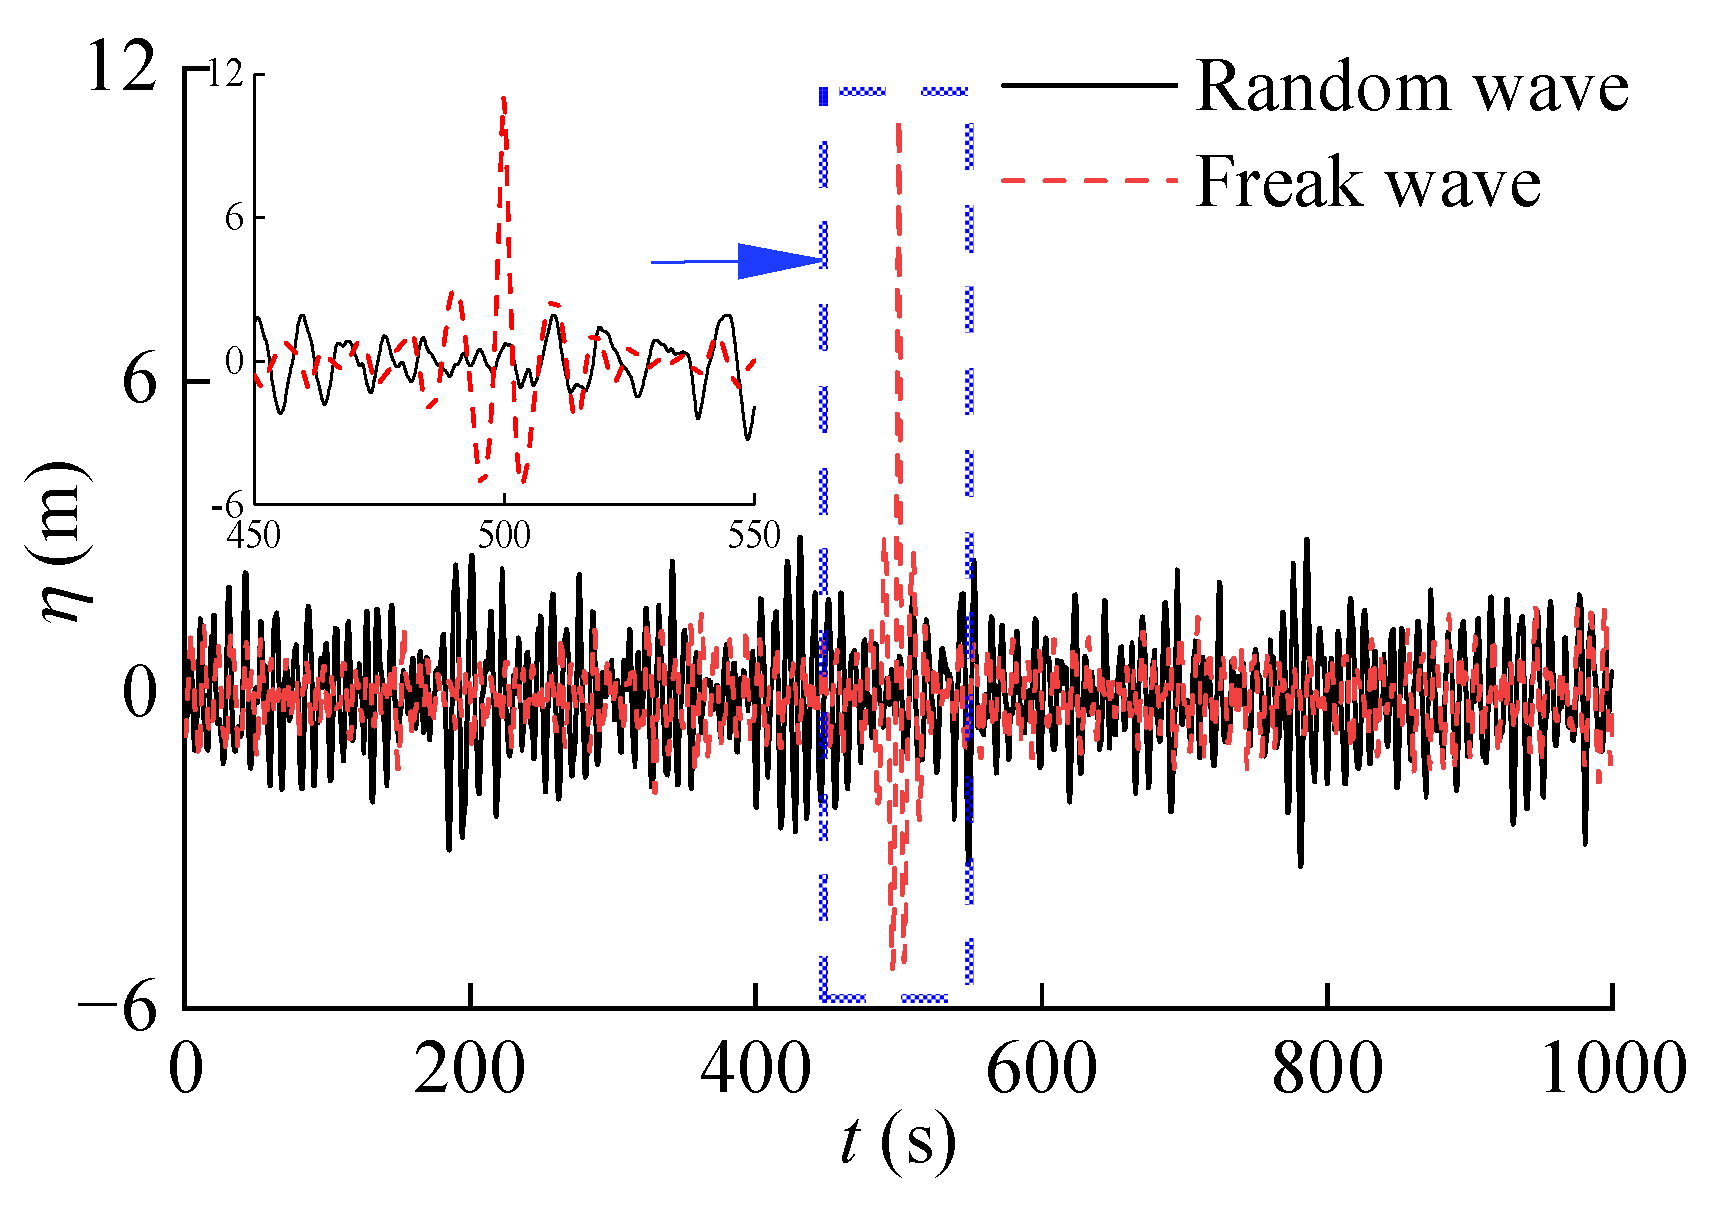
2.3. Generation Model of Random and Freak Waves

Random and freak waves are two typical ocean conditions that are required to be effectively simulated for the analysis of deep-sea floating PV mooring structures. To depict the variable and irregular features of the random wave, the standard JONSWAP spectrum [28] has been proposed with some characteristic parameters of the wave height, period, and so on. An equal energy technique is utilized to divide the wave spectrum into a sequence of unit components with different frequencies, and the spectral energy of each unit component in the frequency zone is kept consistent. The frequency domain of the unit components is then transformed to the time domain via the inverse Fourier transform approach, and a certain number of linear wave segments are obtained for the superposition to generate random wave sequences, which are expressed as follows:
η ( x , t ) = i = 1 N f i 1 f i 2 S ( f ) d f 1 2 c o s ( k i x ω i t + φ i )
where
N—the wave component number;
k i , ω i and φ i —the wave number, angular frequency, and phase lag of the ith wave component.
S ( f ) —the spectral density function is given by
S ( f ) = α g 2 / ( 16 π 4 f 5 ) e x p 1.25 ( f / f m ) 4 γ β
where α—the spectral energy factor;
g—the gravitational constant;
In β = e x p f f m 2 / 2 σ 2 f m 2 σ is the spectral width coefficient;
fm and γ—the peak frequency and enhancement factor.
For the generation of freak waves, a linear superposition technique is utilized to express the freak wave as a combination of the random wave and the transient wave with different energy ratios [9]. The random wave controls the randomness of the wave sequence represented by the wave spectrum. The transient wave is simulated by means of focusing the wave model to converge wave energy at the appointed location at the same time. Therefore, the generation expression of the freak wave can be given by
η ( x , t ) = E p 1 i = 1 N a i c o s [ k i x ω i t + φ i ] + E p 2 i = 1 N a i c o s [ k i ( x x p ) ω i ( t t p ) ]
where
Ep1 and Ep2—the energy ratios of the random wave and transient wave; Ep2 = 1 − Ep1;
ai—the wave amplitude;
xp and tp—the focused location and time of the transient wave.

3. Numerical Implementation

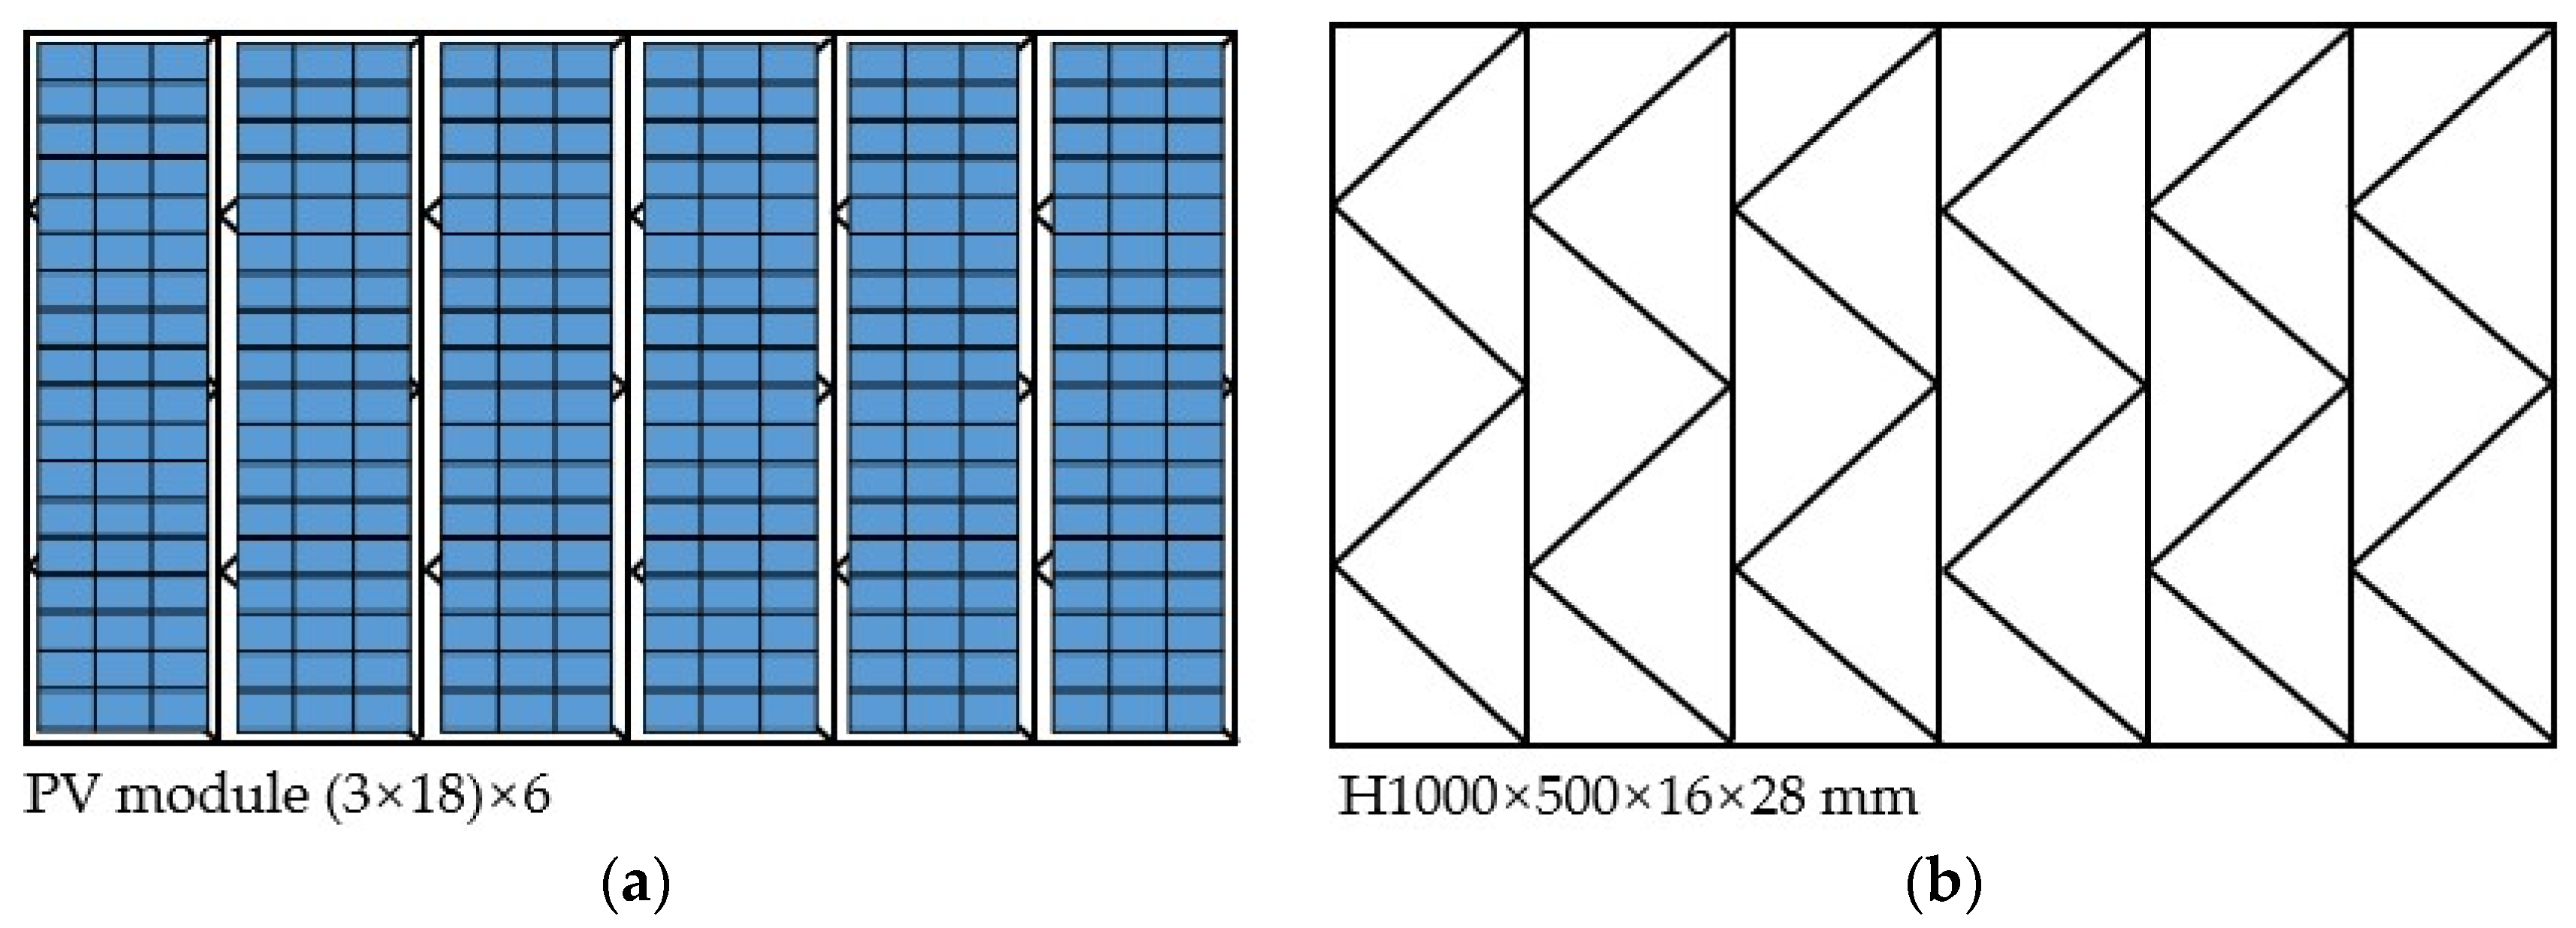
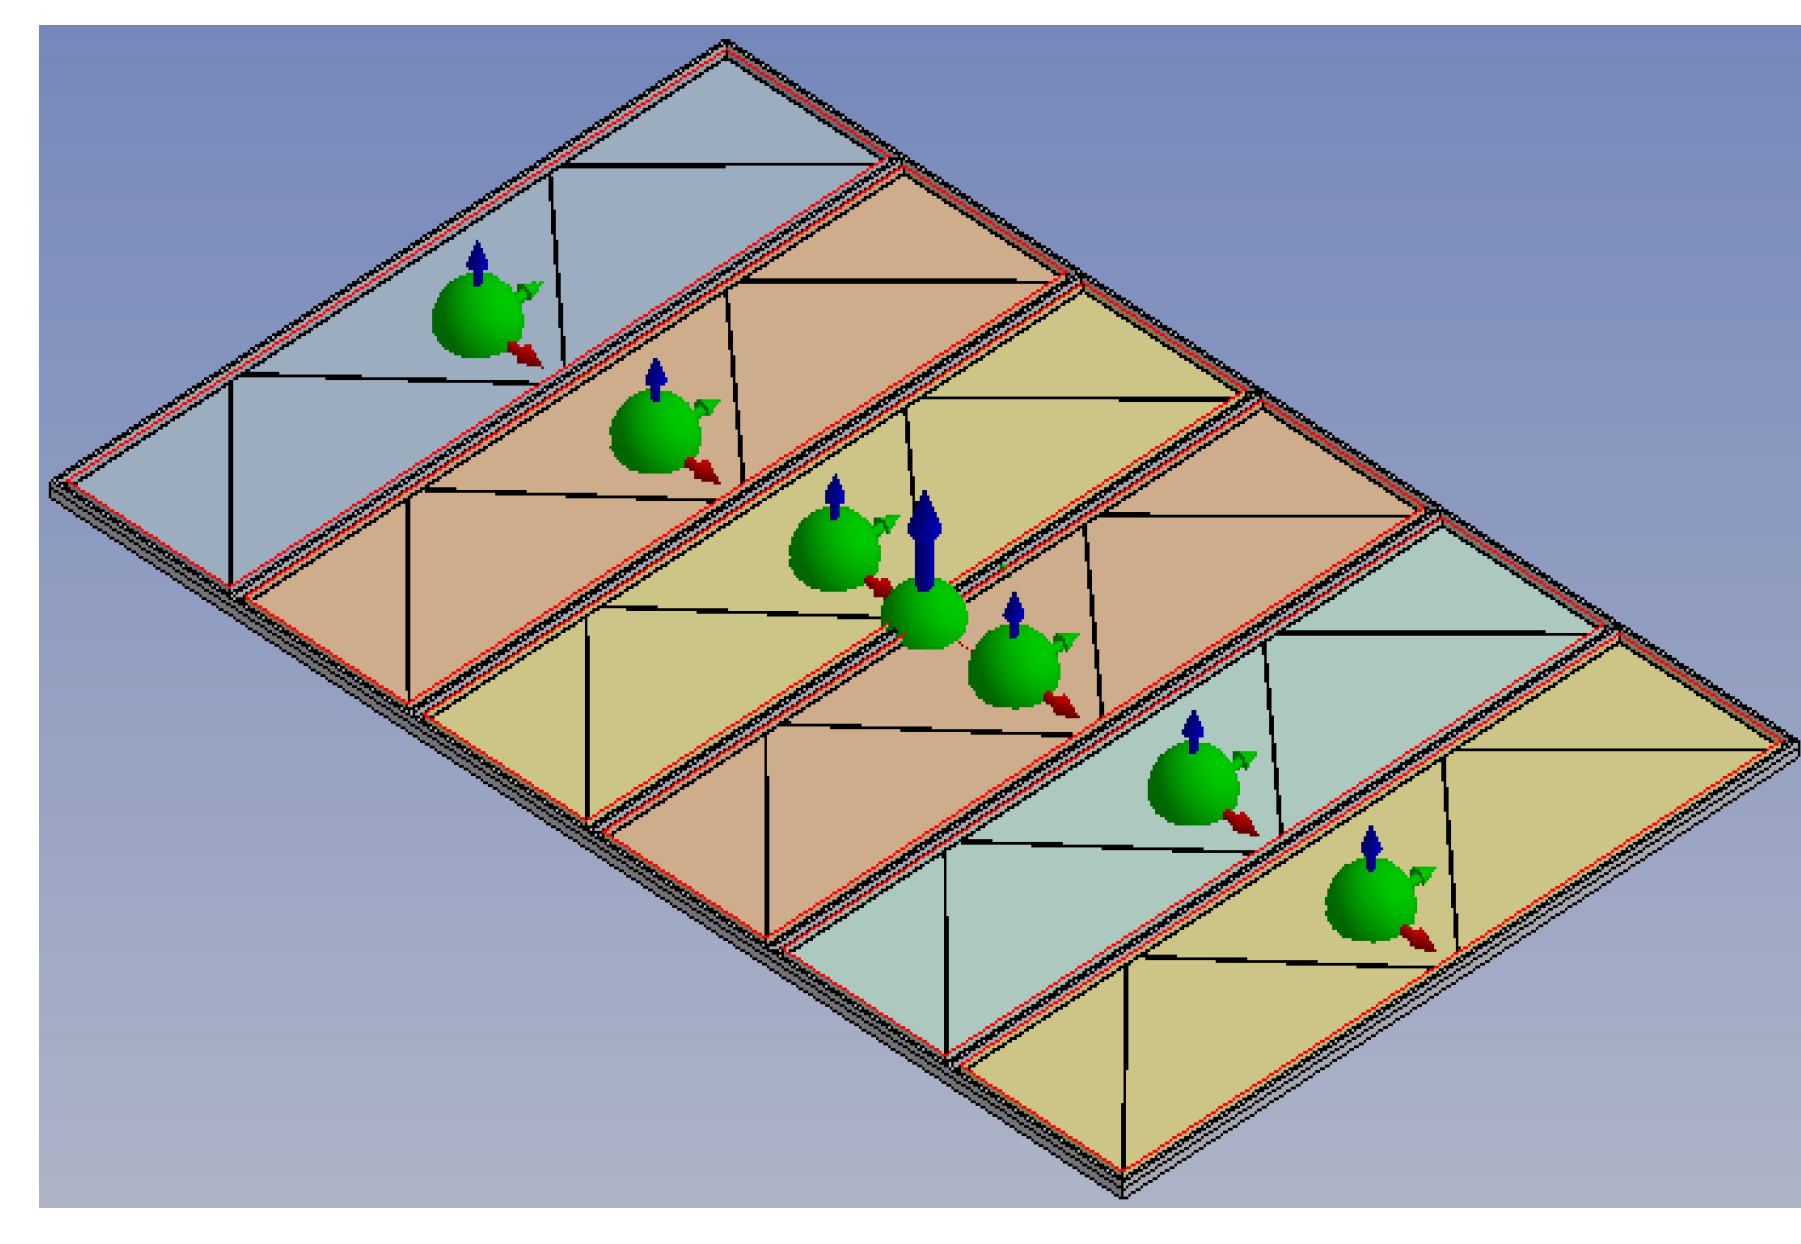
3.1. Basic Parameters of PV Platform and Mooring Structure

According to the actual engineering from the ocean sea off Pingtan city in Fujian province, a large floating PV platform is initially proposed and designed with a total length of 80.62 m, a width of 50.7 m, a mass of 355.91 t, a draft of 0.57 m and working water depth of 45 m, as shown in Figure 3. The floating platform mainly contains the PV module and the steel frame, which are rigidly connected. The PV module consists of 324 PV panels with 6 arrays mutually hinged onto each other, and each array comprises 3 × 18 PV panels, as displayed in Figure 3a. The steel frame includes the rectangular members composed of 1000 × 500 × 16 × 28 mm H-beams for temporary maintenance, and the “W” type members composed of 500 × 200 × 10 × 16 mm H-beams support the PV modules, as illustrated in Figure 3b.
The suspension chain line mooring system is adopted for the floating PV platform, as shown in Figure 4. A plane coordinate system (x, y) is established with the origin point at the lower left corner of the platform, and the long and short sides of the platform are arranged by 6 and 4 mooring lines in the x-axis and y-axis directions, respectively. A total of 20 mooring lines and 8 anchorage points are arranged symmetrically for the whole platform. Each mooring line is made up of three sections, including the chain at the top, the nylon in the middle, and the chain at the bottom. The radius and length of each section and the material property parameters of the chain and the nylon are listed in Table 1 and Table 2, respectively.

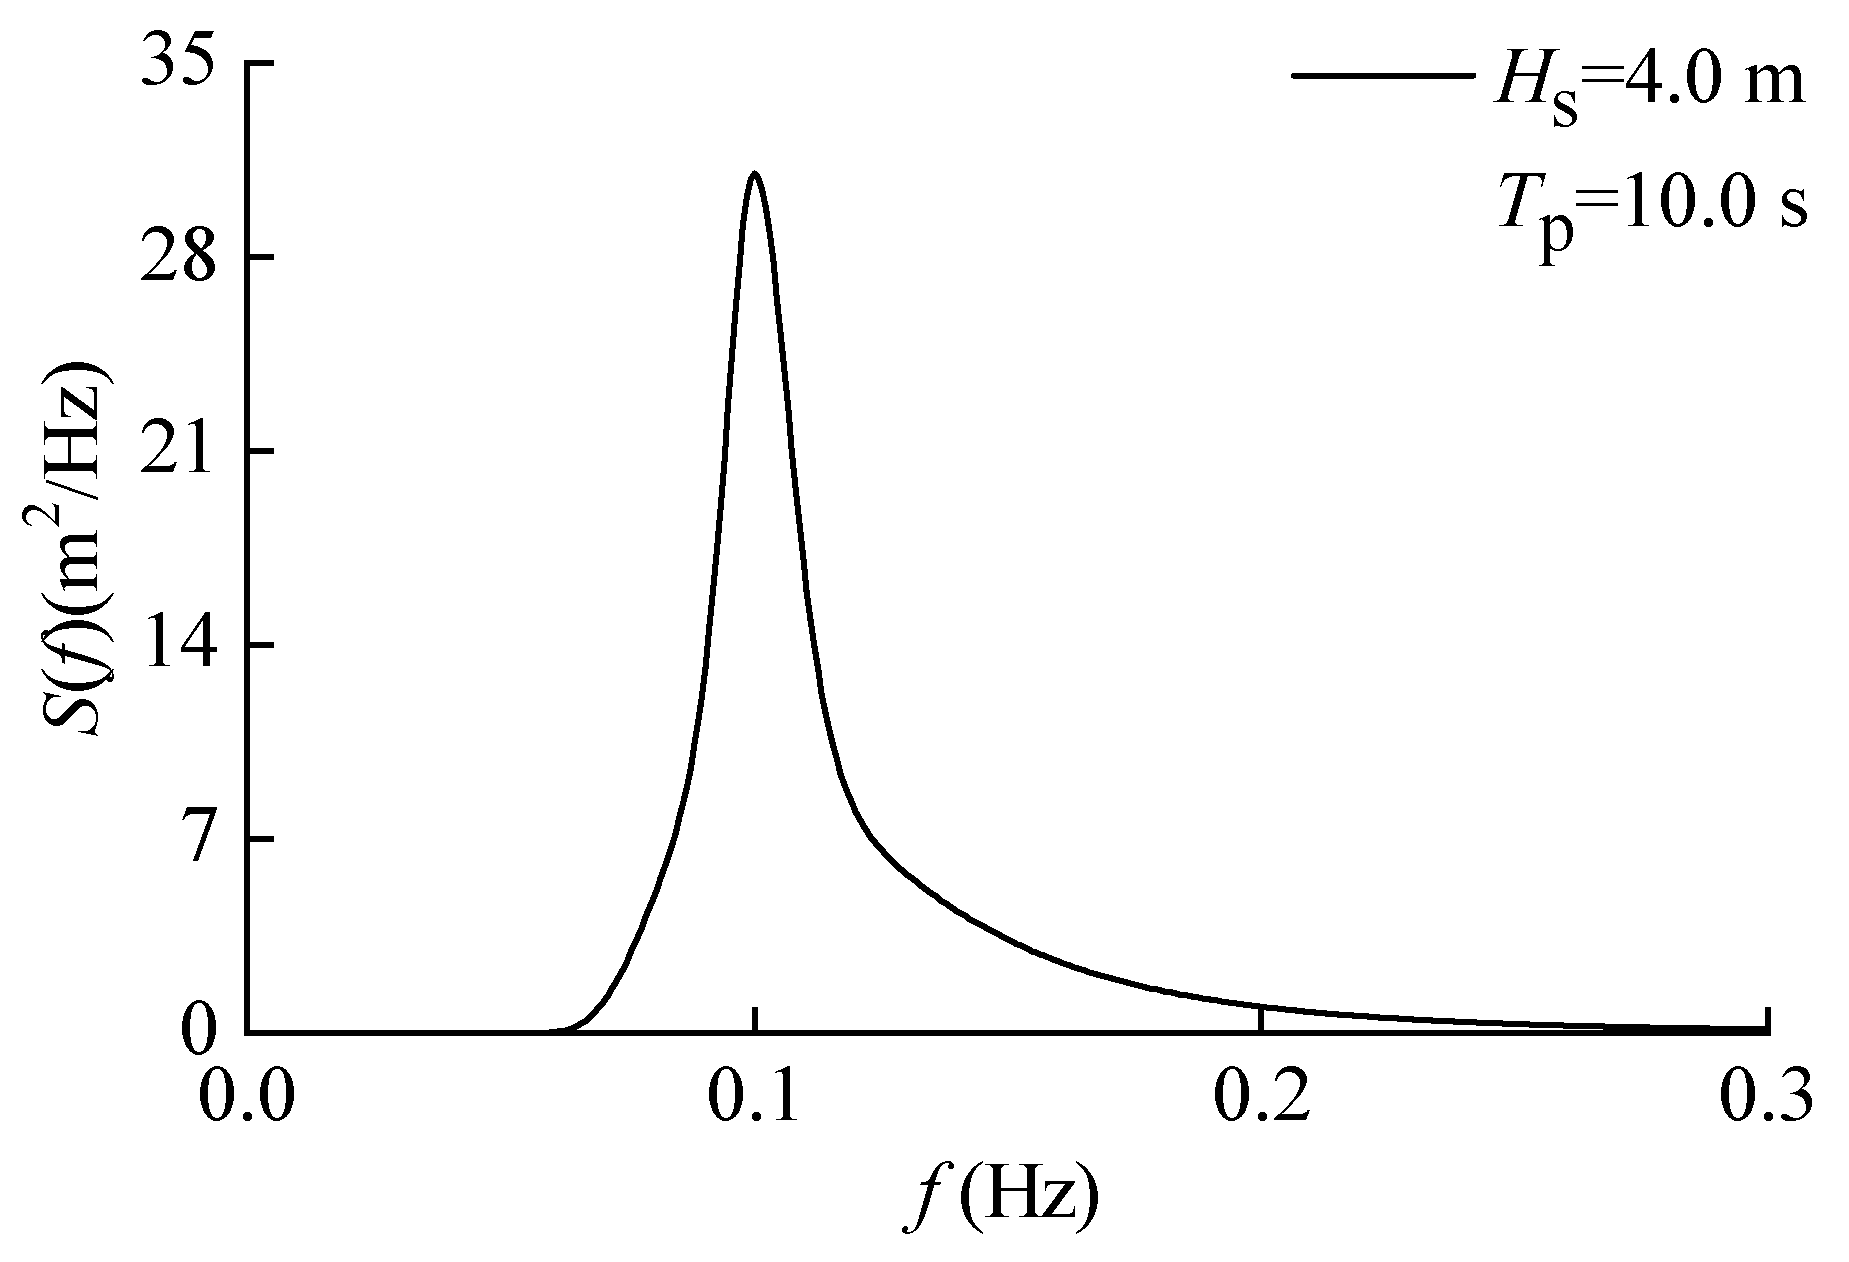
3.2. Ocean Environmental Conditions

Based on the measured data from the observation station in the ocean sea off Pingtan city, the JONSWAP spectrum is selected to represent the random waves with a significant wave height Hs = 4.0 m, spectral peak period Tp = 10.0 s, and spectral peak factor γ = 3.3, as shown in Figure 5, and the spectral parameters as listed in Table 3. The equal energy technique is employed to transform the spectrum into a time-history series of random waves. A focusing wave model is then utilized to combine random waves and transient waves to generate a sequence of freak waves. A total time of 1000 s is selected to illustrate the generated random waves and freak waves, as displayed in Figure 6. In view of the freak wave, the wave amplitude increases abruptly to attain the peak value of 11.0 m at the focusing time of 500 s with a maximum wave height of 16.3 m. Meanwhile, the wave amplitude is relatively small before and after the focusing moment, which is in accordance with the characteristic law of the freak wave [15]. In addition, the variation in current velocity with water depth is illustrated in Figure 7 based on the actual measurement. The constant wind is considered with a speed of 10 m/s, and the directions of the ocean wind, wave, and current in the simulation calculation are all set as 0°.

3.3. Implementation Process

Two calculated modules are included in the dynamic simulation of floating PV structural responses. In terms of structural connections, universal connections are made between each PV platform panel and the steel frame in AQWA within the ANSYS [29]. This type of connection restricts relative motion in all directions except for the rotation around the floating PV’s X-axis and the steel frame’s Y-axis. The lower steel frame of the PV platform uses Morison members, and the upper PV platform panel uses a panel model to conduct hydrodynamic analysis in the frequency domain, obtaining the hydrodynamic parameters of the PV platform, as shown in Figure 8. The numerical model, coupling the PV platform and mooring line structures, is the core module built within the framework of OrcaFlex [30], as shown in Figure 9. Six degrees of freedom motions of the PV platform are considered in the model with the influences of the first-order wave load and second-order wave drift load. Twenty mooring lines are established to calculate the configuration and tension responses, where the top end is connected to the PV platform; the bottom end is anchored at the seabed.
The other module is the generation model of freak wave sequences, which are implemented by a large number of coding programs with MatLab. Then, the obtained freak wave series are integrated into the PV platform model as an input ocean environmental condition. The hydrodynamic loads induced by ocean waves and currents on the PV platform and mooring lines are sufficiently taken into account. The time domain simulation calculation of the coupling numerical model is accomplished using the implicit integration method. The motion equations of the PV platform and the force equilibrium equations of the mooring lines are solved to acquire the dynamic responses of the PV platform and mooring lines under the random and freak waves.

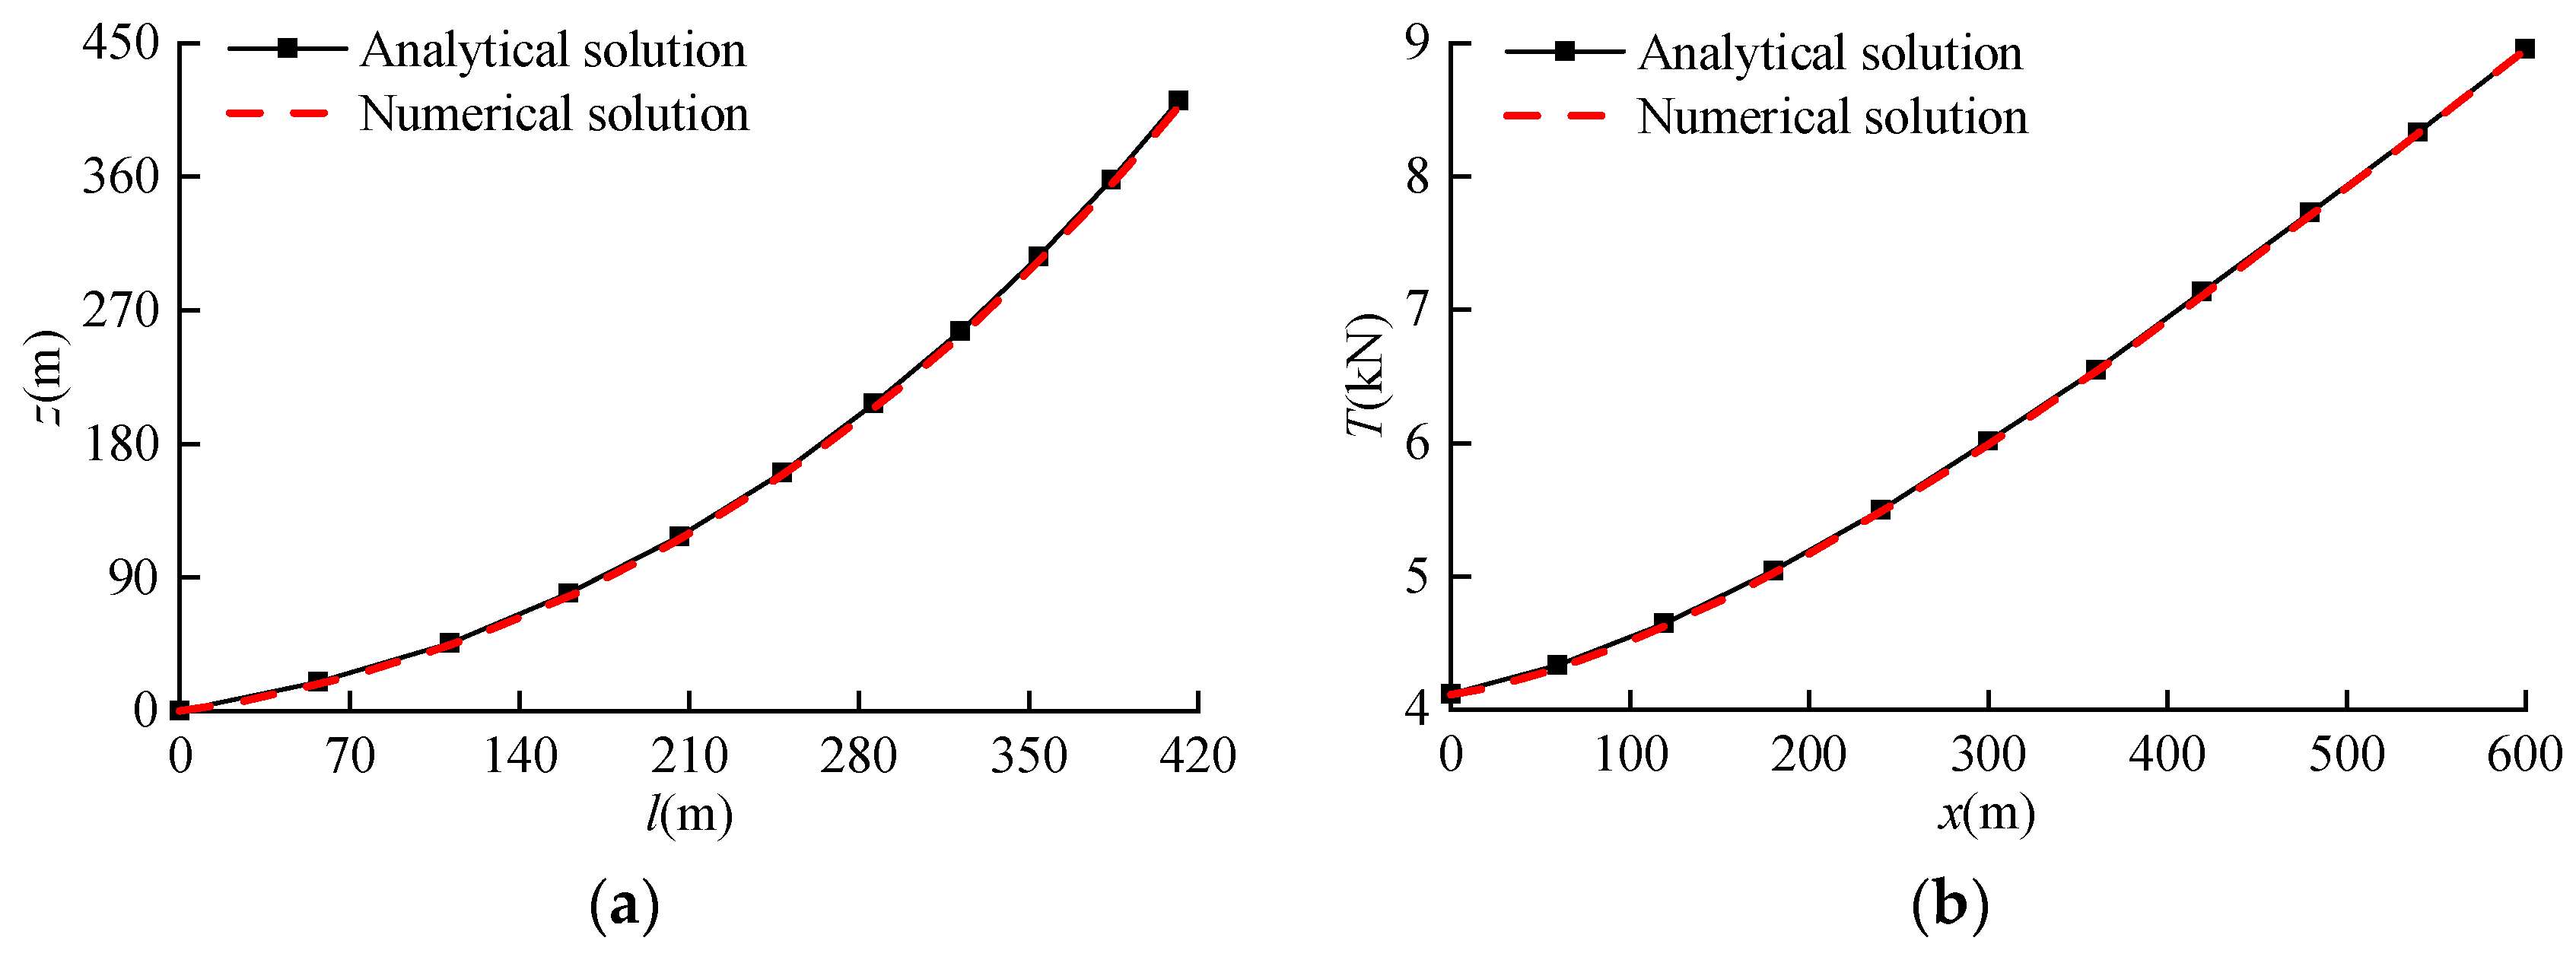
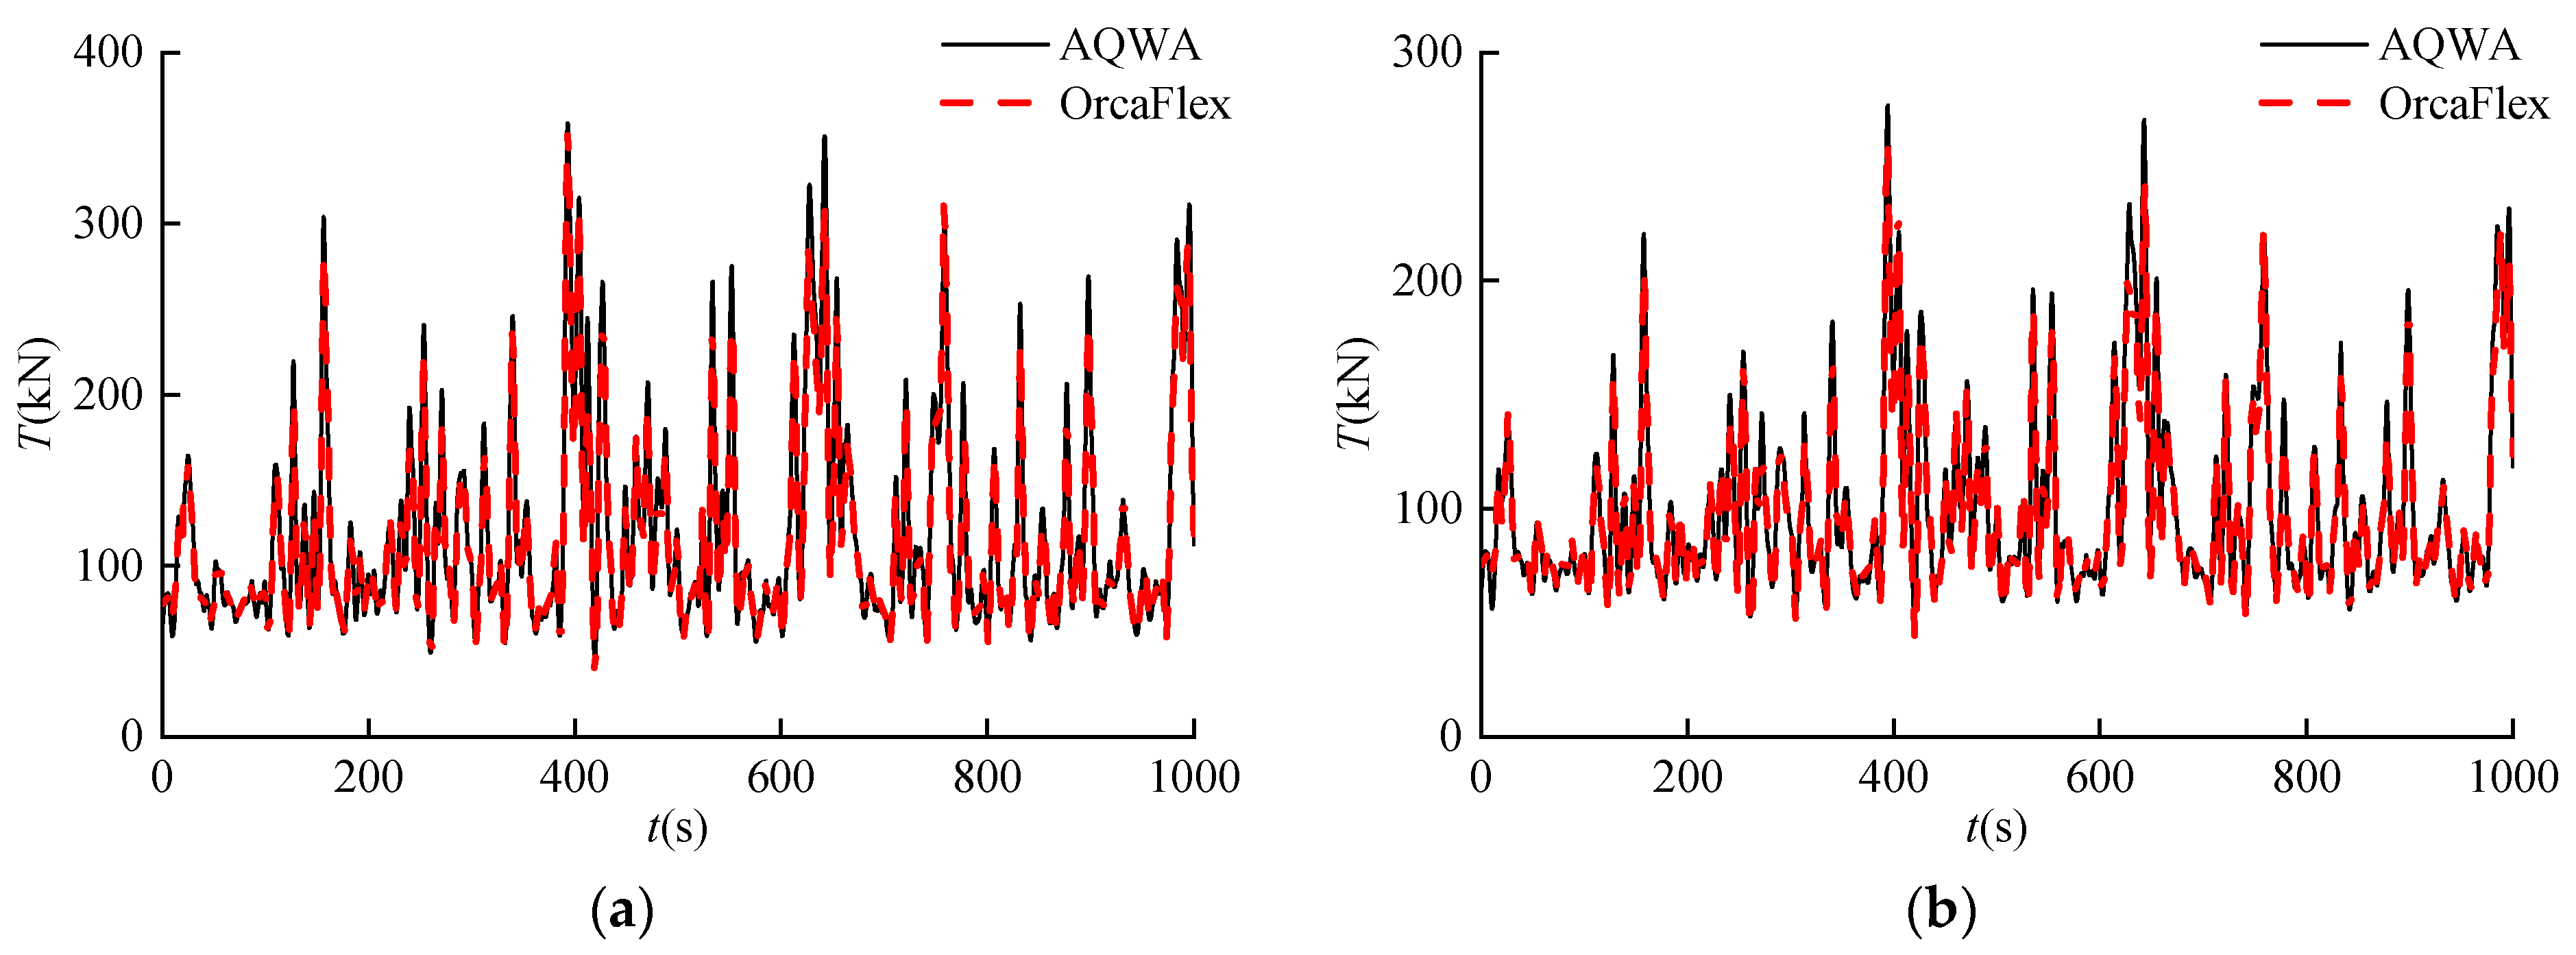
3.4. Comparison and Verification

A preliminary comparison between the developed numerical solution via OrcaFlex and the analytical solution in the literature [31] is conducted to calculate the static responses of the mooring line. The basic parameters of the mooring line are set as the same with a steel cable density of 7000 kg/m, a length of 600 m, and a water depth of 420 m, and the calculated result of the mooring line is illustrated in Figure 10. Both the configuration and tension distributions along the entire mooring line coincide well for these two solutions, which initially validates the accuracy of the present numerical method for the simulation of the mooring line.
The dynamic time history responses of the designed floating PV platform and mooring structures caused by random waves are further compared with the corresponding calculated results by AQWA within the ANSYS. Two representative sea states of 0° and 45° wave incidence directions are selected in the numerical simulations. The surge motions of the floating platform are randomly varied with the calculated time, which is matched consistently for both numerical methods. The motion response amplitude in the direction of 0° is larger than that in the direction of 45°, as illustrated in Figure 11. Additionally, the tension time history responses of the mooring line L1 are also in agreement with the two numerical methods, and the tension response amplitude in the direction of 0° is greater than that in the direction of 45°, as illustrated in Figure 12.

4. Results and Discussion

4.1. PV Platform Motion Responses

The time history motion responses and the maximum response amplitudes of the floating PV platform under the random wave and freak wave are shown in Figure 13. Induced by the ocean wave with the direction of 0°, the floating PV platform occurs with 3 degrees of freedom and irregular motions, including the surge, heave, and pitch. At the freak wave focusing time of 500 s nearby, all three motion responses of the PV platform clearly enlarge. Considering the freak wave effect, the response amplitude of the surge, heave, and pitch motions attain 33.17 m, 16.72 m, and 20.82°, which separately increase by 191.22%, 116.86%, and 106.14% in contrast with the corresponding response values of 11.39 m, 7.71 m, and 10.10° for the random wave. Thus, the freak wave has a significant influence on the motion responses of the PV platform and especially causes a remarkable amplification of the surge motion response amplitude.

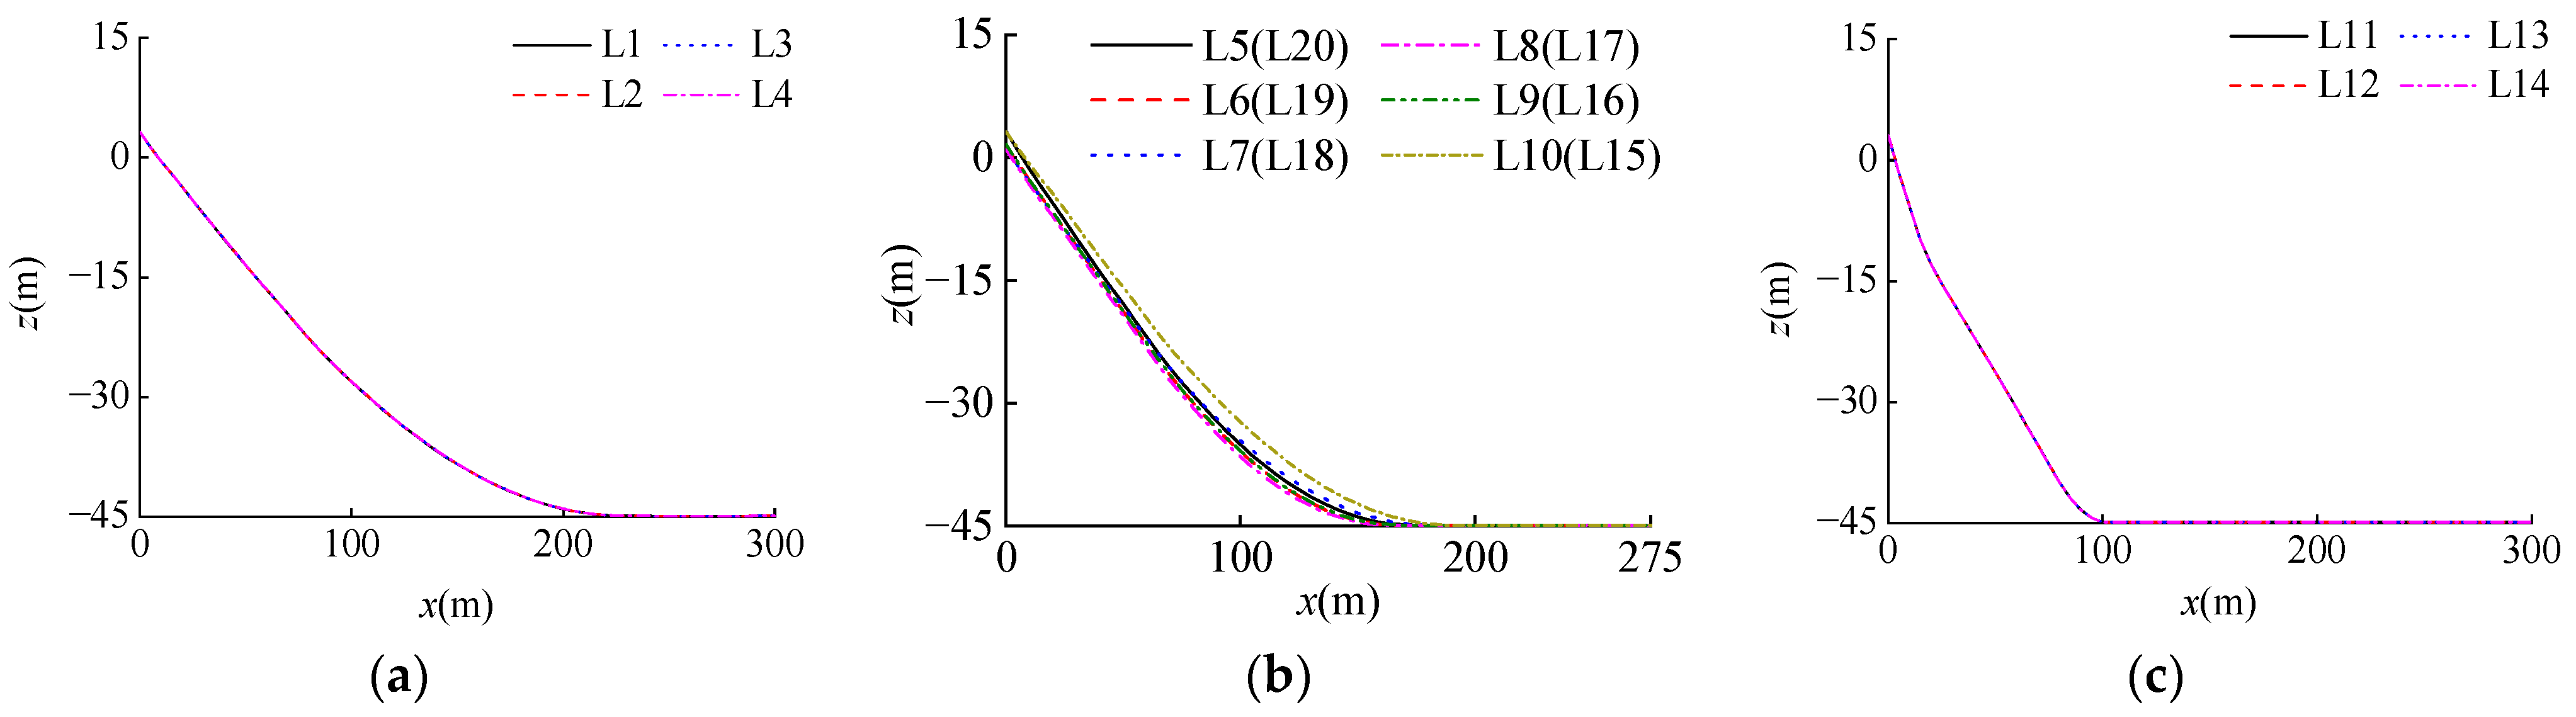
4.2. Mooring Line Configuration Responses

The mooring configuration is a crucial parameter for the design and selection of the mooring line length. Figure 14 and Figure 15 illustrate the configuration response distribution of the twenty mooring lines resulting from the maximum displacements under the random wave and freak wave. Among the mooring lines L1~L20, the configurations of the mooring lines L1~L4 in the wave-facing direction are the tightest, and the configurations of the mooring lines L11~L14 back in the wave-facing direction are the slackest. Moreover, the configurations of the mooring lines L5~L10 are identical to the shapes of the mooring lines L15~L20 due to their symmetrical layout. Under the freak wave, the configurations of the mooring lines L1~L4 are tighter than those under the random wave. The configurations of other mooring lines L5~L20 are generally similar for the two waves.
To intuitively clarify the influence of the freak wave on the mooring line configuration, Figure 16 shows the lying length of the twenty mooring lines on the seabed under the random wave and freak wave. Considering the freak wave effect, the lying lengths of all twenty mooring lines L1~L20 are smaller than those under the random wave. Particularly for the mooring lines L1~L4, the lying lengths decrease from 65 m to 0 m. The lying lengths for the mooring lines L11~L14 for both waves are 190 m and 195 m, and the difference is only 2.56%. These results demonstrate that the freak wave influences the configuration of the mooring line structures to some extent, especially for the mooring lines L1~L4, where the influence is most significant.

4.3. Mooring Line Tension Responses

For the symmetrical layout of mooring lines, four representative mooring lines, L1, L5, L11, and L15, were chosen to compare and analyze the time history response of the top tension under the random wave and freak wave, as shown in Figure 17. The axial tensions of all four mooring lines at the top end randomly varied in a certain range. The top tensions for the mooring lines L1, L5, and L15 reach the crest values near the focusing time of 500 s, and the tension response amplitudes under the freak wave are evidently larger than ones under the random wave. The tension for the mooring line L11 decreases to the trough value near the focusing time of 500 s, for which the mooring line is back toward the wave direction.
Figure 18 and Figure 19 display the maximum axial tensions of the twenty mooring lines under the random wave and freak wave, respectively. Among the mooring lines L1~L20, the axial tensions of the mooring lines L1~L4 are the largest, and the axial tensions of the mooring lines L11~L14 are the smallest. The axial tensions of the mooring lines L5~L10 are the same as the corresponding mooring lines L15~L20. In addition, the tension distributions under the random wave and freak wave are evidently different for the mooring lines L1~L4 and similar to some degrees for other mooring lines L5~L20.
The maximum tension comparison of the twenty mooring lines under the random wave and freak wave is further illustrated in Figure 20. The maximum tensions of all the twenty mooring lines under the freak wave are greater than those under the random wave. The maximum tensions of the mooring lines L1~L4 under the two waves are 612 kN and 1961 kN, and the difference attains 220.42%. The maximum tensions among the mooring lines L5~L10 and L15~L20 under both waves are 434 kN and 663 kN, and the difference is 52.77%. The maximum tensions of the mooring lines L11~L14 under the two waves are only 54 kN and 62 kN, and the difference is a minimum of 12.90%. Therefore, the influence of the freak wave on the axial tension is mainly on the mooring lines L1~L4 towards the wave direction.

5. Conclusions

This paper proposes a preliminary design scheme of the large floating PV platform moored by twenty lines in a water depth of 45 m according to the ocean environmental and geological conditions that were actually measured. The coupled numerical model of the PV platform and its mooring line structure was developed to investigate their dynamic responses when induced by freak waves, which were generated via the utilization of a superposition technique in conjunction with the transient waves and random waves. The full-time domain analyses were carried out to acquire the dynamic responses of the PV platform and mooring line structures. The significant contribution of this research is to observe the remarkable differences in the PV platform motions, mooring line configuration, and tension under random waves and freak waves. The following conclusions are drawn:
(1)
The developed numerical model could reasonably simulate and calculate the response characteristics of the designed floating PV platform and mooring line structures. The accuracy and applicability of this model are reasonably verified by two groups of comparisons, including the static mooring line tension and the time history responses of the PV platform’s surge motion and mooring tension. The generated freak wave series could be effectively inserted into the created model to explore its effect on the floating PV platform’s motions, mooring line configuration, and tension responses.
(2)
The motion responses of the PV platform are noticeably remarkable under freak waves with a direction of 0°. Particularly nearby, the wave focusing time for all three motion responses of the PV platform attained the peak values, and the response amplitudes of the PV platform caused by the freak waves were evidently greater than those induced by the random waves. Among the three motions, the surge motion response is the most significant, which becomes the dominant motion of the PV platform and should be regarded with importance in the design stage.
(3)
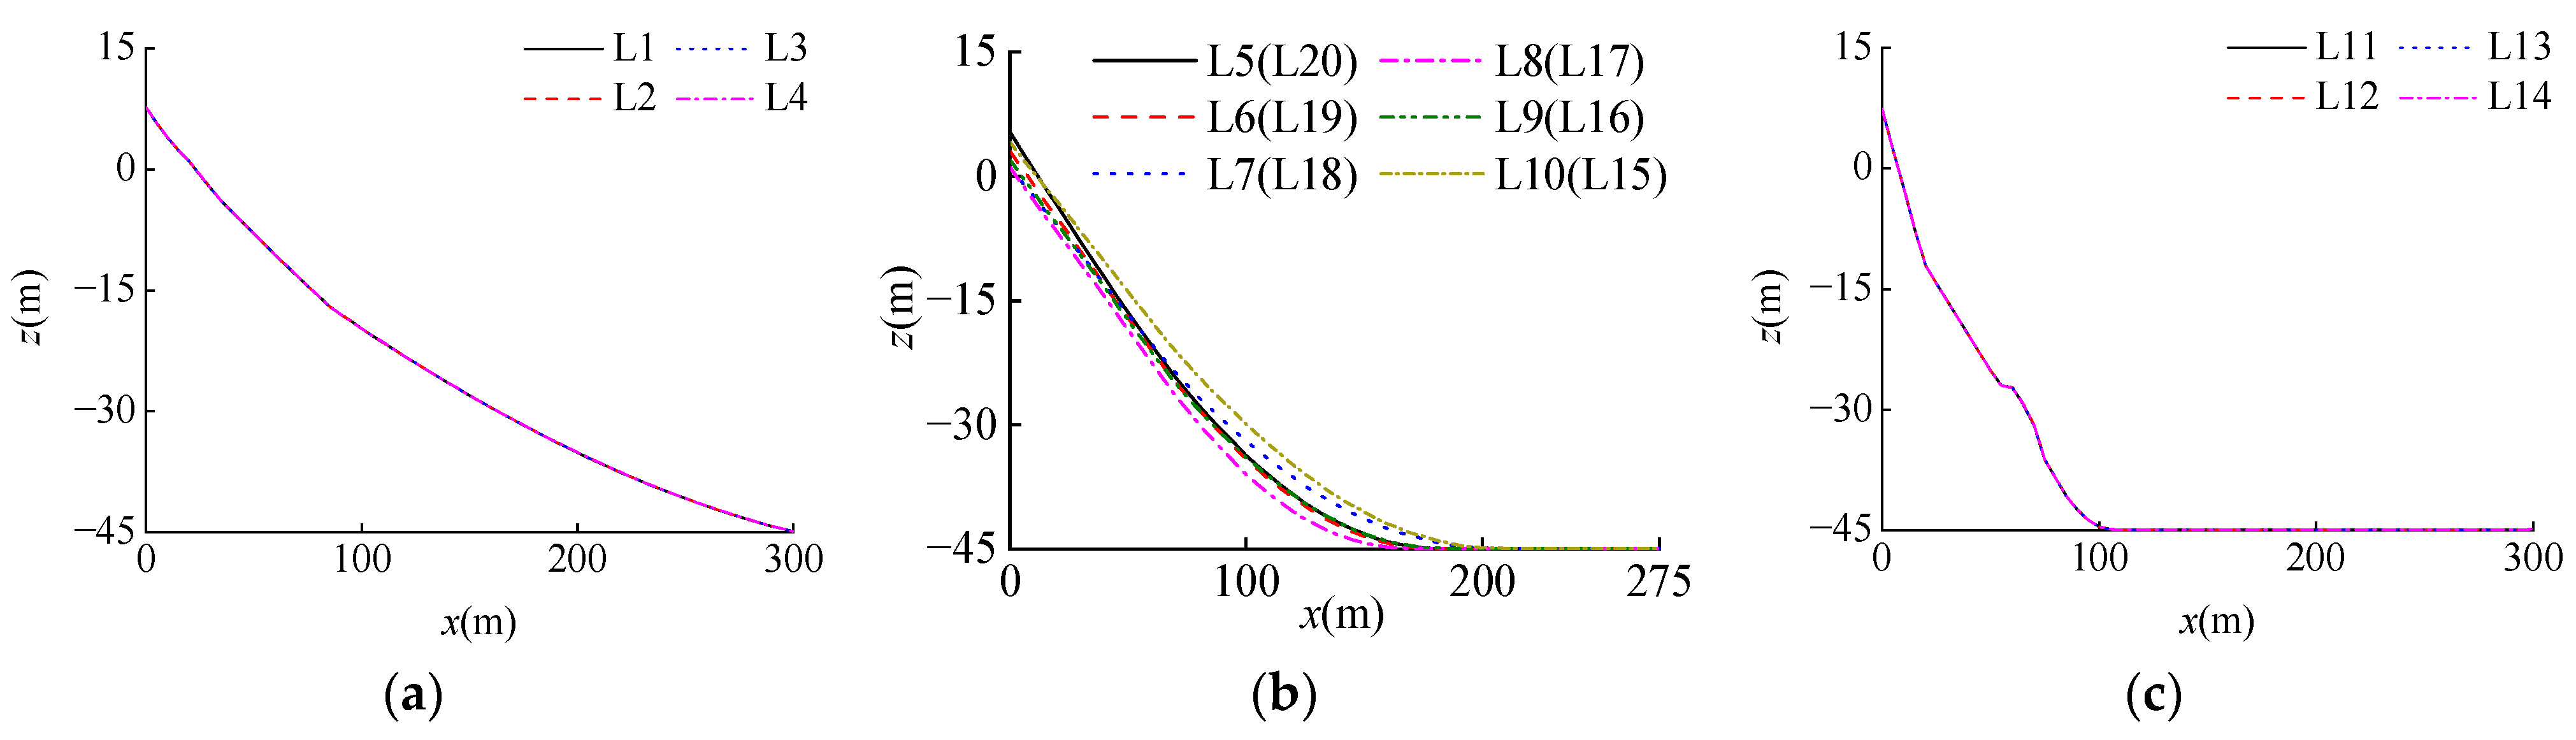
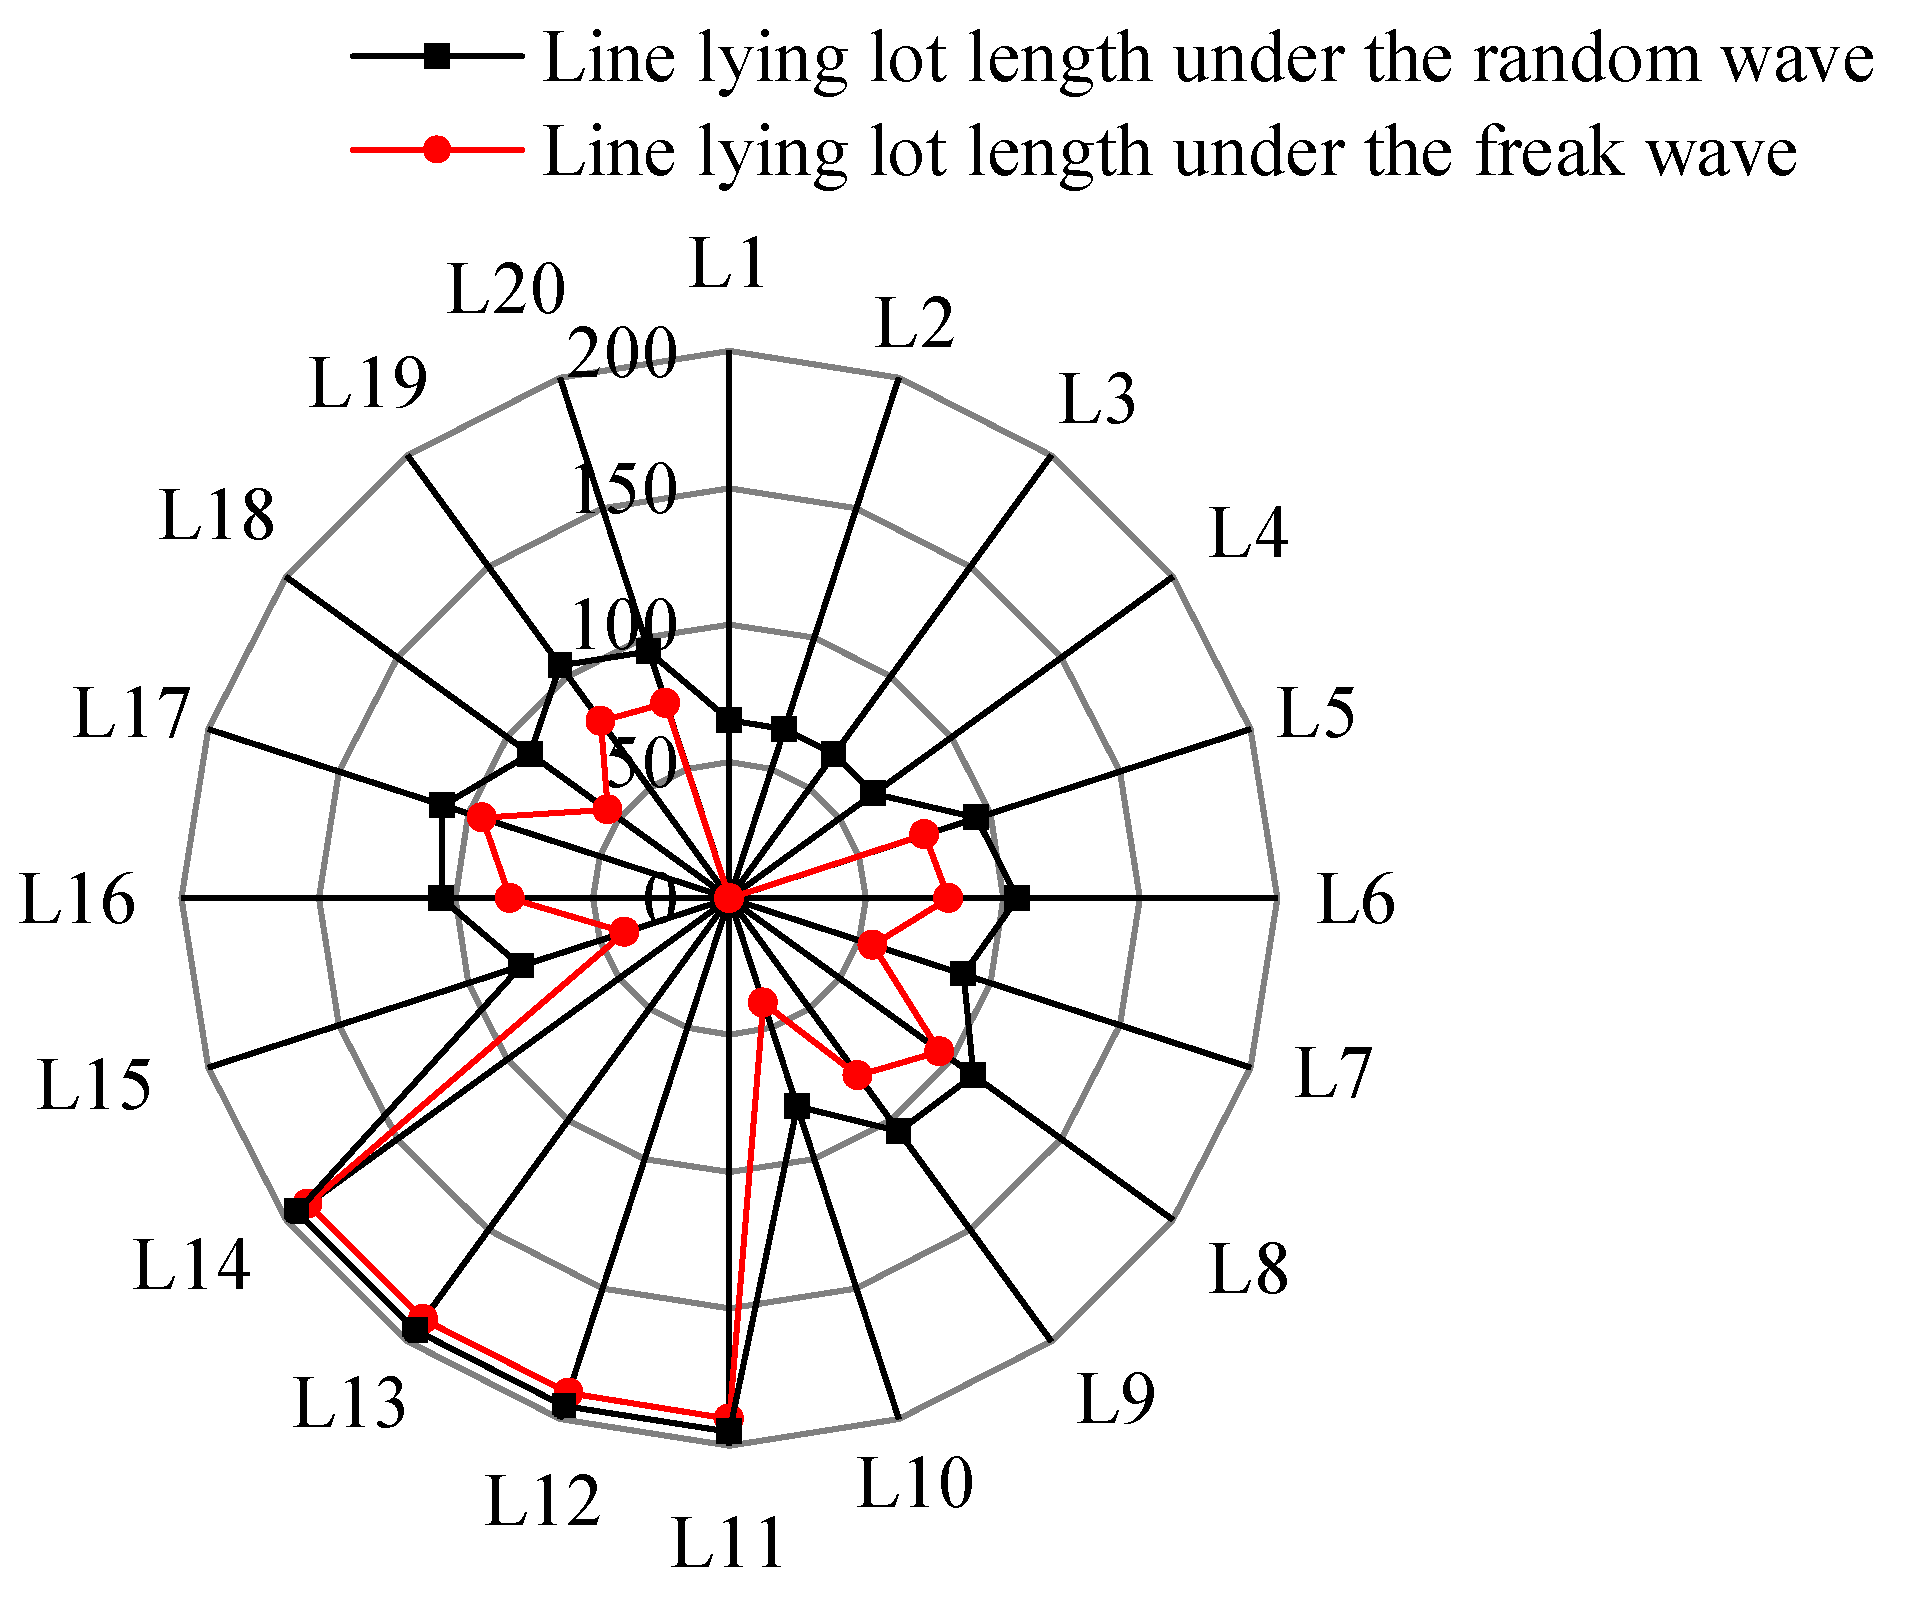
The freak waves have a great influence on the configuration of the mooring line structures. Induced by the surface waves, the configurations of the mooring lines L1~L4 on the wave-facing direction are the tightest, and the corresponding lying lengths on the seabed are the smallest among the twenty mooring lines. The configurations of the mooring lines L1~L4 under the freak wave are tighter than those under the random wave, and the configurations of other mooring lines L5~L20 are similar under the two waves. The lying lengths of the mooring lines vary analogously for the comparison of both waves.
(4)
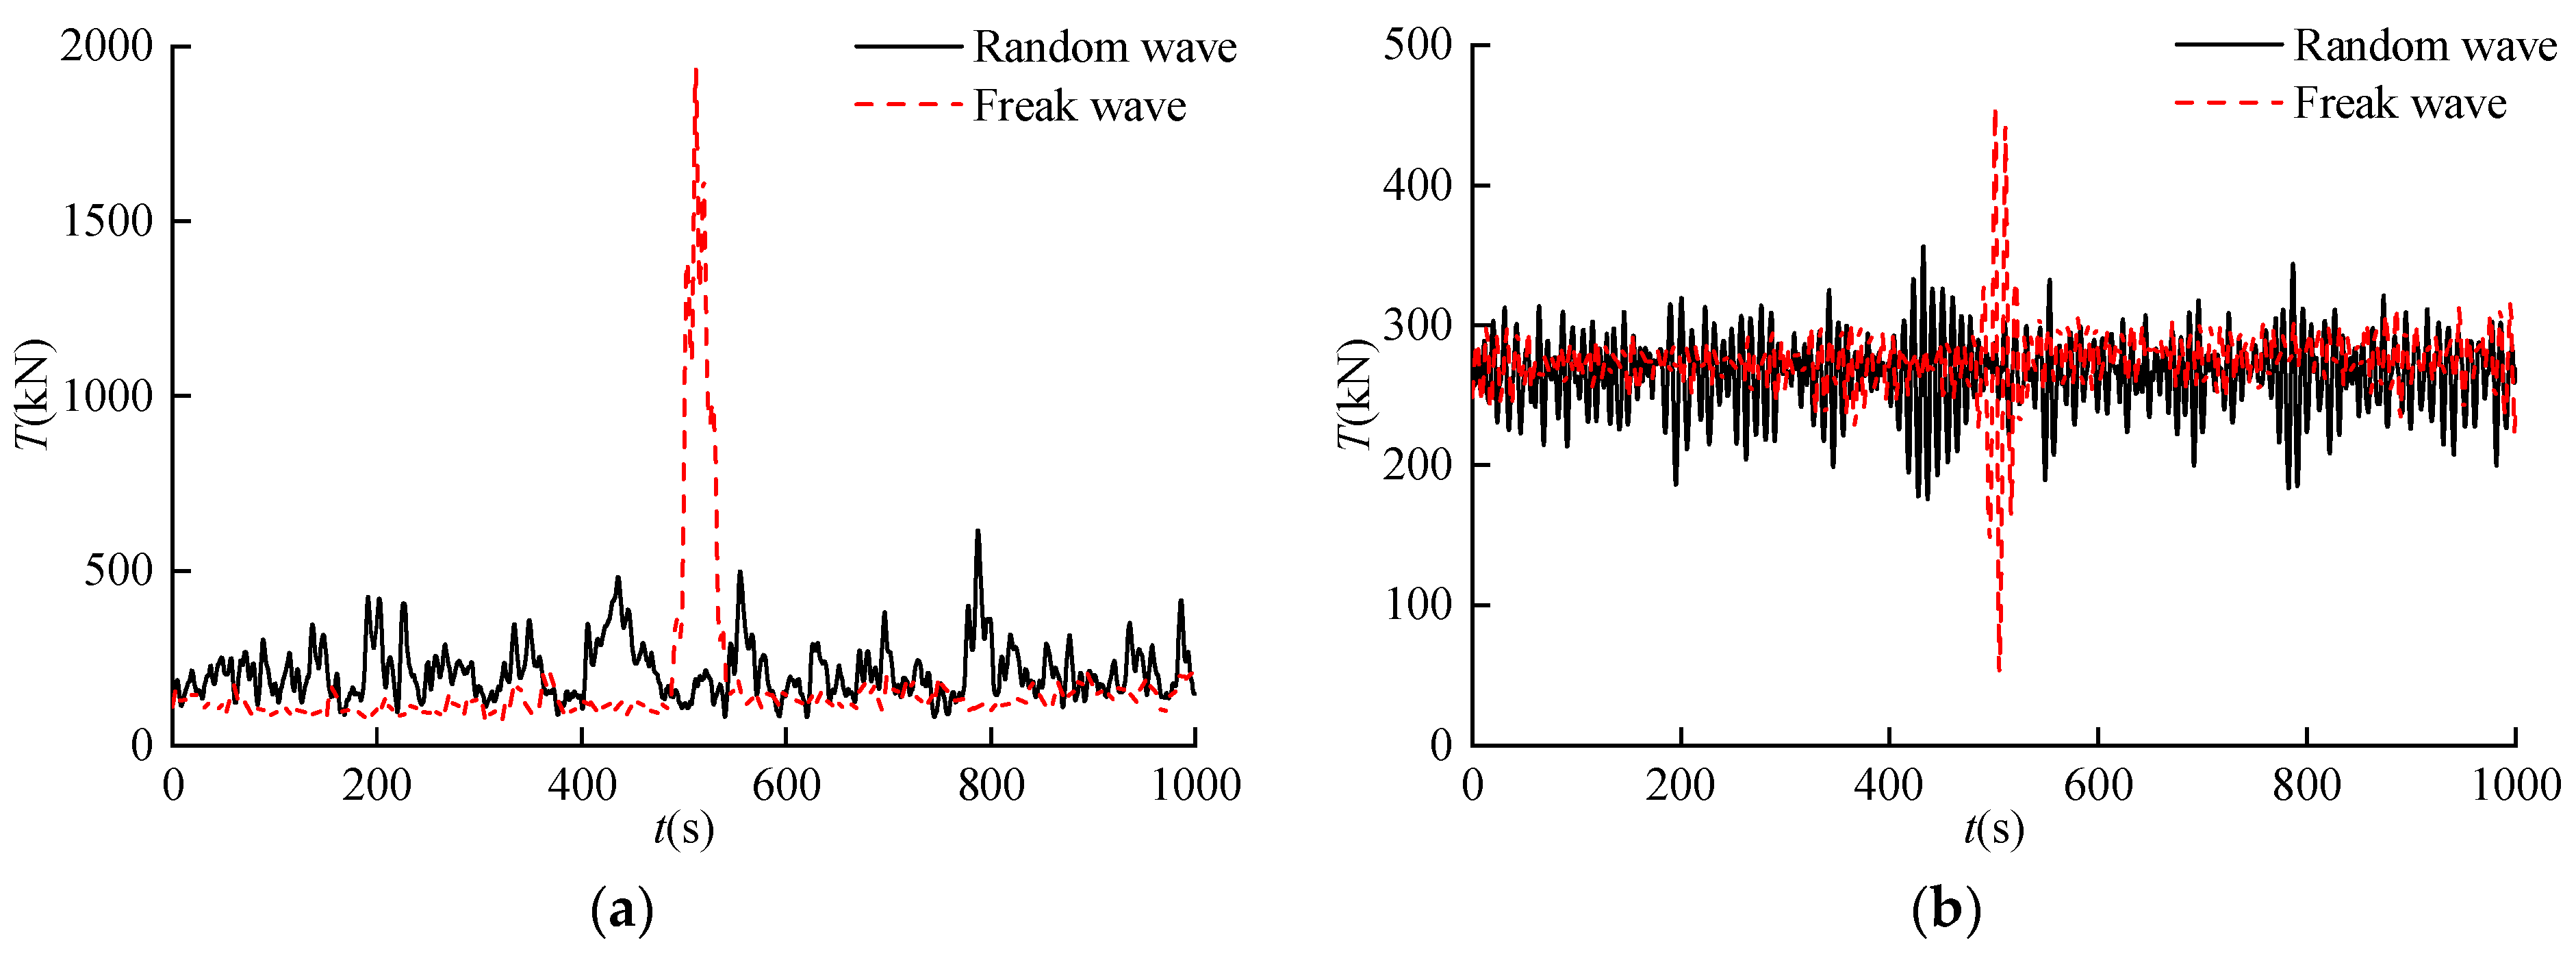
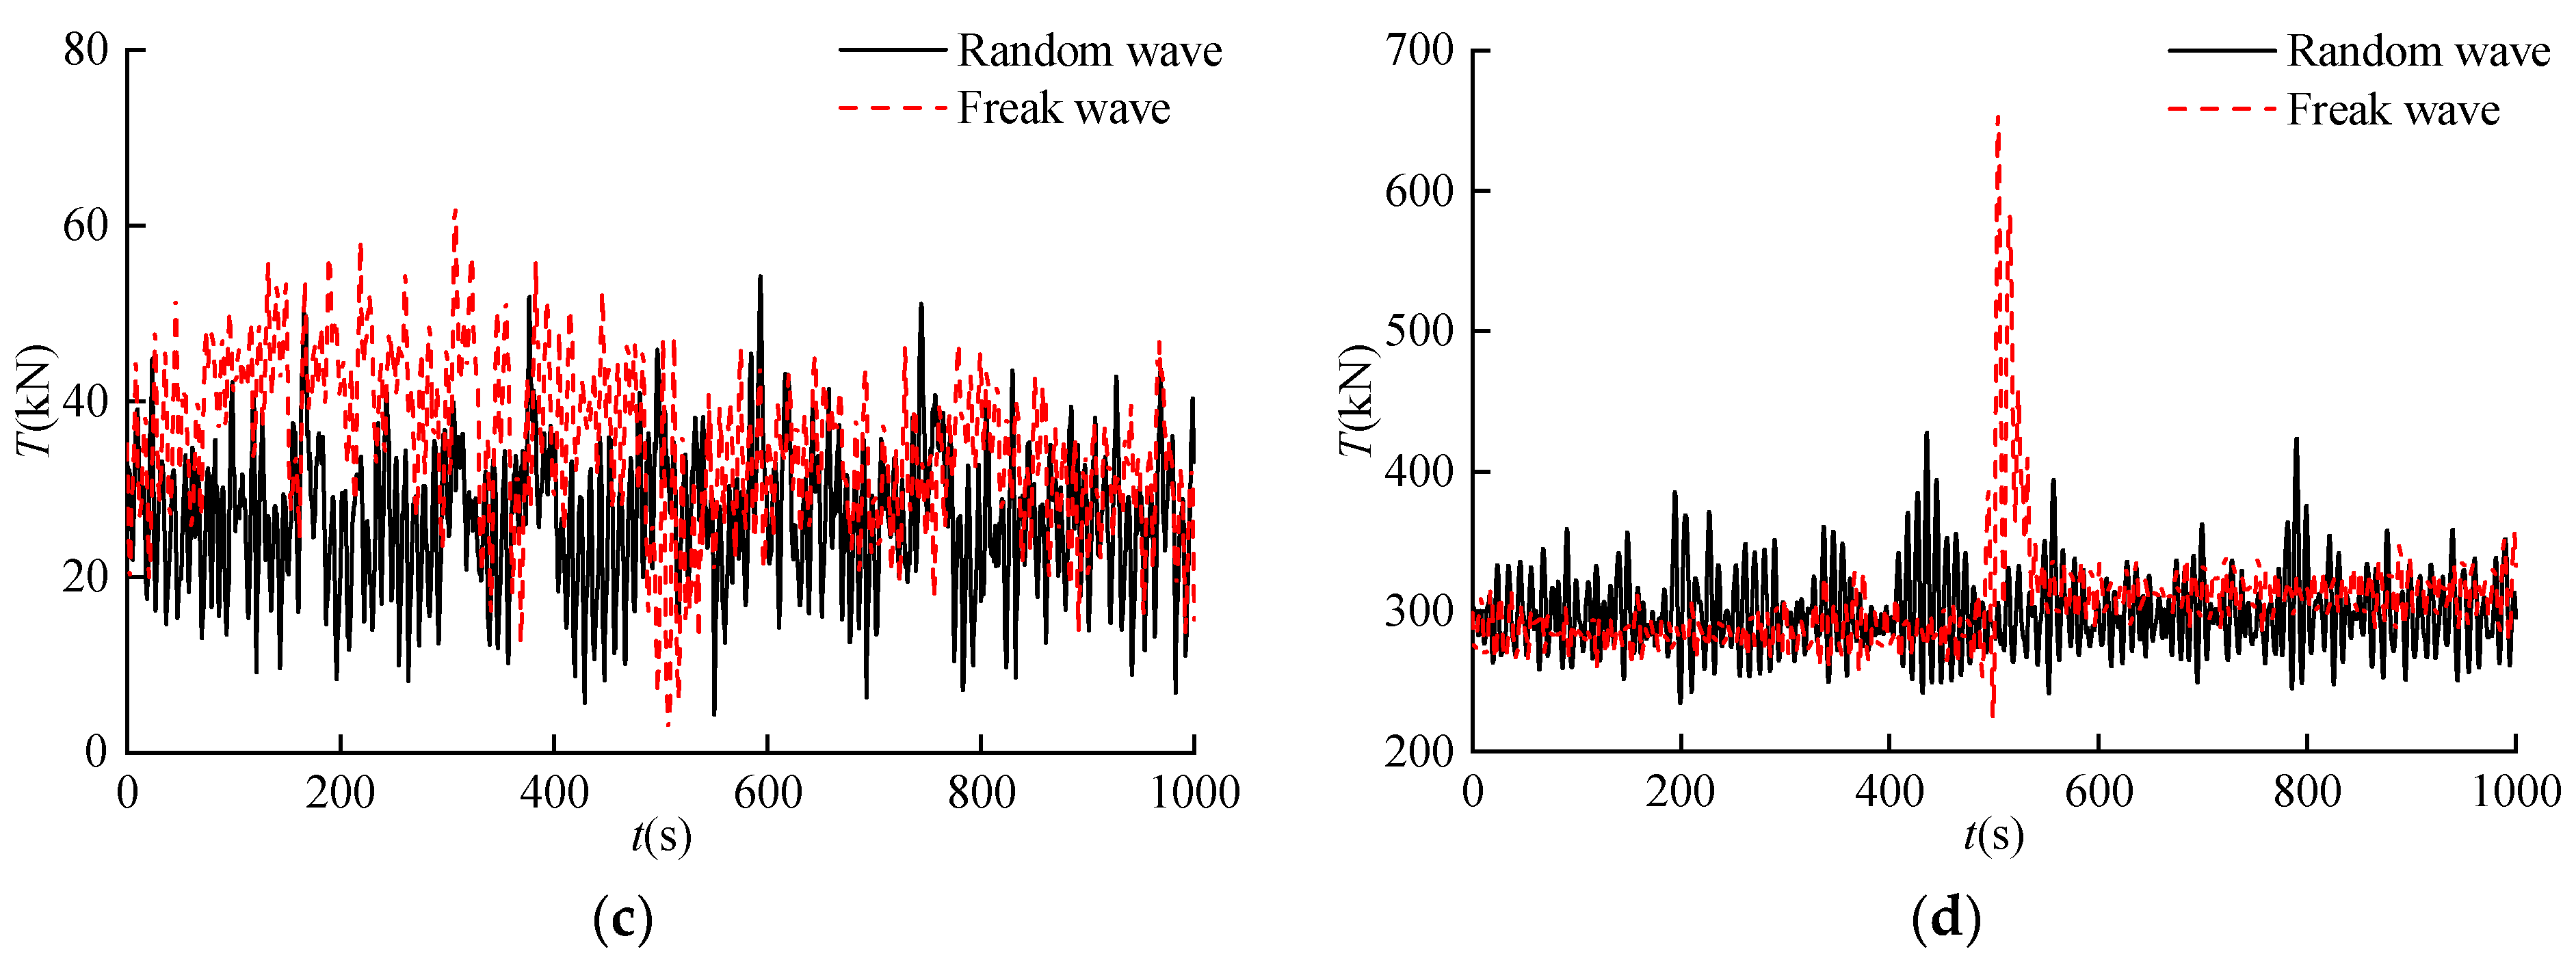
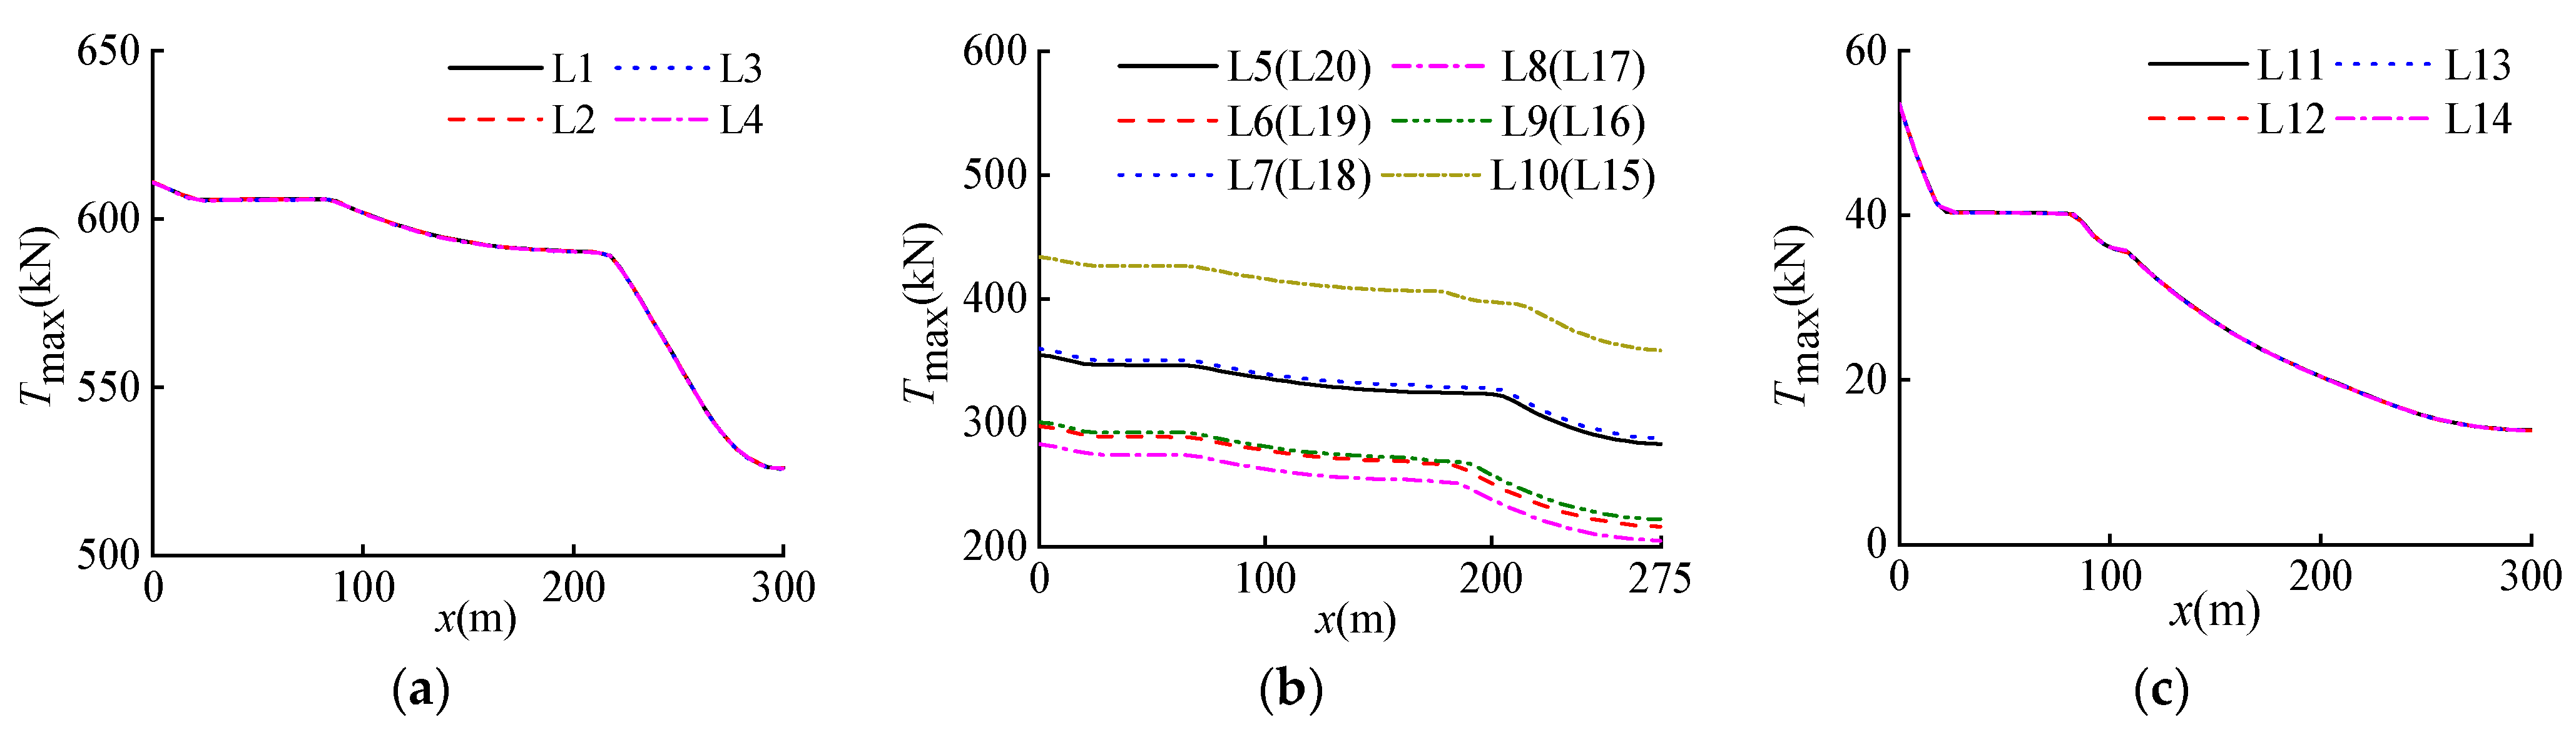
The axial tension of the mooring lines has a clear variation due to the influence of freak waves. The maximum or minimum value of the tension based on the facing direction of the mooring lines is reached near the wave focusing time. Among the twenty mooring lines, the axial tensions are the largest for the mooring lines L1~L4 and the smallest for the mooring lines L11~L14. The maximum tensions of the mooring lines L1~L4 under the freak wave increase by 220.42% compared to the corresponding value under the random wave. The difference in the maximum top tensions of the mooring lines L11~L14 is only 12.90% for the two waves.

Author Contributions

Conceptualization, P.X., Q.S. and W.L.; methodology, P.X., Z.Z. and S.L.; software, P.X., Z.Z. and S.L.; validation, P.X., Z.Z. and S.L.; formal analysis, P.X., Z.Z. and S.L.; investigation, P.X., Z.Z. and S.L.; resources, P.X., Q.S. and W.L.; data curation, P.X., Z.Z. and S.L.; writing—original draft preparation, P.X., Q.S. and W.L.; visualization, P.X., Q.S. and W.L.; supervision, P.X.; project administration, P.X., Q.S. and W.L.; funding acquisition, P.X. All authors have read and agreed to the published version of the manuscript.

Funding

This research was financially supported by the National Natural Science Foundation of China (Grant No. 51809048) and the Natural Science Foundation of Fujian Province (Grant No. 2022J01092).

Institutional Review Board Statement

Not applicable.

Informed Consent Statement

Not applicable.

Data Availability Statement

The data presented in this study are available in this article (in tables and figures).

Conflicts of Interest

Author Pu Xu has received research grants from Fujian Youfu Power Engineering Co., Ltd. The remaining authors declare that the research was conducted in the absence of any commercial or financial relationships that could be construed as a potential conflict of interest.

References

  1. Trapani, K.; Santafé, R.M. A review of floating photovoltaic installations: 2007–2013. Prog. Photovolt. Res. Appl. 2015, 23, 524–532. [Google Scholar] [CrossRef]
  2. Ranjbaran, P.; Yousefi, H.; Gharehpetian, G.B.; Astaraei, F.R. A review on floating photovoltaic (FPV) power generation units. Renew. Sustain. Energy Rev. 2019, 110, 332–347. [Google Scholar] [CrossRef]
  3. Tina, G.M.; Scavo, F.B. Energy performance analysis of tracking floating photovoltaic systems. Heliyon 2022, 8, e10088. [Google Scholar] [CrossRef] [PubMed]
  4. Kjeldsen, S.P. Measurements of freak waves in Norway and related ship accidents. In Royal Institution of Naval Architects International Conference-Design and Operation for Abnormal Conditions III; Royal Institution of Naval Architects: London, UK, 2005. [Google Scholar]
  5. Nikolkina, I.; Didenkulova, I. Rogue waves in 2006–2010. Nat. Hazards Earth Syst. Sci. 2011, 11, 2913–2924. [Google Scholar] [CrossRef]
  6. Fochesato, C.; Grilli, S.; Dias, F. Numerical modeling of extreme rogue waves generated by directional energy focusing. Wave Motion 2007, 44, 395–416. [Google Scholar] [CrossRef]
  7. Liu, Z.Q.; Zhang, N.C.; Yu, Y.X. An efficient focusing model for generation of freak waves. Acta Oceanol. Sin. 2011, 30, 19–26. [Google Scholar] [CrossRef]
  8. Cui, C.; Pan, W.B. Experimental study on the wavelengths of two-dimensional and three-dimensional freak waves. China Ocean Eng. 2023, 37, 154–164. [Google Scholar] [CrossRef]
  9. Zhao, X.Z.; Sun, Z.C.; Liang, S.X. Efficient focusing models for generation of freak waves. China Ocean Eng. 2009, 23, 429–440. [Google Scholar]
  10. Zhao, X.Z.; Ye, Z.T.; Fu, Y.N.; Cao, F.F. A CIP-based numerical simulation of freak wave impact on a floating body. Ocean Eng. 2014, 87, 50–63. [Google Scholar] [CrossRef]
  11. Hu, Z.Q.; Tang, W.Y.; Xue, H.X. A probability-based superposition model of freak wave simulation. Appl. Ocean Res. 2014, 47, 284–290. [Google Scholar] [CrossRef]
  12. Tang, Y.G.; Li, Y.; Wang, B.; Liu, S.X.; Zhu, L.H. Dynamic analysis of turret-moored FPSO system in freak wave. China Ocean Eng. 2016, 30, 521–534. [Google Scholar] [CrossRef]
  13. Qin, H.; Tang, W.; Xue, H.; Hu, Z. Numerical study of nonlinear freak wave impact underneath a fixed horizontal deck in 2-D space. Appl. Ocean Res. 2017, 64, 155–168. [Google Scholar] [CrossRef]
  14. Li, X.; Deng, Y.F.; Li, L.; Tian, X.L.; Li, J. Motion and dynamic responses of a semisubmersible in freak waves. China Ocean Eng. 2017, 31, 754–763. [Google Scholar] [CrossRef]
  15. Xu, P.; Du, Z.X.; Gong, S.F. Numerical investigation into freak wave effects on deepwater pipeline installation. J. Mar. Sci. Eng. 2020, 8, 119. [Google Scholar] [CrossRef]
  16. Xu, P.; Gong, S.F. Numerical investigation of deepwater S-lay pipeline under freak waves. J. Offshore Mech. Arct. Eng. 2020, 142, 041803. [Google Scholar] [CrossRef]
  17. Pan, W.; Liang, C.; Zhang, N.; Huang, G. Experimental study on hydrodynamic characteristics of a moored square cylinder under freak wave (II: Frequency-domain study). Ocean Eng. 2021, 219, 108452. [Google Scholar] [CrossRef]
  18. Chang, S.; Huang, W.; Liu, F.; Song, H. Influence of second-order wave force and focusing position on dynamic responses of tension leg platform under a freak wave. Ocean Eng. 2021, 242, 110126. [Google Scholar] [CrossRef]
  19. Zeng, F.; Zhang, N.; Huang, G.; Gu, Q.; He, M. Experimental study on dynamic response of a floating offshore wind turbine under various freak wave profiles. Mar. Struct. 2023, 88, 103362. [Google Scholar] [CrossRef]
  20. Huo, F.; Zhao, Y.; Zhang, J.; Zhang, M.; Yuan, Z.M. Study on wave slamming characteristics of a typical floating wind turbine under freak waves. Ocean Eng. 2023, 269, 113464. [Google Scholar] [CrossRef]
  21. Cazzaniga, R.; Cicu, M.; Rosa-Clot, M.; Rosa-Clot, P.; Tina, G.M.; Ventura, C. Compressed air energy storage integrated with floating photovoltaic plant. J. Energy Storage 2017, 13, 48–57. [Google Scholar] [CrossRef]
  22. Luo, W.; Isukapalli, S.N.; Vinayagam, L.; Ting, S.A.; Kumar, A. Performance loss rates of floating photovoltaic installations in the tropics. Sol. Energy 2021, 219, 58–64. [Google Scholar] [CrossRef]
  23. Choi, S.M.; Lee, G.R.; Park, C.D.; Cho, S.H.; Lim, B.J. Wind load on the solar panel array of a floating photovoltaic system under extreme hurricane conditions. Sustain. Energy Technol. Assess. 2021, 48, 101616. [Google Scholar] [CrossRef]
  24. Kaymak, M.K.; Şahin, A.D. Problems encountered with floating photovoltaic systems under real conditions: A new FPV concept and novel solutions. Sustain. Energy Technol. Assess. 2021, 47, 101504. [Google Scholar] [CrossRef]
  25. Xu, P.; Wellens, P.R. Fully nonlinear hydroelastic modeling and analytic solution of large-scale floating photovoltaics in waves. J. Fluids Struct. 2022, 109, 103446. [Google Scholar] [CrossRef]
  26. Jin, Z.; Liu, Y.; Zhu, M.; Fang, H.; Li, A. A novel analytical model coupling hydrodynamic-structural-material scales for very large floating photovoltaic support structures. Ocean Eng. 2023, 275, 114113. [Google Scholar] [CrossRef]
  27. Zhang, L.; Shi, W.; Karimirad, M.; Michailides, C.; Jiang, Z. Second-order hydrodynamic effects on the response of three semisubmersible floating offshore wind turbines. Ocean Eng. 2020, 207, 107371. [Google Scholar] [CrossRef]
  28. Hasselmann, K.; Barnett, T.P.; Bouws, E.; Carlson, H.; Cartwright, D.E.; Enke, K.; Ewing, J.A.; Gienapp, H.; Hasselmann, D.E.; Kruseman, P.; et al. Measurements of Wind-Wave Growth and Swell Decay During the Joint North Sea Wave Project (JONSWAP); Deutches Hydrographisches Institute: Hamburg, Germany, 1973. [Google Scholar]
  29. ANSYS. AQWA User Manual, Version 2021 R1; ANSYS: Canonsburg, PA, USA, 2021. [Google Scholar]
  30. Orcina. OrcaFlex User Manual, Version 10.2; Orcina: Cumbria, UK, 2017. [Google Scholar]
  31. Tcheou, G. Non-Linear Dynamics of Mooring Lines. Ph.D. Thesis, Massachusetts Institute of Technology: Cambridge, MA, USA, 1997. [Google Scholar]
Figure 1. Floating PV platform and mooring structures.
Jmse 12 00096 g001
Figure 2. Mooring line discrete model.
Jmse 12 00096 g002
Figure 3. Module arrangement and steel frame section of the floating PV platform. (a) PV module arrangement; (b) Steel frame section.
Jmse 12 00096 g003
Figure 4. Mooring line arrangement of floating PV platform.
Jmse 12 00096 g004
Figure 5. JONSWAP spectrum.
Jmse 12 00096 g005
Figure 6. Time history of random and freak waves.
Jmse 12 00096 g006
Figure 7. Current velocity distribution.
Jmse 12 00096 g007
Figure 8. PV platform model in AQWA.
Jmse 12 00096 g008
Figure 9. Global coupled model in OrcaFlex.
Jmse 12 00096 g009
Figure 10. Comparison of static calculation results of the mooring line. (a) Configuration; (b) Tension.
Jmse 12 00096 g010
Figure 11. Comparison of surge motion time history responses of the floating PV platform. (a) 0° direction; (b) 45° direction.
Jmse 12 00096 g011
Figure 12. Comparison of tension time history responses of mooring line L1. (a) 0° direction; (b) 45° direction.
Jmse 12 00096 g012
Figure 13. Floating PV platform motion response under the random wave and freak wave. (a) Surge; (b) Heave; (c) Pitch; (d) Amplitudes.
Jmse 12 00096 g013aJmse 12 00096 g013b
Figure 14. Mooring line configuration under random waves. (a) L1~L4; (b) L5~L10 (L15~L20); (c) L11~L14.
Jmse 12 00096 g014
Figure 15. Mooring line configuration under freak waves. (a) L1~L4; (b) L5~L10 (L15~L20); (c) L11~L14.
Jmse 12 00096 g015
Figure 16. Lying lengths of twenty mooring lines under the random wave and freak wave.
Jmse 12 00096 g016
Figure 17. Time history responses of the mooring line top tension under the random wave and freak wave. (a) L1; (b) L5; (c) L11; (d) L15.
Jmse 12 00096 g017aJmse 12 00096 g017b
Figure 18. Maximum tensions of the mooring line along the length under a random wave. (a) L1~L4; (b) L5~L10 (L15~L20); (c) L11~L14.
Jmse 12 00096 g018
Figure 19. Maximum tensions of the mooring line in along the length under a freak wave. (a) L1~L4; (b) L5~L10 (L15~L20); (c) L11~L14.
Jmse 12 00096 g019
Figure 20. Comparison of maximum tension at the top of mooring lines.
Jmse 12 00096 g020
Table 1. Layout parameters of mooring lines.
Mooring LineMooring Radius/mDesign Length of Each SectionMooring Line Length/m
L1/L2/L3/L4/L11/L12/L13/L14290chain 20 m (top)-nylon 65 m-chain 215 m (bottom)300
L5/L7/L8/L10/L15/L17/L18/L20270chain 20 m (top)-nylon 45 m-chain 210 m (bottom)275
L6/L9/L16/L19269chain 20 m (top)-nylon 45 m-chain 210 m (bottom)275
Table 2. Material property parameters of mooring lines.
Mooring Line TypeNominal Diameter/mmWeight in Water/kg·m−1Axial Stiffness/MNBreaking Strength/MN
R380110.675115.37
Nylon2002.644.726.56(Dry)
5.57(Wet)
Table 3. JONSWAP spectral parameters.
Hs (m)Tp (s)Tz (s)fm (Hz)γασ1σ2
4.010.07.770.13.30.0050.070.09
Disclaimer/Publisher’s Note: The statements, opinions and data contained in all publications are solely those of the individual author(s) and contributor(s) and not of MDPI and/or the editor(s). MDPI and/or the editor(s) disclaim responsibility for any injury to people or property resulting from any ideas, methods, instructions or products referred to in the content.

