Article

Global Sensitivity Analysis of the Fundamental Frequency of Jacket-Supported Offshore Wind Turbines Using Artificial Neural Networks

by
Román Quevedo-Reina
,
Guillermo M. Álamo
and
Juan J. Aznárez
*
Instituto Universitario de Sistemas Inteligentes y Aplicaciones Numéricas en Ingeniería (SIANI), Universidad de Las Palmas de Gran Canaria, Edificio Central del Parque Científico y Tecnológico, Campus Universitario de Tafira, 35017 Las Palmas de Gran Canaria, Spain
*
Author to whom correspondence should be addressed.
J. Mar. Sci. Eng. 2024, 12(11), 2011; https://doi.org/10.3390/jmse12112011
Submission received: 8 October 2024 / Revised: 28 October 2024 / Accepted: 6 November 2024 / Published: 8 November 2024
(This article belongs to the Special Issue Advances in Ships and Marine Structures)

Abstract

:
Determining the fundamental frequency of Offshore Wind Turbines (OWTs) is crucial to ensure the reliability and longevity of the structure. This study presents a global sensitivity analysis of the fundamental frequency of OWTs on jacket foundations. Monte Carlo sampling was employed to generate a diverse set of wind turbines, emplacements, and jacket designs, ensuring that the generated samples are realistic and yield relevant conclusions. The fundamental frequency and its partial derivatives were obtained via a previously developed ANN model. The relative sensitivities were computed to facilitate the comparison of their influence. The results demonstrate that wind turbine properties are the most relevant variables affecting the fundamental frequency, with a decrement in frequency caused by tower height and rotor-nacelle assembly mass, as well as an increment due to the section dimensions of the tower, particularly at its base. Soil properties have a significant effect on foundation stiffness for soft and light soils but can be neglected for hard and heavy soils. The diameter and thickness of the braces also show different relevance depending on their dimensions, producing rigid links between legs for greater sections. This study provides a measure of the variables influencing the fundamental frequency, facilitating a deeper comprehension of this phenomenon.

1. Introduction

The expansion of offshore wind farms as a key contributor to renewable energy has been a significant trend over the past three decades [1]. This growth in technology has led to a greater emphasis on exploring locations further from the coast and with deeper waters [2]. According to a recent report by the Offshore Wind Market, which analyzed 322 global operating offshore wind energy projects up to 2023 [3], there has been an increase in both the distance from shore and water depth of installed global projects over time. This trend has had a notable effect on the type of substructures used to support offshore wind turbines (OWTs), where monopile foundations have been the most common typology used. A detailed examination of existing offshore wind energy projects and a comparison with data until 2022 provided by the Wind Market Report [4] reveal that the proportion of monopiles in the installed capacity has decreased from 60.2% in 2022 to 55.6% in 2023. Conversely, jacket substructures have experienced an increase from 10.4% in 2022 to 13.4% in 2023 over the installed capacity, showing a growing interest of the industry in this type of substructure.
To ensure the reliability and longevity of OWTs, it is crucial to determine their natural frequency during the design process. This allows designers to avoid resonance phenomena, which could lead to structural collapse or deterioration due to fatigue over time. Consequently, preventing the fundamental frequency of the system from coinciding with the rotor’s speed range and the transition frequency of the blades is essential [5]. This leaves a narrow range for the fundamental frequency of the system, as represented in Figure 1.
Therefore, taking into account the significance of dynamic characterization for this type of structure, the development of comprehensive sensitivity analyses to determine the importance of various parameters on the natural frequency of the system can be very useful and informative in the initial stages of the design process. In this context, Partovi-Mehr et al. [6] conducted an examination of the natural frequencies and damping ratios of an OWT on a jacket structure under diverse operational and environmental conditions. The study employed numerical simulations to investigate the impact of various parameters on the structural response of the turbine. Additionally, experimental data were utilized to complement the findings, thereby providing a more comprehensive understanding of the complex interactions involved.
The importance of structure design capacity in OWTs has been explored by other researchers through sensitivity analysis [7,8,9,10,11,12,13]. This type of analysis enables the identification of critical parameters that significantly influence the structural response of the turbine, ultimately informing the design and optimization process. For example, Li et al. [7] specifically investigated the effects of pile young modulus and soil properties on the internal forces and displacements in a monopile OWT. Velarde et al. [8] performed a sensitivity analysis to examine the correlation between variations in some inputs and fatigue damage in an OWT on a gravity-based foundation. Shittu et al. [9] investigated the effects of environmental and wind turbine variables on the limit states of an OWT on a jacket structure.
To further understand the complex interactions between OWTs and their environment, it is essential to extend the scope of local sensitivity analysis. Teixeira et al. [14] performed a global sensitivity analysis of fatigue damage to environmental characteristics across 30 samples with diverse conditions. The study demonstrated the effectiveness of this approach in identifying key factors influencing fatigue damage, thereby informing the development of more robust design strategies.
The majority of the reviewed studies focus on a single, specific case study or typically analyse a reduced set of variables. The absence of exhaustive and comprehensive sensitivity analyses to ascertain the influence of the model’s constituent parameters on the fundamental frequency of jacket structures underscores the necessity for further investigation in this domain.
The primary objective of this study is to perform a derivative-based global sensitivity analysis with respect to variables impacting the fundamental frequency of an Offshore Wind Turbine (OWT) supported by a jacket structure. In order to derive pertinent and general conclusions, it is essential to analyze a diverse set of samples comprising different OWTs, emplacements, and jacket designs. To facilitate this undertaking, the fundamental frequency and its partial derivatives are computed utilizing previously trained and validated Artificial Neural Networks (ANNs) [15]. This approach enables a comprehensive examination of the variables influencing the fundamental frequency, thereby providing valuable insights into the dynamic behavior of OWTs on jacket structures. The comprehension of this complex phenomenon facilitates the design decision process by supporting the predictable effects of each parameter. Furthermore, when a large number of evaluations is required, as in optimization processes, knowledge of the most relevant variables enables simplification of the structural model to include only these, thereby significantly reducing the computational cost.
This manuscript is organized as follows. The methodology adopted for the sensitivity analysis is presented in Section 2, where the underlying principles and computational framework are thoroughly described. In Section 3, the outcomes of the sensitivity analysis are presented, highlighting the key findings and trends observed in the data. Finally, in Section 4, the principal conclusions drawn from this investigation are summarized.

2. Methodology

A derivative-based global sensitivity analysis is performed to quantify the relationship between the fundamental frequency of an OWT supported on a jacket structure and the most influential variables characterizing the system. This process entails three distinct steps.
Initially, Monte Carlo sampling is employed to generate a diverse set of system configurations consisting of many OWTs, emplacements, and jacket designs (Section 2.1). Subsequently, taking advantage of their rapid evaluation capabilities, the fundamental frequency and partial derivatives are evaluated using previously developed ANNs trained using a synthetic dataset generated by a structural model [15] (Section 2.2). The sensitivity of the OWT’s fundamental frequency to variables defining the system is then measured (Section 2.3). By executing these steps, a comprehensive understanding of the relationship between the fundamental frequency and the system’s constituent variables can be established.

2.1. Monte Carlo Sampling

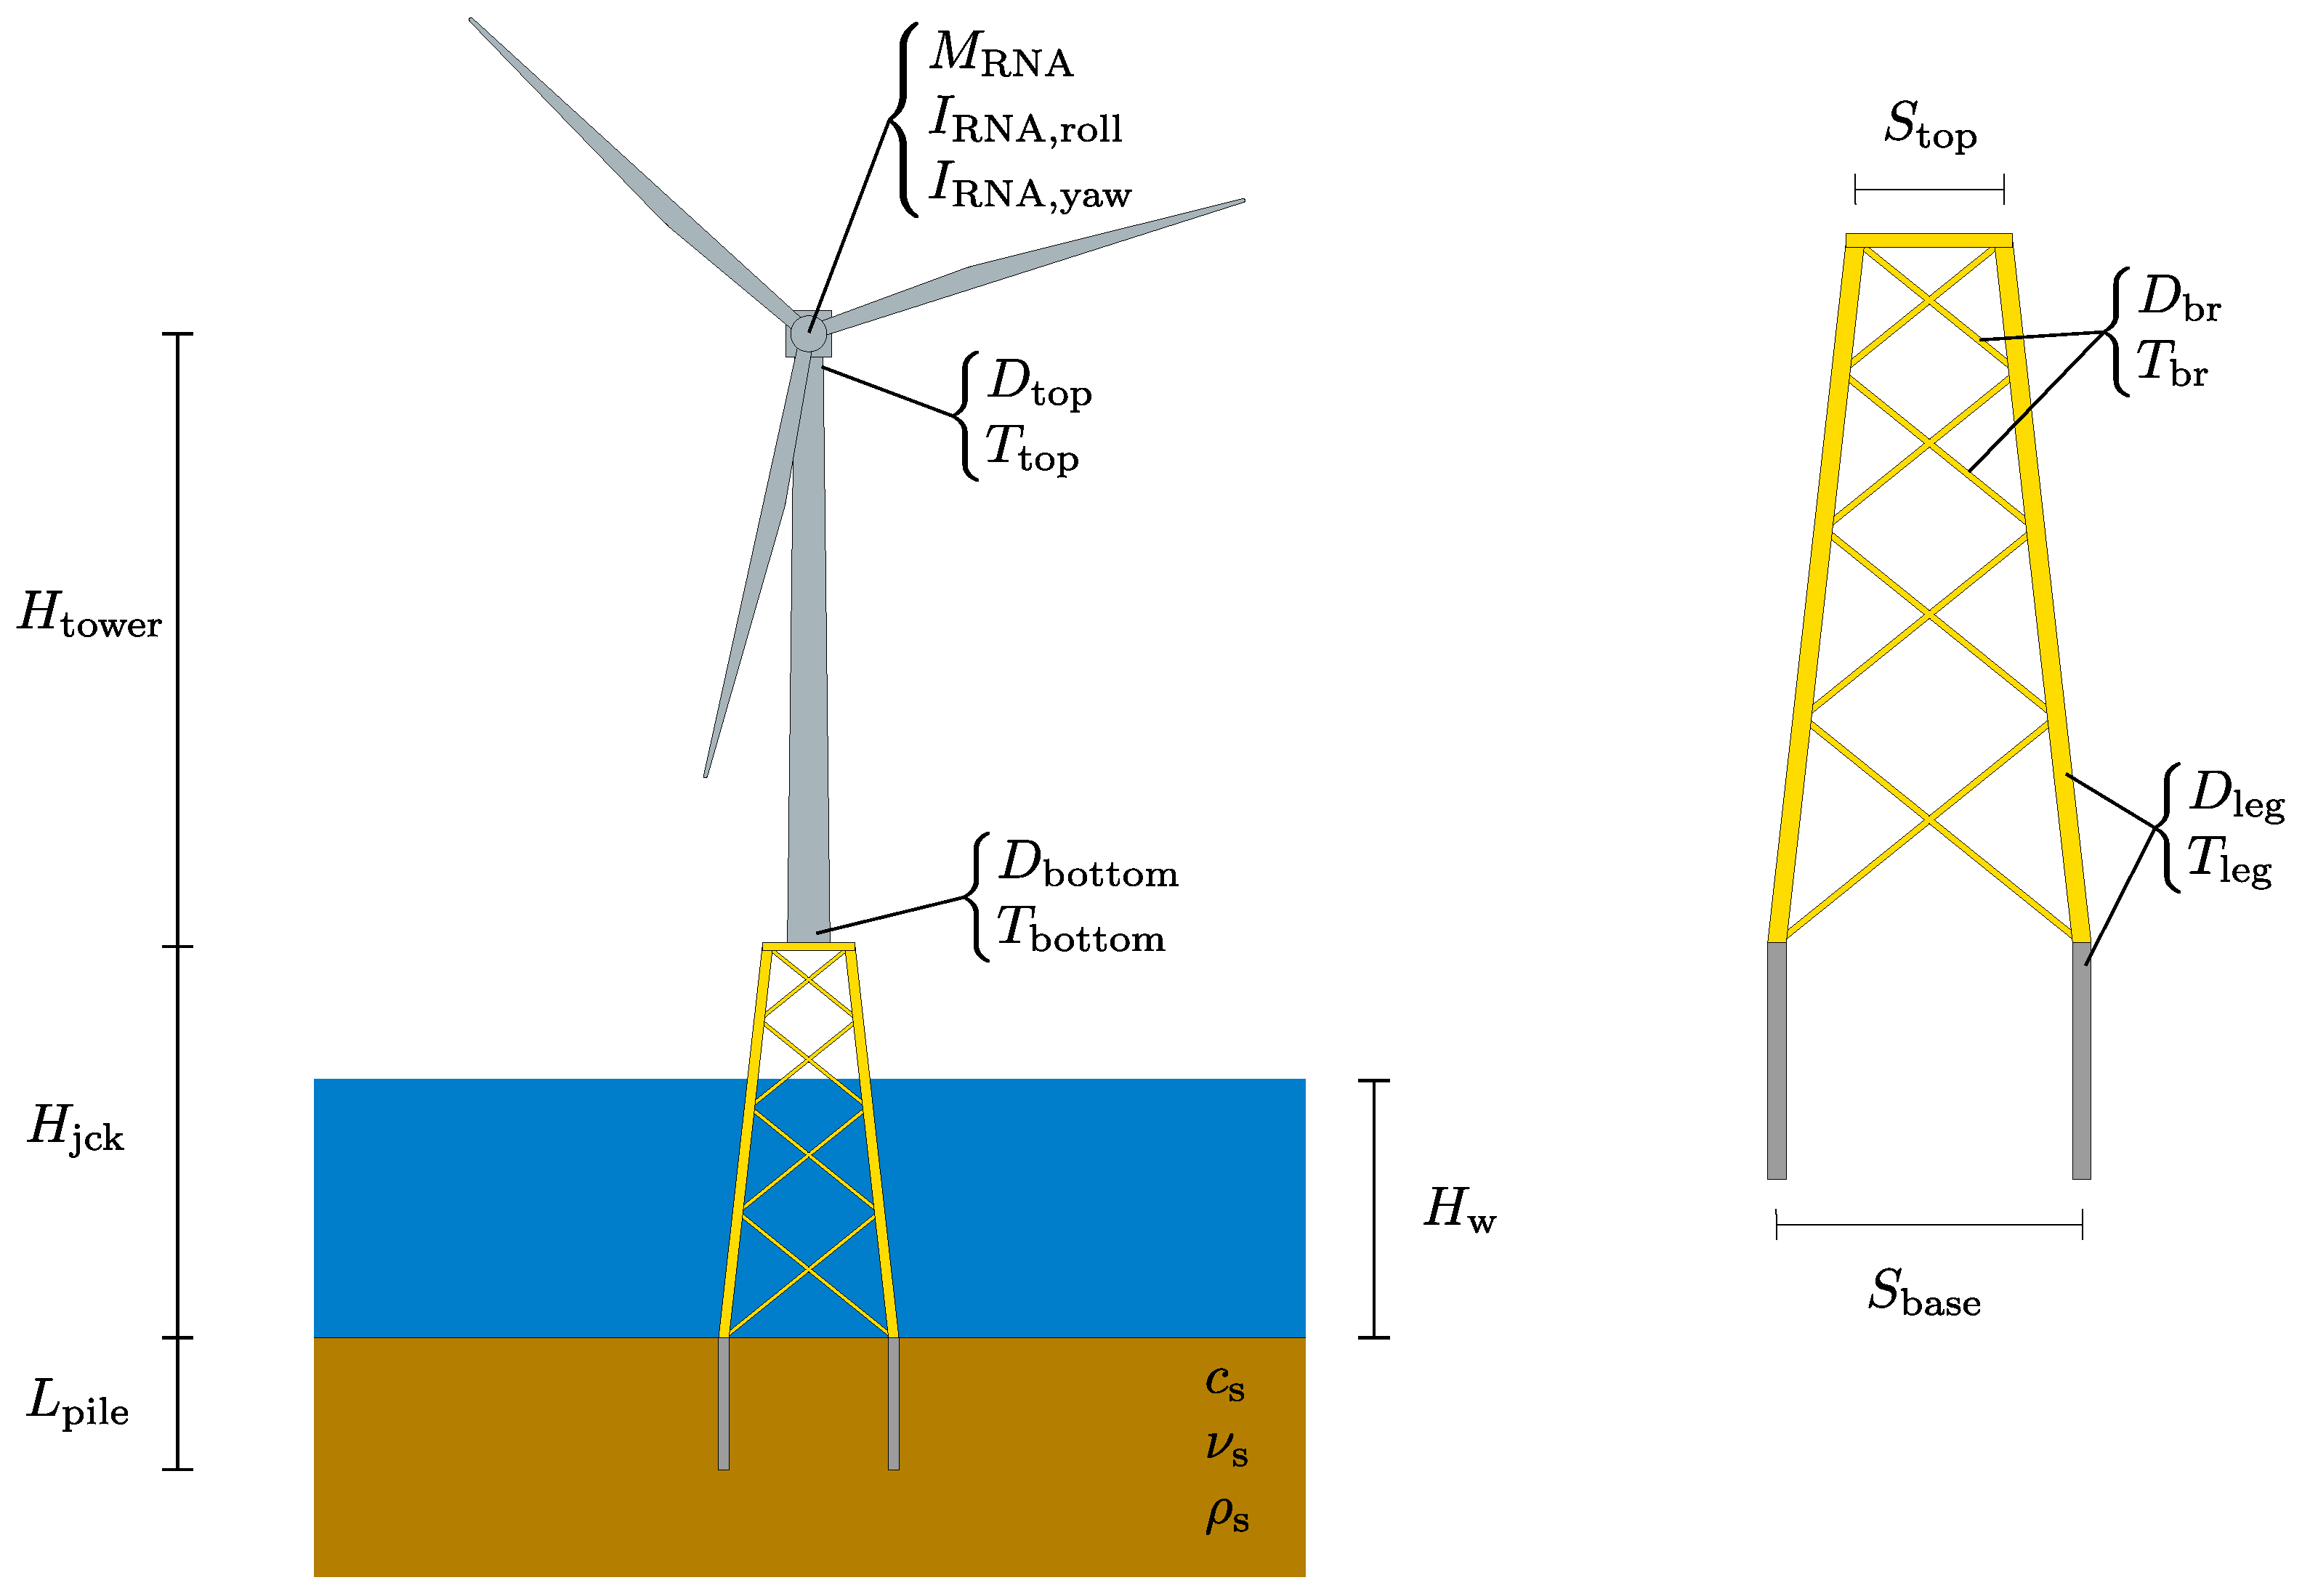
In an endeavor to obtain pertinent and generalized conclusions, this study analyzes a diverse range of samples containing many OWTs, emplacements, and jacket designs via a Monte Carlo sampling methodology. This strategy entails generating several random cases, with the fundamental frequency ( f n ) of the jacket structure being obtained using an ANN model. In order for all the variables included in this sampling process to be contained within the ANN’s inputs, the sampling strategy is identical to that followed during the training of the ANN, as detailed in Quevedo-Reina et al. [15]. The variables characterizing the system (represented in Figure 2) comprise wind turbine, emplacement, and jacket characteristics.
Specifically, the OWT parameters include geometry such as tower height ( H tower ), bottom diameter ( D bottom ), bottom thickness ( T bottom ), top diameter ( D top ), and top thickness ( T top ), as well as inertia properties such as rotor-nacelle assembly mass ( M RNA ), moments of inertia about roll axis ( I RNA,roll ), and yaw/pitch axis ( I RNA,yaw ).
The emplacement parameters comprise soil characteristics, including shear wave propagation velocity ( c s ), Poisson’s ratio ( ν s ), and soil density ( ρ s ), as well as sea properties such as water depth ( H w ).
Regarding the jacket design, the hyperparameters that define the global geometry of the structure include jacket height ( H jck ), number of legs ( n leg ), leg spacing at the bottom ( S base ), leg spacing at the top ( S top ), and number of bracing levels ( n br ). Additionally, the dimensions of the tubular elements are defined by the leg diameter ( D leg ), leg thickness ( T leg ), braces diameter ( D br ), braces thickness ( T br ), and pile length ( L pile ). Notably, it is assumed that all legs and piles have uniform sections along their lengths, and all braces present the same section for all bracing levels.
To increase the relevance of the generated samples, this sampling strategy avoids imposing fixed bounds on most variables. Instead, relationships among different variables are established, and limits are imposed upon them to exclude extremely rare or unviable systems for which sensitivity analysis would not be meaningful. Thus, uniform distributions are employed to randomly generate one of the variables. Then, random values are obtained for cited relationships, and the characteristic variables are subsequently derived from them. For wind turbine variables, these relations and limits are manually set from properties of four examples with capacities of 5, 8, 10, and 15 MW [16,17,18,19]. The environmental properties are established according to common values found in the literature. The jacket variables are determined after analyzing some structures present in the bibliography [20,21,22] and considering ranges imposed by the DNV International Standard [23].
A dataset consisting of one million different wind turbines, emplacements, and jacket designs was generated via this process. The variables included in the study and their corresponding minimum and maximum values after sampling (not uniformly distributed) are presented in Table 1.

2.2. ANN-Based Surrogate Model

In this study, a previously developed ANN model [15] is employed to compute the fundamental frequency of OWTs, thereby leveraging the computational efficiency inherent in such models.
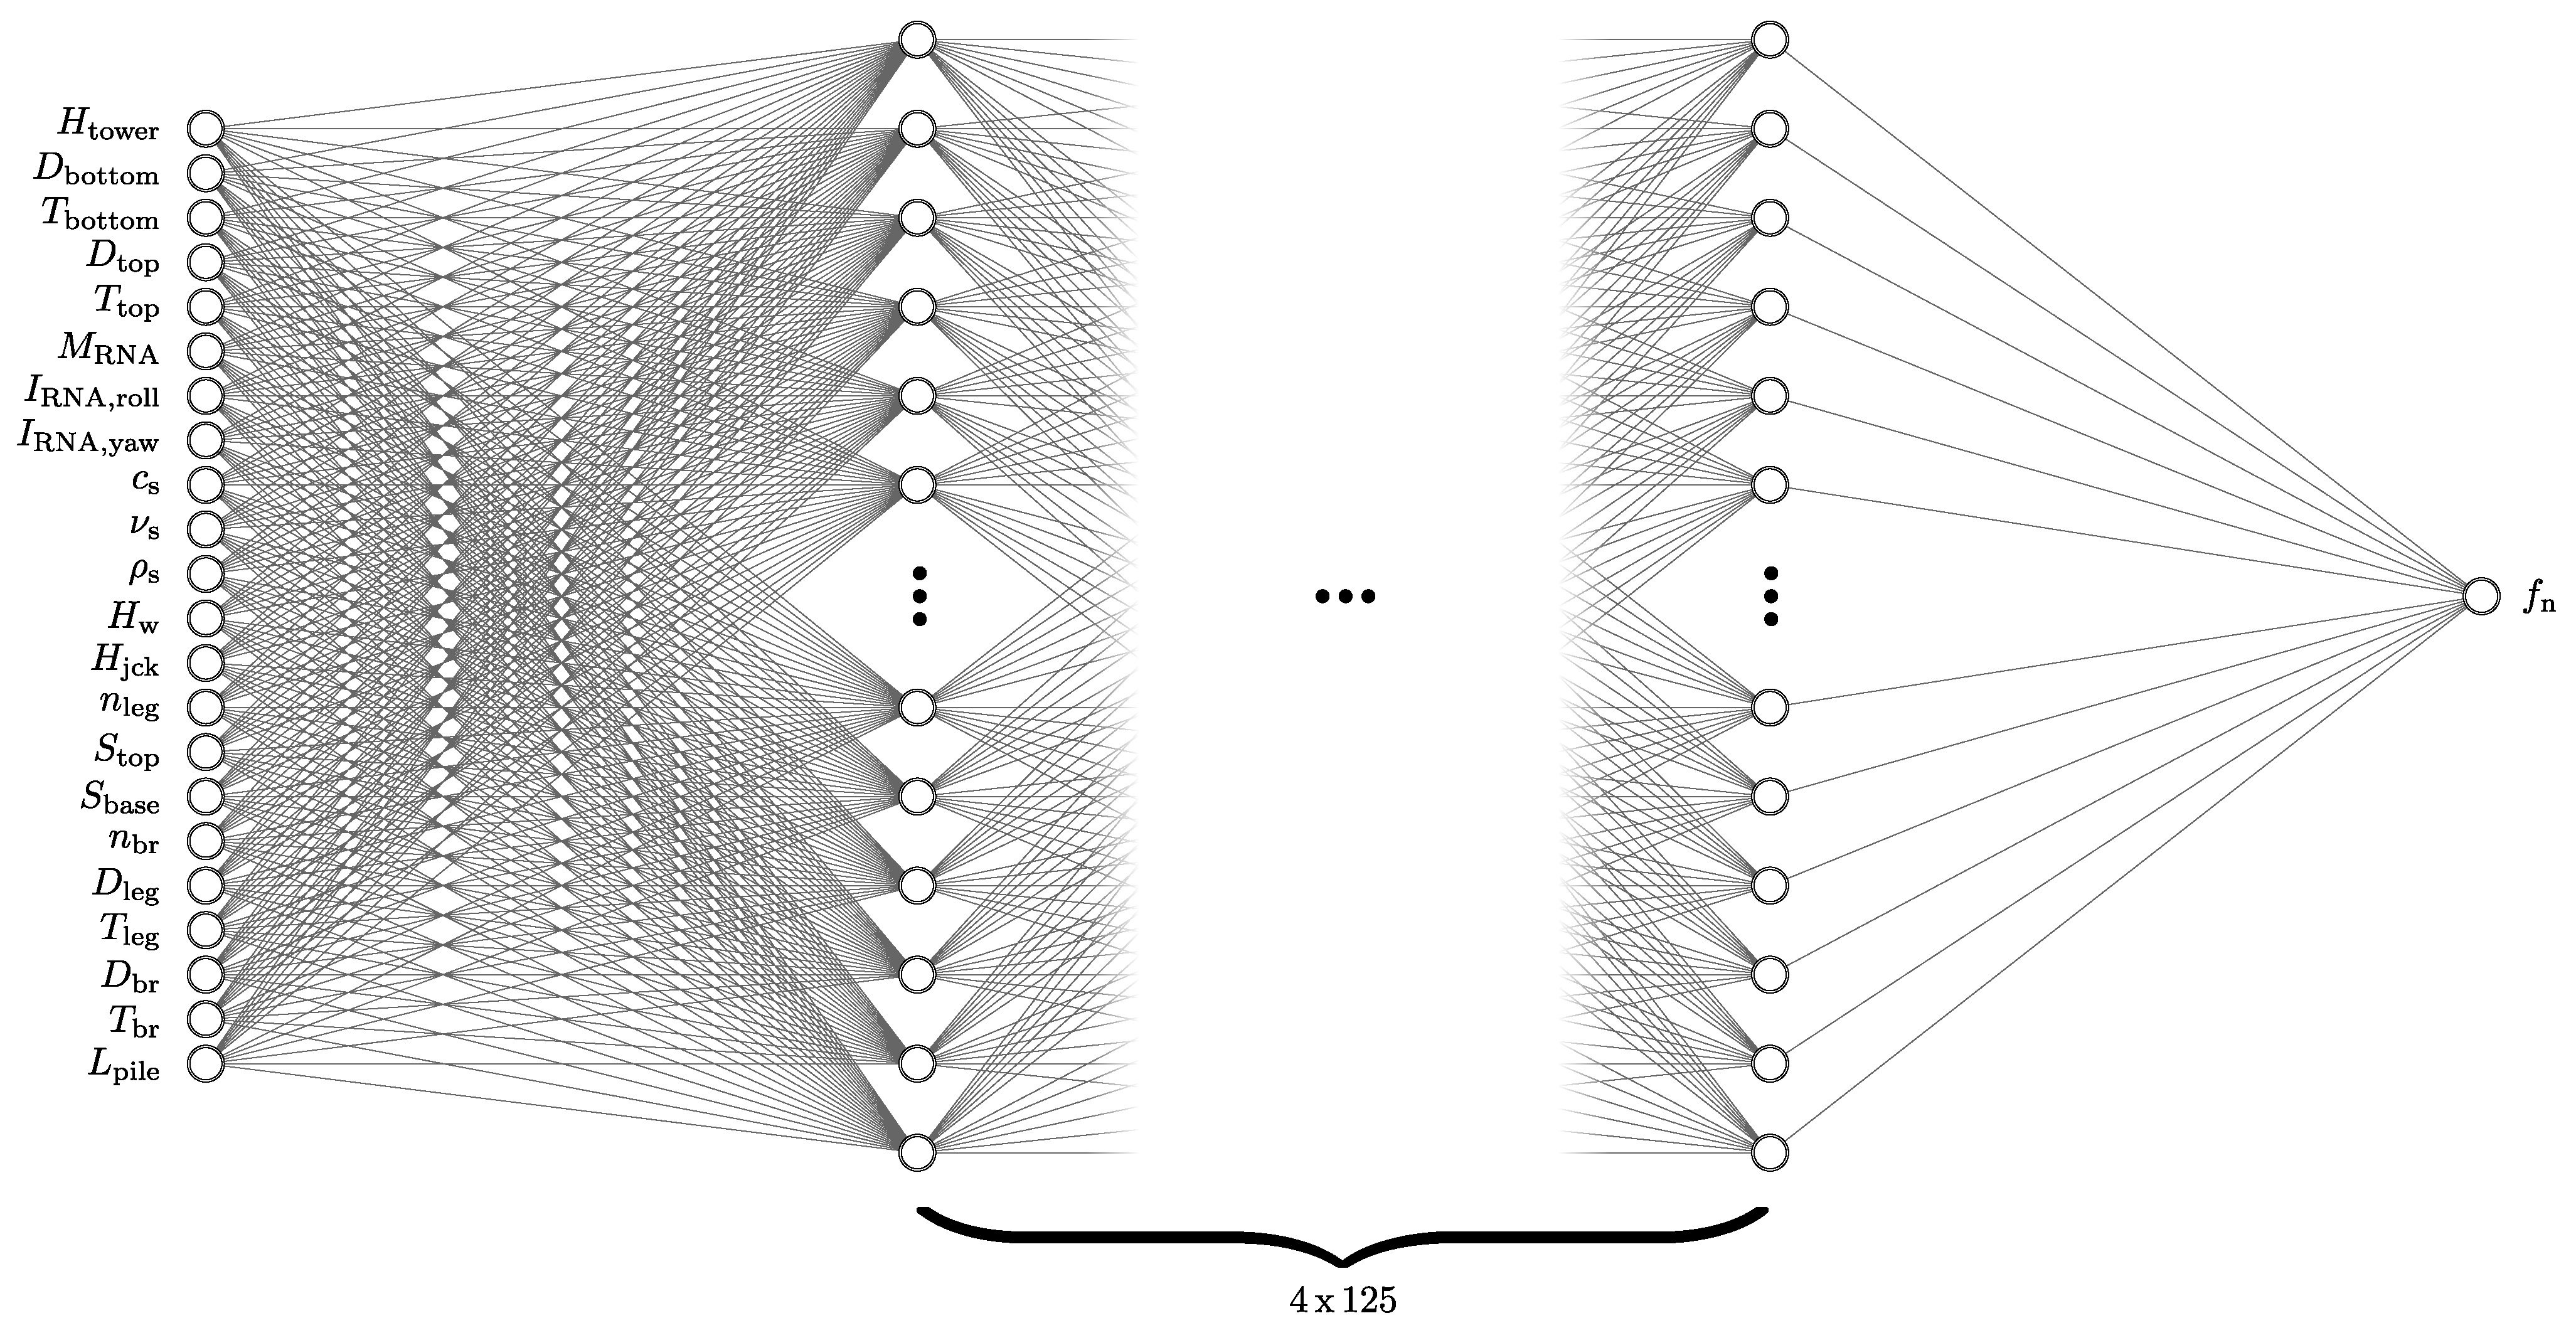
The model consists of an ensemble of 20 regression ANNs, where the output is calculated as the mean of individual networks predictions. Each ANN features 22 neurons in the input layer, corresponding to the variables described in Section 2.1, while the output layer contains a single neuron representing the fundamental frequency of the system. Four hidden layers are included, each comprising 125 neurons and utilizing the Rectified Linear Unit (ReLU) activation function. Figure 3 shows a schematic representation of the architecture of each of the ANNs.
These ANNs were initially trained using an extensive synthetic dataset consisting of 100,000 samples evaluated by a linear finite-element model that incorporates soil–structure interaction effects. This dataset was randomly divided into three groups: a training set (70%) for training the ANN, a validation set (15%) to prevent overfitting by stopping the training process, and a test set (15%) for evaluating the performance of the ANN. The training process was carried out using automatic differentiation algorithm present in MATLAB [24], with the mean squared error of the fundamental frequency as the loss function.
Compared to the direct use of the aforementioned FEM model, the ANN surrogate model enables the efficient computation of the fundamental frequency for all samples in the dataset, as well as the evaluation of partial derivatives with respect to individual input variables by applying the chain rule. It is essential to note that, as with any surrogate model, the validity of the conclusions relies on the capacity of the model to accurately reproduce the underlying physical problem. However, test results demonstrate a high degree of fitting capacity of the ensemble model within most of the search space, showing errors below 6% for 99% of the testing samples and less than 0.6% for 90% of the testing samples [15]. Furthermore, the surrogate model performance was also evaluated using specific application examples [15], wherein the observed smooth behavior in the model’s response enhances the confidence in the evaluated partial derivatives.
Furthermore, despite its unconventional nature, this methodology permits the calculation of partial derivatives with respect to discrete variables, such as the number of legs or bracing levels. This cannot be considered as an intrinsic characteristic of the system but rather a general trend learned from the regression process involved in ANN training.

2.3. Sensitivity Analysis

A derivative-based global sensitivity analysis of the fundamental frequency of OWTs on jacket structures is conducted within this work. The sensitivity is quantified based on the partial derivative, representing the change in the fundamental frequency produced by each variable. This process is approached from two distinct scales: firstly, partial derivatives are computed to ascertain the local sensitivity of each variable within specific samples; secondly, the local sensitivities of a diverse set of samples are analyzed to obtain global conclusions regarding the variables’ influence.
The use of partial derivatives maintains the dimensional character of the sensitivity. This approach may lead to difficulties when comparing the sensitivity of variables with different scale values. For instance, an increment of 1 unit in a variable with a value of 0.1 units is more relevant than the same unitary increment in a variable with a value of 2000 units. To obviate this issue, the present study analyzes the relative sensitivity (see, for example, [25]) instead of the absolute sensitivity. The relative sensitivity ( S r ) is defined as follows:
S r = ln f n ln x i = ln f n x i x i ln x i = 1 f n f n x i x i = f n x i x i f n = S x i f n
where S = f n / x i is the absolute sensitivity, and x i is the variable with respect to which the sensitivity is evaluated.
The relative sensitivity is a measure of the relative change in the output against a relative change in the input. Specifically, an increment of 1% in the independent variable produces an increment of S r % in the dependent variable. Relative sensitivity is a non-dimensional metric that offers several advantages over absolute sensitivity analysis, particularly when dealing with variables with vastly different scale values. By considering relative changes rather than absolute changes, this approach provides a more nuanced understanding of the relationships between input variables and output responses.

3. Results

The methodology outlined in Section 2 is followed, obtaining the relative sensitivities of the fundamental frequency with respect to each input variable for the dataset comprising one million samples. However, owing to the vast search space explored and the substantial number of generated samples, some predictions of the fundamental frequency exhibit anomalously low values. As the fundamental frequency is situated in the denominator of the relative sensitivity, these instances can lead to numerical inconsistencies.
Consequently, all samples exhibiting a fundamental frequency lower than 0.05 Hz are systematically removed from the dataset to preclude potential computational inaccuracies. Only ninety-four samples out of one million samples are found to be affected by this criterion. It is reasonable to infer that these anomalous samples represent extremely soft structures, which fail to satisfy the technical specifications established by international standards and guidelines for such systems. Nevertheless, their removal does not impact the validity of the conclusions drawn from the analysis.

3.1. Global Sensitivity Analysis

The analysis of the global sensitivity of the fundamental frequency of an OWT on a jacket structure involves evaluating the effects of the main characteristics that define it. To achieve this, an aggregate analysis of each sensitivity for all evaluated samples is performed.
Firstly, the limitation of studying partial derivatives is examined using boxplots of sensitivities divided by the characterization variable in Figure 4. The results indicate that the thicknesses of the wind turbine tower, legs, and bracings are the variables with the most significant impact on the fundamental frequency. This phenomenon is attributed to these variables presenting low values, thereby being more susceptible to unitary increments compared to other variables. However, it was noted that expressing these variables in millimeters instead of meters could mitigate this issue. Nevertheless, applying a manual process to all variables would pose two potential problems: inconsistencies among variables due to disparate criteria, and the lack of a universal criterion for specific variables with varying magnitudes.
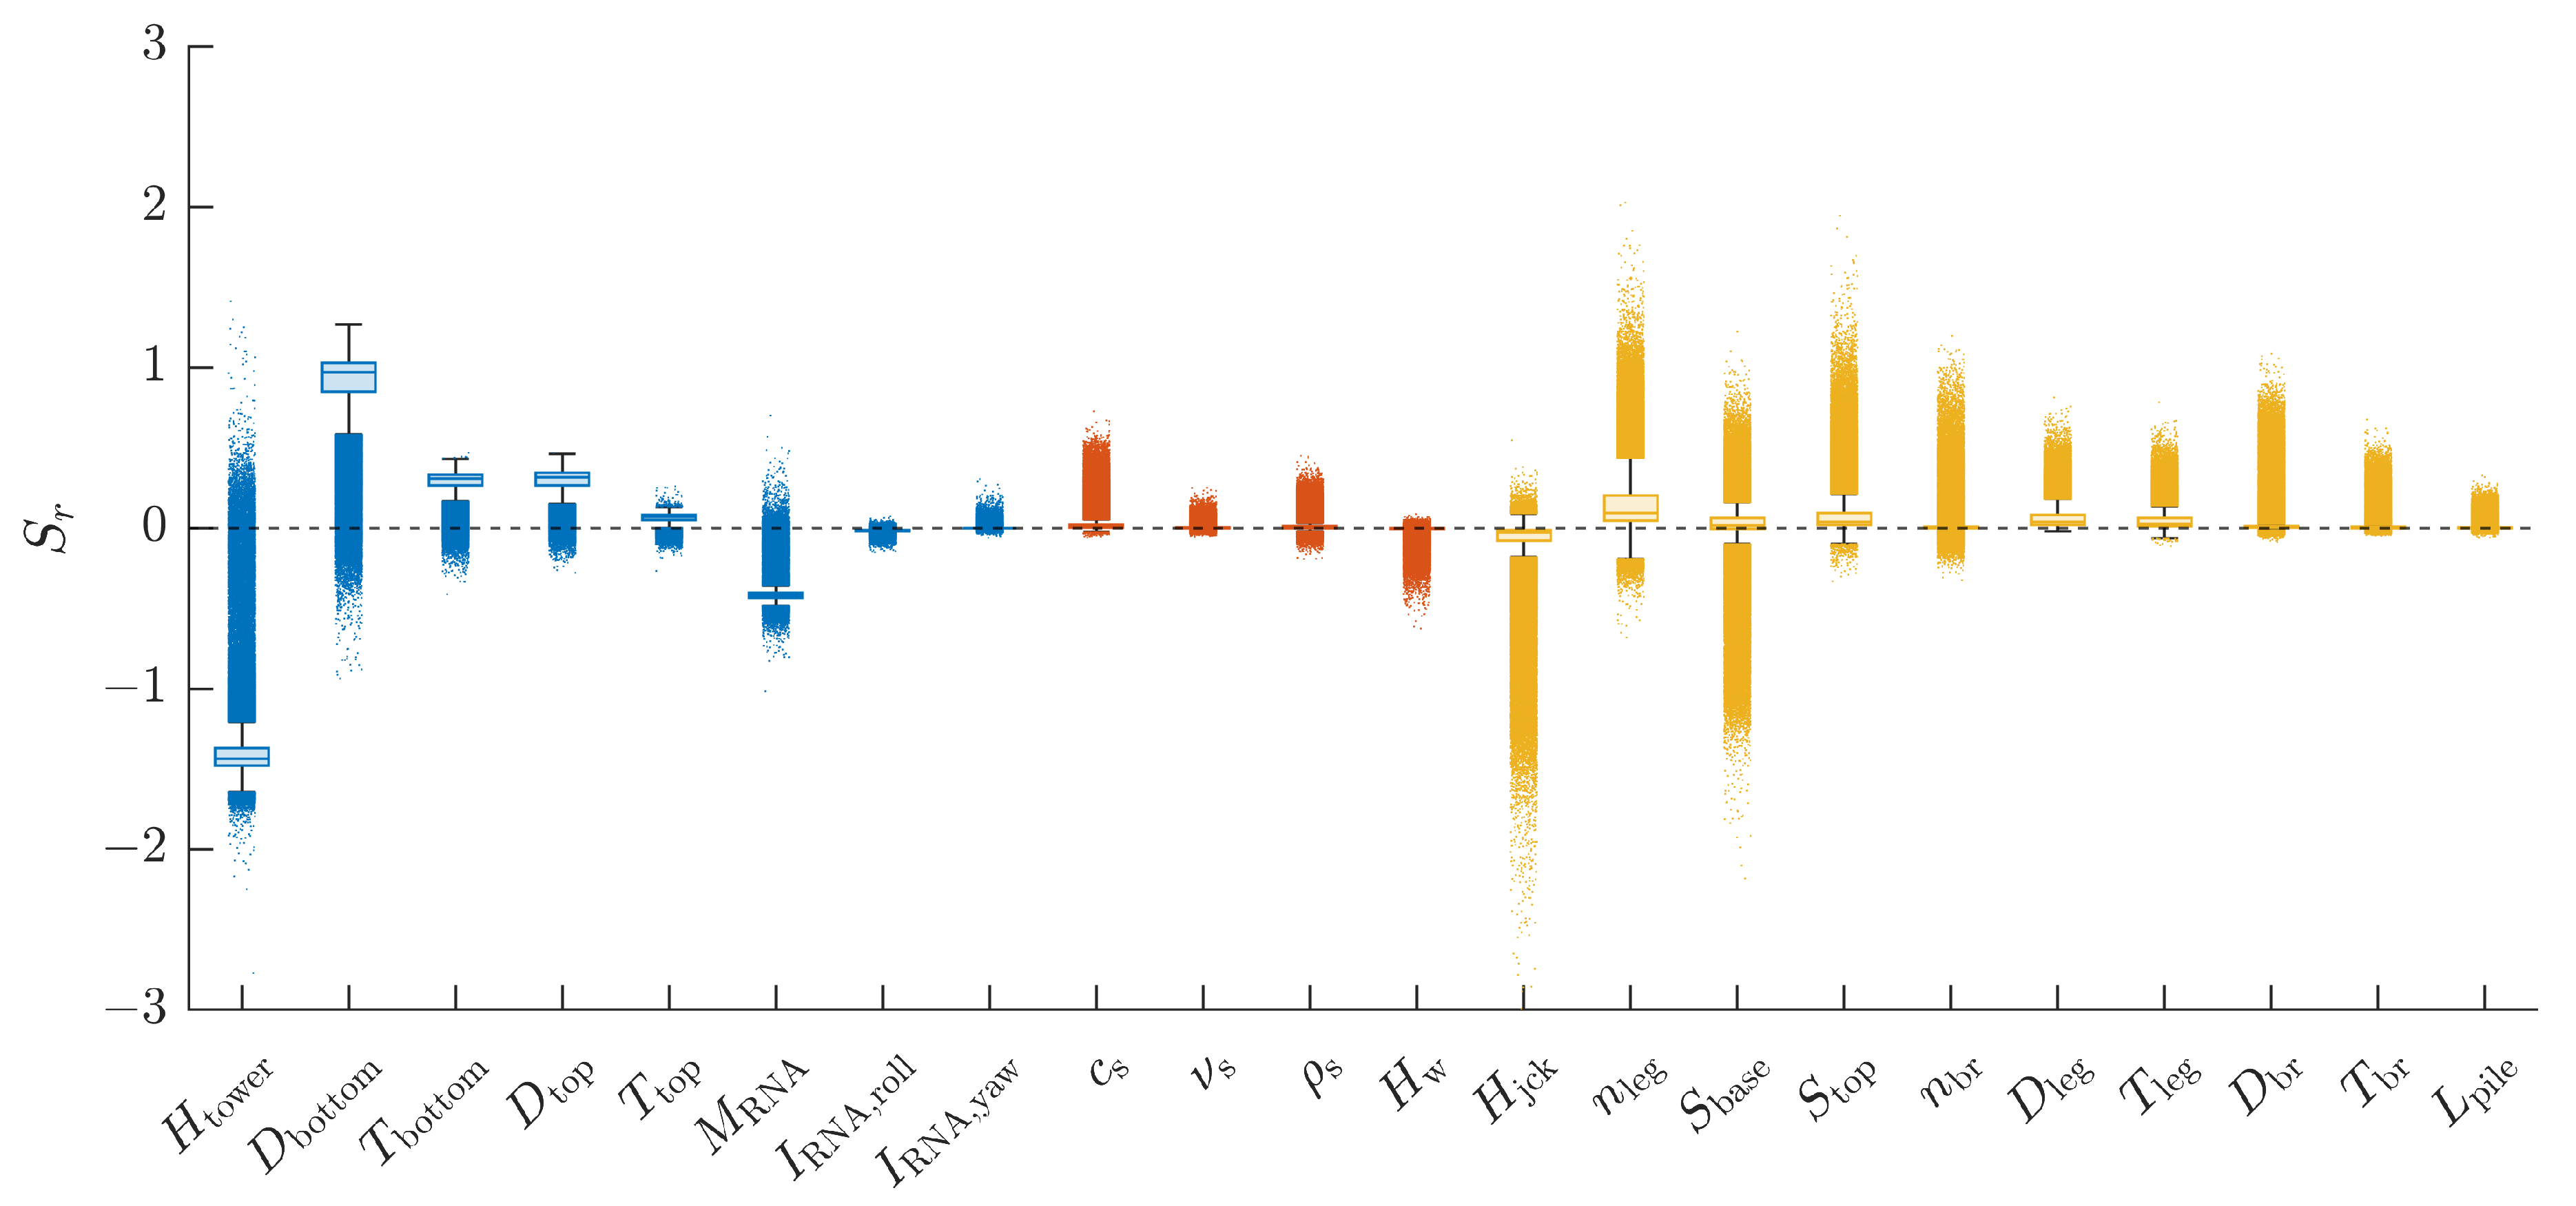
To address this challenge, Section 2.3 introduces the concept of relative sensitivity, which represents the rate of the relative change. This non-dimensional sensitivity analysis enables the evaluation of sensitivities in a unified manner. Boxplots of the relative sensitivities of the fundamental frequency for each variable that characterizes the system are presented in Figure 5. Notably, for each variable, most of the relative sensitivities of the samples exhibit similar values, with outliers extending the distribution. These outliers can arise from two distinct factors: specific samples with atypical dynamic characteristics, or suboptimal predictions due to samples in under-explored regions by the ANN-based surrogate model. Despite this, the interquartile distance is relatively small, and the great performance of the ANN-based surrogate model allows for a reliable analysis, focusing on this interquartile distance.
The variable with the most pronounced effect on the fundamental frequency is tower height, inducing a decrease of around 1.45% in fundamental frequency after increasing the length by 1%. This phenomenon is attributed to the flexibilization produced by this increment. As expected, other characteristics of the wind turbine that contribute to a decrement in the frequency are the inertial effects. The rotor-nacelle assembly mass presents a relative sensitivity of around 0.42, while the moments of inertia have a negligible effect. This effect coincides with that expected for the first mode of vibration of the cantilever beam. The moment of inertia about the roll axis is slightly more relevant, with a relative sensitivity close to 0.017. Conversely, the other moment of inertia exhibits a near-zero relative sensitivity, indicating that the first mode of vibration involves rotation about the roll axis.
Regarding wind turbine tower section dimensions, both diameter and thickness increments increase frequency due to enhanced system stiffness. Notably, the bottom section dimensions are more significant than those at the top, owing to the greater moment-curvature at the base due to the tower acting as a cantilever beam. Moreover, the diameters have a greater influence than the thicknesses because they exert a more significant effect on the moment of inertia of the section compared with the thickness. The variable most prone to increasing frequency is therefore the bottom diameter, exhibiting a relative sensitivity of approximately 0.97.
In contrast, emplacements characteristics have significantly lower relative sensitivities, below 0.05 for most samples, due to the increased stiffness of the jacket structure compared to the wind turbine. The soil properties included in this study tend to increase the fundamental frequency by making the system stiffer, whereas water depth decreases the frequency due to the added mass effect on the jacket.
Regarding jacket design, all variables are found to increase the stiffness of the structure except for the jacket height, with a relative sensitivity of around 0.04. The most relevant variable in jacket design affecting the fundamental frequency is the number of legs, with a relative sensitivity close to 0.1. This is followed by legs spacing and leg section dimensions, whose relative sensitivities range from 0.02 to 0.05 for most samples. These variables impact the global structural stiffness by increasing the moment of inertia of the corresponding sectional area within the frame structure, which is achieved through either an increase in the areas of the legs themselves or a greater separation of these from the central axis of the structure.

3.2. Relationship Between Relative Sensitivity and System Characteristics

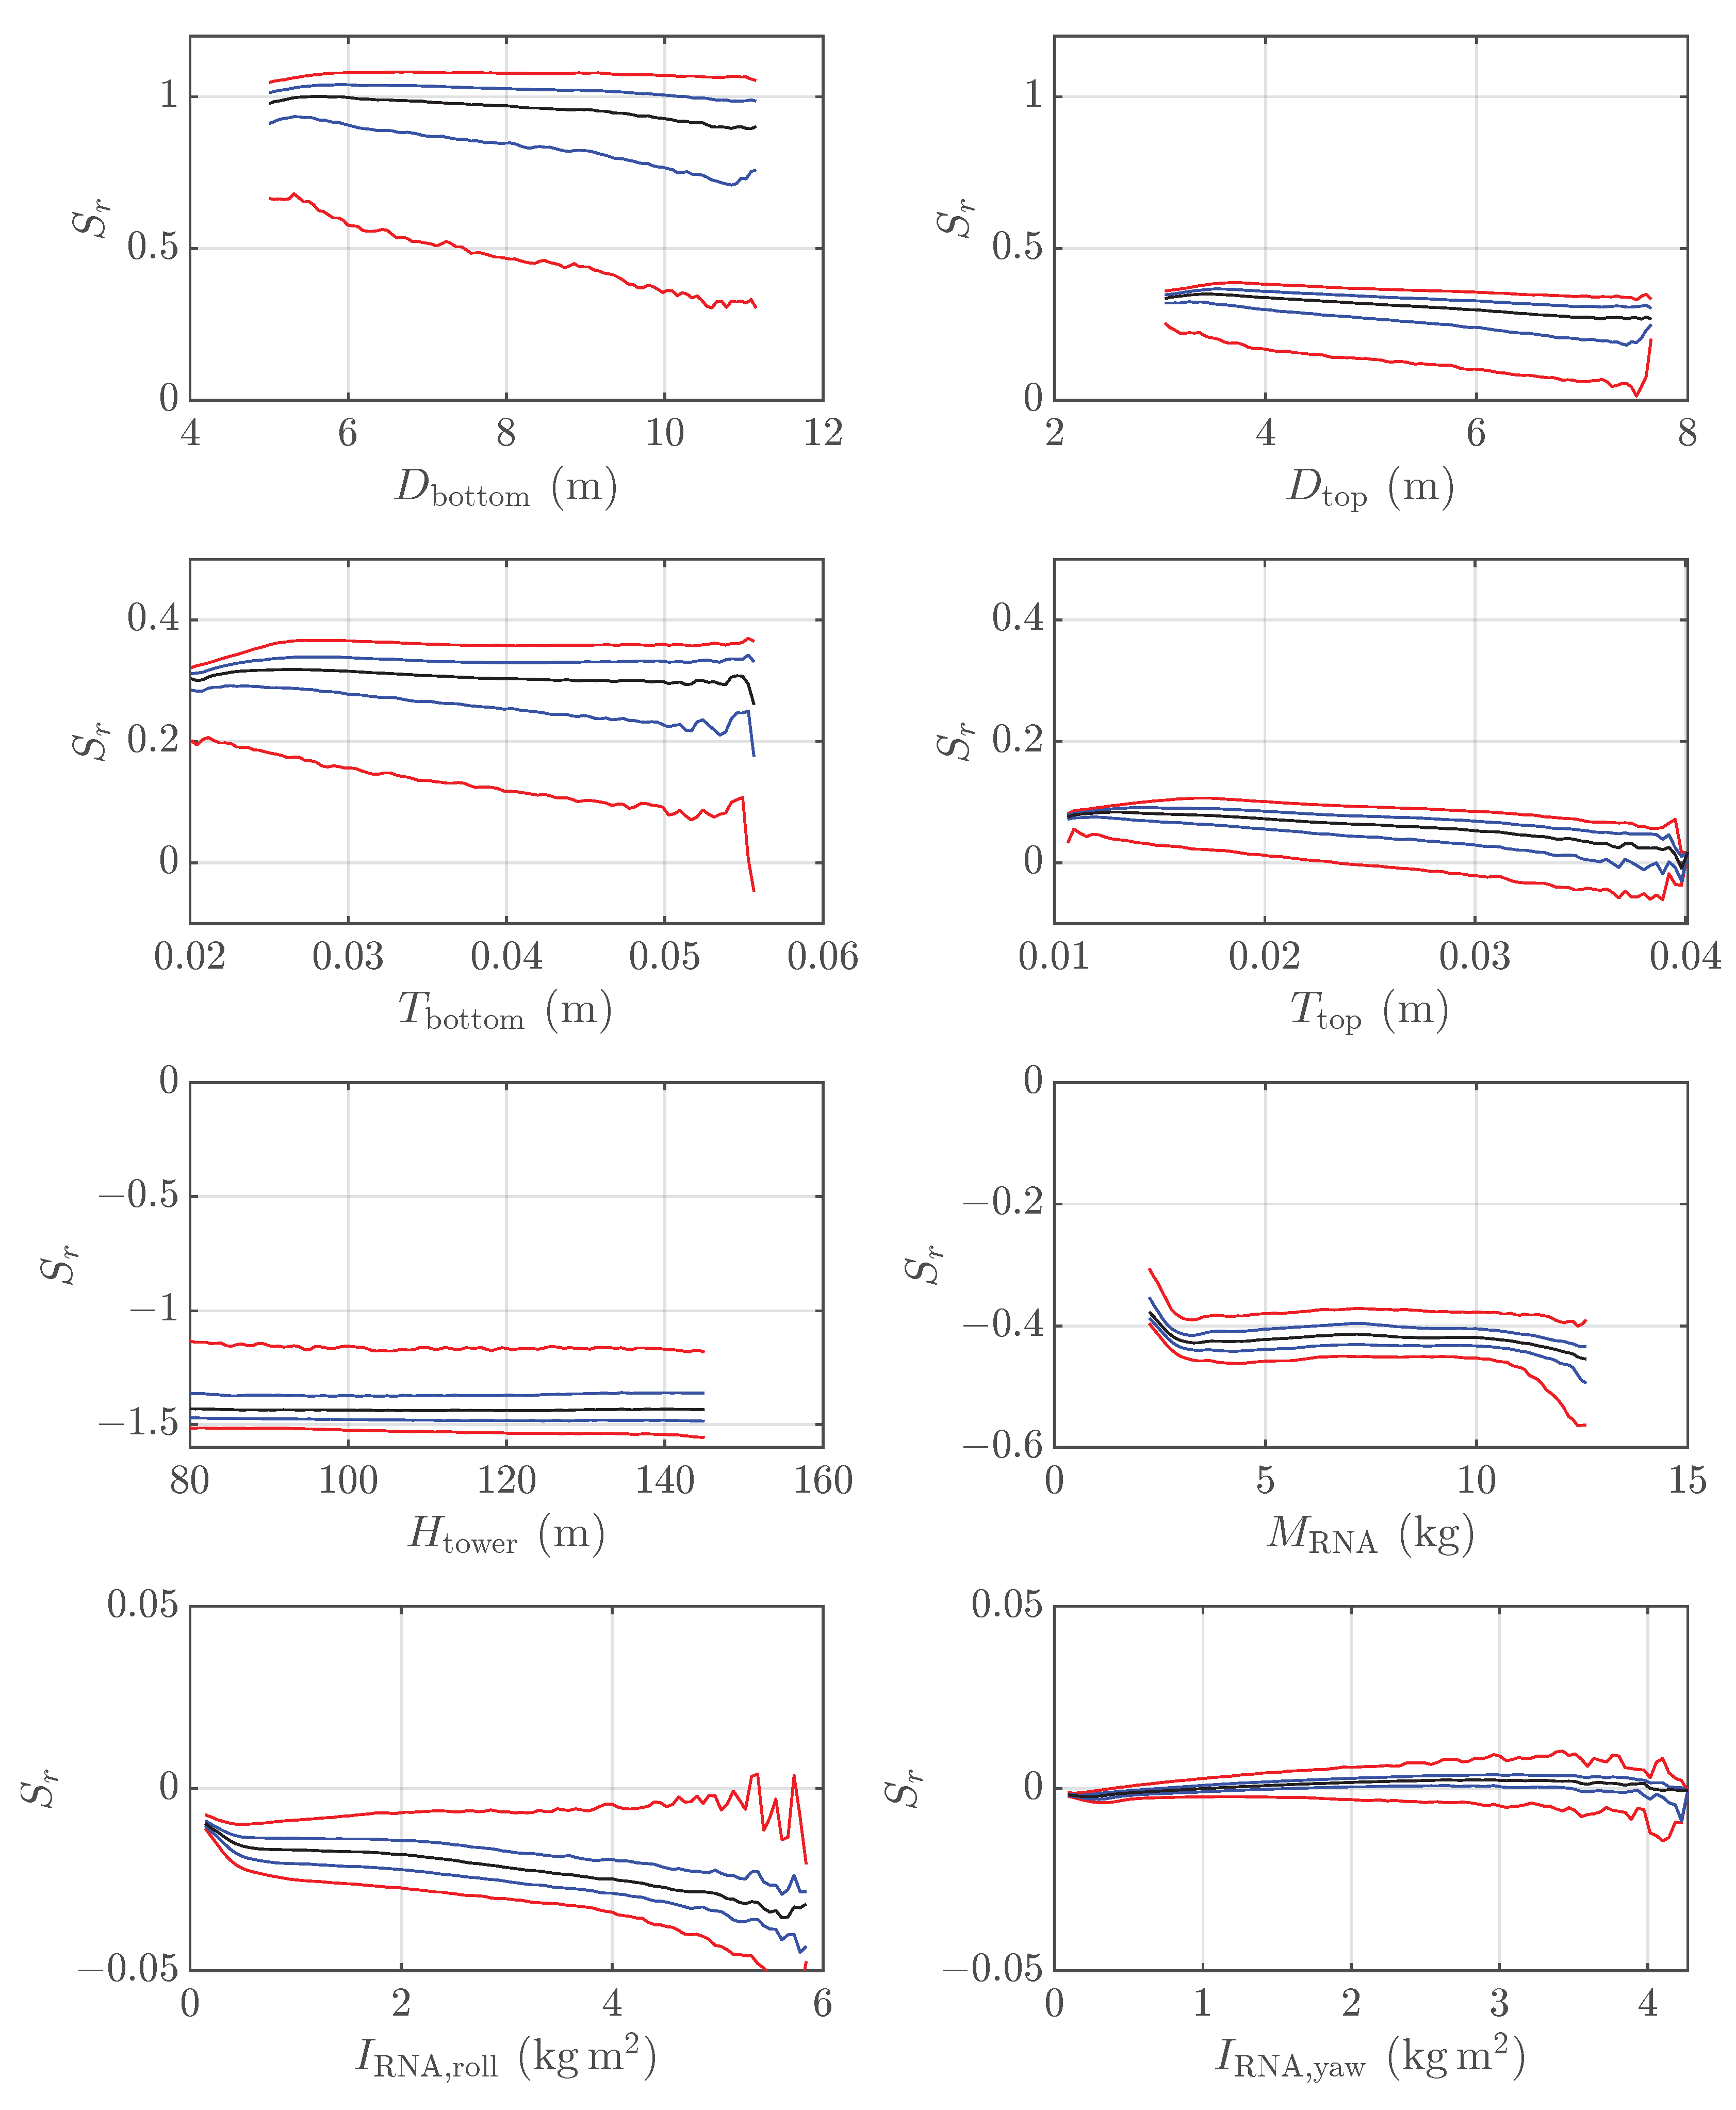
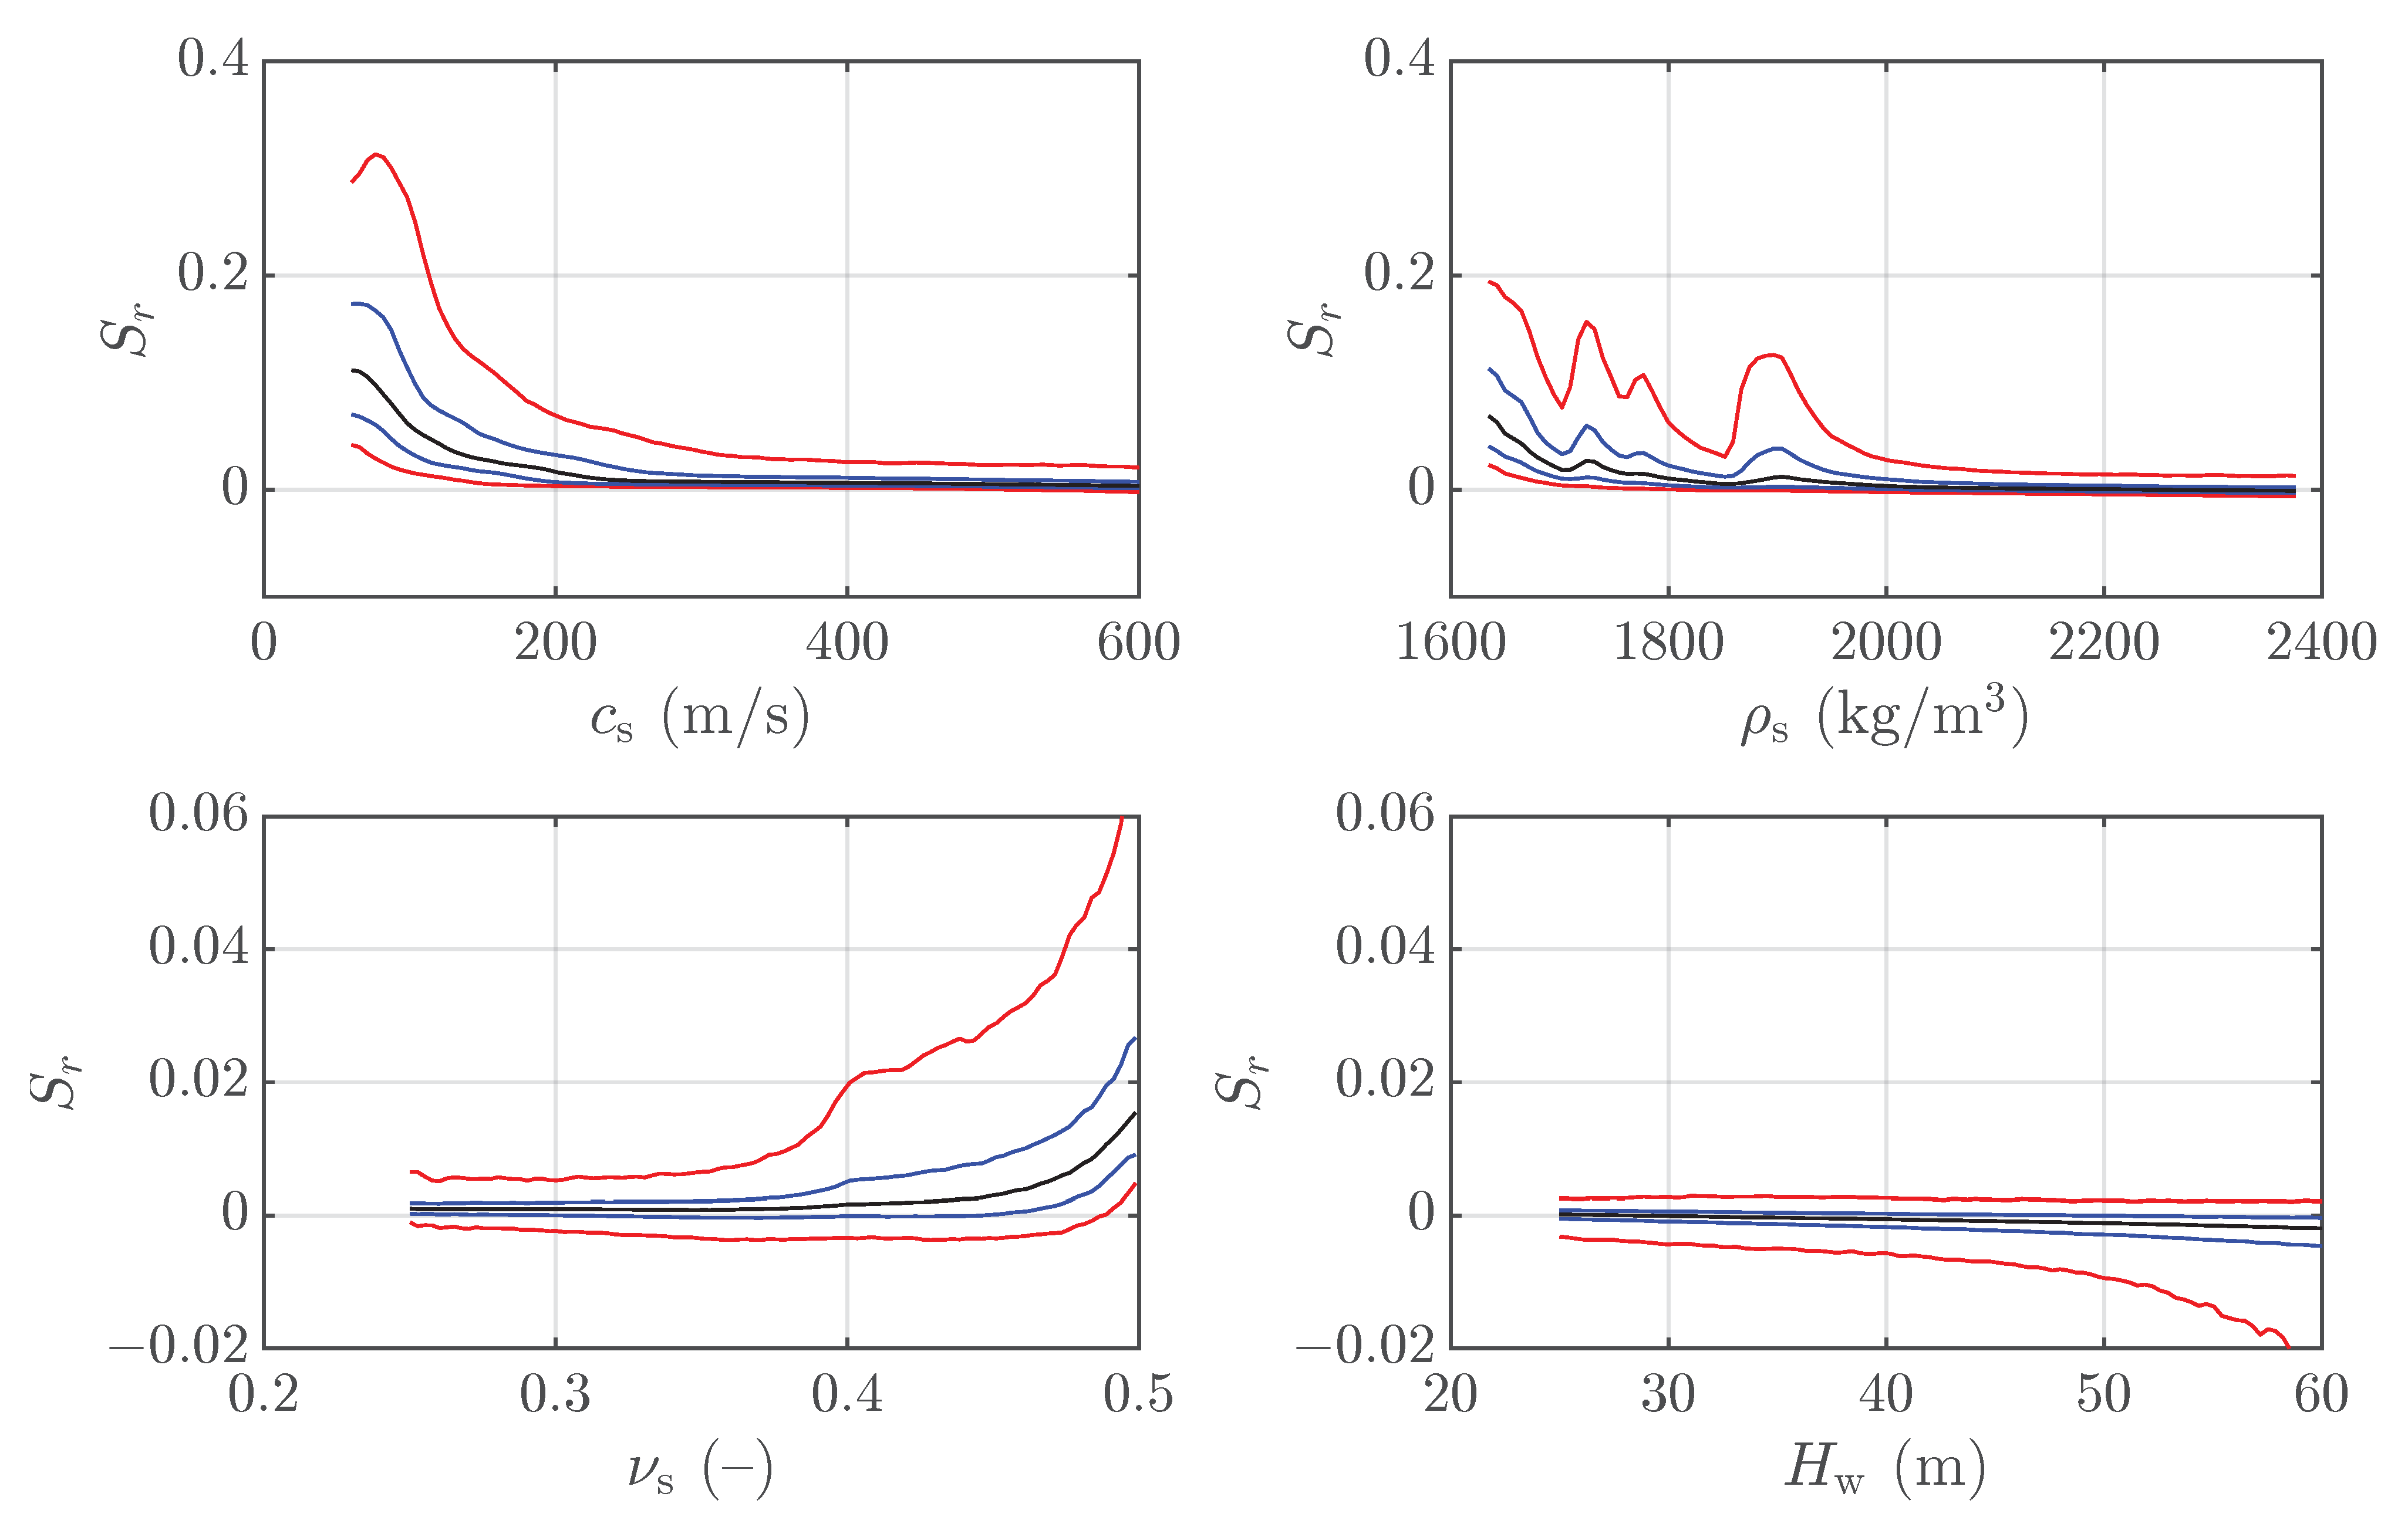
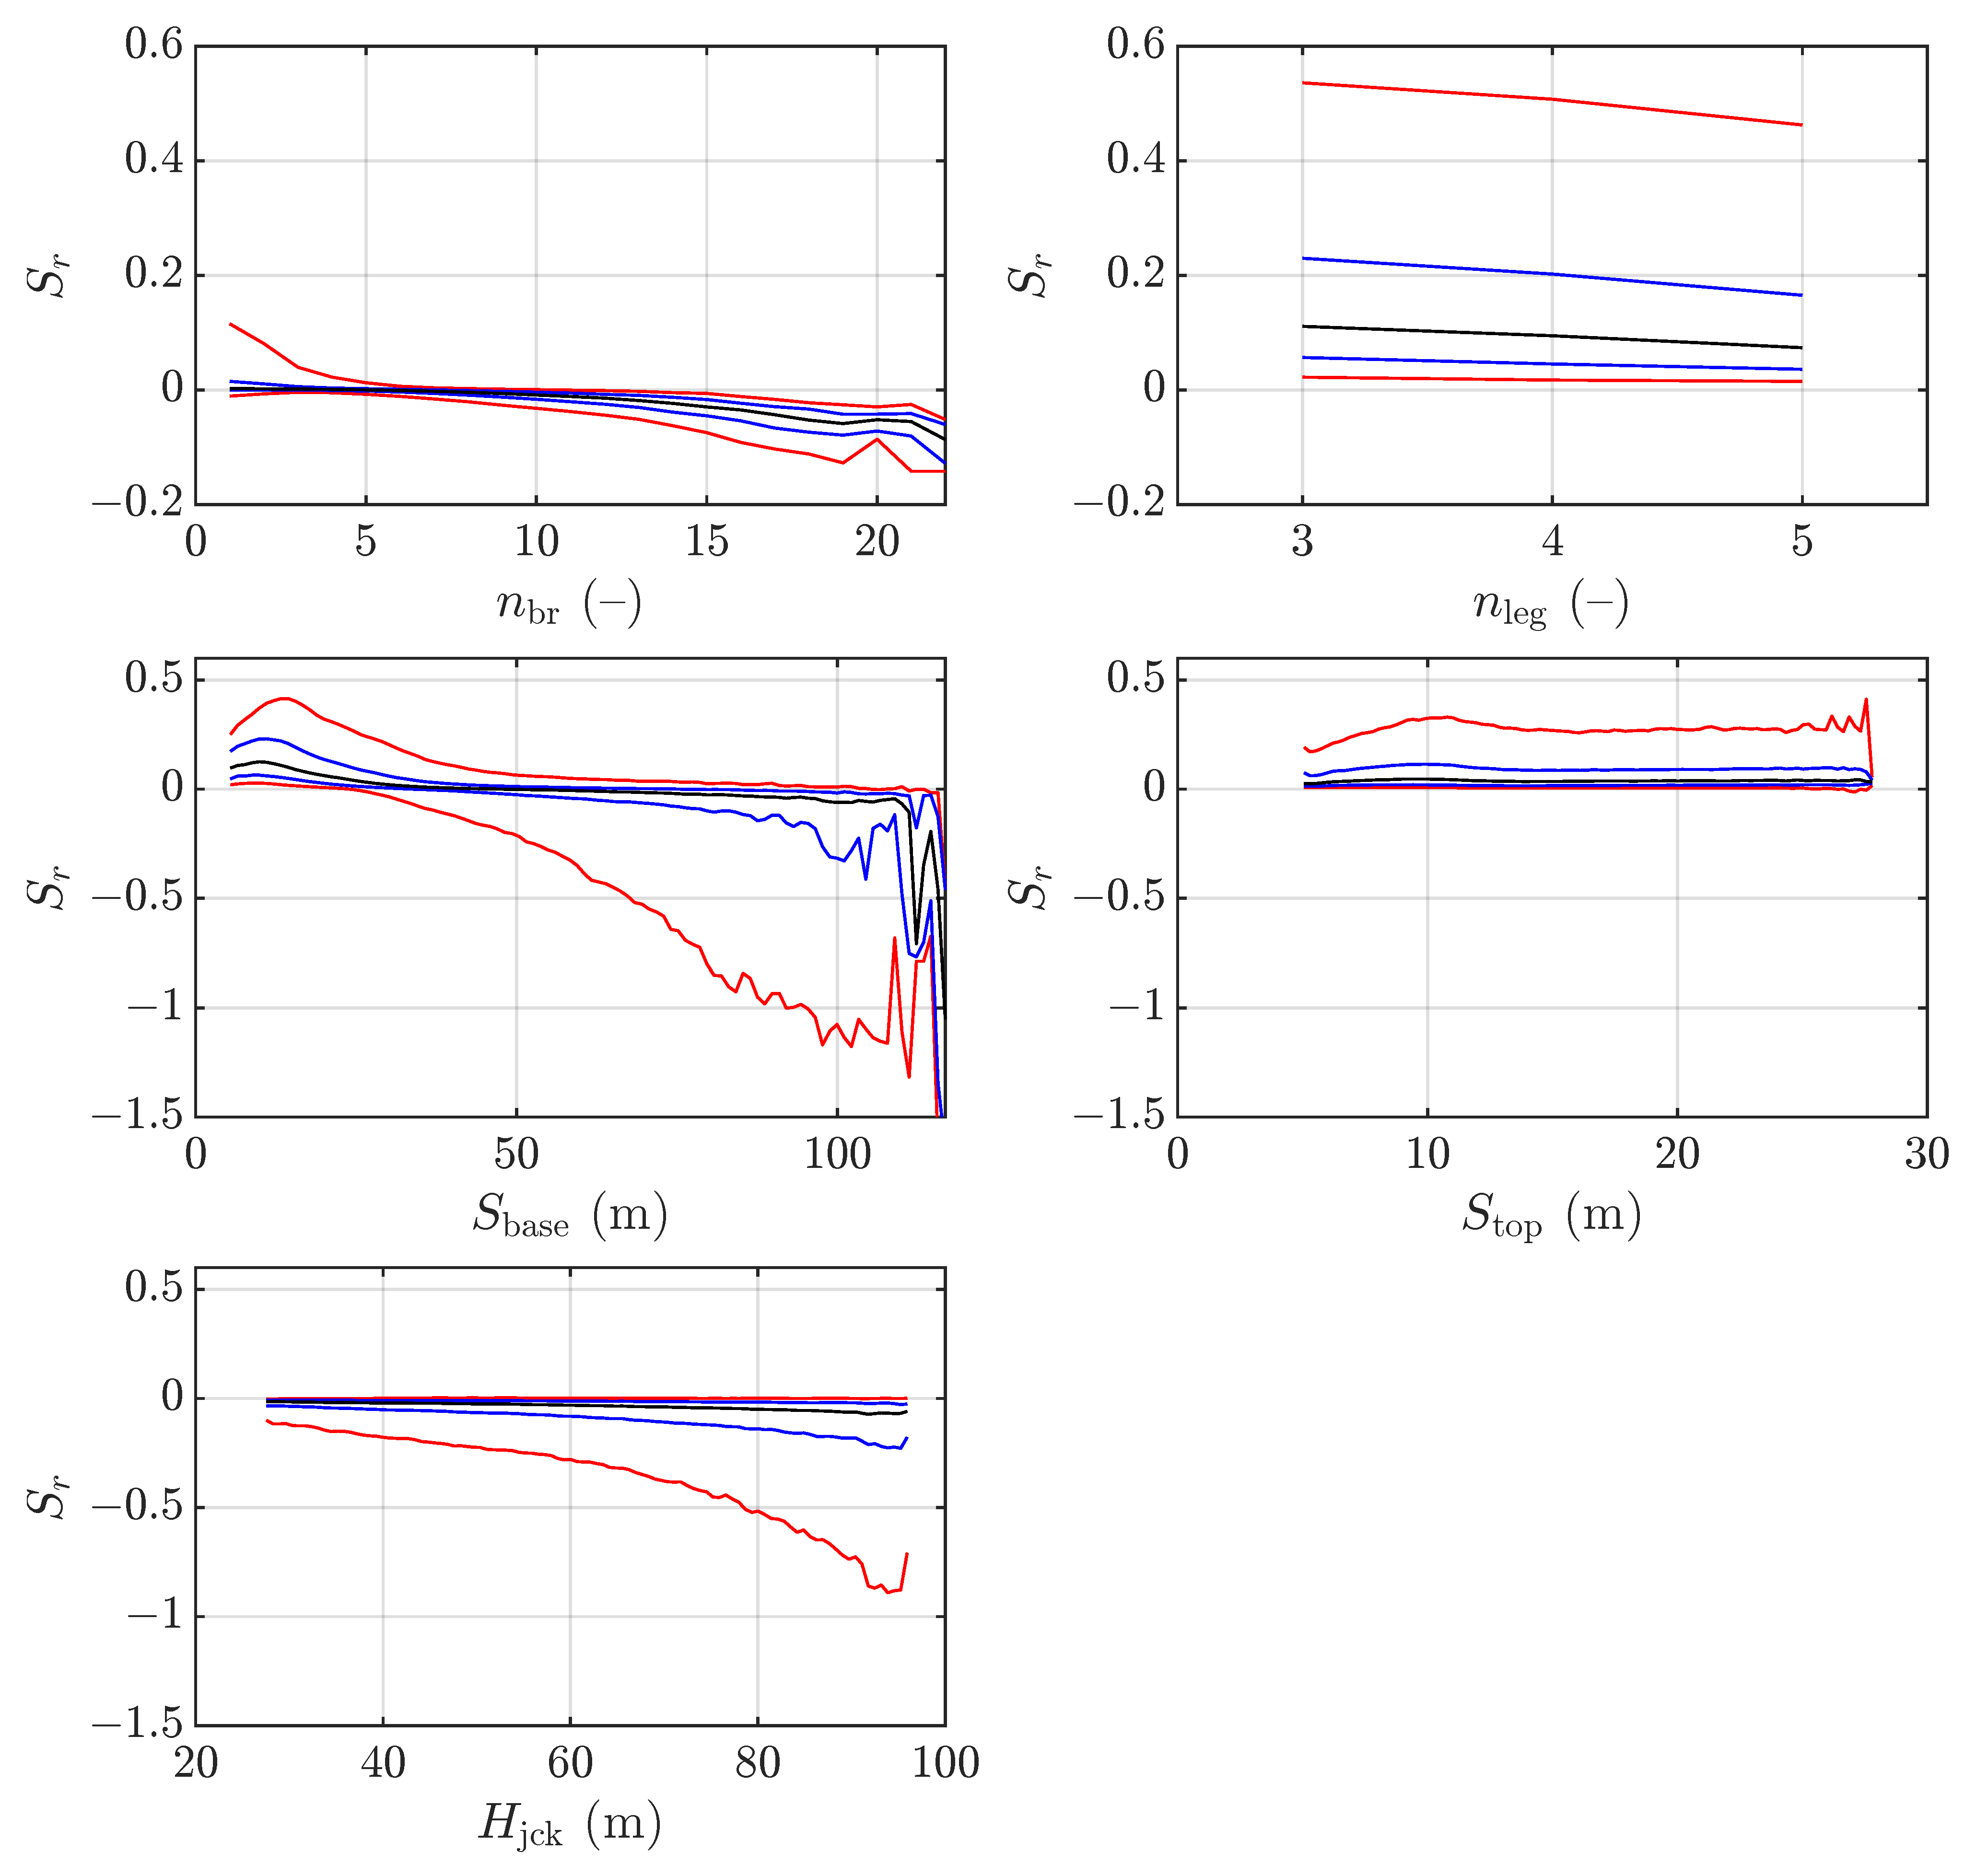
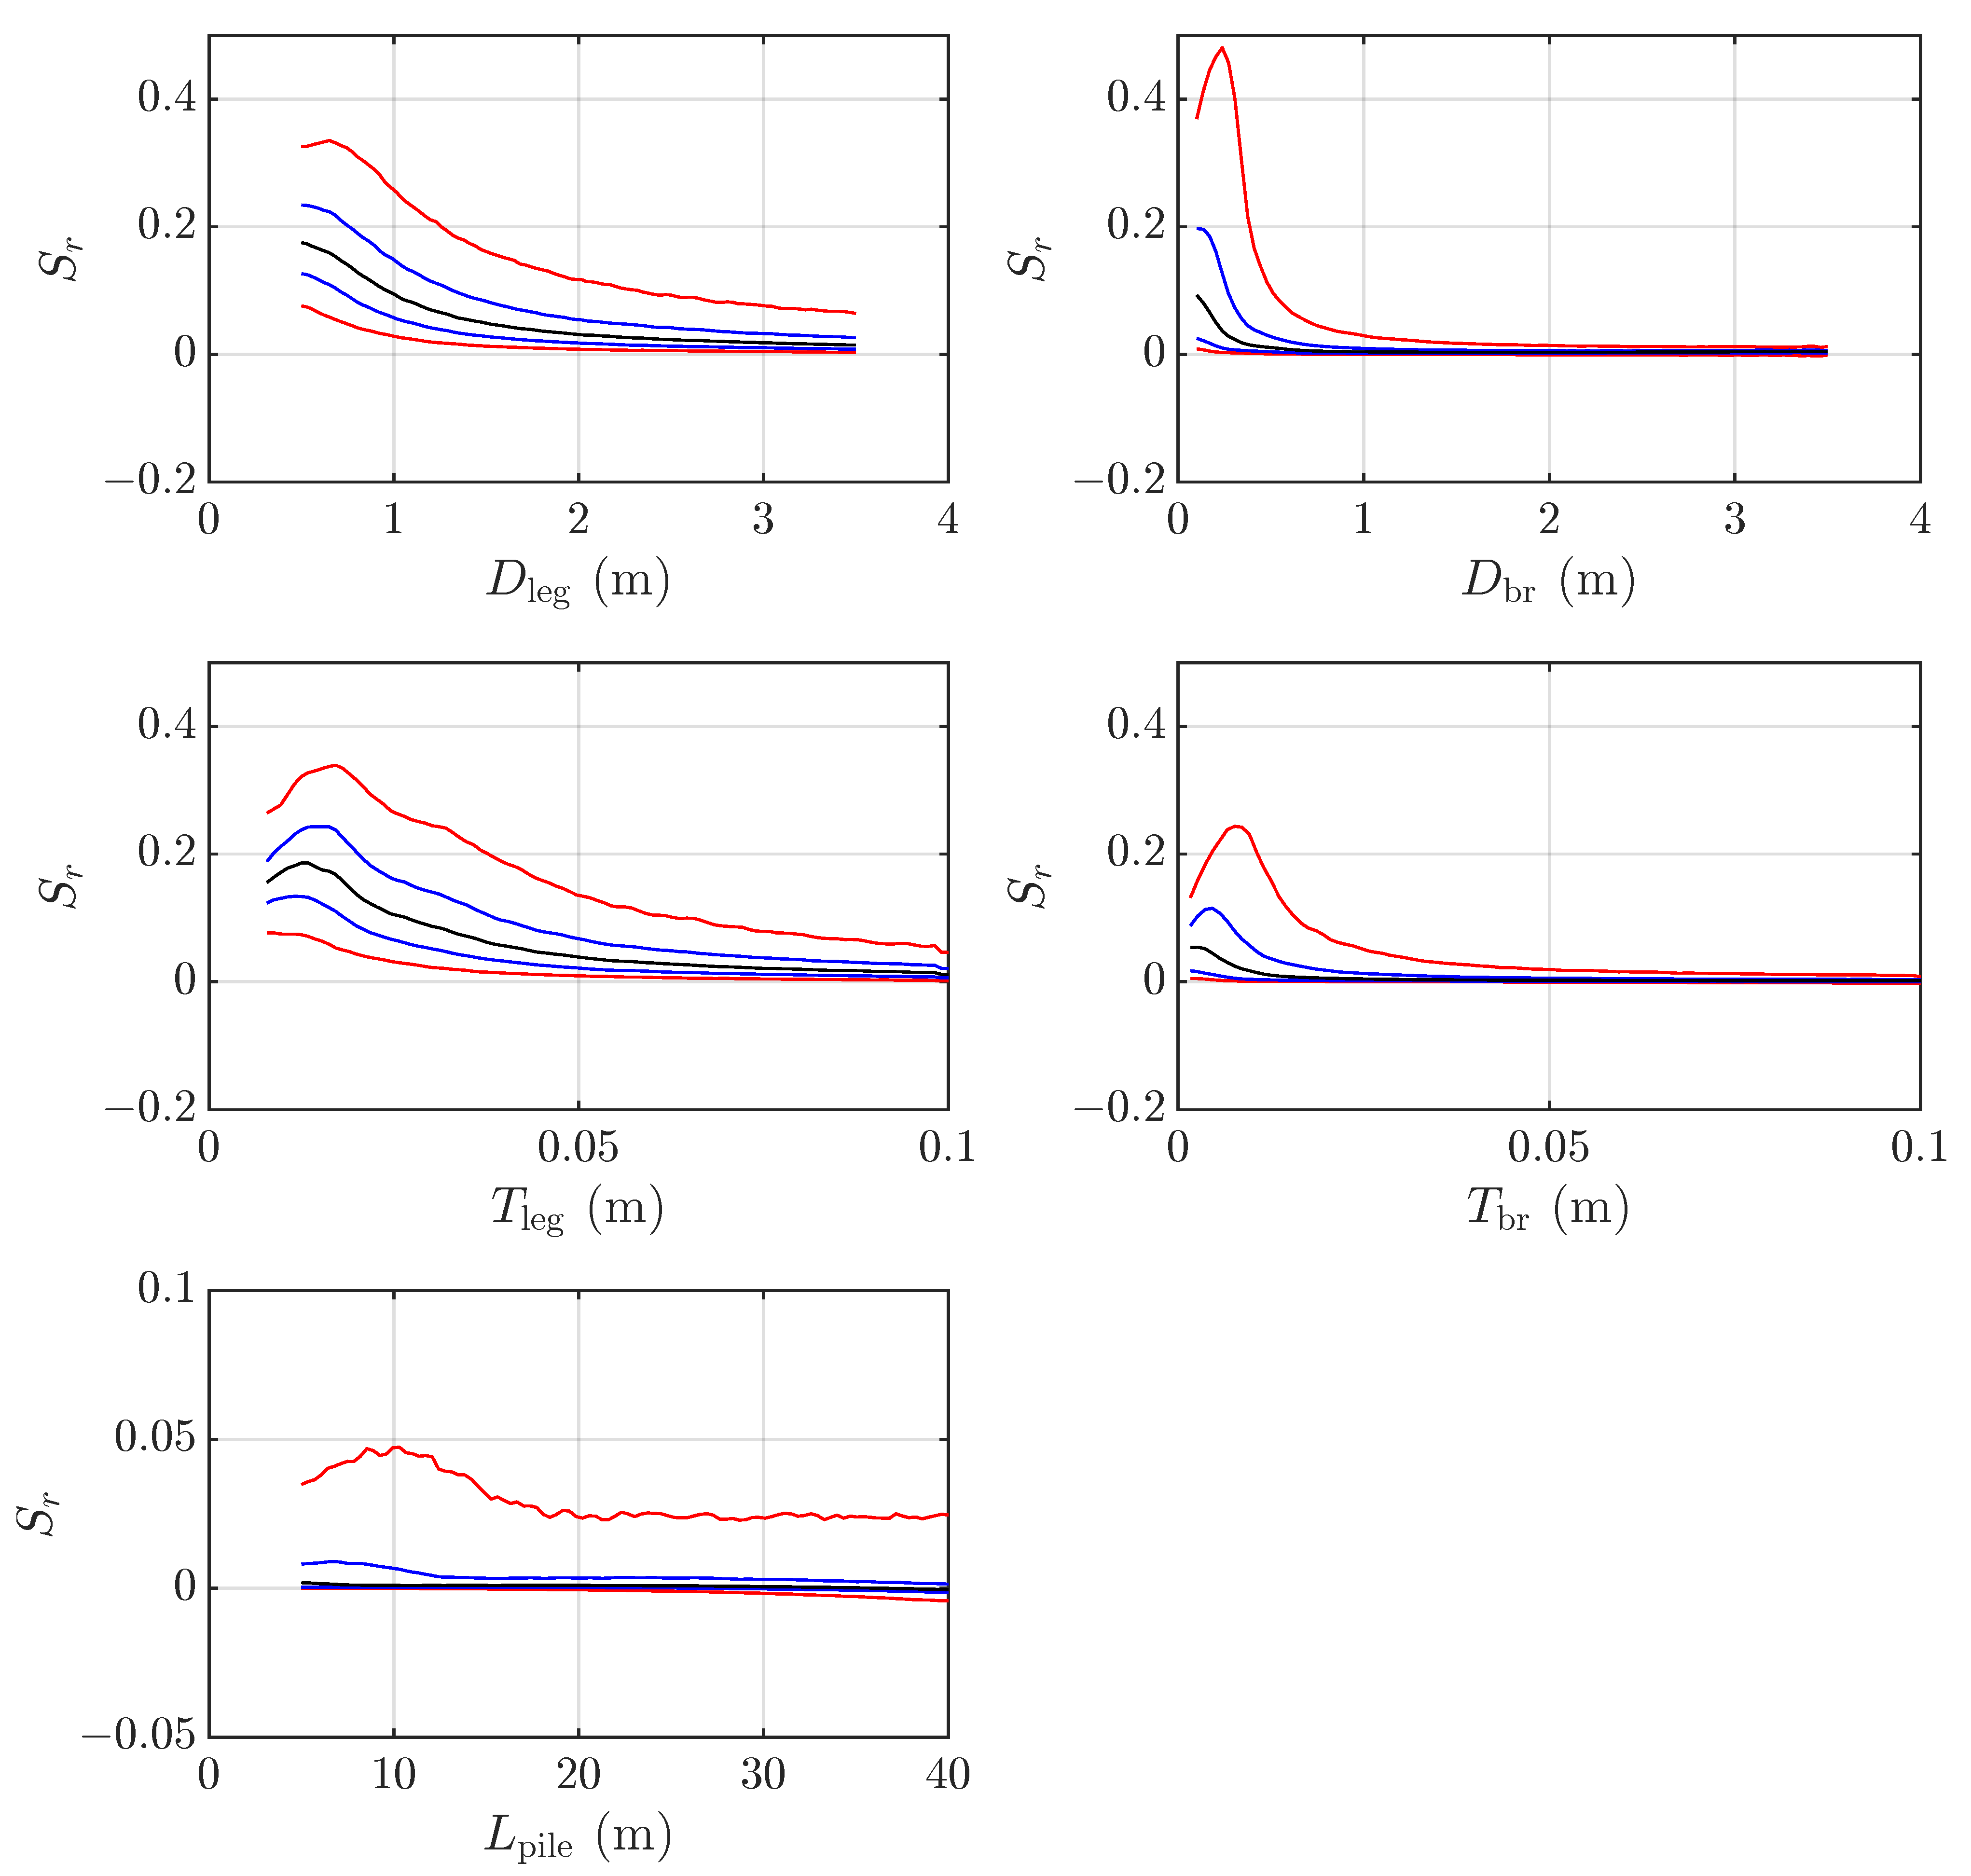
A more detailed analysis of the sensitivity of the fundamental frequency to system characteristics was performed in order to gain further insight into their influence. The relative sensitivity of the fundamental frequency to various system parameters was studied, and the results are presented in Figure 6, Figure 7, Figure 8 and Figure 9. The figures show the 5th, 25th, 50th, 75th, and 95th percentiles of the relative sensitivity of the fundamental frequency for each one of the variables considered as a function of their values. These plots demonstrate how the sensitivity of the fundamental frequency varies with respect to each parameter.
Figure 6 presents the analysis of the wind turbine variables considered in this study. The results show that section dimensions of the tower exhibit a decreasing trend in relative sensitivity as their values increase, being more relevant for the decrement observed for the top section than for the bottom. This happens because larger sections behave like rigid bodies, and their variations have a lesser impact on the flexibility of the global system. In contrast, the relative sensitivity against tower height is almost constant across its range. Similarly, the rotor-nacelle assembly mass does not significantly modify its relative sensitivity, except at extreme values. The moments of inertia also exhibit a non-significant trend, with an increase in relative sensitivity that does not have a substantial impact on the fundamental frequency. These relative constant influences arise from the high relevance of the wind turbine flexibility on the wind turbine-jacket substructure system flexibility.
Figure 7 presents an analysis of the emplacement characteristics and their effects on the fundamental frequency. In general terms, soil variables do not significantly affect the fundamental frequency. However, softer and lighter soils exhibit higher median values of relative sensitivity to c s (0.11) and ρ s (0.7). This trend is also observed for incompressible soils with ν s close to 0.5. For hard soils with c s greater than 300 m/s, this variable has no effect on the fundamental frequency, and similarly for heavy soils with ρ s greater than 2000 kg/m3. Therefore, the foundation’s stiffness appears to be relatively high compared to the jacket’s substructure when the soil is sufficiently hard and heavy. Consequently, the effects of soil–structure interaction can be safely neglected in such cases. Regarding water depth, an increasing relevance is observed as the water becomes deeper. This is because deeper waters require higher jackets, which are more flexible, and the added mass affects the global vibration mode.
Figure 8 presents the influence of jacket design hyperparameters. The median relative sensitivity to jacket height slightly increases up to 0.07, with a significant increment in dispersion. This indicates that for flexible high-jacket substructures, the jacket height can be a very significant variable for determining the fundamental frequency. The relative sensitivity to the number of legs and leg spacing at the top do not present relevant variations with these variables values. However, the relative sensitivity to leg spacing at the bottom exhibits a significant variation. Lower spacings produce an increment in the fundamental frequency by making the structure stiffer, while large spacings reduce the stiffness due to the inclination of the legs and the decreased restriction of platform rotation. The numbers of bracing levels show similar trends, where lower values increase the stiffness, and larger levels reduce the stiffness due to the inclination of the braces and the decreased restriction of platform rotation.
Figure 9 presents an analysis of the relative sensitivity against the dimensions of jacket tubular elements. In general terms, the legs’ section is more relevant than the braces’ section. For legs diameter and thickness, the relative sensitivity trends decrease as these variables increase because a stiffer jacket compared to the wind turbine renders their influence less pertinent. A very interesting trend appears for the braces’ diameter and thickness. For small braces, an increment in their dimensions produces a relevant increment in the fundamental frequency by making the jacket structure stiffer. However, for diameters and thicknesses greater than 1 m and 0.05 m, respectively, their influence on the frequency tends to zero. This happens because once the bracings are stiff enough to assume rigid links between the legs, a variation in their sections does not affect the dynamic characterization of the system. A limitation of this study lies in the assumption of a constant section for the legs and piles of the jacket, as well as identical sections for all the braces. This prevents the differentiation of the relative influence of sections at diverse levels. However, owing to the jacket behaving like a lattice structure, it is assumed that each level would present a partial influence on the system, being less significant than the other variables considered.

4. Conclusions

A global sensitivity analysis of the fundamental frequency of an OWT on a jacket structure has been proposed to elucidate the primary factors influencing this characteristic. This study aims to investigate the dependence of wind turbine properties, emplacement conditions, and jacket design parameters. To achieve this objective, widespread Monte Carlo sampling is conducted to generate a vast set of wind turbines, emplacements, and jacket designs. Most variables are constrained by relationships with other characteristics to ensure that the generated samples are realistic and yield relevant conclusions. The fundamental frequency and its partial derivatives with respect to the main characteristics are obtained via an Artificial Neural Network (ANN) model, which offers fast evaluation capabilities. The relative sensitivities of the fundamental frequency to primary variables are computed to facilitate a comparable analysis of their influence.
It is demonstrated that relative sensitivity exhibits superior performance compared to partial derivatives due to the dimensional character of the latter. The influence on the fundamental frequency measured by the partial derivatives depends on both the intrinsic influence of the variable and the relative change applied. This last factor can be mitigated by studying relative sensitivity, which measures the relative change rate, allowing for a straightforward comparison.
The wind turbine properties are found to be the most relevant variables affecting the fundamental frequency. A decrement in frequency is caused by tower height and rotor-nacelle assembly mass, as well as an increment due to the section dimensions of the tower, particularly at the base. This is attributed to the relatively rigid nature of the jacket substructure compared to the wind turbine tower.
Although some variables exhibit negligible influence for many samples, notable variations in their impact on dynamic characterization are observed within specific ranges. For example, soil properties have a significant effect on foundation stiffness for soft and light soils but can be neglected for hard and heavy soils ( c s > 300 m/s). Additionally, the relative sensitivity of the braces’ diameter and thickness shows pronounced variations with different dimensions. Notably, for small braces, an increment in their dimensions leads to a substantial increase in fundamental frequency due to the increased stiffness of the jacket structure. However, for diameters and thicknesses exceeding 1 m and 0.05 m, respectively, their influence on frequency tends towards zero. This is because once bracings are sufficiently stiff to assume rigid links between legs, variations in their sections do not significantly affect dynamic characterization.
This study provides an approximation of the understanding of the variables influencing the fundamental frequency of OWTs on jacket structures. By measuring the individual influence of each factor, this research facilitates a deeper comprehension of the complex interactions governing this critical characteristic. Also, the results manifest the ability of ANN-based surrogate models to conduct studies involving a large amount of data.

Author Contributions

Conceptualization, R.Q.-R. and G.M.Á.; methodology, R.Q.-R.; software, R.Q.-R.; formal analysis, R.Q.-R.; investigation, R.Q.-R.; writing—original draft preparation, R.Q.-R.; writing—review and editing, R.Q.-R., G.M.Á. and J.J.A.; visualization, R.Q.-R.; supervision, G.M.Á.; project administration, J.J.A.; funding acquisition, R.Q.-R. and J.J.A. All authors have read and agreed to the published version of the manuscript.

Funding

This research was funded by the Ministerio de Ciencia e Innovación and the Agencia Estatal de Investigación of Spain (MCIN/AEI/10.13039/501100011033) through Research Project PID2020-120102RB-I00. In addition, R. Quevedo-Reina was a recipient of the FPU research fellowship (FPU19/04170) from the Ministerio de Universidades (MIU) of Spain. This research was partially supported by ACIISI, Spain–Gobierno de Canarias and European FEDER Funds grant EIS 2021 04.

Institutional Review Board Statement

Not applicable.

Informed Consent Statement

Not applicable.

Data Availability Statement

The data that support the findings of this study are available from the authors, upon reasonable request.

Conflicts of Interest

The authors declare no conflicts of interest.

References

  1. Jiang, Z. Installation of offshore wind turbines: A technical review. Renew. Sustain. Energy Rev. 2021, 139, 110576. [Google Scholar] [CrossRef]
  2. Rodrigues, S.; Restrepo, C.; Kontos, E.; Teixeira Pinto, R.; Bauer, P. Trends of offshore wind projects. Renew. Sustain. Energy Rev. 2015, 49, 1114–1135. [Google Scholar] [CrossRef]
  3. McCoy, A.; Musial, W.; Hammond, R.; Hernando, D.M.; Duffy, P.; Beiter, P.; Pérez, P.; Baranowski, R.; Reber, G.; Spitsen, P. Offshore Wind Market Report: 2024 Edition; Office of Energy Efficiency & Renewable Energy: Washington, DC, USA, 2024.
  4. Musial, W.; Spitsen, P.; Duffy, P.; Beiter, P.; Shields, M.; Hernando, D.M.; Hammond, R.; Marquis, M.; King, J.; Sathish, S. Offshore Wind Market Report: 2023 Edition; Office of Energy Efficiency & Renewable Energy: Washington, DC, USA, 2023.
  5. DNVGL-ST-0126; Support Structures for Wind Turbines. Det Norske Veritas and Germanischer Lloyd: Høvik, Norway, 2016.
  6. Partovi-Mehr, N.; Branlard, E.; Song, M.; Moaveni, B.; Hines, E.M.; Robertson, A. Sensitivity Analysis of Modal Parameters of a Jacket Offshore Wind Turbine to Operational Conditions. J. Mar. Sci. Eng. 2023, 11, 1524. [Google Scholar] [CrossRef]
  7. Li, J.; Cui, C.; Xiao, Z.; Wang, B.; Xu, C. Reliability and sensitivity analyses of monopile supported offshore wind turbines based on probability density evolution method with pre-screening of controlling parameters. Ocean. Eng. 2024, 310, 118746. [Google Scholar] [CrossRef]
  8. Velarde, J.; Kramhøft, C.; Sørensen, J.D. Global sensitivity analysis of offshore wind turbine foundation fatigue loads. Renew. Energy 2019, 140, 177–189. [Google Scholar] [CrossRef]
  9. Shittu, A.A.; Mehmanparast, A.; Amirafshari, P.; Hart, P.; Kolios, A. Sensitivity analysis of design parameters for reliability assessment of offshore wind turbine jacket support structures. Int. J. Nav. Archit. Ocean. Eng. 2022, 14, 100441. [Google Scholar] [CrossRef]
  10. Braithwaite, J.; Goenaga, I.G.; Tafazzolimoghaddam, B.; Mehmanparast, A. Sensitivity analysis of friction and creep deformation effects on preload relaxation in offshore wind turbine bolted connections. Appl. Ocean. Res. 2020, 101, 102225. [Google Scholar] [CrossRef]
  11. Hübler, C.; Gebhardt, C.G.; Rolfes, R. Hierarchical four-step global sensitivity analysis of offshore wind turbines based on aeroelastic time domain simulations. Renew. Energy 2017, 111, 878–891. [Google Scholar] [CrossRef]
  12. Kim, N.; Jin, J.W. Sensitivity analysis of offshore wind turbine tower caused by the external force. KSCE J. Civ. Eng. 2013, 17, 859–864. [Google Scholar] [CrossRef]
  13. Karimirad, M.; Bachynski, E.E. Sensitivity Analysis of Limited Actuation for Real-time Hybrid Model Testing of 5MW Bottom-fixed Offshore Wind Turbine. Energy Procedia 2017, 137, 14–25. [Google Scholar] [CrossRef]
  14. Teixeira, R.; O’Connor, A.; Nogal, M. Probabilistic sensitivity analysis of offshore wind turbines using a transformed Kullback-Leibler divergence. Struct. Saf. 2019, 81, 101860. [Google Scholar] [CrossRef]
  15. Quevedo-Reina, R.; Álamo, G.M.; Padrón, L.A.; Aznárez, J.J. Surrogate model based on ANN for the evaluation of the fundamental frequency of offshore wind turbines supported on jackets. Comput. Struct. 2023, 274, 106917. [Google Scholar] [CrossRef]
  16. Jonkman, J.; Butterfield, S.; Musial, W.; Scott, G. Definition of a 5MW Reference Wind Turbine for Offshore System Development; National Renewable Energy Laboratory (NREL): Golden, CO, USA, 2009. [CrossRef]
  17. Desmond, C.; Murphy, J.; Blonk, L.; Haans, W. Description of an 8 MW reference wind turbine. J. Phys. Conf. Ser. 2016, 753, 092013. [Google Scholar] [CrossRef]
  18. Bak, C.; Zahle, F.; Bitsche, R.; Kim, T.; Yde, A.; Henriksen, L.; Natarajan, A.; Hansen, M. Description of the DTU 10 MW Reference Wind Turbine; DTU Wind Energy: Roskilde, Denmark, 2013. [Google Scholar]
  19. Gaertner, E.; Rinker, J.; Sethuraman, L.; Zahle, F.; Anderson, B.; Barter, G.; Abbas, N.; Meng, F.; Bortolotti, P.; Skrzypinski, W.; et al. Definition of the IEA 15-Megawatt Offshore Reference Wind Turbine; IEA Wind TCP Task 37; National Renewable Energy Laboratory: Golden, CO, USA, 2020.
  20. Couceiro, I.; París, J.; Navarrina, F.; Guizán, R.; Colominas, I. Optimization of Offshore Steel Jackets: Review and Proposal of a New Formulation for Time-Dependent Constraints. Arch. Comput. Methods Eng. 2020, 27, 1049–1069. [Google Scholar] [CrossRef]
  21. Vorpahl, F.; Popko, W.; Kaufer, D. Description of a Basic Model of the “UpWind Reference Jacket” for Code Comparison in the OC4 Project Under IEA Wind Annex 30; Fraunhofer Institute for Wind Energy and Energy System Technology (IWES): Bremerhaven, Germany, 2011; Volume 450. [Google Scholar]
  22. Stolpe, M.; Wandji, W.; Natarajan, A.; Shirzadeh, R.; Kühn, M.; Kaufer, D. Innovative Design of a 10MW Steel-Type Jacket; Deliverable D4.34; INNWIND.EU, 2016. Available online: http://www.innwind.eu/ (accessed on 5 November 2024).
  23. DNVGL-RP-C203; Fatigue Design of Offshore Steel Structures; Recommended Practice. Det Norske Veritas and Germanischer Lloyd: Hamburg, Germany, 2016.
  24. Matlab. Deep Learning Toolbox, Version 9.9.0.1592791 (R2020b) Update 5; The MathWorks Inc.: Natick, MA, USA, 2020.
  25. Moschytz, G.S. Elements of Sensitivity Theory. In Analog Circuit Theory and Filter Design in the Digital World: With an Introduction to the Morphological Method for Creative Solutions and Design; Springer International Publishing: Cham, Switzerland, 2019; pp. 299–333. [Google Scholar] [CrossRef]
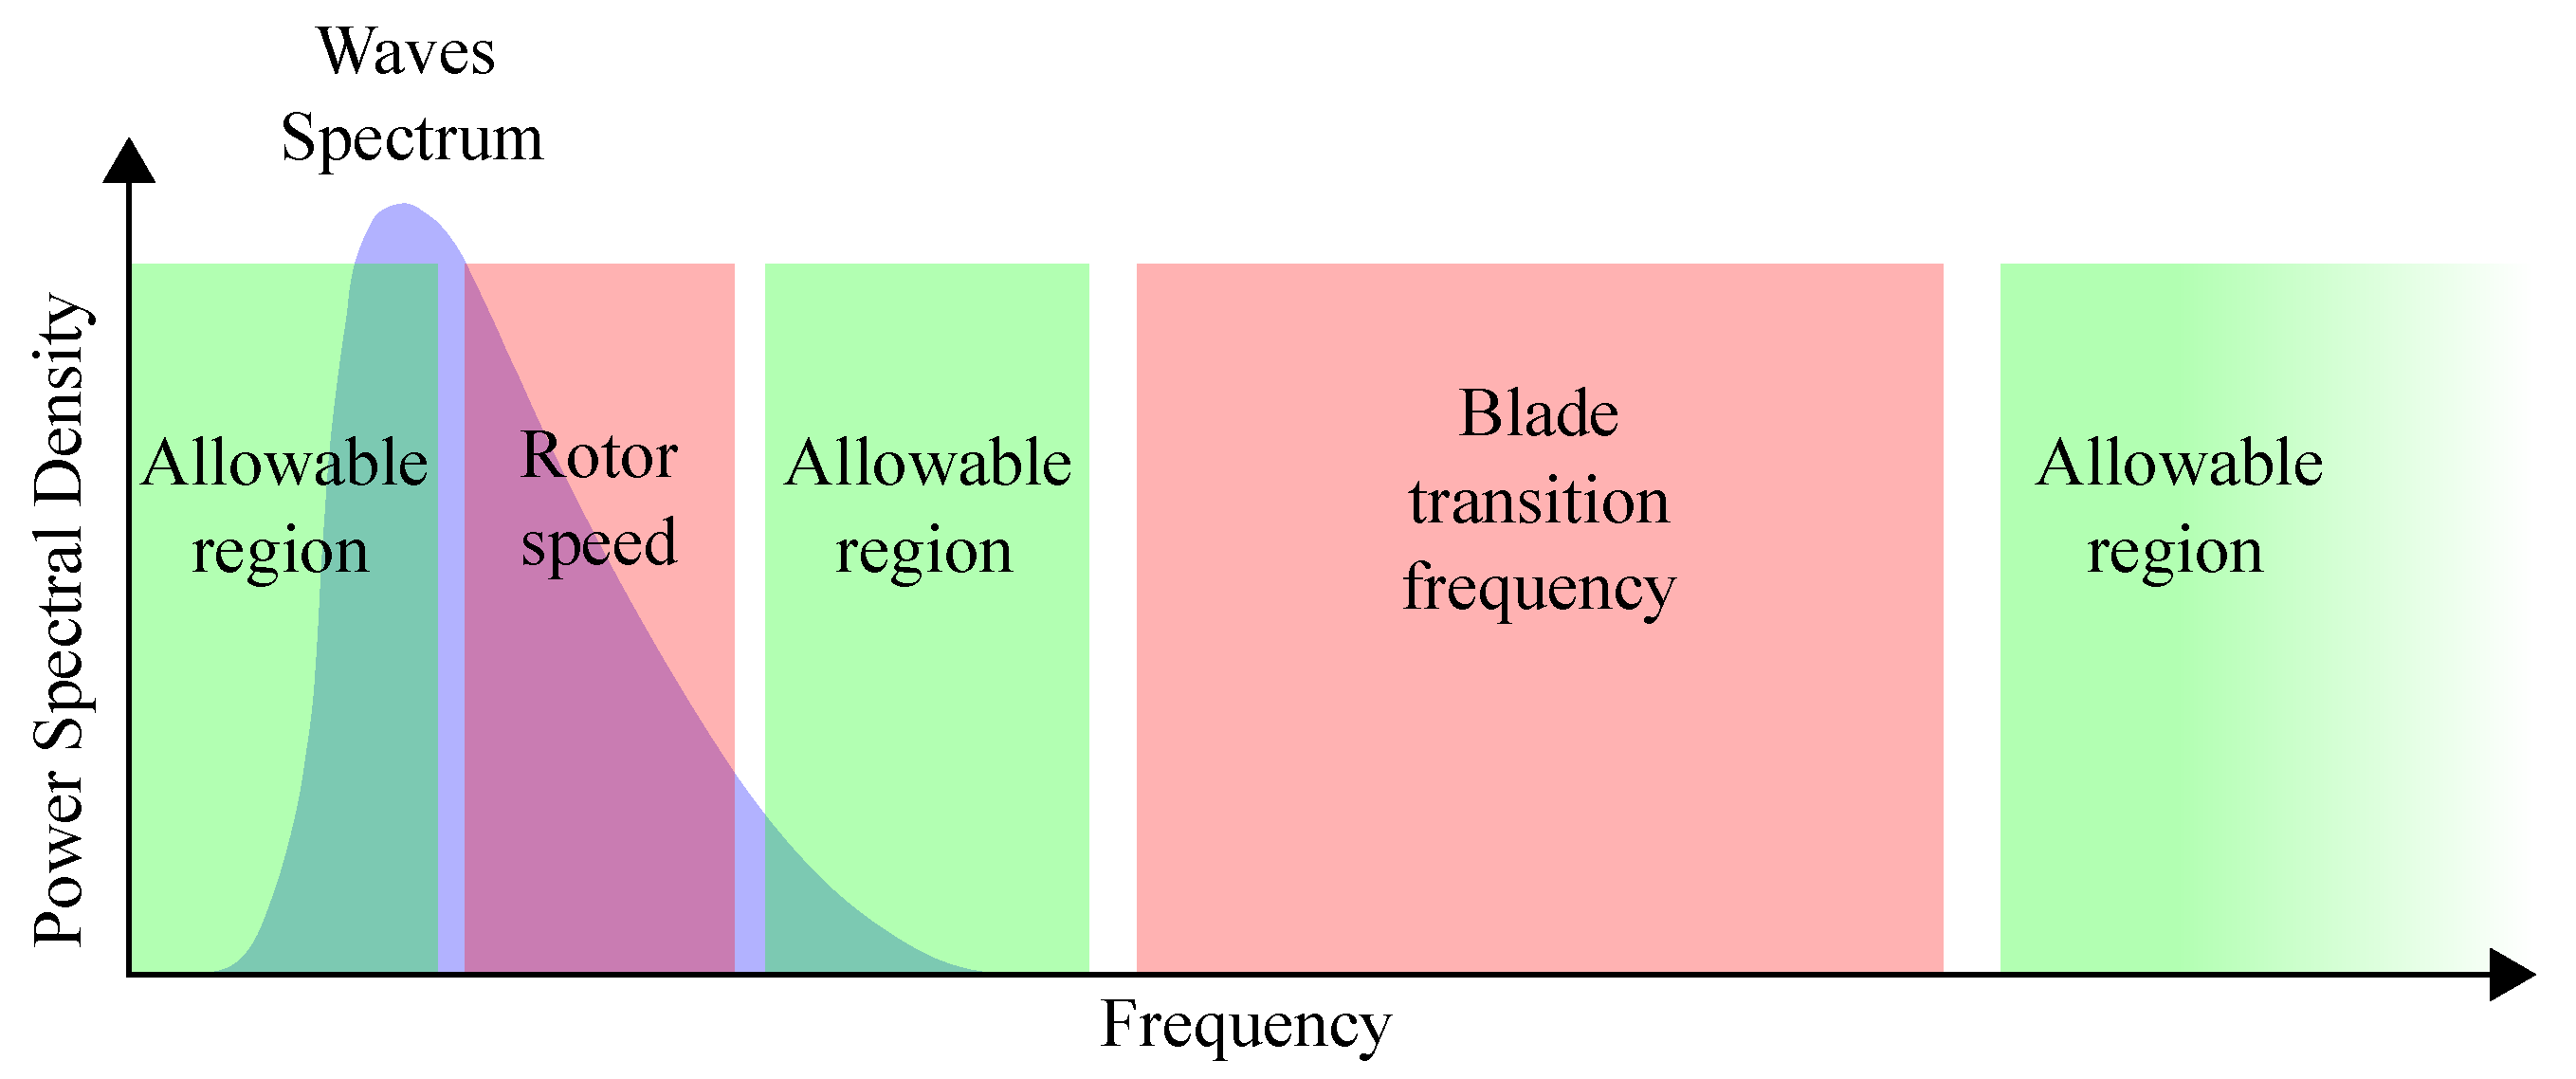
Figure 1. Representation of allowed bandwidth for the fundamental frequency of the OWT according to DNVGL-ST-0126 [5].
Jmse 12 02011 g001
Figure 2. Representation of an OWT supported on a jacket structure with a pile foundation.
Jmse 12 02011 g002
Figure 3. Schematic representation of the architecture of each ANN included in the ANN-based surrogate model.
Jmse 12 02011 g003
Figure 4. Boxplot of the sensitivities of the OWT fundamental frequency to the characteristics defining the system.
Jmse 12 02011 g004
Figure 5. Boxplot of the relative sensitivities of the OWT fundamental frequency to the characteristics defining the system.
Jmse 12 02011 g005
Figure 6. Percentiles of the sensitivity of the fundamental frequency of the OWT to wind turbine variables, segregated based on variable value. Black lines represent the 50th percentile, blue lines the 25th and 75th percentiles, and red lines the 5th and 95th percentiles.
Jmse 12 02011 g006
Figure 7. Percentiles of the sensitivity of the fundamental frequency of the OWT to emplacement variables, segregated based on variable value. Black lines represent the 50th percentile, blue lines the 25th and 75th percentiles, and red lines the 5th and 95th percentiles.
Jmse 12 02011 g007
Figure 8. Percentiles of the sensitivity of the fundamental frequency of the OWT to jacket hyperparameter variables, segregated based on variable value. Black lines represent the 50th percentile, blue lines the 25th and 75th percentiles, and red lines the 5th and 95th percentiles.
Jmse 12 02011 g008
Figure 9. Percentiles of the sensitivity of the fundamental frequency of the OWT to jacket element dimension variables, segregated based on variable value. Black lines represent the 50th percentile, blue lines the 25th and 75th percentiles, and red lines the 5th and 95th percentiles.
Jmse 12 02011 g009
Table 1. Minimum and maximum values obtained via Monte Carlo sampling for each variable.
SubsystemVariableMinimum ValueMaximum Value
Wind turbine H tower (m)80145
D bottom (m)511.15
T bottom (m)0.0200.056
D top (m)3.057.65
T top (m)0.0110.040
M RNA (kg) 2.25 · 10 5 1.26 · 10 6
I RNA,roll (kg m2) 1.46 · 10 7 5.84 · 10 8
I RNA,yaw (kg m2) 9.09 · 10 6 4.27 · 10 9
Emplacement c s (m/s)60600
ν s (–)0.2500.499
ρ s (kg/m3)16352376
H w (m)2560
Jacket substructure H jck (m)27.5595.94
n leg (–)35
S base (m)5.41116.82
S top (m)5.0627.79
n br (–)122
D leg (m)0.53.5
T leg (m)0.00780.1
D br (m)0.13.5
T br (m)0.00170.1
L pile (m)540
Disclaimer/Publisher’s Note: The statements, opinions and data contained in all publications are solely those of the individual author(s) and contributor(s) and not of MDPI and/or the editor(s). MDPI and/or the editor(s) disclaim responsibility for any injury to people or property resulting from any ideas, methods, instructions or products referred to in the content.