Review

Natural and Engineered Ocean Inflow Projects to Improve Water Quality Through Increased Exchange

by
Benjamin Komita
1,2,*,
Robert Weaver
1,
Nicole McClain
1,3 and
Austin Fox
1
1
Department of Ocean Engineering & Marine Sciences, Florida Institute of Technology, Melbourne, FL 32901, USA
2
McLaren Engineering Group, New York, NY 10001, USA
3
Taylor Engineering, Inc., Jacksonville, FL 32256, USA
*
Author to whom correspondence should be addressed.
J. Mar. Sci. Eng. 2024, 12(11), 2047; https://doi.org/10.3390/jmse12112047
Submission received: 1 October 2024 / Revised: 3 November 2024 / Accepted: 8 November 2024 / Published: 12 November 2024
(This article belongs to the Section Coastal Engineering)

Abstract

:
Globally, the health of coastal water bodies continues to be threatened by climate change and mounting anthropogenic pressures related to population increase and associated development. Land use changes have increased the direct runoff of freshwater, nutrients, and other contaminants from watersheds into coastal systems. Exacerbated by increased temperatures, these changes have contributed to a worldwide decline in seagrass coverage and losses of critical habitat and ecosystem functions. For restricted estuaries and lagoons, the influx of nutrients is particularly damaging due to high water residence times and impaired flushing. The result is eutrophication and associated declines in water quality and ecosystem function. To mitigate degraded water quality, engineered ocean–estuary exchanges have been carried out and studied with examples in Australia, New Zealand, India, Denmark, the Netherlands, Portugal, and the United States of America. Based on successes including decreased nutrient concentrations, turbidity, and chlorophyll and increased faunal abundance in some past studies, this option is considered as a management tool for combatting worsening water quality in other estuaries including the Indian River Lagoon, a subtropical, lagoon-type estuary on the central east coast of Florida, USA. Decreased residence times, lower nutrients, higher dissolved oxygen (DO), higher salinity, lower temperature, and lower turbidity all combine for improved ecosystem health. In this review, the successes and failures of past projects intended to increase ocean–estuary exchanges, including biological and geochemical processes that contributed to observed outcomes, are evaluated. The primary indicators of water quality considered in this review include nutrient contents (e.g., nitrogen and phosphorus) and dissolved oxygen levels. Secondary indicators include changes in temperature and salinity pre- and post- engineering as well as turbidity, which can also impact seagrass growth and overall ecosystem health. Each of the sites investigated recorded improvements in water quality, though some were more pronounced and occurred over shorter time scales. Overall, enhanced ocean exchange in restricted, impaired water bodies resulted in system-specific response trajectories, with many experiencing a net positive outcome with respect to water quality and ecosystem health.

Graphical Abstract

1. Introduction

Coastal communities worldwide face serious and ongoing problems related to the water quality of their marine waterways [1]. As new development continues to take place, (e.g., residential, commercial, industrial, and agricultural) and human factors continue to amplify climate change, coastal landscapes are undergoing extreme changes in hydrologic cycles, including alterations to water runoff rates and local residence times [2]. With responses varying from new migration patterns to reduced reproduction to mass mortality events (MME’s), aquatic species demonstrate extreme sensitivity to environmental changes [3]. Declining water quality, resulting in a loss of biodiversity, ultimately affects the ecological function of coastal systems. Not only are the effects of poor water quality felt by species living in the environment, but they are also felt by the human population. Water quality degradation is a major threat to human health; it hinders food production, reduces ecosystem functions, and restricts economic growth [4].
Caused by both point and nonpoint source pollution, eutrophication (i.e., high nutrient loading) is one of the most prevalent water quality impairments [2,5]. Point source pollution, PSP, is pollution that is discharged into a waterway at a particular location or point through a pipe or channel; it typically originates from factories, commercial facilities, stormwater drainage systems, and sewage treatment plants [6]. Nonpoint source pollution, NSP, is pollution that is introduced into waterways via runoff, groundwater, and atmospheric deposition; pollutants contained within NSP can include excess fertilizers and insecticides from residential or agricultural lands, oil and grease from roadways, toxic chemicals from energy production plants, the release of combustion by-products into the atmosphere, and even sediment particles from construction sites [6,7]. Restricted estuaries and lagoons are especially susceptible to the negative impacts of eutrophication due to the lack of water circulation resulting in high residence times. Decreasing and mitigating these existing and future external inputs is an essential part of any multifaceted management strategy; however, engineering strategies can rapidly address chronic water quality issues by serving as a catalyst that helps to promote beneficial feedback loops that can restore ecosystem services and internal nutrient cycling.
A second major contributor to water quality impairment are the alterations to the natural patterns of water circulation including freshwater inflows being supplemented to coastal systems [5]. Human activities have significantly altered surface water flow patterns and pollutant loading. As human populations continue to increase, the urbanization of coastal environments and associated manmade hydrologic changes permanently alter the hydrodynamics of coastal water systems [8]. Engineered changes to hydrologic systems can include reservoirs, hydroelectric dams, dewatering canals, and irrigation systems; all of which have a purpose of controlling human access to water but often result in impairment to the ecosystem and a decrease in biodiversity [9]. The increase in freshwater inflows into coastal waters can be attributed to two primary causes: (1) Climate change-driven intensification of the hydrological cycle [10] and (2) anthropogenic alterations to coastal hydraulic systems [8,11].
The Indian River Lagoon, IRL, on Florida’s central east coast, is an example of an impaired, restricted estuary. Over the last 50 years, the biological and ecological integrity of the IRL has shown evidence of decline due to a significant decrease in water quality, marked by an unprecedented algal bloom in 2011 with recurring blooms and impaired water quality since then [12]. Like many other coastal lagoons and estuaries, the water quality has deteriorated as a result of anthropogenic causes, such as eutrophication and alterations to natural water circulation and flows. The IRL receives two and a half times more freshwater than it originally and naturally was receiving, largely due to the construction of a network of drainage and agricultural canals [8]. The substantial increase in freshwater inputs ultimately impacts the salinity of the IRL. The increased freshwater supply also contributes phosphorus, nitrogen, and other contaminants [11]. These factors, combined with sufficient light and warm water temperatures, create the ideal environment for harmful algal blooms in the IRL system [11]. In 2011, a “super bloom” occurred in the northern IRL, and the excessive growth of phytoplankton led to the loss of seagrasses, simultaneously resulting in an MME that saw the large-scale deaths of a variety of animals, including manatees, dolphins, seabirds, and fish [13,14,15].
As the health of coastal water bodies continues to be threatened due to anthropogenic activities, solutions can be implemented to minimize and reverse these cumulative effects. Most management strategies focus on decreasing external nutrient loading; however, beyond some threshold, management strategies must address impacts to changing ecosystem functions and internal nutrient cycling. One solution for improving water quality in restricted estuaries involves hydrologically engineering the system to increase ocean exchange [16]. Ocean water exchange projects, if designed properly, can not only improve circulation within estuaries and decrease the residence times for water in these systems, but the shift water quality can also increase the ability for the ecosystem to manage nutrients. Bringing ocean water into these systems can help stabilize temperature, salinity, and dissolved oxygen concentrations that have been destabilized by changing land use and human infrastructure. Enhanced exchanges between these systems and adjacent seawater can mitigate thermal and halo stresses, thereby creating habitats more suitable for benthic fauna while also increasing the resilience of these systems to hypoxia that results from eutrophication. Improved habitat quality can help to restore natural ecosystem functions responsible for assimilating external nutrient loading that can help to mitigate HABs. Historically, human development and land use changes have increased the direct runoff of freshwater, bringing nutrients and other pollutants to these systems. In an effort to mitigate declining water quality due to a combination of external and internal processes, hydraulically engineered inflow or enhancing ocean exchanges have been used to improve water quality with varying levels of success. Exchange can be achieved by designing, constructing, and managing any number of engineering solutions, including either one-way or two-way flow structures. Examples of one-way flow structures include
  • the construction of a low-crested dam or weir structure, e.g., Ringkobing Fjord, Denmark [17,18];
  • the implementation of a pipe and pump system (either tidally driven or mechanical), e.g., Destin Harbor [19,20,21,22];
  • a managed lock system to allow for flow only during incoming tide, e.g., Lake Veere [23,24,25,26,27]; and
  • a culvert with a flap gate.
  • Examples of two-way flow structures are
  • the creation of a new inlet e.g., Fire Island [28,29,30,31,32,33,34,35];
  • altering the existing ocean connection to improve the exchange coefficient, e.g., ICOLLs [36,37,38,39,40,41,42,43,44,45,46,47,48,49,50,51];
  • opening a lock system to allow for continuous flow, e.g., Ringkobing Fjord Denmark [17,18,52].
Each engineered solution has pros and cons. Any open connection (two-way flow) will have a limited geographical influence since the extent of penetration of the tidal prism into an estuary is a function of the physical properties of that estuary (e.g., depth, length, width, restriction, friction). A drawback of creating a new inlet is the lifetime operation and maintenance costs associated with keeping the inlet open and mitigating the downcoast erosion as the natural flow of sand along the coast is interrupted [53,54,55].
One-way inflow methods can potentially have a greater geographic region of influence than two-way flow structures by generating a hydraulic head at the point of inflow which would induce flow down-gradient toward the pre-existing inlets and back into the ocean. This added flow will enhance circulation, bringing in a new supply of salt water from the ocean which would also alter the chemistry and the bio-geochemical processes that sequester and remove nutrients from the system.
With the goal of improving water quality, these management and engineering projects have taken two approaches: (1) improve water quality directly through mixing, bringing in water from the coastal ocean, and (2) relying on decreased concentrations of dissolved nutrients in the exchanged water to decrease the growth and proliferation of harmful algal blooms helping to restore ecosystem services. Decreased algae, fewer instances of hypoxia, and increased biodiversity resulting from seawater exchanges contribute to sustaining and further improving water quality by promoting and restoring natural biogeochemical removal processes. In addition to enhancing nutrient removal, hydrological engineering has also promoted the development and growth of mangroves, seagrasses and associated benthic communities [16,17,18,32,44,56]. These habitats are vital to the coastal environment, helping to maintain water quality through the filtration and removal of nutrients through burial or removal to the atmosphere [16]. The restoration of these ecosystem services is fundamental to remedying the underlying causes of water quality issues and leads to the removal of nutrients from the ecosystem without simply exporting them to adjacent areas.
In shallow coastal systems, including the IRL, seagrass abundance is often cited as a long-term indicator of water quality; with a decline in water quality throughout the system, the loss of seagrasses has become more apparent, indicating a loss of biological integrity in the lagoon [14].
As with any engineering project, it is important to clearly define the end goals so that each step of the process can be evaluated. Existing projects in India [57], Netherlands [24], New Zealand [58], China [59], Australia [39,60], Denmark [17], Portugal [61], and in the United States of America in Florida [22], New York [31,32,33], and California [62] can provide guidance as coastal communities seek effective and beneficial methods for combatting eutrophication. The goal of each project was to improve water quality as defined by meeting specific objectives, which vary by study and location. Most projects were focused on improving a combination of parameters, e.g., increasing water clarity/decreasing turbidity, decreasing/stabilizing temperature, increasing/stabilizing salinity, increasing/stabilizing dissolved oxygen, and decreasing nutrients and chlorophyll concentrations. Success has been measured in terms of changes in the listed environmental variables [24,25,29,39]. In this review, we evaluate system-specific changes to water quality in an effort to identify the characteristics of each system that led to the successful implementation of enhanced seawater exchanges towards improved water quality. In the IRL, one of the main objectives of a potential seawater inflow project would be to decrease nutrient concentrations by promoting natural biogeochemical processes, thereby helping to mitigate algal blooms and hypoxia. To that end, this study focuses on five location examples from systems with similarities to IRL.
The inflow projects reviewed here have experienced varying degrees of improvement in water quality over varied spatial scales. Each of these examples has observed improvements related to a combination of the mixing and restoration of ecosystem health and ecosystem functioning. For example, healthy estuary systems remove large fractions of external nitrogen and phosphorus loading before water is discharged to the coastal ocean [63]. As ecosystem health declines, the ability of coastal systems to assimilate these nutrients can be degraded, leading to adverse ecosystem-level impacts, even with no appreciable change in external nutrient loading [64]. These changes reflect the non-linear trajectory of ecosystem functioning, where feedback loops accelerate ecosystem decline or recovery. For example, biogeochemical processes responsible for the assimilation of nitrogen and phosphorus are promoted by seagrasses and other benthic fauna and flora. With respect to restoration, these non-linear responses create opportunities where projects such as inflow or enhanced circulation can have improvements in water quality that exceed those based on mixing alone.

2. Existing Projects

Five locations are selected for a closer examination of water quality metrics, Table 1
1.
Barrier island breech at Fire Island, New York, USA;
2.
Intermittently Closed and Opened Lakes and Lagoons (ICOLLs) in New South Wales Australia;
3.
Hydraulic pumping of ocean water into Destin Harbor, Florida, USA;
4.
Restoring tidal exchange in a coastal lake at Lake Veere, the Netherlands;
5.
Establishing ocean exchange at Ringkobing Fjord, Denmark.
Though there are many more examples of ocean exchange that could have been highlighted, these five locations represent the range of types of projects that exist globally.

2.1. Fire Island, New York, USA

2.1.1. Introduction to the Location

Great South Bay (GSB) is the largest shallow saltwater lagoon in the state of New York situated between Long Island to the Northwest and Fire Island to the Southeast [28], Figure 1. The lagoon, like all barrier island systems, developed naturally from the dynamic actions of wind, waves, and tides; these dynamic changes include breaches and island migration as sediment is moved [29]. Despite remaining a productive ecosystem, the waterbody has experienced negative impacts due to anthropogenic activities beginning in the late 1800s. A decline in water quality became more apparent following the 1950s as increased nutrient concentrations caused recurring harmful algal blooms, threatening the system’s habitats, specifically the shellfish populations [30]. Despite these threats, the estuary supports significant populations of fishes and migratory birds, including a large portion of the North Atlantic’s population of striped bass [28]. Additionally, many species utilize the lower portion of GSB as a nursery, spending early larval stages in the protected and food-rich waters behind Fire Island [28].
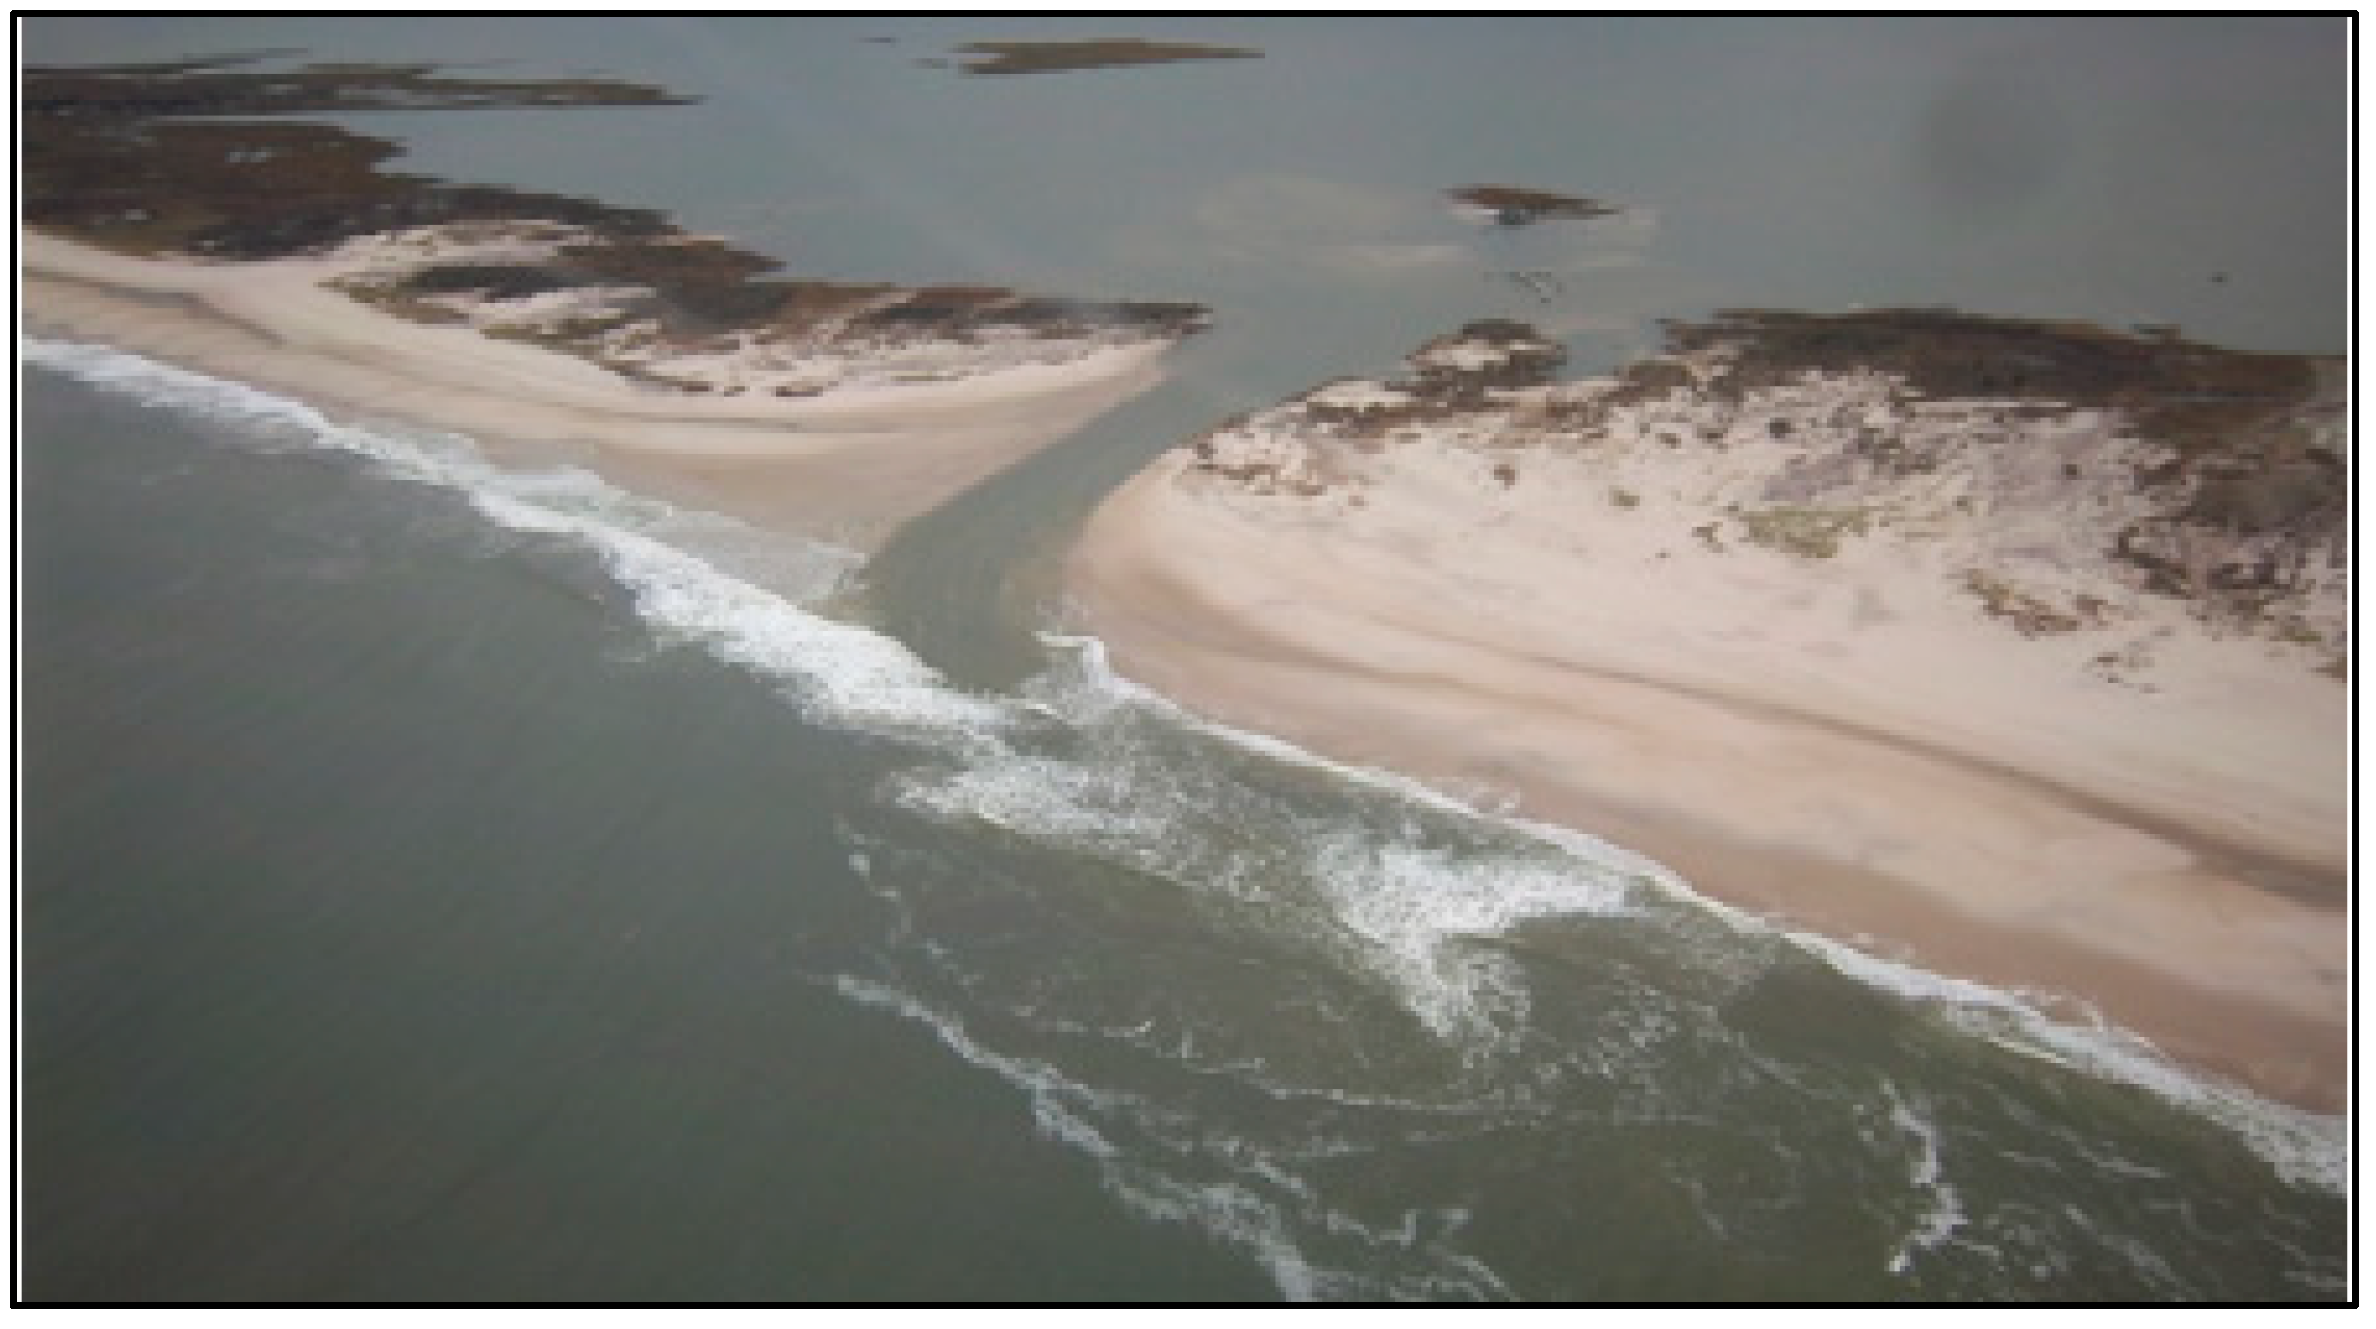
Prior to 2012, the only direct connection from Great South Bay to the Atlantic Ocean was through Fire Island Inlet at the southernmost point of Fire Island [28]. However, the landfall of Hurricane Sandy in late October of 2012 led to the opening of three breaches in the barrier islands on the southern side of Long Island, forming connections between the high saline Atlantic Ocean and the tidally bound GSB [29,34]. The Fire Island Wilderness Breach remained open [32], Figure 2.

2.1.2. Results of the Natural Opening

Agency researchers and scientists decided that no action was to be taken to address the breach unless established criteria were exceeded; for this alternative action, human intervention would only occur to prevent the loss of life or to prevent major economic/physical damage to Great South Bay [70]. To evaluate the impacts of the Fire Island Wilderness Breach, the National Park Service has continuously monitored and modeled how the breach has changed the geomorphology, hydrology, and ecology of the Great South Bay lagoon system [32].
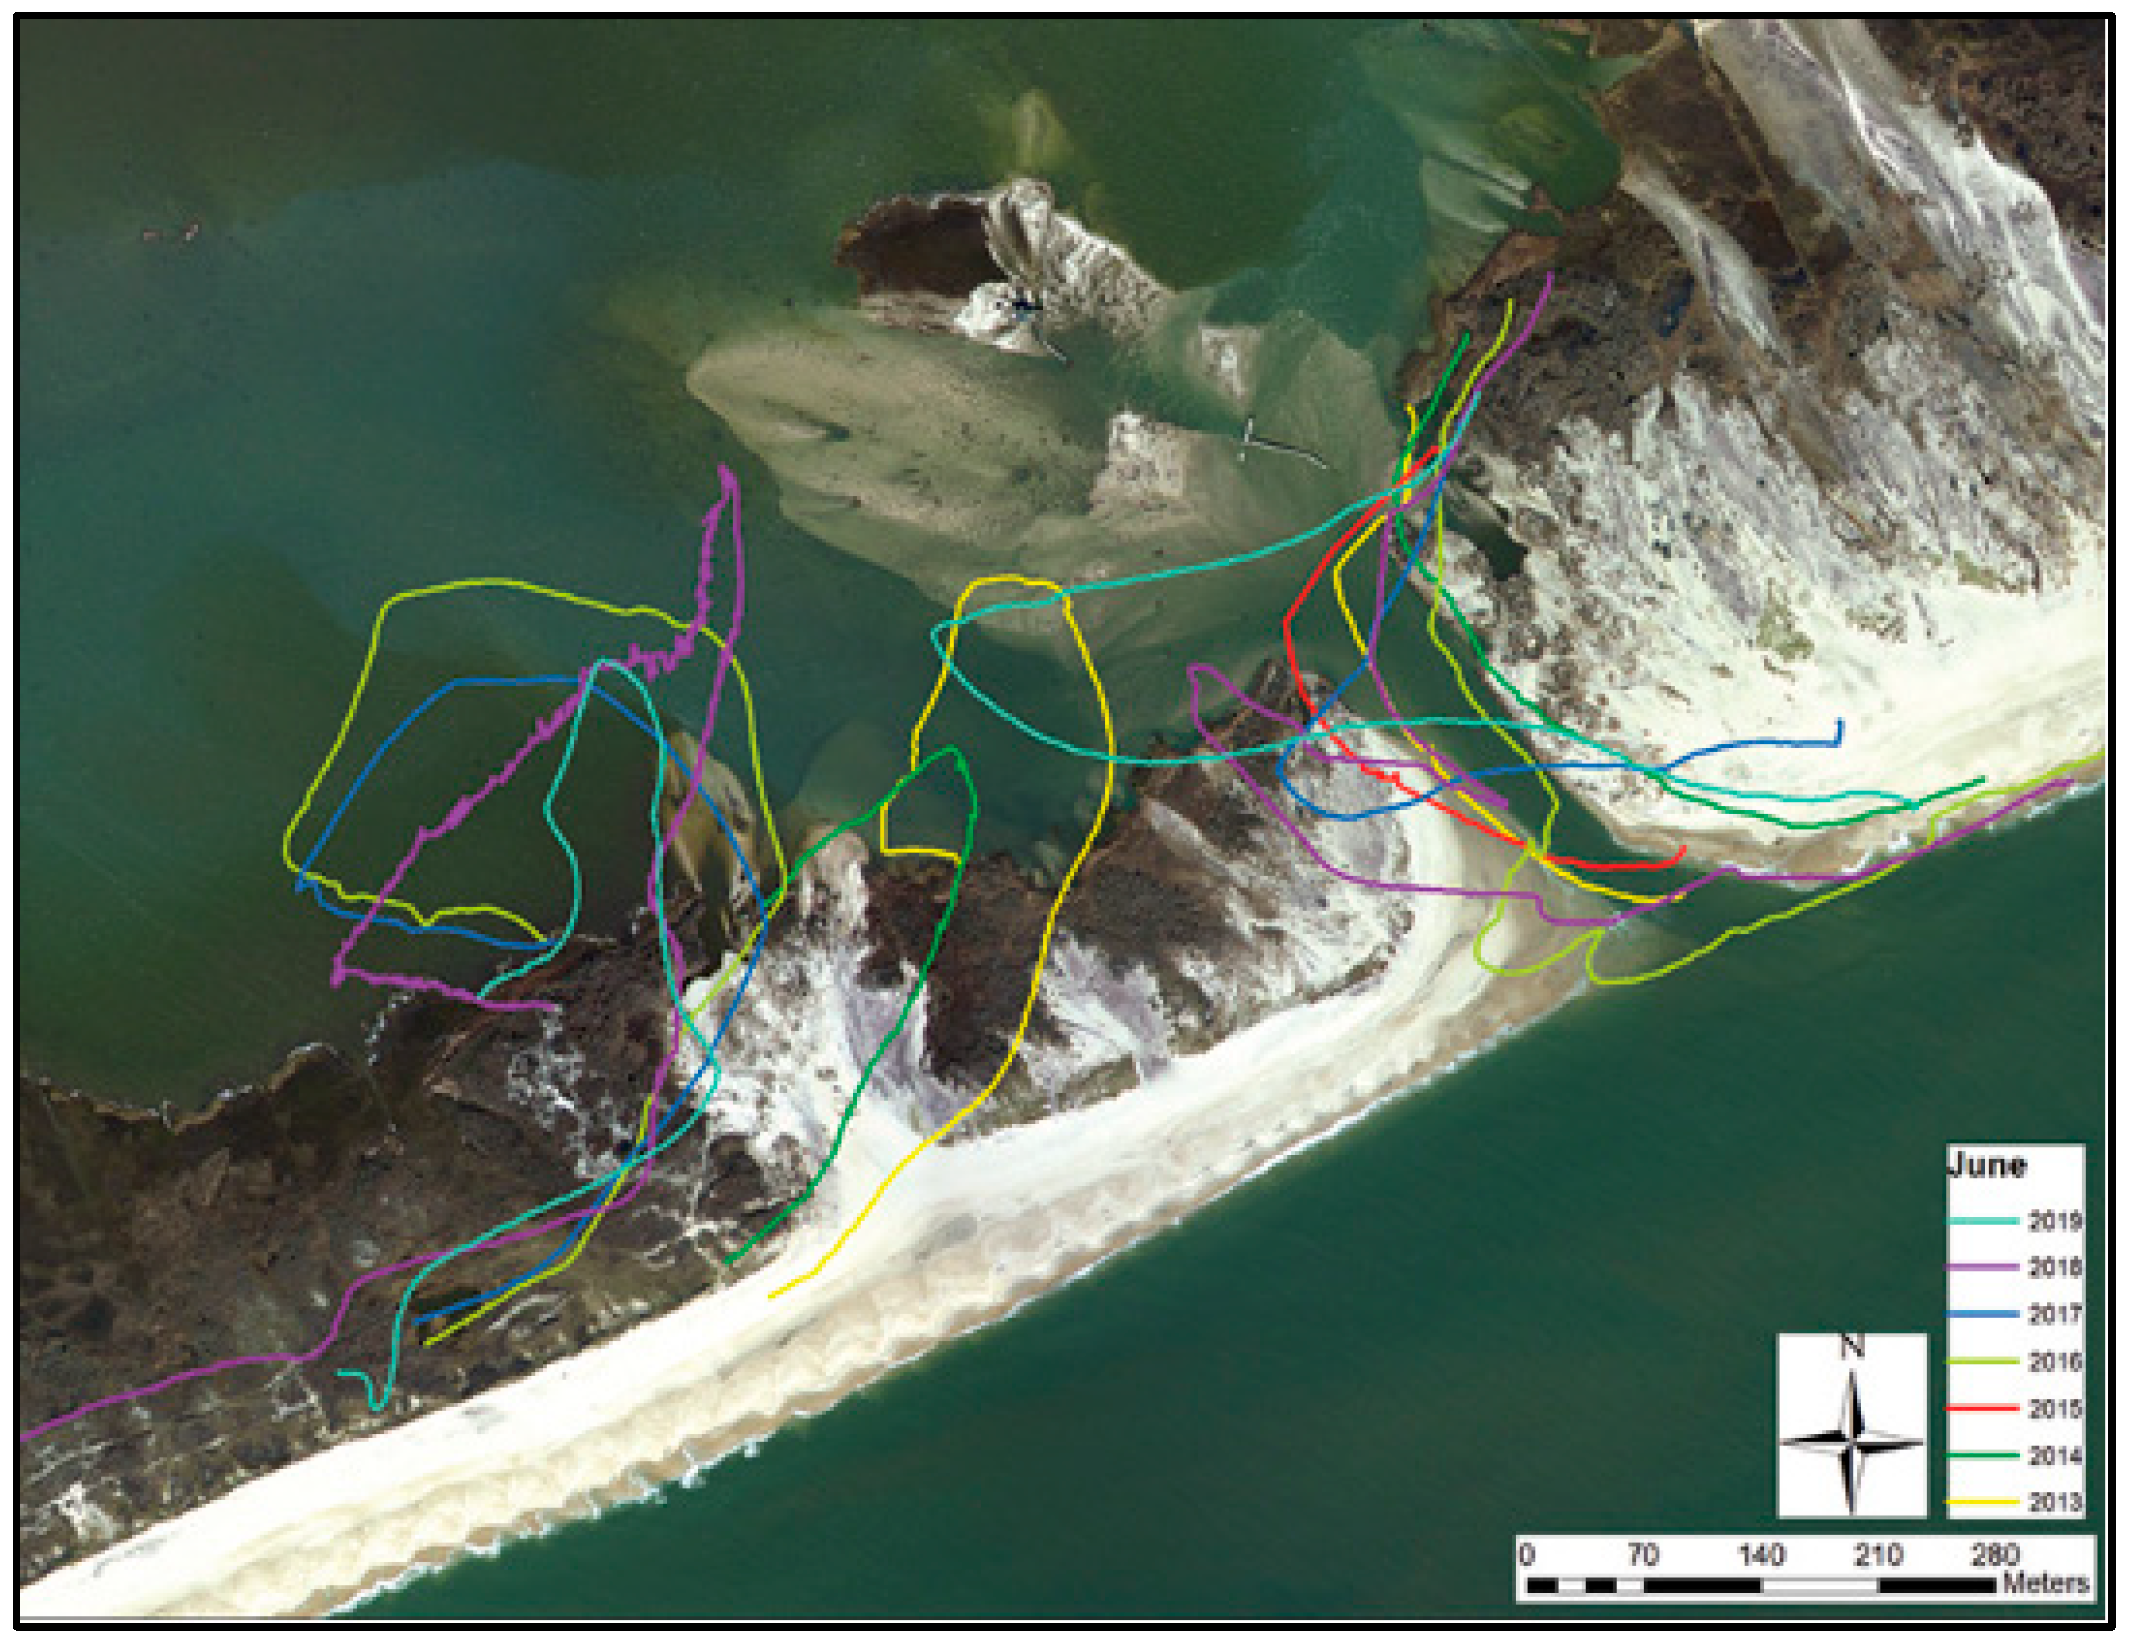
Post-opening monitoring showed that after the initial establishment of flood and ebb shoals, the new inlet continued to migrate in a primarily westward direction, as indicated by the yearly survey lines in Figure 3. [29]. A submerged clay layer on either side of the inlet should reduce further migration and naturally stabilize the inlet; ongoing monitoring has shown that the new inlet is dynamic yet relatively stable [29], Figure 3.
Beyond the physical changes, monitoring indicates ecosystem health improvement in GSB, directly related to the inflow of water from the Fire Island Wilderness Breach [35]. The ocean water flowing through the inlet at high tide is cooler and saltier than the water in GSB. This input of new ocean water into the system correlates to a 1.5 °C (5 °F) decrease in summer water temperatures and a 2–5 increase in salinity [35]. Following the breach, nitrogen levels decreased throughout the lagoon by 0.02 mg/L, and notably, in close proximity to the opening, the levels decreased by 0.2 mg/L [71,72]. The dissolved oxygen level changes were variable based on the proximity to the opening yet demonstrate an overall increase of 1 to 1.2 mg/L when compared to pre-breach levels [73]. These changes in physical water quality indicate that the breach has influenced the hydrodynamic properties of GSB. As a result, the tidal phase is nearly 30 min earlier than before and the residence time of water parcels in GSB decreased by over 58% [35]. Additionally, residence times have reduced from between 50 and 100 days to 40 days, which means cleaner, cooler, and more oxygenated water is being cycled through the breach, contributing to the restoration of ecosystem services including nitrogen cycling and removal [71,72]. With increased ocean exchange, nitrogen, chlorophyll-a, and turbidity levels decreased while the number of brown algal blooms decreased significantly in eastern GSB [29]. These trends demonstrate significant strides in mitigating the eutrophic conditions influenced by local anthropogenic impacts.
An increase in the abundance of seagrass clusters in GSB was observed in connection with the improved water quality of the system. Populations of hard clams, finfish, crabs, and shrimp saw improved growth rates and an increase in abundance in areas of the lagoon near the breach [32]. For example, lady crab populations have increased by 500% in areas adjacent to the breach location [73]. These changes were certainly sparked by improved water quality, but the breach also increased the physical exchange and movement of organisms between the Atlantic Ocean and GSB [29].
The Fire Island Wilderness Breach improved the water quality of GSB, allowing the system to diversify [32]. The new Fire Island Inlet has led to increased salinity, stabilized water temperature, reduced turbidity, decreased nitrogen, and a diversification in species composition [71]. The results from this case study show improved water quality, increased abundances of marine flora and fauna, and the improved health of the coastal lagoon ecosystem. Collectively, these observations and improvements reflect the interactions among variables that contribute to water quality; disrupting the feedback loops that contribute to sustained impaired coastal waters [74]. Nevertheless, spatial variability in the improvements at GSB reflects the limited spatial impact of two-way exchanges.

2.2. Various ICOLLs in New South Wales (NSW), AU

2.2.1. Introduction to the Locations

Intermittently Closed and Opened Lakes and Lagoons (ICOLLs) represent an alternative case study on the topic of ocean water inflow projects. Utilizing two different mechanisms of inflow, natural and artificial openings, ICOLLs with proximity to each other present an opportunity to compare and contrast water quality changes with respect to the inflow mechanism.
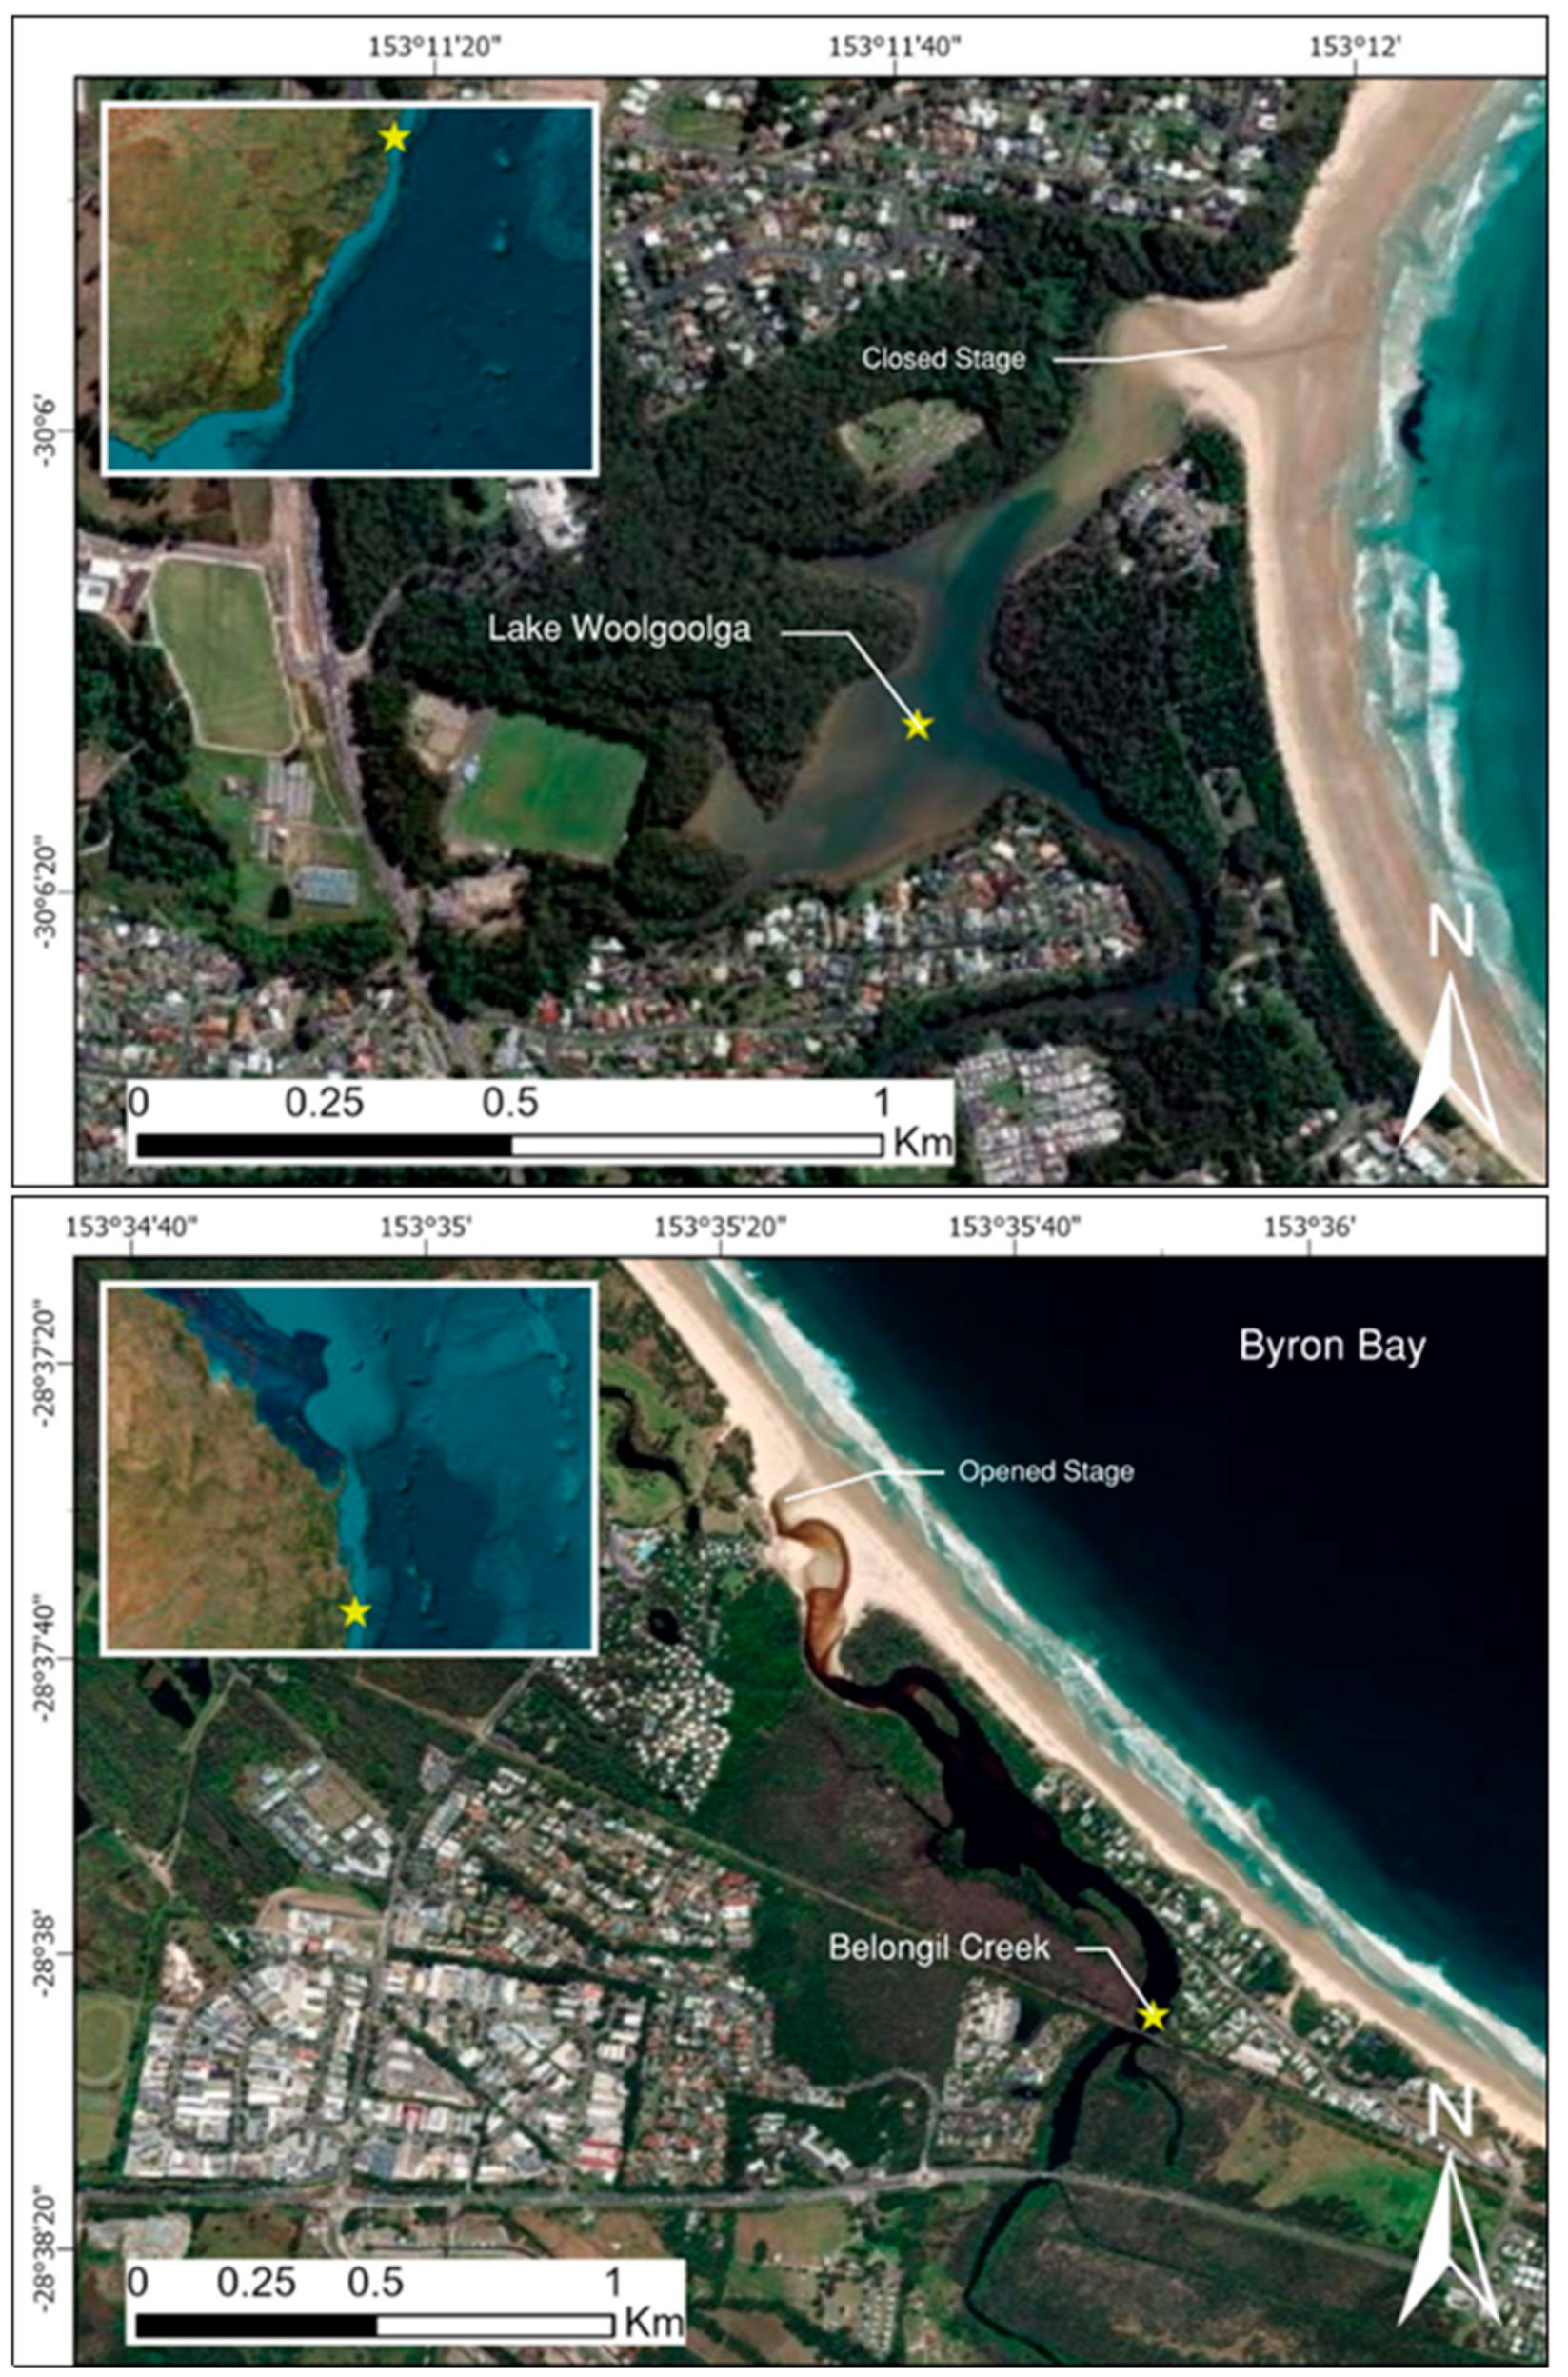
Two morphologically unique ICOLLs in NSW Australia are examined. These locations are Belongil Creek [37] and Woolgoolga Lake [36], Figure 4. ICOLLs in northern NSW are typically small and undergo management to some extent, although opening strategies are fluid and can depend on rainfall levels [39]. Each of the locations were selected specifically to highlight the same water quality standards under changing variables, including the adjacent land use type, total catchment size, current management plans, and opening/closing mechanisms [39].
Belongil Creek is located at −28.63° N, 153.59° E [39,41,42], Figure 5. The creek is an ecologically diverse body of water and a social gathering spot for people living in NSW [37]. Belongil Creek has a catchment area of agricultural, industrial, and residential land but is also a watershed of high ecological value, with many threatened and endangered flora and fauna using the creek as a habitat [37].
Belongil Creek is managed according to the Belongil Creek Entrance Opening Strategy, which was implemented in February of 2020 [41]. The Byron Shire Council decided to utilize a method of adaptive management dependent on many factors, including the water level in the creek, wind speed and direction, swell size and direction, and expected rainfall [42]. The creek openings are facilitated through the mechanical removal of sand separating the higher-salinity ocean water from the brackish water in the creek. The lack of a structure means that the opening location can be changed based on the conditions, mimicking where a natural opening would be expected to occur [42].
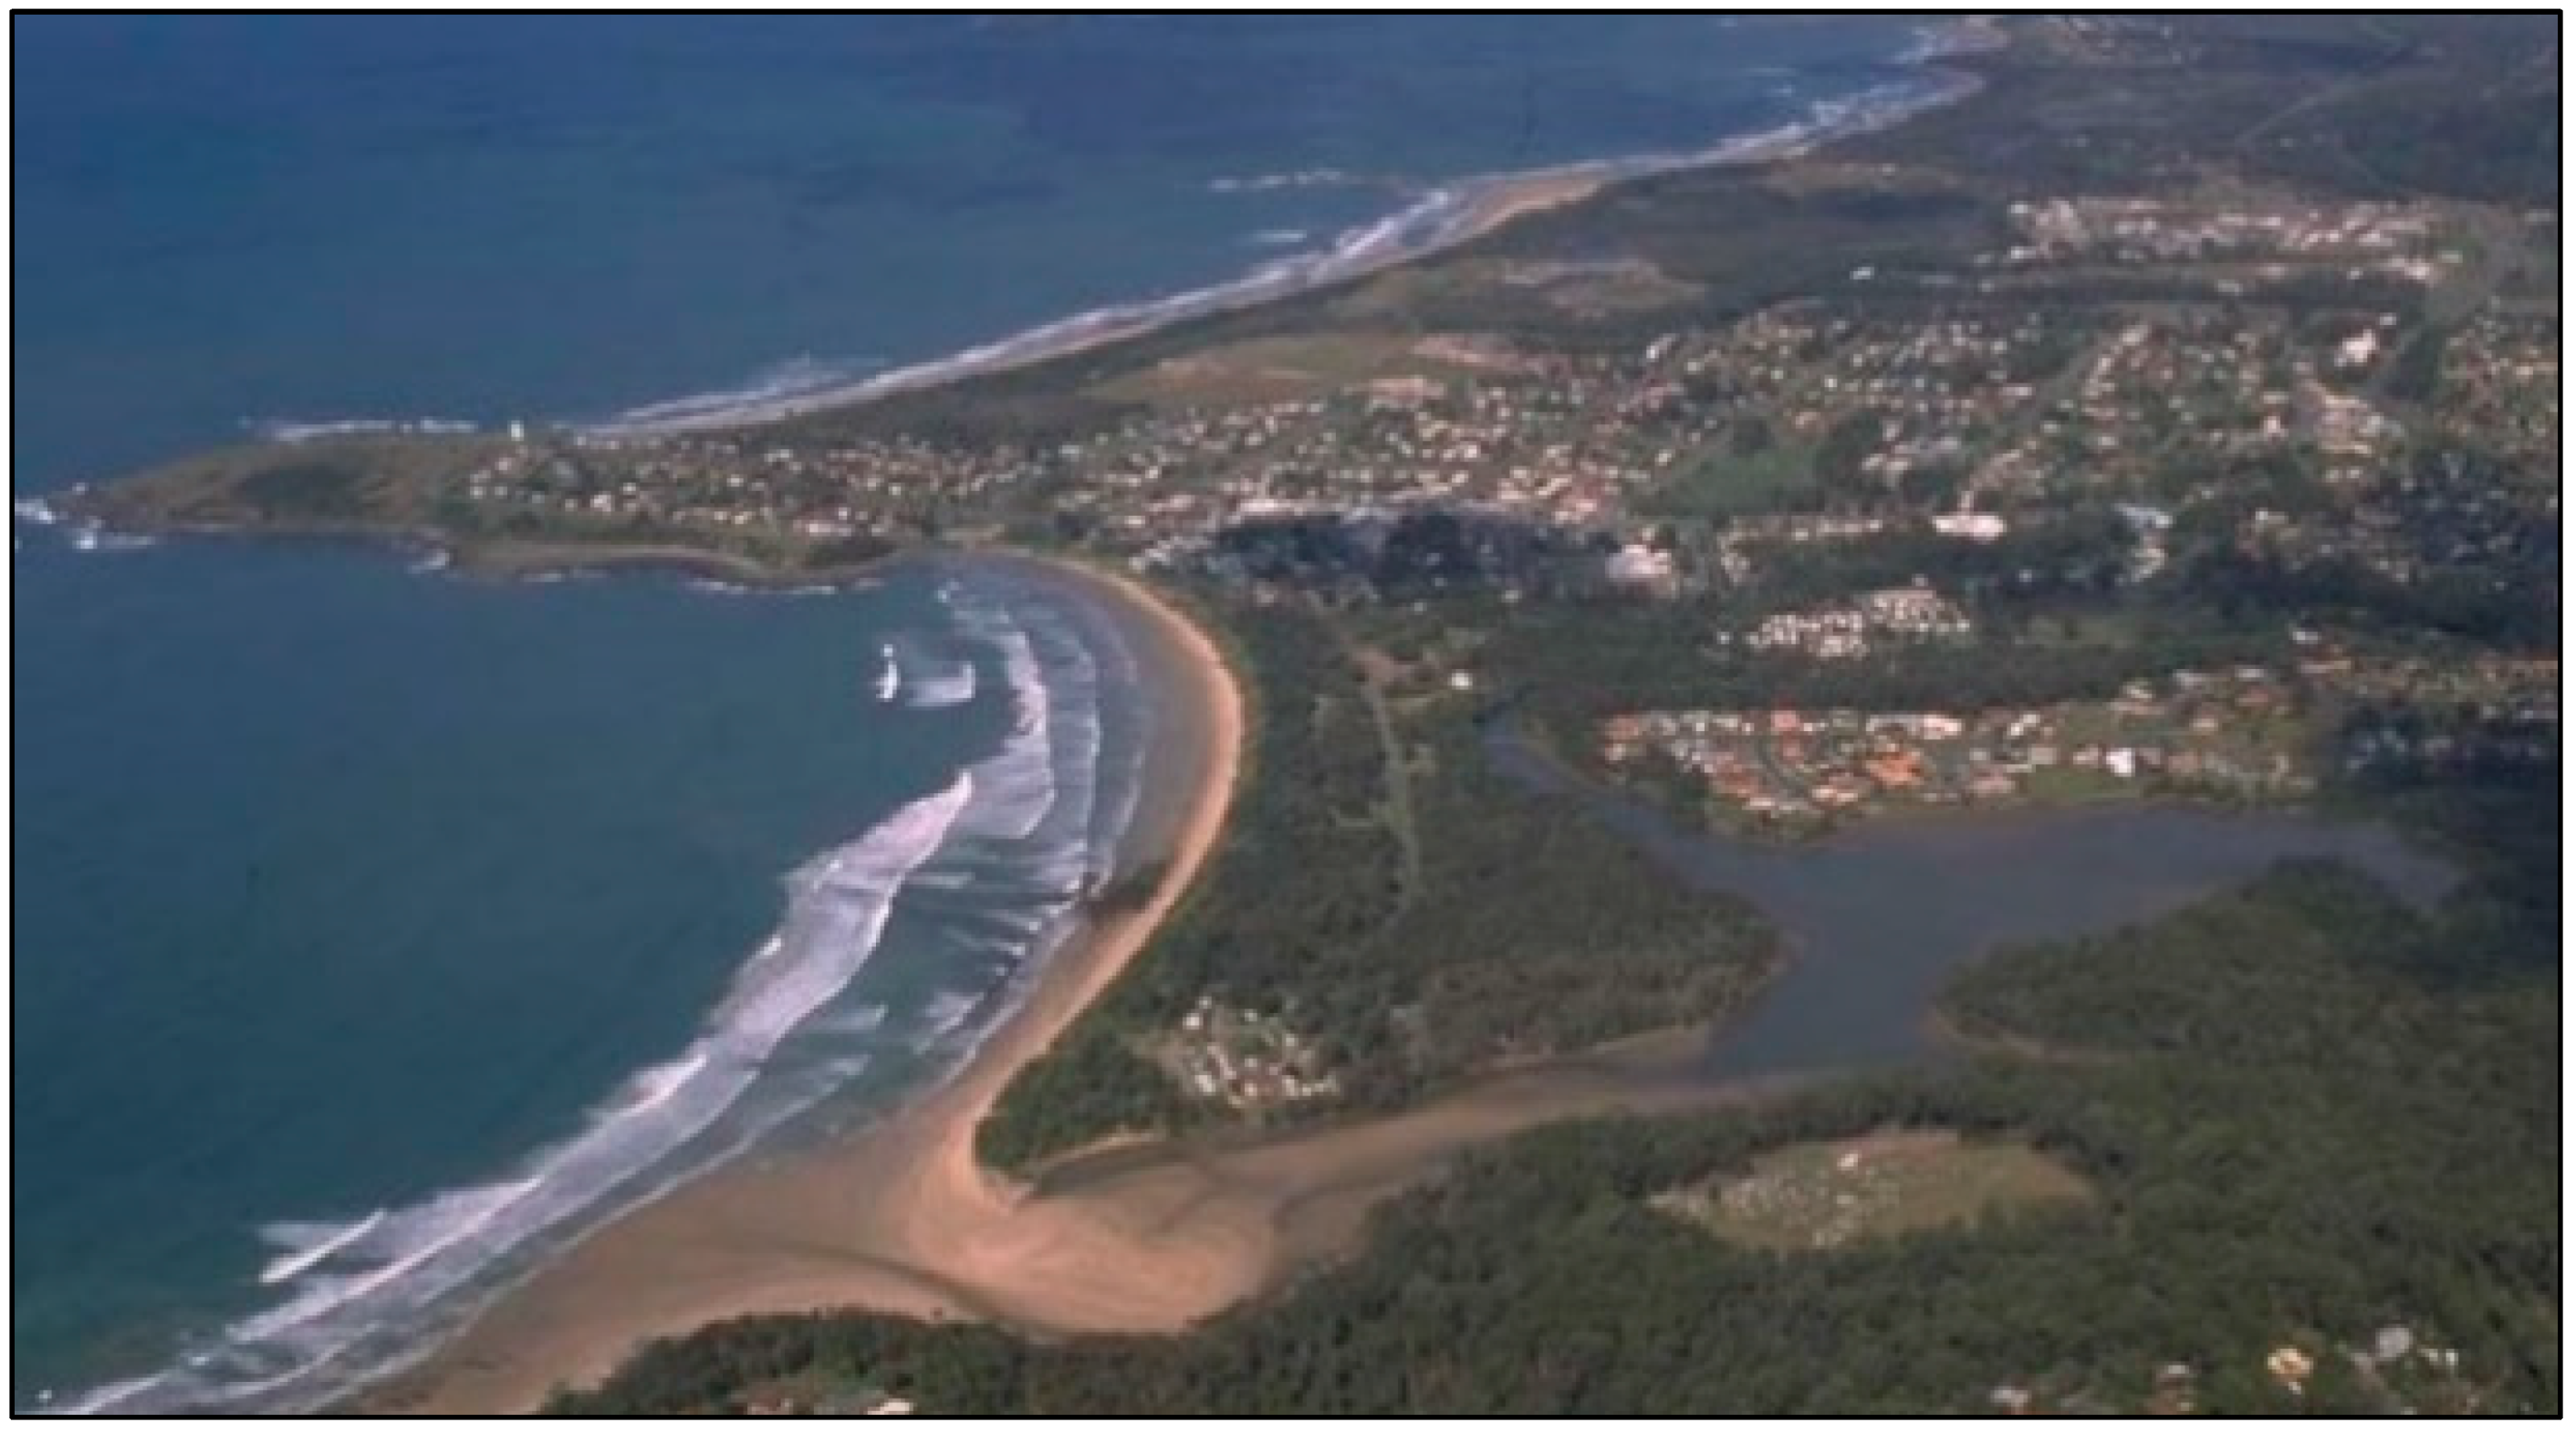
Lake Woolgoolga is located at –30.10° N, 153.20° E with a catchment covered by urban development, grazing land, and managed forests [38,41], Figure 6. Lake Woolgoolga is monitored by Coffs Harbour City Council and the University of New England’s EcoHealth program. As a natural ICOLL, Lake Woolgoolga does not have an opening plan and instead relies on natural processes and water levels both within the estuary and on the ocean side of the berm. With a large catchment area, Lake Woolgoolga water levels often rise rapidly and overtop the naturally formed berm, leaving hydrodynamic forces to scour a channel to the higher saline water [38]. The water quality in Lake Woolgoolga is tied to recreation and tourism, with improved water health increasing tourist attraction to the area [38]. Both lakes are home to historic and highly degraded leaf oyster reefs. The leaf oyster and associated bacterial communities form a holobiont which serves to remove large amounts of dissolved nitrogen from the water, which can mitigate the effects of nutrient-rich runoff [44].

2.2.2. Results of Artificial Openings at Belongil Creek

The artificially opened ICOLL experienced heavy rainfall prior to the artificial opening and subsequent sampling event. The openings were triggered by rising water levels, with limits set by the Byron Shire Council, which manages these two bodies of water [39]. Each sampling procedure involved, but was not limited to, measuring temperature, salinity, DO, total phosphorus, and total nitrogen. The Belongil Creek sampling regime clearly demonstrated that during the open period, the DO concentration levels were 110–162% higher than when compared to the closed period in each section of the lake [39]. The salinity levels increased significantly in the lake during the opening periods, increasing by as much as 20 ppt [39]. Looking closely at the May artificial opening, the temperature along the entire lake dropped between 3 and 5 °C during the open period [39]. It should be noted that the artificial opening resulted in an initial decrease in the measured DO levels [39], likely caused by the draw-off of more highly oxygenated surface waters and the resuspension of particles and subsequent bacterial metabolism. The low DO event was followed by a recovery of and increase in the measured DO levels as the opened system reached a new equilibrium [39].

2.2.3. Results of the Natural Opening at Lake Woolgoolga

The natural openings of Lake Woolgoolga were triggered by various rain events, causing the water level to rise substantially overtop the shoal. The Lake Woolgoolga sampling regime clearly demonstrated that during the open period, the DO concentration levels were 17–71% higher than when compared to the closed period in the upper, middle, and lower reaches of the slender, winding lake [39]. Additionally, the temperature levels along the entire lake dropped by approximately 5 °C during the open period [39]. It should be noted that in Lake Woolgoolga, opening events happen more often due to a lower berm stopping flow. This means that the opening and subsequent flow out to open water has less of a draw-off effect (e.g., surface oxygenated water discharging and leaving bottom anoxic water), the largest cause of the fish kill events in the artificially opened locations. The salinity levels also increased, although increases were only observed near the mouth of the opening as a natural opening event is a slower process influenced by an upstream increase in freshwater levels from a rain event [39].

2.2.4. Results of Natural Openings (Other)

Though the focus of this review was on the ICOLLs in NSW Australia, there are other examples in the Americas [45,46,47], Africa [48,49], and other regions of Australia [40,50]. In these cases, similar results were seen as those in NSW, where a more frequent natural opening led to immediate and sustained water quality improvements while the artificial opening had an initial decline in water health followed by overall improvement. However, regardless of the opening mechanism for the ICOLL, increased flushing and exchange rates with ocean water led to more favorable ecological conditions with respect to DO, temperature, salinity, phosphorus and nitrogen levels, and turbidity. The temporary adverse impacts associated with artificial openings were attributed to increased turbidity during the mechanical opening process and a draw-off effect of higher oxygenated surface water. The increased turbidity and resuspension of sediments contributed to microbial respiration and decreased dissolved oxygen and hypoxia. These hypoxic events were short-lived. Once the water equilibrated, increasing ocean exchange yielded improvements in water quality.

2.3. Destin Harbor, Florida, USA

2.3.1. Introduction to the Location

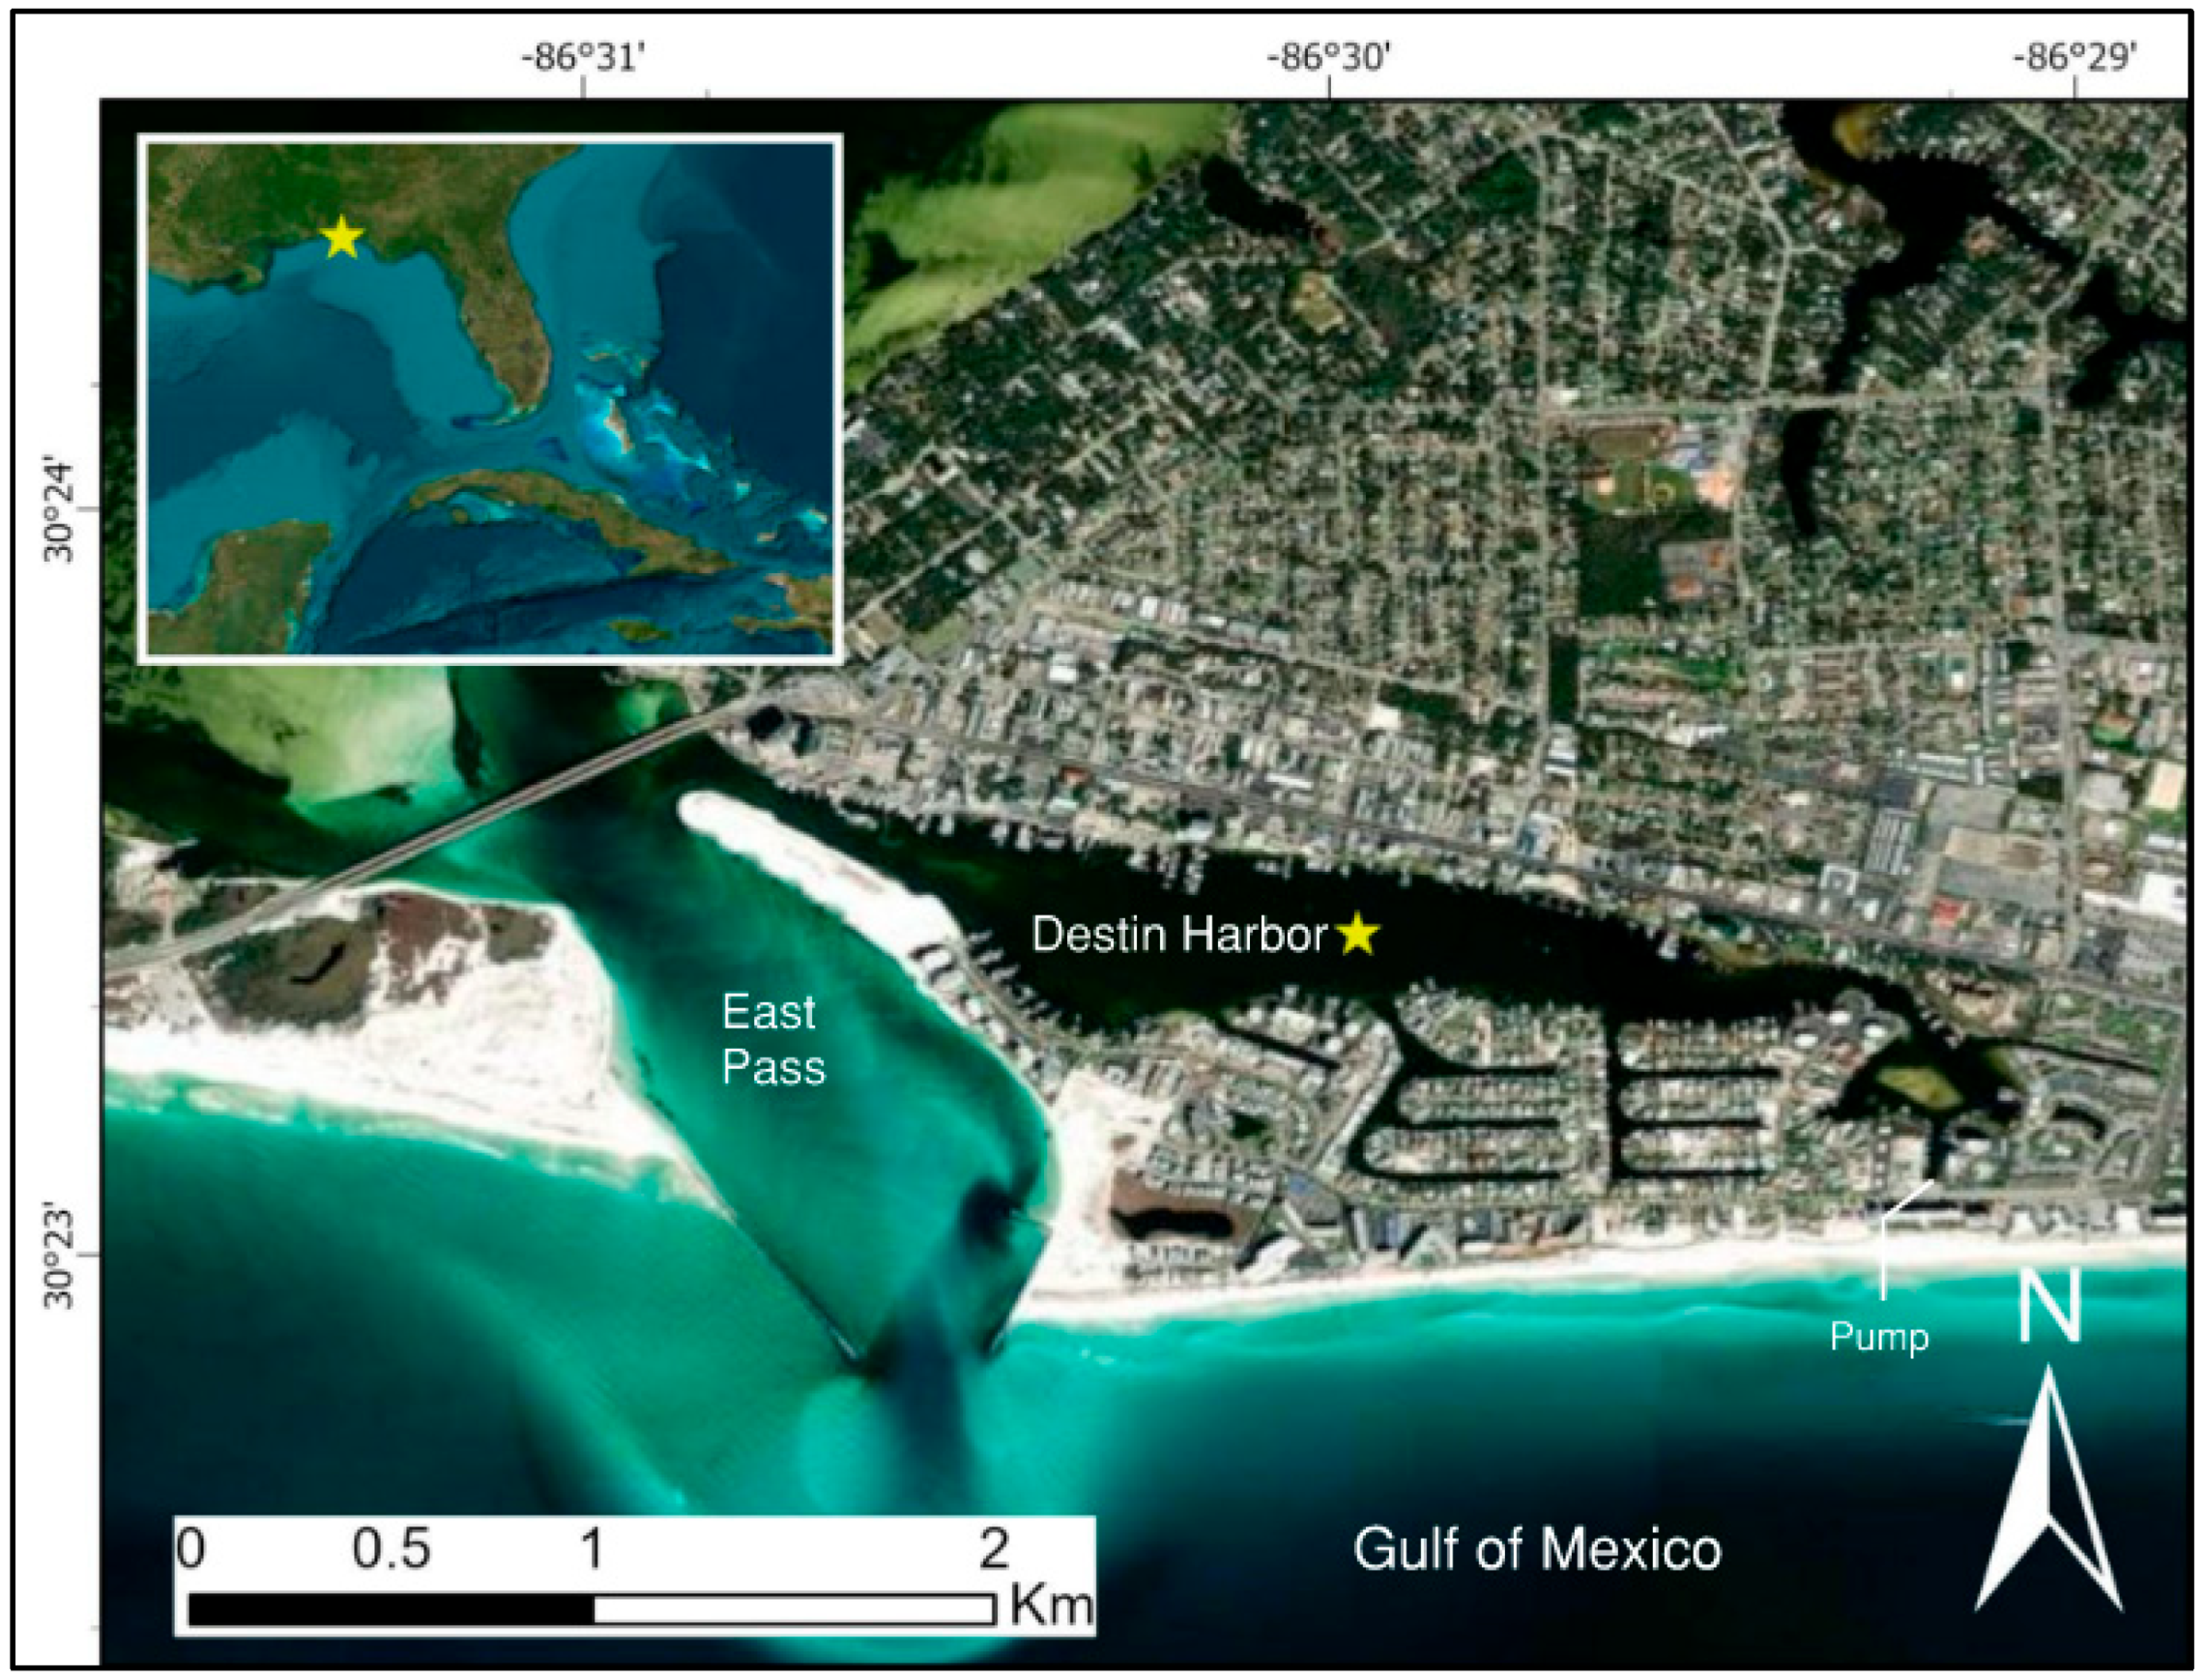
Destin is a popular city in the Florida Panhandle that has a coastline along the Gulf of Mexico. The Destin Harbor, a lagoon located within the city limits of Destin, originally served as a connection between the Gulf of Mexico and the Choctawhatchee Bay [22]. The original East Pass, or Old Pass, which was initially opened by locals during a flooding event in 1929, was closed by a hurricane and storm activity in 1930, and in 1931, a channel, East Pass, was mechanically opened to the west of Destin Harbor, Figure 7. For the next 30 years, the US Army Corps of Engineers maintained and strengthened this channel with jetties, widening, and dredging [22]. A channel was later dredged to allow for boat access from Destin Harbor into the East Pass channel [22]. Although the Destin Harbor is connected to the Gulf of Mexico via East Pass, natural circulation is restricted and the inside of the harbor was poorly flushed, with high residence times, especially in the eastern portions of the harbor and in the residential canals, Figure 7.
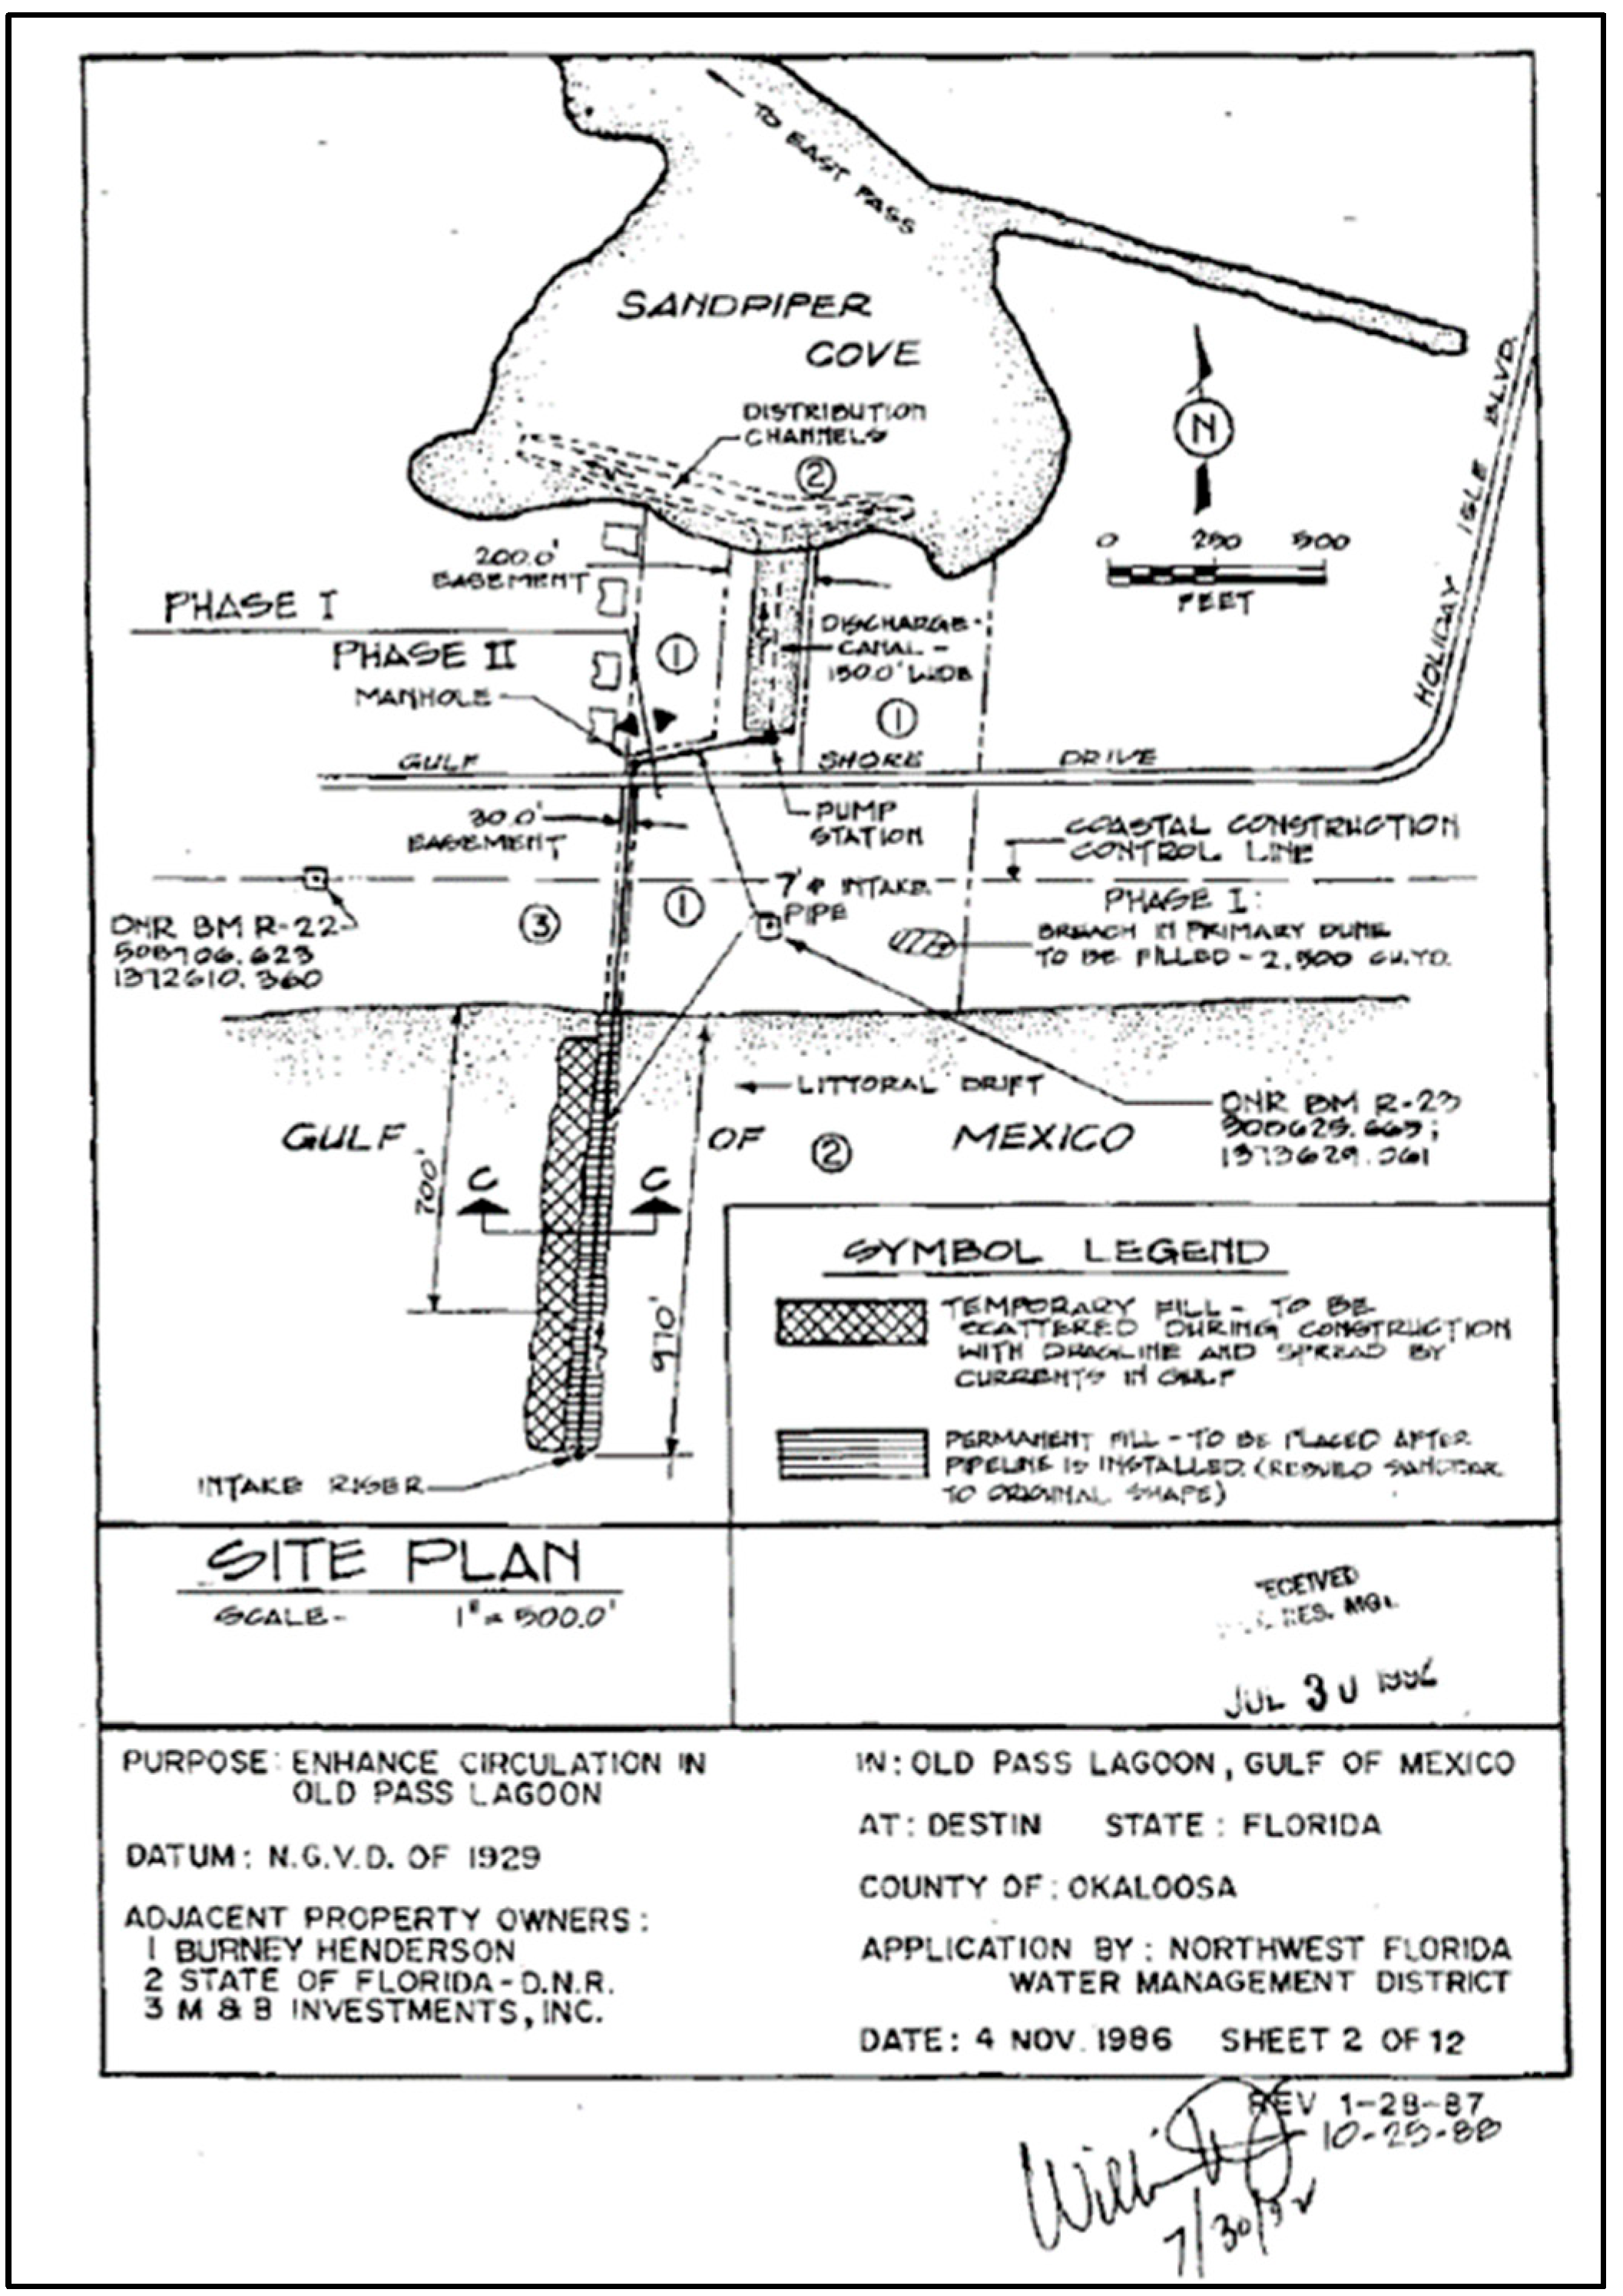
Residential construction booms and infrastructure expansion in the 1960s, 1970s, and 1980s put strain on the stormwater facilities and led to discharges of untreated water into portions of the harbor that already experienced poor circulation. Combined with increased boating activity, water quality within the harbor degraded rapidly, marked by an extended fish kill event in the harbor in the fall of 1982 [22]. In 1984, the Northwest Florida Coast Resource Planning and Management Committee was created and charged with creating policies to address development and its effects on the environment, with a subcommittee designated to address water quality issues within Destin Harbor. The Destin Harbor Management Plan, written in 1987 by Landers-Atkins Planners, Inc., provided a comprehensive plan recommending the best methods for alleviating the water quality deterioration occurring in the waterbody, and one of the major recommendations was the implementation of the Northwest Florida Water Management District’s flushing pipe and pump system [22,75], Figure 8.
The Destin Harbor Pump Project was constructed in two phases and completed in 1992 for a total of USD 3.3 million; phase one included the construction of the pump station and phase two included the construction of the Gulf intake structure and the piping [20]. During the warmer months from April to November, the pump system is operated daily during the hours of 11 p.m. to 7 a.m., bringing in close to 22 million gallons of low-nutrient water from the Gulf of Mexico every night [19]. When the pump is not running, Gulf water is still able to flow into the Harbor, forced by the tides since the gates on the discharge weir remain open year-round.

2.3.2. Results of the Intervention

The implementation of the Destin Harbor Pump Project was seen as a success in its ability to contribute to the improvement of the Harbor’s water quality; the regular flow of Gulf water allows for greater water circulation inside of the restricted lagoon [20]. The water inside of the Harbor is tested in eight different locations annually for its dissolved oxygen, salinity, water clarity, fecal and total coliform, and nutrient content. Since the implementation of the pump system, the Destin Harbor has maintained the Class III Surface Water Quality Standard, meaning the basin is safe for fish consumption and is able to support the recreation and sustain a healthy population of fish and wildlife [20,21,76]. It has also maintained acceptable levels of dissolved oxygen, salinity, and water clarity, and there have been no additional fish kills [19].

2.4. Lake Veere, the Netherlands

2.4.1. Introduction to the Location

Lake Veere is an artificially managed lagoon, located at 51.55° N, 3.89° E in the Netherlands [23] Figure 9. Prior to 1961, Lake Veere in Southwestern Netherlands was a tidally connected estuary that experienced a daily exchange of saline water with the North Sea through the Dutch Delta [24]. However, as a response to heavy flooding in 1953, Lake Veere’s inlet was closed and the area was turned into a brackish lake with no water exchange [24]. The lake was used as a catchment area for nutrient-rich runoff from surrounding crop fields. Upon this closing, water salinity dropped from 29 to 18, which marked a transition from a thriving ecological basin to a eutrophic brackish lake [25]. From the 1960s to the 1980s, the lake experienced a rise in eutrophic conditions including an increase in turbidity and the occurrence of anoxic conditions due to strong stratification [23]. Additionally, there was a shift in the dominant flora from Zostera marina seagrass to macroalgae, primarily Ulva lactura [26]. The lake was described as having poor water transparency, high nutrient levels, and frequently occurring anoxic areas.
It was these changes in water quality that led to the Dutch government’s decision to reconnect Lake Veere to the North Sea, which would reintroduce tidal dynamics to the water basin [24]. In 2004 the Katse Heule, a water gate installed in the dam on the eastern side of the lake, was constructed, which formed the connection from Lake Veere to the Eastern Scheldt, Figure 10.

2.4.2. Results of the Intervention

In the period after the closure of the Veerse Gatdam but prior to the opening of the Katse Huele, the salinity of Lake Veere had a net drop from 29 to 18 [25]. This decreasing saline water resulted in large die-offs of M. edulis and Zostera marina [27]. Combined with restricted flushing rates, eliminated tidal influence, and continued population growth in surrounding areas, excess nutrients in Lake Veere’s water led to massive green and blue-green algal blooms.
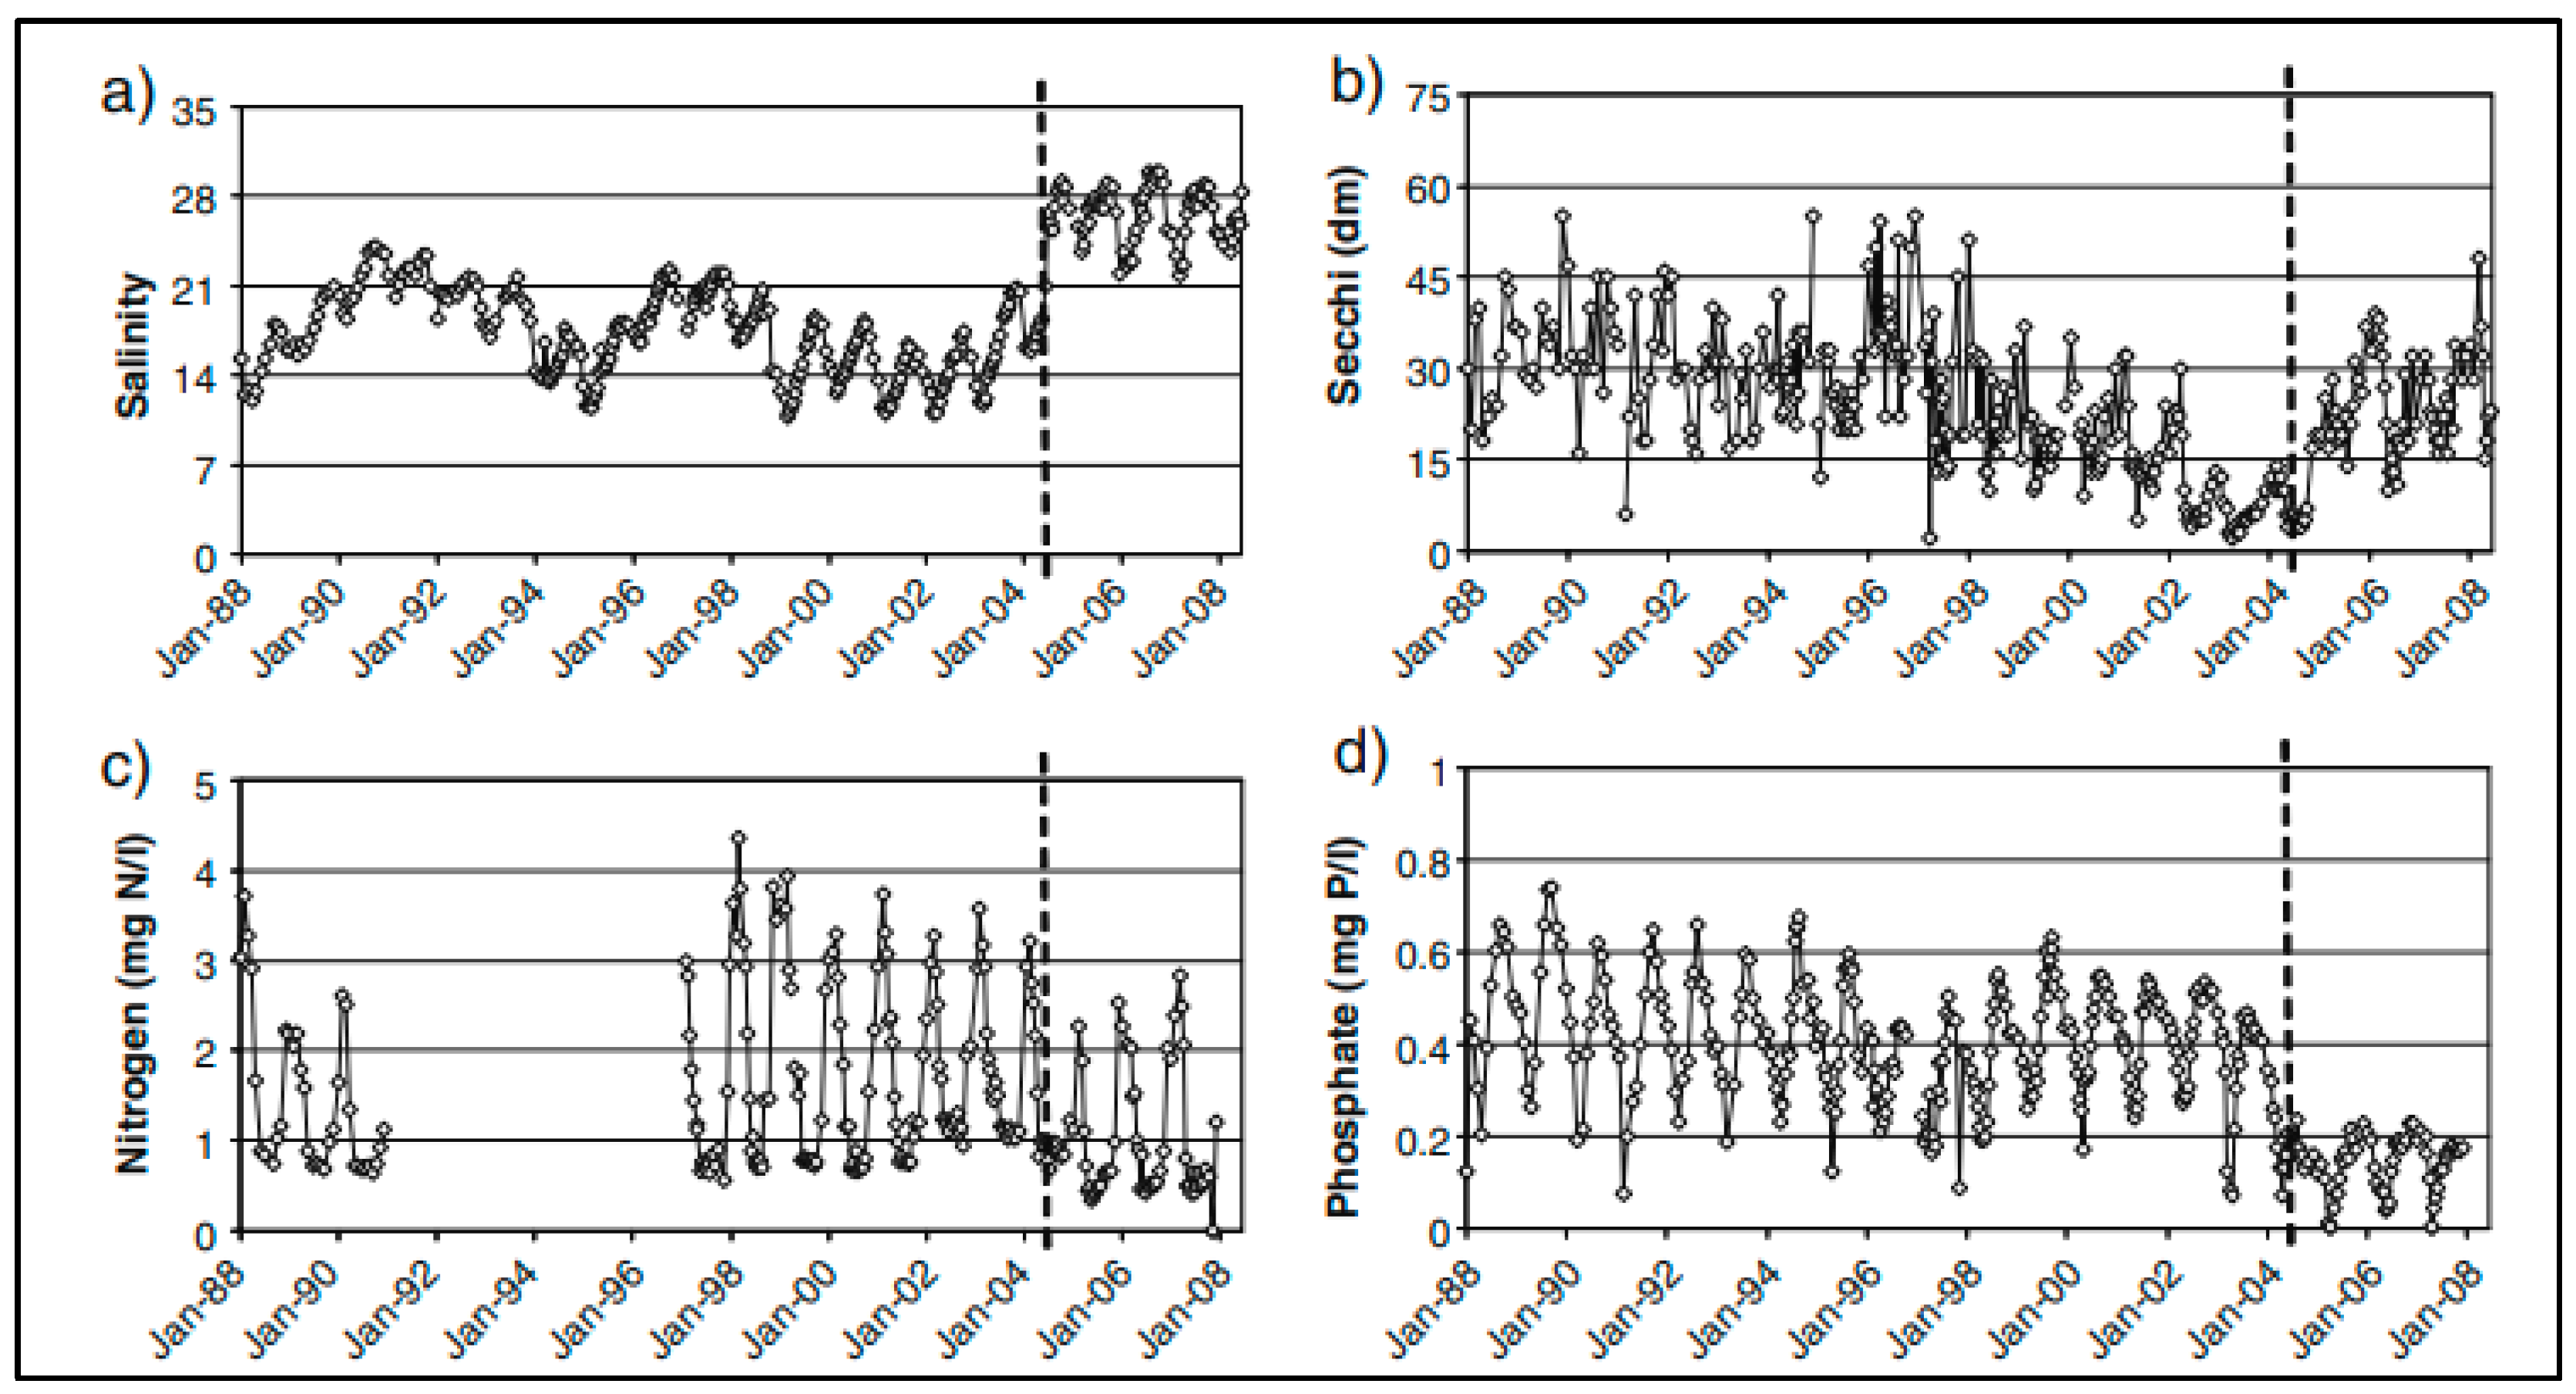
The opening of the Katse Heule led to immediate changes in water quality, including an increase in salinity but also an increase in the vertical mixing of the water column [27]. Measured changes in nutrient levels—specifically, dissolved phosphorus—and water clarity were visible in the first year after the opening, Figure 11. Salinity also experienced immediate changes after the opening, directly related to the inflow of cleaner and higher-salt-concentration water from the North Sea [24]. Another large improvement included the increase in dissolved oxygen levels, with anoxic and hypoxic conditions nearly eliminated [24]. Reflecting improved oxygen conditions, seasonal variations in dissolved phosphate were diminished after the opening, most likely related to decreased instances of seasonal hypoxia and the release of exchangeable phosphorus [77]. The shift from previously poorly oxygenated water is likely due to the increased mixing rates and smaller differences in salinity inside and outside the lake; this variation will continue to decrease as Lake Veere’s water experiences more flushing.
It is important to note that the construction of the Katse Huele did nothing to change the nutrient input for the system but rather the increased flushing rates and more stable dissolved oxygen concentrations allowed the system to more efficiently assimilate external nutrient loading without triggering algal blooms. A direct two-way connection with the North Sea means the nutrient concentrations are lower and the salinity levels are higher, resulting in higher water clarity and fewer and less severe algal blooms. Although the Katse Huele connection did not immediately lead to an increase in macrozoobenthos density and biomass, the improved and higher-saline water quality did spark a species transition [27]. Typical confined lagoon species that mark polluted environments have started to be replaced and outcompeted by species that indicate a healthy ecosystem [24]. This transition demonstrates how increased exchange rates with cleaner, high-saline water improve water quality and support an environment for a productive ecosystem.

2.5. Ringkobing Fjord, Denmark

2.5.1. Introduction to the Location

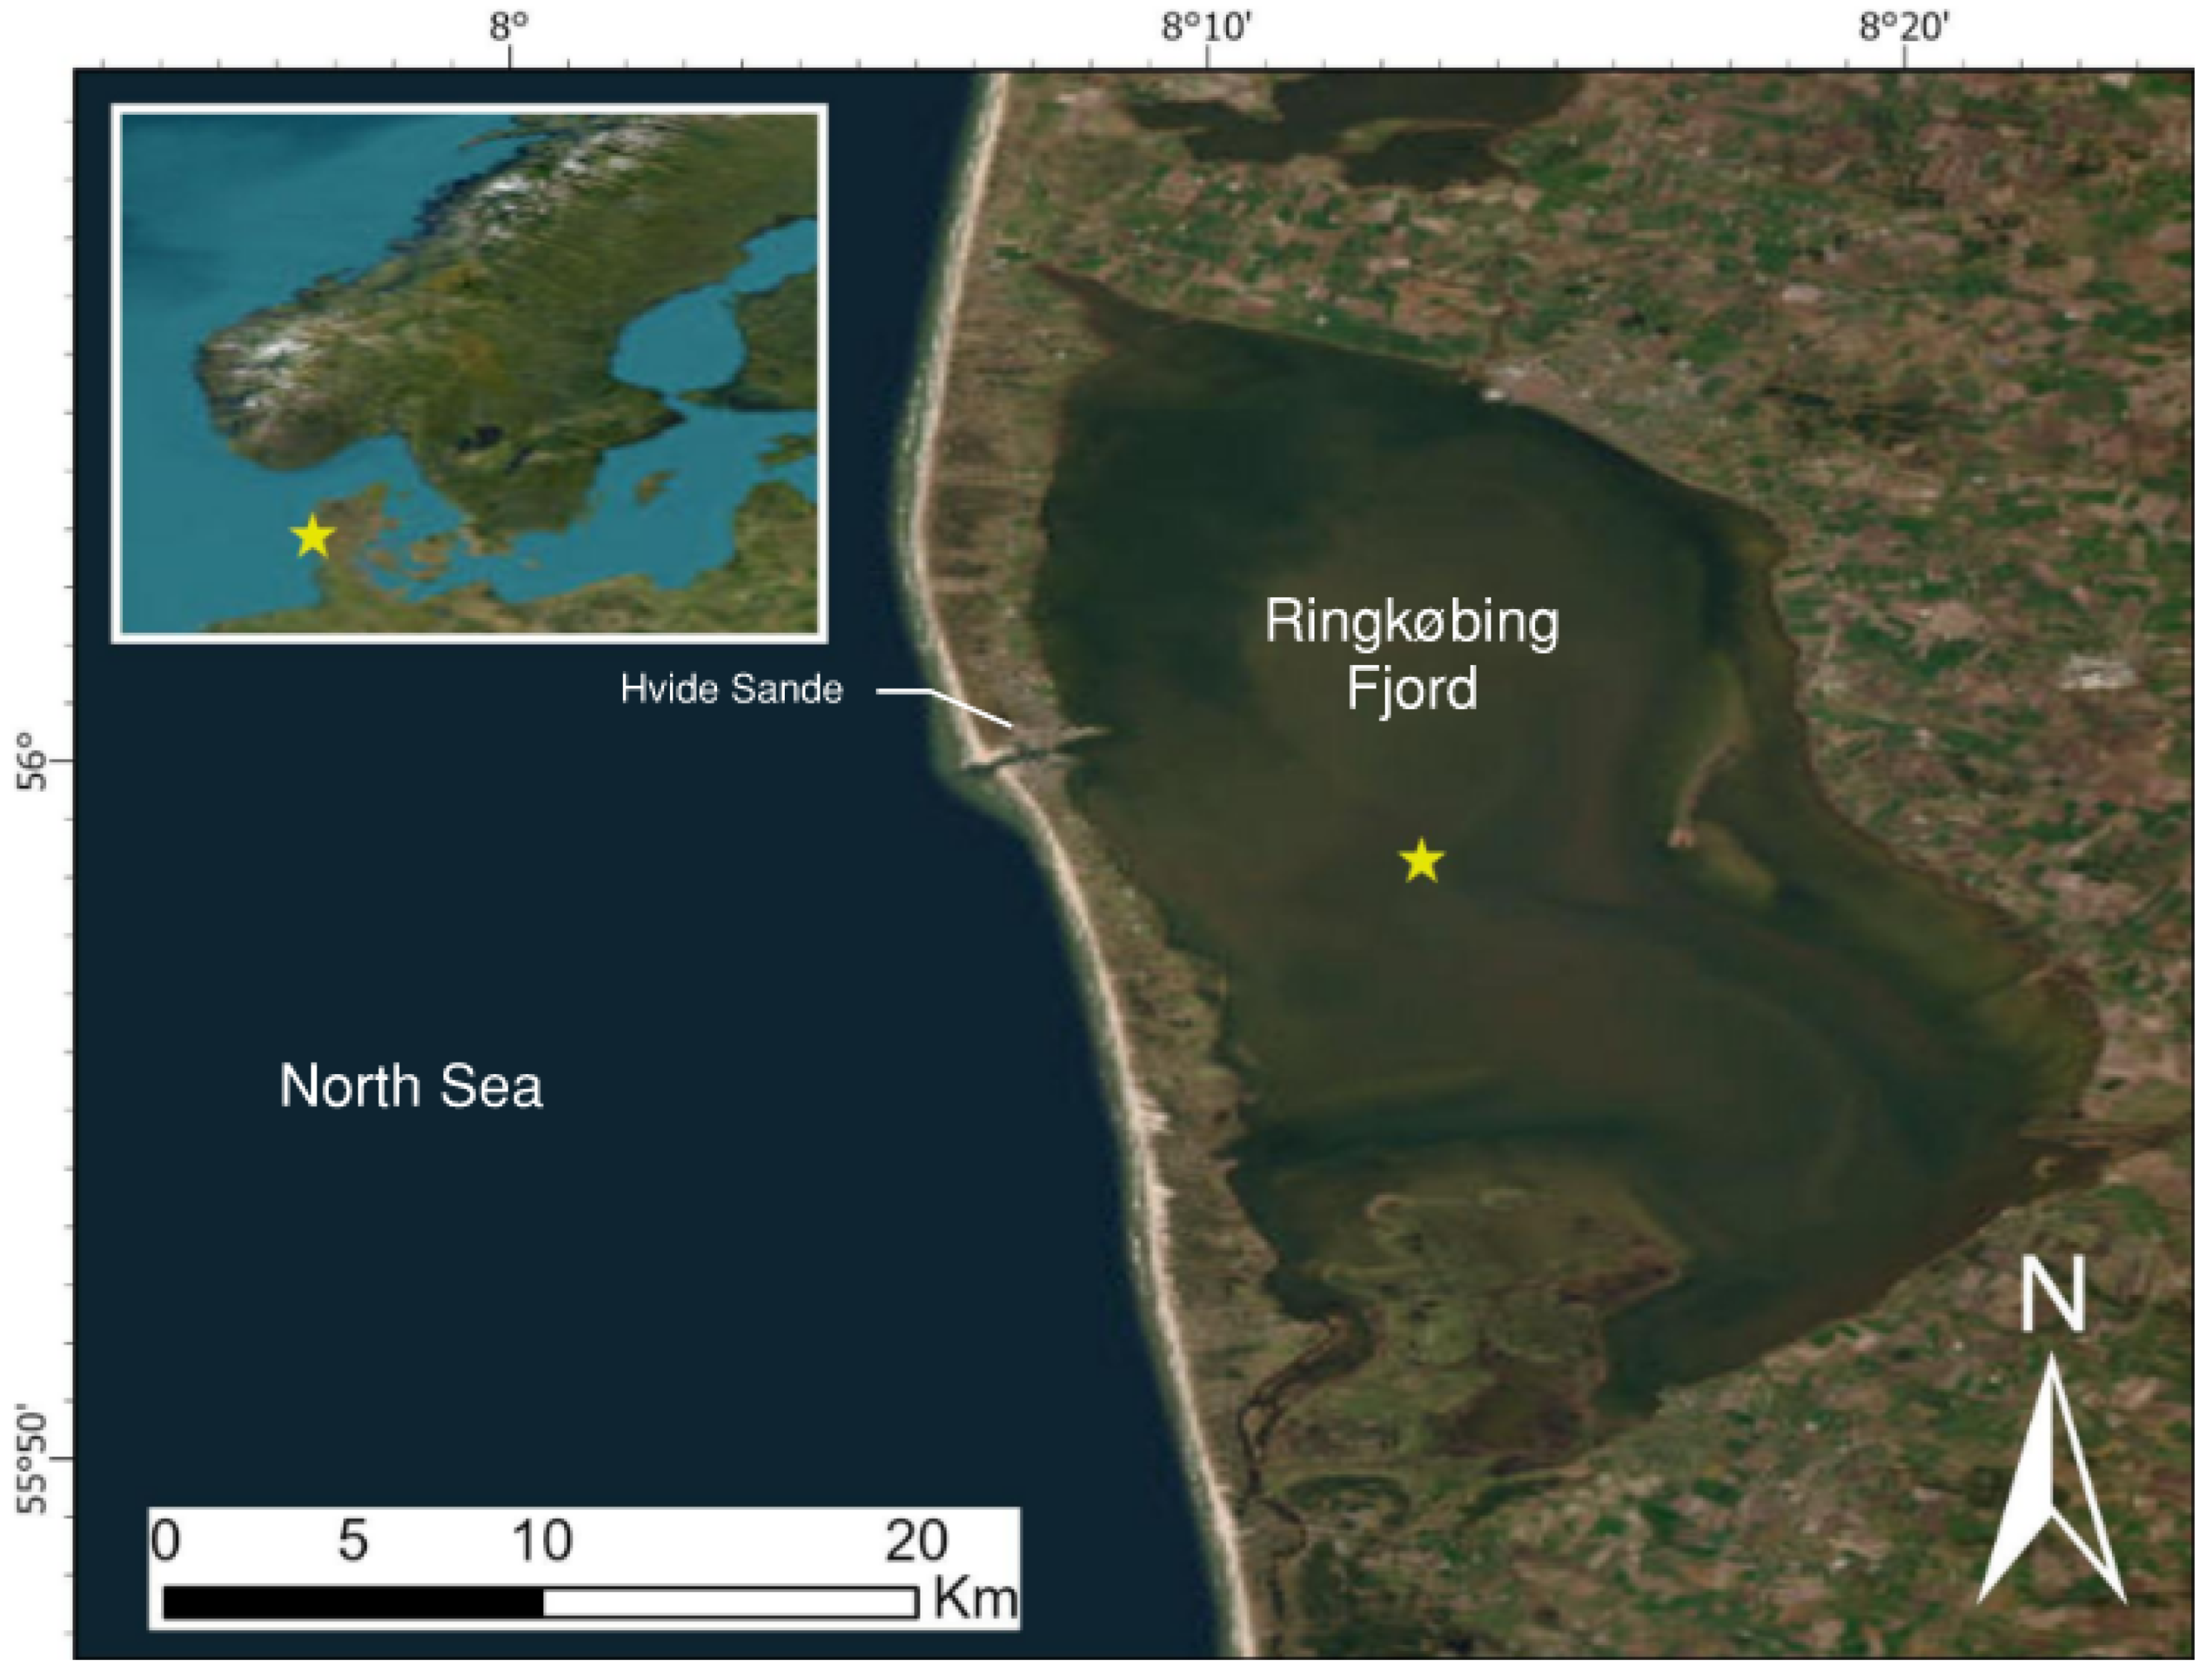
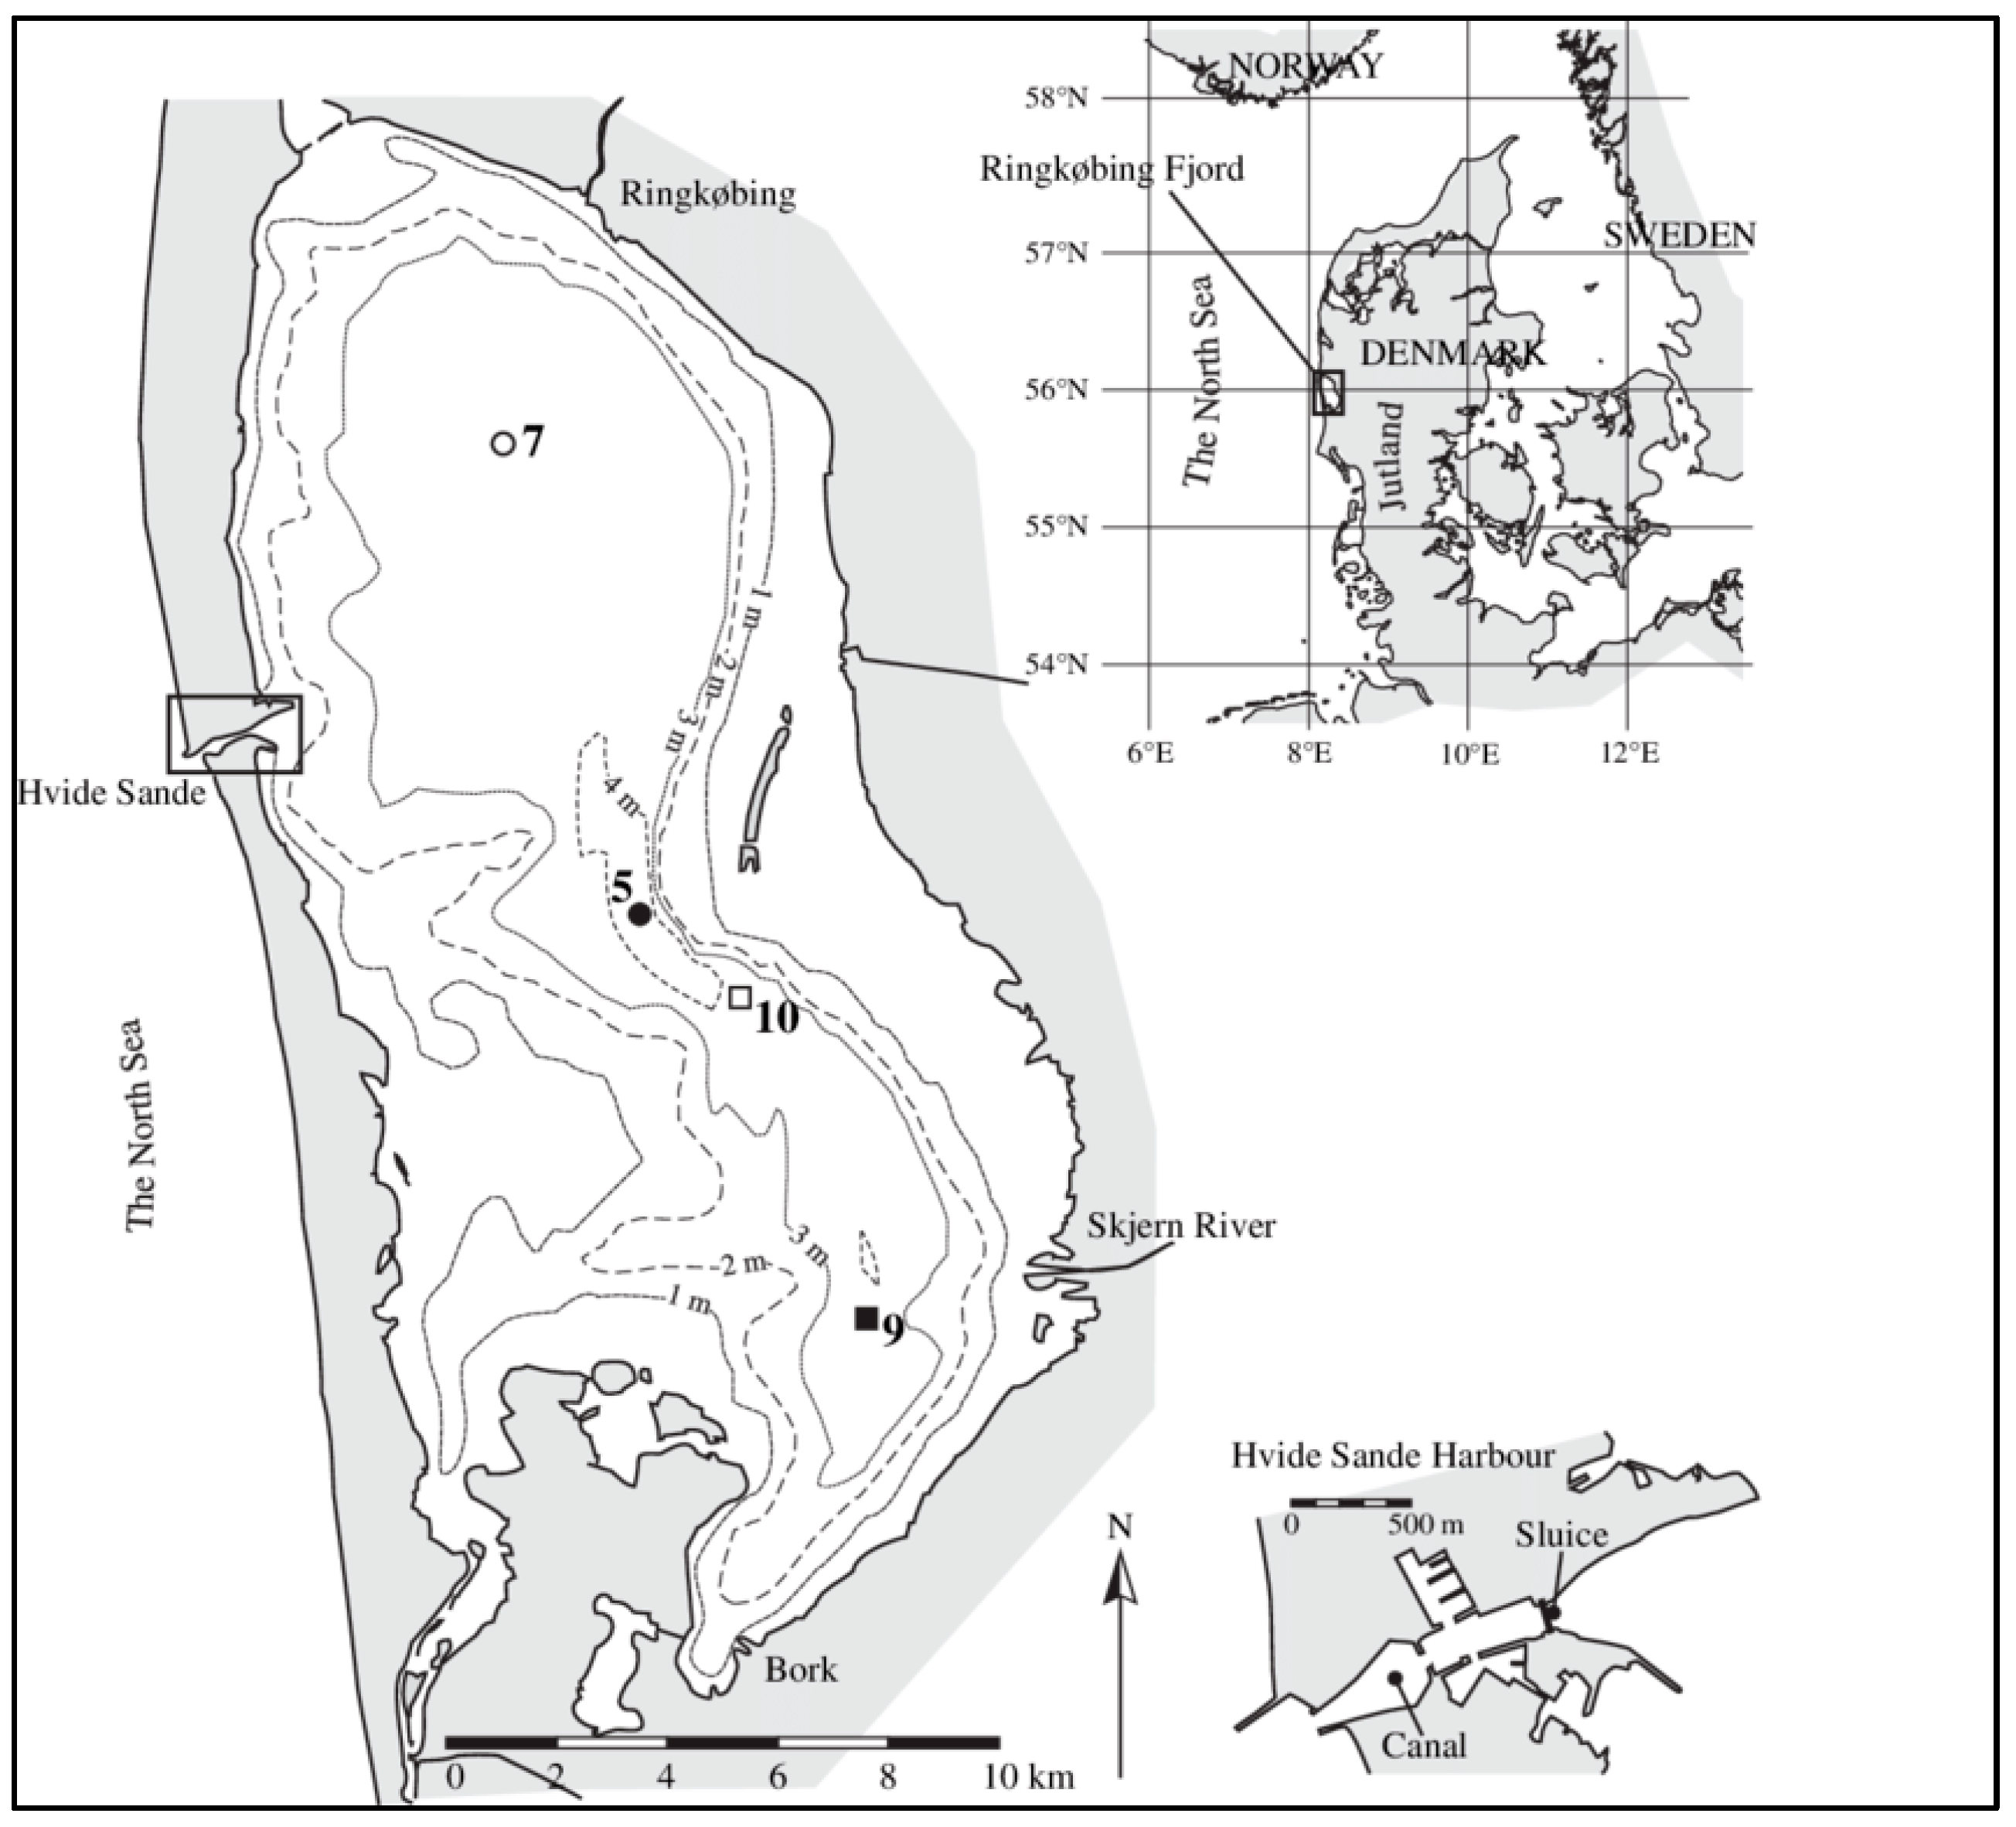
Ringkobing Fjord, located on the west coast of the Jutland peninsula in Denmark, is a shallow coastal lagoon with an average depth of 1.9 m, Figure 12 [78]. The lagoon is situated adjacent to the North Sea yet no longer has a natural connection, as a sluice constructed in 1931 governs the water exchange, Figure 13 [18]. Heavy urbanization and fertilizer use from the 1950s to the 1970s combined with restricted flow through the sluice, located in Hvide Sande, led to the heavy deterioration and eutrophication of the water [17]. In the 1960s, the Skjern River was channeled to further increase drainage from surrounding agricultural land, which increased both freshwater and nutrient input, two large sources of water quality deterioration [18]. To counteract this degradation, it was decided in 1995 that the sluice management plan would be altered to allow the sluice to be opened more often for longer durations [17]. The intent of the increased exchange was to reduce the amount of phytoplankton growth through salinity manipulation, which would open the habitat for seagrasses and other benthic fauna to grow [18].

2.5.2. Results of the Intervention

There was an increase in salinity after the change in sluice management, with the greatest increase occurring in 1996 (the year after the change in sluice management took place) and stabilizing by 1999 [17]. The two years following the new opening regime were marked by an increase in the soft-shell clam population and a subsequent 95% reduction in phytoplankton biomass [18]. The mean salinity increased from approximately 5 to a more varying annual mean, ranging from approximately 8 to 11, depending on tidal and wind-driven water levels in the adjacent North Sea [17].
An increase in benthic fauna was recorded following 1996 as well. The annual mean dissolved inorganic nitrogen (DIN) and dissolved inorganic phosphate (DIP) concentrations did not decrease in the years immediately following the new management. There were increasing trends in both DIN and DIP concentrations initially, with DIN decreasing by 1999 and DIP decreasing by 2003. The DIP response lagged the DIN response. Despite the initial increase in DIN and later DIP, a significant decrease in the annual mean chlorophyll a concentration occurred immediately following the change in sluice management. Similarly, a decrease in the annual mean phytoplankton was immediate, and downward-trending zooplankton biomass prior to management continued. Though Secchi depth and water clarity increased after the new management, the coverage of submerged aquatic vegetation (SAV) was already in decline in the years leading up the change due to years of poor water [17]. The recovery of SAV started in 2001, and by 2006, coverage had reached 1991 levels. The number of bird-days, which is calculated as the average number of birds per month multiplied by days in the month, declined following the year 1996. It is hypothesized that this decrease in bird-days was most likely related to the decrease in the total coverage of SAV [17]. Another noteworthy result of the change in sluice management was an increase in the mean abundance of clams following 1996 [17]. By changing sluice management, saltwater inflow from the North Sea was doubled following 1996, increasing the mean annual salinity; this increase in salinity facilitated abiotic and biotic shifts in the lagoon [17].
An analysis of the data collected from 1989 to 2006 indicates that the change in sluice management in Ringkobing Fjord was seen as a successful intervention for improving water quality and ecosystem health. Based on the results from data collected between 1989 and 2006, the ecosystem changed from eutrophic and turbid to a clear-water condition. This shift was shown to be a direct result of increased inflow from the North Sea [17]. Not only did the added inflow enhance the dilution of excessive nutrients in the water, it also facilitated the re-establishment of organisms that were previously declining in abundance, including soft-shelled clams and other benthic fauna [17]. Following the change in sluice management, the change in many abiotic parameters of the Ringkobing Fjord, such as salinity, DIN, and DIP, ultimately contributed to a beneficial regime shift from a bottom-up to a top-down controlled state of the coastal lagoon [17].

3. Synthesis of Location Data

To return to the basis of this study, we must look at the criteria on the basis of which each of these locations has been evaluated: nutrient contents (e.g., nitrogen and phosphorus), dissolved oxygen levels, temperature, salinity, turbidity, and flora and fauna changes. Each location discussed has exhibited positive changes in some if not all of the evaluation criteria, Table 2.
The responses to natural and engineered inflow systems varied, demonstrating the complex and system-specific nature of successfully altering ocean inflow. Although each system showed improvements in water quality, these improvements were dependent on proximity to the exchange site and varied over time. While some changes, such as salinity and dissolved oxygen, happen relatively quickly in response to increased inflow, other changes, such as the altered abundance and diversity of flora and fauna, can take longer to develop and show changes in response to altered water quality. This synthesis is limited to the observations and data collected and available at each of these locations. Water quality improvement is complex and exists on a spectrum, with interactions between criteria influencing the perceived changes.
Overall, changes in water quality and ecosystem health can be categorized into short-term and long-term responses. For the purposes of this synthesis, the focus was placed on the long-term (month to years) responses, recognizing that disturbance from the physical manipulation of waterways sometimes had undesirable short-term effects. For example, disturbed sediments when naturally or artificially opening or manipulating waterways have in some cases led to temporarily increased turbidity and respiration and low oxygen [40]. Following these sometimes-reported short-term disturbances, the long-term impacts provided beneficial outcomes.
Ecosystem-level responses can be further categorized into impacts of (1) direct mixing with seawater and (2) geochemical and biological (biogeochemical) responses to the impacts of mixing. To empirically describe the relationship between the inflow, outflow, and nutrient loading of a system, literature that developed theoretical and empirical equations for the nutrient and mass balance of coastal estuaries was reviewed [63,76,79,80]. These prior models were summarized to develop a balance of mass inflow and mass outflow in terms of the flux rate and concentration, Q C , mass removal through biogeochemical processes, K V C , and mass loading into the system, L :
Q e x i t C + K V C = Q i n o r i g i n a l C i n o r i g i n a l + Q i n e n g i n e e r e d C i n e n g i n e e r e d + L  
Equation (1) represents the mass balance of nutrient inflow to nutrient outflow while accounting for loading and internal removal. External and internal nutrient loading are balanced by export and biogeochemical removal. Each of the locations examined in this summary varied greatly between the historic connection to the ocean, existing nutrient and freshwater inputs, and mechanism for ocean water inflow; a relationship that is applicable to all systems, both those in this paper and others around the world, was important to include. However, regardless of the inflow mechanism, shape, volume, etc., the mass balance of coastal water bodies can be simplified to the above terms. Q e x i t is the flow rate of water leaving the estuary; Q i n o r i g i n a l is the flow rate of and C i n o r i g i n a l is the concentration of dissolved N and P in the water entering the system prior to any inflow intervention, including both fresh and saline water; Q i n e n g i n e e r e d is the flow rate of and C i n e n g i n e e r e d   is the concentration of dissolved N and P in the saline water entering the system due to the engineered inflow system; C is the concentration of dissolved N and P in the estuary, and it is assumed that the estuary is well mixed; L is the mass loading rate of nutrients added to the system from point and nonpoint sources; V is the volume of water in the estuary; and K is the removal rate of N and P due to ecosystem services, e.g., bio-geochemical processes, in the estuary.
The application of these variables can change based on location-specific parameters. For example, Q i n o r i g i n a l may be limited to only the flow rate of the freshwater input for a system such as Lake Woolgoolga that is restricted from ocean connection during closed phases. However, the balance between new water entering the system ( Q i n e n g i n e e r e d ), water exiting the system with nutrients ( Q e x i t ), and nutrients being removed internally due to ecosystem services ( K ) is accounted for in this equation. These engineered systems increase the flow of water into the system, so Q e x i t can be expected to increase at a rate approximately equal to Q i n e n g i n e e r e d . As this higher saline, cooler, more oxygenated water enters the system, it is expected to promote the ecosystem services described in further detail below; this means that increased inflow can contribute to a higher K value with respect to time and in response a lower mean average C   within the system. Generating a feedback loop to promote improved water quality based on the evaluation criteria in Table 2 is the ultimate goal. To keep the mass balance equation equal, a higher K value over time will mean that an estuary will be less reliant on inflow, Q i n e n g i n e e r e d , to reduce concentrations of N and P and that the restored ecosystem services can hopefully sustain the feedback mechanisms contributing to improved water quality.
Overall, the five locations demonstrated lower temperatures, higher salinities, and increased or stabilized DO quickly after openings, with reported lower concentrations of dissolved nutrients likely reflecting lower concentrations in the adjacent coastal ocean or larger body of water. These initial changes in conjunction with increased vertical and horizontal mixing contribute to geochemical and biological changes that respond more slowly. For example, each of the five studies summarized here reported an improvement in oxygen levels, with several reporting fewer instances of hypoxia or anoxia. Hypoxia is well established to influence the cycling of both nitrogen and phosphorus. Changes in nitrogen cycling are dynamic and likely to respond differently based on the initial condition within each system, which is not always reported. Phosphorus is readily sequestered onto oxygenated particles and sediments; phosphorus is released from anoxic particles and sediments into the water column during hypoxic events [77]. Increased oxygen levels contribute to lower dissolved phosphorus concentrations. When reported, phosphorus decreased following increased seawater exchange and improvements to hypoxic water and sediments.
Several studies reported increased coverage of SAV or increased abundance or diversity of benthic fauna [17,18,20,24,27,32,39,56,75]. These biological responses can result from impacts of mixing and the improved redox state of the water and sediments. These organisms contribute directly and indirectly to moving oxygen across the sediment water interface to promote processes of nutrient cycling, including coupled nitrification–denitrification and the sorption of phosphorus to oxidized particles and sediments. Collectively, the studies included in this review focused on quantifying direct improvements in water quality. However, the improved ecosystem contributes to a positive feedback loop, helping to sustain the improved water quality over time.

4. Conclusions

In coastal environments worldwide, the escalating impacts of climate change and anthropogenic activities pose significant threats to water quality, leading to the decline in marine ecosystems. Climate-induced alterations in hydrologic cycles contribute to increased freshwater runoff and the influx of nutrients, resulting in a global decline in estuarine water quality, impacting flora and fauna. Eutrophication, primarily caused by point and nonpoint source pollution, emerges as a widespread water quality impairment. Anthropogenic modifications to natural water circulation patterns, including freshwater inflows, further exacerbate the issue. The Indian River Lagoon (IRL) in Florida is one example of these disruptions, experiencing a notable decline in water quality, large-scale algal blooms, and ecosystem disruptions. To counteract these challenges, engineered ocean–estuary exchanges emerge as a potential solution, as evidenced by projects highlighted in this article. The core functions of engineered inflow projects include enhancing the circulation and tidal prism, decreasing residence times, and stabilizing environmental factors (Table 2) by decreasing nutrient concentrations, increasing gravitational circulation though the salinity-linked horizontal density gradient, balancing temperature levels with cooler ocean water, and increasing DO levels by introducing higher oxygenated ocean water; these functions combined offer a means to mitigate eutrophication and restore ecosystem functions. The intent of engineered inflow systems is to remedy water quality by restoring ecosystem services that remove nutrients through natural biogeochemical processes without simply exporting them to adjacent areas. The success of such initiatives is contingent on carefully designed engineering solutions tailored to specific estuarine conditions, highlighting the importance of understanding the environmental and ecological context for effective water quality management.
Mechanically enhancing or restoring ocean inflow is one approach to improving water quality in coastal estuaries, especially where anthropogenic changes have increased freshwater inflow. This approach has the potential to alter the chemistry of the system in a short period of time compared to other interventions (e.g., dredging, stormwater projects, chemical filtering, etc.). The response and the response time vary depending on the flow rate induced by the intervention. Overall, mechanical inflow intervention has demonstrated a net positive impact on the water quality and the ecosystem. In some cases, short durations of decreased water quality can occur during the transition. Regardless of the initial response, systems experiencing improved clarity, stabilized temperatures, stabilized salinities closer to ocean salinity, increased DO, and increased abundance and diversity of the flora and fauna post-intervention is likely and has been reported in the long term.

Author Contributions

Conceptualization, B.K., R.W., N.M. and A.F.; Investigation, B.K. and N.M.; Writing—Original Draft Preparation, B.K., R.W., N.M.; Writing—Review and Editing, B.K., R.W., A.F.; Supervision, R.W. and A.F.; Project Administration, B.K. and R.W.; Funding Acquisition, R.W. and A.F. All authors have read and agreed to the published version of the manuscript.

Funding

This work was supported by the Florida Legislature as part of the Florida Department of Education Grant Project No. 857-93160-1Q001 Restore Lagoon Inflow Research. Publication funding provided by the Indian River Lagoon Research Institute at Florida Tech.

Institutional Review Board Statement

Not applicable.

Informed Consent Statement

Not applicable.

Data Availability Statement

No new data were created or analyzed in this study.

Conflicts of Interest

The authors declare no competing interests. The author Benjamin Komita was employed by the company McLaren Engineering Group. There is no conflict of interest between any of the authors and the company McLaren Engineering Group. The author Nicole McClain was employed by the company Taylor Engineering, Inc. There is no conflict of interest between any of the authors and the company Taylor Engineering, Inc.

References

  1. Smith, V.H. Eutrophication of freshwater and coastal marine ecosystems a global problem. Environ. Sci. Pollut. Res. 2003, 126–139. [Google Scholar] [CrossRef] [PubMed]
  2. United Nations. International Decade for Action ‘WATER FOR LIFE’ 2005–2015. 2014. Available online: https://www.un.org/waterforlifedecade/quality.shtml (accessed on 15 March 2022).
  3. Bassem, S. Water Pollution and Aquatic Biodiversity. Environ. Sci. 2020, 4, 10–16. [Google Scholar]
  4. UNESCO. International Initiative on Water Quality (IIWQ). 2019. Available online: https://en.unesco.org/waterquality-iiwq/wq-challenge#:~:text=One%20in%20nine%20people%20worldwide%20uses%20drinking%20water%20from%20unimproved%20and%20unsafe%20sources&text=2.4%20billion%20people%20live%20without%20any%20form%20of%20sanitation&text=Lack% (accessed on 9 September 2022).
  5. Stewart, J.; Virnstein, R.; Haunert, D.; Lund, F. Surface Water Improvement and Management (SWIM) Plan for the Indian River Lagoon; St. Johns Water Management District and South Florida Water Management District: Palatka, FL, USA, 1989. [Google Scholar] [CrossRef]
  6. Salzamn, J.E., Jr.; Thompson, B.H.T. Envinonmental Law and Policy; Foundation Press: New York, NY, USA, 2019. [Google Scholar]
  7. Kanakidou, M.; Myriokefalitakis, S.; Daskalakis, N.; Fanourgakis, G.; Nenes, A.; Baker, A.; Tsigaridis, K.; Past, N.M. Present and Future Atmospheric Nitrogen Deposition. J. Atmos Sci. 2016, 73, 2039–2047. [Google Scholar] [CrossRef] [PubMed]
  8. Harbor Branch, “IRL Information”. 2022. Available online: https://www.fau.edu/hboi/research/marine-ecosystem-conservation/irlo/outreach/irl-information/ (accessed on 9 November 2022).
  9. Bridgewater, P.; Guarino, E.; Thompson, R.M. Hydrology in the Anthropocene. Encycl. Anthr. 2017, 1–5, 87–92. [Google Scholar]
  10. Dagbegnon, C.; Djebou, S.; Singh, V. Impact of climate change on the hydrologic cycle and implications for society. Environ. Sci. 2016, 1, 36–49. [Google Scholar]
  11. Sigua, G.C.; Steward, J.; Tweedale, W. Water-Quality Monitoring and Biological Integrity Assessment in the Indian River Lagoon, Florida: Status, Trends, and Loadings (1988–1994). Environ. Manag. 2000, 25, 199–209. [Google Scholar] [CrossRef]
  12. IRLNEP. Looking Ahead to 2030: A 10-Year Comprehensive Conservation and Management Plan (CCMP) for the Indian River Lagoon (IRL); IRL Council and IRLNEP: Sebastian, FL, USA, 2017. [Google Scholar]
  13. Barile, P.J. Widespread sewage pollution of the Indian River Lagoon system, Florida (USA) resolved by spatial analyses of macroalgal biogeochemistry. Mar. Pollut. Bull. 2018, 128, 557–574. [Google Scholar] [CrossRef]
  14. Morris, L.J.; Hall, L.M.; Jacoby, C.A.; Chamberlain, R.H.; Hanisak, M.D.; Miller, J.D.; Virnstein, R.W. Seagrass in a Changing Estuary, the Indian River Lagoon, Florida, United States. Front. Mar. Sci. 2022, 8, 789818. [Google Scholar] [CrossRef]
  15. Philips, E.J.; Badylak, S.; Nelson, N.G.; Hall, L.M.; Jacoby, C.A.; Lasi, M.A.; Lockwood, J.C.; Miller, J.D. Cyclical Patterns and a Regime Shift in the Character of Phytoplankton Blooms in a Restricted Sub-Tropical Lagoon, Indian River Lagoon, Florida, United States. Front. Mar. Sci. 2021, 8, 730934. [Google Scholar] [CrossRef]
  16. Duarte, C.M.; Krause-Jensen, D. Intervention Options to Accelerate Ecosystem Recovery From Coastal Eutrophication. Front. Mar. Sci. 2018, 5, 470. [Google Scholar] [CrossRef]
  17. Petersen, J.K.; Hansen, J.W.; Laursen, M.B.; Clausen, P.; Carstensen, J.; Conley, D.J. Regime Shift in a Coastal Marine Ecosystem. Ecol. Appl. 2008, 18, 497–510. [Google Scholar] [CrossRef] [PubMed]
  18. Nielsen, M.H.; Rasmussen, B.; Gertz, F. A simple model for water level and stratification in Ringkøbing Fjord, a shallow, artificial estuary. Estuar. Coast. Shelf Sci. 2005, 63, 235–248. [Google Scholar] [CrossRef]
  19. Burgess, M. Destin Harbor Pump. 2020. Available online: https://mydestinlife.com/destin-harbor-pump-ready-for-the-2020-season/ (accessed on 7 January 2023).
  20. Indian River County. Bethel Creek Community Discussion Meeting. 2016. Available online: https://ircgov.com/Lagoon/Bethel-Creek/Bethel-Workshop-081116.pdf (accessed on 12 January 2023).
  21. FDEP. DEP 101: Surface Water Quality Standards. 20 March 2023. Available online: https://floridadep.gov/comm/press-office/content/dep-101-surface-water-quality-standards (accessed on 9 April 2023).
  22. Landers-Atkins Planners, Inc. Destin Harbor Management Plan. 1987. Available online: https://www.govinfo.gov/content/pkg/CZIC-tc225-d47-d47-1987/html/CZIC-tc225-d47-d47-1987.htm (accessed on 23 September 2022).
  23. Ysebaert, T.; van der Hoek, D.-J.; Wortelboer, R.; Wijsman, J.W.M. Tangelder and A. Nolte. Management options for restoring estuarine dynamics and implications for ecosystems: A quantitative approach for the Southwest Delta in the Netherlands. Ocean. Coast. Manag. 2016, 121, 33–48. [Google Scholar] [CrossRef]
  24. Wijnhoven, S.; Escaravage, V.; Daemen, E.; Hummel, H. The decline and restoration of a coastal lagoon (Lake Veere) in the Dutch Delta. Estuaries Coasts 2010, 33, 1261–1278. [Google Scholar] [CrossRef]
  25. Coosen, J.; Meire, P.; Stuart, J.; Seys, J. Trophic relationships in brackish Lake Veere: The role of macrophytes. In Proceedings of the 24th European Marine Biology Symposium, Aberdeen, UK, 4–10 October 1990. [Google Scholar]
  26. Herman, P.; Hemminga, M.; Nienhuis, P.; Verschuure, J.; Wessel, E. Wax and wane of eelgrass Zostera marina and water column silica levels. Mar. Ecol. Prog. Ser. 1996, 144, 303–307. [Google Scholar] [CrossRef]
  27. Troost, K.; Tangelder, M.; van den Ende, D.; Ysebaert, T. From Past to Present: Biodiversity in a Changing Delta; Statutory Research Tasks Unit for Nature & the Environment: Wageningen, The Netherlands, 2012. [Google Scholar]
  28. Dowhan, J.; Halavik, T.; Milliken, A.; MacLachlan, A.; Caplis, M.; Lima, K.; Zimba, A. Significant Habitats and Habitat Complexes of the New York Bight Watershed; US Fish and Wildlife Service: Charleston, RI, USA, 1997. [Google Scholar]
  29. Bilecki, M.S. Fire Island National Seashore: A breach in the barrier island at the Otis Pike Fire Island High Dune Wilderness. Parks Steward. Forum 2020, 36, 137–143. [Google Scholar] [CrossRef]
  30. Hinrichs, C.; Flagg, C.N.; Wilson, R.E. Great South Bay After Sandy: Changes in Circulation and Flushing due to New Inlet. Estuaries Coasts 2018, 41, 2172–2190. [Google Scholar] [CrossRef]
  31. Olin, J.A.; Cerrato, R.M.; Nye, J.A.; Sagarese, S.R.; Sclafani, M.; Zacharias, J.P.; Frisk, M.G. Evidence for Ecosystem Changes Within a Temperate Lagoon Following a Hurricane-Induced Barrier Island Breach. Estuaries Coasts 2020, 43, 1625–1639. [Google Scholar] [CrossRef]
  32. NPS. Monitoring the Wilderness Breach. 2018. Available online: https://www.nps.gov/fiis/learn/nature/monitoring-the-wilderness-breach.htm (accessed on 2 February 2023).
  33. NPS; USACE. Final Fire Island Wilderness Breach Management Plan/Environmental Impact Statement. 2017. Available online: https://parkplanning.nps.gov/showFile.cfm?projectID=58824&MIMEType=application%252Fpdf&filename=FIIS%5FFEIS%5FFinal%5F508%5FEPA%5FPEPC%5FFile%5FDec2017%2Epdf&sfid=308208 (accessed on 4 February 2023).
  34. National Park Service. Post-Hurricane Sandy: Old Inlet Breach on Fire Island. 13 January 2013. Available online: https://web.archive.org/web/20130113205614/http://www.nps.gov/fiis/naturescience/post-hurricane-sandy-breaches.htm (accessed on 27 January 2023).
  35. National Park Service. The Fire Isalnd Wilderness Breach: Water Quality and Levels. 20 December 2016. Available online: https://www.nps.gov/articles/the-fire-island-wilderness-breach-water-quality-and-levels.htm (accessed on 18 January 2023).
  36. NSW Department of Planning and Envionment. Woolgoolga Lake. 27 November 2023. Available online: https://www.environment.nsw.gov.au/topics/water/estuaries/estuaries-of-nsw/woolgoolga-lake (accessed on 8 January 2024).
  37. NSW Department of Planning and Environment. Belongil Creek. 2 May 2023. Available online: https://www.environment.nsw.gov.au/topics/water/estuaries/estuaries-of-nsw/belongil-creek (accessed on 8 January 2024).
  38. NSW Government. Habitat Management–Wetland Habitats. February 2023. Available online: https://www.dpi.nsw.gov.au/fishing/habitat/aquatic-habitats/wetland/coastal-wetlands/management-of-coastal-lakes-and-lagoons-in-nsw (accessed on 8 January 2024).
  39. NSW Government. Health of Our Estuaries. 14 December 2021. Available online: https://www.environment.nsw.gov.au/topics/water/estuaries/estuaries-of-nsw/tallow-creek (accessed on 11 May 2023).
  40. Mayjor, M.; Reichelt-Brushett, A.J.; Malcolm, H.A.; Page, A. Water quality fluctuations in small intermittently closed and open lakes and lagoons (ICOLLs) after natural and artificial openings. Estuar. Coast. Shelf Sci. 2023, 281, 132–146. [Google Scholar] [CrossRef]
  41. Ferguson, A.; Wiecek, D.; Hughes, M.; Hanslow, D.; Wainwright, D.; Scanes, P. Form and Function of NSW Intermittently Closed and Open Lakes and Lagoons. Environment, Energy and Science; Department of Planning, Industry and Environment: Parramatta, NSW, Australia, 2021. [Google Scholar]
  42. Byron Shire Council. Belongil Creek. 2022. Available online: https://www.byron.nsw.gov.au/Services/Environment/Coast-and-waterways/Estuaries-and-ICOLLs/Belongil-Creek (accessed on 12 March 2023).
  43. Ivezich, M.; Teague, J.; Wainwright, D.; Skull, S. Belongil Creek Entrance Opening Strategy; Byron Shire Council: Mullumbimby, NSW, Australia, 2021. [Google Scholar]
  44. Cavanagh, D.; Visser, J.; Richards, S.; Ainsworth, J. Review of Environmental Factors: Tallow Creek Entrance Opening–Vol. 1; BMT WBM: Brisbane, Australia, 2015. [Google Scholar]
  45. Benkendorff, K.; Klaas, C.; Kirby, M. Water Quality in Woolgoolga Estuary and Valuation of Nutrient Removal Servies by the Remnant Leaf Oyster Reef; Coffs Harbour City Council–Environmental Levy Program: Coffs Harbour, NSW, Australia, 2022. [Google Scholar]
  46. Hyman, A.C.; Stephens, D.B. Effects of seawater exchange on water chemistry among coastal lakes with intermittent connections to the sea. Estuar. Coast. Shelf Sci. 2020, 244, 106934. [Google Scholar] [CrossRef]
  47. Elwany, M.H.S.; Flick, R.E.; Aijaz, S. Opening and closure of a marginal Southern California lagoon inlet. Estuaries 1998, 21, 246–254. [Google Scholar] [CrossRef]
  48. Kraus, N.C.; Militello, A.; Todorf, G. Barrier Breaching Processes and Barrier Spit Breach, Stone Lagoon, California. Shore Beach 2002, 70, 21–28. [Google Scholar]
  49. Whitfield, A.; Bate, G. A review of information on temporarily open/closed estuaries in the warm and cool temperate biogeographic regions of South Africa, with particular emphasis on the influence of river flow on these systems. Water Res. Com. 2007, 158, 7. [Google Scholar]
  50. Perissinotto, R.; Stretch, D.D.; Whitfield, A.K.; Adams, J.; Forbes, A.T.; Demetriades, N.T. Temporarily Open/Closed Estuaries in South Africa; Nova Science Publishers: Novinka, Russia, 2010. [Google Scholar]
  51. Maher, W.; Mikac, K.; Foster, S.; Spooner, D.; Williams, D. Form and functioning of micro size intermittent closed open lake lagoons (ICOLLs) in NSW, Australia. In Lagoons: Biology, Management and Environmental Impact; Nova Science Publishers, Inc.: New York, NY, USA, 2011; pp. 119–152. [Google Scholar]
  52. Kinnear, J.A.; Binley, A.; Duque, C.; Engesgaard, P.K. Using geophysics to map areas of potential groundwater discharge into Ringkøbing Fjord, Denmark. Lead. Edge 2013, 32, 725–856. [Google Scholar] [CrossRef]
  53. USACE Jacksonville District. St. Lucie Inlet FL (O&M) Congressional Fact Sheet; USACE: Jacksonville, FL, USA, 2023. [Google Scholar]
  54. Jupiter Inlet District. Inlet Dredging Project. 2023. Available online: https://www.jupiterinletdistrict.org/2023-jupiter-inlet-district-inlet-dredging-project (accessed on 28 November 2023).
  55. Gray, J. 10 FAQS–Sebastian Inlet District’s Channel Maintenance Dredging, Sand Bypass and Beach Renourishment Project. 9 March 2019. Available online: https://www.sitd.us/10-faqs-sebastian-inlet-district-s-channel-maintenance-dredging-sand-bypass-and-beach-renourishment-project (accessed on 10 September 2022).
  56. Remillard, J.; McDivitt, P.; Druschke, C.G. The Fire Island Wilderness Breach: Ecological Resilience in Great South Bay; National Park Service: Patchogue, NY, USA, 2017. [Google Scholar]
  57. Ghosh, A.K.; Pattnaik, A.K.; Ballatore, T.J. Chilika lagoon: Restoring ecological balance and livelihoods through re-salinization. Lakes Reserv. Sci. Policy Manag. Sustain. Use 2006, 11, 239–255. [Google Scholar] [CrossRef]
  58. Schallenberg, M.; Larned, S.T.; Hayward, S.; Arbuckle, C. Contrasting effects of managed opening regimes on water quality in two intermittenly closed and open coastal lakes. Estuar. Coast. Shelf Sci. 2010, 86, 587–597. [Google Scholar] [CrossRef]
  59. Li, Y.; Tang, C.; Wang, C.; Anim, D.; Yu, Z.; Acharya, K. Improved Yangtze River Diversions: Are they helping to solve algal bloom problems in Lake Taihu, China? Ecol. Eng. 2013, 51, 104–116. [Google Scholar] [CrossRef]
  60. Humphries, R.; Robinson, S. Assessment of the success of the peel-harvey estuary system management strategy- a western Australian attempt at integrated catchment management. Water Sci. Technol. 1995, 32, 255–264. [Google Scholar] [CrossRef]
  61. Lillebo, A.I.; Neto, J.M.; Martins, L.; Verdelhos, T.; Leston, S.; Cardoso, P.G. Management of a shallow temperate estuary to control eutrophication: The effect of hydrodynamics on the system’s nutrient loading. Estuar. Coast. Shelf Sci. 2005, 65, 697–707. [Google Scholar] [CrossRef]
  62. Port of Los Angeles Engineering Division. Inner Cabrillo Beach Water Quality Improvement Project Source Identifications and Mitigation Alternatives. 2006. Available online: https://faast.waterboards.ca.gov/attachments/proposal_18975/attachment_61567.pdf (accessed on 20 October 2022).
  63. Nixon, S.; Ammerman, J.; Atkinson, L.; Berounsky, V.; Billen, G.; Boicourt, W.; Boynton, W.; Church, T.; Ditoro, D.; Elmgren, R.; et al. The fate of nitrogen and phosphorus at the land-sea margin of the North Atlantic Ocean. Biogeochemistry 1996, 35, 141–180. [Google Scholar] [CrossRef]
  64. Kemp, W.; Testa, J.; Conley, D.; Gilbert, D.; Hagy, J. Coastal hypoxia responses to remediation. Biogeosciences 2009, 6, 6889–6948. [Google Scholar]
  65. Hinga, K.R. Water Quality and Ecology of Great South Bay (Fire Island National Seashore Science Synthesis Paper); National Park Service: Boston, MA, USA, 2005. [Google Scholar]
  66. NYSDEC. South Shore Estuary Reserve. 2023. Available online: https://www.dec.ny.gov/lands/31847.html (accessed on 17 May 2023).
  67. Judnich, T. ‘World’s Luckiest Fishing Village’: Multi-Pronged Destin Harbor Study Could Wrap Up in 22. 28 July 2021. Available online: https://www.nwfdailynews.com/story/news/local/2021/07/28/destin-harbors-environmental-public-safety-economic-health-study/8040254002/ (accessed on 21 November 2022).
  68. Ramsar. Veerse Meer. 1 November 2022. Available online: https://rsis.ramsar.org/ris/1251 (accessed on 8 November 2022).
  69. Basemap; ArcGIS Pro 3.3.0; Environmental Systems Research Institute (ESRI): Redlands, CA, USA, 2024.
  70. National Park Service, US Department of the Interior. Planning, Environment & Public Comment. December 2017. Available online: https://parkplanning.nps.gov/document.cfm?parkID=227&projectID=58824&documentID=84750 (accessed on 3 February 2023).
  71. Methratta, E.T.; Pacelli, C.L.; Fields, L.; Bosma, K.; Clark, H.J. Technical Synthesis Report for Physical and Ecological Resources at Fire Island National Seashore; NPS: Fort Collins, CO, USA, 2017. [Google Scholar]
  72. Gobler, C.J.; Young, C.S.; Goleski, J.; Stevens, A.; Thickman, J.; Wallace, R.B.; Curran, P.; Koch, F.; Kang, Y.; Lusty, M.W.; et al. Collier. Accidental ecosystem resotration? Assessing the estuary-wide impacts of a new ocean inlet created by Hurricane Sandy. Estuar. Coast. Shelf Sci. 2019, 221, 132–146. [Google Scholar] [CrossRef]
  73. Gobler, C.J.; Collier, J.; Lonsdal, D. Assessing the Response of the Great South Bay Plankton Community to Hurricane Sandy; SUNY Stony Brook: New York, NY, USA, 2014. [Google Scholar]
  74. Harris, L.; Hodgkins, C.; Day, M.; Austin, D.; Testa, J.; Boynton, W.; Van Der Tak, L.; Chen, N. Optimizing recovery of eutrophic estuaries: Impact of destratification and re-aeration on nutrient and dissolved oxygen dynamics. Ecoloical Eng. 2015, 75, 470–483. [Google Scholar] [CrossRef]
  75. Northwest Florida Water Management District. Permit Re-Application for the Old Pass Lagoon Yater Circulation Facility; Northwest Florida Water Management District: Havana, FL, USA, 1992. [Google Scholar]
  76. Shen, J.; Du, J.; Lucas, L.V. Simple relationships between residence time and annual nutrient retention, export, and loading for estuaries. Limnol. Oceanogr. 2022, 67, 918–933. [Google Scholar] [CrossRef]
  77. Diaz, R.J.; Rosenberg, R. Spreading Dead Zones and Consequences for Marine Ecosystems. Science 2008, 321, 926–929. [Google Scholar] [CrossRef]
  78. Hakanson, L.; Bryhn, A.C. Goals and remedial strategies for water quality and wildlife management in a coastal lagoon—A case-study of Ringkobing Fjord, Denmark. J. Environ. Manag. 2008, 86, 498–519. [Google Scholar] [CrossRef]
  79. Dettmann, E.H. Effect of water residence time on annual export and denitrification of nitrogen in estuaries: A model analysis. Estuaries Coasts 2001, 24, 481–490. [Google Scholar] [CrossRef]
  80. Vollenweider, R.A. Input-output models With special reference to the phosphorus loading concept in limnology. Aquat. Sci. 1975, 37, 53–84. [Google Scholar] [CrossRef]
Figure 1. Location of Fire Island National Seashore and Great South Bay [69].
Jmse 12 02047 g001
Figure 2. Fire Island Wilderness breach on 2 November 2012. Reproduced from [34].
Jmse 12 02047 g002
Figure 3. November 2012 base photo with subsequent shoreline surveys of the Fire Island Wilderness Beach conducted by the National Park Service in June of each year. Survey results indicate an approximate 280 m westward migration of the channel between 2013 and 2019 [29]. Reproduced or adapted from [29], with permission from Belicki, 2024.
Jmse 12 02047 g003
Figure 4. Location of ICOLLs on the northeast coast of NSW Australia. Lake Woolgoolga is shown in the upper image and Belongil Creek is shown in the lower image [69].
Jmse 12 02047 g004
Figure 5. Belongil Creek during the Opened Stage [37]. Reproduced from [37] with permission from NSW Department of Planning and Environment, 2023.
Jmse 12 02047 g005
Figure 6. Woolgoolga Lake during the closed stage [51]. Reproduced from [51] with permission from NSW Government, 2023.
Jmse 12 02047 g006
Figure 7. Destin Harbor Aerial Map [69].
Jmse 12 02047 g007
Figure 8. Northwest Florida Water Management District Pipe and Pump Site Plan for ocean inflow into Destin Harbor [75].
Jmse 12 02047 g008
Figure 9. Location of Lake Veere, Eastern Scheldt, and Katse Heule [69].
Jmse 12 02047 g009
Figure 10. Lake Veere vicinity map and monitoring station depths/locations [24].
Jmse 12 02047 g010
Figure 11. Water quality conditions between 1988 and 2008, with the opening of Katse Heule marked with a dashed line [24]. (a) Salinity; (b) Secchi; (c) Nitrogen; (d) Phosphate.
Jmse 12 02047 g011
Figure 12. Location of Ringkobing Fjord [69].
Jmse 12 02047 g012
Figure 13. Map of Jutland Peninsula, Ringkobing Fjord, and Hvide Sande Harbour [18]: Shaded area indicates land. Location of Ringkobing Fjord along the Denmark West Coast is provided in the upper right portion of the figure. In the bottom right, an insert illustrating the canal and sluice is provided. Reproduced from [18] with permission from Elsevier, 2024.
Jmse 12 02047 g013
Table 1. Study Locations Summary.
NameLocationType of Water BodySurface AreaAverage DepthOpening MechanismCatchment Area
Great South BayNY, USAShallow Saltwater Lagoon [28]390 km2 [28]1.3 m [65]Naturally breached inlet [29]844 km2 [66]
Belongil CreekNSW, AUSICOLL [41]0.3 km2 [37]0.5 m [40]Mechanically opened temporary inlet [41]30 km2 [37]
Lake WoolgoolgaNSW, AUSICOLL [38]0.2 km2 [40]0.4 m [38]Naturally opened temporary inlet [40]21 km2 [38]
Destin HarborDestin, FL, USASaltwater Lagoon [22]0.85 km2 [67]5.3 m [67]Restricted opening with mechanical pumping [19]4 km2 [19]
Lake VeereSouth-western NLDArtificially Managed Lagoon24.4 km2 [23]10 m [24]Managed tidal gate [25]Varies based on the pumping schedule from surrounding polders [68]
Ringkobing FjordWestern DNKShallow Coastal Lagoon300 km2 [18]2–3 m [17]Managed Tidal Sluice [17]3500 km2 [52]
Table 2. Synthesis of locations demonstrating an improvement in evaluation criteria.
Evaluation CriteriaFire Island, NY, USANSW, AULake Veere, NLDestin Harbor, FL, USARingkobing Fjord, DK
Decreased Nutrient (N, P) Concentrationsx-x-x
Increased Dissolved Oxygenxxxxx
Reduction/stabilization of temperaturexx---
Increase/stabilization of salinityx----
Reduction in turbidity/increase in water clarityx--xx
Increase in flora/fauna diversity and abundancex-xxx
No data reported in various review papers. x Location demonstrates identified change.
Disclaimer/Publisher’s Note: The statements, opinions and data contained in all publications are solely those of the individual author(s) and contributor(s) and not of MDPI and/or the editor(s). MDPI and/or the editor(s) disclaim responsibility for any injury to people or property resulting from any ideas, methods, instructions or products referred to in the content.