
Enhanced Continental Weathering Triggered the Anoxia of Seawater and Mass Extinctions During the Late Ordovician


Abstract
1. Introduction
2. Geological Setting
3. Methods
3.1. Major and Trace Elements
3.2. Elemental Concentrations and 87Sr/86Sr Analysis in Carbonates
4. Results
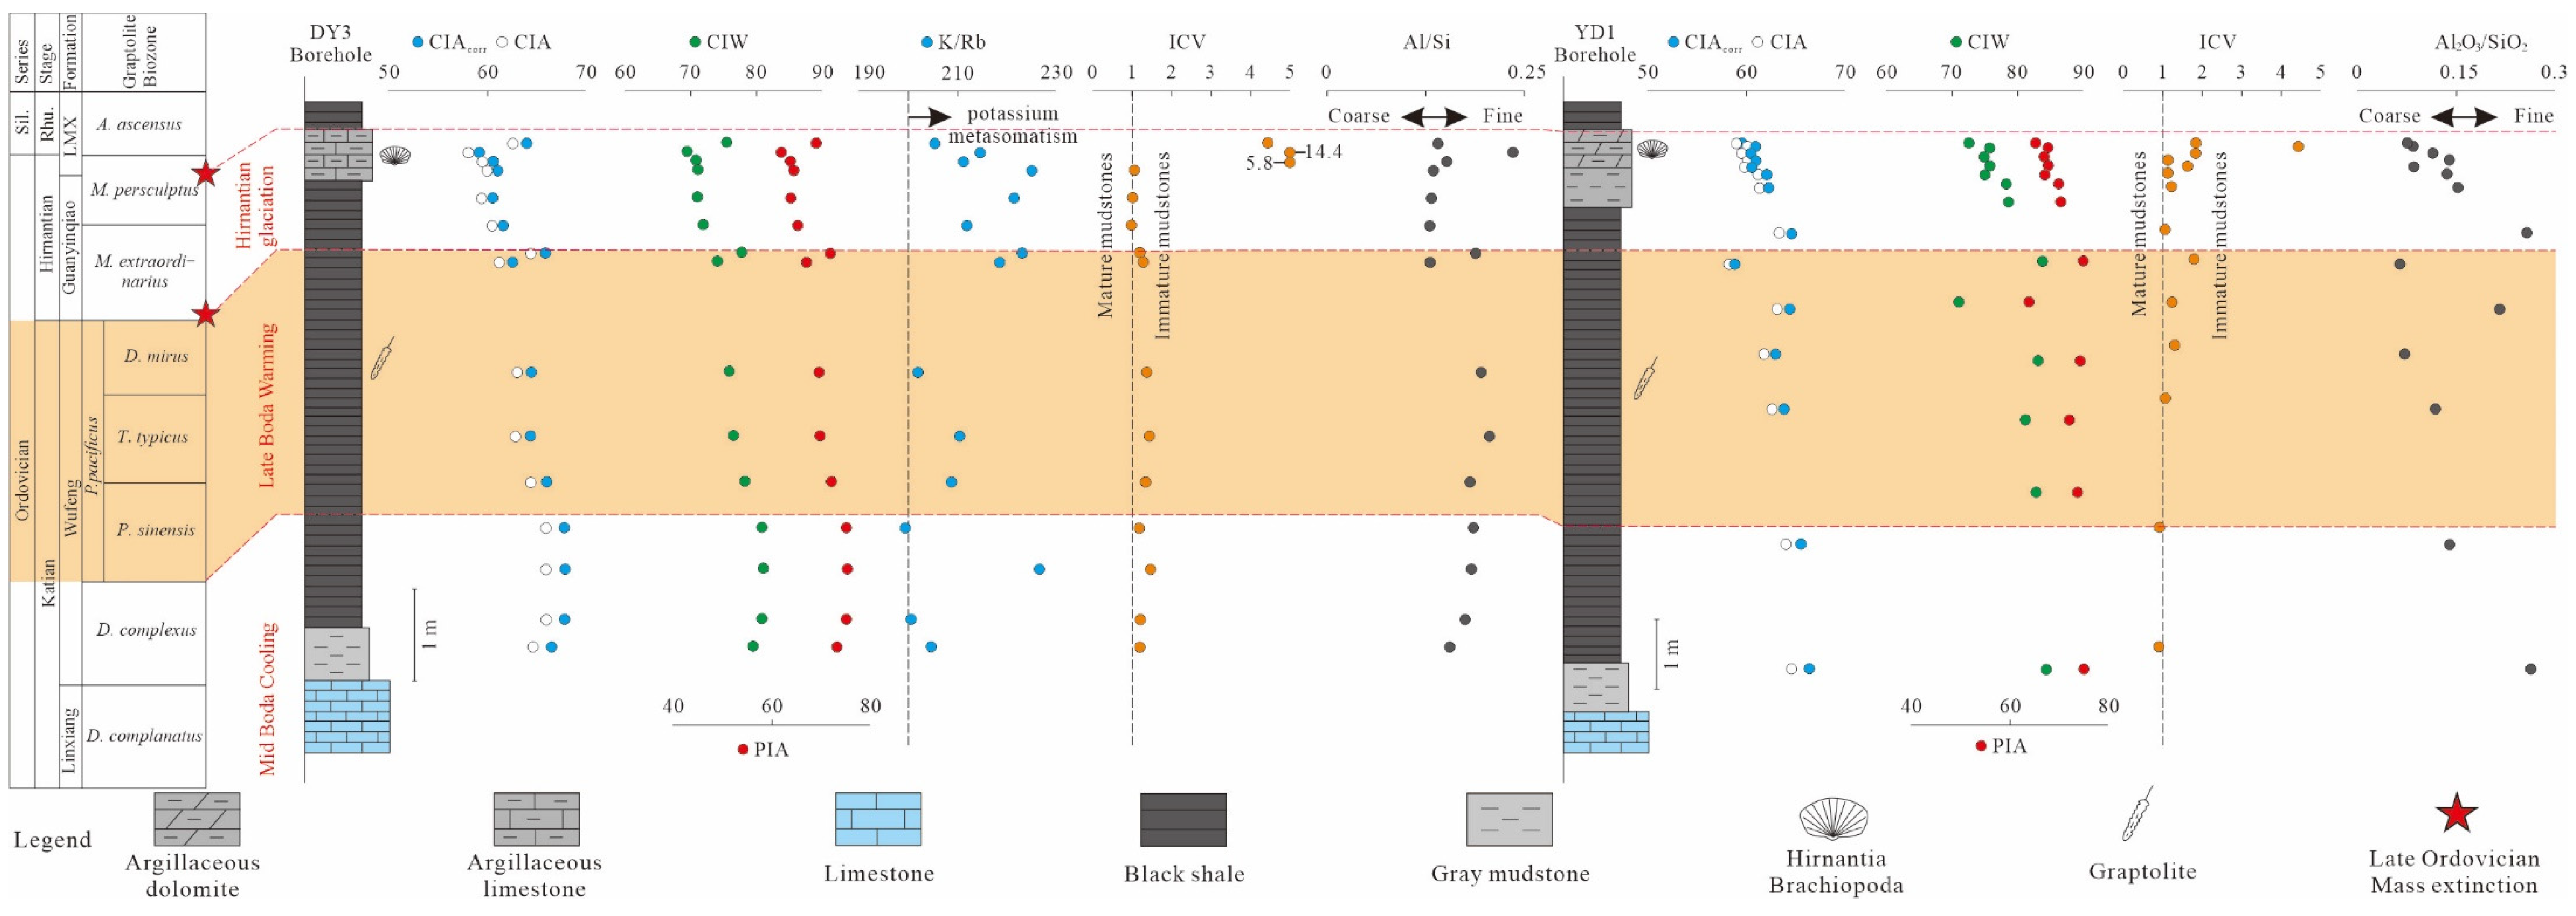
4.1. Major Elements
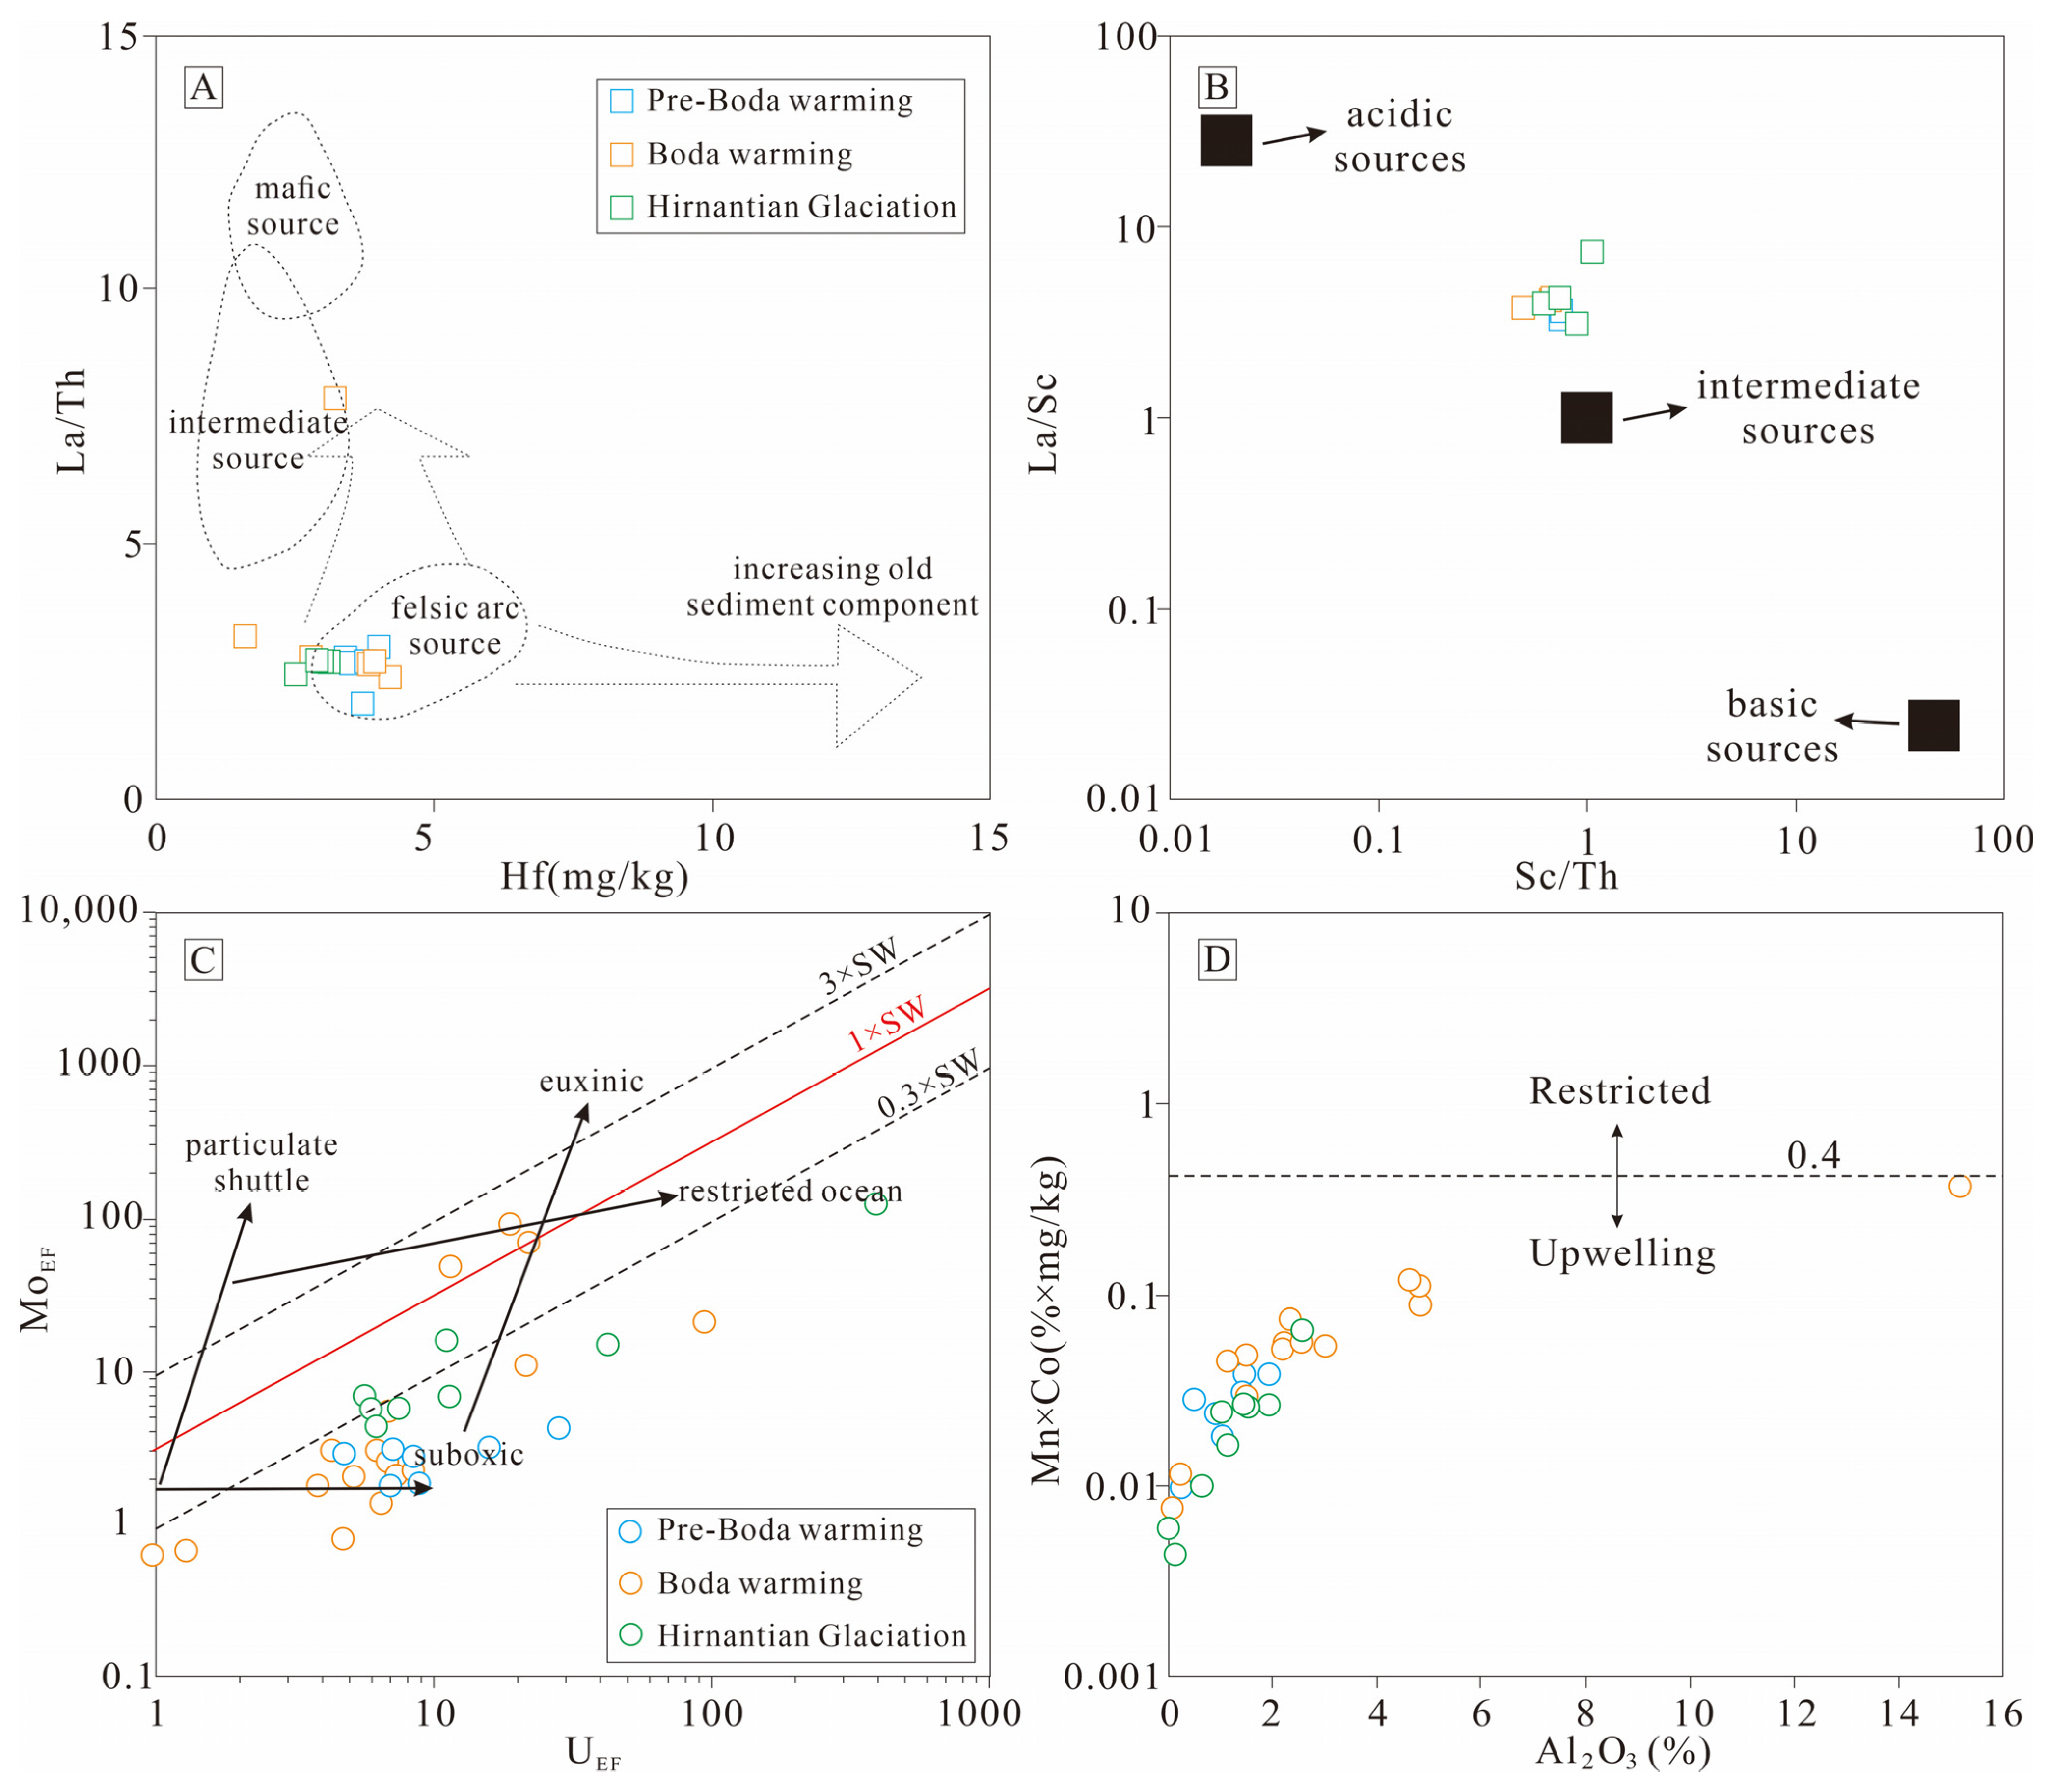
4.2. Trace Elements
4.3. 87Sr/86Sr and Elements in Carbonate Leachates
5. Discussion
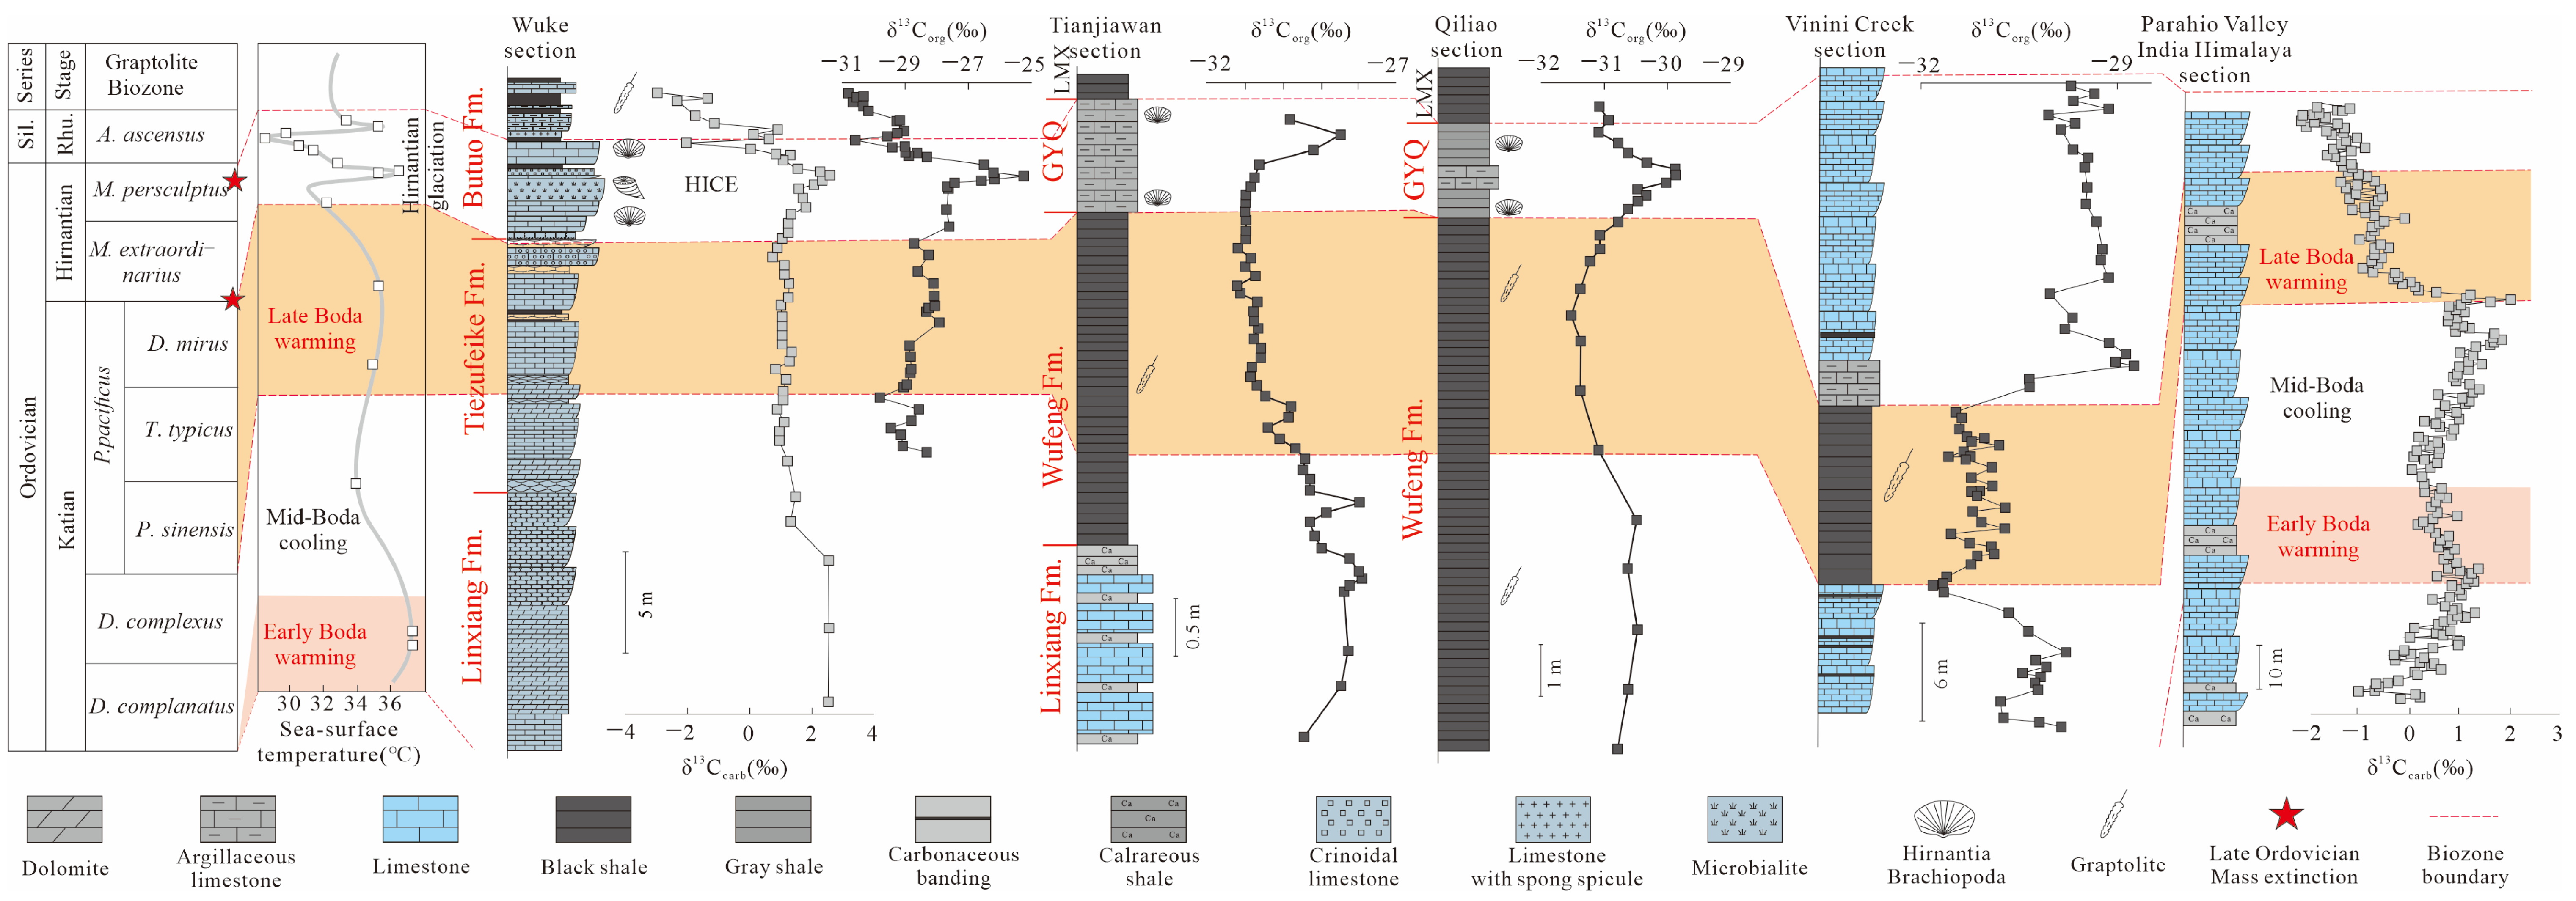
5.1. δ13 C Records and Climate Events in the Late Ordovician
5.2. The Reliability of the Weathering Proxies in Shales and Carbonates
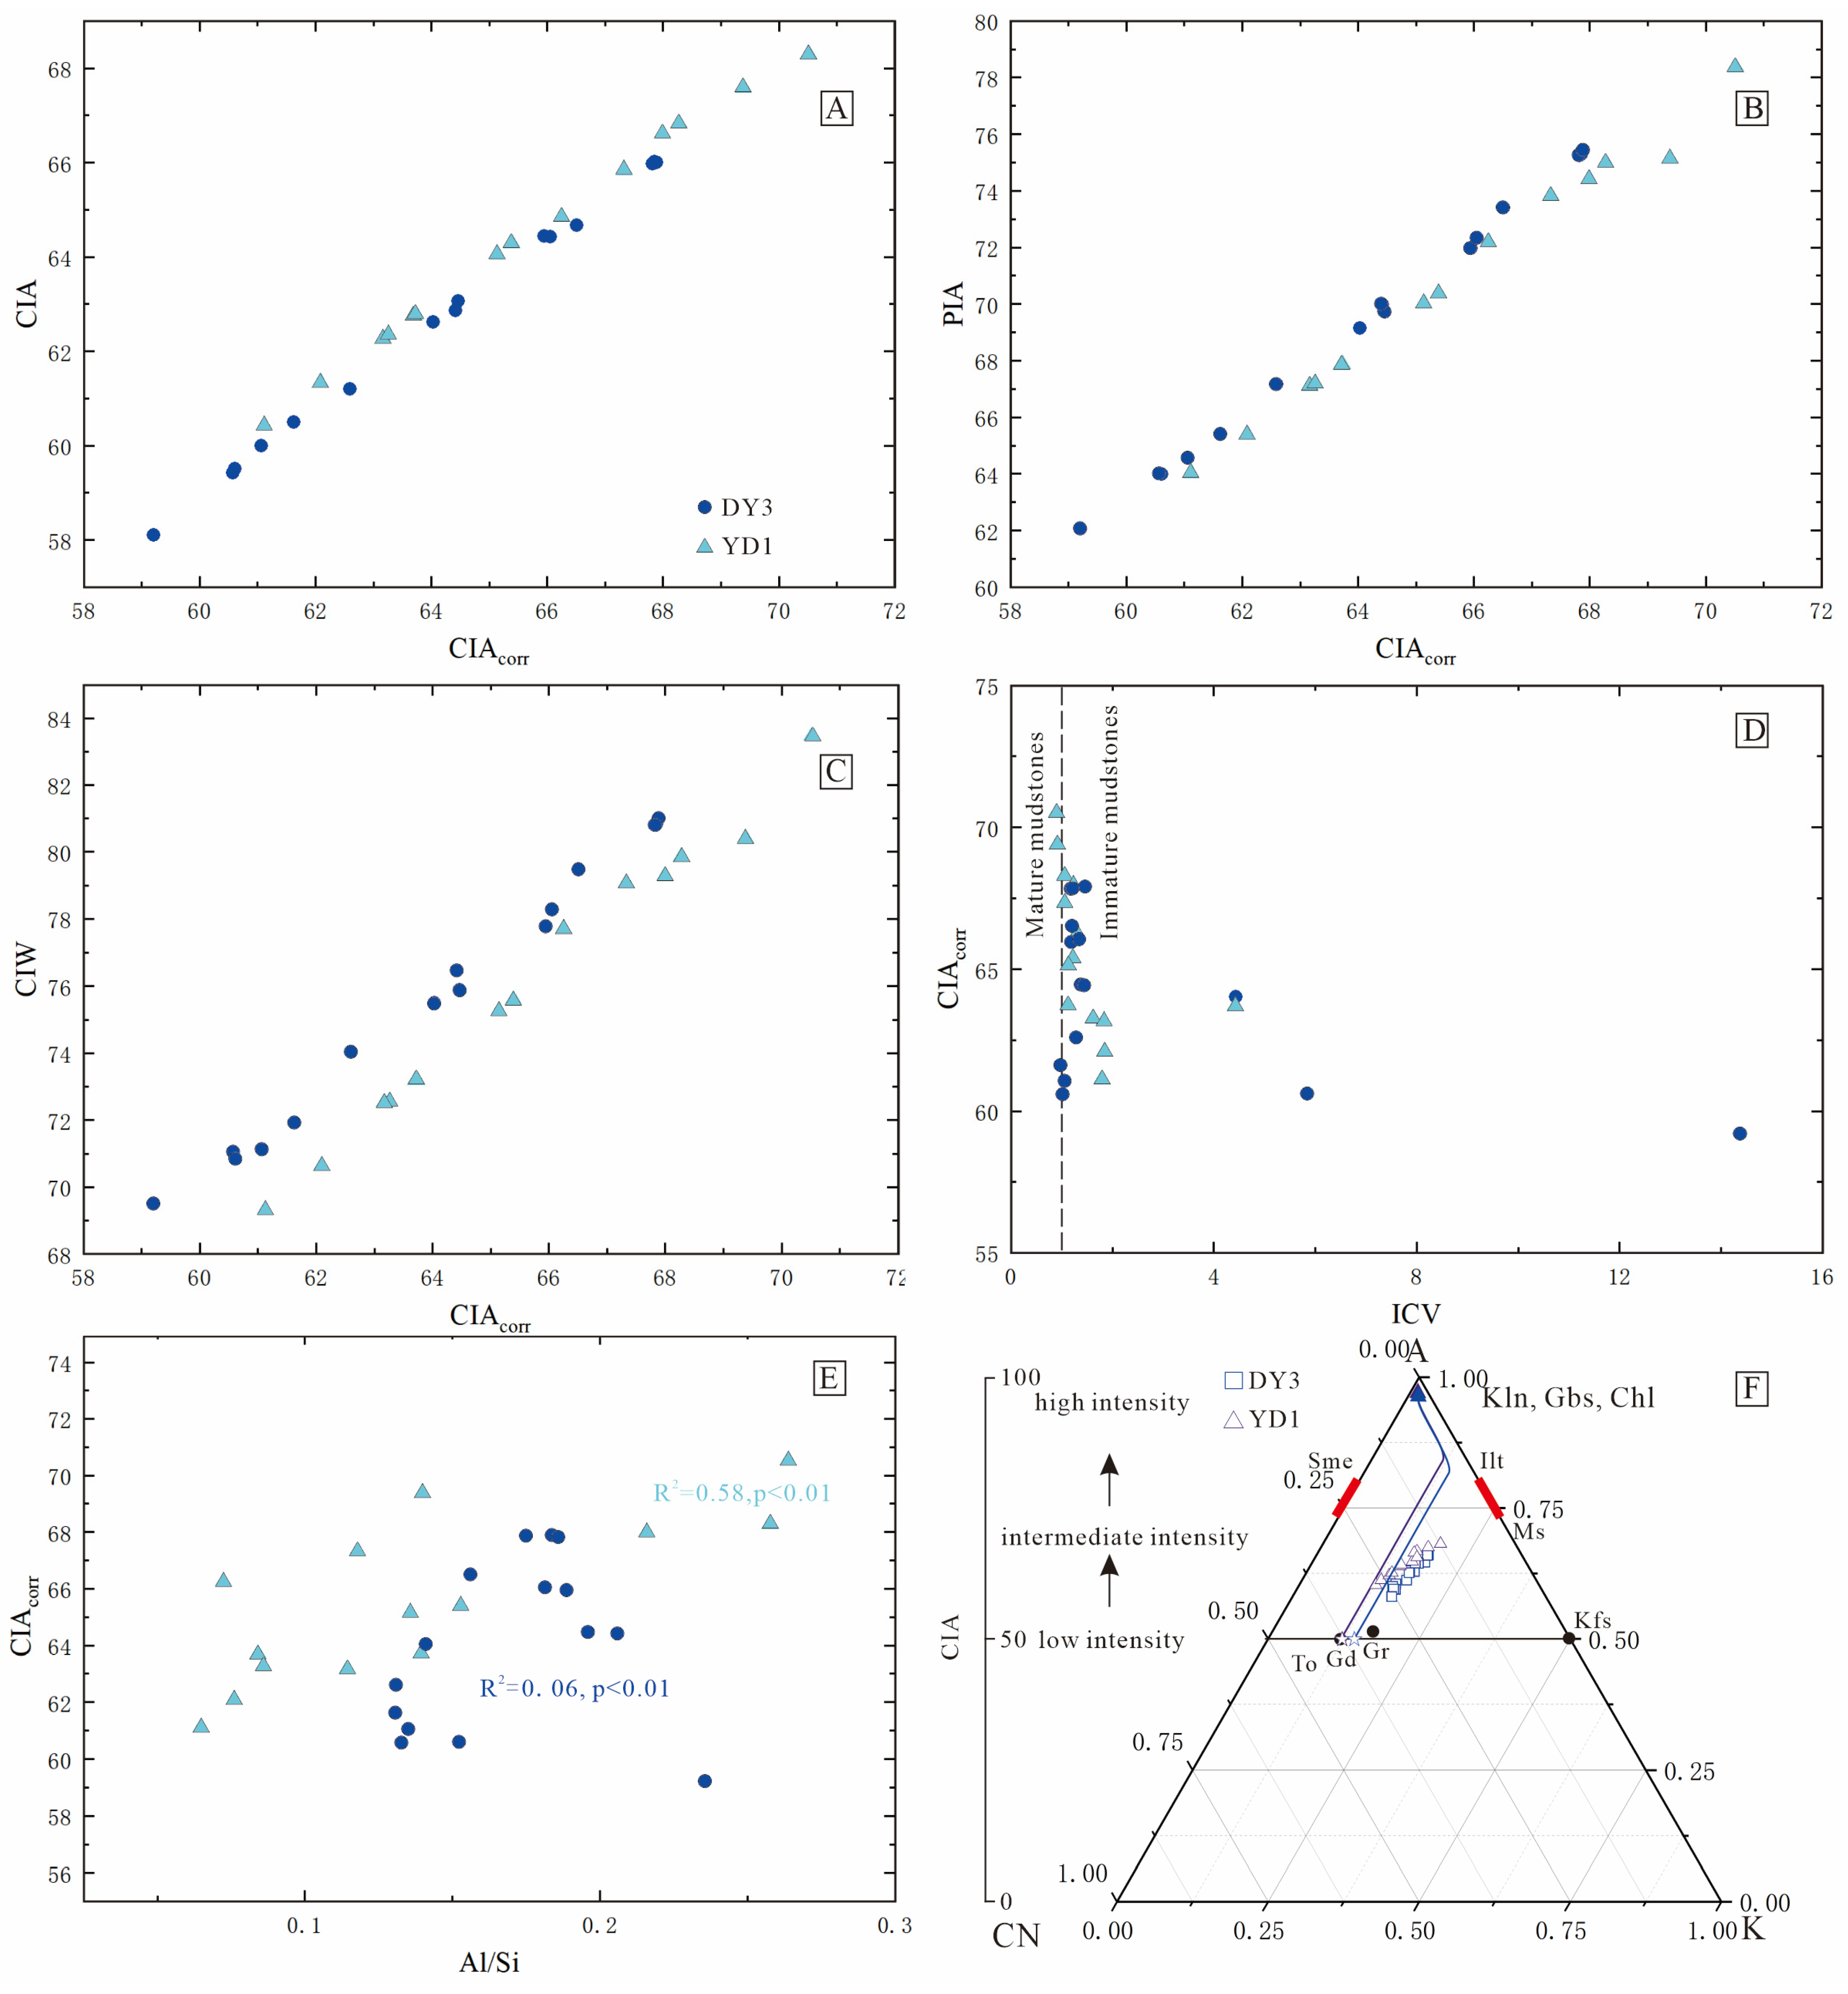
5.2.1. Evaluation of Weathering Proxies in Shales
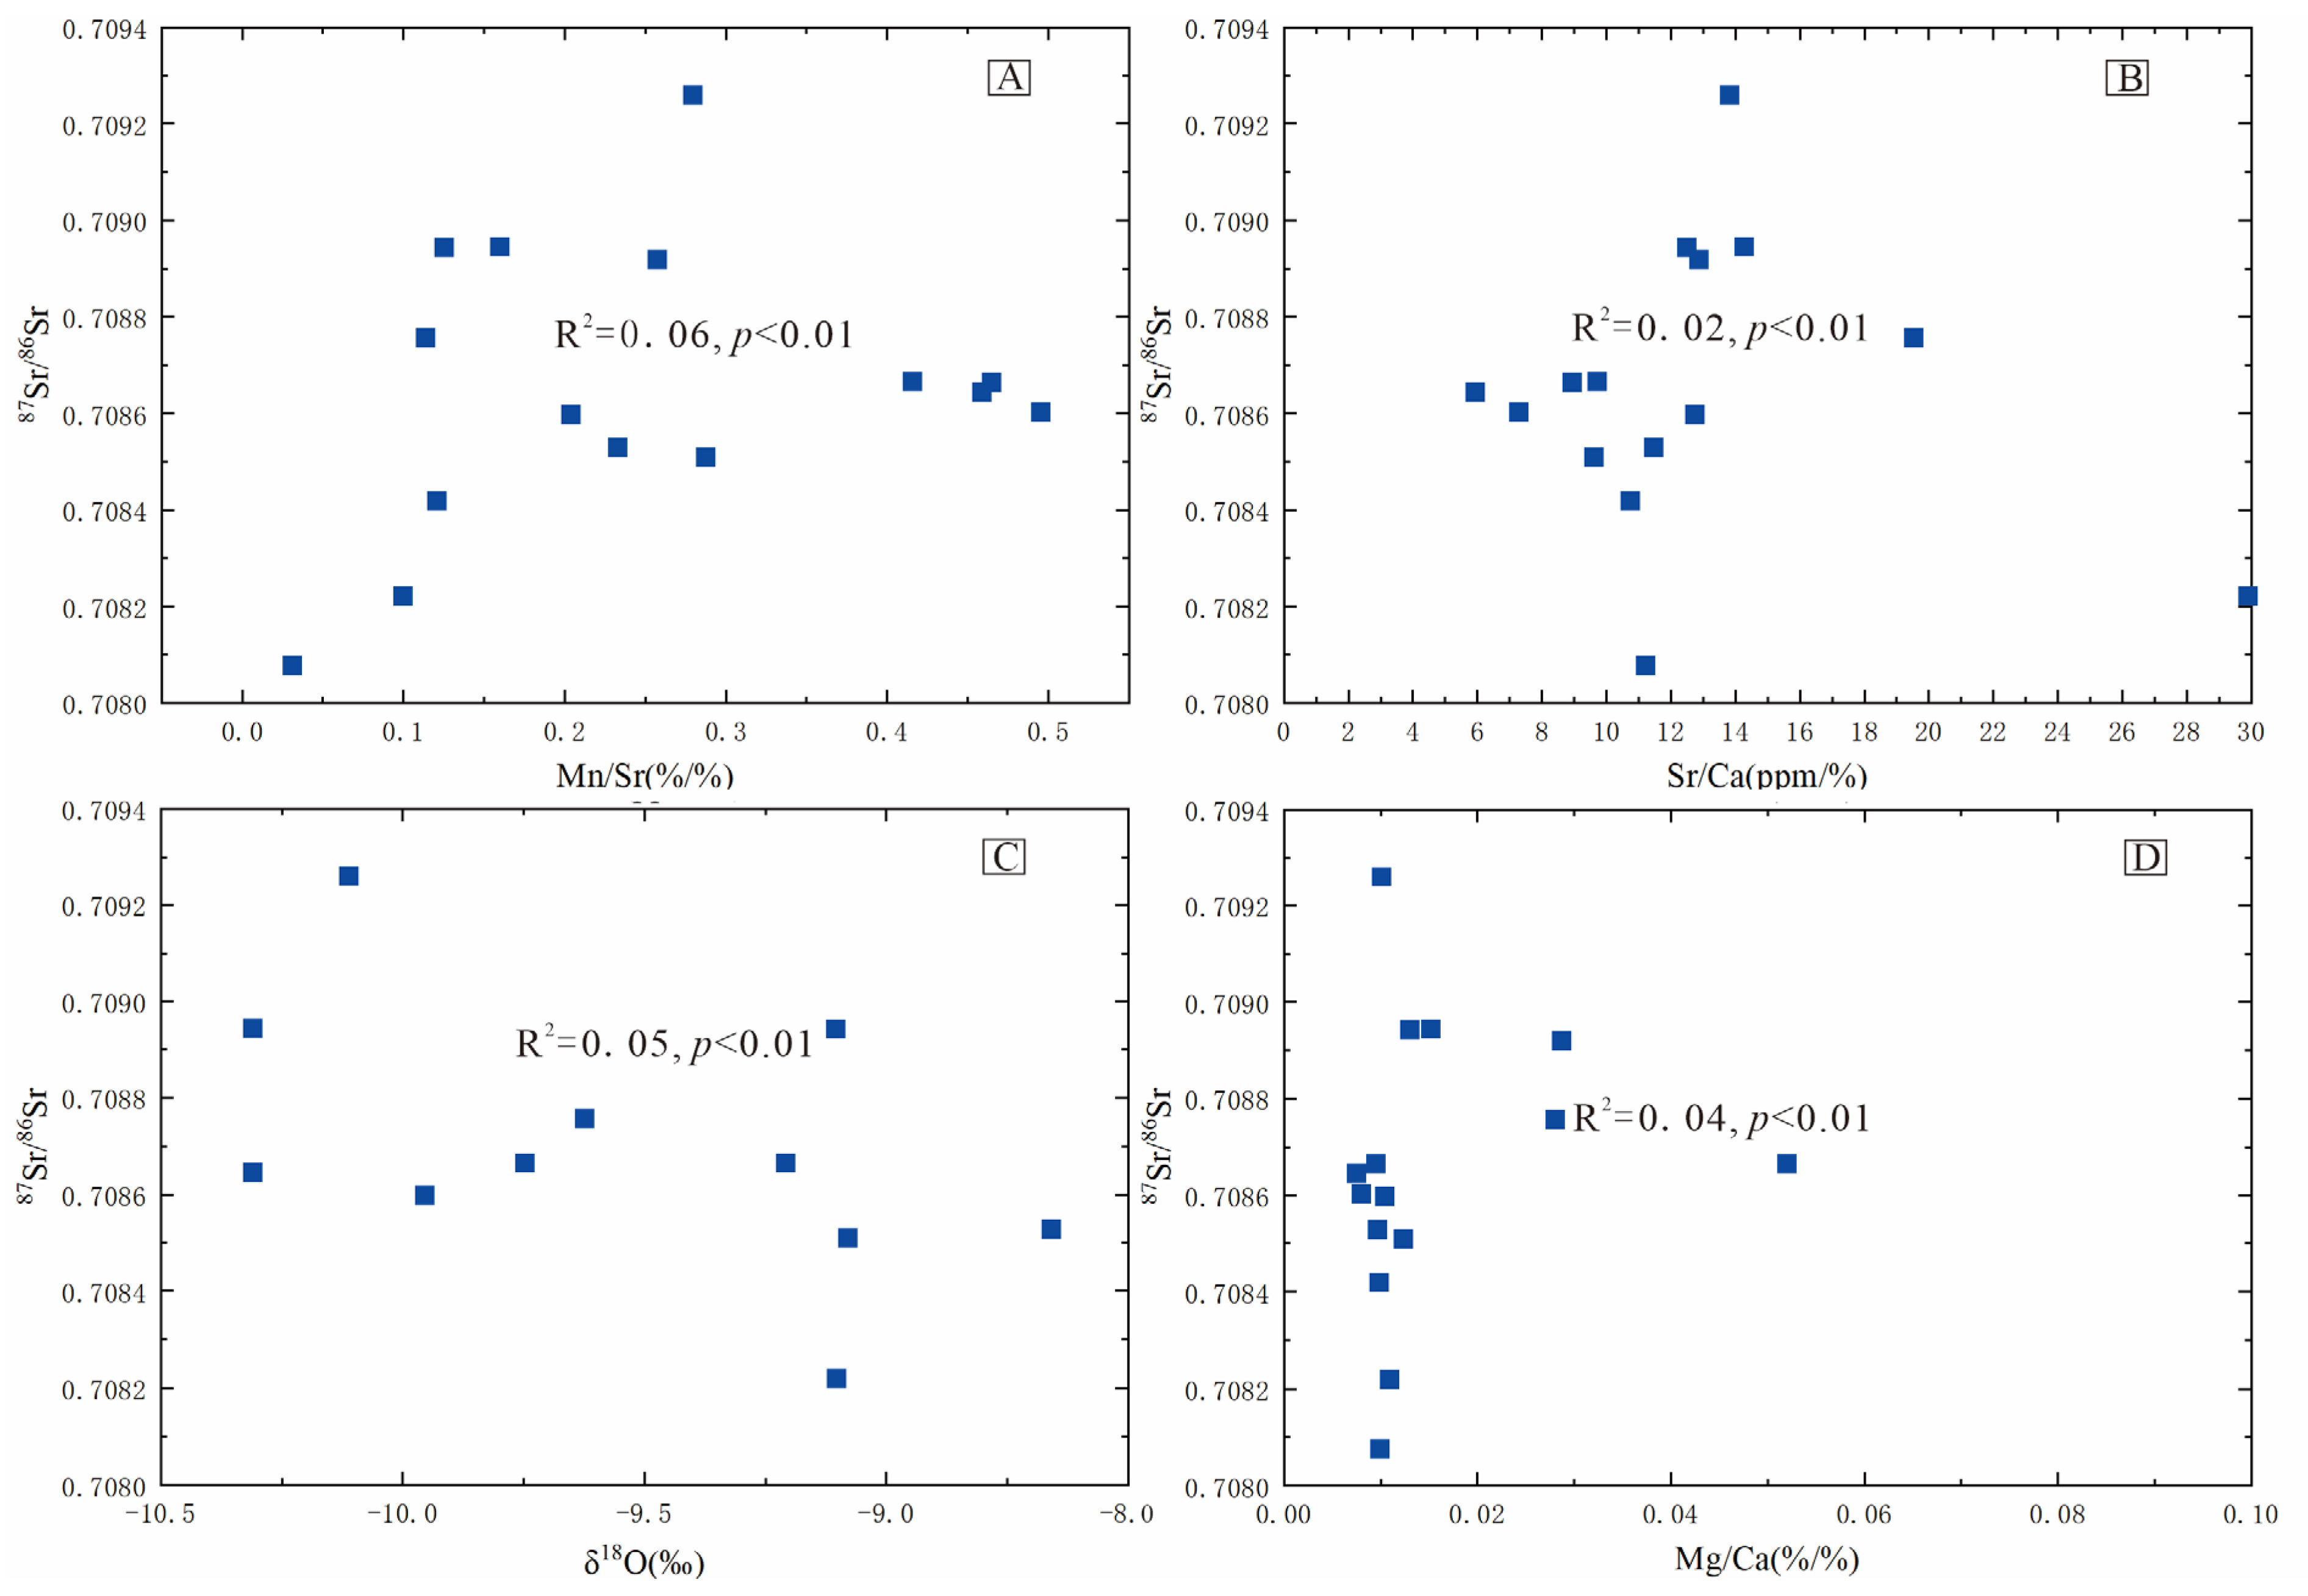
5.2.2. Evaluation of Carbonate 87Sr/86Sr
5.3. Fluctuations in Weathering Proxies in the Late Ordovician
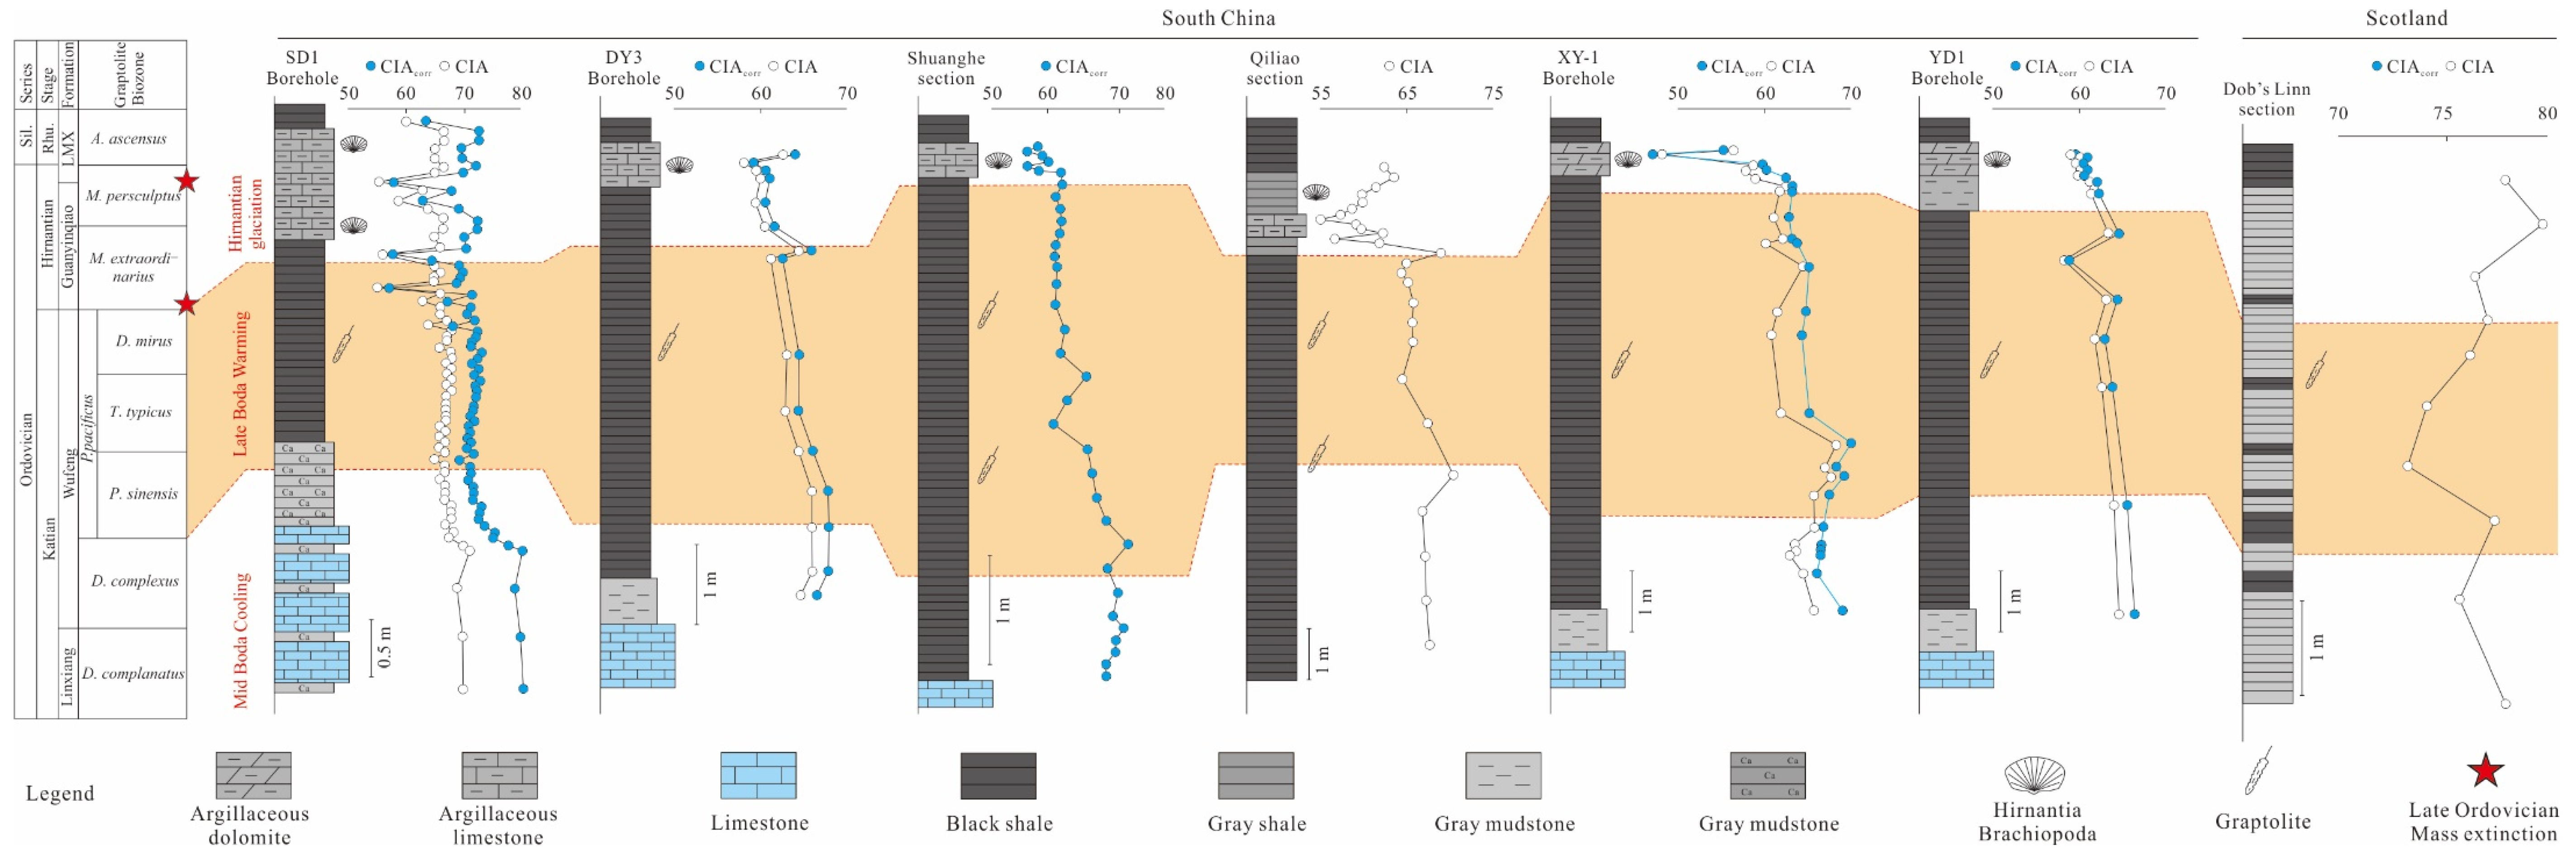
5.3.1. Fluctuations in CIAcorr Values in the Late Ordovician
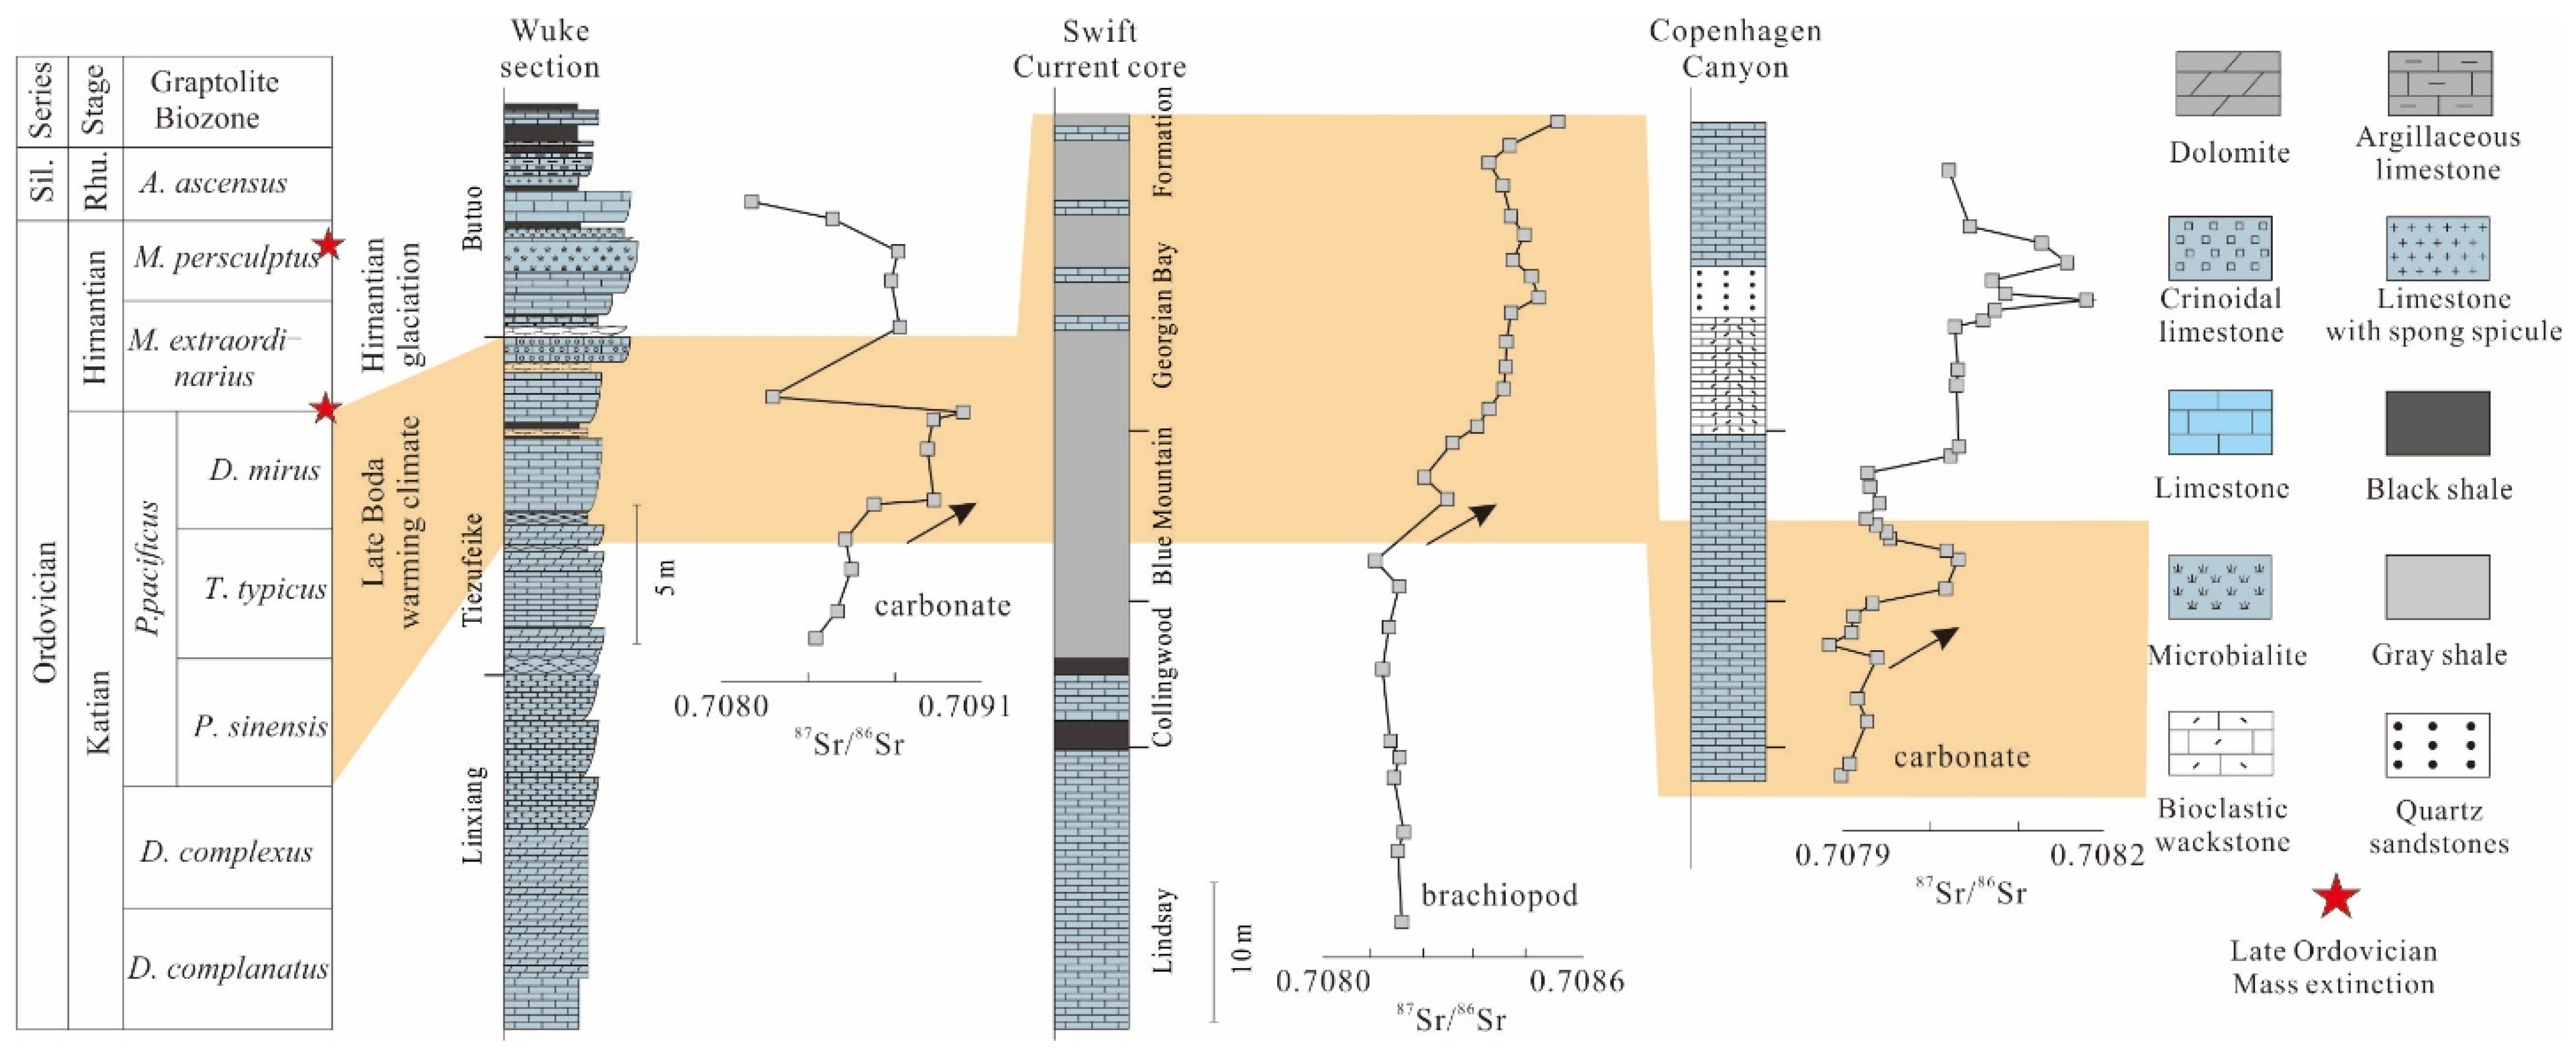
5.3.2. Fluctuations in Seawater 87Sr/86Sr in the Late Ordovician
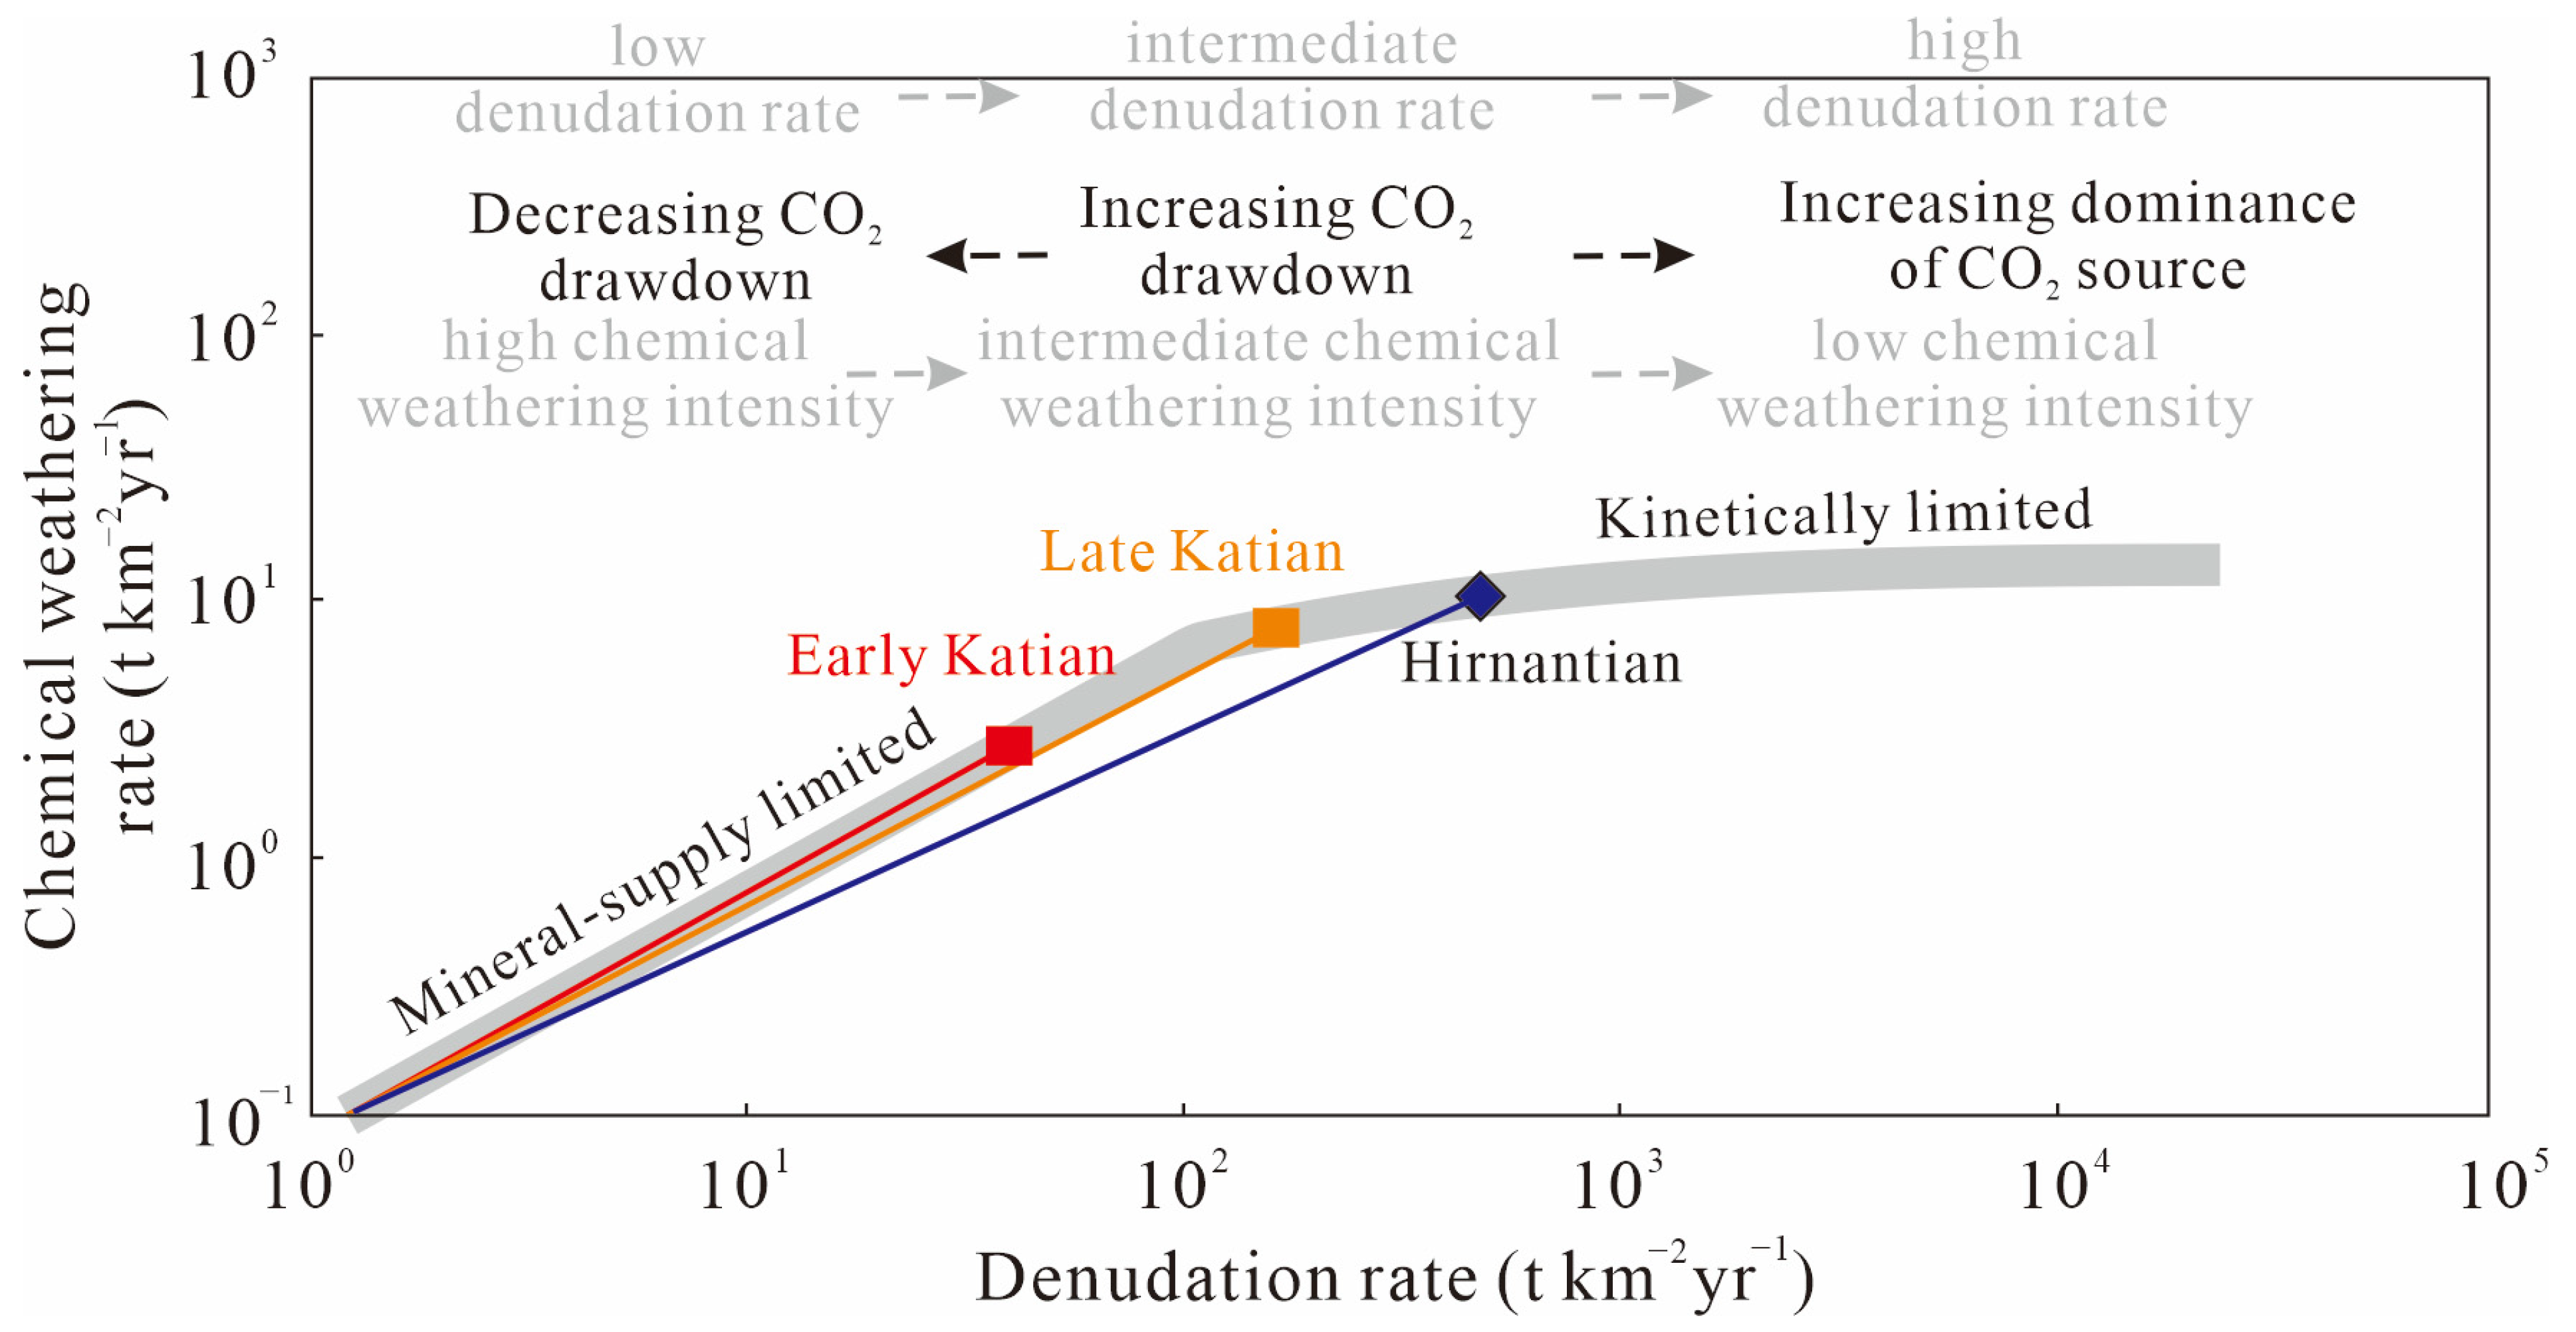
5.4. The Changes in Continental Weathering in the Late Ordovician
5.5. Implications for the Changes in Global Climates and LOMEs
6. Conclusions
Supplementary Materials
Author Contributions
Funding
Institutional Review Board Statement
Informed Consent Statement
Data Availability Statement
Conflicts of Interest
References
- Melchin, M.J.; Mitchell, C.E.; Holmden, C.; Štorch, P. Environmental changes in the Late Ordovician-early Silurian: Review and new insights from black shales and nitrogen isotopes. Geol. Soc. Am. Bull. 2013, 125, 1635–1670. [Google Scholar] [CrossRef]
- Harper, D.A.T.; Hammarlund, E.U.; Rasmussen, C.M.Ø. End Ordovician extinctions: A coincidence of causes. Gondwana Res. 2014, 25, 1294–1307. [Google Scholar] [CrossRef]
- Jin, C.S.; Liao, Z.W.; Lash, G.G. High-frequency redox variation across the Ordovician–Silurian transition, South China. Palaeogeogr. Palaeoclimatol. Palaeoecol. 2021, 566, 110218. [Google Scholar] [CrossRef]
- Deng, K.; Yang, S.Y.; Guo, Y.L. A global temperature control of silicate weathering intensity. Nat. Commun. 2022, 13, 1781. [Google Scholar] [CrossRef] [PubMed]
- Kump, L.R.; Arthur, M.A.; Patzkowsky, M.E.; Gibbs, M.T.; Pinkus, D.S.; Sheehan, P.M. A weathering hypothesis for glaciation at high atmospheric pCO2 during the Late Ordovician Interpreting carbon—Isotope excursions: Carbonates and organic matter. Palaeogeogr. Palaeoclimatol. Palaeoecol. 1999, 16152, 18173–19887. [Google Scholar]
- Finlay, A.J.; Selby, D.; Gröcke, D.R. Tracking the Hirnantian glaciation using Os isotopes. Earth Planet. Sci. Lett. 2010, 293, 339–348. [Google Scholar] [CrossRef]
- Lenton, T.; Michael, C.; Martin, J.; Pires, N.; Dolan, L. First plants cooled the Ordovician. Nat. Geosci. 2012, 5, 86–89. [Google Scholar] [CrossRef]
- Swanson-Hysell, N.L.; Macdonald, F.A. Tropical weathering of the Taconic orogeny as a driver for Ordovician cooling. Geology 2017, 45, 719–722. [Google Scholar] [CrossRef]
- Sproson, A.D.; von Strandmann, P.A.E.; Selby, D.; Jarochowska, E.; Frýda, J.; Hladil, J.; Loydell, D.K.; Slavík, L.; Calner, M.; Maier, G.; et al. Osmium and lithium isotope evidence for weathering feedbacks linked to orbitally paced organic carbon burial and Silurian glaciations. Earth Planet. Sci. Lett. 2022, 577, 117260. [Google Scholar] [CrossRef]
- Deng, Y.; Fan, J.X.; Zhang, S.H.; Fang, X.; Chen, Z.Y.; Shi, T.K.; Wang, H.W.; Wang, X.B.; Yang, J.; Hou, X.D. Timing and patterns of the Great Ordovician Biodiversification Event and Late Ordovician mass extinction: Perspectives from South China. Earth Sci. Rev. 2021, 220, 103743. [Google Scholar] [CrossRef]
- Harper, D.A.T. Late Ordovician Mass Extinction: Earth, fire and ice. Natl. Sci. Rev. 2024, 11, nwad319. [Google Scholar] [CrossRef] [PubMed]
- Sheehan, P.M. The Late Ordovician mass extinction. Annu. Rev. Earth Planet. Sci. 2001, 29, 331–364. [Google Scholar] [CrossRef]
- Yan, D.T.; Chen, D.Z.; Wang, Q.C.; Wang, J.G. Large-scale climatic fluctuations in the latest Ordovician on the Yangtze block, South China. Geology 2010, 38, 599–602. [Google Scholar] [CrossRef]
- Hammarlund, E.U.; Dahl, T.W.; Harper, D.A.T.; Bond, D.P.G.; Nielsen, A.T.; Bjerrum, C.J.; Schovsbo, N.H.; Schönlaub, H.P.; Zalasiewicz, J.A.; Canfield, D.E. A sulfidic driver for the end-Ordovician mass extinction. Earth Planet. Sci. Lett. 2012, 331, 128–139. [Google Scholar] [CrossRef]
- Jones, D.; Martini, A.; Fike, D. A volcanic trigger for the Late Ordovician mass extinction? Mercury data from south China and Laurentia. Geology 2017, 45, 631–634. [Google Scholar] [CrossRef]
- Zou, C.N.; Qiu, Z.; Poulton, S.W.; Dong, D.Z.; Wang, H.Y.; Chen, D.Z.; Lu, B.; Shi, Z.S.; Tao, H.F. Ocean euxinia and climate change “double whammy” drove the Late Ordovician mass extinction. Geology 2018, 46, 535–538. [Google Scholar] [CrossRef]
- Liu, M.; Chen, D.Z.; Jiang, L.; Stockey, R.G.; Aseal, D.; Zhang, B.; Liu, K.; Yang, X.R.; Yan, D.T.; Planavsky, N.J. Oceanic anoxia and extinction in the latest Ordovician. Earth Planet. Sci. Lett. 2022, 588, 117553. [Google Scholar] [CrossRef]
- Wang, P.; Du, Y.S.; Yu, W.C.; Algeo, T.J.; Zhou, Q.; Xu, Y.; Qi, L.; Yuan, L.J.; Pan, W. The chemical index of alteration (CIA) as a proxy for climate change during glacial-interglacial transitions in Earth history. Earth Sci. Rev. 2020, 201, 103032. [Google Scholar] [CrossRef]
- Walker, J.C.G.; Hays, P.B.; Kasting, J.F. A negative feedback mechanism for the long-term stabilization of earth’s surface temperature. Geophys. Res. Lett. 1981, 86, 9776–9782. [Google Scholar] [CrossRef]
- Berner, R.A. Weathering, plants, and the long-term carbon cycle. Geochim. Et Cosmochim. Acta 1992, 56, 3225–3231. [Google Scholar] [CrossRef]
- Föllmi, K. The phosphorus cycle, phosphogenesis and marine phosphate-rich deposits. Earth Sci. Rev. 1996, 40, 55–124. [Google Scholar] [CrossRef]
- Raymo, M.E.; Ruddiman, W.F. Tectonic forcing of late Cenozoic climate. Nature 1992, 359, 117–122. [Google Scholar] [CrossRef]
- Caves, J.K.; Ibarra, D.E.; Von Blanckenburg, F. Neogene cooling driven by land surface reactivity rather than increased weathering fluxes. Nature 2019, 571, 99–102. [Google Scholar] [CrossRef] [PubMed]
- Wang, Y.Y.; Liang, K.; Xiao, Y.L.; Chen, B.; Shan, E.H.; Yang, T.Y.; Zhang, M.; Sun, H.; Gu, H.O.; Tong, F.T.; et al. Carbonate lithium isotope systematics indicate cooling triggered mass extinction during the Frasnian-Famennian transition. Glob. Planet. Chang. 2023, 230, 104284. [Google Scholar] [CrossRef]
- Buggisch, W.; Joachimski, M.M.; Lehnert, O.; Bergstrom, M.; Repetski, E.; Webers, F. Did intense volcanism trigger the first Late Ordovician icehouse? Geology 2010, 38, 327–330. [Google Scholar] [CrossRef]
- Lefebvre, V.; Servais, T.; Francois, L.; Averbuch, O. Did a Katian large igneous province trigger the Late Ordovician glaciation? A hypothesis tested with a carbon cycle model. Palaeogeogr. Palaeoclimatol. Palaeoecol. 2010, 296, 310–319. [Google Scholar] [CrossRef]
- Pogge Von Strandmann, P.A.E.; Desrochers, A.; Murphy, M.J.; Finlay, A.J.; Selby, D.; Lenton, T.M. Global climate stabilisation by chemical weathering during the Hirnantian glaciation. Geochem. Perspect 2017, 3, 230–237. [Google Scholar] [CrossRef]
- West, A.J.; Galy, A.; Bickle, M. Tectonic and climatic controls on silicate weathering. Earth Planet. Sci. Lett. 2005, 235, 211–228. [Google Scholar] [CrossRef]
- Shen, J.; Yin, R.S.; Zhang, S.; Algeo, T.J.; Bottjer, D.J.; Yu, J.X.; Xu, G.Z.; Penman, D.; Wang, Y.D.; Li, L.Q.; et al. Intensified continental chemical weathering and carbon-cycle perturbations linked to volcanism during the Triassic–Jurassic transition. Nat. Commun. 2022, 13, 299. [Google Scholar] [CrossRef]
- Yang, J.H.; Cawood, P.A.; Condon, D.J.; Liu, J.Z.; Deng, X.S.; Wang, J.F.; Du, Y.S.; Yuan, D.X. Anomalous weathering trends indicate accelerated erosion of tropical basaltic landscapes during the Permo-Triassic warming. Earth Planet. Sci. Lett. 2022, 577, 117256. [Google Scholar] [CrossRef]
- Pogge von Strandmann, P.A.E.; Jones, M.T.; West, A.J.; Murphy, M.J.; Stokke, E.W.; Tarbuck, G.; Wilson, D.J.; Pearce, C.R.; Schmidt, D.N. Lithium isotope evidence for enhanced weathering and erosion during the Paleocene-Eocene Thermal Maximum. Sci. Adv. 2021, 7, eabh4224. [Google Scholar] [CrossRef] [PubMed]
- Bufe, A.; Rugenstein, J.K.C.; Hovius, N. CO2 drawdown from weathering is maximized at moderate erosion rates. Science 2024, 383, 1075–1080. [Google Scholar] [CrossRef] [PubMed]
- Veizer, J. Strontium isotopes in seawater through time. Annu. Rev. Earth Planet. Sci. 1989, 17, 141–167. [Google Scholar] [CrossRef]
- Dennison, R.E.; Koepnick, R.B.; Burke, W.H.; Hetherington, E.A. Construction of the Cambrian and Ordovician seawater 87Sr/86Sr curve. Chem. Geol. 1998, 152, 325–340. [Google Scholar] [CrossRef]
- McArthur, J.M.; Howarth, R.J.; Bailey, T.R. Strontium isotope stratigraphy: LOWESS version 3: Best fit to the marine isotope curve for 0–509 Ma and accompanying look-up table for deriving numerical age. J. Geol. 2001, 109, 155–170. [Google Scholar] [CrossRef]
- Saltzman, M.R.; Edwards, C.T.; Leslie, S.A.; Dwyer, G.S.; Bauer, J.A.; Repetski, J.; Harris, A.; Bergström, S.M. Calibration of a conodont apatite-based Ordovician 87Sr/86Sr curve to biostratigraphy and geochronology: Implications for stratigraphic resolution. Geol. Soc. Am. Bull. 2014, 126, 1551–1568. [Google Scholar] [CrossRef]
- Edwards, C.T.; Saltzma, M.R.; Leslie, S.A.; Bergstrm, S.M.; Sedlacek, A.R.C.; Howard, A.; Bauer, J.A.; Sweet, W.C.; Young, S.A. Strontium isotope (87Sr/86Sr) stratigraphy of Ordovician bulk carbonate: Implications for preservation of primary seawater values. Geol. Soc. Am. Bull. 2015, 127, 1275–1289. [Google Scholar] [CrossRef]
- Wang, W.Q.; Garbelli, C.; Zheng, Q.F.; Chen, J.; Liu, X.C.; Wang, W.; Shen, S.Z. Permian 87Sr/86Sr chemostratigraphy from carbonate sequences in South China. Palaeogeogr. Palaeoclimatol. Palaeoecol. 2018, 500, 84–94. [Google Scholar] [CrossRef]
- Harnois, L. The CIW index: A new chemical index of weathering. Sediment. Geol. 1988, 55, 319–322. [Google Scholar] [CrossRef]
- Price, J.R.; Velbel, M.A. Chemical weathering indices applied to weathering profiles developed on heterogeneous felsic metamorphic parent rocks. Chem. Geol. 2003, 202, 397–416. [Google Scholar] [CrossRef]
- Chen, W.Z.; Tian, J.C.; Lin, X.B.; Liang, Q.S.; Wang, X.; Yi, D.X.; Li, Y.Y. Climate fluctuations during the Ordovician-Silurian transition period in South China: Implications for paleoenvironmental evolution and organic matter enrichment. Palaeogeogr. Palaeoclimatol. Palaeoecol. 2023, 613, 111411. [Google Scholar] [CrossRef]
- Zhang, G.; Guo, A.; Wang, Y.J.; Li, S.D.; Dong, Y.P.; Liu, S.F.; He, D.F.; Cheng, S.Y.; Lu, R.K.; Yao, A.P. Tectonics of South China continent and its implications. Sci. China Earth Sci. 2013, 56, 1804–1828. [Google Scholar] [CrossRef]
- Lu, Y.B.; Hao, F.; Yan, D.T.; Lu, Y.C. Volcanism-induced late Boda warming in the Late Ordovician: Evidence from the Upper Yangtze Platform, South China. Palaeogeogr. Palaeoclimatol. Palaeoecol. 2021, 578, 110579. [Google Scholar] [CrossRef]
- Chen, X. Influencece of the Late Ordovician glaciation on the basin configuration of the Yangtze Platform in China. Lethaia 1984, 17, 51–59. [Google Scholar]
- Chen, C.; Mu, C.; Zhou, K.K.; Liang, W.; Ge, X.Y.; Wang, X.P.; Wang, Q.Y.; Zheng, B.S. The geochemical characteristics and factors controlling the organic matter accumulation of the Late Ordovician-Early Silurian black shale in the Upper Yangtze Basin, South China. Mar. Pet. Geol. 2016, 76, 159–175. [Google Scholar] [CrossRef]
- Chen, X.; Rong, J.Y.; Fan, J.X.; Zhan, R.B.; Mitchell, C.E.; Harper, D.A.T.; Melchin, M.J.; Peng, P.A.; Finney, S.C.; Wang, X.F. The Global boundary Stratotype Section and Point (GSSP) for the base of the Hirnantian Stage (the uppermost of the Ordovician System). Epis. J. Int. Geosci. 2006, 29, 183–196. [Google Scholar] [CrossRef]
- Gradstein, F.M.; Ogg, J.G.; Schmitz, M.; Ogg, G. (Eds.) The Geologic Time Scale 2012; Elsevier: Amsterdam, The Netherlands, 2012; Volume 2. [Google Scholar]
- Ge, X.; Chen, D.; Zhang, G.; Huang, T.; Liu, M.; El-Shafeiy, M. Marine redox evolution and organic accumulation in an intrashelf basin, NE Sichuan Basin during the Late Permian. Mar. Pet. Geol. 2022, 140, 105633. [Google Scholar] [CrossRef]
- Nesbitt, H.W.; Young, G.M. Early Proterozoic climates and plate motions inferred from major element chemistry of lutites. Nature 1982, 299, 715–717. [Google Scholar] [CrossRef]
- McLennan, S.M. Weathering and global denudation. J. Geol. 1993, 101, 295–303. [Google Scholar] [CrossRef]
- Fedo, C.M.; Nesbitt, H.W.; Young, G.M. Unraveling the effects of potassium metasomatism in sedimentary rocks and paleosols, with implications for paleoweathering conditions and provenance. Geology 1995, 23, 921–924. [Google Scholar] [CrossRef]
- Cox, R.; Low, D.R.; Cullers, R.L. The influence of sediment recycling and basement composition on evolution of mudrock chemistry in the southwestern United States. Geochim. Cosmochim. Acta 1995, 59, 2919–2940. [Google Scholar] [CrossRef]
- Yang, X.; Yan, D.; Chen, D.; Liu, M.; She, X.; Zhang, J.; Wei, X.; Lu, Z. Spatial variation of carbon isotopic compositions of carbonate and organic matter from the Late Ordovician sedimentary succession in the Yangtze Platform, South China: Implications for sea—Level eustacy and shoaling of marine chemocline. J. Asian Earth Sci. 2020, 202, 104540. [Google Scholar] [CrossRef]
- Xue, S.; Wang, Q.; Deng, J.; Wang, Y.; Peng, T. Mechanism of organic matter assimilation and its role in sulfde saturation of oxidized magmatic ore-forming system: Insights from C-S-Sr-Nd isotopes of the Tulaergen deposit in NW China. Miner. Depos. 2022, 57, 1123–1141. [Google Scholar] [CrossRef]
- Zhang, W.; Hu, Z.C. Estimation of isotopic reference values for pure materials and geological reference materials. At. Spectrosc. 2020, 41, 93–102. [Google Scholar] [CrossRef]
- Van de Kamp, P.C. Potassium distribution and metasomatism in pelites and schists: How and When, relation tpost-depositionalal events. J. Sediment Res. 2016, 86, 683–711. [Google Scholar] [CrossRef]
- Cullers, R.L.; Podkovyrov, V.N. Geochemistry of the Mesoproterozoic Lakhanda shales in southeastern Yakutia, Russia: Implications for mineralogical and provenance control and recycling. Precambrian Res. 2020, 104, 77–93. [Google Scholar] [CrossRef]
- Yang, X.R.; Yan, D.T.; Chen, D.Z.; Liu, M.; She, X.H.; Zhang, B.; Zhang, L.W.; Zhang, J.F. Spatiotemporal variations of sedimentary carbon and nitrogen isotopic compositions in the Yangtze Shelf Sea across the Ordovician-Silurian boundary. Palaeogeogr. Palaeoclimatol. Palaeoecol. 2021, 567, 110257. [Google Scholar] [CrossRef]
- Chen, C. Research on Paleoceanography, Paleoclimate and Formation Mechanism of Source Rock During Geologic Transition Period from Late Ordovician to Early Silurian in Southern Sichuan Province—Northern Guizhou Province, South China; China University of Geosciences: Wuhan, China, 2018. [Google Scholar]
- Ahm, A.S.; Bjerrum, C.J.; Hammarlund, E.U. Disentangling the record of diagenesis, local redox conditions, and global seawater chemistry during the latest Ordovician glaciation. Earth Planet. Sci. Lett. 2017, 459, 145–156. [Google Scholar] [CrossRef]
- Myrow, P.M.; Fike, D.A.; Malmskog, E.; Leslie, S.A.; Zhang, T.R.; Singh, B.P.; Chaubey, R.S.; Prasad, S.K. Ordovician–Silurian boundary strata of the Indian Himalaya: Record of the latest Ordovician Boda event. Geol. Soc. Am. Bull. 2019, 131, 881–898. [Google Scholar] [CrossRef]
- Finnegan, S.; Bergmann, K.; Eiler, J.M.; Jones, D.S.; Fike, D.A.; Eisenman, I.; Hughes, N.C.; Tripati, A.K.; Fischer, W.W. The magnitude and duration of Late Ordovician-Early Silurian glaciation. Science 2011, 331, 903–906. [Google Scholar] [CrossRef]
- Armstrong, H.A.; Baldini, J.U.L.; Challands, T.J.; Grocke, D.R.; Owen, A.W. Response of the Intertropical Convergence Zone to Southern Hemisphere cooling during Upper Ordovician glaciation. Palaeogeogr. Palaeoclimatol. Palaeoecol. 2009, 284, 227–236. [Google Scholar] [CrossRef]
- Wang, Y.; Tan, J.Q.; Wang, W.H. The influence of Late Ordovician volcanism on the marine environment based on high-resolution mercury data from South China. Geol. Soc. Am. Bull. 2023, 135, 787–798. [Google Scholar] [CrossRef]
- Basu, H.; Dandele, P.S.; Kumar, K.R.; Achar, K.K.; Umamaheswar, K. Geochemistry of black shales from the Mesoproterozoic Srisailam Formation, Cuddapah basin, India: Implications for provenance, palaeoweathering, tectonics, and timing of Columbia breakup. Chem. Erde. 2017, 77, 596–613. [Google Scholar] [CrossRef]
- Bayon, G.; Bindeman, I.N.N.; Trinquier, A.; Retallack, G.J.; Bekker, A. Long-term evolution of terrestrial weathering and its link to Earth’s oxygenation. Earth Planet. Sci. Lett. 2022, 584, 117490. [Google Scholar] [CrossRef]
- Perri, F.; Cavalcante, F.; Martín-Martín, M.; Sánchez-Navas, A.; Alcalá, F.J. Cenozoic tectono-sedimentary evolution of the external rif chain (Morocco) derived from mineralogical and geochemical analysis of mudrocks. Mar. Pet. Geol. 2024, 170, 107124. [Google Scholar] [CrossRef]
- Bayon, G.; Toucanne, S.; Skonieczny, C.; Andre, L.; Bermell, S.; Cheron, S.; Dennielou, B.; Etoubleau, J.; Freslon, N.; Gauchery, T.; et al. Rare earth elements and neodymium isotopes in world river sediments revisited. Geochim. Cosmochim. Acta 2015, 170, 17–38. [Google Scholar] [CrossRef]
- Bhatia, M.R.; Crook, K.A. Trace element characteristics of graywackes and tectonic setting discrimination of sedimentary basins. Contrib. Mineral. Petrol 1986, 92, 181–193. [Google Scholar] [CrossRef]
- Algeo, T.J.; Tribovillard, N. Environmental analysis of paleoceanographic systems based on molybdenum–uranium covariation. Chem. Geol. 2009, 268, 211–225. [Google Scholar] [CrossRef]
- Tribovillard, N.; Algeo, T.J.; Baudin, F.; Riboulleau, A. Analysis of marine environmental conditions based on molybdenum–uranium covariation—Applications to Mesozoic paleoceanography. Chem. Geol. 2012, 324–325, 46–58. [Google Scholar] [CrossRef]
- Sweere, T.; van den Boorn, S.; Dickson, A.J.; Reichart, G.-J. Definition of new trace metal proxies for the controls on organic matter enrichment in marine sediments based on Mn, Co, Mo and Cd concentrations. Chem. Geol. 2016, 441, 235–245. [Google Scholar] [CrossRef]
- Sawaki, Y.; Ohno, T.; Tahata, M.; Komiya, T.; Hirata, T.; Maruyama, S.; Windley, B.F.; Han, J.; Shu, D.G.; Li, Y. The Ediacaran radiogenic Sr isotope excursion in the Doushantuo Formation in the Three Gorges area, South China. Precambrian Res. 2010, 176, 46–64. [Google Scholar] [CrossRef]
- Jacobsen, S.B.; Kaufman, A.J. The Sr, C and O isotopic evolution of Neoproterozoic seawater. Chem. Geol. 1999, 161, 37–57. [Google Scholar] [CrossRef]
- Banner, J.L.; Hanson, G.N. Calculation of simultaneous isotopic and trace element variations during water-rock interaction with applications to carbonate diagenesis. Geochim. Cosmochim. Acta 1990, 54, 3123–3137. [Google Scholar] [CrossRef]
- Liu, C.; Wang, Z.; Raub, T.D.; Macdonald, F.A.; Evans, D.A.D. Neoproterozoic cap dolostone deposition in stratified glacial meltwater plume. Earth Planet. Sci. Lett. 2014, 404, 22–32. [Google Scholar] [CrossRef]
- He, L.; Wang, Y.P.; Chen, D.F. Geochemical features of sedimentary environment and paleoclimate during Late Ordovician to Early Silurian in southern Sichuan Basin. Geochemica 2019, 48, 555–566. [Google Scholar]
- Zhang, H. Analysis of Paleoclimate and Provenance Characteristics of Black Shale in Wufeng-Longmaxi Formation in Xianfeng Area, Western Hubei Province. Coal Geol. Chin. 2022, 34, 22–33, (In Chinese with English Abstract). [Google Scholar]
- Hu, D.P.; Zhang, X.L.; Zhou, L.; Finney, S.C.; Liu, Y.S.; Shen, D.; Shen, M.G.; Huang, W.; Shen, Y.N. 87Sr/86Sr evidence from the epeiric Martin Ridge Basin for enhanced carbonate weathering during the Hirnantian. Sci. Rep. 2017, 7, 11348. [Google Scholar] [CrossRef]
- Young, S.A.; Saltzman, M.R.; Foland, K.A.; Linder, J.S.; Kump, L.R. A major drop in seawater 87Sr/86Sr during the Middle Ordovician (Darriwilian): Links to volcanism and climate. Geology 2009, 37, 951–954. [Google Scholar] [CrossRef]
- Hannigan, R.; Brookfield, M.E.; Basu, A.R. A detailed 87Sr/86Sr isotopic curve for the mid-Cincinnatian (Upper Katian-Lower Hirnantian, Upper Ordovician), NE North American Shelf (Ontario, Canada) transition to the Hirnantian glaciation. Chem. Geol. 2010, 277, 336–344. [Google Scholar] [CrossRef]
- Guacaneme, C.; Babinski, M.; Bedoya-Rueda, C.; Paula-Santos, G.M.; Caetano-Filho, S.; Kuchenbecker, M.; Reis, H.L.S.; Trindade, R.I.F. Tectonically-induced strontium isotope changes in ancient restricted seas: The case of the Ediacaran-Cambrian Bambuí foreland basin system, east Brazil. Gondwana Res. 2021, 93, 275–290. [Google Scholar] [CrossRef]
- Zhang, X.; Zhou, G.; Zhang, P.; He, Y.; Wei, Z.; Wang, G.; Zhang, T.; He, W.; Ma, H.; Zhu, C.; et al. Strontium isotope and element constraints on the paleoenvironment of the latest Ediacaran in the Sichuan Basin, southeastern Tibetan Plateau. Front. Earth Sci. 2022, 10, 865709. [Google Scholar] [CrossRef]
- Lu, Y.B.; Jiang, S.; Lu, Y.C.; Xu, S.; Shu, Y.; Wang, Y.X. Productivity or preservation? The factors controlling the organic matter accumulation in the late Katian through Hirnantian Wufeng organic-rich shale, South China. Mar. Pet. Geol. 2019, 109, 22–35. [Google Scholar] [CrossRef]
- Qiu, Z.; Li, Y.F.; Xiong, W.; Fan, T.L.; Zhao, Q.; Zhang, Q.; Wang, Y.M.; Liu, W.; Liang, F.; Zhang, J.Q.; et al. Revisiting paleoenvironmental changes on the Upper Yangtze Blockduring the Ordovician-Silurian transition: New insights from elemental geochemistry. Sediment. Geol. 2023, 450, 106377. [Google Scholar] [CrossRef]
- Abdi, Z.; Rimmer, S.M.; Rowe, H.D.; Nordeng, S. Assessment of bi-metal paleo-redox proxies in the Bakken Formation black shales, Williston Basin, North Dakota, USA. Chem. Geol. 2024, 670, 122439. [Google Scholar] [CrossRef]
- Avila, T.D.; Saltzman, M.R.; Adiatma, Y.D.; Joachimski, M.M.; Griffith, E.M.; Olesik, J.W. Role of seafloor production versus continental basalt weathering in Middle to Late Ordovician seawater 87Sr/86Sr and climate. Earth Planet. Sci. Lett. 2022, 593, 117641. [Google Scholar] [CrossRef]
- Nardin, E.; Godderis, Y.; Donnadieu, Y.; Le Hir, G.; Blakey, R.C.; Puceat, E.; Aretz, M. Modeling the early Paleozoic long-term climatic trend. Geol. Soc. Am. Bull. 2011, 123, 1181–1192. [Google Scholar] [CrossRef]
- Ge, X.Y.; Mou, C.L.; Wang, C.S.; Men, X.; Chen, C.; Hou, Q. Mineralogical and geochemical characteristics of K-bentonites from the Late Ordovician to the Early Silurian in South China and their geological significance. Geol. J. 2019, 54, 514–528. [Google Scholar] [CrossRef]
- Olivarez, A.M.; Owen, R.M. The europium anomaly of seawater—Implications for fluvial versus hydrothermal REE inputs to the oceans. Chem. Geol. 1991, 92, 317–328. [Google Scholar]
- Maher, K.; Chamberlain, C.P. Hydrologic regulation of chemical weathering and the geologic carbon cycle. Science 2014, 343, 1502–1504. [Google Scholar] [CrossRef]
- Hazen, R.M.; Sverjensky, D.A.; Azzolini, D.; Bish, D.L.; Elmore, S.C.; Hinnov, L.; Milliken, R.E. Clay mineral evolution. Am. Mineral. 2013, 98, 2007–2029. [Google Scholar] [CrossRef]
- Trotter, J.A.; Williams, I.S.; Barnes, C.R.; Männik, P.; Simpson, A. New conodont δ18O records of Silurian climate change: Implications for environmental and biological events. Palaeogeogr. Palaeoclimatol. Palaeoecol. 2016, 443, 34–48. [Google Scholar] [CrossRef]
- Hu, D.P.; Li, M.H.; Chen, J.B.; Luo, Q.Y.; Grasby, S.E.; Zhang, T.G.; Yuan, S.L.; Xu, Y.L.; Finney, S.C.; Sun, L.L.; et al. Major volcanic eruptions linked to the Late Ordovician mass extinction: Evidence from mercury enrichment and Hg isotopes. Glob. Planet. Chang. 2021, 196, 103374. [Google Scholar] [CrossRef]
- Chai, Y.F.; Berghuijs, W.R.; Naudts, K.; Janssen, T.A.J.; Yao, Y.; Dolman, H. Using precipitation sensitivity to temperature to adjust projected global runoff. Environ. Res. Lett. 2021, 16, 124032. [Google Scholar] [CrossRef]
- Van Staal, C.; Barr, S. Lithospheric architecture and tectonic evolution of the Canadian Appalachians and associated Atlantic margin. In Tectonic Styles in Canada: The Lithoprobe Perspective; Percival, J.A., Cook, F.A., Clowes, R.M., Eds.; Special Paper; Geological Association of Canada: St. John’s, NL, Canada, 2012; Volume 49, pp. 41–96. [Google Scholar]
- Xu, Y.; Cawood, P.; Du, Y. Intraplate orogenesis in response to Gondwana assembly: Kwangsian orogeny, South China. Am. J. Sci. 2016, 316, 329–362. [Google Scholar] [CrossRef]
- Longman, J.; Mills, B.J.W.; Manners, H.R.; Gernon, T.M.; Palmer, M.R. Late Ordovician climate change and extinctions driven by elevated volcanic nutrient supply. Nat. Geosci. 2021, 14, 924–929. [Google Scholar] [CrossRef]
- Schachtman, N.S.; Roering, J.J.; Marshall, J.A.; Gavin, D.; Granger, D.E. The interplay between physical and chemical erosion over glacial-interglacial cycles. Geology 2019, 47, 613–616. [Google Scholar] [CrossRef]
- Holmden, C.; Mitchell, C.E.; Laporte, D.F. Nd isotope records of late Ordovician sea-level change—Implications for glaciation frequency and global stratigraphic correlation. Palaeogeogr. Palaeoclimatol. Palaeoecol. 2013, 386, 131–144. [Google Scholar] [CrossRef]
- Blum, J.D.; Erel, Y. A silicate weathering mechanism linking increases in marine 87Sr/86Sr with global glaciation. Nature 1995, 373, 415–418. [Google Scholar] [CrossRef]
- Kozik, N.P.; Gill, B.C.; Owens, J.D.; Lyons, T.W.; Young, S.A. Geochemical records reveal protracted and differential marine redox change associated with Late Ordovician climate and mass extinctions. AGU Adv. 2022, 3, e2021AV000563. [Google Scholar] [CrossRef]
- Farouk, S.; Lofty, N.M.; Qteishat, A.; Ahmad, F.; Shehata, A.M.; Al-Kahtany, K.; Hsu, C.S. Source and thermal maturity assessment of the Paleozoic-Mesozoic organic matter in the Risha gas field, Jordan. Fuel 2023, 335, 126998. [Google Scholar] [CrossRef]
- Farouk, S.; Abdeldaim, A.; Qteishat, A.; Ahmad, F.; Mohammed, I.; Al-Kahtany, K.; Powell, J.H. Orbital forcing and paleoenvironmental changes across the upper Ordovician glaciation-lower Silurian hot shale in the Risha gas field, northeast Jordan. Mar. Pet. Geol. 2024, 168, 107040. [Google Scholar] [CrossRef]
- Bergström, S.M.; Chen, X.; Gutiérrez-Marco, J.C.; Dronov, A. The new chronostratigraphic classifi cation of the Ordovician System and its relations to major regional series and stages and to δ13C chemostratigraphy. Lethaia 2009, 42, 97–107. [Google Scholar] [CrossRef]
- Shen, J.; Chen, J.B.; Algeo, T.J.; Feng, Q.L.; Yu, J.X.; Xu, Y.G.; Xu, G.Z.; Lei, Y.; Planavsky, N.J.; Xie, S.C. Mercury fluxes record regional volcanism in the South China craton prior to the end-Permian mass extinction. Geology 2021, 49, 452–456. [Google Scholar] [CrossRef]
- Conwell, C.T.; Saltzman, M.R.; Edwards, C.T.; Griffith, E.M.; Adiatma, Y.D. Nd isotopic evidence for enhanced mafic weathering leading to Ordovician cooling. Geology 2022, 50, 886–890. [Google Scholar] [CrossRef]
- Torres, M.A.; Moosdorf, N.; Hartmann, J.; Adkins, J.F.; West, A.J. Glacial weathering, sulfide oxidation, and global carbon cycle feedbacks. Proc. Natl. Acad. Sci. USA 2019, 114, 8716–8721. [Google Scholar] [CrossRef]
- Rasmussen, C.M.; Kröger, B.; Nielsen, M.L.; Colmenar, J. Cascading trend of Early Paleozoic marine radiations paused by Late Ordovician extinctions. Proc. Natl. Acad. Sci. USA 2019, 116, 7207–7213. [Google Scholar] [CrossRef]
- Rong, J.Y.; Harper, D.A.T.; Huang, B.; Li, R.Y.; Zhang, X.L.; Chen, D. The latest Ordovician Hirnantian brachiopod faunas: New global insights. Earth Sci. Rev 2020, 208, 103280. [Google Scholar] [CrossRef]


| Borehole/Section | SD1 | DY3 | Shuanghe | Qiliao | XY-1 | YD1 | |
|---|---|---|---|---|---|---|---|
| CIA or CIAcorr Value | |||||||
| Average CIA value in Hirnantian | 63 | 60 | / | 59 | 59 | 63 | |
| Average CIAcorr value in Hirnantian | 69 | 61 | 59 | / | 60 | 64 | |
| Average CIA value in late-Boda warming | 66 | 64 | / | 66 | 62 | 66 | |
| Average CIAcorr value late-Boda warming | 72 | 69 | 65 | / | 64 | 67 | |
Disclaimer/Publisher’s Note: The statements, opinions and data contained in all publications are solely those of the individual author(s) and contributor(s) and not of MDPI and/or the editor(s). MDPI and/or the editor(s) disclaim responsibility for any injury to people or property resulting from any ideas, methods, instructions or products referred to in the content. |
© 2024 by the authors. Licensee MDPI, Basel, Switzerland. This article is an open access article distributed under the terms and conditions of the Creative Commons Attribution (CC BY) license (https://creativecommons.org/licenses/by/4.0/).
Share and Cite
Tang, P.; Yang, X.; Yan, D. Enhanced Continental Weathering Triggered the Anoxia of Seawater and Mass Extinctions During the Late Ordovician. J. Mar. Sci. Eng. 2024, 12, 2237. https://doi.org/10.3390/jmse12122237
Tang P, Yang X, Yan D. Enhanced Continental Weathering Triggered the Anoxia of Seawater and Mass Extinctions During the Late Ordovician. Journal of Marine Science and Engineering. 2024; 12(12):2237. https://doi.org/10.3390/jmse12122237
Chicago/Turabian StyleTang, Pan, Xiangrong Yang, and Detian Yan. 2024. "Enhanced Continental Weathering Triggered the Anoxia of Seawater and Mass Extinctions During the Late Ordovician" Journal of Marine Science and Engineering 12, no. 12: 2237. https://doi.org/10.3390/jmse12122237
APA StyleTang, P., Yang, X., & Yan, D. (2024). Enhanced Continental Weathering Triggered the Anoxia of Seawater and Mass Extinctions During the Late Ordovician. Journal of Marine Science and Engineering, 12(12), 2237. https://doi.org/10.3390/jmse12122237