Traffic Flow Theory for Waterway Traffic: Current Challenges and Countermeasures
Abstract
:1. Introduction
2. Comparison of Similarities and Differences Among Various Modes of Transportation
2.1. Human–Machine–Environment
2.1.1. The Size of the Carrier
2.1.2. Reaction Time
2.1.3. The Environment
2.1.4. Traffic Movement
2.2. Organization of Traffic Flow
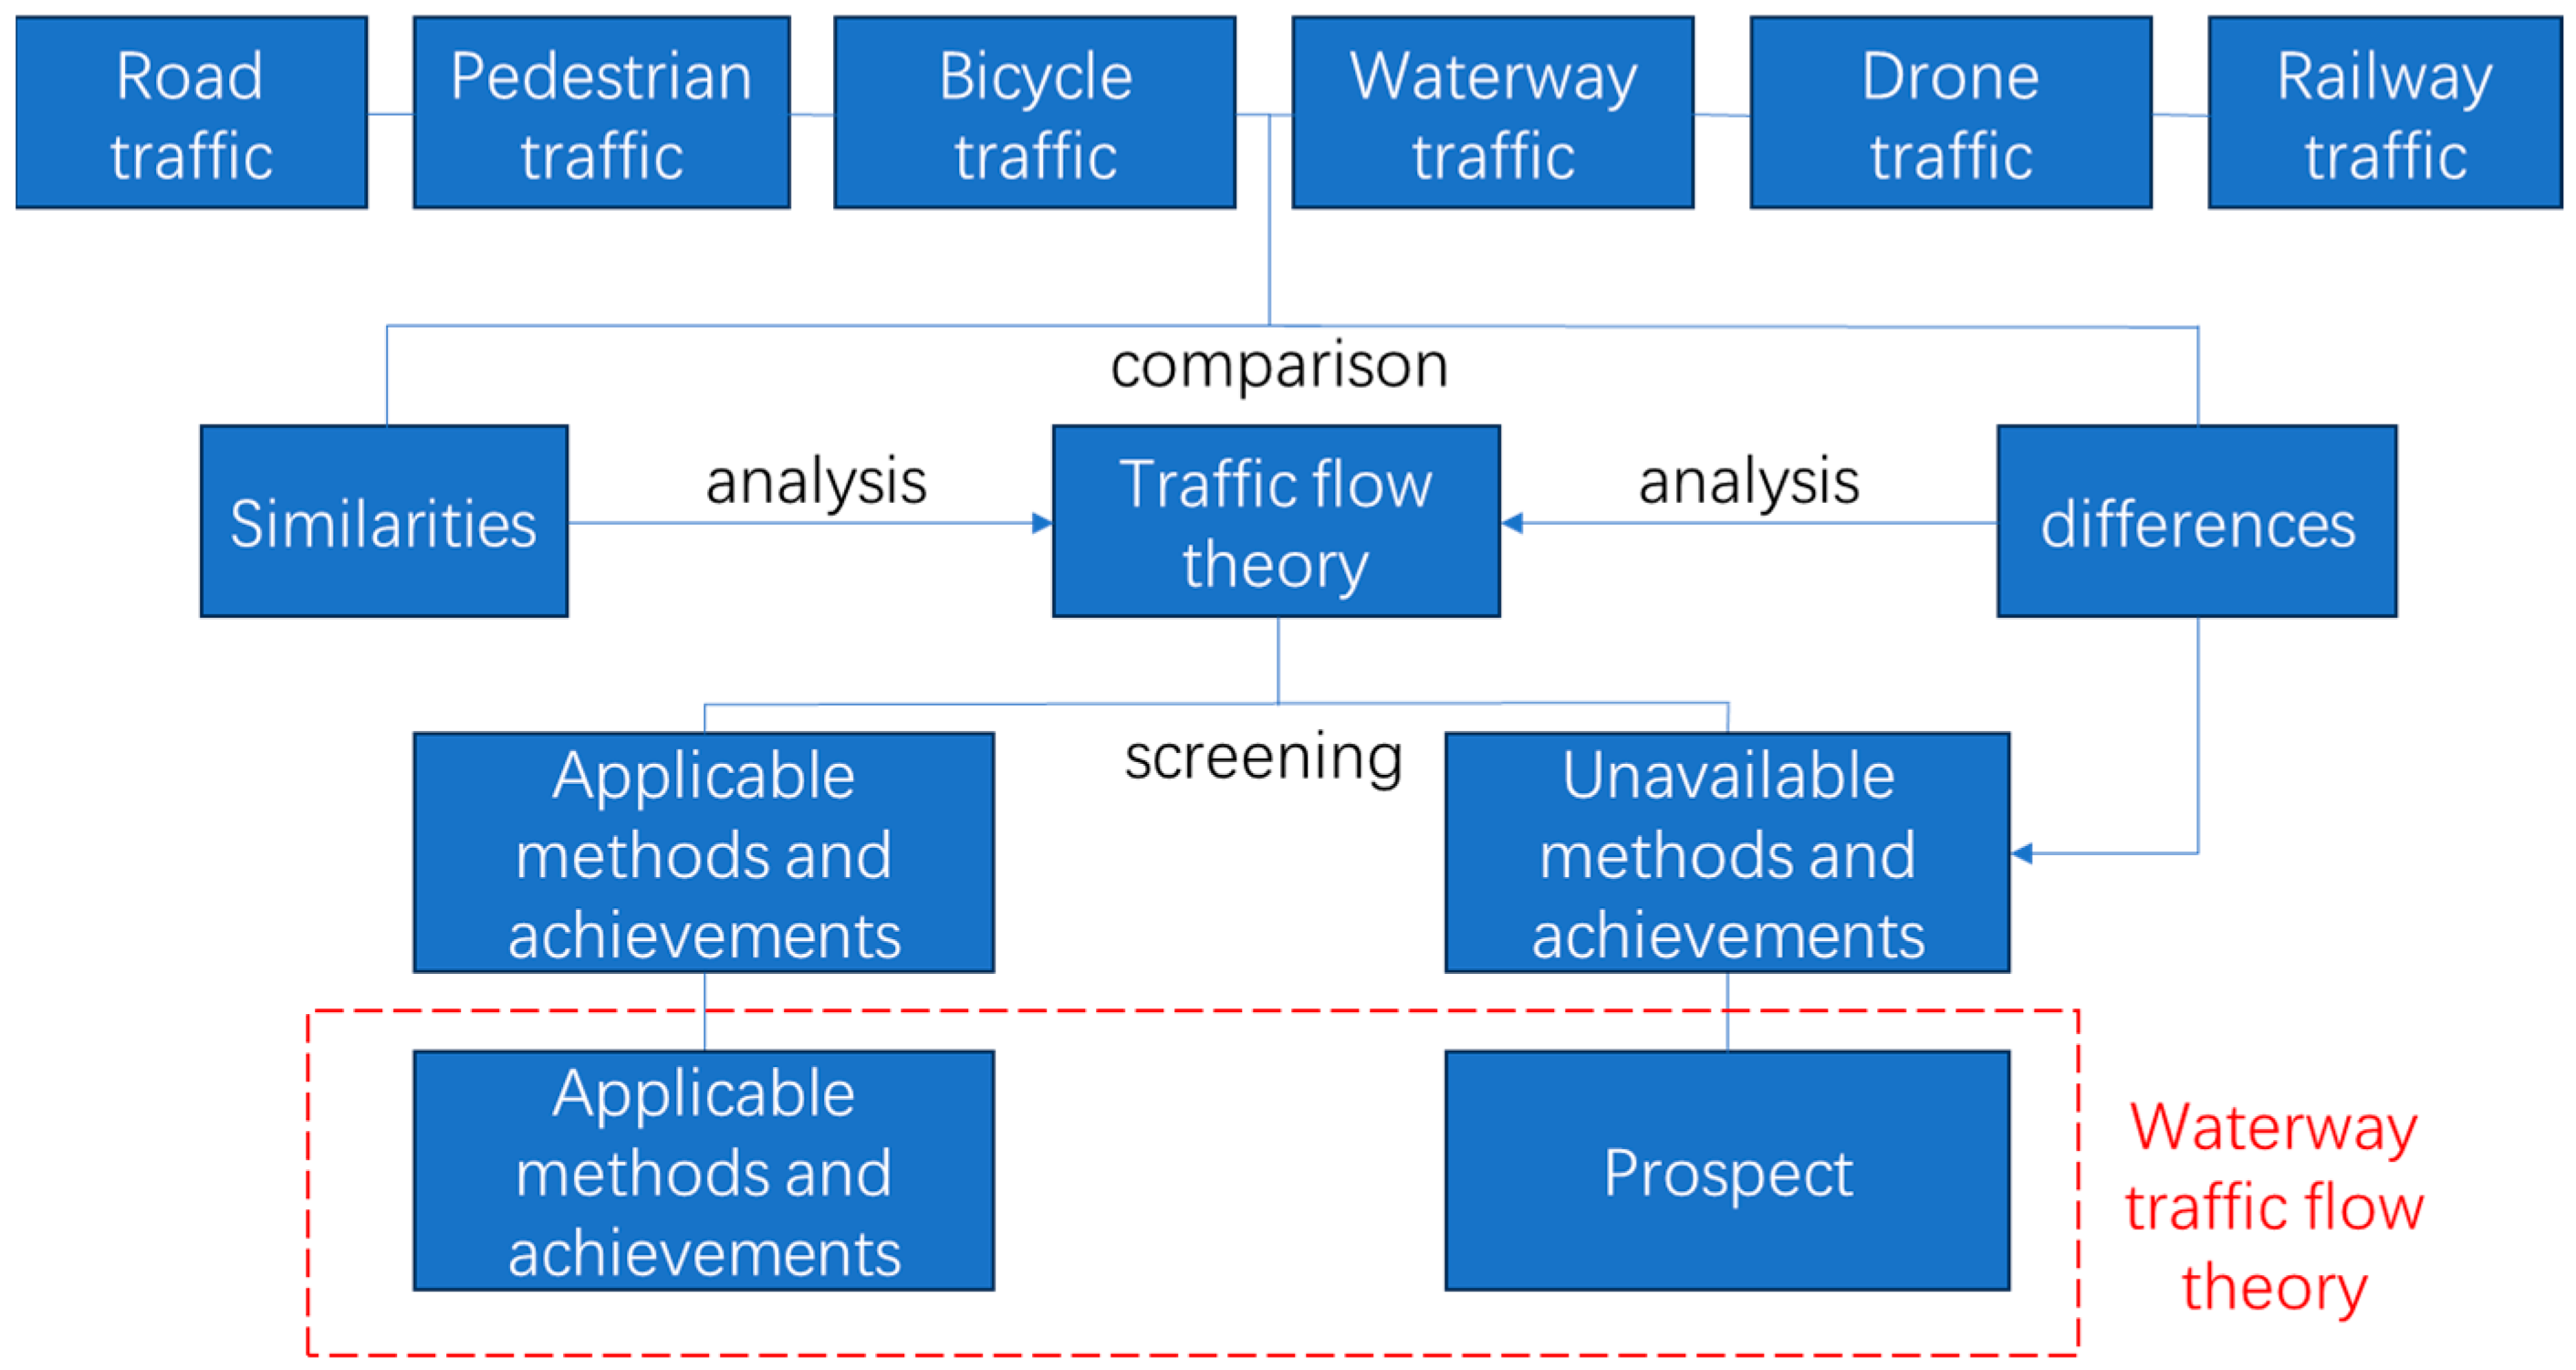
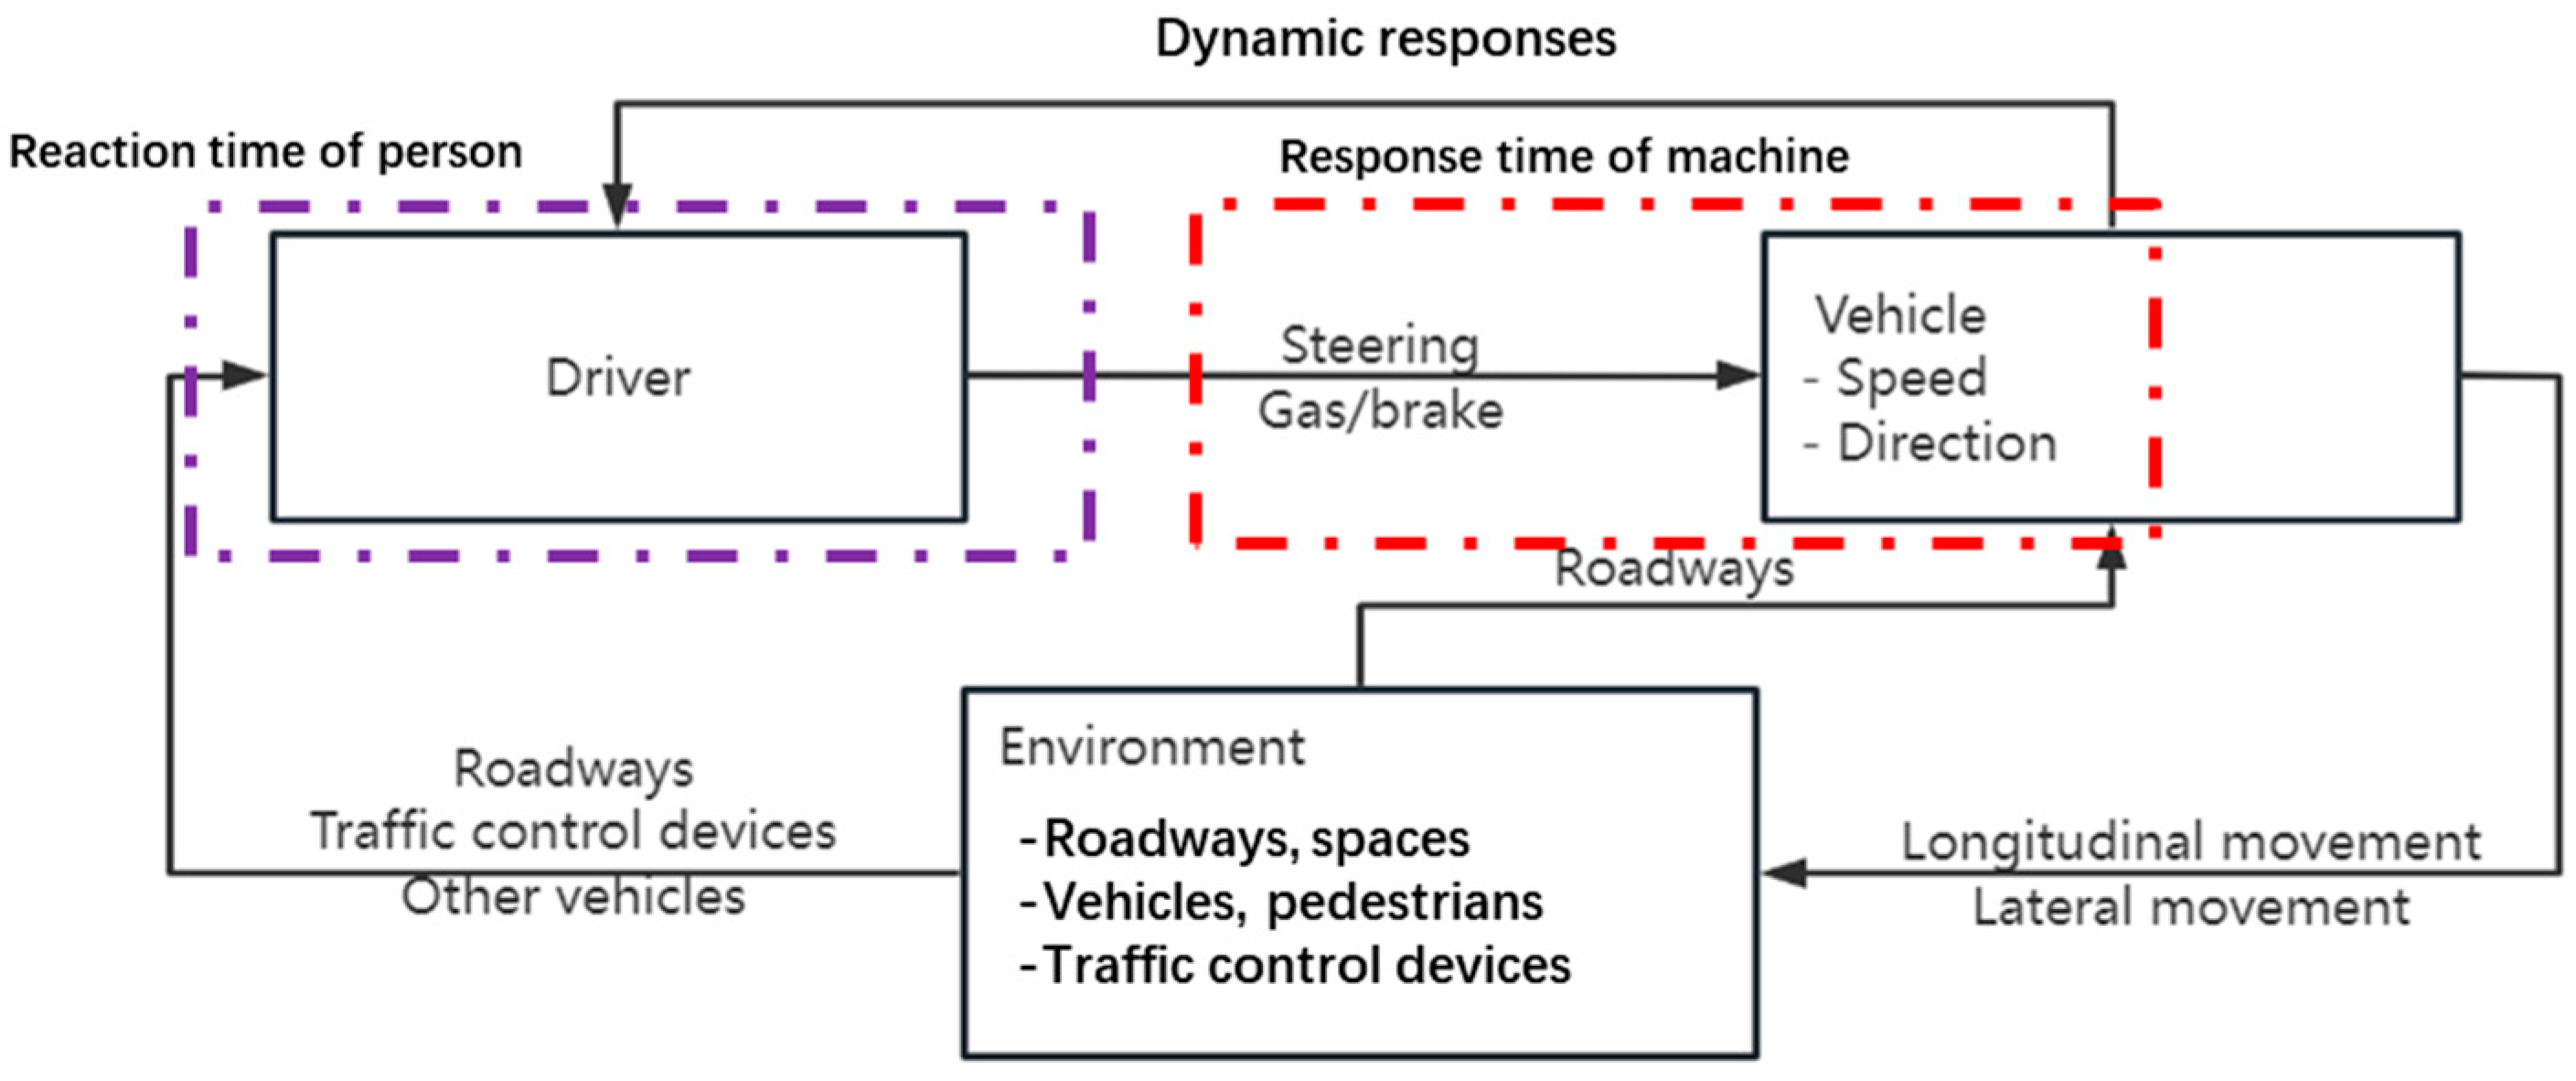
- Waterway traffic comprises vessels that are significantly larger and heavier than those in roadway traffic. Additionally, the perception–response times of vessel operators are considerably longer than those of road vehicle drivers. As a result, waterway traffic exhibits greater heterogeneity compared to roadway traffic.
- Unlike roadway traffic, which is regulated by lane discipline and moves in a one- or one-and-a-half-dimensional space, in uncontrolled approach channel lanes, waterway traffic operates freely on the water surface and is considered moving in a two-dimensional space.
- Compared to other modes of transportation, the environment associated with waterway transportation is relatively complex, and the influence of environmental factors on waterway transport is significantly greater.
3. The Latest Research Progress in Traffic Flow Theory
3.1. The Properties of Traffic Flow
3.2. The Mechanisms of Traffic Flow
3.3. The Dynamics of Traffic Flow
| Geographical Scope | Road Traffic | Waterway Traffic | Bicycle and Pedestrian Traffic | Remark |
|---|---|---|---|---|
| Macroscopic | LWR [6] | - | - | |
| Mesoscopic | TRANSIMS, cellular automata [69,70] | Cellular automata, multi-agent model [71,72] | Cellular automata [73] | |
| Microscopic | GM, OVM, Newell [79,80,81] | GM, IDM, LCM, vessel-following model based on deep reinforcement learning [25,82] | IDM [83] | Following |
| Lane-changing model [84] | - | - | Lane-changing | |
| Integrated model [74] | Artificial potential field models, optimal control models [85,86] | Psychological–physical force model [75] | Integrated | |
| Picoscopic | Picoscopic model [76,77,78] | - | - | - |
4. The Challenge of Applying Roadway Traffic Flow Theory to Waterways
4.1. The Properties of Traffic Flow
- A precise and scientifically sound depiction of waterway traffic flow is essential for the comprehensive study of this field. Flow, density, and speed have long been important concepts for characterizing road traffic flow, and researchers in waterway traffic have similarly adopted these concepts. However, the significant variation in vessel sizes renders the traditional traffic flow characteristics used for roadways unsuitable and clearly unscientific for capturing the unique features of waterway traffic.
- In the field of road traffic, the concept of the PCE is used to convert vehicles of varying sizes into an equivalent number of passenger cars, allowing for a more objective and accurate reflection of road traffic conditions and composition. The question of how many passenger cars each vehicle should be converted to has led to the development of a relatively mature procedure in road traffic [29]. In contrast, waterway traffic is inherently heterogeneous and exhibits a notably high degree of variability. Unlike road traffic, which benefits from established and precise traffic-equivalent conversion standards, waterway traffic lacks a similarly scientific and comprehensive framework. This gap complicates the accurate description of waterway traffic characteristics and poses challenges in quantifying the level of service for waterways. Moreover, the absence of standardized metrics makes it even more difficult to compare the level of service across different temporal and spatial contexts.
- In contrast to road traffic, waterway traffic typically exhibits prominent two-dimensional characteristics, as vessels can move freely on a planar surface. Additionally, unlike the stationary pavement for roadway traffic, waterway traffic operates on water, which is itself in motion. Addressing these two significant discrepancies presents considerable challenges in formulating a comprehensive waterway traffic flow theory.
4.2. The Mechanisms of Traffic Flow
4.3. The Dynamics of Traffic Flow
- In waterway traffic, there are no physical boundaries, and vessel movement typically occurs in two dimensions. In contrast, road traffic flow is often represented through models that focus on car-following and lane-changing behaviors. Applying this research approach to waterway traffic requires addressing two key aspects. First, the control of vessels in both longitudinal and lateral directions are closely interconnected aspects of a single operational process. Therefore, effective models must account for both directions simultaneously. Second, vessel control involves complex maneuvering and reaction characteristics, making it significantly more intricate than vehicle control. Consequently, accurately simulating waterway traffic flow by directly applying road traffic flow theory presents considerable challenges.
- In road traffic flow, some researchers have developed integrated models using deep learning and other artificial intelligence methods to simulate traffic flow. This approach eliminates the need to construct mathematical models for activities such as car following and lane changing. However, these models inherently lack transparency, making it difficult to understand the underlying processes and analytically explain the resulting phenomena. When applying this methodology to waterway traffic, these inherent disadvantages remain and are not easily overcome.
5. Recommendations for Future Research
- (a)
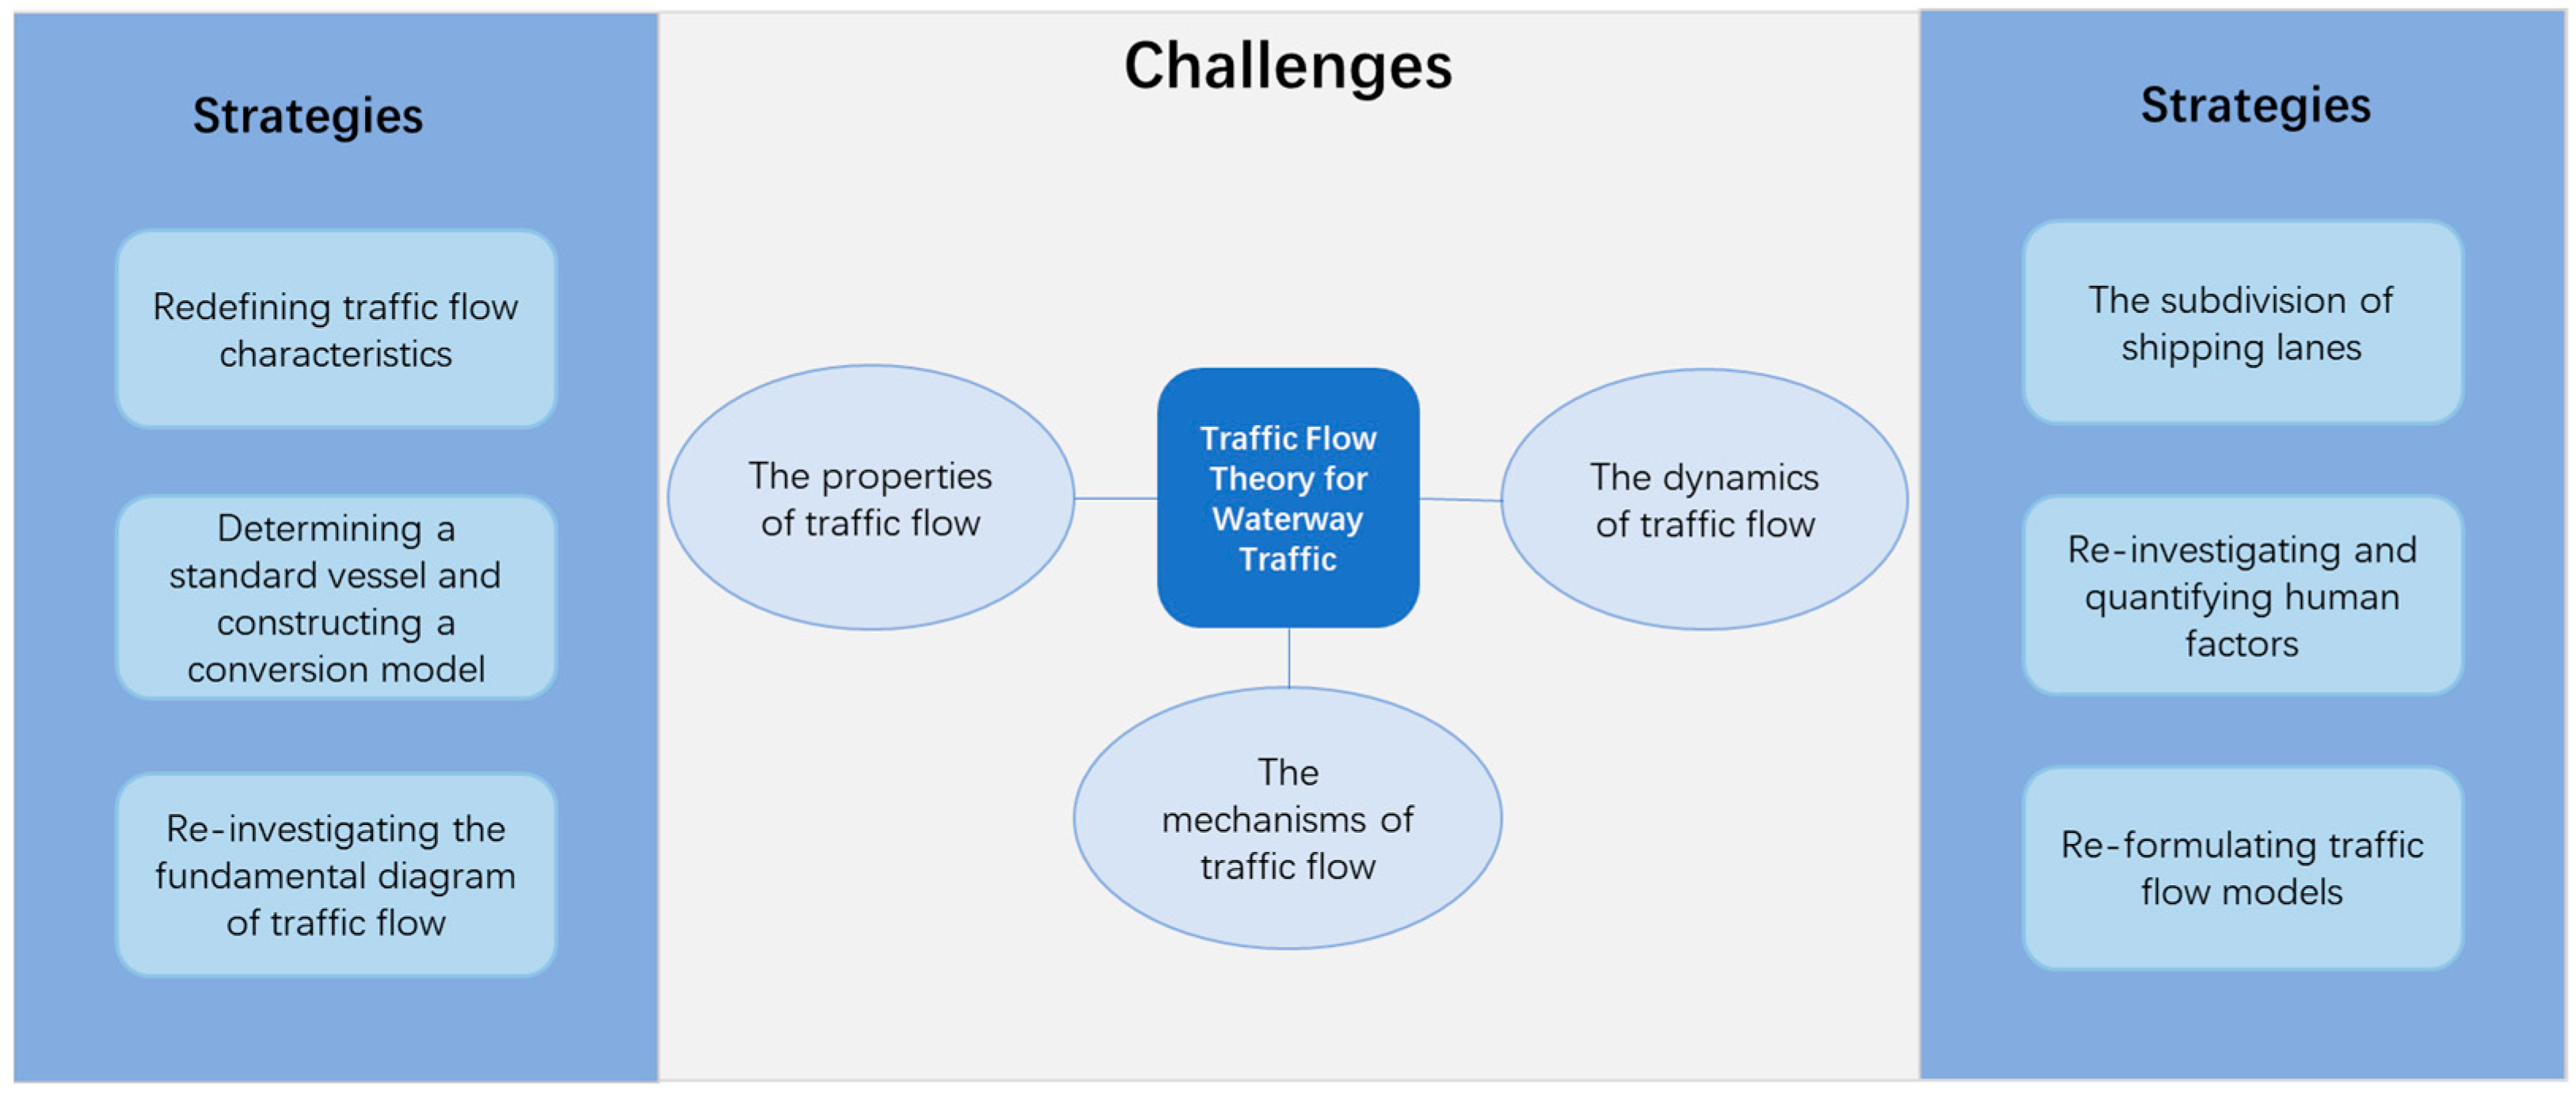
- Re-investigating and quantifying human factors in waterway transportation: Reaction times and ship maneuvering characteristics are essential input parameters in traffic flow models. Vessel collision-avoidance behavior encompasses several key aspects, including the avoidance timing, magnitude, mode, and effect, which are critical for assessing the simulation accuracy of traffic flow models. Despite the importance of these parameters, few researchers have systematically organized data on reaction time and ship maneuvering characteristics. In the future, obtaining information about these parameters could involve extensive field data collection. Alternatively, inspired by advancements in the road traffic field, establishing an ergonomics laboratory for waterway traffic could be a viable option. Such a laboratory would facilitate the measurement and statistical analysis of crucial parameters related to waterway traffic, providing valuable insights for research and development.
- (b)
- Redefining traffic flow characteristics: In waterway traffic, it is not reasonable to rely on traditional methods of counting vessels to describe traffic flow characteristics. However, several studies have made progress in defining these characteristics [39,40,41]. Some definitions effectively address the challenges of characterizing traffic flow in lane-free environments and can indicate the size of carriers within the traffic flow. While these definitions have been successfully applied in road traffic, they have yet to be utilized in the context of waterway traffic. Additionally, waterway traffic flow characteristics may need to account for a vessel’s cross-sectional area, three-dimensional size, and even its displacement of water.
- (c)
- Determining a standard vessel and constructing a conversion model: Given the lack of a robust procedure for converting heterogeneous vessels into equivalent units, similar to the methods employed in road traffic, it is challenging to accurately describe waterway traffic flow characteristics. Therefore, the following measures are recommended for future research. (1) Determine standard ships and construct a conversion model: given the diversity of ship types, a standard vessel should be defined for each category. (2) Formulate a traffic conversion model: for waterway traffic, characterized by lane-free environments and high heterogeneity, the methods proposed in the literature [51,53,55] could provide valuable insights for studying waterway traffic flow. (3) Utilize effective water area: in addition to these three methods, the size of the effective water area occupied by both standard and non-standard ships during navigation could serve as a basis for developing ship-equivalent traffic conversion models. (4) Incorporate environmental factors: future models could also integrate environmental factors related to waterways to enhance their accuracy.
- (d)
- Re-investigating the fundamental diagram of traffic flow: To address the question of whether a fundamental diagram for waterway traffic flow exists, future research can determine traffic flow characteristics based on redefined parameters and the traffic conversion model. Given the absence of physical lane markings in waterways and the lack of data for congested flow, the fundamental diagram for waterway traffic can be obtained by using extensive AIS data. This approach may reveal the full picture of the fundamental diagram including conditions of light and heavy traffic.
- (e)
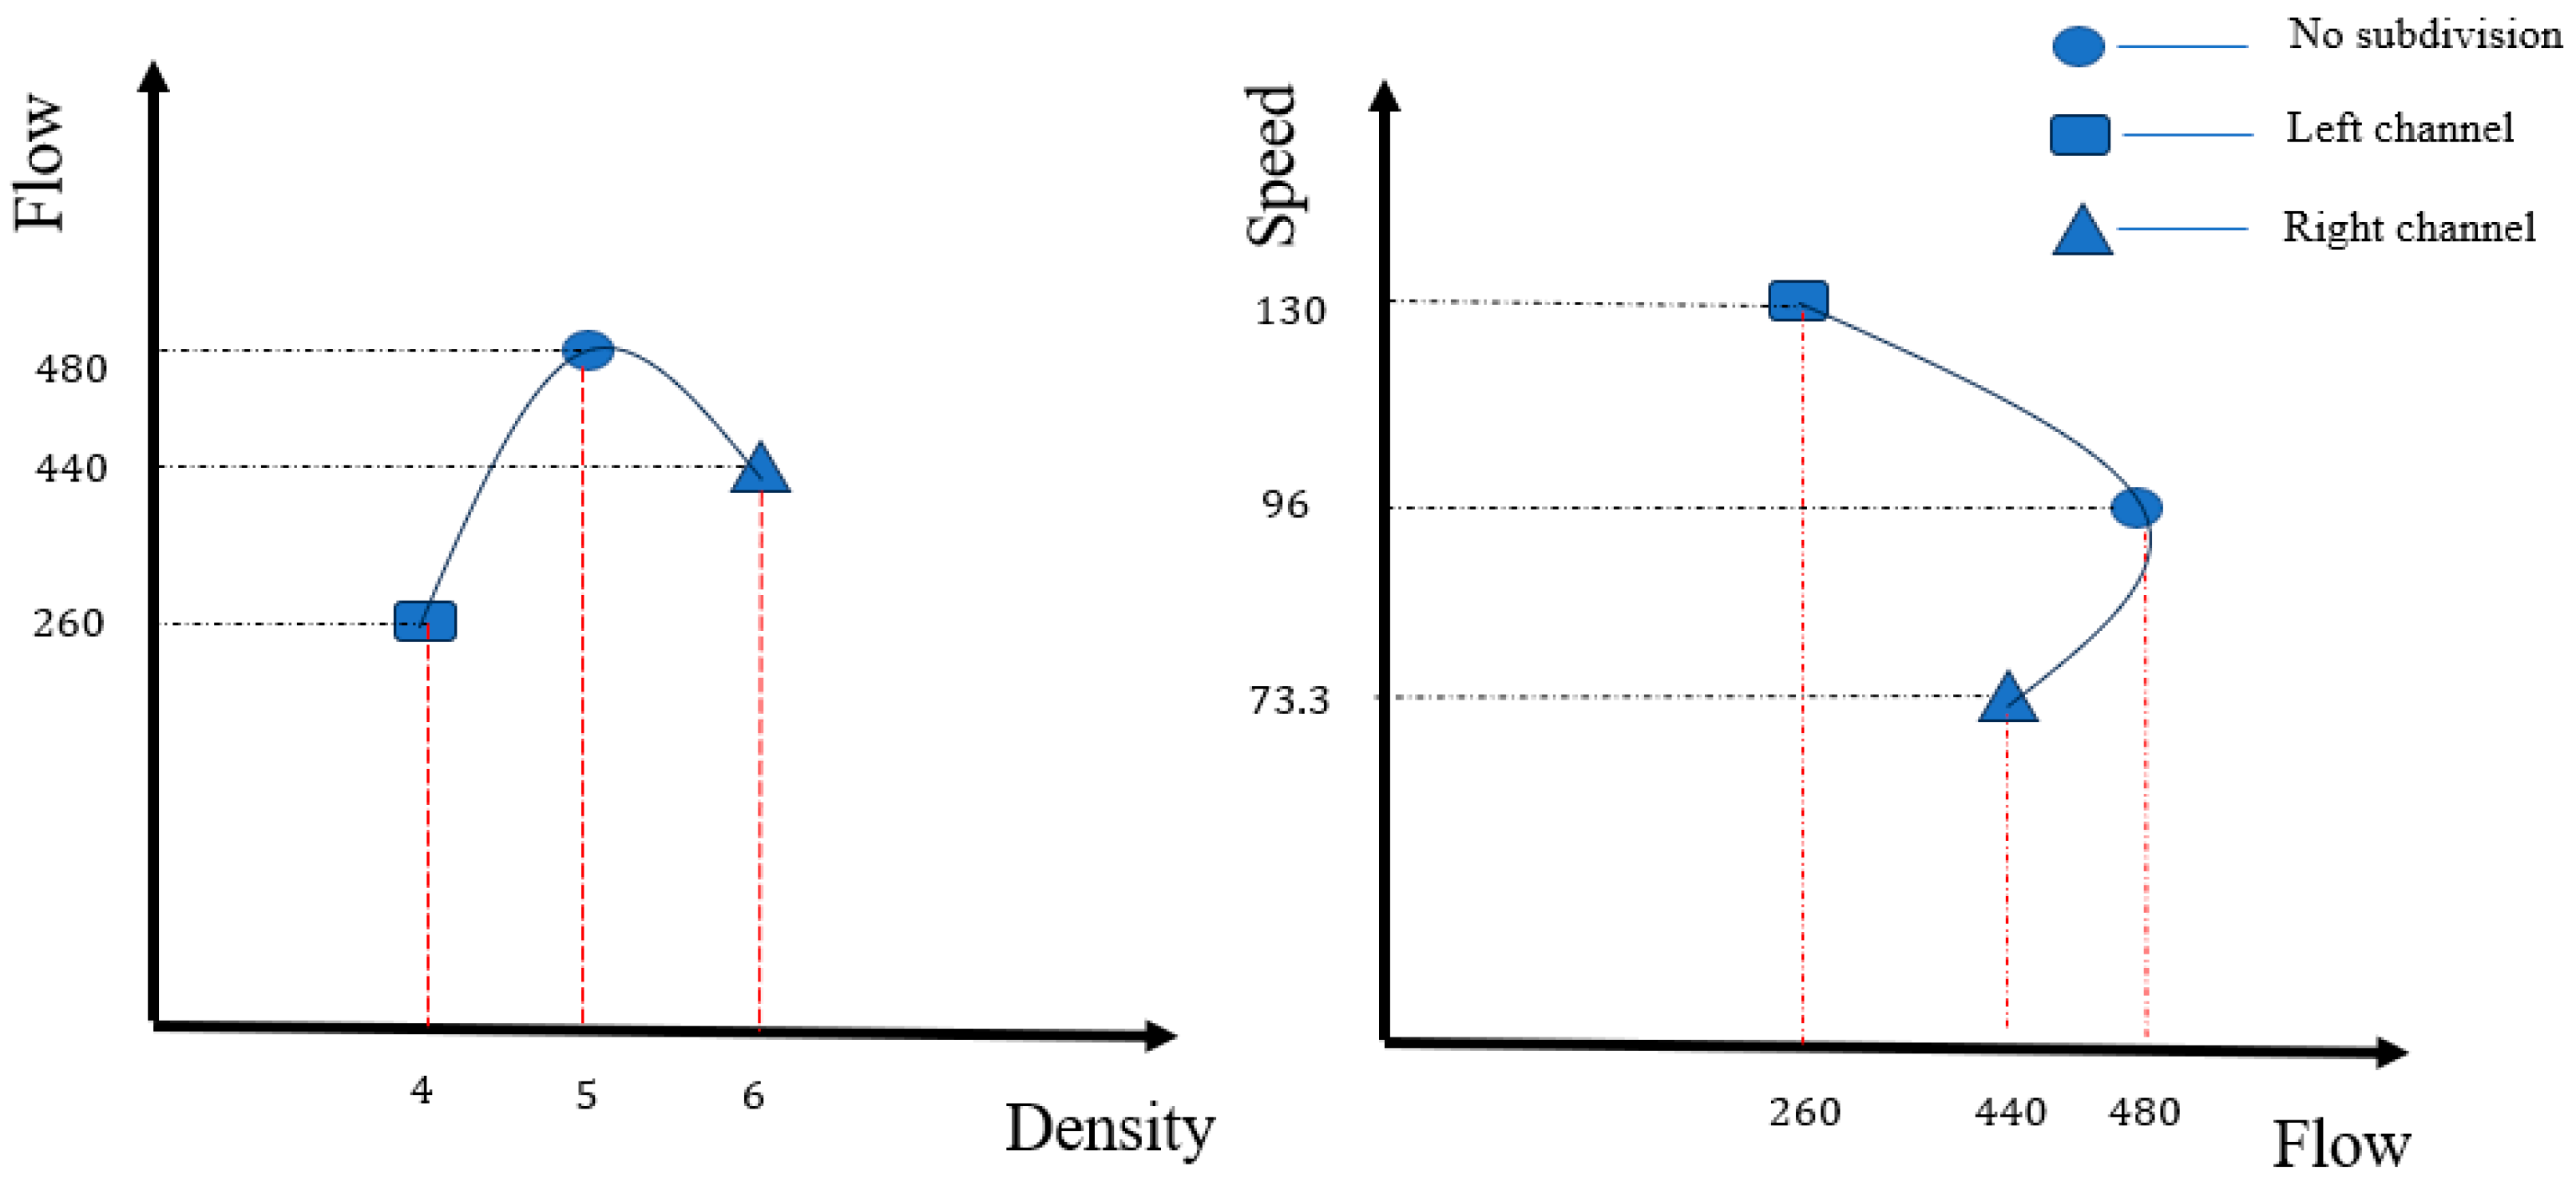
- The subdivision of shipping lanes: Based on the simple experiment presented in Section 3.2 and illustrated in Figure 8, it appears that congestion flow has been discovered. The subdivision of shipping lanes seems to facilitate the verification of the existence of the fundamental diagram for waterway traffic flow and reveal the panorama of the fundamental diagram, thereby providing a more comprehensive understanding of this fundamental diagram. Given the close relationship between ship-following behavior and the fundamental diagram of waterway traffic, future research could explore methods for subdividing shipping lanes through ship-following analysis and techniques for plotting the fundamental diagram based on the subdivision of shipping lanes.
- (f)
- Re-formulating traffic flow models: Currently, waterway traffic flow simulations primarily rely on methodologies developed for road traffic, despite significant differences between the two. This reliance results in two main issues: insufficient detail in the traffic flow information and a substantial gap between a model’s accuracy and actual conditions. Future research should aim to address both these aspects. The literature [76,77,78] shows that the picoscopic traffic flow model not only unifies macroscopic, mesoscopic, and microscopic models but also contains detailed traffic flow information. Furthermore, this model is expected to facilitate the two-dimensional simulation of waterway traffic flow, greatly enhancing the accuracy of simulations. Therefore, establishing a picoscopic model for waterway traffic flow that considers the impact of multiple factors such as environment and dynamic water conditions will be a key focus for future development.
6. Conclusions
Author Contributions
Funding
Institutional Review Board Statement
Informed Consent Statement
Data Availability Statement
Conflicts of Interest
References
- Ni, D. Traffic Flow Theory: Characteristics, Experimental Methods, and Numerical Techniques, 1st ed.; Elsevier: Amsterdam, The Netherlands, 2015. [Google Scholar]
- van Wageningen-Kessels, F.; van Lint, H.; Vuik, K.; Hoogendoorn, S. Genealogy of Traffic Flow Models. EURO J. Transp. Logist. 2015, 4, 445–473. [Google Scholar] [CrossRef]
- Brackstone, M.; McDonald, M. Car-Following: A Historical Review. Transp. Res. Part F Traffic Psychol. Behav. 1999, 2, 181–196. [Google Scholar] [CrossRef]
- Zhang, L.; Yuan, Z.; Yang, L.; Liu, Z. Recent Developments in Traffic Flow Modeling Using Macroscopic Fundamental Diagram. Transp. Rev. 2020, 40, 529–550. [Google Scholar] [CrossRef]
- Laval, J.A. Hysteresis in Traffic Flow Revisited: An Improved Measurement Method. Transp. Res. Part B Methodol. 2011, 45, 385–391. [Google Scholar] [CrossRef]
- Lighthill, M.J.; Whitham, G.B. On Kinematic Waves II. A Theory of Traffic Flow on Long Crowded Roads. Proc. R. Soc. Lond. Ser. A Math. Phys. Sci. 1955, 229, 317–345. [Google Scholar] [CrossRef]
- Richards, P.I. Shock Waves on the Highway. Oper. Res. 1956, 4, 42–51. [Google Scholar] [CrossRef]
- Newell, G.F. A Simplified Theory of Kinematic Waves in Highway Traffic, Part I: General Theory. Transp. Res. Part B Methodol. 1993, 27, 281–287. [Google Scholar] [CrossRef]
- Newell, G.F. A Simplified Theory of Kinematic Waves in Highway Traffic, Part II: Queueing at Freeway Bottlenecks. Transp. Res. Part B Methodol. 1993, 27, 289–303. [Google Scholar] [CrossRef]
- Newell, G.F. A Simplified Theory of Kinematic Waves in Highway Traffic, Part III: Multi-Destination Flows. Transp. Res. Part B Methodol. 1993, 27, 305–313. [Google Scholar] [CrossRef]
- Li, L. Research on the Model of Motion State for Mixed Traffic Flow Based on the Safety Potential Field. Ph.D. Thesis, Southeast University, Nanjing, China, 2021. [Google Scholar]
- Zhou, J.; Zhu, F. Modeling the Fundamental Diagram of Mixed Human-Driven and Connected Automated Vehicles. Transp. Res. Part C Emerg. Technol. 2020, 115, 102614. [Google Scholar] [CrossRef]
- Chen, S.; Hu, L.; Yao, Z.; Zhu, J.; Zhao, B.; Jiang, Y. Efficient and Environmentally Friendly Operation of Intermittent Dedicated Lanes for Connected Autonomous Vehicles in Mixed Traffic Environments. Phys. A Stat. Mech. Its Appl. 2022, 608, 128310. [Google Scholar] [CrossRef]
- Makarewicz, R.; Gałuszka, M. Road Traffic Noise Prediction Based on Speed-Flow Diagram. Appl. Acoust. 2011, 72, 190–195. [Google Scholar] [CrossRef]
- Hughes, R.L. A Continuum Theory for the Flow of Pedestrians. Transp. Res. Part B Methodol. 2002, 36, 507–535. [Google Scholar] [CrossRef]
- Botma, H. Method to determine level of service for bicycle paths and pedestrian-bicycle paths. Transp. Res. Rec. 1995, 1502, 38–44. [Google Scholar]
- Diaz de Rivera, A.; Dick, C.T. Illustrating the Implications of Moving Blocks on Railway Traffic Flow Behavior with Fundamental Diagrams. Transp. Res. Part C Emerg. Technol. 2021, 123, 102982. [Google Scholar] [CrossRef]
- Yang, L.; Yin, S.; Han, K.; Haddad, J.; Hu, M. Fundamental Diagrams of Airport Surface Traffic: Models and Applications. Transp. Res. Part B Methodol. 2017, 106, 29–51. [Google Scholar] [CrossRef]
- Seong, Y.C.; Jeong, J.S.; Park, G.K. The Relation with Width of Fairway and Marine Traffic Flow. In Transport Systems and Processes: Marine Navigation and Safety of Sea Transportation; CRC Press: Boca Raton, FL, USA, 2011; p. 6. [Google Scholar]
- Qi, L.; Zheng, Z.; Gang, L. Marine Traffic Model Based on Cellular Automaton: Considering the Change of the Ship’s Velocity under the Influence of the Weather and Sea. Phys. A Stat. Mech. Its Appl. 2017, 483, 480–494. [Google Scholar] [CrossRef]
- Huang, Y.; Yip, T.L.; Wen, Y. Comparative Analysis of Marine Traffic Flow in Classical Models. Ocean Eng. 2019, 187, 106195. [Google Scholar] [CrossRef]
- Wang, M.; Daamen, W.; Hoogendoorn, S.P.; van Arem, B. Connected Variable Speed Limits Control and Car-Following Control with Vehicle-Infrastructure Communication to Resolve Stop-and-Go Waves. J. Intell. Transp. Syst. 2016, 20, 559–572. [Google Scholar] [CrossRef]
- Stern, R.E.; Cui, S.; Delle Monache, M.L.; Bhadani, R.; Bunting, M.; Churchill, M.; Hamilton, N.; Haulcy, R.; Pohlmann, H.; Wu, F.; et al. Dissipation of Stop-and-Go Waves via Control of Autonomous Vehicles: Field Experiments. Transp. Res. Part C Emerg. Technol. 2018, 89, 205–221. [Google Scholar] [CrossRef]
- Zhu, M.; Wang, Y.; Pu, Z.; Hu, J.; Wang, X.; Ke, R. Safe, Efficient, and Comfortable Velocity Control Based on Reinforcement Learning for Autonomous Driving. Transp. Res. Part C Emerg. Technol. 2020, 117, 102662. [Google Scholar] [CrossRef]
- Hart, F.; Okhrin, O.; Treiber, M. Vessel-Following Model for Inland Waterways Based on Deep Reinforcement Learning. Ocean Eng. 2023, 281, 114679. [Google Scholar] [CrossRef]
- Liu, Y.; Zhuang, S.; Guo, R.; Xiyue, L.; Li, J. Research on the Level of Service of Water Transportation Based on the Perspective of Traffic Differences. In Proceedings of the 2023 7th International Conference on Transportation Information and Safety (ICTIS), Xi’an, China, 4–6 August 2023; pp. 1221–1229. [Google Scholar]
- Jin, S.; Qu, X.; Zhou, D.; Xu, C.; Ma, D.; Wang, D. Estimating Cycleway Capacity and Bicycle Equivalent Unit for Electric Bicycles. Transp. Res. Part A Policy Pract. 2015, 77, 225–248. [Google Scholar] [CrossRef]
- Zhang, J.; Mehner, W.; Andresen, E.; Holl, S.; Boltes, M.; Schadschneider, A.; Seyfried, A. Comparative Analysis of Pedestrian, Bicycle and Car Traffic Moving in Circuits. Procedia Soc. Behav. Sci. 2013, 104, 1130–1138. [Google Scholar] [CrossRef]
- Forti, N.; d’Afflisio, E.; Braca, P.; Millefiori, L.M.; Willett, P.; Carniel, S. Maritime Anomaly Detection in a Real-World Scenario: Ever Given Grounding in the Suez Canal. IEEE Trans. Intell. Transp. Syst. 2022, 23, 13904–13910. [Google Scholar] [CrossRef]
- Qu, X.; Zhang, J.; Wang, S. On the Stochastic Fundamental Diagram for Freeway Traffic: Model Development, Analytical Properties, Validation, and Extensive Applications. Transp. Res. Part B Methodol. 2017, 104, 256–271. [Google Scholar] [CrossRef]
- Bennett, G. The SFPE Handbook of Fire Protection Engineering. J. Hazard. Mater. 1990, 23, 348. [Google Scholar] [CrossRef]
- Liu, Y.; Cheng, Y.; Tu, B.; Ni, D. Level of Service Based on Fundamental Diagram of Waterway Traffic Flow. Transp. Res. Rec. J. Transp. Res. Board 2022, 2676, 63–72. [Google Scholar] [CrossRef]
- Daiheng, N.J.D.L. Direct Methods of Determining Traffic Stream Characteristics by Definition. In Proceedings of the Transportation Research Board 85th Annual Meeting Transportation Research Board, Washington, DC, USA, 22–26 January 2006. [Google Scholar]
- Transportation Research Board; National Academies of Sciences. Highway Capacity Manual, 7th ed.; National Academies Press: Washington, D.C., USA, 2022; ISBN 978-0-309-27566-8. [Google Scholar]
- Banks, J.H. Another look at a priori relationships among traffic flow characteristics (with discussion and closure). Transp. Res. Rec. 1995, 1510, 1–10. [Google Scholar]
- Cassidy, M.J.; Coifman, B. Relation Among Average Speed, Flow, and Density and Analogous Relation Between Density and Occupancy. Transp. Res. Rec. J. Transp. Res. Board 1997, 1591, 1–6. [Google Scholar] [CrossRef]
- Edie, L.C. Discussion of Traffic Stream Measurements and Definitions. In Proceedings of the 2nd International Symposium on the Theory of Traffic Flow, London, UK, 25–27 June 1963; pp. 139–154. [Google Scholar]
- Makigami, Y.; Newell, G.F.; Rothery, R. Three-Dimensional Representation of Traffic Flow. Transp. Sci. 1971, 5, 302–313. [Google Scholar] [CrossRef]
- Liu, Y.; Ji, Z.; Luo, X.; Li, Z.; He, Z.; Liu, J. Exploring Characteristics and Fundamental Relations of Area-Wide Vessel Traffic Flow. In Proceedings of the 2018 21st International Conference on Intelligent Transportation Systems (ITSC), Maui, HI, USA, 4–7 November 2018; pp. 2333–2338. [Google Scholar]
- Mallikarjuna, C.; Rao, K.R. Area occupancy characteristics of heterogeneous traffic. Transportmetrica 2006, 2, 223–236. [Google Scholar] [CrossRef]
- Suvin, P.V.; Mallikarjuna, C. Modified Generalized Definitions for the Traffic Flow Characteristics under Heterogeneous, No-Lane Disciplined Traffic Streams. Transp. Res. Procedia 2018, 34, 75–82. [Google Scholar] [CrossRef]
- Omar, B.S.; Kar, P.; Chunchu, M. Passenger Car Equivalent Estimation for Rural Highways: Methodological Review. Transp. Res. Procedia 2020, 48, 801–816. [Google Scholar] [CrossRef]
- Kimber, R.M.; McDonald, M.; Hounsell, N. Passenger Car Units in Saturation Flows: Concept, Definition, Derivation. Transp. Res. Part B Methodol. 1985, 19, 39–61. [Google Scholar] [CrossRef]
- Arasan, T.; Arkatkar, S. Estimating Passenger-Car Units for Vehicles of Heterogeneous Traffic Using Computer Simulation. In Proceedings of the Transportation Research Board 87th Annual Meeting, Washington, DC, USA, 13–17 January 2008. [Google Scholar]
- Arasan, V.T.; Arkatkar, S.S. Microsimulation Study of Effect of Volume and Road Width on PCU of Vehicles under Heterogeneous Traffic. J. Transp. Eng. 2010, 136, 1110–1119. [Google Scholar] [CrossRef]
- Huber, M.J. Estimation of passenger-car equivalents of trucks in traffic stream (discussion and closure). Transp. Res. Rec. J. Transp. Res. Board 1982, 869, 60–70. [Google Scholar]
- Ballari, S.O. Passenger Car Equivalent Estimation Methods of Trucks in Traffic Stream. Int. J. Recent Technol. Eng. (IJRTE) 2020, 8, 710–716. [Google Scholar] [CrossRef]
- Sumner, R.; Hill, D.; Shapiro, S. Segment Passenger Car Equivalent Values for Cost Allocation on Urban Arterial Roads. Transp. Res. Part A Gen. 1984, 18, 399–406. [Google Scholar] [CrossRef]
- Aerde, M.V.; Vagar, S. Capacity, speed, and platooning vehicle equivalents for two-lane rural highways (discussion and closure). Transp. Res. Rec. 1984, 971, 58–67. [Google Scholar]
- Branston, D.; van Zuylen, H. The Estimation of Saturation Flow, Effective Green Time and Passenger Car Equivalents at Traffic Signals by Multiple Linear Regression. Transp. Res. 1978, 12, 47–53. [Google Scholar] [CrossRef]
- Wang, D.; Feng, T.; Liang, C. Research on Bicycle Conversion Factors. Transp. Res. Part A Policy Pract. 2008, 42, 1129–1139. [Google Scholar] [CrossRef]
- Li, X.; Zhang, J.; Dai, W. Developing Passenger-Car Equivalents for China Highways Based on Vehicle Moving Space. In Proceedings of the Transportation Research Board 85th Annual Meeting, Washington, DC, USA, 22–26 January 2006. [Google Scholar]
- Chandra, S.; Sikdar, P.K. Factors Affecting PCU in Mixed Traffic Situations on Urban Roads. Road Transp. Res. 2000, 9, 40–50. [Google Scholar]
- Cao, N.Y.; Sano, K. Estimating Capacity and Motorcycle Equivalent Units on Urban Roads in Hanoi, Vietnam. J. Transp. Eng. 2012, 138, 776–785. [Google Scholar] [CrossRef]
- Tiwari, G.; Fazio, J.; Pavitravas, S. Passenger car units for heterogeneous traffic using a modified density method. In Proceedings of the Fourth International Symposium on Highway Capacity, Maui, HI, USA, 27 June–1 July 2000. [Google Scholar]
- Tiwari, G.; Fazio, J.; Gaurav, S. Traffic Planning for Non-Homogeneous Traffic. Sadhana 2007, 32, 309–328. [Google Scholar] [CrossRef]
- Mishra, R.; Kumar, P.; Arkatkar, S.S.; Sarkar, A.K.; Joshi, G.J. Novel Area Occupancy–Based Method for Passenger Car Unit Estimation on Multilane Urban Roads Under Heterogeneous Traffic Scenario. Transp. Res. Rec. J. Transp. Res. Board 2017, 2615, 82–94. [Google Scholar] [CrossRef]
- Greenshields, B.D.; Bibbins, J.R.; Channing, W.S.; Miller, H.H. A Study of Traffic Capacity. In Proceedings of the Proceedings of the Fourteenth Annual Meeting of the Highway Research Board, Washington, DC, USA, 6–7 December 1934. [Google Scholar]
- Cassidy, M.J. Bivariate Relations in Nearly Stationary Highway Traffic. Transp. Res. Part B Methodol. 1998, 32, 49–59. [Google Scholar] [CrossRef]
- Guo, N.; Jiang, R.; Wong, S.; Hao, Q.-Y.; Xue, S.-Q.; Hu, M.-B. Bicycle Flow Dynamics on Wide Roads: Experiments and Simulation. Transp. Res. Part C Emerg. Technol. 2021, 125, 103012. [Google Scholar] [CrossRef]
- Wang, P.; Cao, S.; Yao, M. Fundamental Diagrams for Pedestrian Traffic Flow in Controlled Experiments. Phys. A Stat. Mech. Its Appl. 2019, 525, 266–277. [Google Scholar] [CrossRef]
- Jin, C.-J.; Jiang, R.; Wong, S.C.; Xie, S.; Li, D.; Guo, N.; Wang, W. Observational Characteristics of Pedestrian Flows under High-Density Conditions Based on Controlled Experiments. Transp. Res. Part C Emerg. Technol. 2019, 109, 137–154. [Google Scholar] [CrossRef]
- Zhang, J.; Seyfried, A. Empirical Characteristics of Different Types of Pedestrian Streams. Procedia Eng. 2013, 62, 655–662. [Google Scholar] [CrossRef]
- Treiber, M.; Hennecke, A.; Helbing, D. Congested Traffic States in Empirical Observations and Microscopic Simulations. Phys. Rev. E 2000, 62, 1805–1824. [Google Scholar] [CrossRef] [PubMed]
- Greenberg, H. An Analysis of Traffic Flow. Oper. Res. 1959, 7, 79–85. [Google Scholar] [CrossRef]
- Pipes, L.A. Car Following Models and the Fundamental Diagram of Road Traffic. Transp. Res. 1967, 1, 21–29. [Google Scholar] [CrossRef]
- Ni, D.; Leonard, J.D.; Jia, C.; Wang, J. Vehicle Longitudinal Control and Traffic Stream Modeling. Transp. Sci. 2016, 50, 1016–1031. [Google Scholar] [CrossRef]
- Kang, L.; Meng, Q.; Liu, Q. Fundamental Diagram of Ship Traffic in the Singapore Strait. Ocean Eng. 2018, 147, 340–354. [Google Scholar] [CrossRef]
- Smith, L.; Beckman, R.; Baggerly, K. TRANSIMS: Transportation Analysis and Simulation System; Los Alamos National Lab. (LANL): Los Alamos, NM, USA, 1995. [Google Scholar]
- Nagel, K.; Schreckenberg, M. A Cellular Automaton Model for Freeway Traffic. J. Phys. I 1992, 2, 2221–2229. [Google Scholar] [CrossRef]
- Liu, J.; Zhou, F.; Wang, M. Simulation of Waterway Traffic Flow at Harbor Based on the Ship Behavior and Cellular Automata. In Proceedings of the 2010 International Conference on Artificial Intelligence and Computational Intelligence, Sanya, China, 23–24 October 2010; pp. 542–546. [Google Scholar]
- Xiao, F.; Ligteringen, H.; van Gulijk, C.; Ale, B. Nautical Traffic Simulation with Multi-Agent System for Safety. In Proceedings of the 16th International IEEE Conference on Intelligent Transportation Systems (ITSC 2013), Hague, The Netherlands, 6–9 October 2013; pp. 1245–1252. [Google Scholar]
- Jin, S.; Qu, X.; Xu, C.; Ma, D.; Wang, D. An Improved Multi-Value Cellular Automata Model for Heterogeneous Bicycle Traffic Flow. Phys. Lett. A 2015, 379, 2409–2416. [Google Scholar] [CrossRef]
- Peng, J.; Zhang, S.; Zhou, Y.; Li, Z. An Integrated Model for Autonomous Speed and Lane Change Decision-Making Based on Deep Reinforcement Learning. IEEE Trans. Intell. Transp. Syst. 2022, 23, 21848–21860. [Google Scholar] [CrossRef]
- Liang, X.; Mao, B.; Xu, Q. Psychological-Physical Force Model for Bicycle Dynamics. J. Transp. Syst. Eng. Inf. Technol. 2012, 12, 91–97. [Google Scholar] [CrossRef]
- Ni, D. A Unified Perspective on Traffic Flow Theory. Part I: The Field Theory. Appl. Math. Sci. 2013, 7, 1929–1946. [Google Scholar] [CrossRef]
- Ni, D. A Unified Perspective on Traffic Flow Theory. Part II: The Unified Diagram. Appl. Math. Sci. 2013, 7, 1947–1963. [Google Scholar] [CrossRef]
- Ni, D.; Wang, H. A Unified Perspective on Traffic Flow Theory. Part III: Validation and Benchmarking. Appl. Math. Sci. 2013, 7, 1965–1982. [Google Scholar] [CrossRef]
- Chandler, R.E.; Herman, R.; Montroll, E.W. Traffic Dynamics: Studies in Car Following. Oper. Res. 1958, 6, 165–184. [Google Scholar] [CrossRef]
- Bando, M.; Hasebe, K.; Nakayama, A.; Shibata, A.; Sugiyama, Y. Dynamical Model of Traffic Congestion and Numerical Simulation. Phys. Rev. E 1995, 51, 1035–1042. [Google Scholar] [CrossRef]
- Newell, G.F. Nonlinear Effects in the Dynamics of Car Following. Oper. Res. 1961, 9, 209–229. [Google Scholar] [CrossRef]
- Yang, W.; Jiang, S.; Liao, P.; Wang, H. Evaluation of Car-Following Model for Inland Vessel-Following Behavior. Ocean Eng. 2023, 284, 115196. [Google Scholar] [CrossRef]
- Kurtc, V.; Treiber, M. Simulating Bicycle Traffic by the Intelligent-Driver Model-Reproducing the Traffic-Wave Characteristics Observed in a Bicycle-Following Experiment. J. Traffic Transp. Eng. (Engl. Ed.) 2020, 7, 19–29. [Google Scholar] [CrossRef]
- Wang, Z.; Shi, X.; Li, X. Review of Lane-Changing Maneuvers of Connected and Automated Vehicles: Models, Algorithms and Traffic Impact Analyses. J. Indian Inst. Sci. 2019, 99, 589–599. [Google Scholar] [CrossRef]
- Xiao, F. Ships in an Artificial Force Field: A Multi-Agent System for Nautical Traffic and Safety. Ph.D. Thesis, Technische Universiteit Delft, Delft, The Netherlands, 2014. [Google Scholar]
- Shu, Y.; Daamen, W.; Ligteringen, H.; Hoogendoorn, S.P. Operational Model for Vessel Traffic Using Optimal Control and Calibration. Sci. J. Marit. Univ. Szczec. 2015, 42, 70–77. [Google Scholar]



| Traffic Classification | Cars | Bicycles | Pedestrians | Vessels | Trains | Aircraft | Small Unmanned Aircraft |
|---|---|---|---|---|---|---|---|
| Dimensions (length) | 0–24 m [26] | 1.7–1.9 m [27] | 0.43 m [28] | 0–399.9 m [29] | 209 m (CR300AF Renaissance EMU Train) | 38.9 m (C919) 68.28 m (787-10) | 0.35 m (DJI Mavic 3) 0.6 m (INSPIRE 2) |
| Average speed in free flow | 100 km/h [30] | 14–22 km/h [27] | 2.5–4.3 km/h [31] | 6–30 km/h [32] | 200 km/h~250 km/h CR300AF Renaissance EMU Train | 903 km/h | Max 76k m/h (DJI Mavic 3) Max 94 km/h (INSPIRE 2) |
| Order of magnitude of reaction time | Second level | Second level | Second level | Minute level | Second level | Second level | Second level |
| Transportation medium | Roads and air | Roads and air | Roads and air | Air and water | Air and orbits | Air | Air |
| Lane discipline | Yes | No | No | No | Yes | No | No |
| Dimension of motion | 1.5D | 2D | 2D | 2D/3D | 1D | 3D | 3D |
| Traffic Classification | Traffic Organization Mode | |||
|---|---|---|---|---|
| Cars | Self-organizing | Free competition | Driver takes control | Traffic rules |
| Bicycles | Self-organizing | Free competition | Driver takes control | Traffic rules |
| Pedestrians | Self-organizing | Free competition | Driver takes control | Traffic rules |
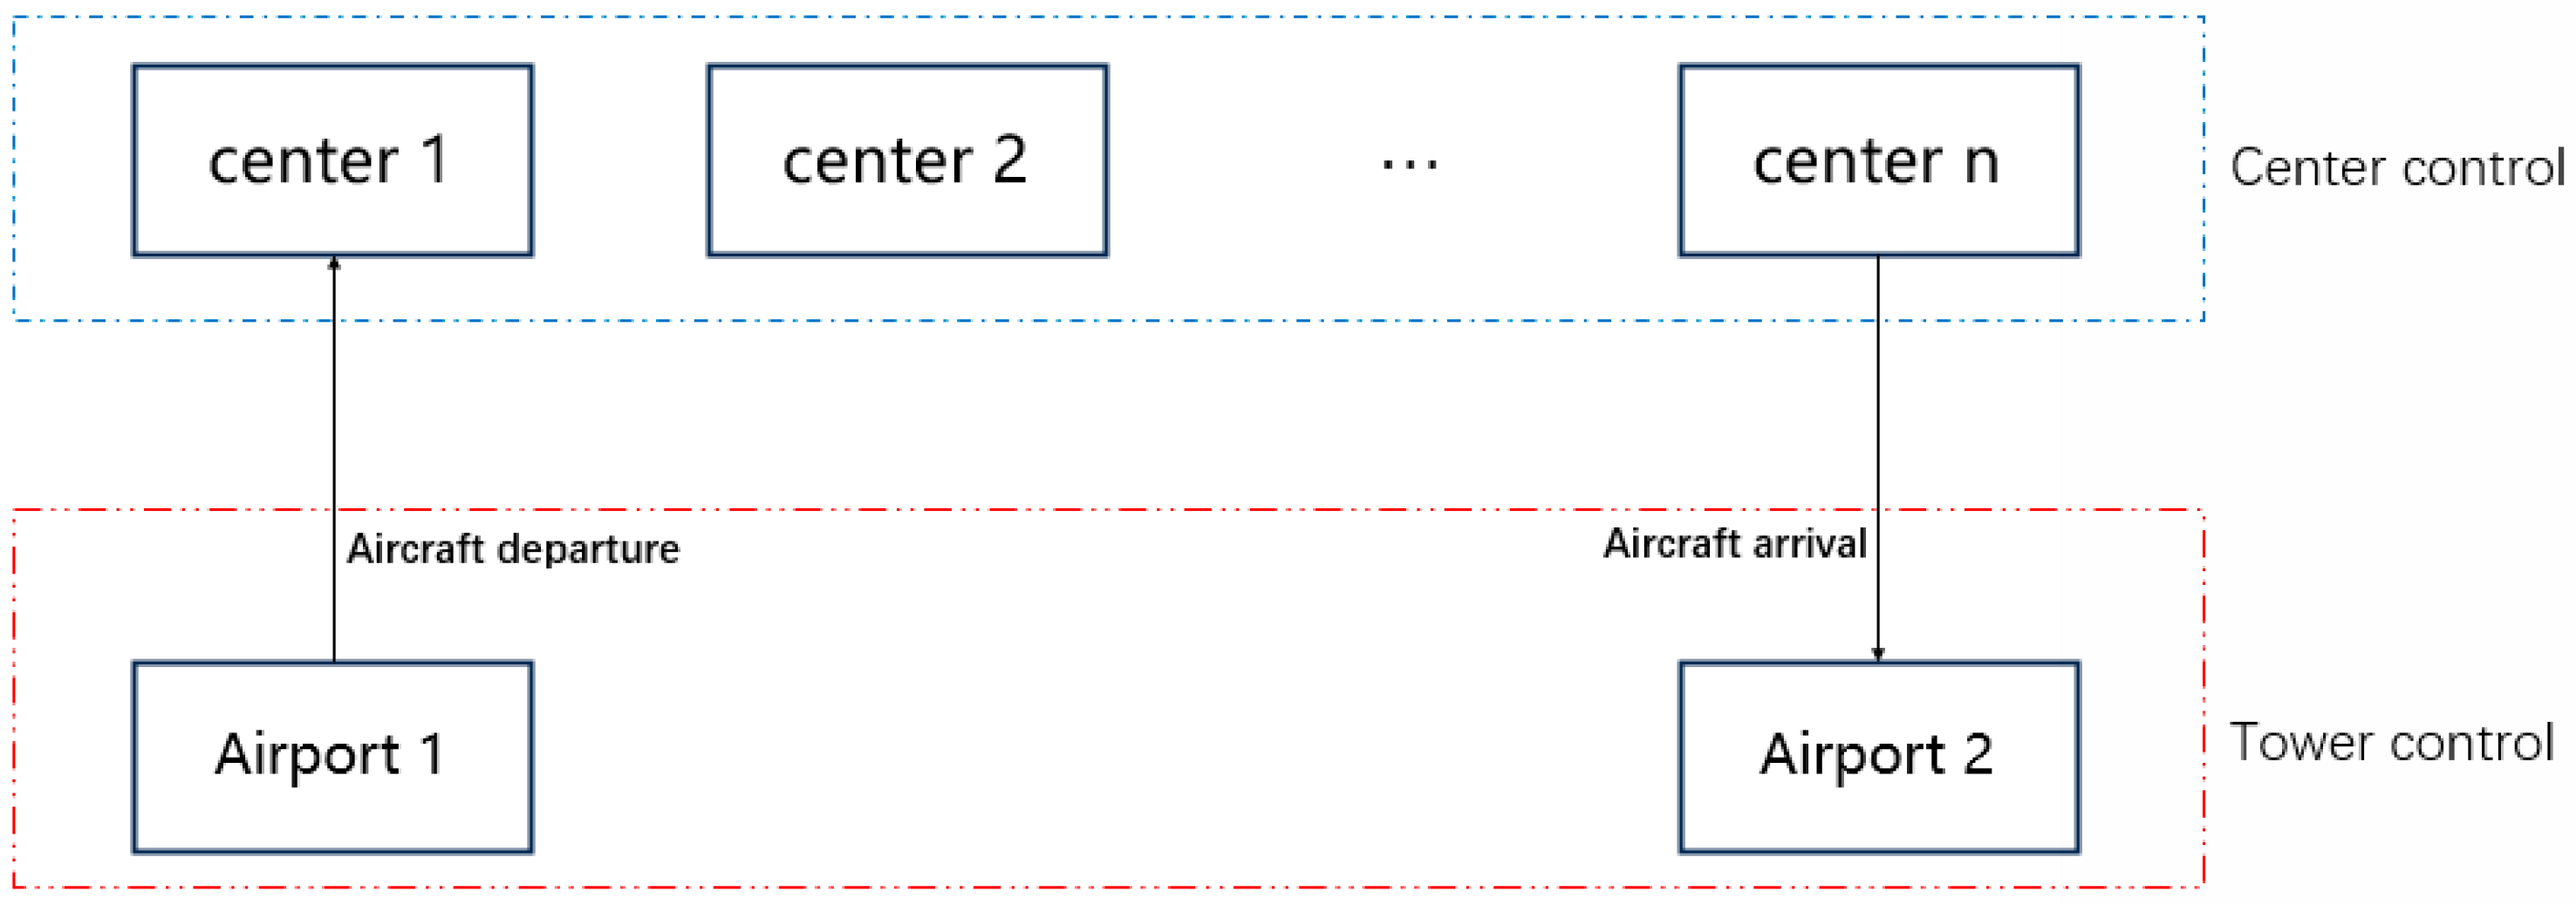
| Trains | Schedule/Management | No free competition | Center control | - |
| Aircraft | Schedule/Management | No free competition | Center control | - |
| Small Unmanned Aircraft | Self-organizing | Free competition | Driver takes control | - |
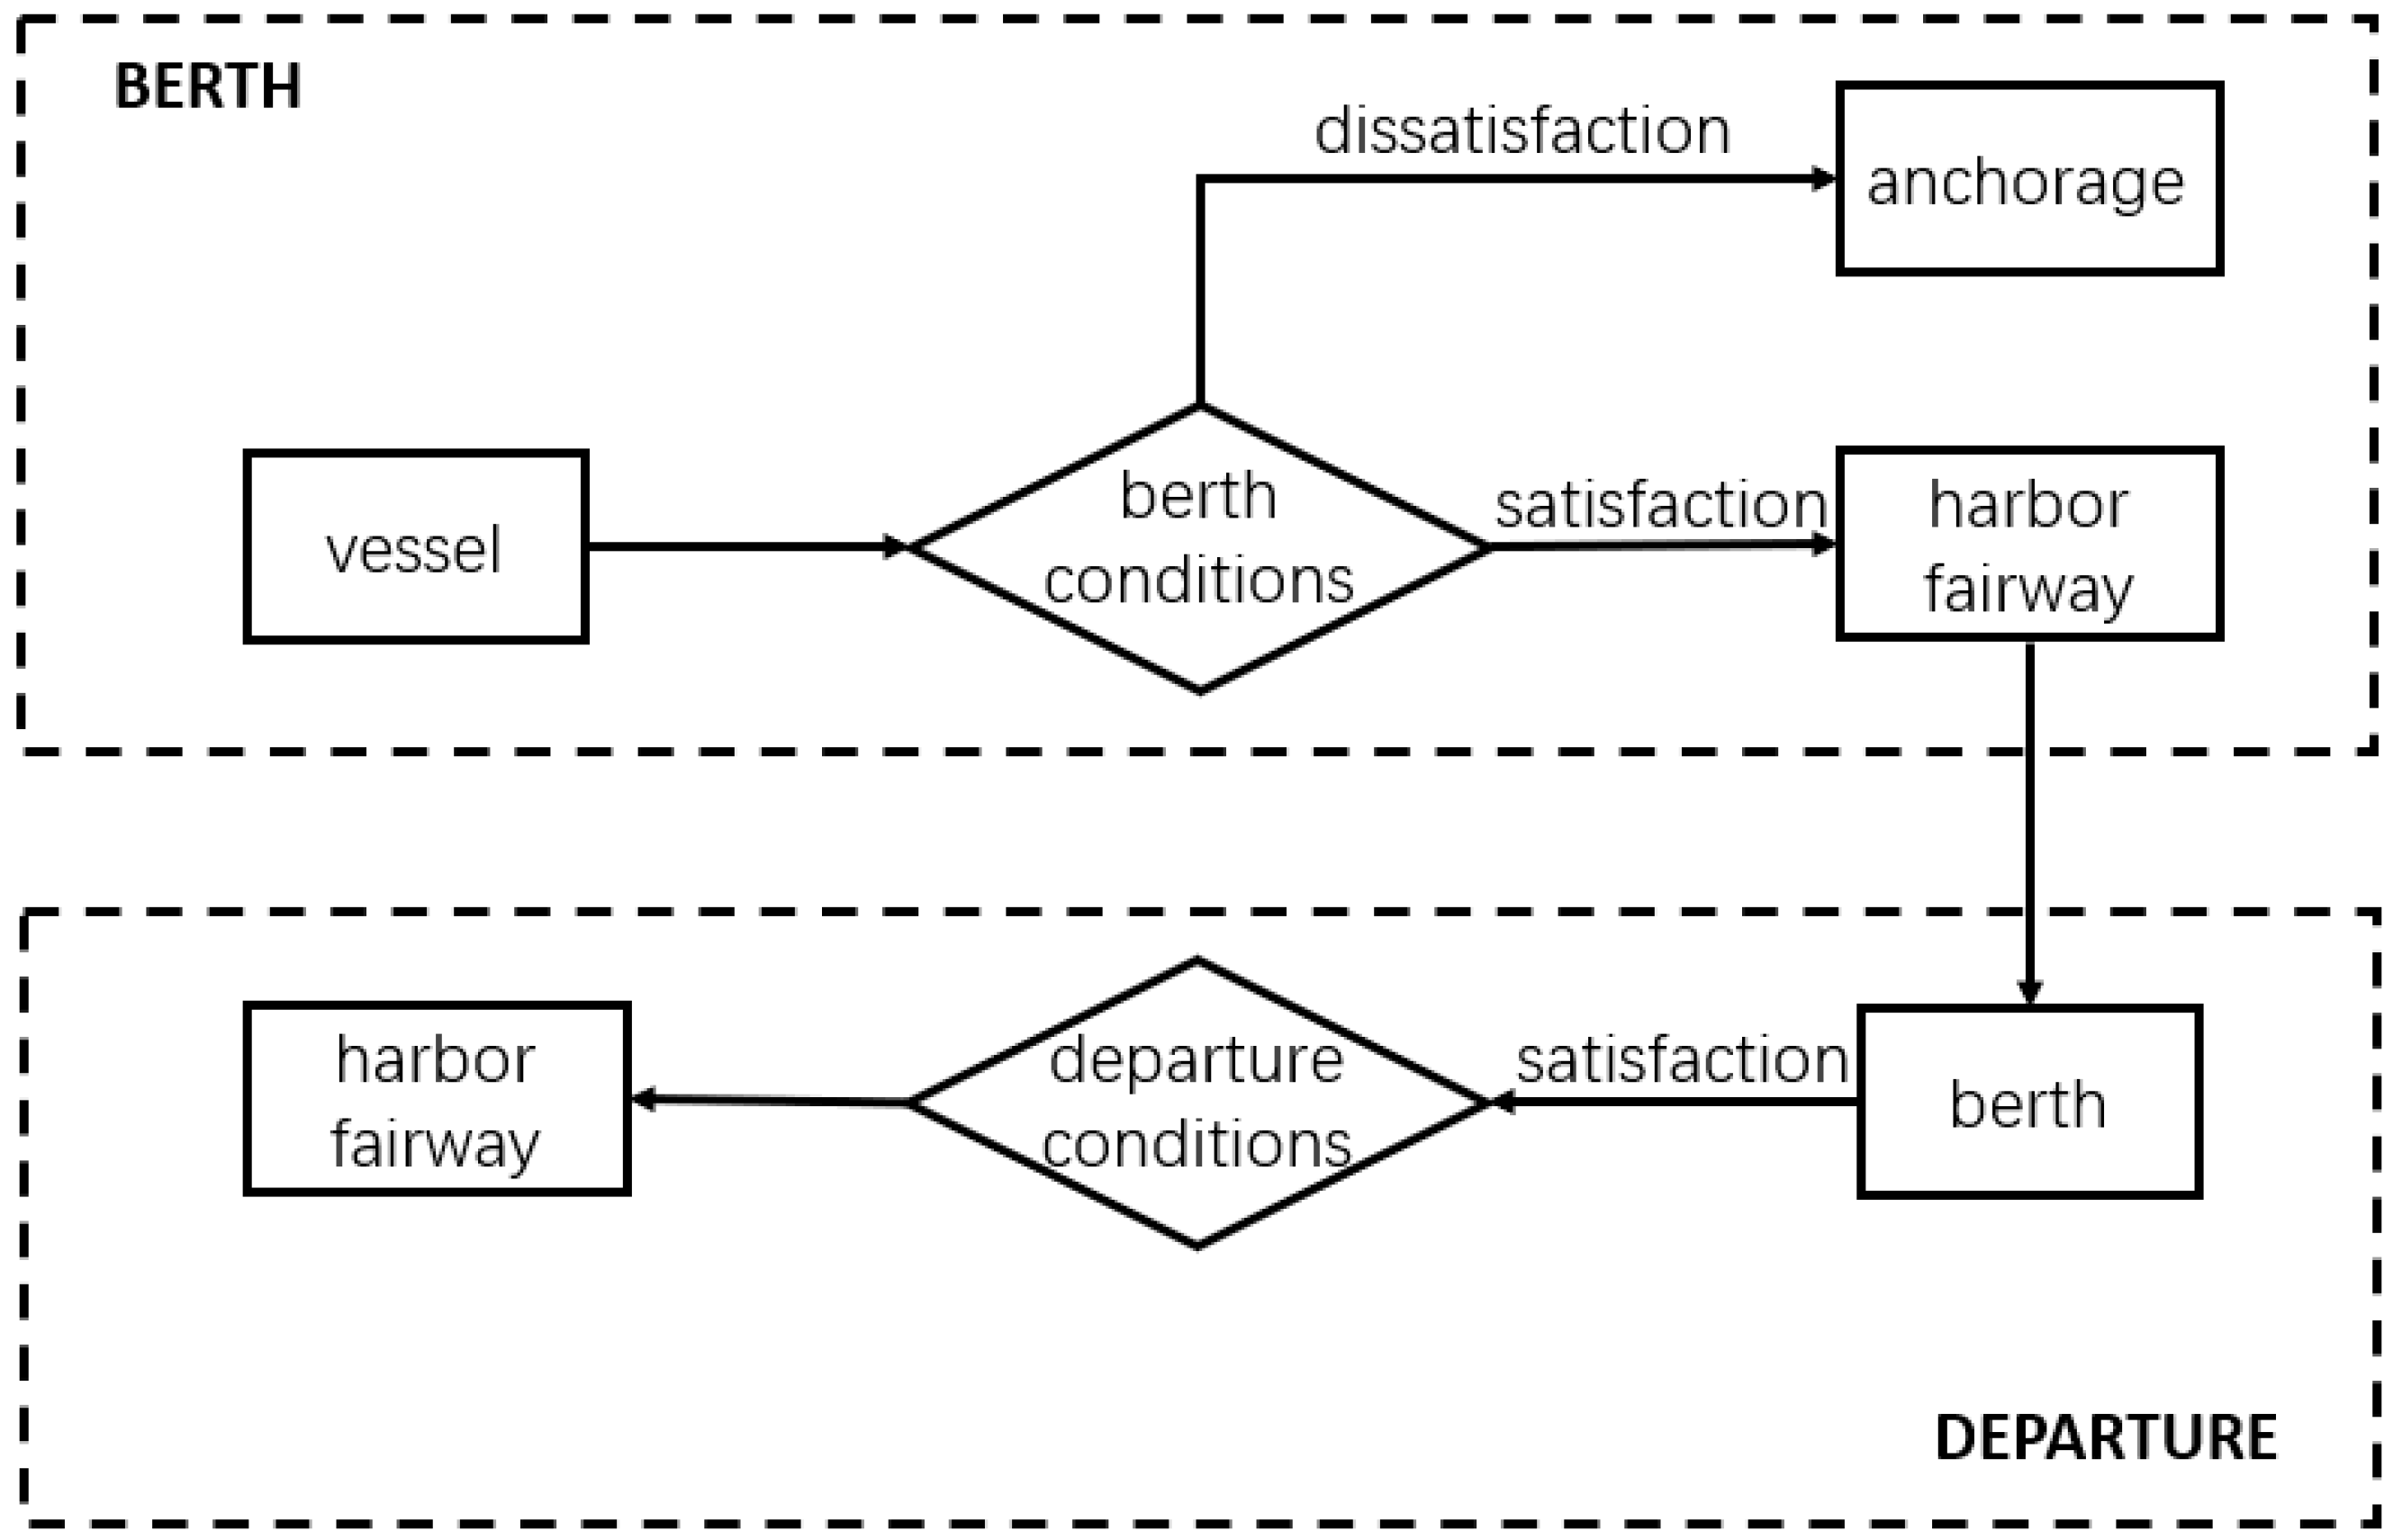
| Vessels | Hybrid | Hybrid | Hybrid | Traffic rules |
| No. | Way | Flow | Density | Speed | Application Scenario | ||
|---|---|---|---|---|---|---|---|
| 1 | one-dimensional | - | homogeneous traffic flow | lane discipline | |||
| 2 | one-dimensional | - | homogeneous traffic flow | lane discipline | |||
| 3 | two-dimensional | X-T | homogeneous traffic flow | lane discipline | |||
| 4 | three-dimensional | N-X-T | homogeneous traffic flow | lane discipline | |||
| 5 | three-dimensional | X-Y-T | homogeneous traffic flow | no lane discipline | |||
| 6 | three-dimensional (adjusted by area) | X-Y-T | heterogeneous traffic flow | no lane discipline | |||
| No. | Method | Basis for Determining Conversion Factors | Calculation Formula or Principle | Application Scenario | Remark | |
|---|---|---|---|---|---|---|
| 1 | Overtaking | Number of vehicles overtaking | The ratio of the number of cars that surpass non-standard cars relative to the number of non-standard cars and the number of standard cars with lower performance relative to the number of standard cars with lower performance. | Lane discipline | Mixed traffic flow with two types of vehicles | Measurable |
| 2 | Headway | Headway | The ratio of the average lagged headway of non-standard vehicles to the average lagged headway of PCUs. | Lane discipline | Mixed traffic flow with two types of vehicles | Measurable |
| 3 | Delay | Vehicle delay time | The ratio of delays experienced by PCUs due to non-standard cars to delays experienced by PCUs due to other PCUs. | Lane discipline | Mixed traffic flow with two or more types of vehicles | Unmeasurable |
| 4 | Equal Speed | Flow speed | Remove a certain number of PCUs and add a certain number of non-standard vehicles to heterogeneous traffic flow so that the flow speeds of the two traffic flows are the same. | Lane discipline | Mixed traffic flow with two or more types of vehicles | Measurable |
| 5 | Macroscopic Relationships | LOS | Under the same performance indicators, a traffic flow that only includes PCUs and another mixed flow that includes both PCUs and non-standard vehicles with the same LOS are considered equivalent. | Lane discipline | Mixed traffic flow with two or three types of vehicles | Unmeasurable |
| 6 | Regression | Vehicle speed, headway | Estimate the PCE value of heavy vehicles driving on a dual-lane, two-way highway based on the relative deceleration caused by an equal amount of each vehicle type. | No lane discipline | Mixed traffic flow with two or more types of vehicles | Measurable |
| 7 | Capacity | Road capacity | According to the principle of equal capacity, when the traffic flow of standard and non-standard vehicles reaches saturation, the conversion coefficient is calculated based on the saturation flow under the same road width. | Lane discipline | Mixed traffic flow with two or more types of vehicles | Measurable |
| 8 | Calculated based on the fact that the traffic flow remains almost unchanged after reaching the road capacity. | No lane discipline | Mixed traffic flow with two or more types of vehicles | Measurable | ||
| 9 | Vehicle Moving Space | Vehicle moving space | The space occupied by non-standard cars relative to standard cars. | No lane discipline | Mixed traffic flow with two or more types of vehicles | Unmeasurable |
| 10 | Speed Area | Vehicle speed and area | The ratio between the speed ratio of the standard cars and non-standard cars to that of the space ratio of the cars. | No lane discipline | Mixed traffic flow with two or more types of vehicles | Measurable |
| 11 | Modified Density | Traffic density and width | The ratio of the area occupancy rate of non-standard cars to the area occupancy rate of standard cars. | No lane discipline | Mixed traffic flow with two or more types of vehicles | Measurable |
| 12 | Area Occupancy | Flow | Calculate the flow corresponding to standard vehicle traffic flow and mixed traffic flow under the same area occupancy rate. | No lane discipline | Mixed traffic flow with two or more types of vehicles | Measurable |
| Ref. | Domain | Author | Characteristics of Traffic Flow | Number of Lanes | Definition Method of Traffic Flow Characteristic | Completeness of Fundamental Diagram |
|---|---|---|---|---|---|---|
| [59] | Road | M. J. Cassidy | Continuous flow with lane discipline | Multiple lanes | Using area occupancy to indicate density | Complete |
| [60] | Bicycle | N. Guo et al. | Continuous flow | Multiple lanes | Using occupancy to indicate density | Complete |
| [61] | Pedestrian | P. Wang et al. | Continuous flow | Multiple lanes with bidirectional pedestrian flow | Using area occupancy to indicate density | Complete |
| [62] | Pedestrian | C.-J. Jin et al. | Continuous flow | Multiple lanes with bidirectional pedestrian flow | Using area occupancy to indicate density | Complete |
| [63] | Pedestrian | J. Zhang et al. | Continuous flow | Multiple lanes with bidirectional pedestrian flow | Using area occupancy to indicate density | Complete |
| [64] | Road | M. Treiber et al. | Continuous flow with lane discipline | Single lane | Using Edie’s definition to indicate density | Complete |
| [58] | Road | B. D. Greenshields et al. | Continuous flow with lane discipline | Single lane | Using Edie’s definition to indicate density | Complete |
| [65] | Road | Greenberg et al. | Continuous flow with lane discipline | Single lane | Using Edie’s definition to indicate density | Complete |
| [66] | Road | L. A. Pipes | Continuous flow with lane discipline | Single lane | Using Edie’s definition to indicate density | Complete |
| [67] | Road | D. Ni | Continuous flow with lane discipline | Single lane | Using Edie’s definition to indicate density | Complete |
| Flow | Speed | Density | |
|---|---|---|---|
| Without channel subdivision | 5 | 96 | 480 |
| Left channel | 4 | 130 | 260 |
| Right channel | 6 | 73.3 | 440 |
| Geographical Scope | Level of Detail for Road Traffic | Level of Detail for Waterway Traffic |
|---|---|---|
| Macroscopic | Nation-wide, state-wide, regional | Nation-wide, regional |
| Mesoscopic | Regional, metropolitan, city-wide transportation network | Port-wide, canal-wide, strait-wide, regional |
| Microscopic | Highways, streets, sections | Small-scale waters, sections of the channel |
| Picoscopic | Sections, blocks, junctions, intersections | Confined water area, crossing water area, small-scale waters |
Disclaimer/Publisher’s Note: The statements, opinions and data contained in all publications are solely those of the individual author(s) and contributor(s) and not of MDPI and/or the editor(s). MDPI and/or the editor(s) disclaim responsibility for any injury to people or property resulting from any ideas, methods, instructions or products referred to in the content. |
© 2024 by the authors. Licensee MDPI, Basel, Switzerland. This article is an open access article distributed under the terms and conditions of the Creative Commons Attribution (CC BY) license (https://creativecommons.org/licenses/by/4.0/).
Share and Cite
Zhuang, S.; Liu, Y.; Wang, W.; Guo, S.; Ni, D. Traffic Flow Theory for Waterway Traffic: Current Challenges and Countermeasures. J. Mar. Sci. Eng. 2024, 12, 2254. https://doi.org/10.3390/jmse12122254
Zhuang S, Liu Y, Wang W, Guo S, Ni D. Traffic Flow Theory for Waterway Traffic: Current Challenges and Countermeasures. Journal of Marine Science and Engineering. 2024; 12(12):2254. https://doi.org/10.3390/jmse12122254
Chicago/Turabian StyleZhuang, Siqing, Yihua Liu, Weihao Wang, Shaojie Guo, and Daiheng Ni. 2024. "Traffic Flow Theory for Waterway Traffic: Current Challenges and Countermeasures" Journal of Marine Science and Engineering 12, no. 12: 2254. https://doi.org/10.3390/jmse12122254
APA StyleZhuang, S., Liu, Y., Wang, W., Guo, S., & Ni, D. (2024). Traffic Flow Theory for Waterway Traffic: Current Challenges and Countermeasures. Journal of Marine Science and Engineering, 12(12), 2254. https://doi.org/10.3390/jmse12122254


