Article

Aeroelastic Simulation of Full-Machine Wind Turbines Using a Two-Way Fluid-Structure Interaction Approach

1
Department of Mechanical Engineering, National Taiwan University, Taipei 10617, Taiwan
2
NTU Energy Research Center, National Taiwan University, Roosevelt Rd., Taipei 10617, Taiwan
3
Department of Mechanical Engineering, National Taiwan University of Science and Technology, Keelung Rd., Taipei 10617, Taiwan
4
Department of Engineering Science and Ocean Engineering, National Taiwan University, Roosevelt Rd., Taipei 10617, Taiwan
*
Authors to whom correspondence should be addressed.
J. Mar. Sci. Eng. 2024, 12(12), 2271; https://doi.org/10.3390/jmse12122271
Submission received: 15 November 2024 / Revised: 7 December 2024 / Accepted: 8 December 2024 / Published: 10 December 2024
(This article belongs to the Section Ocean Engineering)

Abstract

:
Two-way fluid–structure interaction (FSI) simulation of wind turbines has gained significant attention in recent years due to the growth of offshore wind energy development. Strong coupling procedures in these simulations predict realistic behavior with higher accuracy but result in increased computational costs and potential numerical instabilities. This paper proposes a mixed weak and strong coupling approach for the FSI simulation of a 5 MW wind turbine. The deformation of the turbine blade is calculated using a weak coupling approach, ensuring blade deflection meets a convergence criterion before rotating to the next azimuthal position. Fluid and solid solvers are partitioned, utilizing the commercial software packages STAR-CCM+ and Abaqus, respectively. Flexible and rigid blade cases are modeled, and the calculated loads, power, and blade tip displacement for the rotor at a constant rotating speed are compared. The proposed model is validated, showing good agreement with the existing literature and results comparable to those from another validated wind turbine simulator. The effect of rotor–tower interaction is evident in the results. Based on our calculations, the power production of flexible blades is evaluated to be 9.6% lower than that of rigid blades.

1. Introduction

Driven by the recent development of large-scale offshore wind turbines and the increase in designed blade lengths, associated research in wind turbine engineering has increasingly focused on the complex interactions between aerodynamic loads and structural responses. Currently, most wind turbine aerodynamics and aeroelasticity simulations for engineering design are based on simplified wind turbine models, such as OpenFAST [1], Bladed [2], HAWC2 [3], and WAsP [4]. These models avoid solving the detailed physics of fluid fields directly; instead, they rely on reduced-order aerodynamic and structural models to approximate aerodynamic forces and structural responses with reasonable accuracy. While such simplifications exclude certain nonlinear and high-fidelity effects, they enhance model fidelity by incorporating advanced empirical or semi-analytical aerodynamic formulations. This approach reduces computational costs, making them practical for routine design processes. However, advances in computational technology have driven the field toward higher-fidelity, multi-physics coupled simulations, which can reveal more details of the underlying mechanisms. For example, Larsen [5] reported that the nonlinear effects of large blade deflections may cause a smaller effective rotor swept area and lower power production than simplified linear models predict. Recognizing the limitations, this evolution of computational methodologies has led to a growing emphasis on fluid–structure interaction (FSI) simulations for large offshore wind turbines. These simulations provide insights into optimizing blade design and maximizing power efficiency while also establishing the physical foundations for developing the above-mentioned simplified models.
Contemporary wind turbine models employ various methods to handle the interactions between structural responses and aerodynamic loads. Simplified models can incorporate either the actuator line model (ALM) [6,7,8,9] or actuator disk model (ADM) [10,11,12,13,14] to account for the forces transmitted between the blades and wind field. The displacement of the blades is modeled as a driving source to change the body forces exerted on the flows. Alternatively, some researchers focus on the structural modeling of turbine blades and only consider the wind loads derived from various aerodynamic models [15,16,17,18]. For the works with detailed computational structural and fluid dynamic models, FSI simulations are particularly effective and suitable. They can be categorized based on the complexity of the coupling method. One-way coupling [19,20,21,22,23], which considers only the effect of fluid flow onto structural deformations, is a more feasible way to avoid numerical instabilities and high computational expense. In contrast, two-way coupling [22,23,24,25] describes the interactive behaviors more precisely through iterations including the mutual effects on the interface. Albeit with longer computing times, two-way coupling is regarded as an advanced approach to more accurately reflect the realistic physics and dynamics between winds and turbine structures. Using this simulation technique, researchers are allowed to investigate either the dynamics of a wind turbine rotor [26,27,28,29] or the comprehensive characteristics of an entire wind turbine machine [30,31,32], including the effects of rotor–tower interactions.
Coupling methods in FSIs can also be broadly categorized into partitioned and monolithic approaches [33]. In partitioned FSIs, the fluid and structural solvers are separate but communicate iteratively, while monolithic FSIs integrate both solvers into a single system. The partitioned approach is not limited by the synthesis of fluid and solid codes and has higher applicability when implemented with two-way FSI simulation. The two-way coupling can further be classified as weak or strong. In contrast to weak coupling, which involves explicitly iterating between fluid and solid fields only once per time step, strong coupling implicitly transfers variables at the interface and iteratively solves the governing equations for both fluid and structure at each time step, which ensures temporal accuracy [33]. However, this approach typically increases computational costs and can lead to numerical instability, especially in cases of slender structures interacting with incompressible flow [34]. The fluid’s incompressibility leads to the so-called “added-mass effect,” where the fluid acts as an additional mass in the structural dynamics and in turn causes instability. This effect is particularly significant in wind turbine blade simulations for lengthened blade designs of large-scale offshore wind turbines.
Moving forward, developing advanced FSI coupling methods that enhance stability and accuracy is essential for improving wind turbine simulations. This paper, which is an extension of the author’s previous work [35], presents a novel procedure to conduct the full-machine FSI simulation of the 5 MW baseline wind turbine developed by the National Renewable Energy Lab (NREL) [36]. A two-way partitioned approach was selected so that different commercial packages of software were used for fluid and structural dynamic simulations, respectively. The blade displacement due to wind loads was calculated based on weak coupling and was saved when the final steady state of deformation was reached. Then, the deformed blade was assumed rigid and rotated for the next time step. This FSI process of the rotor rotation can be regarded as following the strong coupling approach. Following this line of thought, we introduce the theoretical background and model settings of the proposed FSI simulation in Section 2 where the works of model verification are also elaborated. In Section 3, simulation results of the blade load and displacement as well as power production are shown, including the investigations of rotor–tower interactions. The conclusions and future works of this study are discussed in Section 4.

2. Methodology

The methodology for this study involved the development of a robust wind turbine simulation model, integrating a fluid dynamics model, a structural model, and an FSI coupling method to accurately capture the interactions between these components. Following the model development, we detail the specific settings and configurations used to establish the simulation environment. Afterward, we present the numerical verification process to ensure the reliability of our proposed model.

2.1. Fluid Dynamics Model

The dynamics of wind fields in this study were simulated using CFD (computational fluid dynamics) techniques. The commercial software, STAR-CCM+ [37], a common tool for CFD modeling, was utilized for the wind simulation. Here, we begin with presenting the fundamental equations that govern the fluid dynamic behavior, followed by an introduction of the corresponding turbulence model used to account for complex wind flows. The schemes and algorithms for numerical solutions are also discussed.

2.1.1. Governing Equations

The RANS (Reynolds-averaged Navier–Stokes) model was selected to handle the generation of turbulence field with a high Reynolds number (on the order of ~ 10 6 ) and Mach numbers less than 0.3. The background of the model is briefly outlined in this section. The continuity and momentum transport equations for incompressible flows are commonly written as
· ( ρ u ) = 0 ,
( ρ u ) t + · ( ρ u u ) = p + · τ ρ u u ¯ + ρ g ,
τ = μ ( u + ( u ) T ) ,
where ρ represents the constant density of dry air (i.e., 1.225   kg   m 3 ); t denotes time; and u represents the Reynolds-averaged wind velocity vector. The prime symbol “′” is used to define the fluctuating quantity in Reynolds averaging. p is the averaged dynamic pressure; μ is the dynamic viscosity; and g is the gravitational acceleration vector. The terms τ and ρ u u ¯ refer to the viscous shear stress and the Reynolds stress, respectively. The Reynolds stress term, which relates to the turbulence characteristics, needs to be additionally modeled to achieve closure of the Navier–Stokes equations.

2.1.2. Turbulence Model

In our simulation, we employed the commonly used SST (shear stress transport) k ω model [38] to handle flow turbulence. The Boussinesq hypothesis was applied to model the Reynolds stress as
ρ u u ¯ = μ t u + ( u ) T 2 3 ρ k I ,
k = 1 2 u · u ¯ ,
where μ t denotes turbulent viscosity; k represents the turbulent kinetic energy; and I is the identity matrix. We employed a two-equation model, and the transport equations for k and ω (specific dissipation rate) are expressed as
( ρ k ) t + · ( ρ k u ) = · μ + μ t σ k k + G k Y k ,
( ρ ω ) t + · ( ρ ω u ) = · μ + μ t σ ω ω + G ω Y ω + D ω ,
where σ k and σ ω represent the turbulent Prandtl numbers; G k and G ω are the production terms; Y k and Y ω are the dissipation terms; and D ω is the turbulent cross-diffusion term. By solving these transport equations, the turbulent viscosity μ t can then be determined. The SST k ω model provides flexibility to employ appropriate approaches for capturing accurate turbulence characteristics at different locations displaced from the walls of the simulation domain.

2.1.3. Numerical Methods

In this study, a finite volume method was applied to solve the discretized Navier–Stokes equations. We used the well-known and extensively applied SIMPLE (Semi-implicit Method for Pressure-linked Equations) algorithm [39] to calculate the coupled velocities and pressures in the RANS equations (i.e., Equations (1) and (2)). In STAR-CCM+ modules, we selected the hybrid second-order upwind scheme to compute the convection terms in the discretized momentum, turbulent kinetic energy, and dissipation transport equations. For the numerical solution, we set a convergence criterion to maintain the scaled residuals of all the physical quantities below 10 3 , ensuring stability after sufficient iterations. This criterion served as a reference; however, we also monitored the convergence of key flow variables, including velocity, pressure, and wall shear stress, to confirm that they reached steady values. This additional check ensured that our results were not only stable but also accurate for the study objectives.

2.2. Structural Model

To calculate the structural dynamic responses of wind turbine structures, we conducted finite element analysis (FEA) with the commercial software Abaqus [40]. The standard nonlinear dynamic solver was employed to accurately simulate the structural behavior, which satisfied the kinetic equation given by
M q ¨ ( t ) + C q ˙ ( t ) + K q ( t ) = F ( t ) ,
where q ¨ ( t ) , q ˙ ( t ) , and q ( t ) are the acceleration, velocity, and displacement vectors, respectively, at the mesh nodes. The matrices M , C , and K represent the corresponding nodal mass, damping, and stiffness, respectively. F ( t ) denotes the nodal external force vector associated with the wind loads obtained from the CFD results computed in STAR-CCM+. The Newmark implicit dynamic algorithm [41] was then applied to iteratively solve the kinetic equation and calculate the structural responses of the wind turbine in Abaqus.

2.3. FSI Coupling Method

To account for the interactive forces between the wind fields and turbine structures, we employed a two-way coupling approach using the partitioned fluid and structure solvers (i.e., STAR-CCM+ and Abaqus), as previously mentioned. First, the wind fields and the wind turbine of interest were modeled in STAR-CCM+, which allowed for the calculation of wind pressure and shear stress distributions on the turbine structures. These simulated wind loads were then mapped into the external force term of the finite element model in Abaqus, enabling the calculation of structural deformations. The resulting nodal displacements were subsequently imported back into the fluid model as a reference for updating the simulation boundaries. A portion of the localized mesh around the updated boundaries was morphed to adapt to the deformed simulation domain. This process, carried out within a single time step, constituted a typical two-way FSI coupling cycle. This approach is classified as weak coupling because, in each time step, the fluid-induced loads and structural responses are solved separately, and the simulated data are exchanged sequentially between solvers. Unlike weak coupling, the strong coupling approach involves iterations between solvers to ensure the convergence of simulation results before proceeding to the next time step. While this additional iteration increases computational expense, it provides stronger interactions between fluid and structure.
Focusing on the simulation of deformed turbine blades under stationary inflow conditions, we developed a procedure using a mixed weak and strong coupling approach. Figure 1 presents the flowchart of the proposed FSI simulation process. As illustrated, the typical weak coupling procedure was applied to calculate the deformation of blades at a fixed azimuthal angle ψ i . The FSI simulation ran with a specific time step Δ t b and continued until the blade deformation converged to a steady state. To reduce computational cost, we assumed that the deformed blade was effectively rigid during the instantaneous time step when it rotated to the next azimuthal angle, ψ i + 1 , while at each angle the blade remained fully deformable as it interacted with the flow. This assumption was valid when the wind turbine operated at a constant rotor speed with transient periods excluded. It is also supported by prior studies showing that blade tip deflections vary smoothly over a rotor cycle [26,30], displaying characteristics of a relatively low-frequency response. Thus, assuming the blade holds a quasi-rigid shape during these brief transitions allows for accurate load and power predictions with lower computational demand. At the next azimuthal step ψ i + 1 (or the time step for rotation, Δ t r ), the weak coupling procedure was rerun to calculate the updated blade deformation based on the wind field encountered at the new angle, enabling a full rotor cycle FSI simulation for detailed turbine load assessments.
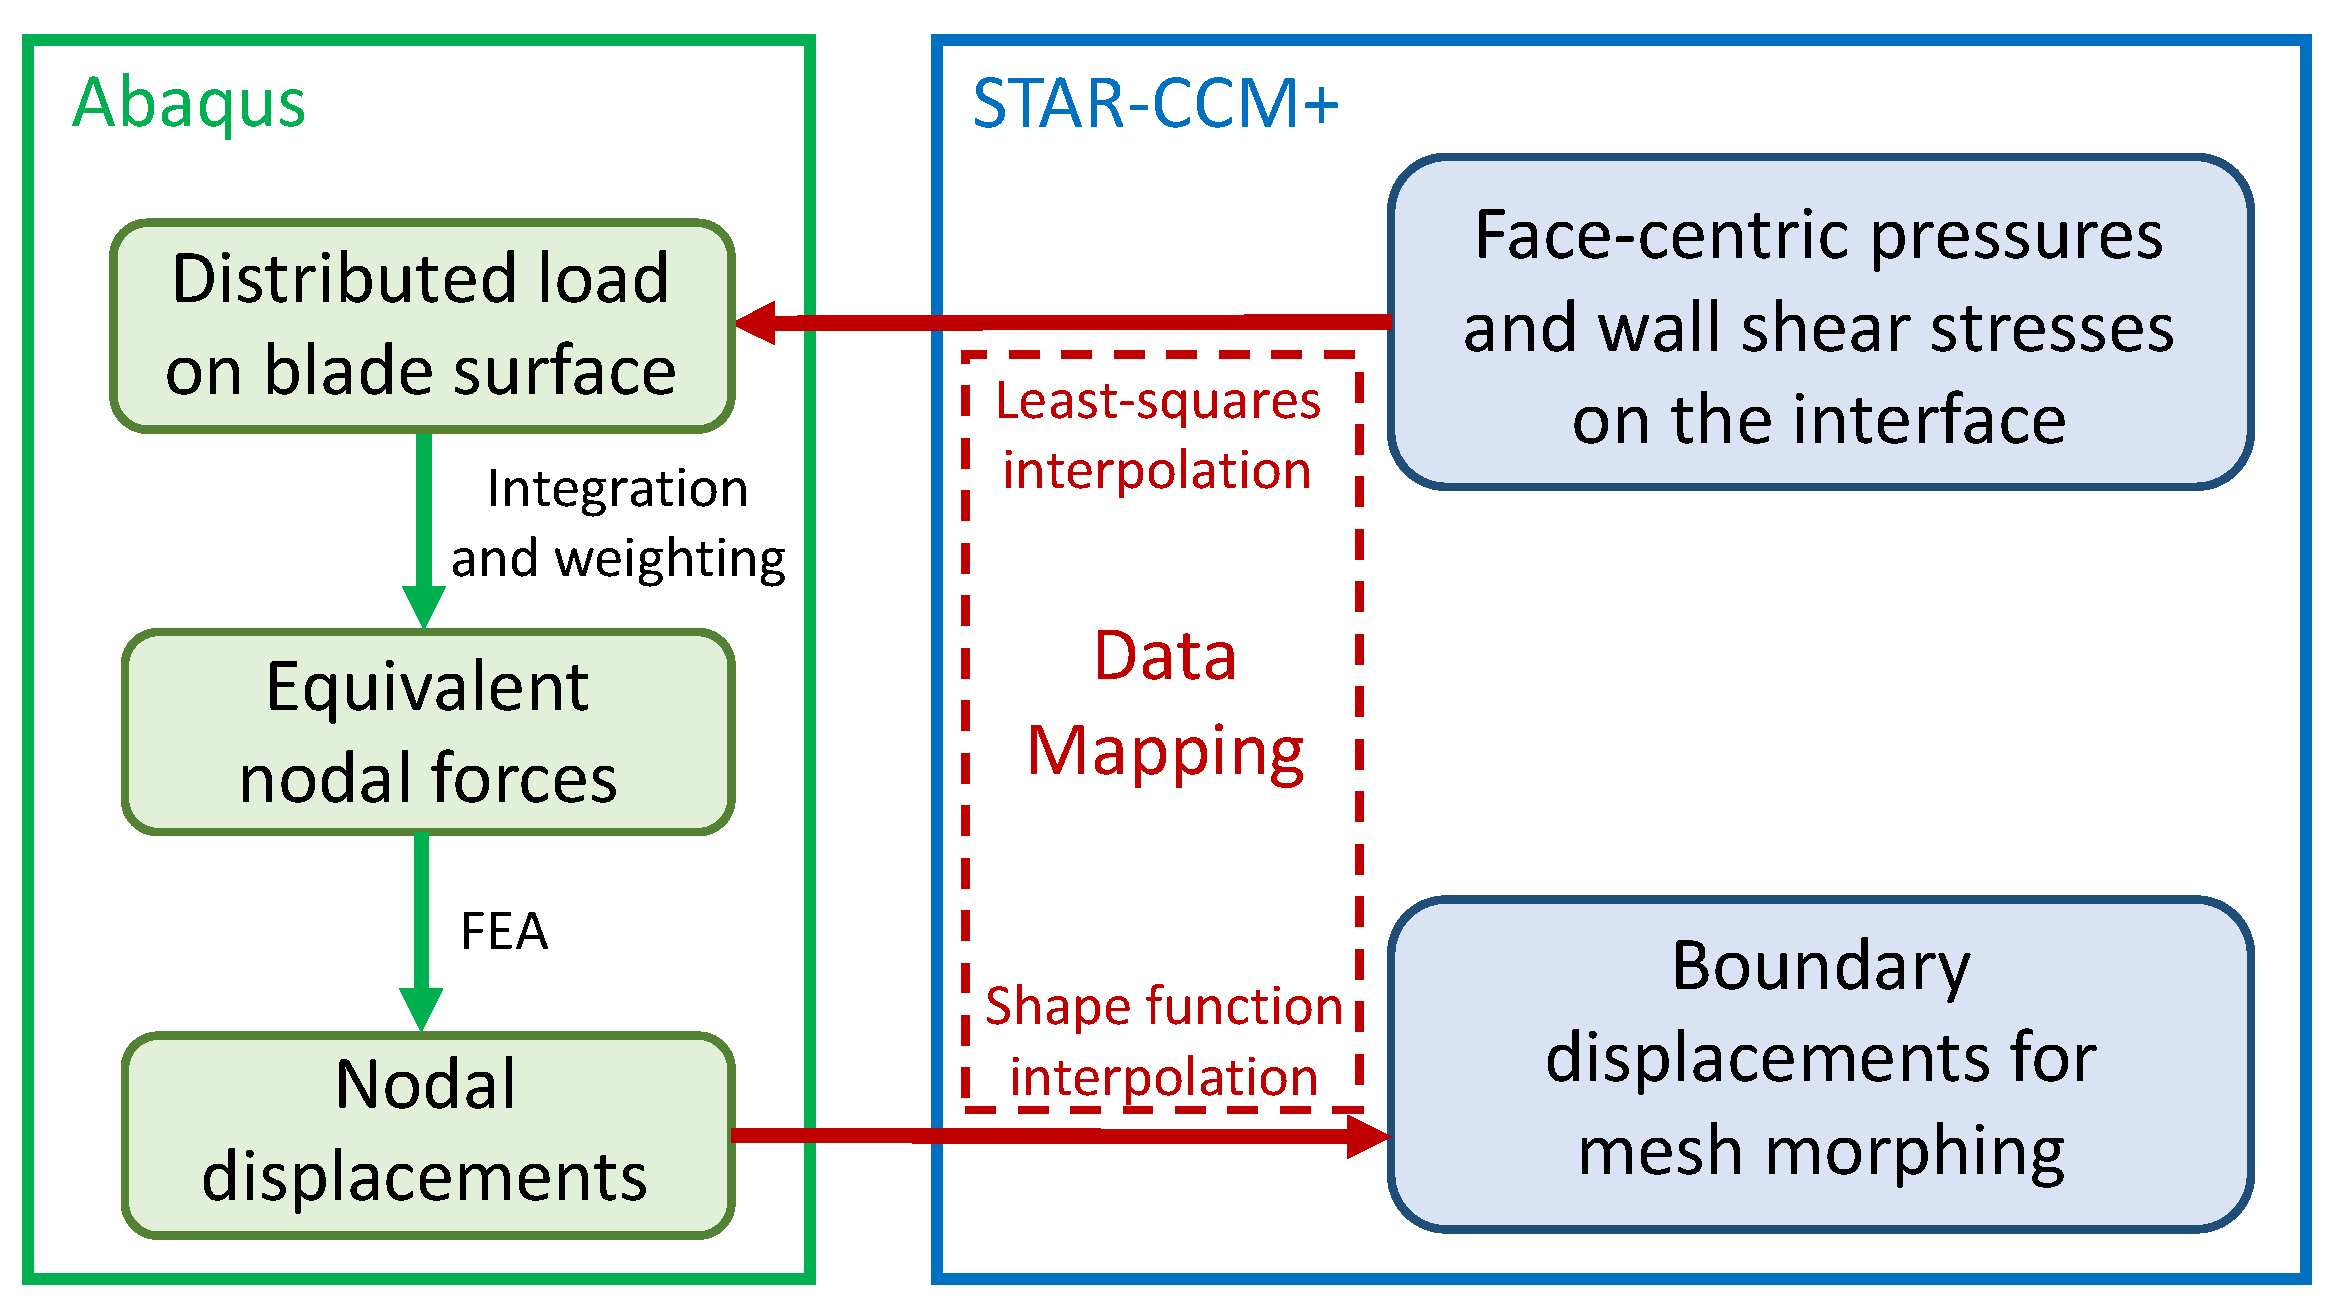
Figure 2 illustrates the data exchange process between the two codes in the FSI simulation. STAR-CCM+ utilizes collocated grids, where calculated velocities and pressures are stored at the centers of finite volume cells. For boundaries adjacent to the immersed structure, STAR-CCM+ evaluates face-centric pressures and wall shear stresses, which are subsequently converted into distributed loads for the structural interaction. A least-squares interpolation method is applied to these face-centric data, mapping them to the Abaqus input. On the Abaqus side, a standard finite element analysis is performed to determine equivalent nodal forces and compute displacements at the element vertices. These nodal displacements are then transferred back to STAR-CCM+ and converted through a shape function interpolation to update the CFD simulation domain boundaries. The fluid mesh is morphed based on the updated boundaries, allowing the next calculation step to proceed. This data mapping technique enables the automatic selection of appropriate mapping functions, facilitating the conversion between non-conformal fluid and structural meshes (i.e., the meshes do not need to align facially or match exactly). Additional details can be found in the STAR-CCM+ user guide [37] and Lakshmynarayanana [42].

2.4. Model Setup

Building on the background of our FSI approach, this section details the configurations established in the simulation environment. We introduce the wind turbine model used in this study, followed by a description of the settings applied in the CFD and structural models. The coupling settings used to effectively integrate these models are discussed afterward.

2.4.1. Wind Turbine Model

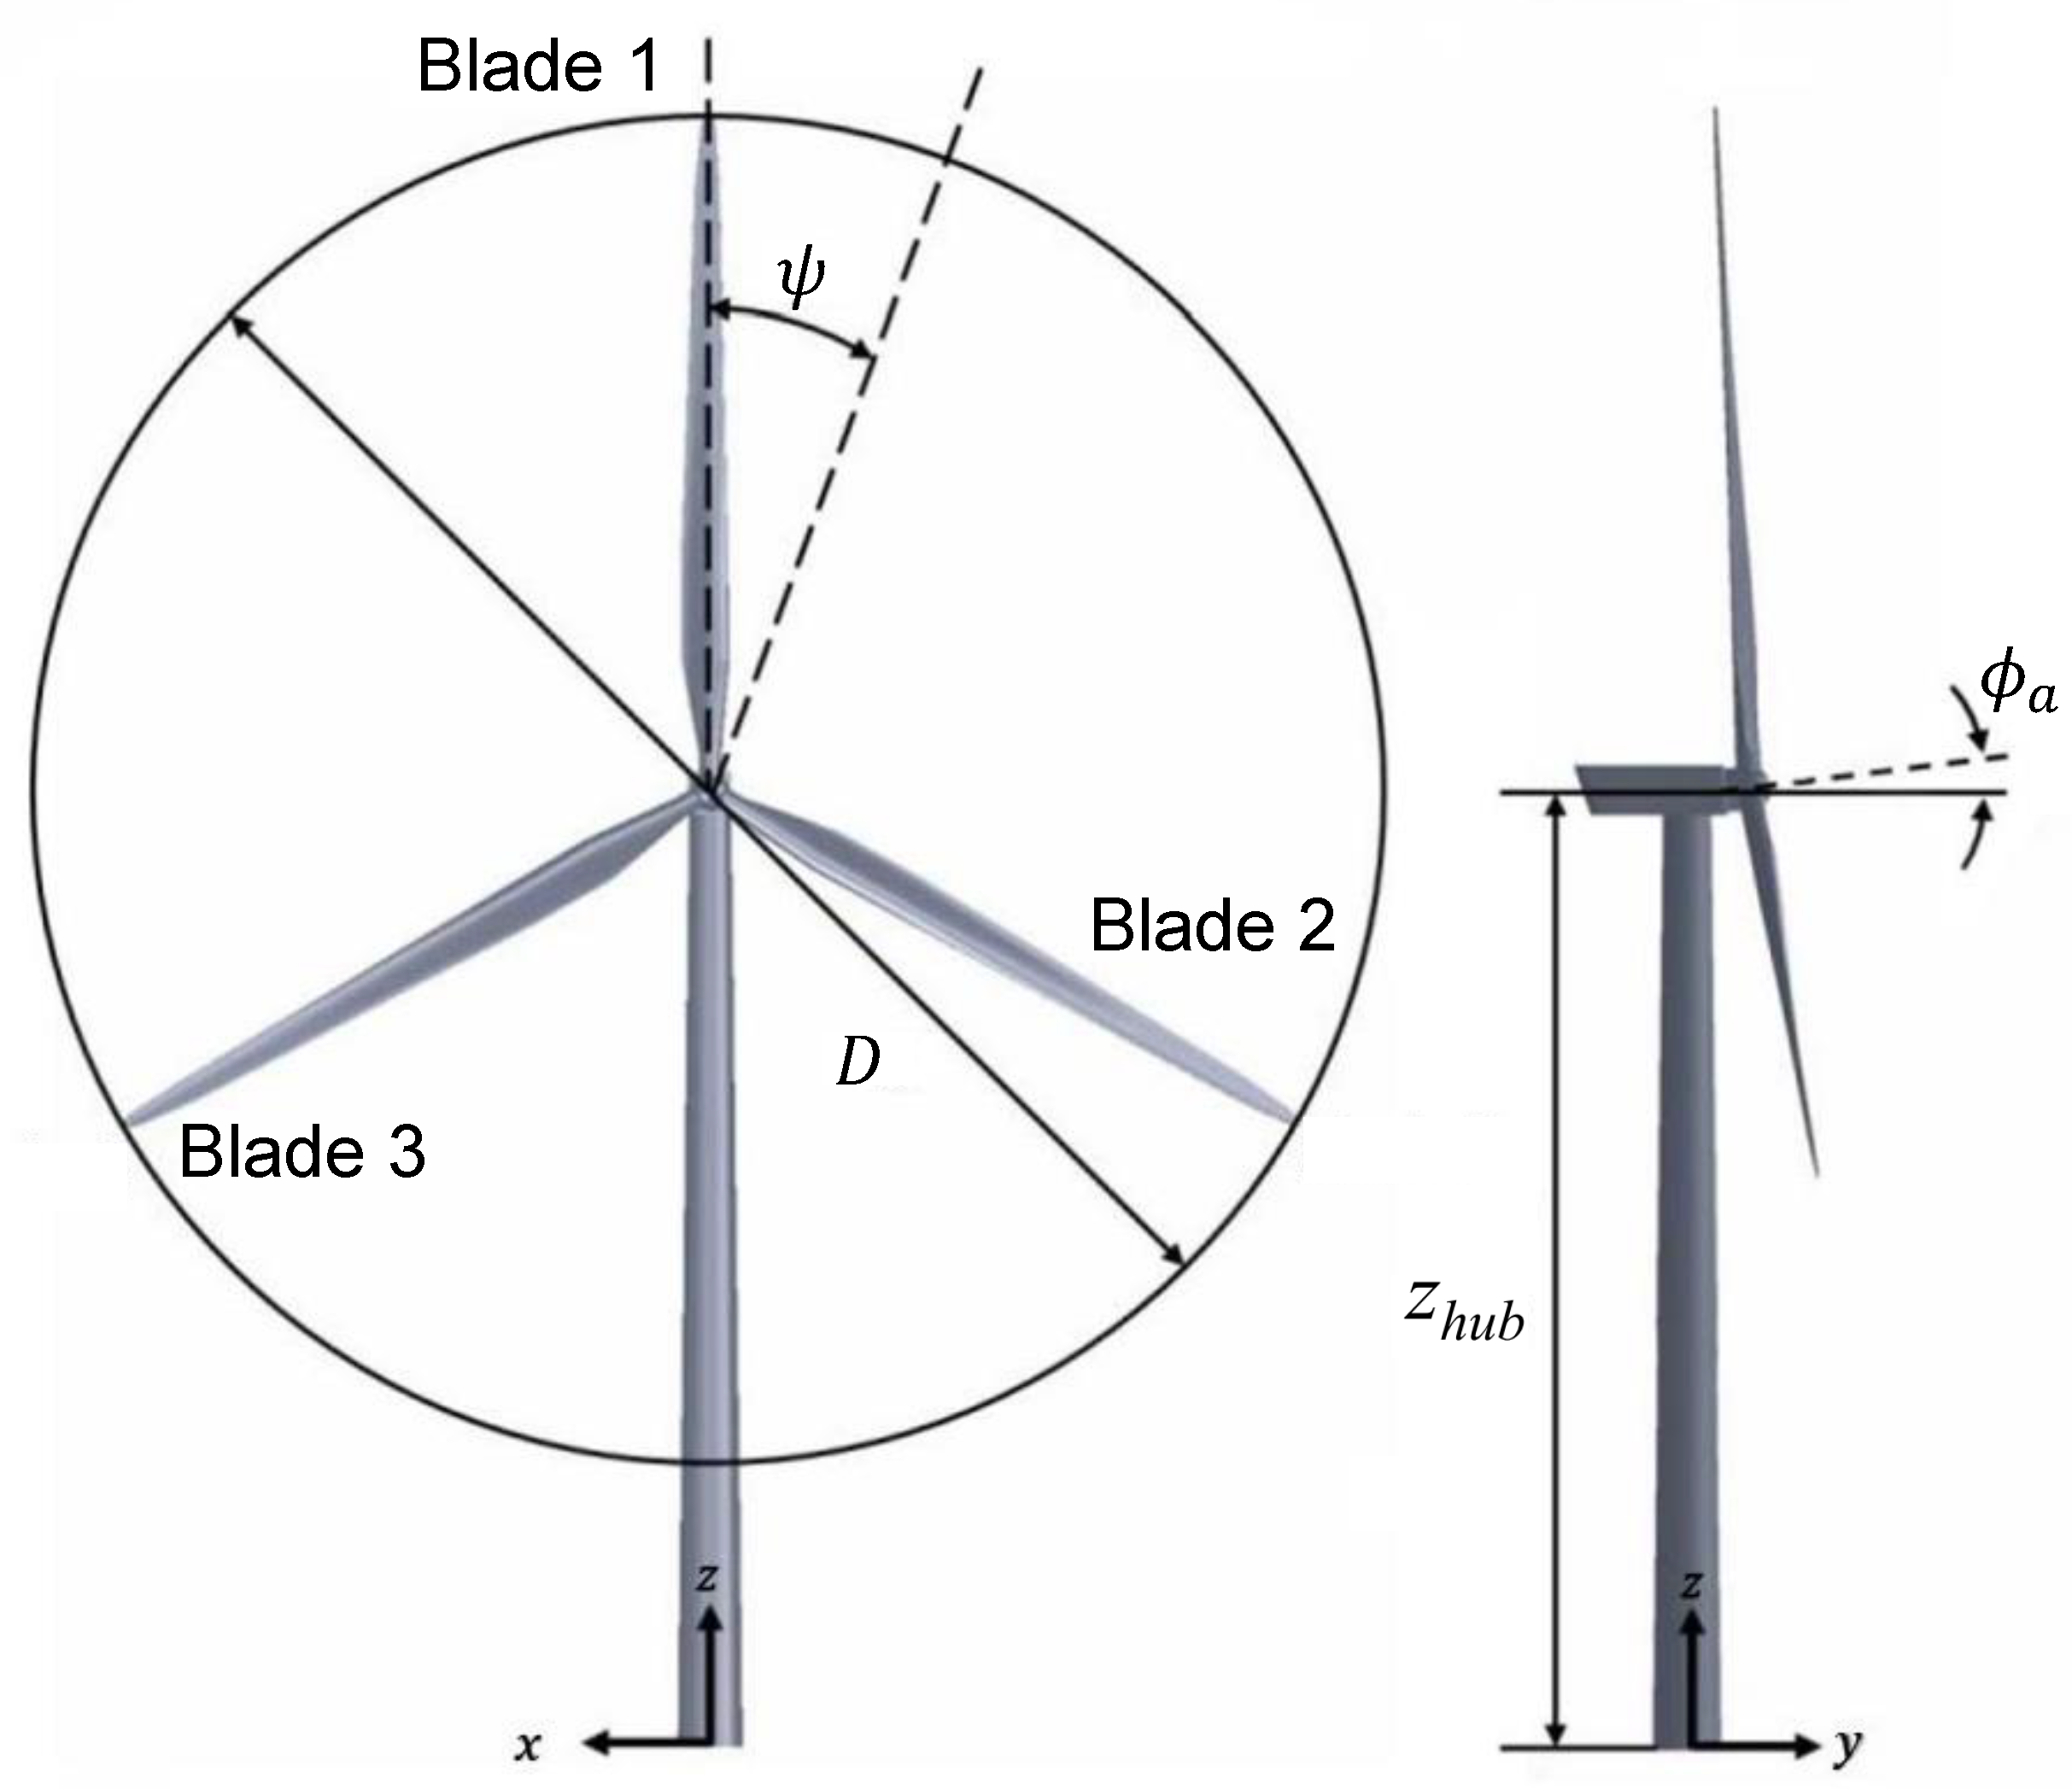
The 5 MW baseline wind turbine model developed by NREL [36] was used in this study. Figure 3 schematically illustrates this three-bladed horizontal-axis wind turbine model. The rotor diameter D, hub height z h u b , and rotor tilt angle ϕ a were 126 m, 90 m, and 5 ° , respectively. The azimuthal angle, ψ , is defined by the swept angle of blade 1 (the top blade) spanned clockwise from the top azimuth of the rotor. A Cartesian coordinate system was set to align the front of the rotor plane with the y-axis, with the origin at the tower base. This same coordinate system was also used in the CFD simulation domain, which corresponds to the spatial coordinates used in Section 2.1. Detailed information about the model is open-sourced and can be found in Jonkman et al. [36] and the NWTC (National Wind Technology Center) subroutine library [43] supported by NREL. The main properties of the model are listed in Table 1. We based our FSI simulations on the given geometric data to establish the full-machine wind turbine model. In our simulations, the wind turbine operated at a constant rotational speed of 12.1 rpm, which was the designed rated rotor speed.

2.4.2. CFD Modeling

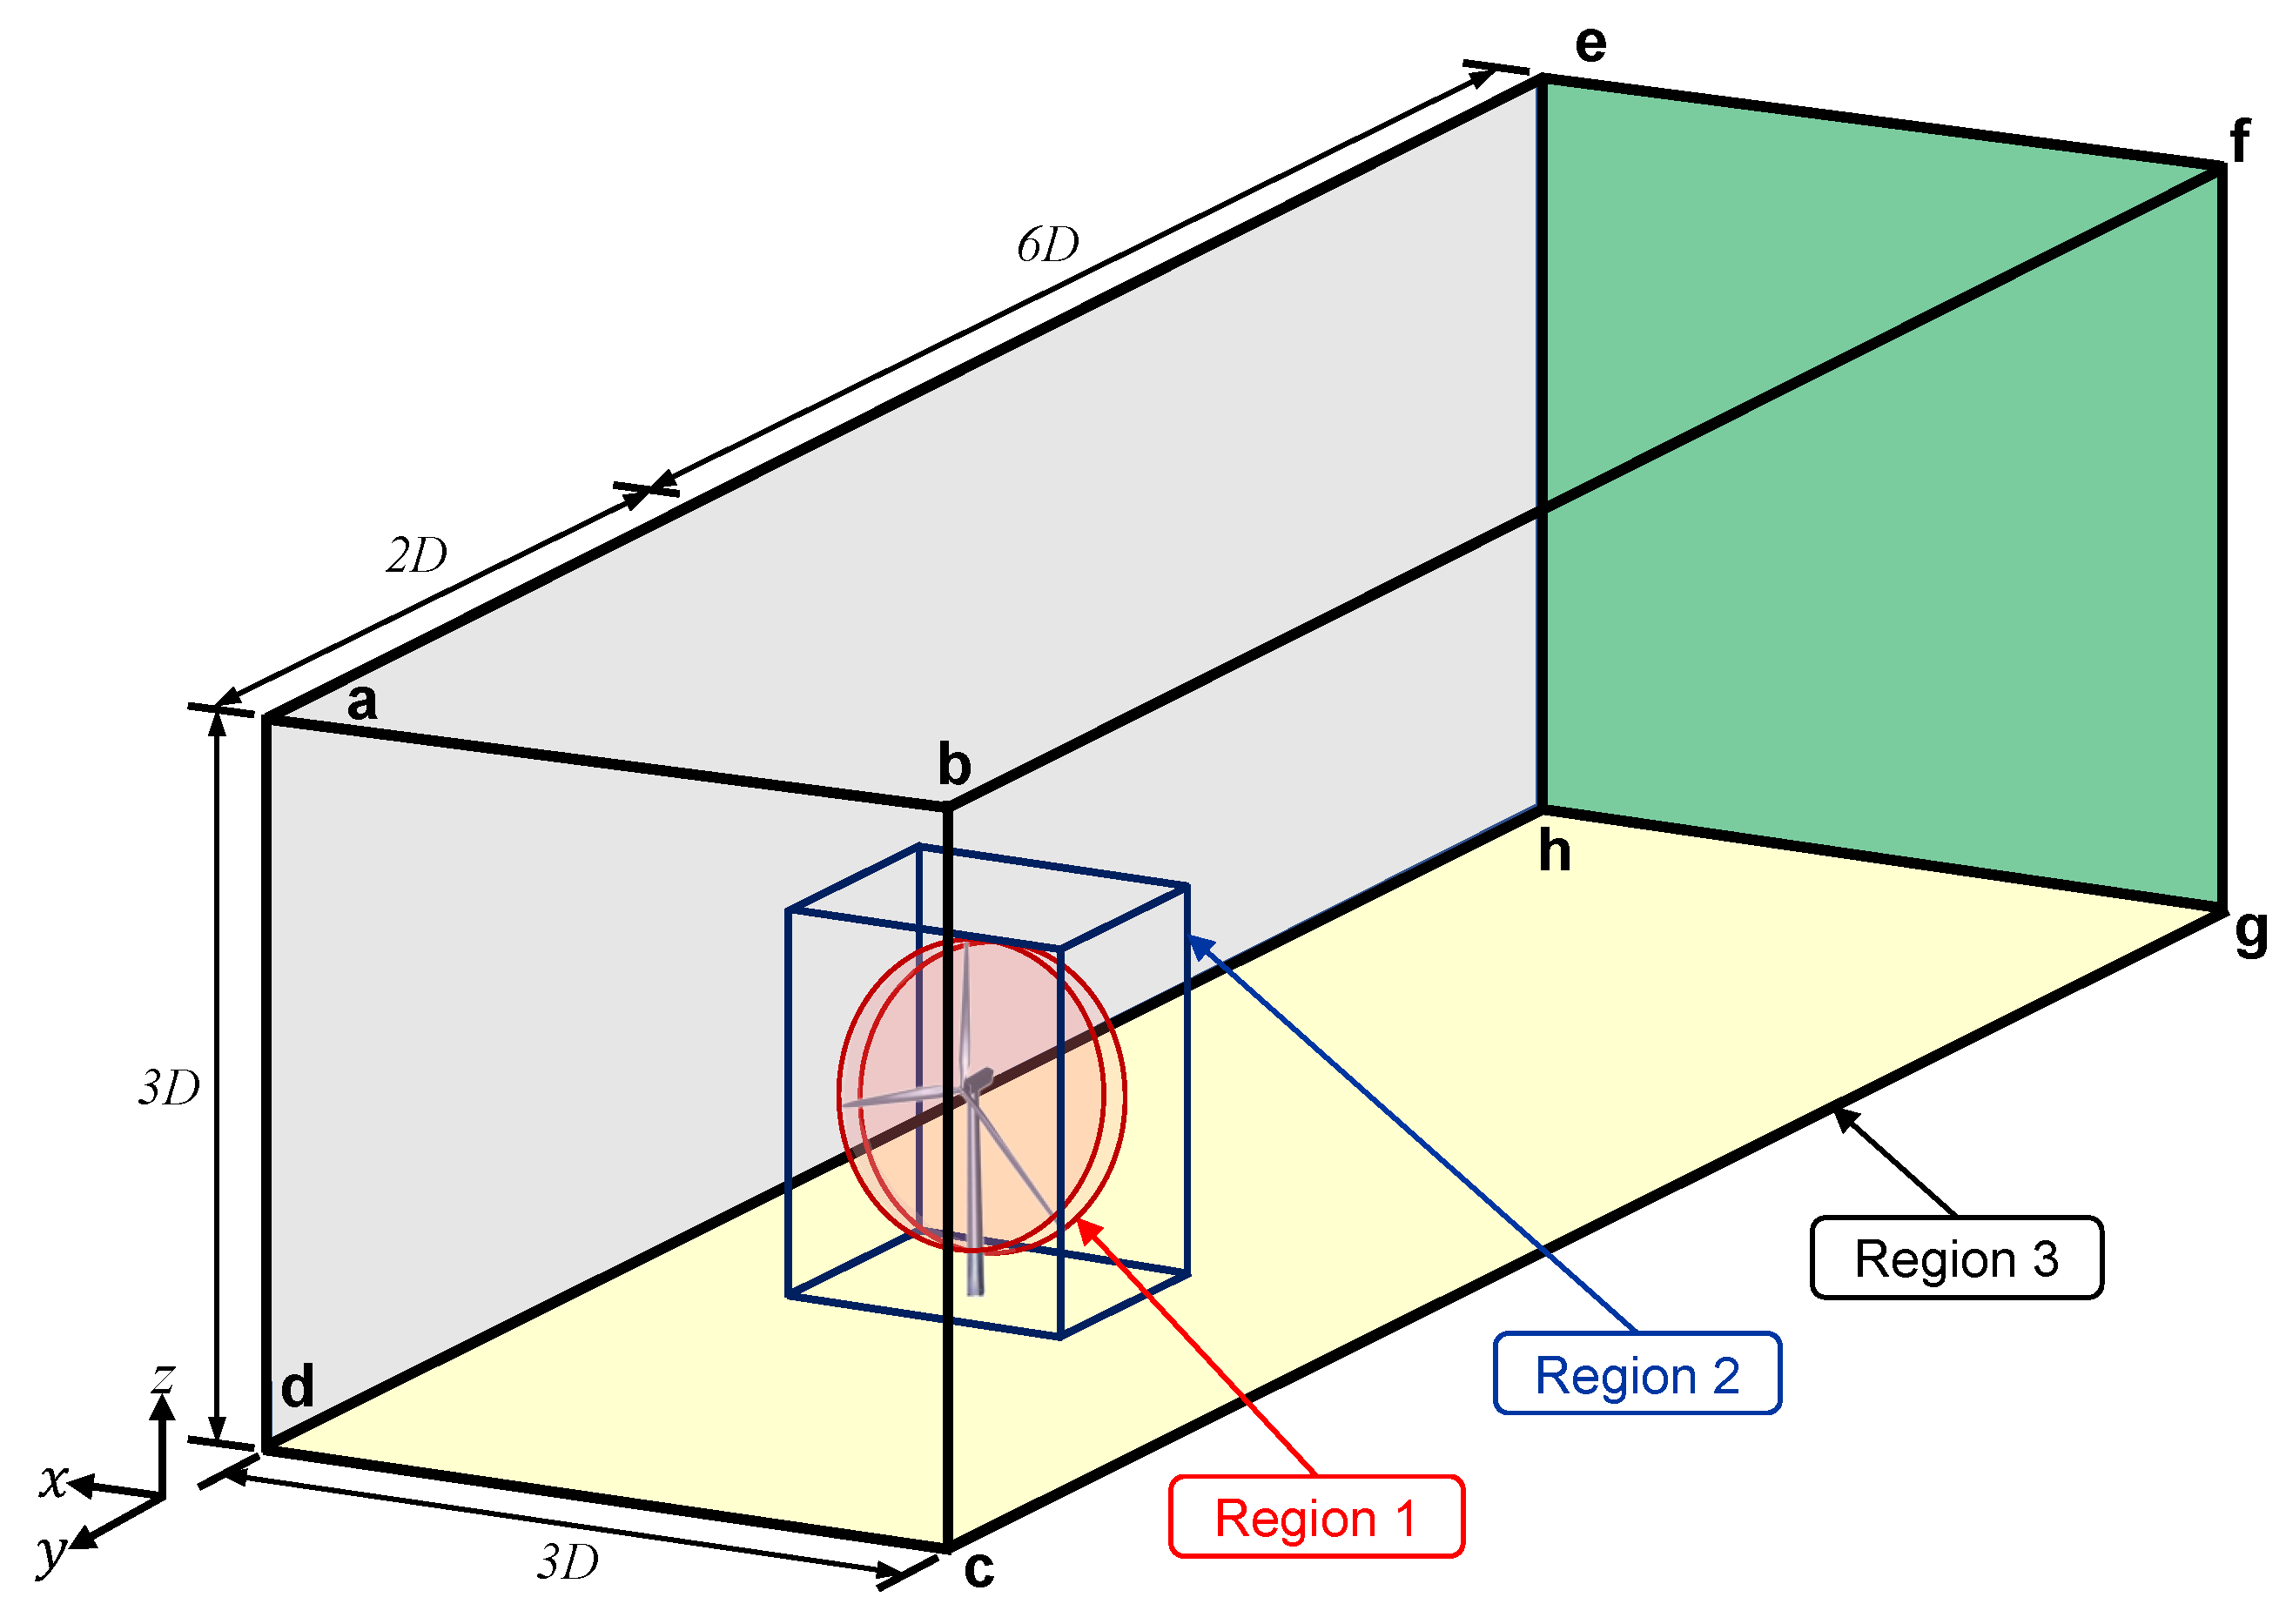
Figure 4 shows the simulation domain of the wind field that served as inflow for the target wind turbine, while Table 2 lists the boundary conditions assigned to all faces of the domain. The rotor diameter D was used as a metric scale. The upstream face abcd had an area of 3 D × 3 D and was positioned 2 D upstream of the wind turbine, while the downstream face efgh, defined as the outlet, was located 6 D downwind. The upstream, top and side faces were all set as inlets. A gradient-free velocity boundary condition was employed at the outlet, while the bottom face and the surfaces of all parts of the wind turbine were set to no-slip wall conditions. Therefore, the turbine blades were regarded as time-varying boundaries in the CFD model and needed to be updated at each time step (i.e., Δ t b and Δ t r ) during the FSI simulation process. To reduce the computational costs, three regions with different grid refinements were defined in the simulation domain, with the grid distributions shown in Figure 5. The finest mesh was set in region 1 around the turbine rotor, with a minimum grid size of 0.02 m. The cell numbers in the regions 1, 2, and 3 were about 1.88 ×   10 6 , 2.50   ×   10 5 , and 1.70   ×   10 5 , respectively. These numbers were determined based on a grid dependence test, which will be presented in Section 2.5. Several prismatic layers were fitted around the tower, nacelle, and blade surfaces, with the thickness of the first layer adjusted to ensure a y + value below 10, meeting the wall treatment requirements of the selected SST k ω turbulence model. The grid quality metrics of the CFD model are provided in Table 3. These parameters were controlled to meet the recommended levels specified in the STAR-CCM+ user manual.
The inflow conditions were specified based on the vertical mean wind profile, which follows the power law distribution defined in the IEC (International Electrotechnical Commission) design guideline [44]. This is expressed as
u i n = u h u b z z h u b α ,
where u i n and u h u b denote the mean wind speed at the inlet and turbine hub height z h u b , respectively. Equation (7) shows that the inflow mean wind speeds vary with height z via a power function with exponent α . The inflow turbulence is also specified through the inlet turbulent kinetic energy k i n and the specific dissipation rate ω i n , which are given by
k i n = 3 2 u i n I T 2 ,
ω i n = k i n 3 2 L c ,
where I T and L c represent the turbulence intensity and the turbulence characteristic length scale, respectively. All simulations were performed with turbulent inflows at the rated wind speed at hub height ( u h u b = 11.4 m/s). The power law exponent α was set to 0.1 with the consideration of flat terrain. The inflow fields were assumed to be stationary and horizontally homogeneous, with the coefficients I T = 1 % and L c = 0.1 m.

2.4.3. Finite Element Model

To streamline the FSI simulation of a full-scale wind turbine, we simplified the model by considering only the turbine blades as deformable structures. Other structural components, such as the rotor-nacelle assembly (RNA) and the tower, were treated as rigid bodies. Specifically, the three blades were modeled as elastic cantilever beams fixed to the rotatable hub, while the entire tower was assumed to be rigid and fixed. This simplification was justified by the fact that tower deflections are relatively minor compared with blade deflections and should not significantly affect the simulated loads. The tower, however, was included in the wind field calculations to account for fixed wall conditions, influencing the wind loads exerted on the blade surfaces as they passed in front of the tower. Throughout the simulations, the pitch angle of the blades remained constant at 0 ° , ensuring maximal blade surface exposure to the incoming inflow.
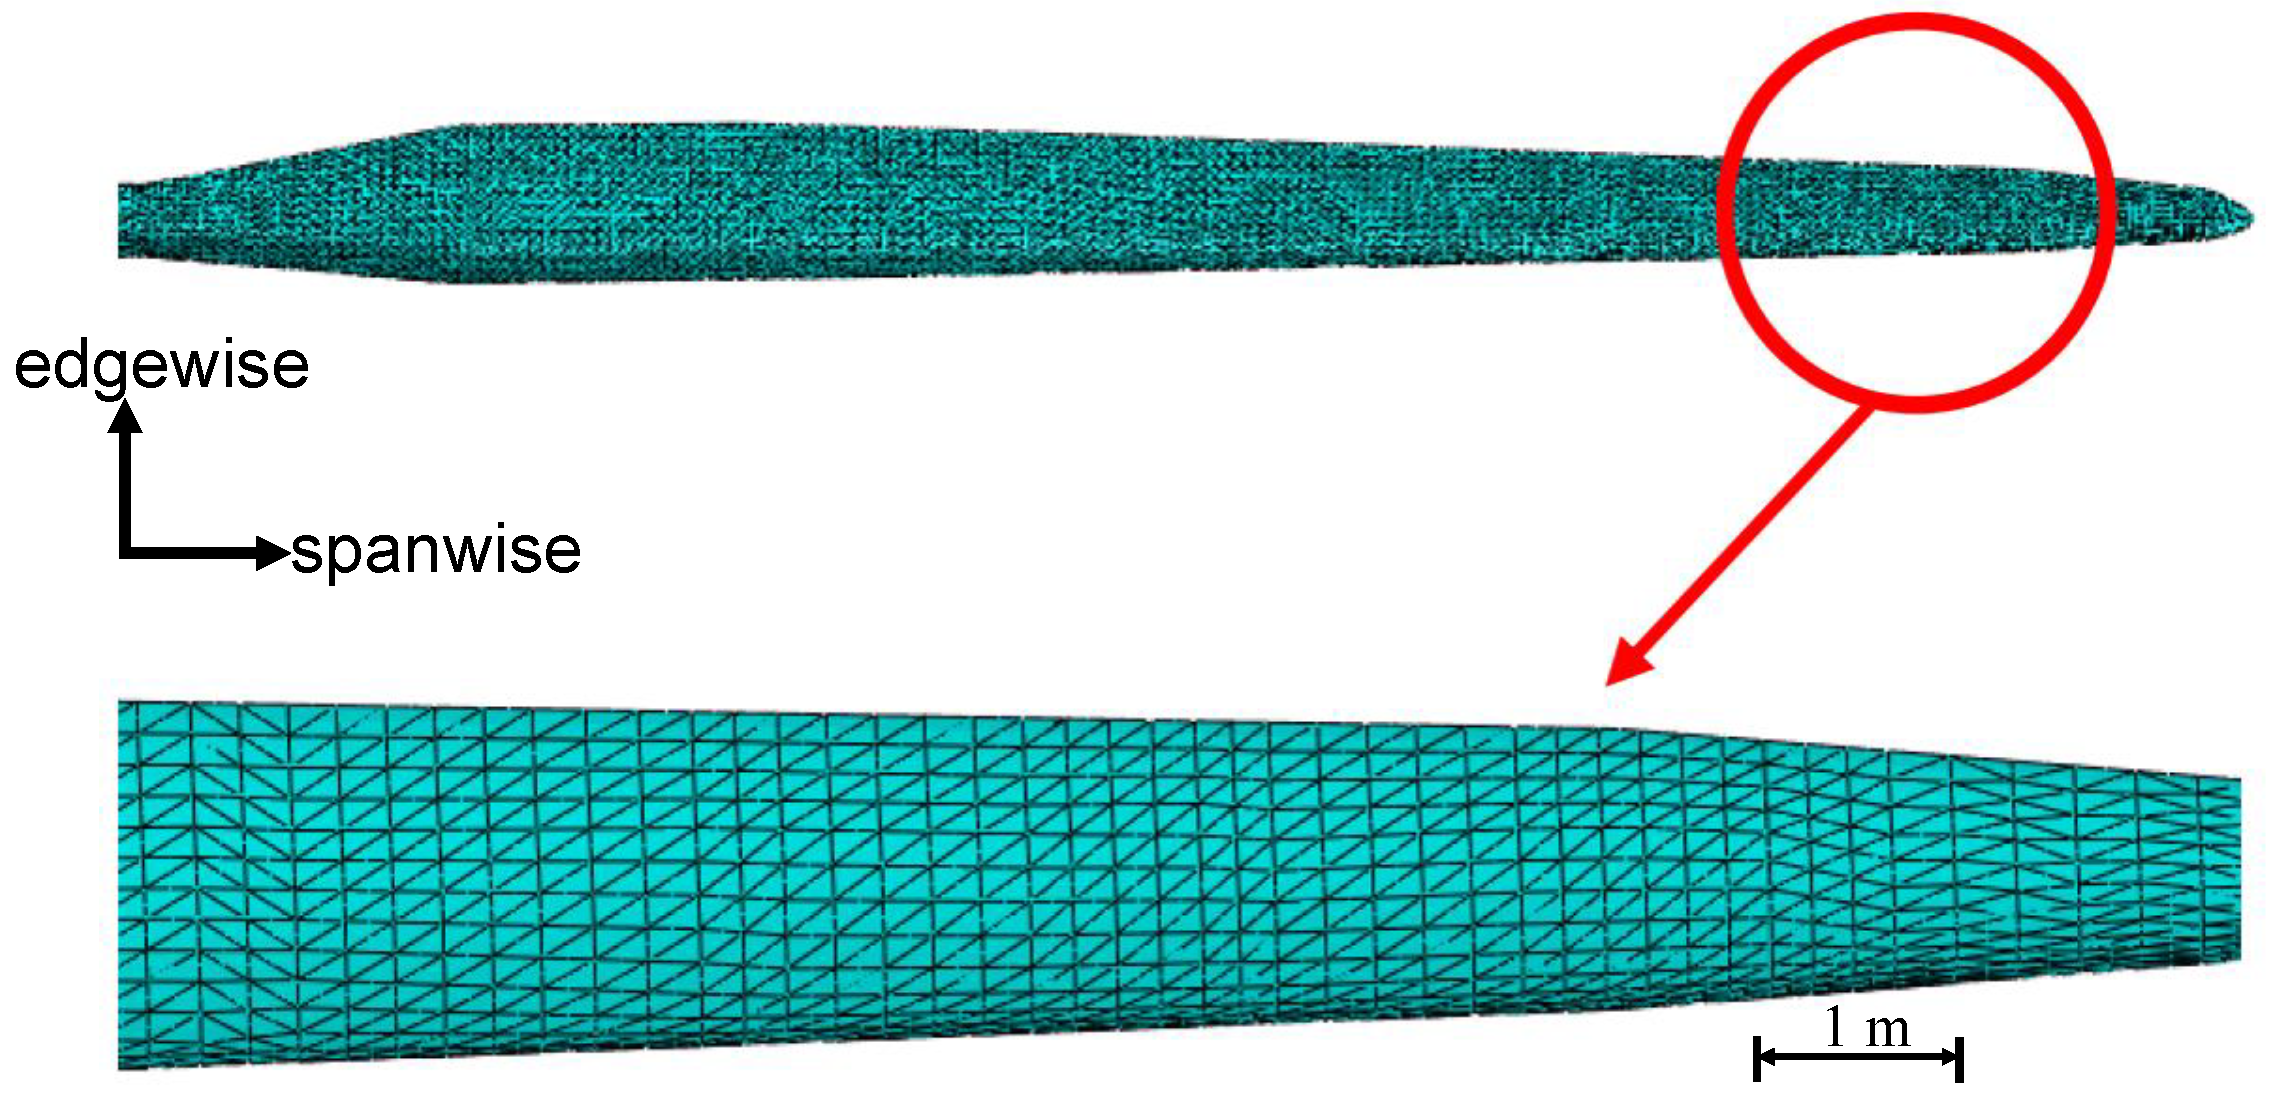
The finite element model of the blade built in Abaqus is depicted in Figure 6. Tet (tetrahedral) elements were used throughout the entire blade with a total number of ~ 80 , 000 . The element size was maintained at approximately 0.2 m, which was determined to be suitable for capturing the blade deformation characteristics. This mesh resolution was further verified through the numerical studies presented later in Section 2.5. The blade was modeled as a solid body, unlike its original design of multiple-cell structure, which was composed of thin-walled shells and shear webs. The equivalent material properties were required to be assigned to the elements; therefore, the modeled blade could obtain the same stiffness and mechanical property as the 5 MW turbine blade defined in the NREL documentation [36]. The structural properties varying along the spanwise axis were based on the 62.6 m long LM Glasfiber blade used in the DOWEC study [45,46]. Due to the anisotropic nature of the material, it was necessary to define the Young’s modulus, shear modulus, and Poisson’s ratio corresponding to the flapwise, edgewise, and spanwise directions. The blade was divided into several spanwise sections, and the equivalent moduli for each section were carefully calibrated. Table 4 lists the calibrated material properties distributed at selected spanwise locations along the blade. Here, it was noticed that the Young’s modulus in the spanwise direction ( E s p a n ) was relatively smaller than that in the flapwise ( E f l a p ) and edgewise ( E e d g e ) directions. The shear modulus G presented in Table 4 only accounted for the in-plane shear stress–strain relationship of each blade cross-section. The warping effect in bending was considered limited throughout the blade (i.e., the cross-sections approximately remained planar), so the shear moduli in the other two directions were accordingly set to 100 times G to limit out-of-plane deformation. The Poisson’s ratios were assumed constant and set to 0.32, 0.32, and 0.43, respectively, in the flapwise, edgewise, and spanwise directions.

2.4.4. Coupling Settings

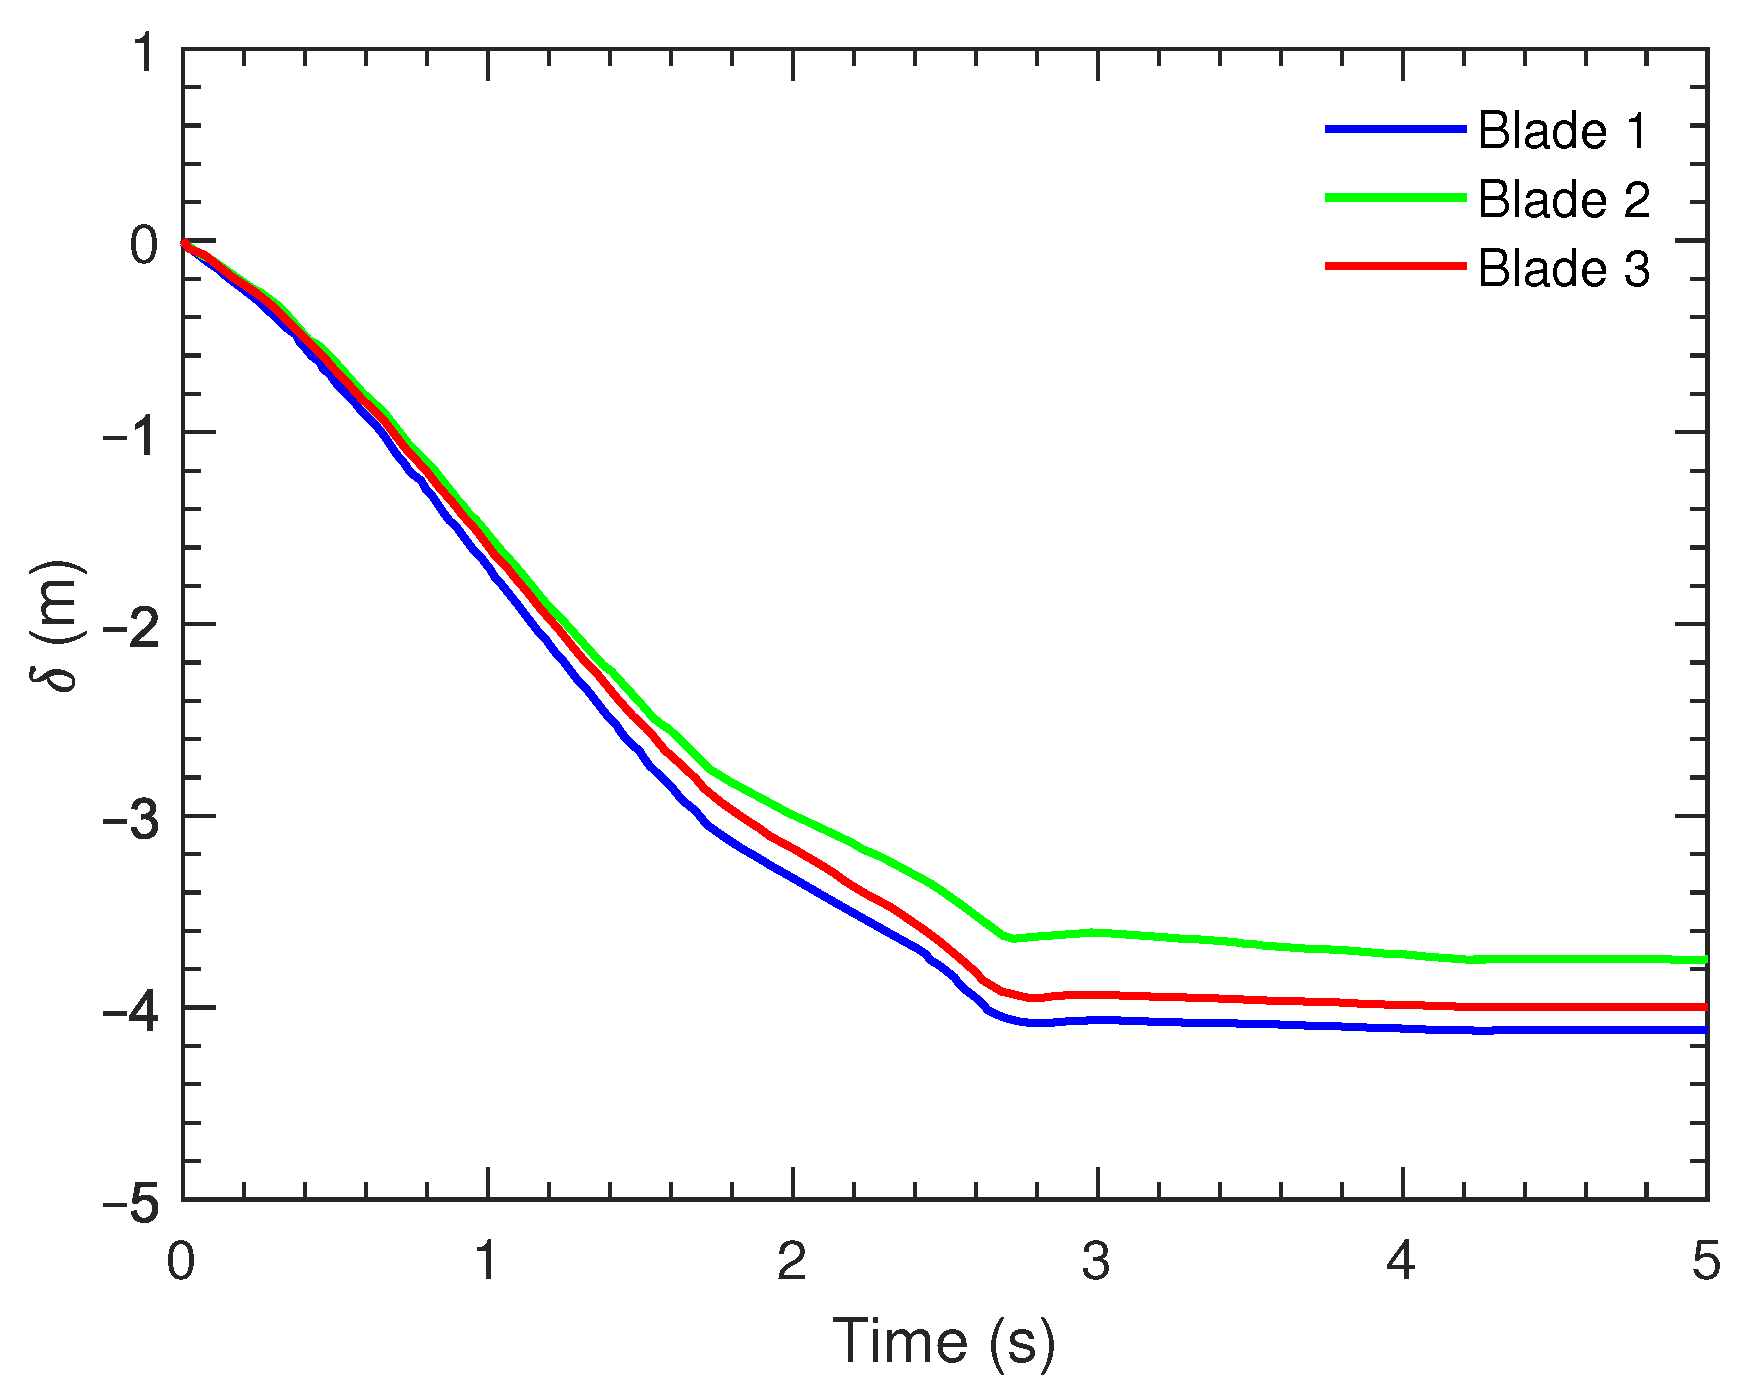
Following the FSI coupling procedure as introduced in Section 2.3, we set the time step Δ t b = 0.05 s in the weak coupling process for calculating the blade deformation. The calculation continued until the blade deformation was presumed to have converged to a steady state. The time step Δ t b was chosen after testing a range of values from 0.01 s to 0.1 s, where Δ t b = 0.05 s was found to provide a good balance between computational efficiency and accuracy while avoiding poor CFD mesh quality caused by excessive grid morphing. Figure 7 shows an example of the convergence check by monitoring the variation of the blade tip displacement, δ . In this case, the reference tip points located at 59.9 m from the center of the rotor hub on the three blades were tracked during the calculation. Each displacement, starting from zero, increased with time until ∼2.8 s. Then, all three displacements reached a maximum of about 4.1 m and remained roughly constant after 3.0 s. To confirm convergence, we implemented a criterion whereby the variation in δ remained within 0.1% of the peak value over the last 10 time steps. This criterion ensured that the deformation had stabilized, verifying a convergent state. The three displacements converged to different ultimate magnitudes because the blades were located at different azimuths and experienced varying wind conditions.
After the deformation computations, the blade was forced to rotate clockwise by 4 ° in azimuth with this deformed shape. This means that the time step for rotation, Δ t r , introduced in Section 2.3, was about 0.0551 s, based on the rotor speed 12.1 rpm. The rotation increment of 4 ° was determined by testing values from 1 ° to 10 ° , where 4 ° was found to provide sufficient accuracy and computational efficiency while maintaining good CFD mesh quality during data exchange. These 4 ° increment locations were referred to as the interaction points in the FSI simulation, as shown in Figure 8, allowing the fluid and structure models to exchange data more frequently at these points.
The simulation of a full rotor cycle was achieved by repeating the incremental procedure until a 360 ° azimuthal sweep was completed. During the weak coupling process, the moving mesh around the deformed blade was morphed at each time step. When the rotor moved to the next interaction point, the surrounding blade mesh was also morphed to adapt to the updated boundaries. The time steps, Δ t b and Δ t r , needed to be small enough to ensure a satisfactory grid quality after morphing. However, the remeshing process actually led to degraded mesh quality as it progressed through more interaction points, particularly at the blade tip, where extremely small geometric features were present. To avoid this issue, we grouped five interaction points in a set, and the FSI simulation was run for one set at a time. After completing one simulation run, a new run was initiated at the 20 ° azimuth, where the first set of simulations finished. By using this method, 18 simulation runs were completed sequentially, and the results were combined to represent a full rotor cycle. The connection between two consecutive sets was feasible since the blade deformations at each initial and terminal azimuth of the sets were already confirmed to be convergent and could be matched appropriately.

2.5. Numerical Verification

In this section, a grid dependence test is conducted to verify the proposed FSI simulation model, aiming to mitigate modeling errors within acceptable tolerance. The inflow conditions used are the same as those mentioned in the previous section for a constantly operated wind turbine at the rated rotor speed. While the finite element mesh as introduced in Section 2.4.3 remains unchanged, five levels of systematic CFD grid refinement, with the total grid number ranging from 4.40 × 10 5 to 4.37 × 10 6 , are included to ensure that the numerical solution of the simulated turbine power P is well converged. Figure 9 shows the discretization error of the power, E P , estimated by Richardson’s extrapolation [47] when compared to a method with second-order accuracy. The error is seen to increase as the dimensionless grid size, d x , grows (i.e., the total grid number decreases). The results indicate that the discretization error can be reduced to about 0.6% when a model with a grid number of 2.30 × 10 6 is employed. Table 5 lists the total grid numbers and the simulated powers of the five grid refinements. We selected the case with a relative error of only 0.2% compared with the finest grid case. This mesh configuration was chosen for subsequent simulations due to its satisfactory convergence behavior and an acceptable balance between accuracy and computational cost.

2.6. OpenFAST Simulation

OpenFAST [1,48], developed by NREL, is a well-known and open-source program for aeroelastic simulation of wind turbines. The NREL 5 MW baseline wind turbine model can also be applied in the simulator, and its associated results have been validated in various research projects [36]. Users can conveniently set up wind turbine simulations under self-defined conditions and assess the associated turbine loads. Unlike high computational cost models (e.g., finite element models), OpenFAST simplifies the entire wind turbine to 1D structures with discretized nodes. The aerodynamic loads distributed to these nodes are evaluated by a dynamic BEMT (Blade Element Momentum Theory) model in the AeroDyn module [49]. The nodal dynamics and load responses can be efficiently derived within a short computing time using a modal solution [48]. We carried out an OpenFAST simulation of the 5 MW NREL wind turbine under inflow conditions comparable to our FSI simulation. The specified wind inflow was generated by the stochastic full-field turbulence simulator, TurbSim [50], also developed by NREL, with its codes and output data compatible with OpenFAST. We generated a 10-min and 31 × 31 gridded wind field with a power-law mean wind profile based on a 11.4 m/s wind speed at hub height. The simulation time step was set as 0.05 s. A non-turbulent inflow was considered in order to make fair comparisons to the calculated loads induced by the Reynolds-averaged wind field of the FSI simulation. In the OpenFAST settings, to maintain a constant rotor speed of 12.1 rpm, the degree of freedom for the generator was deactivated. Other variables, such as the yaw angle, tower deflection, and blade pitch angle, were also fixed at zero to match the FSI simulation conditions. The tower influence, modeled based on an analytical potential-flow solution around the tower cylinder [49,51], was specifically activated and considered significant to the simulated aerodynamic loads.

3. Results and Discussions

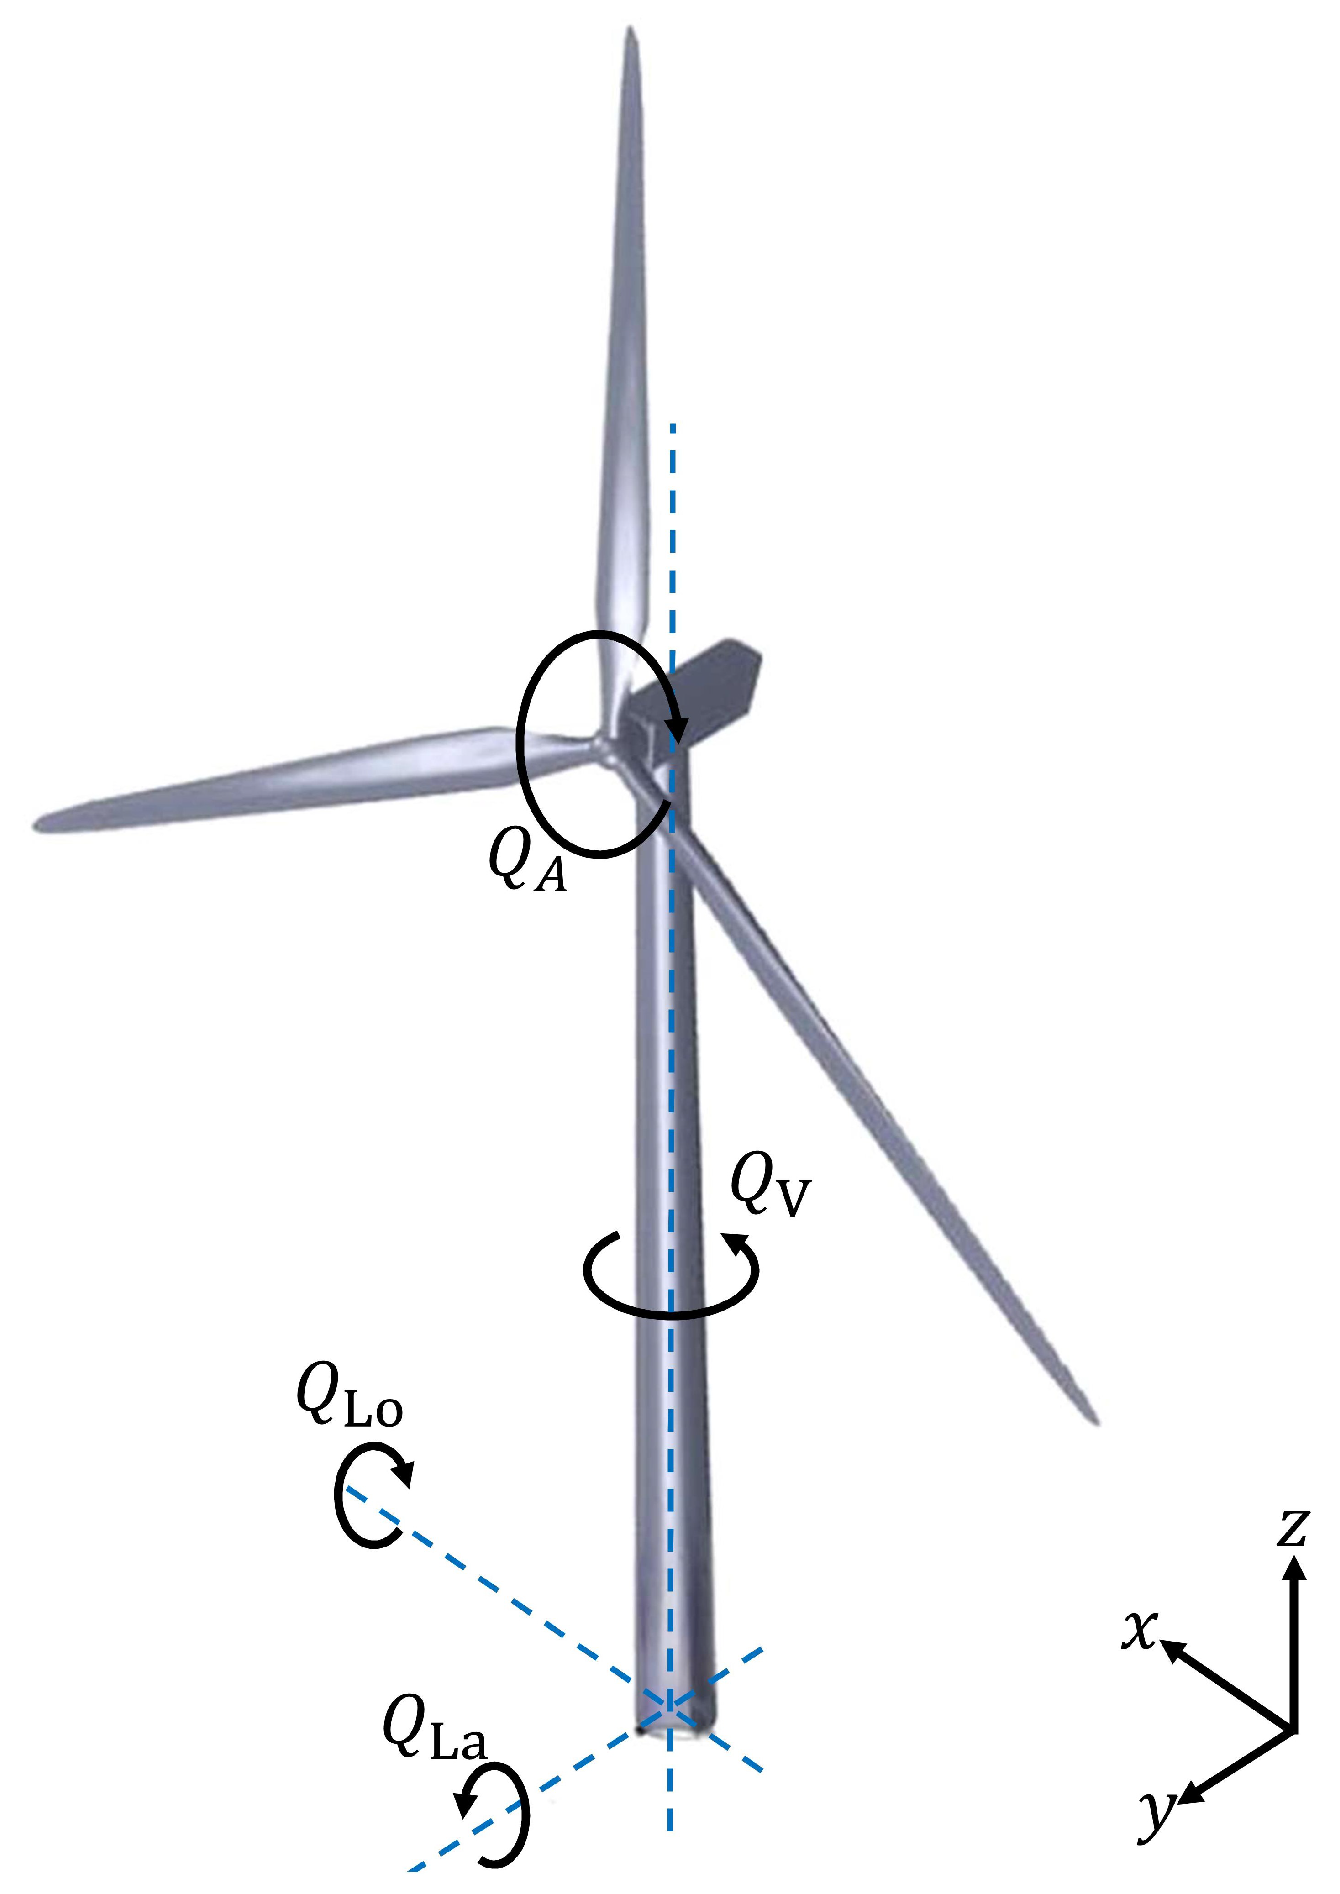
Based on the proposed FSI framework, we present the simulation results and compare them to the previous literature and the OpenFAST-simulated results in this section. We analyze the aerodynamic torques exerting on a single blade and the entire rotor, as well as the blade tip displacement, tower-base moments, and the power production. In addition, a case with rigid blades is presented as a reference to evaluate the effect of blade flexibility. Figure 10 shows the aerodynamic loads specified in the simulation results, where Q A represents the aerodynamic torque about the rotor axis; Q L a , Q L o and Q V denote the lateral, longitudinal and vertical moments about the tower base, respectively. The Q L a and Q L o also represent the fore-aft and side-to-side bending moment about the tower base, respectively. Only the contributions from the aerodynamic loads on the three blades are considered; loads induced by the generator are excluded.

3.1. Blade Load and Deformation

Figure 11 shows the variations in aerodynamic torque about the rotor axis applied to blade 1 over a rotor cycle. The duration of one rotor cycle is approximately 5 s, so we extracted a complete cycle from the stable stage of our simulation and redefined the time ticks from t = 0 to 5 s. At t = 2.5 s, blade 1 was positioned directly in front of the tower, corresponding to an azimuthal angle of 180 ° , as indicated on the top axis. The cases of rigid (red solid line) and flexible (blue solid line) blades are presented alongside the results from Hsu and Bazilevs [30] (green solid line), referred to as H2012 hereafter, and the OpenFAST simulation (black dashed line).
For our simulations, the aerodynamic torque decreases as blade 1 rotates from top to bottom, then increases as it returns to the top. This behavior is due to the mean wind profile, which results in higher inflow wind speeds at the top and lower speeds at the bottom, causing smaller blade loads when blade 1 passes the tower. This trend was absent in the load simulated by H2012, who used constant inflow wind speeds. However, their load curve exhibits a noticeable dip when blade 1 overlapped with the tower, indicating that the tower effect was well simulated. In our model, both the wind profile and tower effects were considered, resulting in rapid torque decreases around t = 2.5 s for both rigid and flexible blade cases as the blades entered the wind-affected region by the tower. The aerodynamic torque for the flexible blade was generally lower than that for the rigid blade due to the smaller swept area of the deformed blade.
Compared to the OpenFAST-simulated load, our results show similar time-varying trends, although OpenFAST calculated blade deformation using a simplified modal method. The tower effect in OpenFAST was also simplified by a potential-flow approach, which analytically modified wind velocities at blade nodes influenced by the tower. This caused the blade nodes to experience lower wind speeds in front of the tower and higher speeds on either side. Combined with the rotor’s rotating speeds and the BEMT-evaluated blade load, the aerodynamic torque simulated by OpenFAST reached the minimum value of about 1 MN-m at t = 2.5 s, similar to that simulated by our FSI model. However, the torque fluctuated after the blade passed in front of the tower, with this phenomenon displaying a different pattern in the FSI simulation results. Based on the above comparisons, we conclude that our model can evaluate the aerodynamic load of a blade with comparable accuracy to other FSI or aeroelastic models.
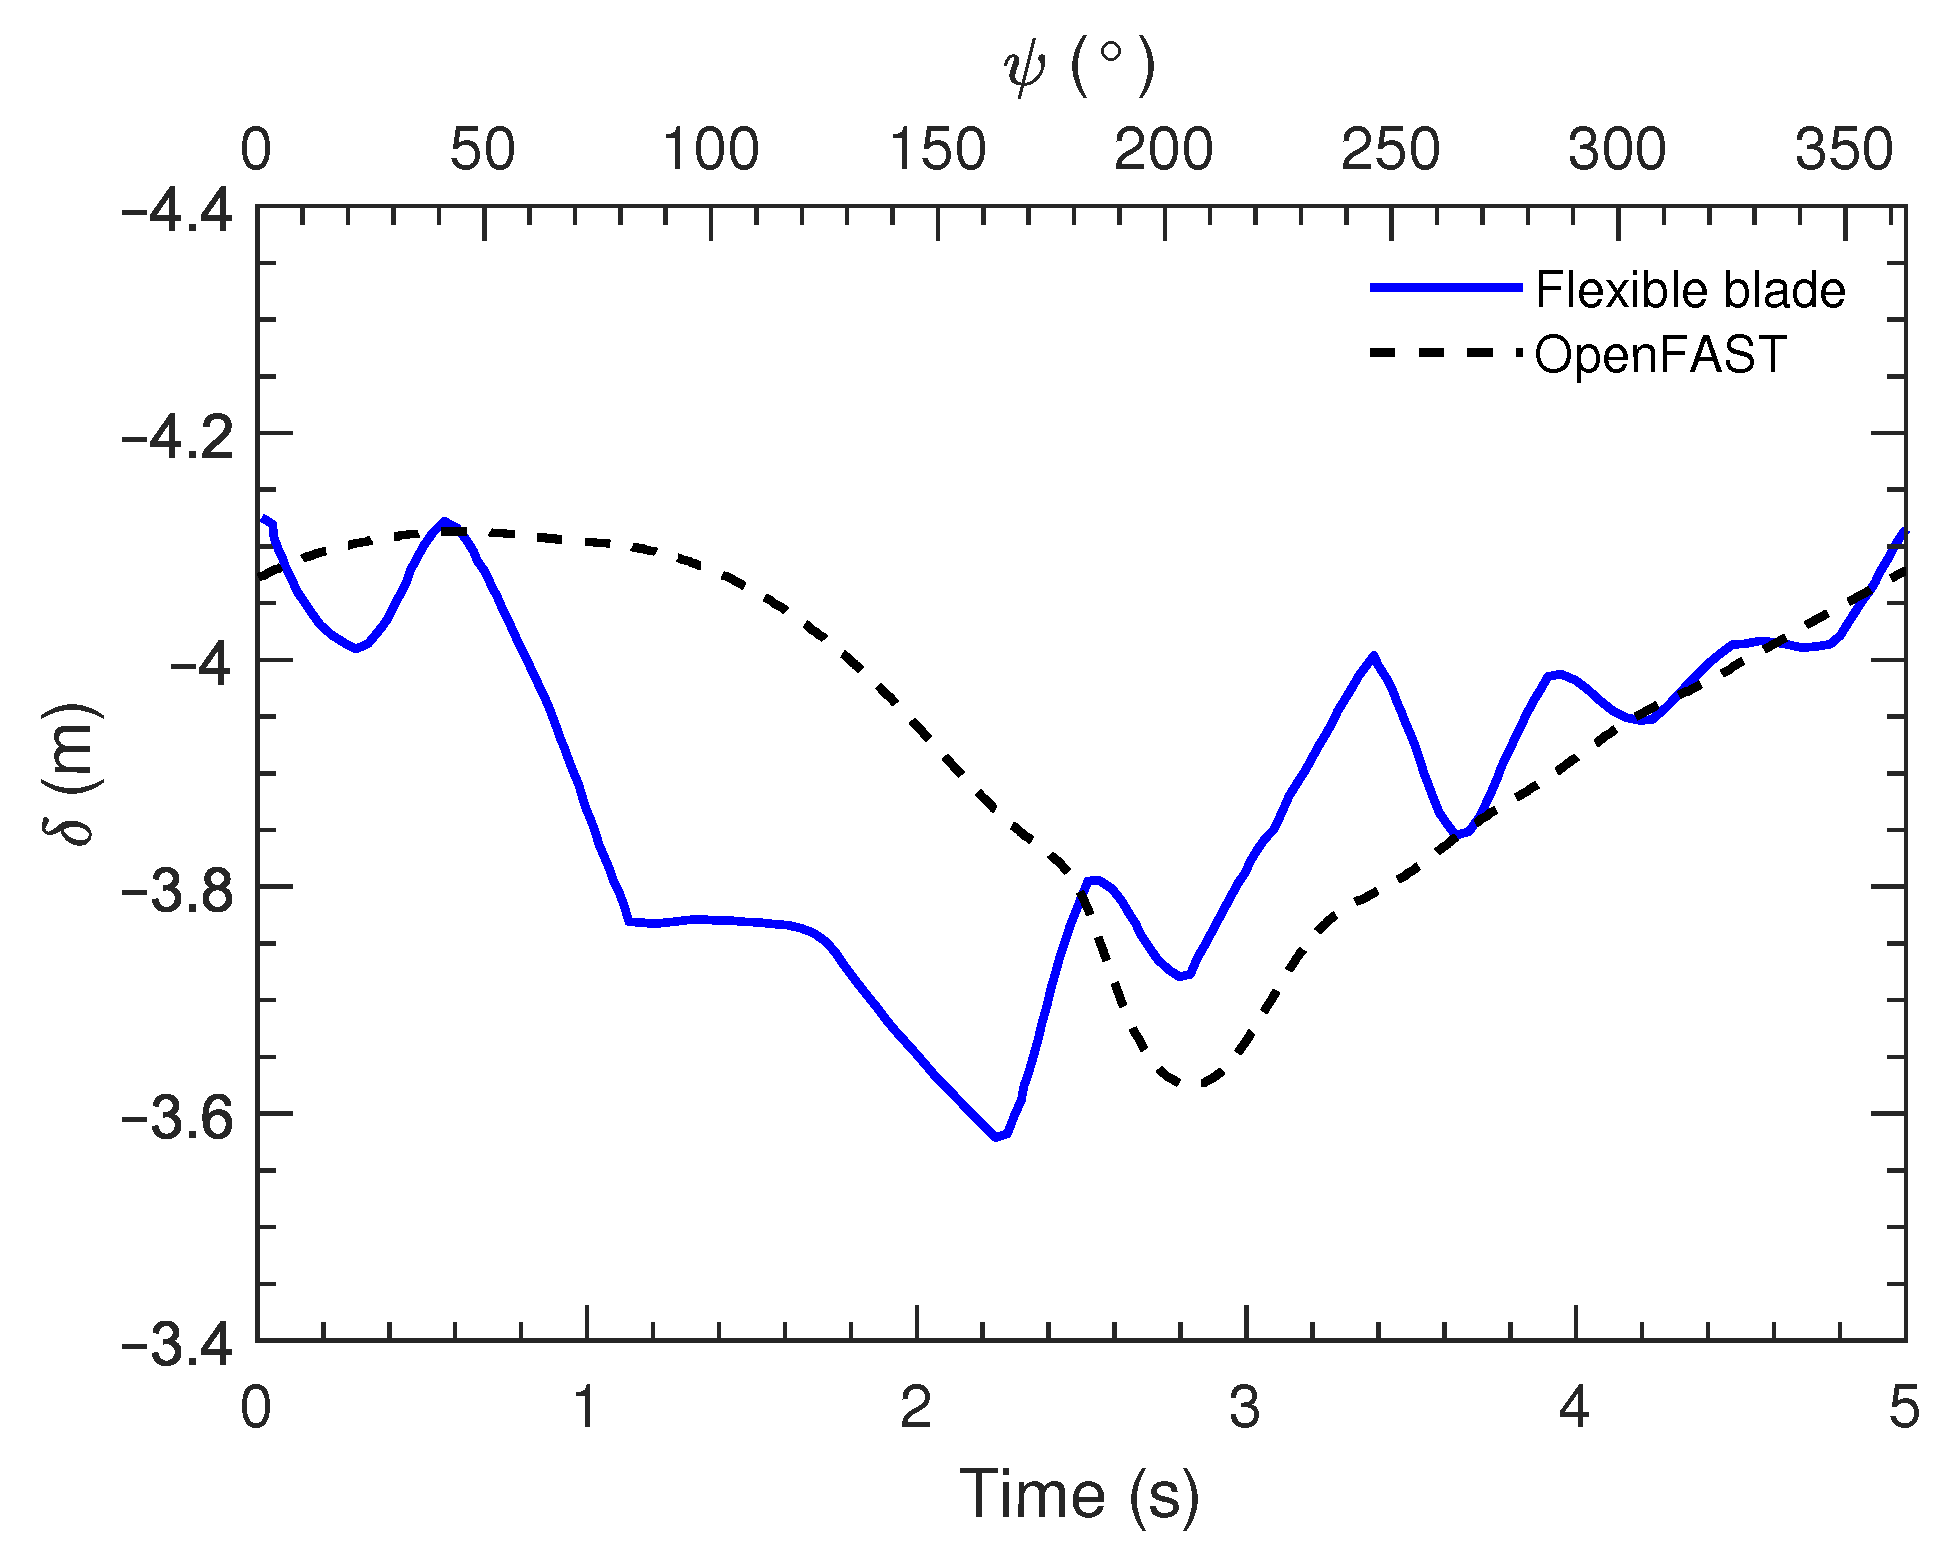
Figure 12 presents the time series of tip displacement ( δ ) for the flexible blade over a rotor cycle. The results calculated by the present FSI model (blue solid line) are compared to those from the OpenFAST simulation (black dashed line). The reference tip point on the blade is, again, set at a location 59.9 m from the center of the rotor hub. Both models exhibited similar trends in displacement variation over time, with the minimum blade tip displacement being quite close, each showing a magnitude of approximately 3.6 m. The FSI model showed greater variability in deformation, which was a trend also observed in the results from H2012.
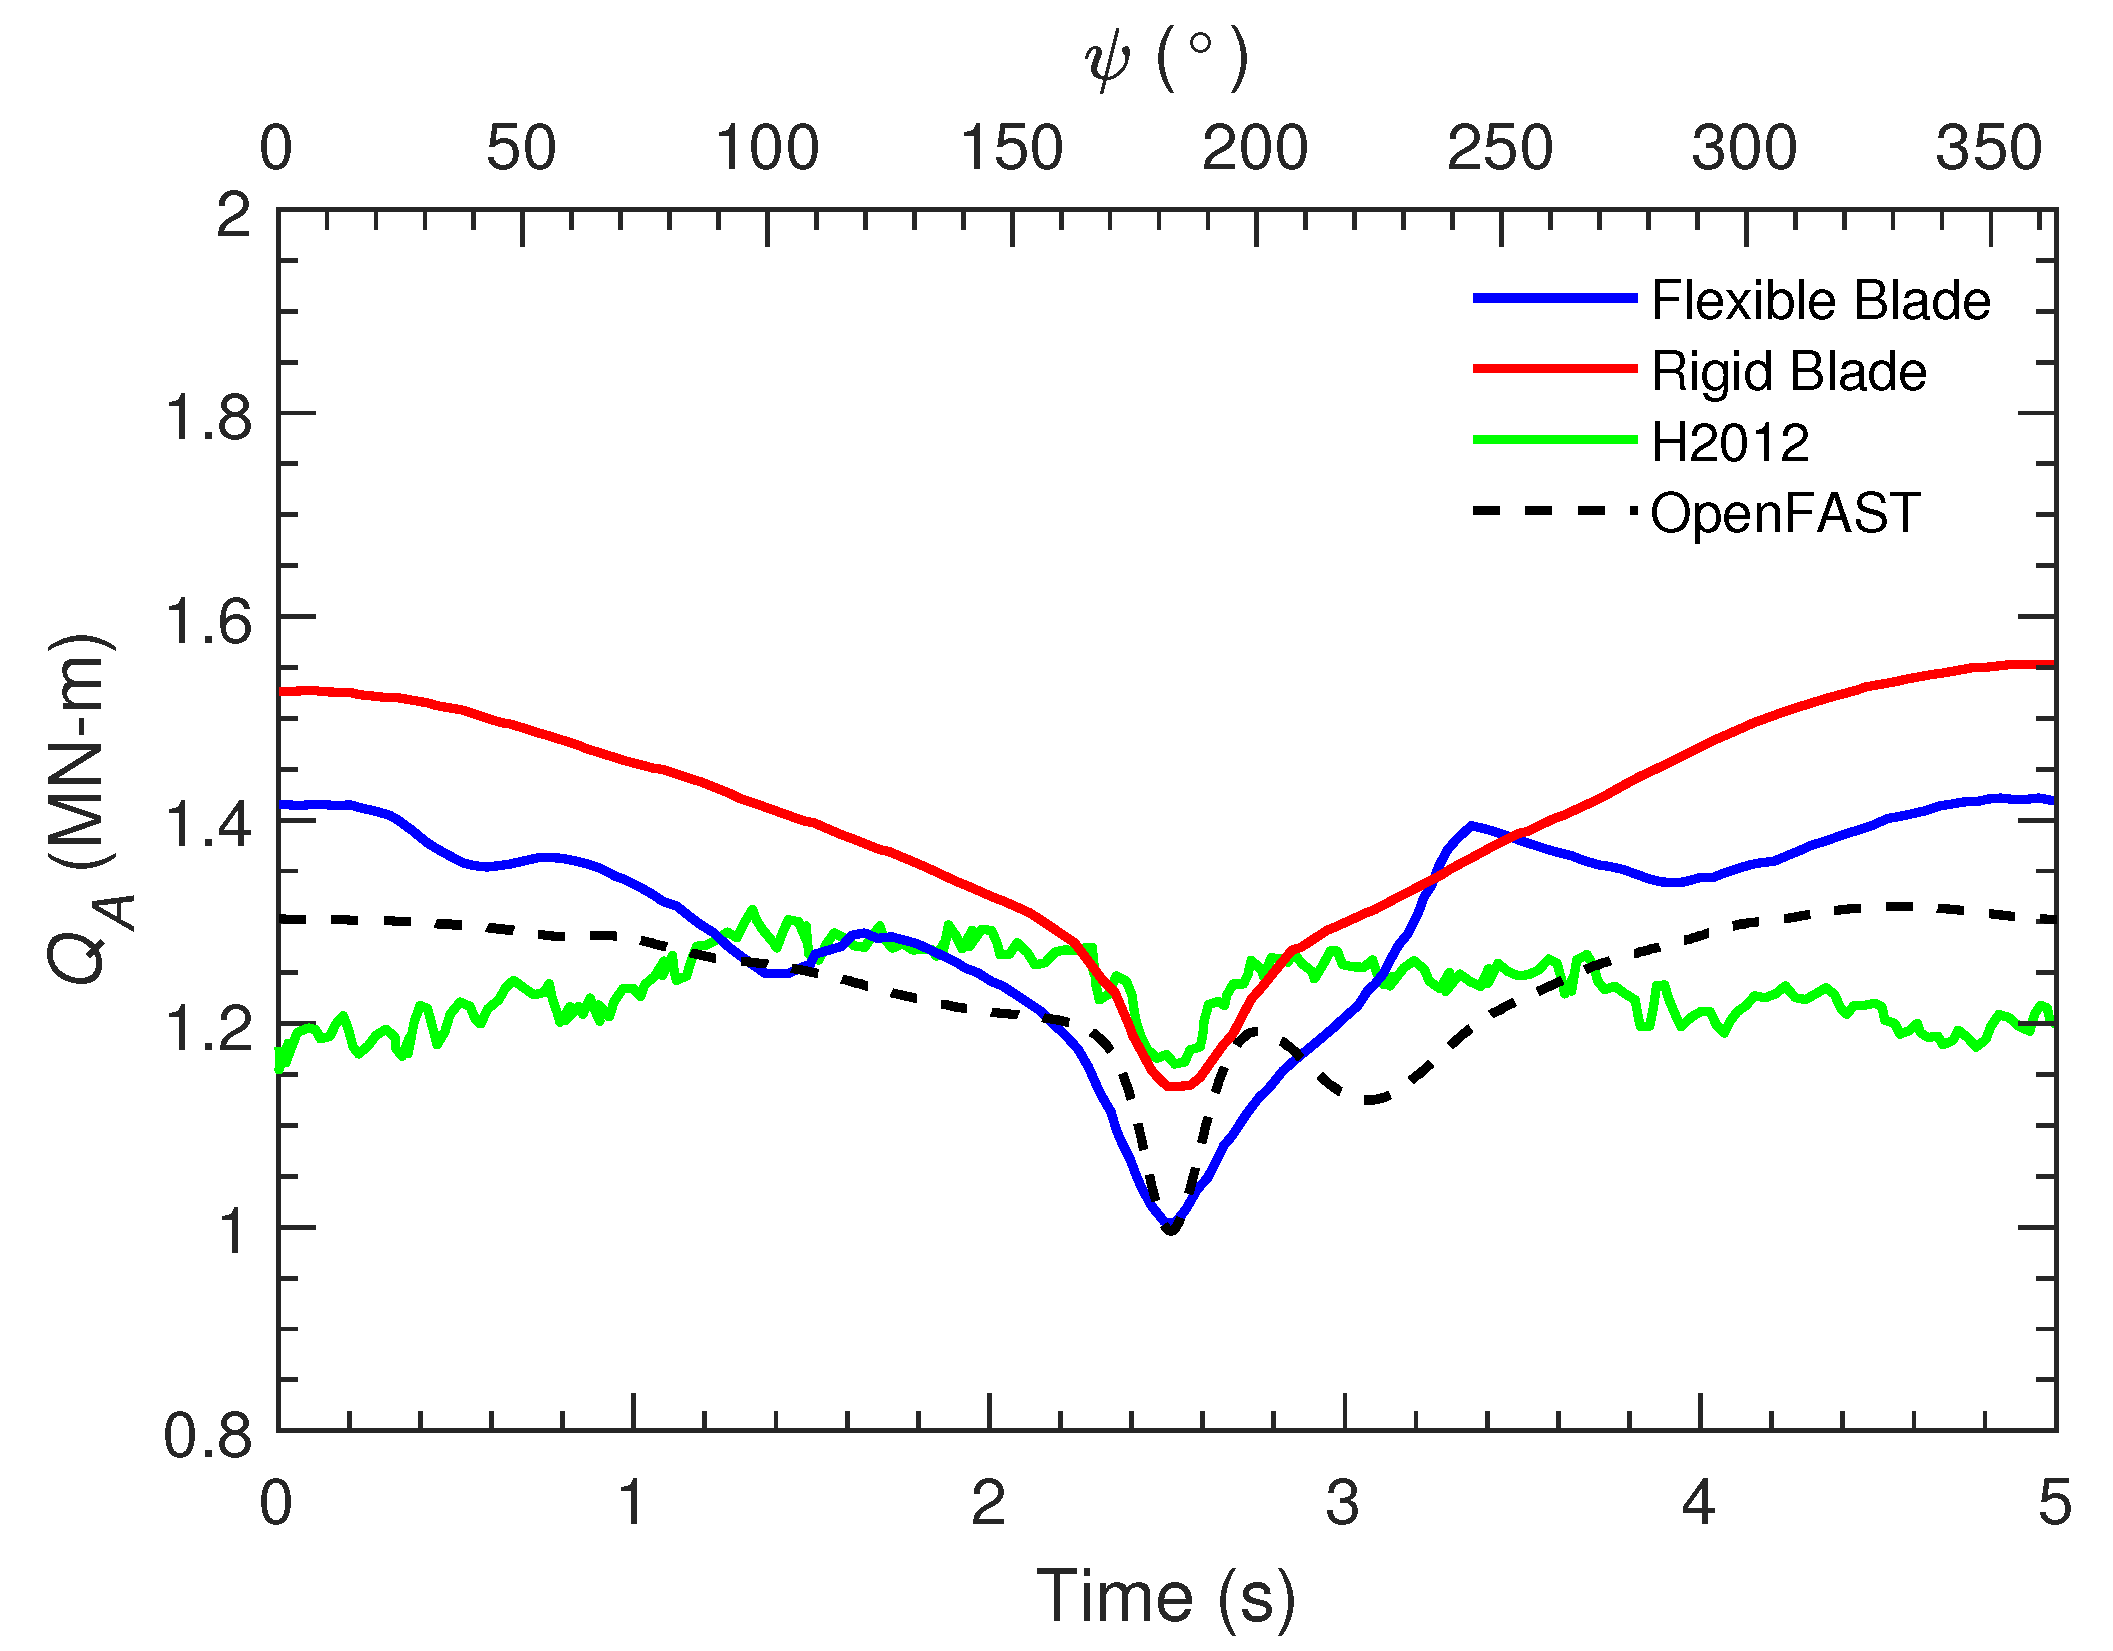
Figure 13 shows the aerodynamic torques exerted on the three blades about the rotor axis ( Q A ) over a cycle time. Both rigid and flexible blade cases were presented and compared to the results obtained with OpenFAST. The cycle-averaged torque of the flexible blades was approximately 3.86 MN-m, which is comparable to the evaluation by OpenFAST. The three dips in the load curve corresponded to the tower’s influence on the three blades and occurred when the blades reached the 180 ° azimuthal angle in both models. However, the range of load amplitudes was larger in the FSI simulation than in OpenFAST. The cycle-averaged torque of the rigid blades was about 4.27 MN-m, which was 10.6% larger than that of the flexible blades.

3.2. Tower Base Loads

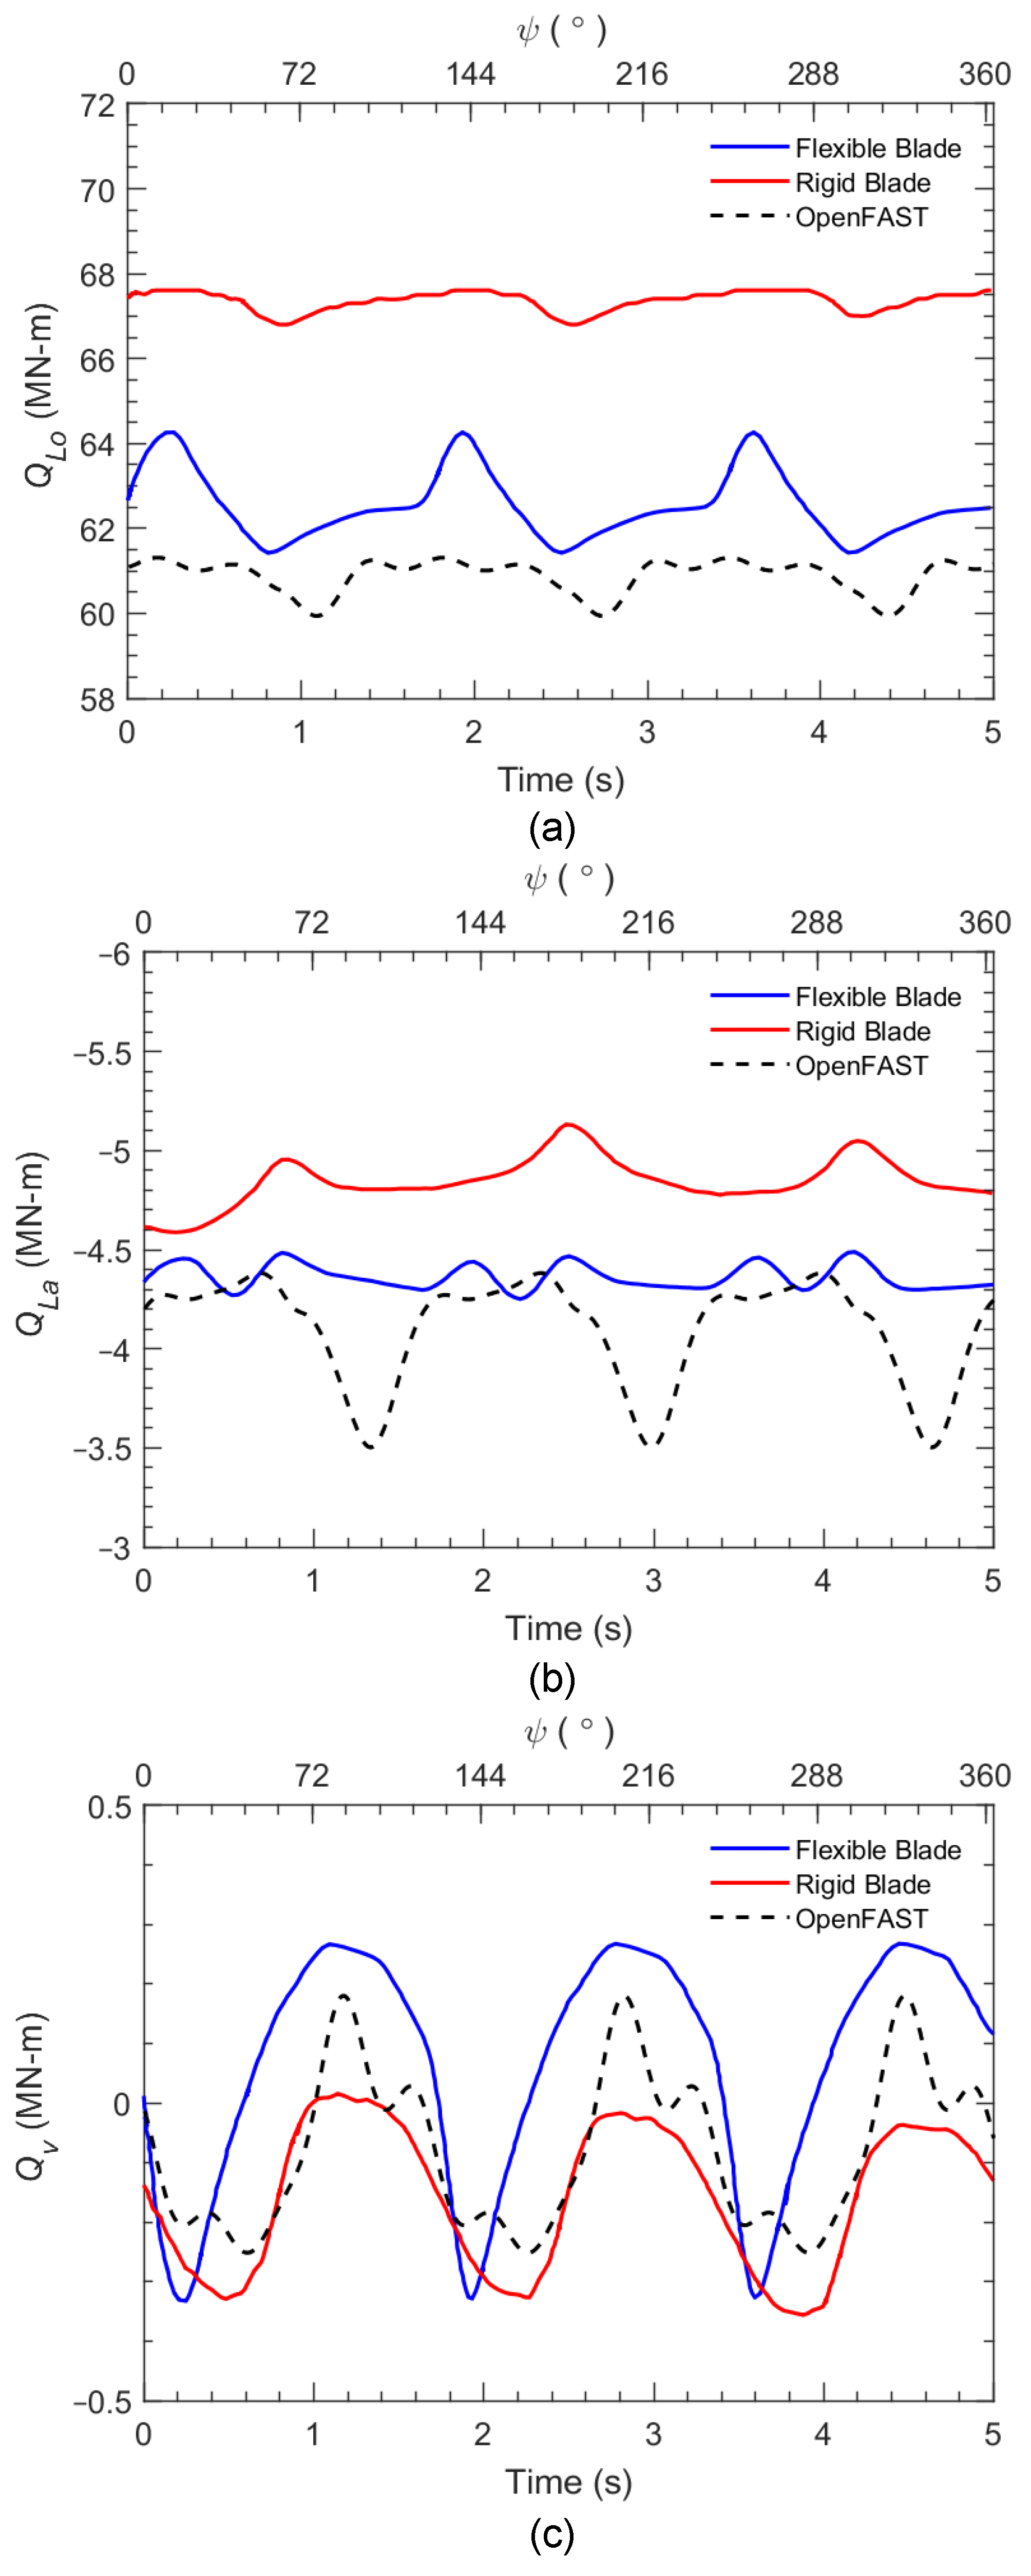
Three types of load at the tower base were examined in the present FSI simulation. All the loads were calculated based solely on the aerodynamic forces acting on the three blades, excluding wind loads on other parts of the turbine. Figure 14 shows the time series of the fore-aft bending moment Q L a (a), side-to-side bending moment Q L o (b), and vertical torque Q V (c) at the tower base over a rotor cycle. The curves for all three tower loads demonstrate that the tower effect consistently caused three dips corresponding to the moments when the three blades passed the tower. The cycle-averaged load levels are comparable across all load types, although the range of load amplitudes is larger in the FSI simulation, except for the side-to-side bending moment. Larger amplitudes of cyclic turbine loads can significantly impact structural integrity, particularly concerning fatigue and lifetime design considerations. As seen in Figure 14b, the tower effect evaluated using potential-flow theory in OpenFAST significantly decreased the minimum side-to-side bending moments to about 3.44 MN-m, whereas the minimum loads evaluated by the FSI model were about 4.25 MN-m, which is not substantially different from the cycle-averaged load of 4.37 MN-m.

3.3. Turbine Power

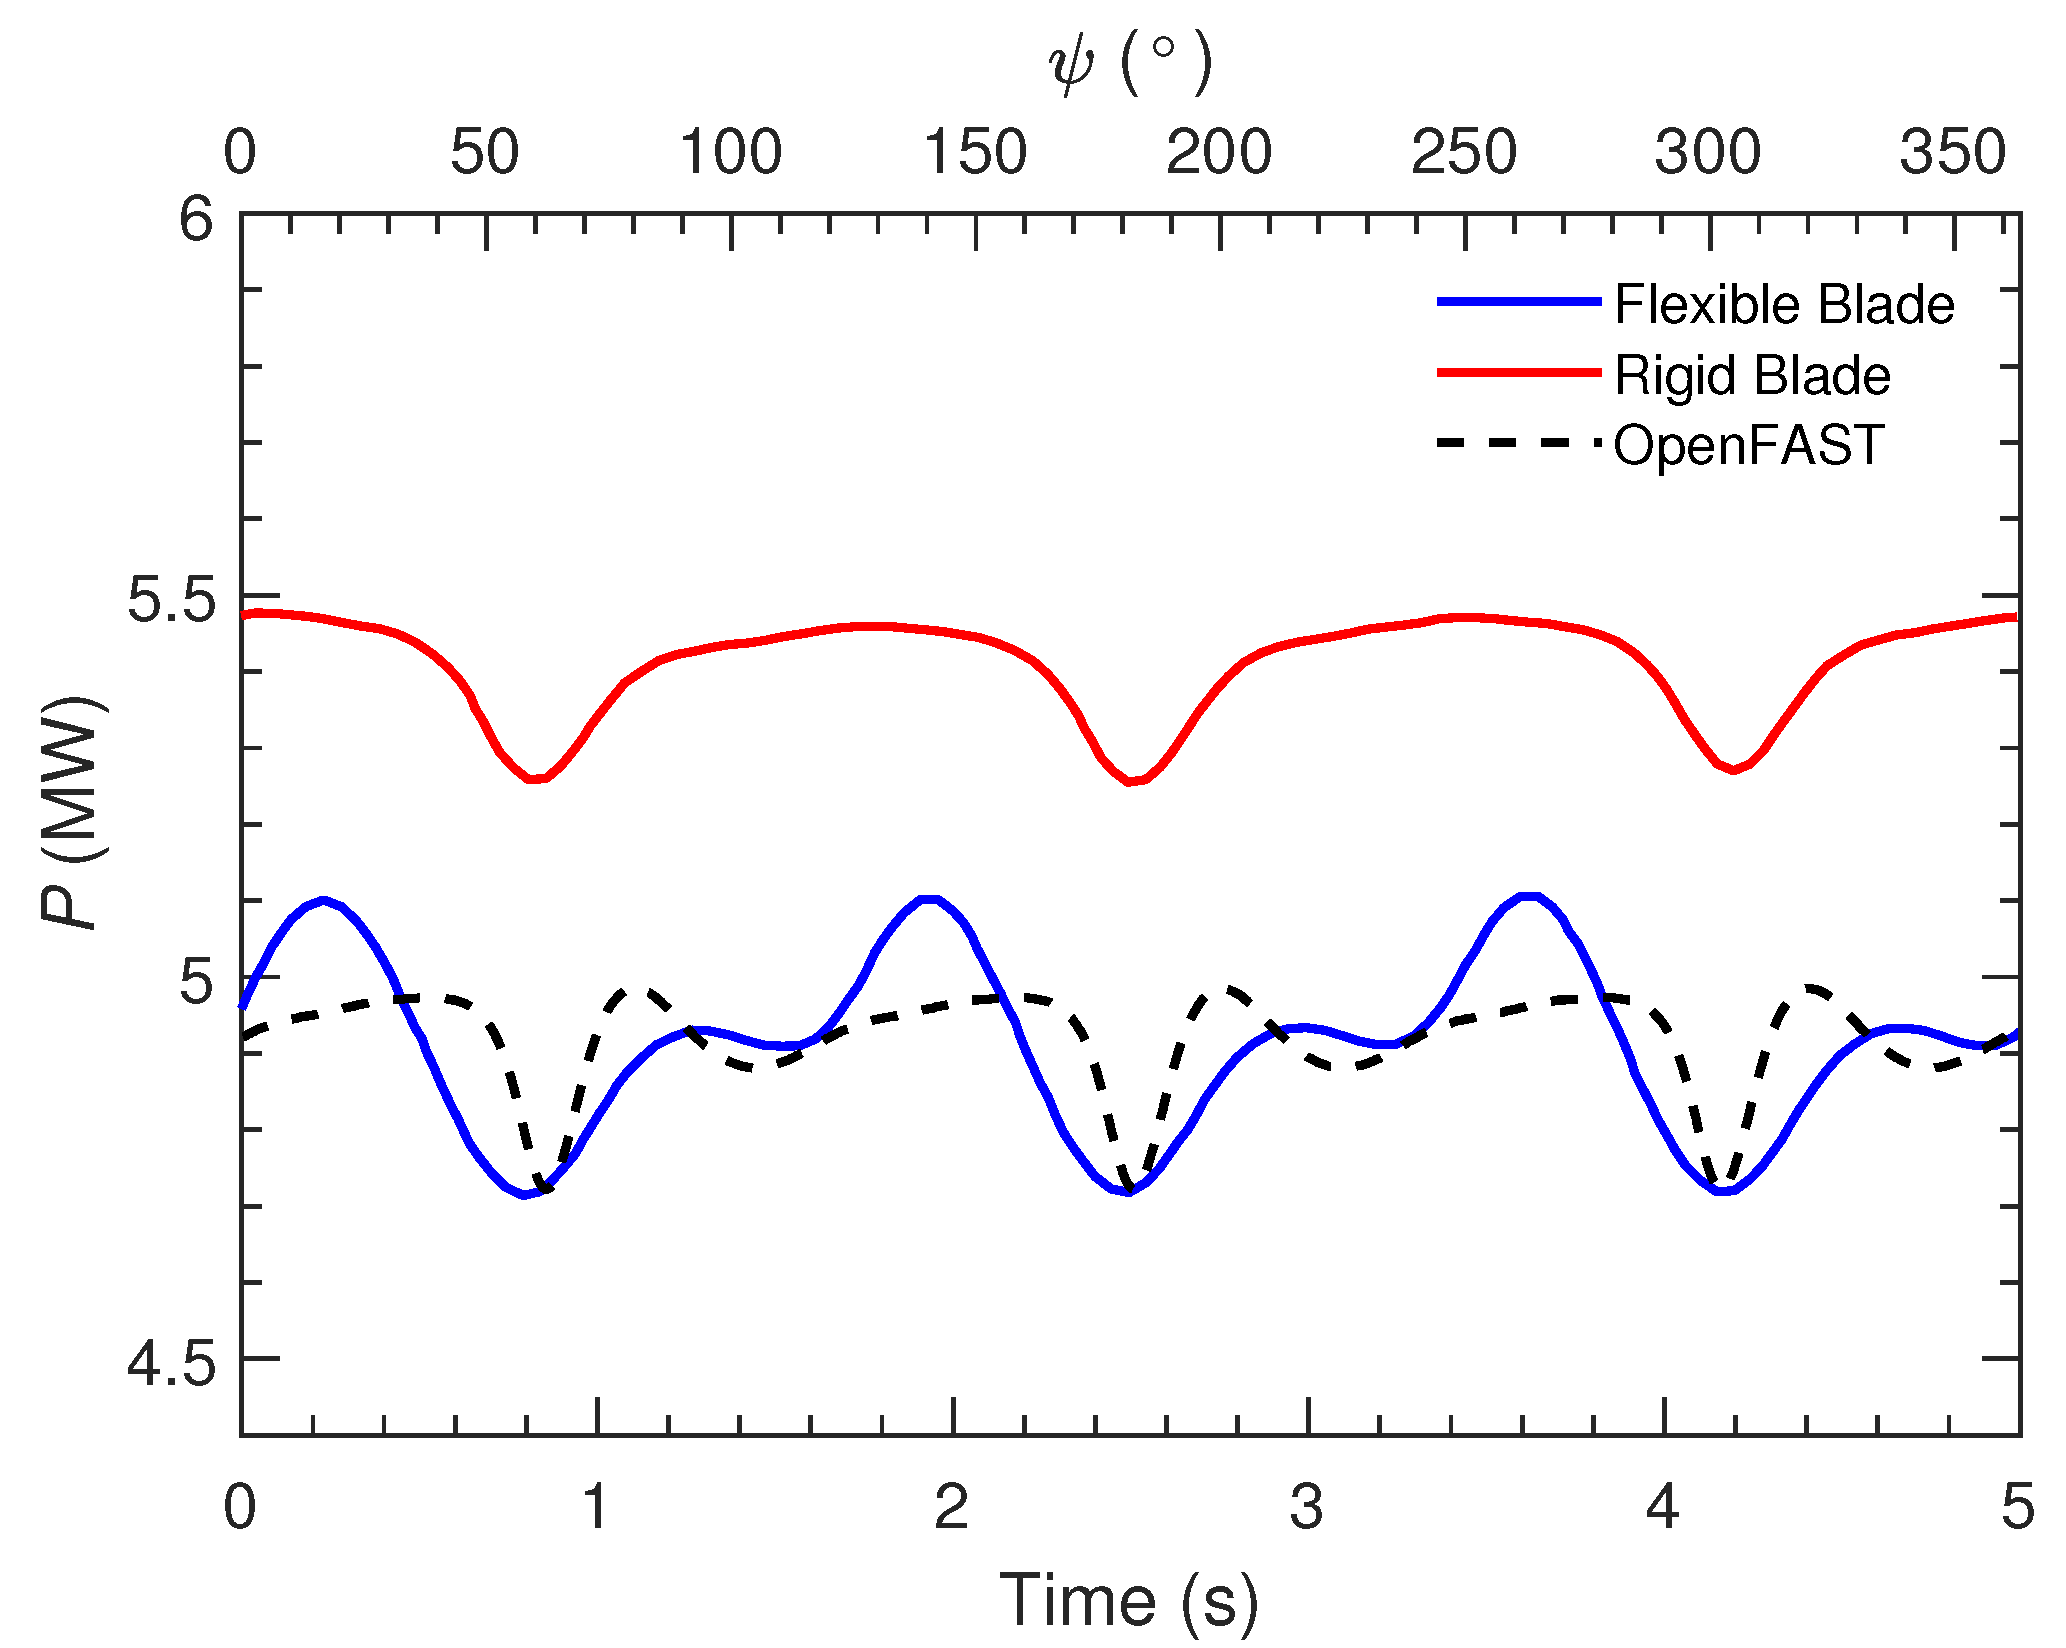
Figure 15 shows the time series of turbine power over a rotor cycle as evaluated by the present FSI (solid line) and OpenFAST (dashed line) simulations. The power presented here includes only the energy generated by the aerodynamic torques on the rotor, excluding gear box and generator power losses. The case of rigid blades (red) is also shown for comparison with the flexible blades (blue). As seen in the figure, the cyclic power curve from the FSI result exhibited greater variability with higher power peaks (∼5.1 MW). The power dips, resulting from rotor–tower interaction, were observed at a similar level (∼4.72 MW). Compared with the cycle-averaged power of the rigid blade case (5.42 MW), the blade flexibility reduced the mean power production to about 90.4% according to the present FSI calculation.
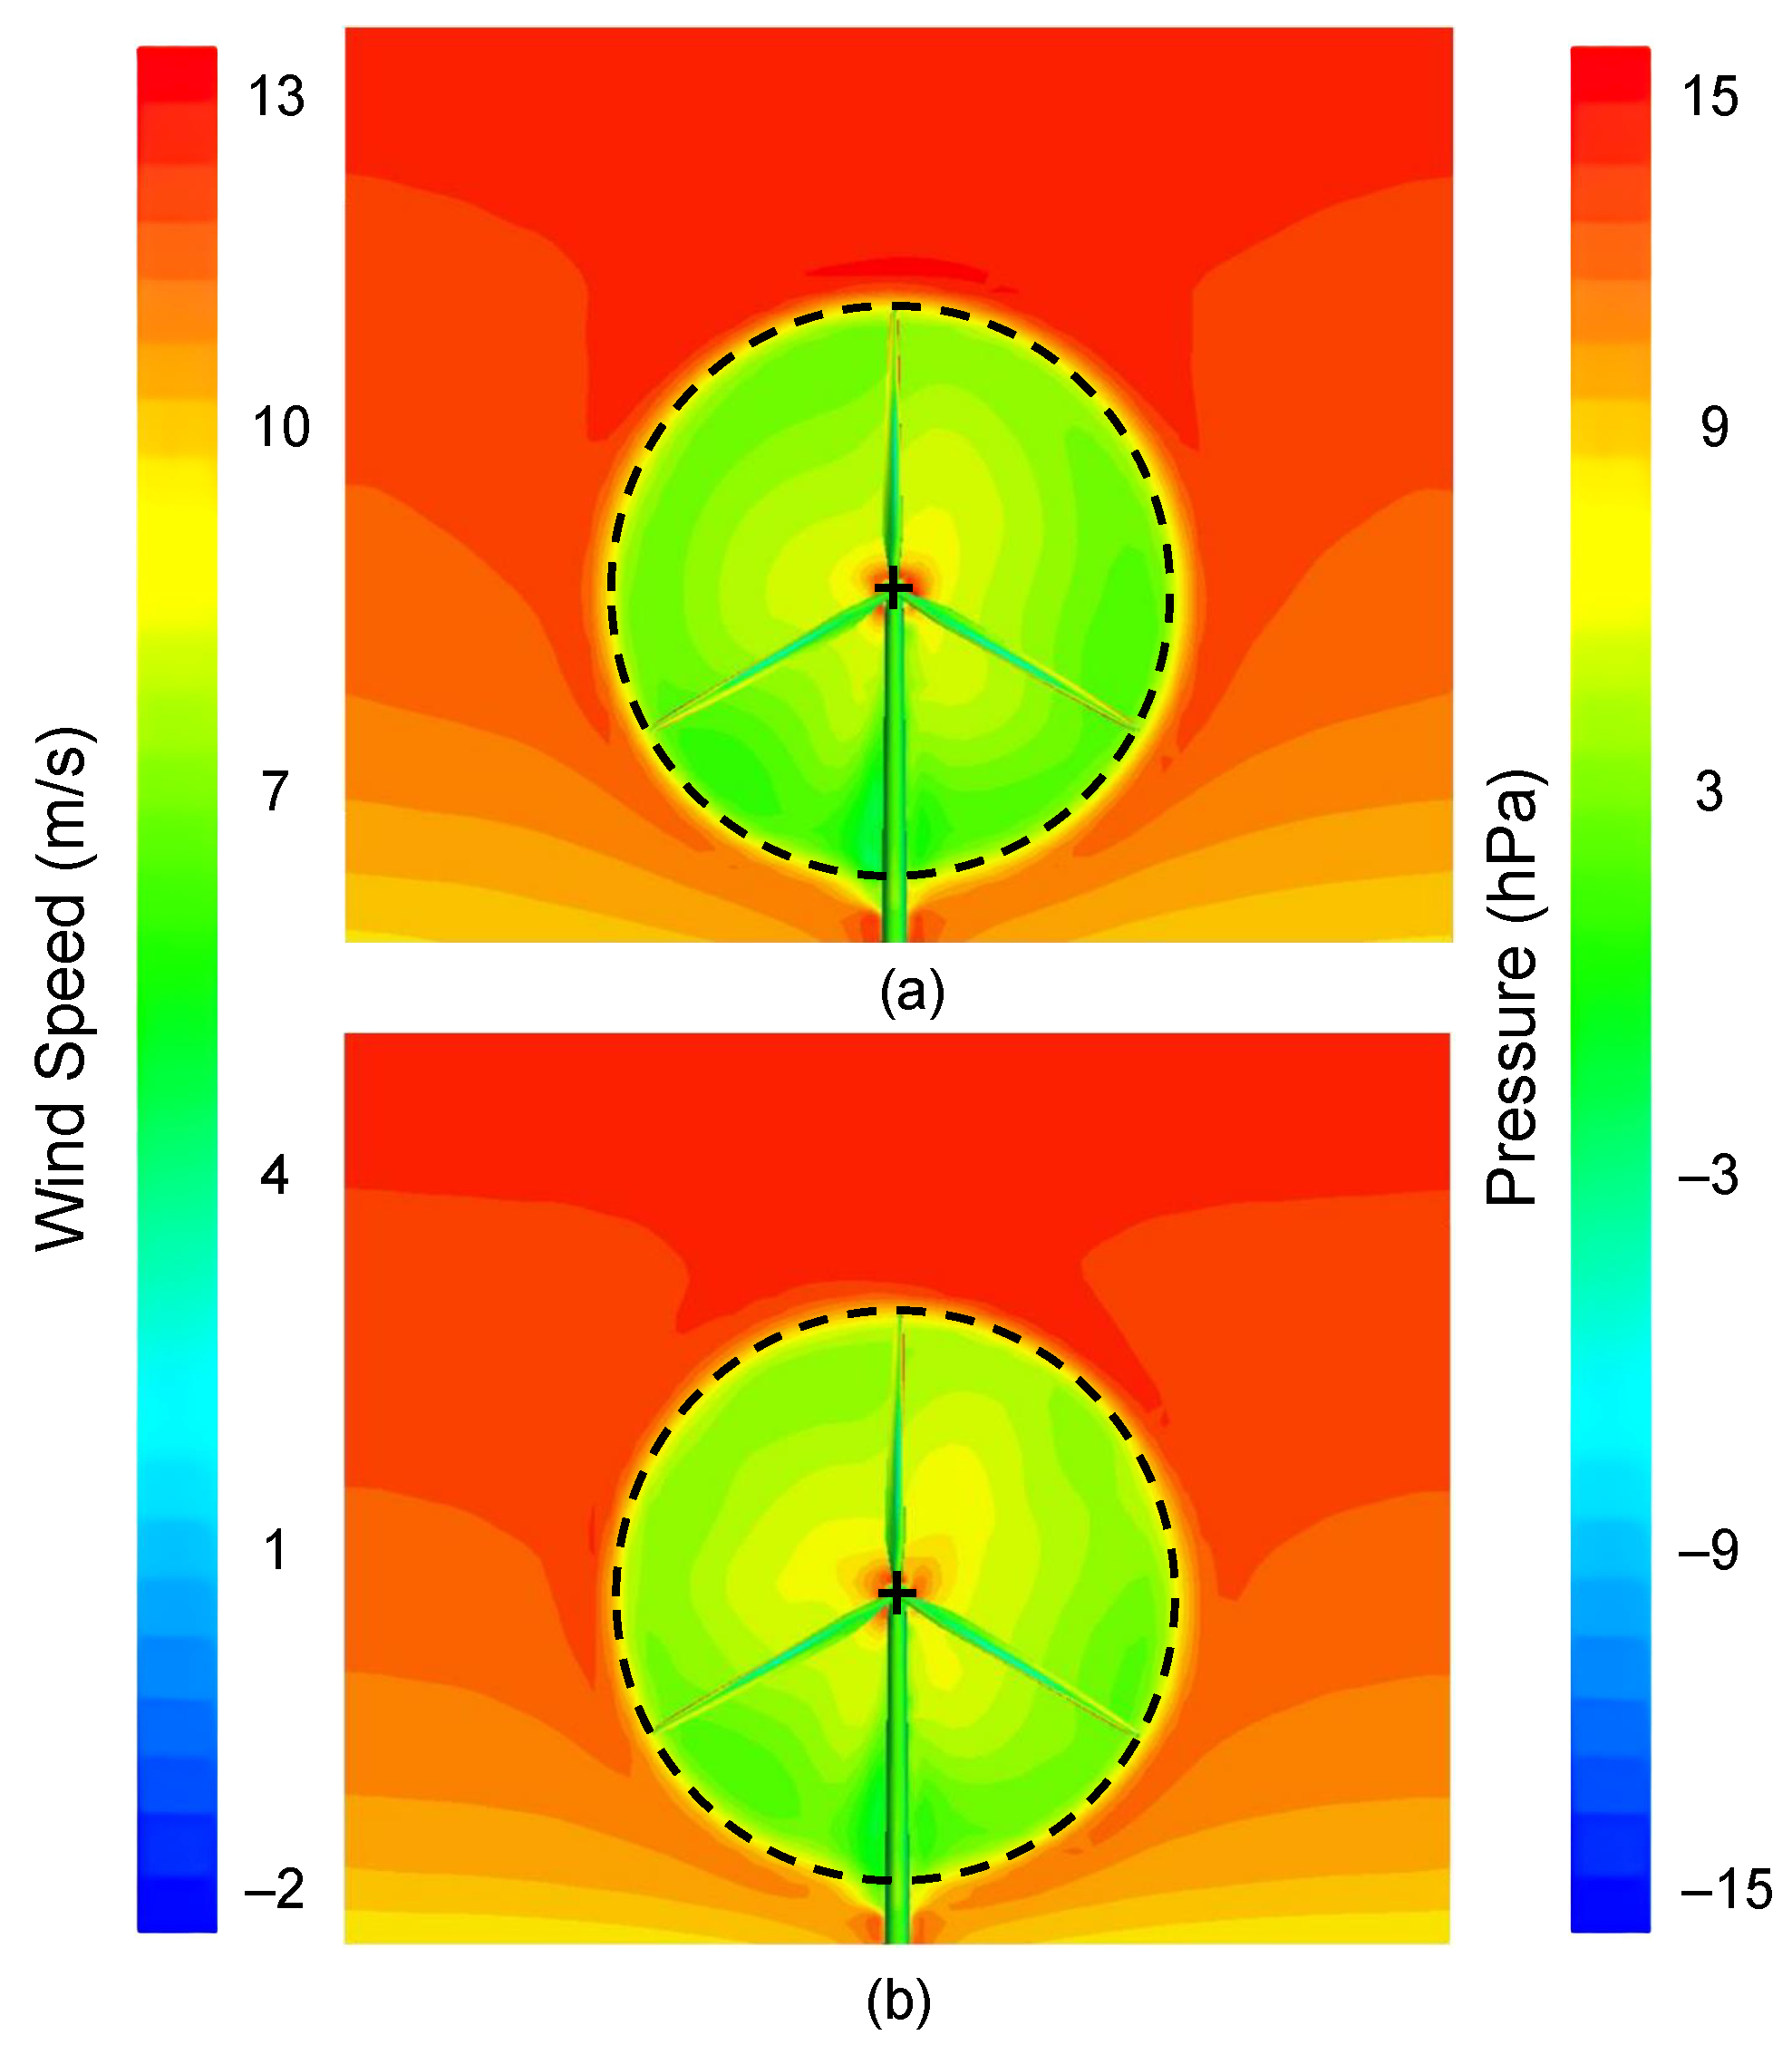
Figure 16 and Figure 17 show the vertical cross sections at x = 0 m and y = 15 m, respectively, of the simulated wind field for the cases of rigid (a) and flexible (b) blades. The snapshots, taken at a simulation time corresponding to one rotor cycle (∼5 s), depict the wind speed distribution using color contours. The turbine surfaces are colored according to the instantaneous pressure distributions. In the case of flexible blades, the deflected blades are seen to result in smaller rotor swept area and in turn reduce the downstream wake region immediately behind the rotor. As the flow progressed downstream, the wake area (indicated by the large green region in Figure 16) expanded, in contrast to the more uniform wake observed with rigid blades. The rigid rotor appeared to impede more inflow, resulting in lower wind speeds upstream. Consequently, as the higher upstream wind speeds were converted into a larger wake region, it can be inferred that greater momentum is transferred to the downstream flow when the blades are flexible. This momentum transfer leads to lower power production, consistent with the results shown in Figure 15. The reduced rotor swept area (indicated by the green circular region in Figure 17) for the flexible blades was more pronounced when compared to a reference circle, particularly near the lower rim. Additionally, the wakes induced by the tower, as captured in our FSI model, were clearly visible as sharp wakes near the tower base. The pressure distribution on the turbine blades revealed higher pressures near the blade tips. This can be attributed primarily to the increased tangential speeds at the rotor’s outer edge during constant-speed rotation, which enhanced the aerodynamic forces in this region. Additionally, three-dimensional effects near the blade tips, including flow separation and vortex formation, may have also contributed to the observed pressure increase.

3.4. Computational Time

All simulations were executed in parallel on a computing cluster with two Intel Xeon CPUs (E5-2640 v2). The computational time varied based on the modeling approach: the flexible blade case, requiring convergence at each interaction point as detailed in Section 2.4.4, took approximately 780 s per point, leading to a total runtime of about 19.5 h for a full rotor cycle. In contrast, the rigid blade case, which performed mainly CFD calculations, completed a full rotor cycle in around 15 min. OpenFAST simulations, focusing solely on aerodynamic loads and blade modal responses without direct FSI, typically finished within seconds for a full rotor cycle. However, this speed sacrificed the definition of important details, as OpenFAST does not fully capture the complex interactive behaviors critical for accurate turbine response and load patterns. In contrast, our proposed model provides improved load and power predictions while maintaining a lower computational cost compared with fully strong-coupling FSI models.

4. Conclusions

We have presented a new framework for FSI simulation of a full-machine wind turbine under stationary inflow winds and a constant rotating speed. Blade deformation due to wind loads was calculated using a weak-coupling two-way FSI approach with partitioned fluid and solid solvers, while the rotor rotation was simulated by assuming that the deformation-converged blade remains rigid during the rotation. The concept of ensuring convergence of blade deformation is similar to strong coupling; thus, this framework is regarded as a mixed weak and strong coupling approach to FSI simulation. Our model effectively captured the time series of aerodynamic loads, blade tip displacement, tower base loads, and aerodynamic power of the rotor. The results were reviewed and compared to the previous literature and OpenFAST-simulated results. It was concluded that the model can derive averaged data within a rotor cycle comparable to other methods. Our findings revealed that the ranges of cyclic amplitudes for power and certain loads (e.g., blade aerodynamic torques, fore-aft, and side-to-side tower base bending moments) are larger when evaluated using the FSI simulation. The tower effect significantly influences the power and load time series, consistently causing dips in the curves. The evaluated minima are similar to those obtained from OpenFAST simulations, where potential-flow theory is employed to handle the tower effect. Compared to rigid blades, we found that blade flexibility results in only 90.4% of power production, which could be a critical consideration for future offshore wind turbine design guidelines. We acknowledge that direct validation of wind turbine simulations using Supervisory Control and Data Acquisition (SCADA) data is challenging due to confidentiality concerns. However, SCADA data, when available, could be used to validate simulated power outputs against observed data. In this study, we validated our results by comparing them with outputs from OpenFAST, a well-established simulation tool widely used in wind energy research and industry. Future work could involve collaborations with industry partners to access SCADA data and enhance validation efforts under real-world conditions. The proposed FSI simulation framework for wind turbines stands out for its accuracy in load and power predictions and its relatively lower computational cost compared with other strong-coupling two-way FSI simulations.

Author Contributions

Conceptualization, S.-W.C.; methodology, S.-W.C. and N.-Y.L.; investigation, Y.L., N.-Y.L. and J.K.L.; software, Y.L., N.-Y.L. and J.K.L.; validation, Y.L. and N.-Y.L.; visualization, Y.L., N.-Y.L. and J.K.L.; writing—original draft preparation, Y.L., N.-Y.L. and J.K.L.; writing—review and editing, N.-Y.L. and S.-W.C.; funding acquisition, N.-Y.L. and S.-W.C. All authors have read and agreed to the published version of the manuscript.

Funding

This research was financially supported by National Taiwan University under Grant No. 113L894302/113L894303 of the Higher Education Sprout Project, funded by the Ministry of Education, and the National Science and Technology Council under Grant No. 110-2221-E-002-067-MY3/111-2222-E-002-001-MY3.

Institutional Review Board Statement

Not applicable.

Informed Consent Statement

Not applicable.

Data Availability Statement

The original contributions presented in this study are included in the article. Further inquiries can be directed to the corresponding author.

Acknowledgments

The authors gratefully acknowledge the technical support provided by the NTU Energy Research Center at National Taiwan University.

Conflicts of Interest

The authors declare no conflicts of interest.

Abbreviations

The following abbreviations are used in this manuscript:
ALMActuator Line Model
ADMActuator Disk Model
BEMTBlade Element Momentum Theory
CFDComputational Fluid Dynamics
CPUCentral Processing Unit
FEAFinite Element Analysis
FSIFluid–Structure Interaction
H2012Hsu and Bazilevs [30]
IECInternational Electrotechnical Commission
NRELNational Renewable Energy Lab
NWTCNational Wind Technology Center
RNARotor-Nacelle Assembly
RANSReynolds-averaged Navier–Stokes
SCADASupervisory Control and Data Acquisition
SIMPLESemi-implicit Method for Pressure-linked Equations
SSTShear Stress Transport

Symbols

The following symbols are used in this manuscript:
DRotor diameter
D ω Turbulent cross-diffusion term in k ω transport equations
E P Discretization error of turbine power
E e d g e , E f l a p , E s p a n Blade Young’s modulus in the edgewise, flapwise, and spanwise directions
F ( t ) Nodal external force vector of wind loads
GBlade shear modulus
G k , G ω Production terms in k ω transport equations
g Gravitational acceleration vector
I T Turbulence intensity
I Identity matrix
kTurbulent kinetic energy
k i n Inlet turbulent kinetic energy
L c Turbulence characteristic length scale
M , C , K Nodal matrices of mass, damping, and stiffness
PTurbine power
pAveraged dynamic pressure
Q A Aerodynamic torque about the rotor axis
Q L a , Q L o , Q V Lateral, longitudinal, and vertical moments about the tower base
q ¨ ( t ) , q ˙ ( t ) , q ( t ) Acceleration, velocity, and displacement vectors at the structural mesh nodes
tTime
t b Time step for blade deflection
t r Time step for rotor rotation
u i n Mean wind speed at the inlet
u h u b Mean wind speed at hub height
u Averaged wind velocity vector
x , y , z Distances along the longitudinal, lateral, and vertical directions
Y k , Y ω Dissipation terms in k ω transport equations
y + Dimensionless wall distance
z h u b Hub height
α Power law exponent
δ Blade tip displacement
μ t Turbulent viscosity
ρ Constant density of dry air
σ k , σ ω Turbulent Prandtl numbers in k ω transport equations
τ Viscous shear stress
ϕ a Rotor tilt angle
ψ i Azimuthal angle
ω Specific dissipation rate
ω i n Inlet specific dissipation rate

References

  1. NREL. OpenFAST Documentation. 2019. Available online: https://openfast.readthedocs.io (accessed on 14 November 2024).
  2. DNV GL. Bladed Theory Manual, version 4.8; DNV GL-Energy: Oslo, Norway, 2016. [Google Scholar]
  3. Larsen, T.J.; Hansen, A.M. How 2 HAWC2, The User’s Manual; Risø National Laboratory: Roskilde, Denmark, 2007. [Google Scholar]
  4. Mortensen, N.G.; Landberg, L.; Rathmann, O.; Frank, H.; Troen, I.; Petersen, E. Wind atlas analysis and application program (WAsP). In Wind Energy Department: Scientific and Technical Progress 1999–2000; Forskningscenter Risoe: Roskilde, Denmark, 2001. [Google Scholar]
  5. Larsen, T.J.; Hansen, A.M.; Buhl, T. Aeroelastic effects of large blade deflections for wind turbines. In Special Topic Conference: The Science of Making Torque from Wind; Delft University of Technology: Delft, The Netherlands, 2004; pp. 238–246. [Google Scholar]
  6. Lu, H.; Porté-Agel, F. Large-eddy simulation of a very large wind farm in a stable atmospheric boundary layer. Phys. Fluids 2011, 23, 065101. [Google Scholar] [CrossRef]
  7. Churchfield, M.J.; Lee, S.; Michalakes, J.; Moriarty, P.J. A numerical study of the effects of atmospheric and wake turbulence on wind turbine dynamics. J. Turbul. 2012, 13, N14. [Google Scholar] [CrossRef]
  8. Sørensen, J.N.; Shen, W.Z. Numerical modeling of wind turbine wakes. J. Fluids Eng. 2002, 124, 393–399. [Google Scholar] [CrossRef]
  9. Ravensbergen, M.; Mohamed, A.B.; Korobenko, A. The actuator line method for wind turbine modelling applied in a variational multiscale framework. Comput. Fluids 2020, 201, 104465. [Google Scholar] [CrossRef]
  10. Calaf, M.; Meneveau, C.; Meyers, J. Large eddy simulation study of fully developed wind-turbine array boundary layers. Phys. Fluids 2010, 22, 015110. [Google Scholar] [CrossRef]
  11. Porté-Agel, F.; Wu, Y.T.; Lu, H.; Conzemius, R.J. Large-eddy simulation of atmospheric boundary layer flow through wind turbines and wind farms. J. Wind Eng. and Ind. Aerodyn. 2011, 99, 154–168. [Google Scholar] [CrossRef]
  12. Behrouzifar, A.; Darbandi, M. An improved actuator disc model for the numerical prediction of the far-wake region of a horizontal axis wind turbine and its performance. Energy Conv. Manag. 2019, 185, 482–495. [Google Scholar] [CrossRef]
  13. Simisiroglou, N.; Breton, S.P.; Ivanell, S. Validation of the actuator disc approach using small-scale model wind turbines. Wind Energy Sci. 2017, 2, 587–601. [Google Scholar] [CrossRef]
  14. Sørensen, J.N.; Nilsson, K.; Ivanell, S.; Asmuth, H.; Mikkelsen, R.F. Analytical body forces in numerical actuator disc model of wind turbines. Renew. Energy 2020, 147, 2259–2271. [Google Scholar] [CrossRef]
  15. Hansen, M.H. Vibrations of a three-bladed wind turbine rotor due to classical flutter. In Proceedings of the ASME 2002 Wind Energy Symposium, Reno, NV, USA, 14–17 January 2002; Volume 7476, pp. 256–266. [Google Scholar]
  16. Kiendl, J.; Bazilevs, Y.; Hsu, M.C.; Wüchner, R.; Bletzinger, K.U. The bending strip method for isogeometric analysis of Kirchhoff–Love shell structures comprised of multiple patches. Comput. Methods Appl. Mech. Eng. 2010, 199, 2403–2416. [Google Scholar] [CrossRef]
  17. Şener, Ö.; Farsadi, T.; Ozan Gözcü, M.; Kayran, A. Evaluation of the effect of spar cap fiber angle of bending–torsion coupled blades on the aero-structural performance of wind turbines. J. Sol. Energy Eng. 2018, 140, 041004. [Google Scholar] [CrossRef]
  18. Ju, D.; Sun, Q. Modeling of a wind turbine rotor blade system. J. Vib. Acoust. 2017, 139, 051013. [Google Scholar] [CrossRef]
  19. Bazilevs, Y.; Hsu, M.C.; Kiendl, J.; Benson, D. A computational procedure for prebending of wind turbine blades. Int. J. Numer. Methods Eng. 2012, 89, 323–336. [Google Scholar] [CrossRef]
  20. Roul, R.; Kumar, A. Fluid–structure interaction of wind turbine blade using four different materials: Numerical investigation. Symmetry 2020, 12, 1467. [Google Scholar] [CrossRef]
  21. Wang, L.; Quant, R.; Kolios, A. Fluid structure interaction modelling of horizontal-axis wind turbine blades based on CFD and FEA. J. Wind Eng. Ind. Aerodyn. 2016, 158, 11–25. [Google Scholar] [CrossRef]
  22. Zhu, R.; Chen, D.d.; Wu, S.w. Unsteady flow and vibration analysis of the horizontal-axis wind turbine blade under the fluid–structure interaction. Shock Vib. 2019, 2019, 3050694. [Google Scholar] [CrossRef]
  23. Ageze, M.B.; Hu, Y.; Wu, H. Comparative study on uni-and bi-directional fluid structure coupling of wind turbine blades. Energies 2017, 10, 1499. [Google Scholar] [CrossRef]
  24. Benra, F.K.; Dohmen, H.J.; Pei, J.; Schuster, S.; Wan, B. A comparison of one-way and two-way coupling methods for numerical analysis of fluid–structure interactions. J. Appl. Math. 2011, 2011, 853560. [Google Scholar] [CrossRef]
  25. Della Posta, G.; Leonardi, S.; Bernardini, M. A two-way coupling method for the study of aeroelastic effects in large wind turbines. Renew. Energy 2022, 190, 971–992. [Google Scholar] [CrossRef]
  26. Dose, B.; Rahimi, H.; Herráez, I.; Stoevesandt, B.; Peinke, J. Fluid–structure coupled computations of the NREL 5 MW wind turbine by means of CFD. Renew. Energy 2018, 129, 591–605. [Google Scholar] [CrossRef]
  27. Bazilevs, Y.; Hsu, M.C.; Kiendl, J.; Wüchner, R.; Bletzinger, K.U. 3D simulation of wind turbine rotors at full scale. Part II: Fluid–structure interaction modeling with composite blades. Int. J. Numer. Methods Fluids 2011, 65, 236–253. [Google Scholar] [CrossRef]
  28. Grinderslev, C.; González Horcas, S.; Sørensen, N.N. Fluid–structure interaction simulations of a wind turbine rotor in complex flows, validated through field experiments. Wind. Energy 2021, 24, 1426–1442. [Google Scholar] [CrossRef]
  29. Santo, G.; Peeters, M.; Van Paepegem, W.; Degroote, J. Dynamic load and stress analysis of a large horizontal axis wind turbine using full scale fluid–structure interaction simulation. Renew. Energy 2019, 140, 212–226. [Google Scholar] [CrossRef]
  30. Hsu, M.C.; Bazilevs, Y. Fluid–structure interaction modeling of wind turbines: Simulating the full machine. Comput. Mech. 2012, 50, 821–833. [Google Scholar] [CrossRef]
  31. Bazilevs, Y.; Korobenko, A.; Deng, X.; Yan, J. Novel structural modeling and mesh moving techniques for advanced fluid–structure interaction simulation of wind turbines. Int. J. Numer. Methods Eng. 2015, 102, 766–783. [Google Scholar] [CrossRef]
  32. Zhang, D.; Liu, Z.; Li, W.; Hu, G. LES simulation study of wind turbine aerodynamic characteristics with fluid–structure interaction analysis considering blade and tower flexibility. Energy 2023, 282, 128840. [Google Scholar] [CrossRef]
  33. Felippa, C.A.; Park, K.C.; Farhat, C. Partitioned analysis of coupled mechanical systems. Comput. Methods Appl. Mech. Eng. 2001, 190, 3247–3270. [Google Scholar] [CrossRef]
  34. Förster, C.; Wall, W.A.; Ramm, E. Artificial added mass instabilities in sequential staggered coupling of nonlinear structures and incompressible viscous flows. Comput. Methods Appl. Mech. Eng. 2007, 196, 1278–1293. [Google Scholar] [CrossRef]
  35. Lin, Y. Aerodynamic prediction of horizontal-axis offshore wind turbine via a two-way fluid–structure interaction approach. Master’s Thesis, Department of Mechanical Engineering, College of Engineering, National Taiwan University of Science and Technology, Taipei, Taiwan, 2014. [Google Scholar]
  36. Jonkman, J.; Butterfield, S.; Musial, W.; Scott, G. Definition of a 5-MW Reference wind Turbine for Offshore System Development; Technical Report; National Renewable Energy Lab. (NREL): Golden, CO, USA, 2009. [Google Scholar]
  37. CD-Adapco. User Guide, Star-CCM+ (9.02.007-R8); CD-adapco: Melville, NY, USA, 2014. [Google Scholar]
  38. Menter, F. Zonal two equation kw turbulence models for aerodynamic flows. In Proceedings of the 23rd Fluid Dynamics, Plasmadynamics, and Lasers Conference, Orlando, FL, USA, 6–9 July 1993; p. 2906. [Google Scholar]
  39. Patankar, S.V.; Spalding, D.B. A calculation procedure for heat, mass and momentum transfer in three-dimensional parabolic flows. In Numerical Prediction of Flow, Heat Transfer, Turbulence and Combustion; Elsevier: Amsterdam, The Netherlands, 1983; pp. 54–73. [Google Scholar]
  40. Simulia. Abaqus/CAE User’s Manual, version 6.13; Simulia/Dassault: Johnston, RI, USA, 2014. [Google Scholar]
  41. Newmark, N.M. A method of computation for structural dynamics. J. Eng. Mech. Div. 1959, 85, 67–94. [Google Scholar] [CrossRef]
  42. Lakshmynarayanana, P.A. Application of 3D-CFD Modelling for Dynamic Behaviour of Ship in Waves. Ph.D. Thesis, University of Southampton, Southampton, UK, 2017. [Google Scholar]
  43. Buhl, M. The NWTC design-codes suite: An overview. In Proceedings of the 43rd AIAA Aerospace Sciences Meeting and Exhibit, Reno, NV, USA, 10–13 January 2005; p. 592. [Google Scholar]
  44. IEC. Wind Turbines-Part 1: Design Requirements; Technical Report; International Electrotechnical Commission and others: Geneva, Switzerland, 2007. [Google Scholar]
  45. Lindenburg. Modelling of the LMH64-5 Blade; Technical Report; Energy Research Center of the Netherlands: Petten, The Netherlands, 2002; DOWEC Dutch Offshore Wind Energy Converter 1997–2003 Public Reports [CD-ROM], DOWEC 10083_001, DOWEC-02-KL-083/0. [Google Scholar]
  46. Kooijman, H.J.T.; Lindenburg, C.; Winkelaar, D.; van der Hooft, E. Pre-Design: Aero-Elastic Modeling of the DOWEC 6 MW Pre-Design in PHATAS; Technical Report; Energy Research Center of the Netherlands: Petten, The Netherlands, 2003; DOWEC Dutch Offshore Wind Energy Converter 1997–2003 Public Reports [CD-ROM], DOWEC 10046_009, ECN-CX–01-135. [Google Scholar]
  47. Richardson, L.F., IX. The approximate arithmetical solution by finite differences of physical problems involving differential equations, with an application to the stresses in a masonry dam. Philos. Trans. Royal Soc. London. Ser. A Contain. Papers Math. Phys. Character 1911, 210, 307–357. [Google Scholar]
  48. Jonkman, J.; Buhl, M. FAST User’s Guide; Technical Report; National Renewable Energy Laboratory: Golden, CO, USA, 2005. [Google Scholar]
  49. Jonkman, J.M.; Hayman, G.; Jonkman, B.; Damiani, R.; Murray, R. AeroDyn v15 User’s Guide and Theory Manual; NREL Draft Report 46; National Renewable Energy Lab.: Golden, CO, USA, 2015. [Google Scholar]
  50. Jonkman, B. Turbsim User’s Guide v2.00.00; Technical Report; National Renewable Energy Lab.: Golden, CO, USA, 2014. [Google Scholar]
  51. Bak, C.; Madsen, H.A.; Johansen, J. Influence from blade-tower interaction on fatigue loads and dynamics (poster). In Proceedings of the 2001 European Wind Energy Conference and Exhibition (EWEC’01), WIP-Renewable Energies, Copenhagen, Denmark, 2–6 July 2001; pp. 394–397. [Google Scholar]
Figure 1. Flowchart of the present two-way FSI simulation.
Jmse 12 02271 g001
Figure 2. Flowchart of the data conversion in the FSI simulation.
Jmse 12 02271 g002
Figure 3. Schematic diagram of the NREL 5 MW wind turbine.
Jmse 12 02271 g003
Figure 4. Computational domain of the wind fields.
Jmse 12 02271 g004
Figure 5. (a) Side view and (b) front view of the grid distributions.
Jmse 12 02271 g005
Figure 6. Structural mesh of the turbine blade.
Jmse 12 02271 g006
Figure 7. Displacement of blade tip at ψ = 0 ° .
Jmse 12 02271 g007
Figure 8. The interaction points in the FSI coupling process.
Jmse 12 02271 g008
Figure 9. Discretization error E p with respect to dimensionless grid size d x .
Jmse 12 02271 g009
Figure 10. Aerodynamic loads on the wind turbine.
Jmse 12 02271 g010
Figure 11. Aerodynamic torque of blade 1 over a rotor cycle.
Jmse 12 02271 g011
Figure 12. Tip displacement of blade 1 over a rotor cycle.
Jmse 12 02271 g012
Figure 13. Aerodynamic torque exerted on 3 blades about the rotor axis over a rotor cycle.
Jmse 12 02271 g013
Figure 14. (a) Fore-aft bending moment Q L a , (b) side-to-side bending moment Q L o , and (c) vertical torque Q V about the tower base induced by aerodynamic loads over a rotor cycle.
Jmse 12 02271 g014
Figure 15. Turbine power induced by aerodynamic loads over a rotor cycle.
Jmse 12 02271 g015
Figure 16. Wind speed and turbine surface pressure distributions at x = 0 m for the (a) rigid and (b) flexible blade cases.
Jmse 12 02271 g016
Figure 17. Wind speed and turbine surface pressure distributions at y = 15 m for the (a) rigid and (b) flexible blade cases.
Jmse 12 02271 g017
Table 1. Main properties of the 5 MW NREL turbine model.
  PropertiesValues
  Power rating5 MW
  Rotor typeUpwind/ 3-bladed
  Rotor diameter (D)126 m
  Hub height ( z h u b )90 m
  Cut-in, rated, cut-out speed3, 11.4, 25 m s−1
  Rated rotor speed12.1 rpm
Table 2. Boundary conditions of the computational domain.
  FacesConditions
  abcd, aehd, abfe, and bfgcInlet
  efghOutlet
  dcghNo-slip wall
Table 3. Overall mesh quality metrics used in the CFD simulation.
  Metrics  Results
  Maximum skewness angle   83 . 3 ° (< 85 ° )
  Minimum cell quality  0.06 (< 1 × 10 5 )
  Maximum volume change  0.06 (>0.01)
Table 4. Selected equivalent moduli used in the blade model.
  SpanwiseEflapEedgeEspanG
  Locations (m) (GPa) (GPa) (GPa) (GPa)
  2.724.747924.61713.43513.4508
  10.74.55771.88420.85160.2086
  21.73.23201.41090.63360.0640
  31.74.66792.08570.53860.0557
  41.75.12162.25810.42760.0442
  51.76.13382.12260.31990.0357
  63.028.33337.63720.12620.2870
Table 5. Grid dependence test based on relative errors of simulated turbine power.
RefinementTotal Grid NumberP (MW)Relative Error
1 4.40 × 10 5 3.88−28.4%
2 8.89 × 10 5 5.15−5.0%
3 1.14 × 10 6 5.30−2.2%
4 2.30 × 10 6 5.41−0.2%
5 4.37 × 10 6 5.42
Disclaimer/Publisher’s Note: The statements, opinions and data contained in all publications are solely those of the individual author(s) and contributor(s) and not of MDPI and/or the editor(s). MDPI and/or the editor(s) disclaim responsibility for any injury to people or property resulting from any ideas, methods, instructions or products referred to in the content.