Article

Hydrodynamic Modelling of Severn Bore and Its Dependence on Ocean Tide and River Discharge

1
Department of Engineering, University of Cambridge, Cambridge CB1 2PZ, UK
2
Engineering Research Center for the Operation and Ecological Safety of Cross-Basin Water Diversion and Transfer in Henan Province, Yellow River Conservancy Technical Institute, Kaifeng 475000, China
3
Engineering and Technology Research Center for Disaster Prevention of Giant Water Networks in Henan Province, Yellow River Conservancy Technical Institute, Kaifeng 475000, China
4
CHN Energy Technology and Economics Research Institute, Beijing Changping District Future Science City Shenhua Research Institute, Beijing 102211, China
*
Authors to whom correspondence should be addressed.
J. Mar. Sci. Eng. 2024, 12(12), 2319; https://doi.org/10.3390/jmse12122319
Submission received: 1 December 2024 / Revised: 13 December 2024 / Accepted: 17 December 2024 / Published: 18 December 2024
(This article belongs to the Section Coastal Engineering)

Abstract

:
Owing to the high tidal range, the Severn Estuary and Bristol Channel have the potential to generate huge amounts of renewable electricity for the UK. During the flood tide, the surging water travels upstream to form the Severn Bore. This study explores the dynamics of the Severn Bore through hydrodynamic modelling, analyzing how the tidal amplitude, mean water level, and river discharge affect the bore’s intensity, reach, and sustainability. The Delft3D simulations show that the downstream tidal amplitude plays a critical role. Tides with an amplitude of less than 6 m will lead to the disappearance of the Severn Bore. The mean water level also significantly influences the bore’s propagation, with a 1.5 m drop resulting in a 15 km retreat of the bore. A high river discharge rate weakens the bore’s intensity and reduces its reach. These findings underscore the need for careful planning in tidal energy development within the Severn Estuary. Excessive exploitation of tidal energy can be detrimental to the Severn Bore and the ecological function of the estuary.

1. Introduction

Tidal bores are remarkable natural phenomena characterized by a sudden surge of tidal water propagating upstream in estuaries during flood tides. These positive surges occur when the incoming tidal wave moves against the river current, forming a steep wave front. Tidal bores are significant not only for their unique hydrodynamic characteristics but also for their ecological, cultural, and economic value [1].
Ecologically, tidal bores create distinctive estuarine environments that serve as vital habitats for various fish species and provide essential feeding and breeding grounds for birds and other marine wildlife [2]. Culturally and economically, tidal bores hold immense importance for local communities. For instance, the Qiantang River tidal bore in China attracts over 300,000 tourists annually and plays a central role in local traditions and festivals. The Severn Bore in the United Kingdom similarly contributes to the local economy and cultural identity, drawing surfers and spectators from around the world [3,4].
The formation of tidal bores requires specific geographical and hydrodynamic conditions, including a large tidal range, a shallow and convergent channel with a rising riverbed, and low freshwater discharge [5]. Globally, approximately 100 rivers are known to experience observable tidal bores [6]. However, this delicate balance of conditions makes tidal bores highly susceptible to human interventions such as river training, dredging, and damming. These activities can alter estuarine bathymetry and hydrodynamic conditions, leading to the weakening or disappearance of tidal bores. For example, the tidal bore of the Seine River has disappeared, and the Colorado River bore has been significantly diminished. While these changes have improved navigation safety, they have adversely impacted the ecosystems of the affected estuarine areas [2].
Research on tidal bores has traditionally relied on qualitative observations [5,7] and quantitative field studies [8,9,10,11]. Numerical modeling studies are comparatively rare, with the Qiantang Bore being the most extensively modelled tidal bore globally [12,13,14,15,16]. Two-dimensional (2D) shallow water equations and three-dimensional (3D) non-hydrostatic models have been developed to investigate its propagation, sedimentary dynamics, and morphodynamic impacts. Despite this progress, many tidal bores, including the Severn Bore, remain understudied from a numerical modeling perspective [17,18,19,20,21].
The Severn Bore, one of the most prominent tidal bores globally, occurs in the Severn Estuary (Figure 1). As a focal point for tidal energy development, the Severn Estuary has been the subject of numerous hydrodynamic modelling studies, predominantly using one-dimensional (1D) or two-dimensional (2D) depth-averaged approaches. For instance, Xia et al. [22] examined the hydrodynamic impacts of possible tidal power projects, while Ahmadian et al. [23] explored the far-field hydro-environmental effects of a potential tidal barrage. Liang et al. [24] linked the large tidal range to the high amplification factor of the M2 tidal constituent, and Ma and Adcock [25] analyzed the resonant response of the Bristol Channel system, including the effects of tidal range structures.
Despite these studies, accurately modeling the Severn Estuary and its tidal dynamics remains a significant challenge due to its complex bathymetry and the presence of multiple spatial and temporal scales [24]. Spatially, the estuary narrows dramatically from approximately 7.7 km at its seaward boundary to just 72 m near the landward limit. Temporally, the semidiurnal tidal wave has a period of approximately 12 h, while the Severn Bore passes a given cross-section in less than a minute. These complexities, coupled with the natural irregularities of the river’s topography, make it particularly difficult to capture the Severn Bore’s propagation with high precision.
As the UK strives to achieve net-zero emissions by 2050, there is renewed interest in tidal energy projects in the Severn Estuary. A new commission has been established to explore tidal energy schemes to meet the country’s renewable energy targets [26]. However, earlier proposals, such as the Severn Barrage in 2010, failed to gain government approval due to significant environmental and social concerns, including potential adverse impacts on the Severn Bore.
To address these concerns and enable sustainable tidal energy development, detailed hydrodynamic modeling is critical for quantifying and assessing the potential effects of tidal energy extraction on the Severn Bore. Although some theoretical work has been conducted on bore propagation in tidal rivers, including Abbott’s [27] work on channel geometry, frictional resistance, and tidal amplitude, comprehensive numerical analyses specifically addressing the Severn Bore are lacking. Wu’s [19] numerical study of the Severn Estuary examined the propagation of tidal wave and other relevant research has primarily focused on the broader hydrodynamic impacts of tidal energy schemes without specifically addressing the tidal bore [22,23].
This study seeks to address this research gap by developing a detailed hydrodynamic model of the Severn Bore to analyze its propagation and dynamics under various conditions. The model provides a baseline scenario for the Severn Bore’s behavior, offering insights into its response to tidal energy developments. These findings aim to inform the design and operation of tidal energy schemes, ensuring that the ecological and cultural significance of the Severn Bore is preserved while meeting renewable energy goals.

2. Model Setup and Validation
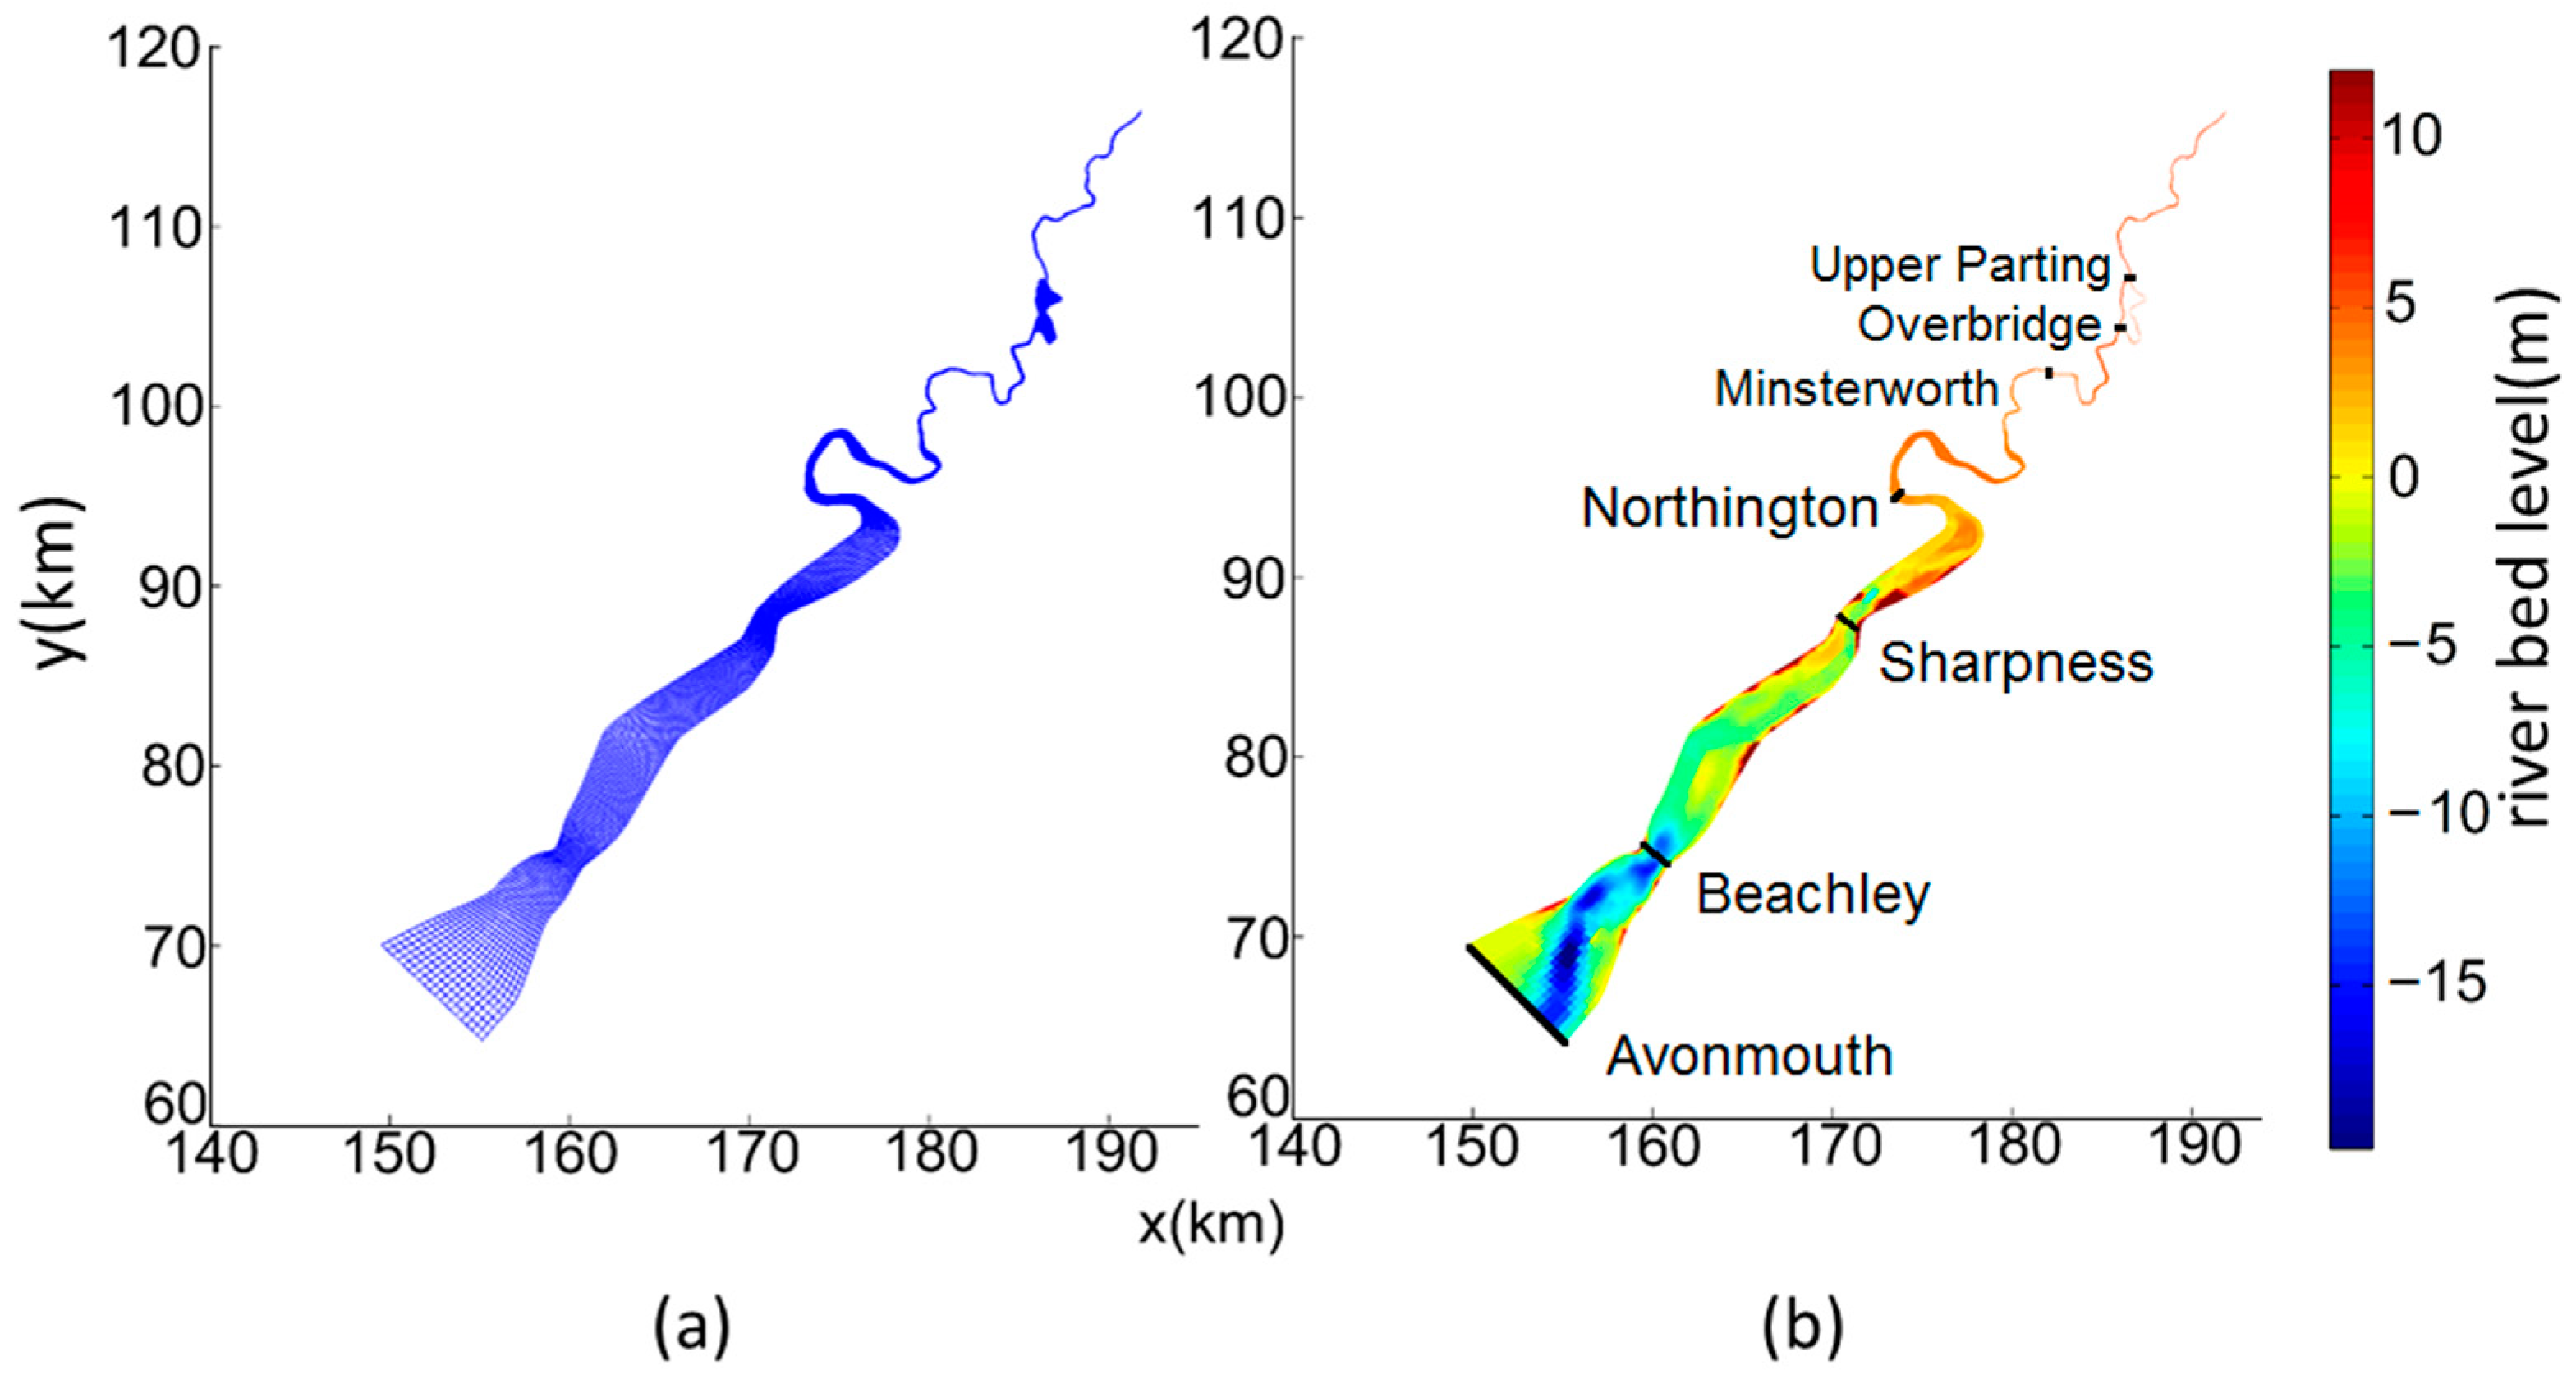
2.1. Study Site

The Severn Estuary, situated between England and Wales, stretches from the tidal limit of the River Severn near Gloucester to the Bristol Channel. Its distinctive funnel-shaped geometry amplifies tidal ranges as the estuary narrows inland, resulting in some of the highest tidal ranges globally—reaching up to 14 m during spring tides [22,28]. This unique tidal environment supports the formation of the Severn Bore, one of the most prominent tidal bores in the world.
The Severn Bore forms upstream of Sharpness and typically dissipates near the tidal limit at Gloucester. During significant tidal events, the bore can reach heights exceeding 2 m, travel at speeds of up to 20 km/h, and extend as far as 40 km inland. Its formation is governed by several factors, including the large tidal range, the estuary’s funnel-shaped geometry, and the river’s shallow, convergent channel with a rising riverbed [27].
This study focuses on the Severn Bore, utilizing a model domain extending approximately 85 km from Avonmouth at the seaward boundary to Deerhurst at the landward boundary (Figure 1). This domain encompasses the critical regions where the bore forms and propagates, providing a framework for analyzing its hydrodynamic behavior and the impacts of tidal energy developments in the estuary.

2.2. Model Establishment

In this study, we employed the Delft3D model suite developed by Deltares to simulate the propagation of the Severn Bore in the Severn Estuary and the downstream reach of the River Severn. The hydrodynamic module, Delft3D-FLOW, is a multi-dimensional simulation program that solves the shallow water equations. In Cartesian coordinates, the momentum equations and the continuity equation can be expressed as follows:
u t + u u x + v u y + ω H u σ f v = 1 ρ P u + v H 2 u x 2 + 2 u y 2 + 1 H 2 σ v V u σ
v t + u v x + v v y + ω H v σ + f u = 1 ρ P v + v H 2 v x 2 + 2 v y 2 + 1 H 2 σ v V v σ
ω σ = η t x H     u d σ + y H     v d σ ,
where u , v , and ω are components of flow velocity in the horizontal x , y and vertical σ directions; H and η are total water depth and free surface elevation; f is the Coriolis parameter; ρ is flow density; P u and P v are the pressure gradients; and v H and v V are the horizontal and vertical eddy viscosity coefficients.
Equations are reformulated and a curvilinear mesh is mapped from physical to computational space by numerical grid transformation. Arakawa C-grid and an Alternating Direction Implicit method are applied for space and temporal discretization.
A curvilinear grid was established for the study area as shown in Figure 2a. The grid was designed with 3382 × 21 grid cells. For three dimensional models, 10 σ -layers are employed in the vertical direction. The model features a variable resolution. Near Avonmouth, the grid resolution is relatively coarse, with cell dimensions up to 400 m, suitable for capturing the broader estuarine flows. Beyond Sharpness, towards Deerhurst, the cell size decreases progressively to approximately 5 m in the reach where the Severn Bore is most prominent. This refinement is essential for accurately capturing the complex bathymetry and hydrodynamic features of the estuary critical to the bore formation and propagation. Although a typical bore front extends much less than 5 m, applying a finer mesh size throughout the entire domain is impractical due to the computational cost. Consequently, a localized 5 m mesh size in flow direction was utilized to accurately capture the free surface profile.
Bathymetric data were sourced from interpolation of the bathymetric data from the digitized Admiralty Charts, ensuring accurate representation of the estuarine and riverine topography (Figure 2b). The bathymetric data were interpolated onto the computational grid to define the depth at each grid point. Due to significant depth gradients and complex natural features, the bathymetry was smoothed using the QUICKIN data interpolation module within Delft3D to reduce numerical instabilities. In the narrower upstream sections, starting downstream of Northington, the bathymetry was simplified by assigning a uniform bed depth across cross-sections. This simplification reduces spurious oscillations arising from steep gradients, thereby enhancing model stability without compromising the accuracy of the hydrodynamic simulation.
Simulations were conducted using three different mesh sizes: 5072 × 21 (fine), 3382 × 21 (medium), and 1692 × 11 (coarse). The simulated water levels were compared with measured water levels at the Northington gauging station on 10 September 2023, as shown in Figure 3. The results from all three mesh sizes demonstrated close agreement with the observed data, indicating that the model achieved mesh convergence. The use of a finer mesh did not result in any noticeable improvement in model performance, confirming that the medium-resolution mesh (3382 × 21) is sufficient for accurately capturing the hydrodynamic processes while balancing computational efficiency.
At the downstream boundary, water levels were prescribed using measurements from the Avonmouth tide-gauge station, provided by the Permanent Service for Mean water level [29]. These measurements incorporated the semi-diurnal tidal variations characteristic of the Severn Estuary. At the upstream boundary, the average discharge was calibrated and set to 65 m3/s to reflect typical river flow conditions.
The wall roughness was configured as free-slip, assuming no shear stress at the lateral boundaries. For bed roughness, calibration was performed by comparing simulated water levels and tidal ranges along the estuary with observed river level data. A uniform Manning roughness coefficient of 0.0155 yielded the closest agreement with observations, indicating that this value effectively captures the frictional characteristics of the estuary bed and ensures accurate simulation of hydrodynamic processes.

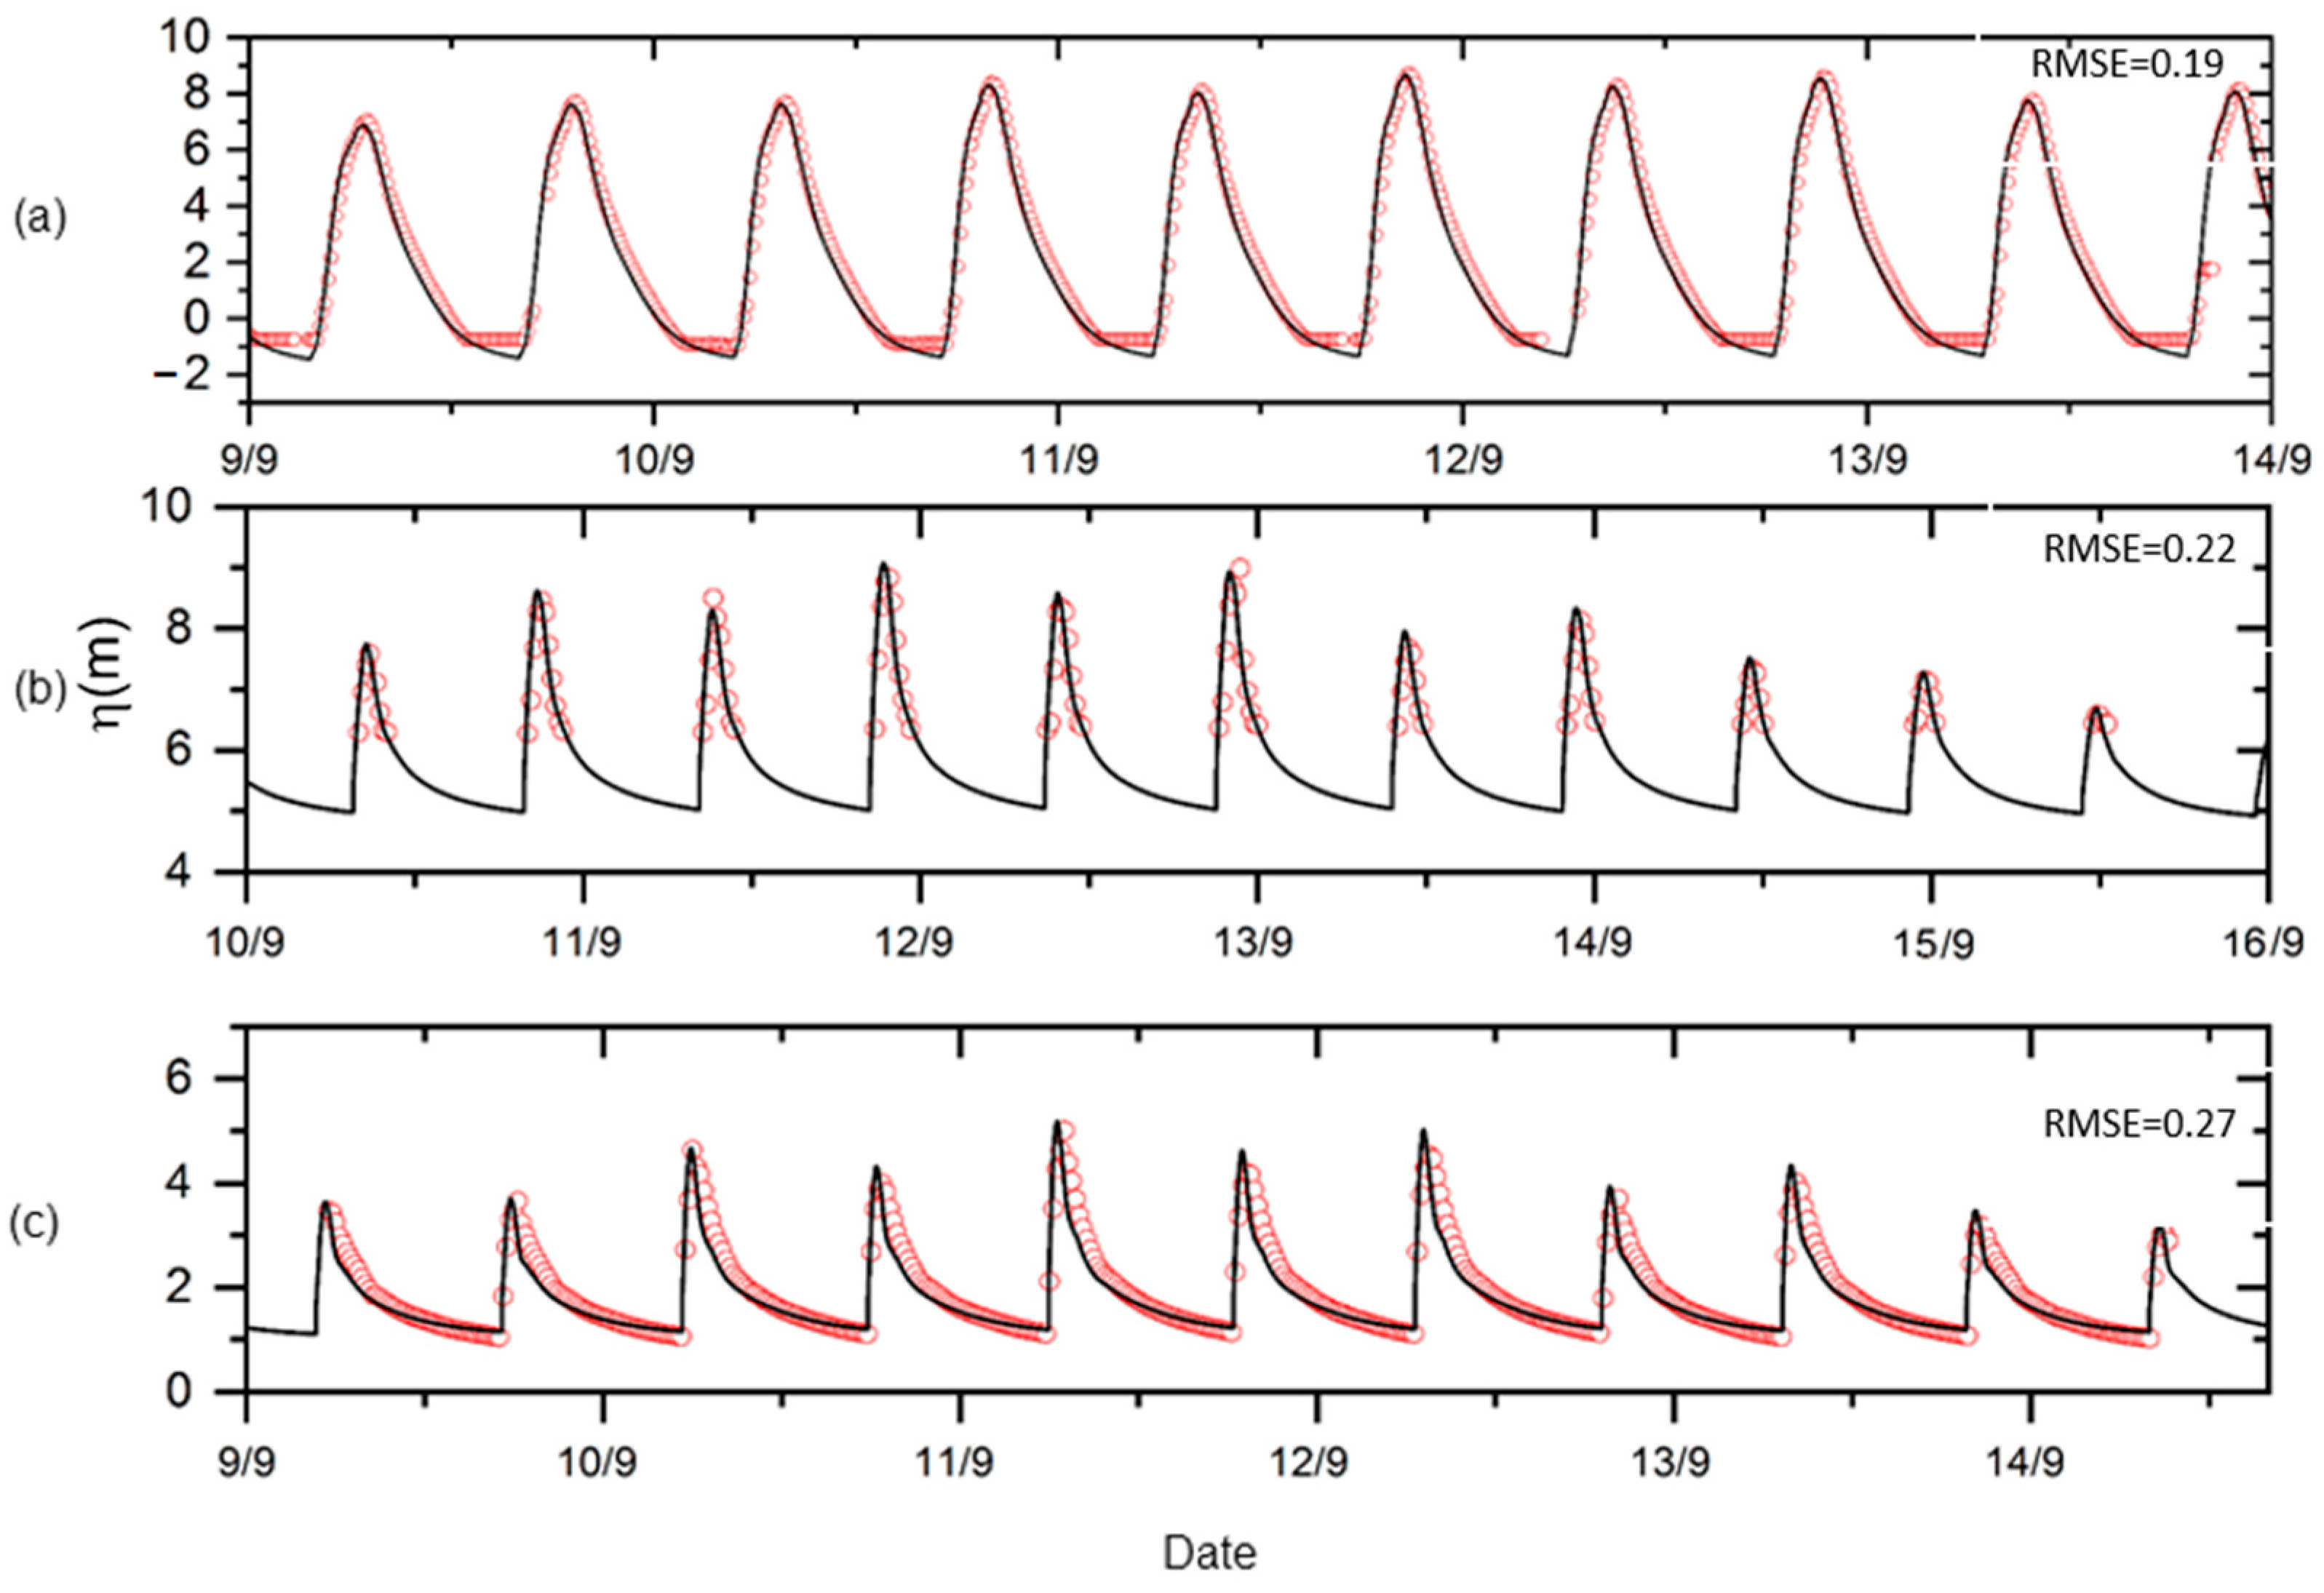
2.3. Model Validation

The model was validated against water level measurements collected by the Environment Agency at gauging stations along the River Severn [30]. Three stations—Sharpness, Epney, and Minsterworth—were selected for comparison, as they are evenly distributed along the reach where the tidal bore occurs. Water level measurements at these stations, recorded relative to the riverbed, were sampled at a frequency of 15 measurements per hour.
Figure 4 compares the predicted and observed water levels, converted to meters Above Ordnance Datum (mAOD), during the period from 9 September 2022 to 16 September 2022. The model’s predictions showed strong agreement with the measured data, as evidenced by the low values of root mean square error (RMSE) reported in the figure. The model accurately captured the distortion of the tidal wave as it propagated upstream, including the pronounced ebb-flood asymmetry characteristic of tidal bores.
Figure 5 illustrates the progressive distortion of the tidal wave as it propagates upstream along the River Severn in case 1. Near the estuary mouth at Avonmouth, the tidal range is relatively large, likely due to the combined effects of resonance [24] and the estuary’s funnel-shaped geometry, which amplify the tidal wave. As the tidal wave moves inland, its waveform becomes increasingly asymmetric, transitioning from a nearly sinusoidal shape at Avonmouth to a significantly skewed profile in upstream locations. This asymmetry is characterized by a shorter flood duration and a longer ebb duration, indicating a much stronger flood current compared to the ebb current—a phenomenon known as flood dominance. Flood dominance is a critical factor for the formation of tidal bores [31]. In the upstream section, tidal attenuation becomes apparent as the tidal amplitude diminishes, driven by energy dissipation caused by bottom friction and the channel’s constricted geometry. A secondary, smaller peak observed at Over Bridge and Upper Parting is likely a result of wave reflection, where the tidal wave interacts with obstacles such as the Maisemore Weir. This interaction leads to the superposition of the incoming and reflected waves, further distorting the tidal waveform.
Figure 6 illustrates the free surface profile along the channel at an interval of 30 min on 12 September 2022. At approximately 40 km from the downstream boundary, near Northington, an abrupt water level rise is observed as the flood tide front arrives. This location can be identified as the formation site of the tidal bore. The bore subsequently propagates upstream, reaching Gloucester in approximately two and a half hours, consistent with previous observations [32]. As the bore progresses further upstream, its height gradually diminishes, primarily due to frictional effects along the channel bed and banks. This highlights the role of energy dissipation in moderating the bore’s intensity during its propagation.
Figure 7 depicts the vertical profile of the horizontal velocity along the river channel’s middle line at t = 17:55 on 12 September 2022. Before the bore arrives, the water level is below 5 m, and the flow velocity is approximately 0.5 m/s, moving downstream. Upon the bore’s arrival, the water level rapidly rises to over 5.5 m, and the flow velocity at the bore front increases to more than 1.5 m/s. Behind the bore front, the velocity continues to increase, exceeding 3.5 m/s at its maximum.
These results are consistent with previous observations, which highlight the rise in water levels and acceleration of flow velocities following the passage of a tidal bore [33]. Additionally, a velocity gradient is observed, with velocities decreasing from the surface toward the riverbed due to frictional dissipation at the bottom. This highlights the significant impact of friction on velocity distribution and energy dissipation in the channel.
Overall, the model demonstrated reasonable accuracy in simulating the bore phenomenon, validating its capability to describe tidal bores in detail. These results confirm that the shallow water equations-based approach offers a cost-effective and reliable tool for studying tidal bores and associated hydrodynamic processes.

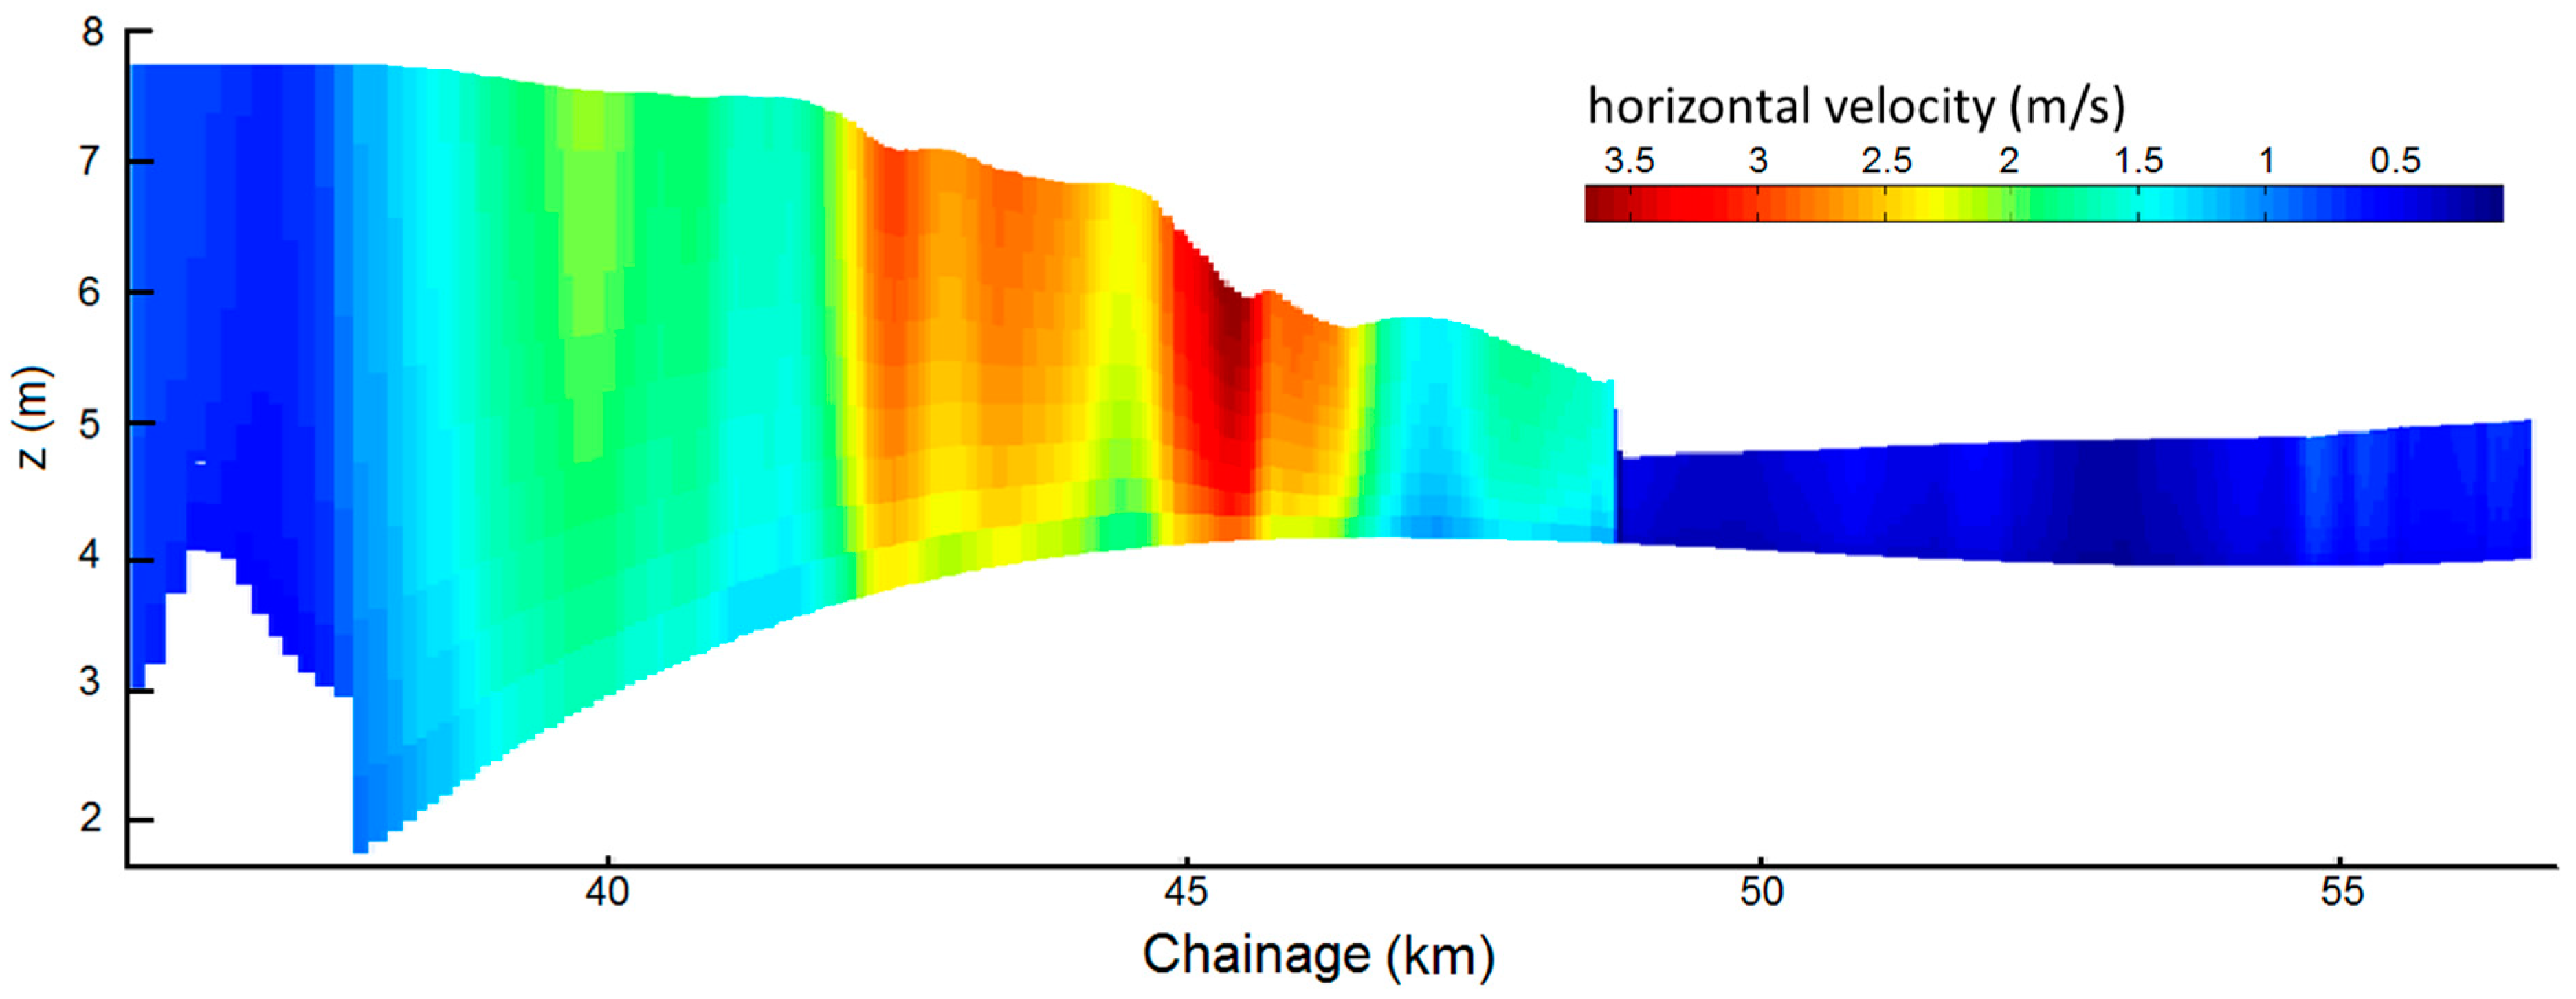
2.4. Tidal Bore Formation and Intensity

Tidal range is widely recognized as a primary factor in the formation of tidal bores [5]. Chanson et al. [2] observed that tidal bores typically develop when the tidal range exceeds 4–6 m. However, field observations reveal inconsistencies in bore formation, with some rivers experiencing bores at lower tidal ranges, while others with significantly larger ranges do not exhibit bore formation [34].
An alternative criterion for tidal bore formation is the maximum elevation slope, proposed by Bonneton et al. [31] based on field surveys. It is often formulated as follows:
α m a x = max η x , t x ,
where α m a x is the maximum elevation slope. It has been shown that a well-formed bore occurs when α m a x exceeds 10−3 [17,34]. While neither criterion has a strong theoretical foundation, the α m a x criterion has proven to be effective in identifying tidal bore inception and was adopted in this study.
The Froude number (Fr) is a key dimensionless parameter used to characterize the strength and nature of tidal bores. Field measurements have established a relationship between the Froude number and bore type [2,35]. A tidal bore forms when Fr > 1. For 1 < Fr < 1.8, the bore is undular, featuring a leading wave followed by a train of smaller waves. When Fr > 1.8, the bore becomes a breaking bore, with a sharp front and intense turbulence (Figure 3).
Table 1 summarizes the observed bore types and their corresponding Froude numbers, demonstrating consistency with the established relationship.
The Froude number is calculated as the ratio of the wave’s propagation speed relative to the flow to the speed of shallow water waves under still conditions, often formulated as:
F r = C + u g h ,
where C is velocity of the bore, g is gravitational acceleration, and h is the depth of water immediately in front of the wave. For a rectangular channel in absence of friction, relationship between geometry of the wetted cross-sections and Froude number is derived from the continuity and momentum principles [35]:
F r = 1 + 1.5 Z H + Z 2 2 H 2 ,
where Z is the height of the bore.
These criteria and characterizations provide valuable tools for analyzing tidal bore dynamics and their dependence on hydrodynamic conditions.

3. Results

3.1. Scenario Definition

The validated model was employed to examine how changes in hydrodynamic parameters, induced by tidal energy development, influence the propagation of the Severn Bore. As outlined in previous chapters, tidal range and tidal stream schemes have been proposed for the Severn Estuary. Several studies have predicted the potential effects of these schemes on the estuary’s hydrodynamics [22]. These investigations indicate that such projects can alter both tidal amplitude and mean water level, affecting regions both upstream and downstream of the scheme locations. For instance, barrage options are expected to reduce maximum water levels upstream by as much as 1.5 m.
Based on these findings and the mechanisms driving tidal bore formation, three key factors—downstream tidal amplitude, mean water level, and river discharge—have been identified as critical to the Severn Bore’s propagation. These parameters were subjected to sensitivity analyses using the scenarios defined in Table 2, providing insights into how tidal energy developments may impact the dynamics and formation of the Severn Bore.
In tests 2–9, the downstream tidal amplitude at Avonmouth was varied, while all other simulation input conditions remained consistent with those used in the validation. The M2 tidal component was chosen as it dominates the resonance characteristics of estuarine systems, while the M4 tide, though capable of enhancing localized effects [25], has a relatively minor overall impact. Tests 10–17 examined the influence of the mean water level at Avonmouth, using two different downstream tidal amplitudes (4 m and 7 m) to investigate the individual impact of mean water level and its potential combined effect with tidal amplitude. Tests 18–22 focused on freshwater discharge, a critical factor influencing tidal bore propagation. The maximum discharge of 115 m3/s was chosen as it represents elevated but non-flooding conditions.
Figure 2b illustrates the locations of observation stations used in these tests, ensuring comprehensive coverage of the study domain for analyzing the Severn Bore dynamics under varying hydrodynamic conditions.

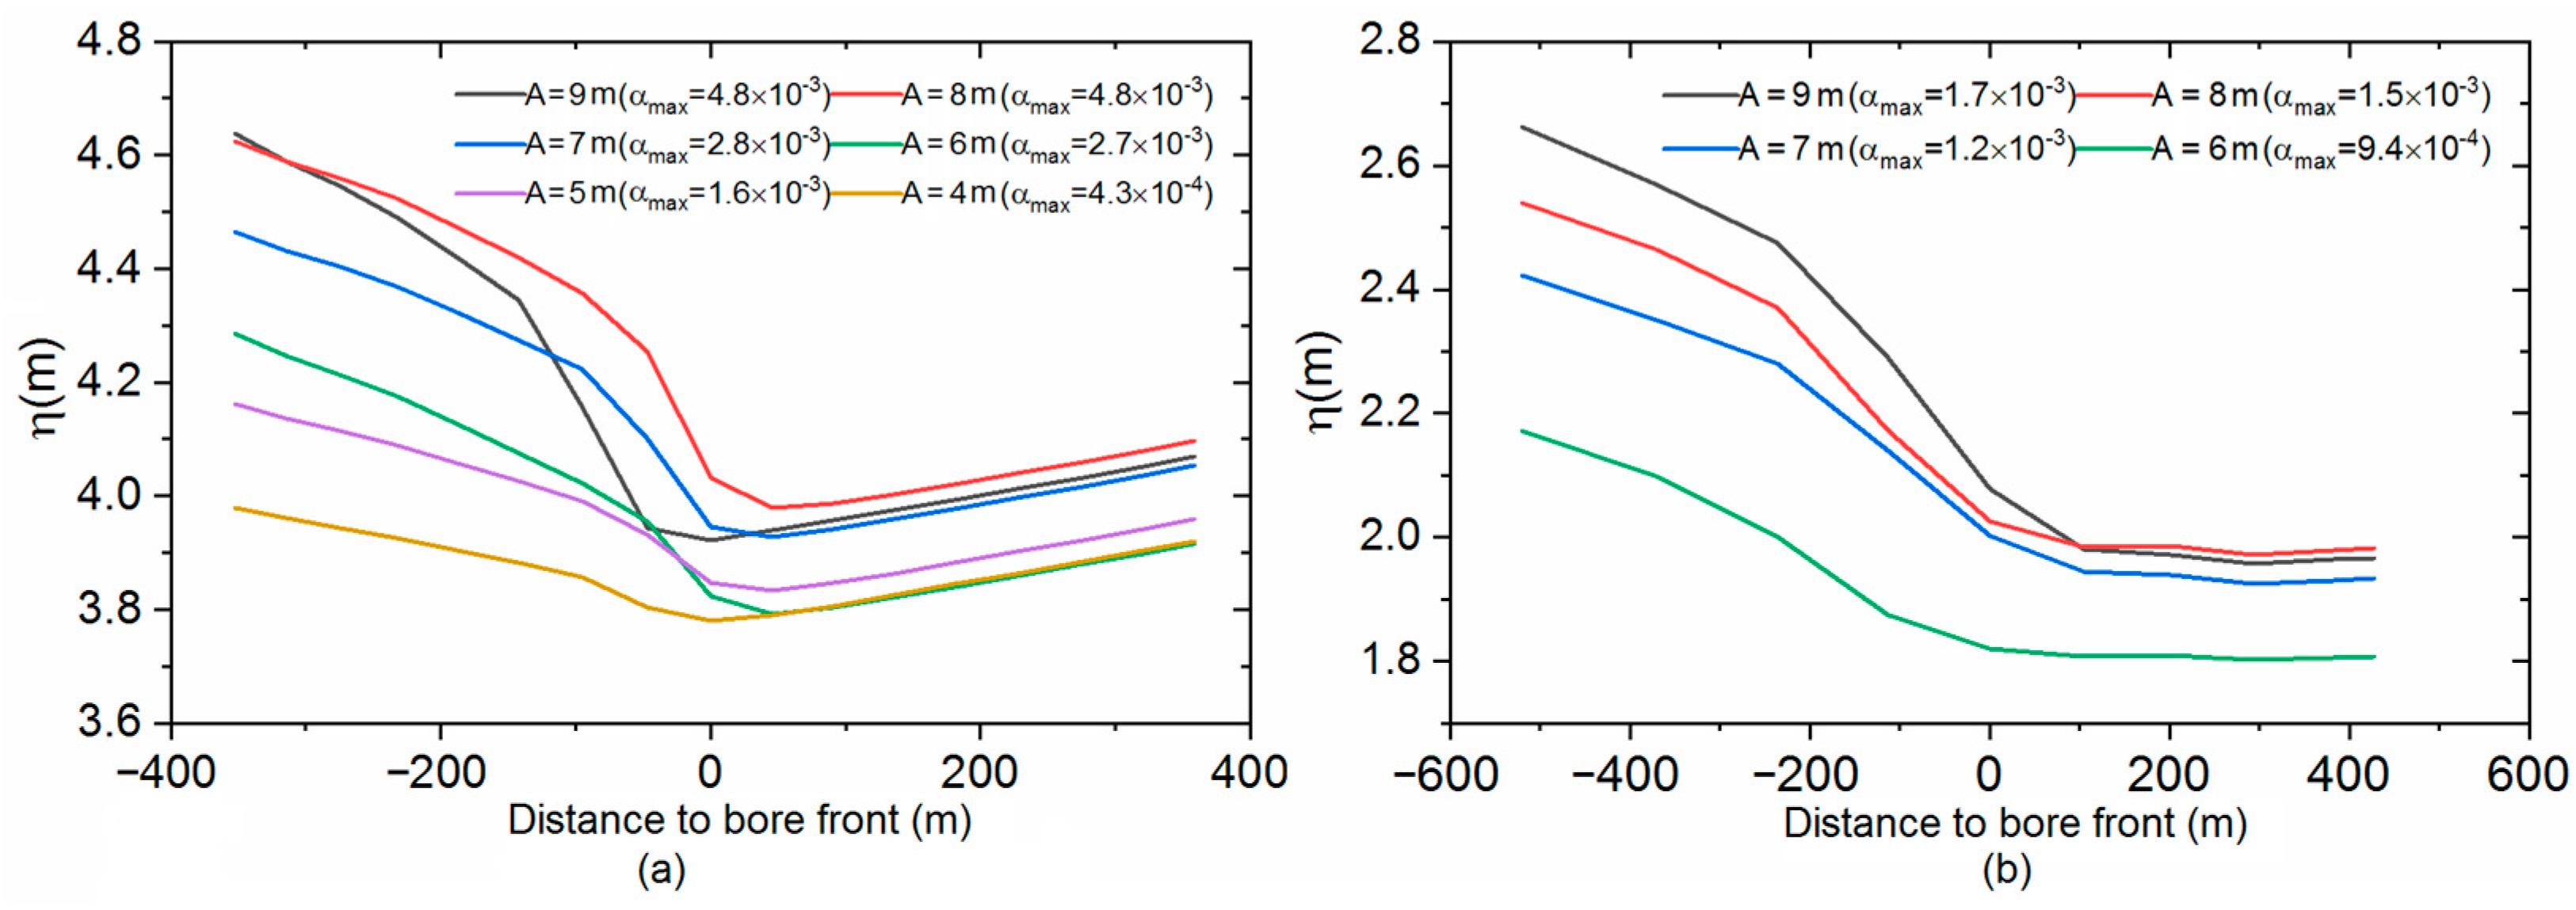
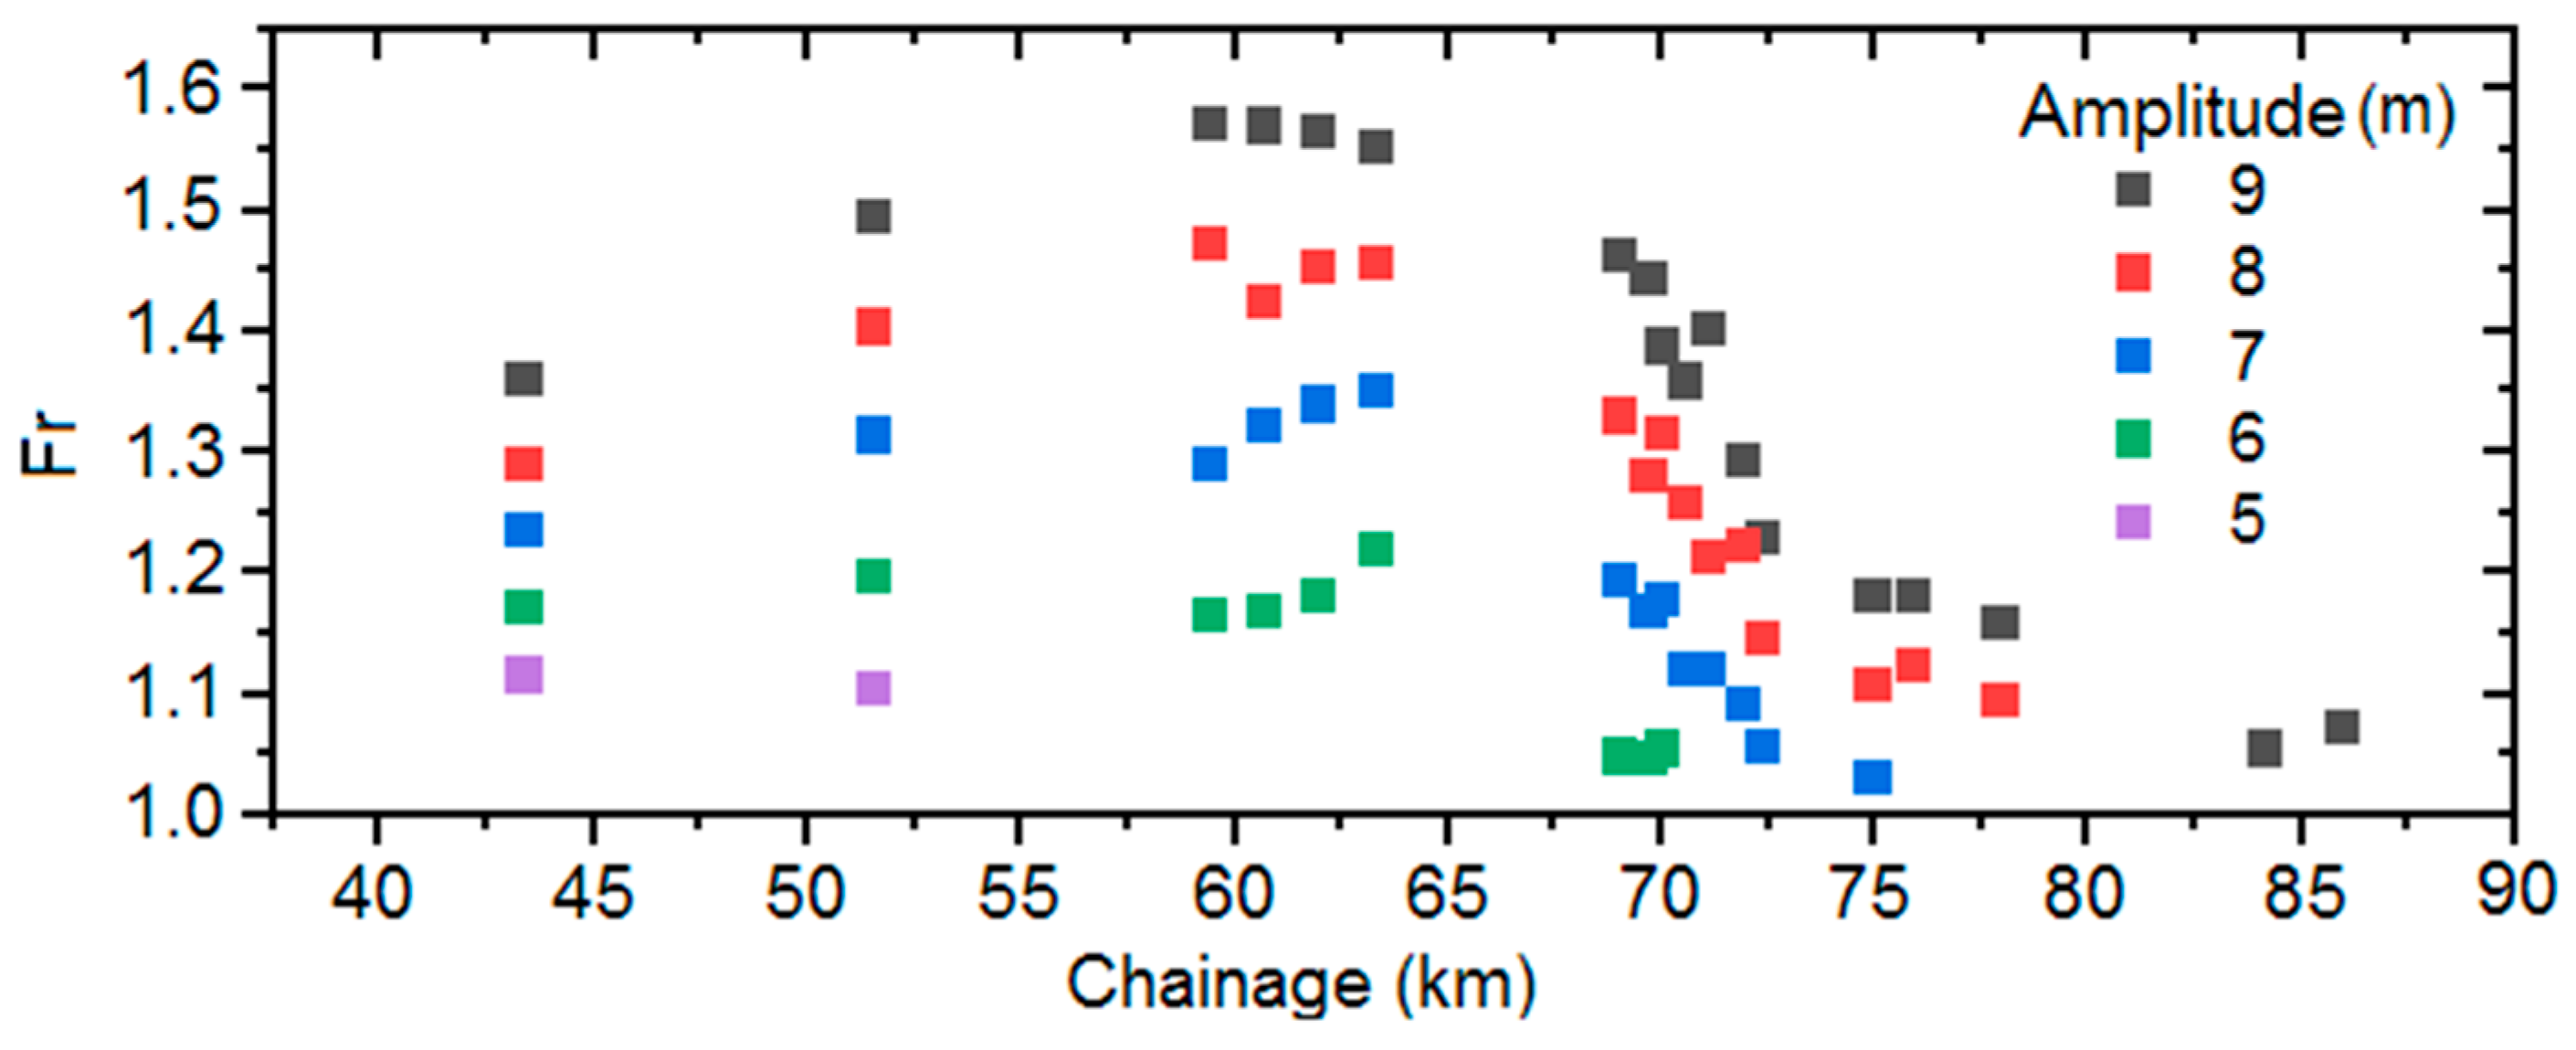
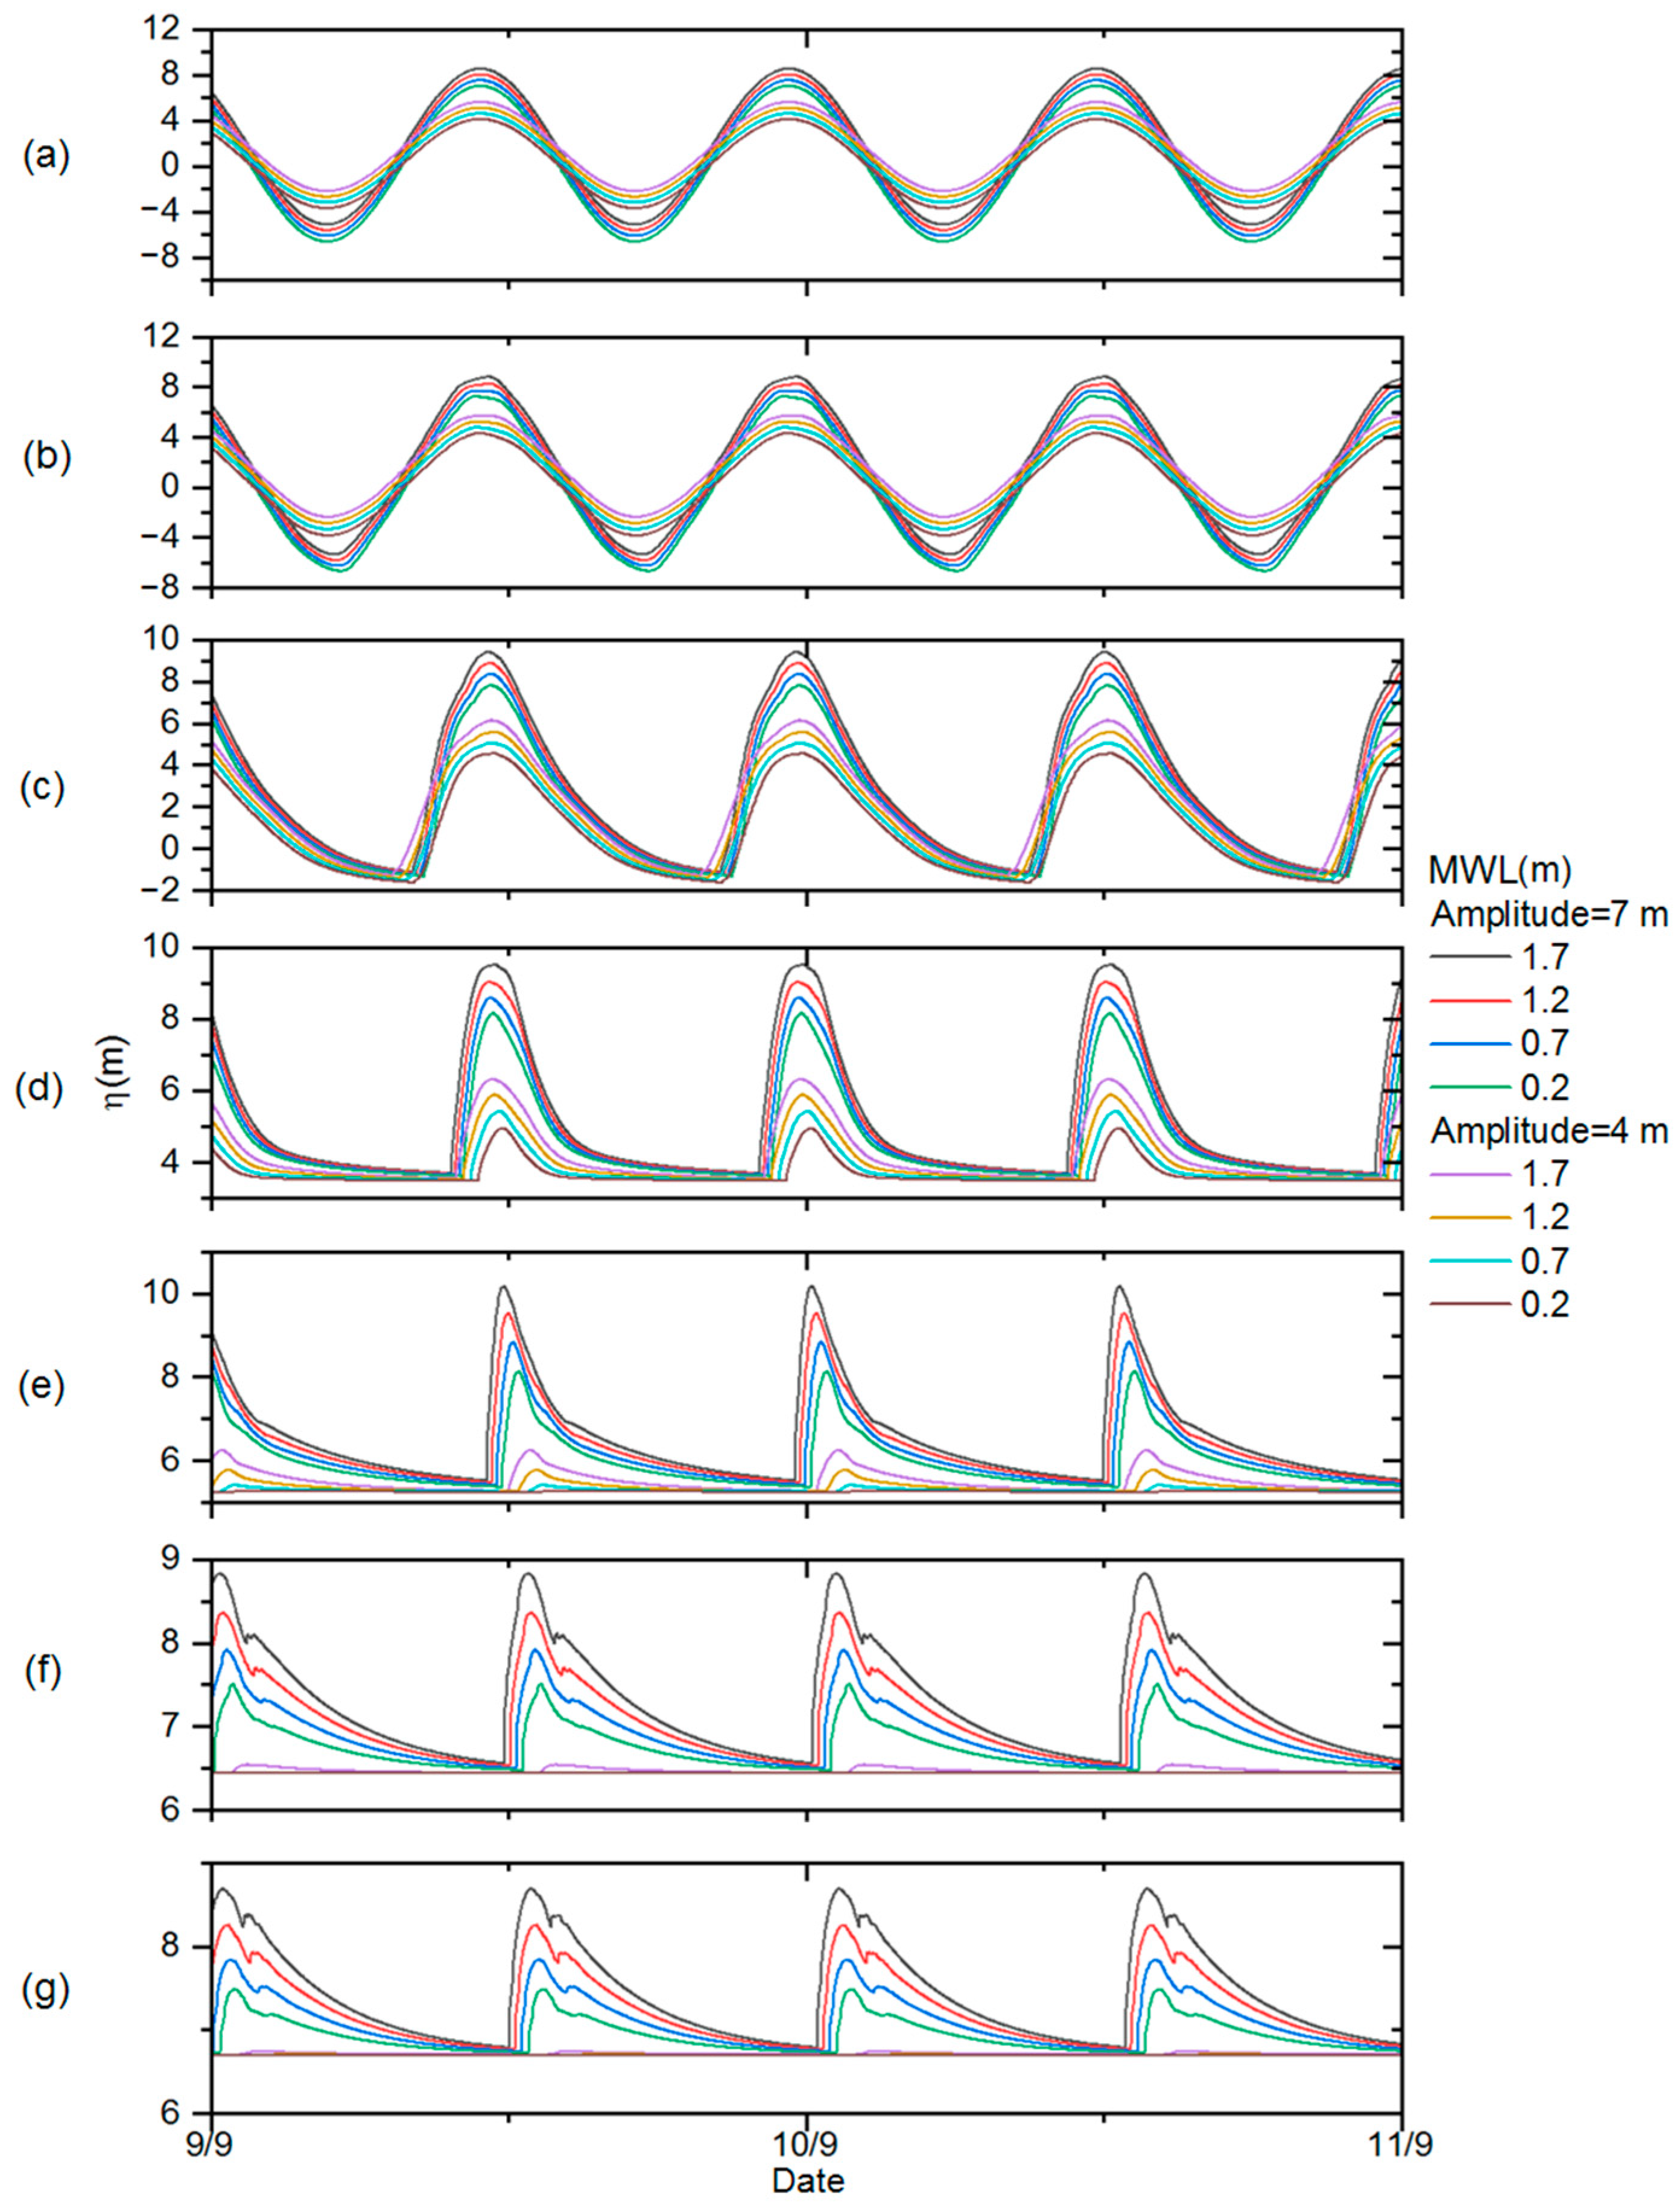
3.2. Influence of Downstream Tidal Amplitude

To examine the influence of tidal range on the inception and propagation of the Severn Bore, the downstream tidal amplitude at Avonmouth was varied in tests 2–9, while maintaining all other simulation input conditions consistent with those used during model validation. The average spring tidal range at Avonmouth is typically 12.2 m, with the highest spring tidal range reaching up to 14.0 m, corresponding to a tidal amplitude of 7 m at this location [24].
Figure 8 presents the maximum water level, minimum water level, and tidal range along the middle line of the River Severn, highlighting the impact of varying tidal amplitudes on the bore’s dynamics.
For scenarios with a downstream tidal amplitude of 7 m or greater, the maximum water levels show a gradual upward trend until Minsterworth (59.5 km), with a more pronounced increase observed between Northington (40.5 km) and Minsterworth. After peaking at Minsterworth, the maximum water levels decline, initially at a rapid rate and then more gradually. This trend becomes more evident with increasing downstream amplitudes. The significant narrowing of the river around Northington amplifies the tidal range, as the converging channel enhances wave energy. This amplification effect dominates other factors, such as frictional damping and freshwater discharge, until the tidal wave reaches Minsterworth. Beyond Minsterworth, where the channel width stabilizes, damping effects become dominant, causing a reduction in maximum water levels.
At Sharpness (28.4 km), the slope of the riverbed causes the low tide to intersect the riverbed, exposing tidal flats during low tide. Beyond Sharpness, the minimum water level is governed exclusively by upstream river discharge.
Figure 8c illustrates a general decreasing trend in tidal range with some fluctuations as the tidal wave ascends the riverbed slope upstream. This reduction is attributed to the combined effects of the rising riverbed and frictional dissipation from the riverbed and banks. River sections with amplified tidal ranges are associated with converging channels, where topographic convergence temporarily counteracts frictional dissipation. The tidal range diminishes to zero at the tidal limit, marking the furthest upstream point influenced by the tide, where tidal energy is fully dissipated.
For lower downstream amplitudes, reduced tidal energy limits the propagation of the tidal wave and the Severn Bore. A downstream amplitude of 2 m results in wave propagation up to approximately 40 km. Increasing the amplitude to 3 m extends propagation to 45 km. For amplitudes of 4 m and 5 m, the tidal wave diminishes after traveling 65 km and 75 km, respectively. With amplitudes of 6 m or greater, the Severn Bore reaches the furthest upstream point within the model domain, demonstrating the critical role of tidal amplitude in determining bore propagation and extent.
Figure 9 illustrates that larger downstream tidal amplitudes, and consequently greater tidal ranges, lead to more pronounced wave distortion as the tide propagates upstream. In subplots (a), (b), and (c), with smaller tidal amplitudes (e.g., 2–4 m), the tidal waveform remains relatively sinusoidal with minimal distortion. In contrast, as the tidal amplitude increases (e.g., 6–9 m in the later subplots), the waveform becomes increasingly nonlinear, characterized by steeper rises during the flood tide and more gradual declines during the ebb tide. This increasing skewness of the tidal waveform reflects flood dominance. Subplots (d) through (g) show that as the tidal range increases, the steepening during the flood phase becomes more pronounced, resulting in greater energy concentration during the flood tide.
Figure 10a demonstrates that a tidal bore forms at Northington when the tidal amplitude is equal to or greater than 5 m, while no bore develops for smaller amplitudes, as as αmax falls below 10−3. At a downstream tidal amplitude of 5 m, the tidal range at Beachley is 10.1 m, which broadly aligns with observations that indicate a tidal range of at least 11 m at Beachley is necessary for bore formation [27].
Figure 10b further indicates that a tidal bore forms 7.8 km upstream of Sharpness when the tidal amplitude is equal to or greater than 7 m, with no bore forming for smaller amplitudes as αmax falls below 10−3. This suggests that with a tidal range of 14 m at Avonmouth (corresponding to A = 7 m), a bore forms approximately 8 km upstream of Sharpness, consistent with observed bore formation regions [27]. However, a smaller tidal range would result in the bore forming further upstream or not forming at all. These findings highlight the critical role of downstream tidal amplitude in determining both the occurrence and location of tidal bore formation in the Severn Estuary.
To further analyze the effect of upstream tidal amplitude on tidal bore dynamics, the Froude number was calculated at stations with rectangular channel cross-sections, starting just upstream of Northington (Figure 11). This analysis provides insights into the relationship between tidal amplitude and bore strength along the river channel.
The Froude number for all scenarios remains below 1.8, indicating that the tidal bore is likely to be undular, consistent with observations. The Froude number increases from Northington to its peak near Minsterworth, after which it begins to decline further upstream. This pattern aligns with the previous results and spectator accounts that identify Minsterworth as the optimal location for viewing the Severn Bore. Beyond Minsterworth, damping effects become dominant, reducing the bore’s intensity as it propagates upstream.
The bore height at Minsterworth, as shown in Table 3, generally falls within the observed range of 0.2 to 1.2 m [27]. Bore intensity decreases with diminishing upstream tidal amplitude, and smaller tidal amplitudes lead to earlier dissipation of the bore during propagation. For a tidal amplitude of 5 m, the propagation and height of the Severn Bore are significantly constrained. Consequently, it can be concluded that a tidal amplitude smaller than 6 m at Avonmouth prevents the Severn Bore from forming. However, this conclusion is not absolute, as external factors, such as wind conditions and the state of the river, can also influence the formation and characteristics of the bore.

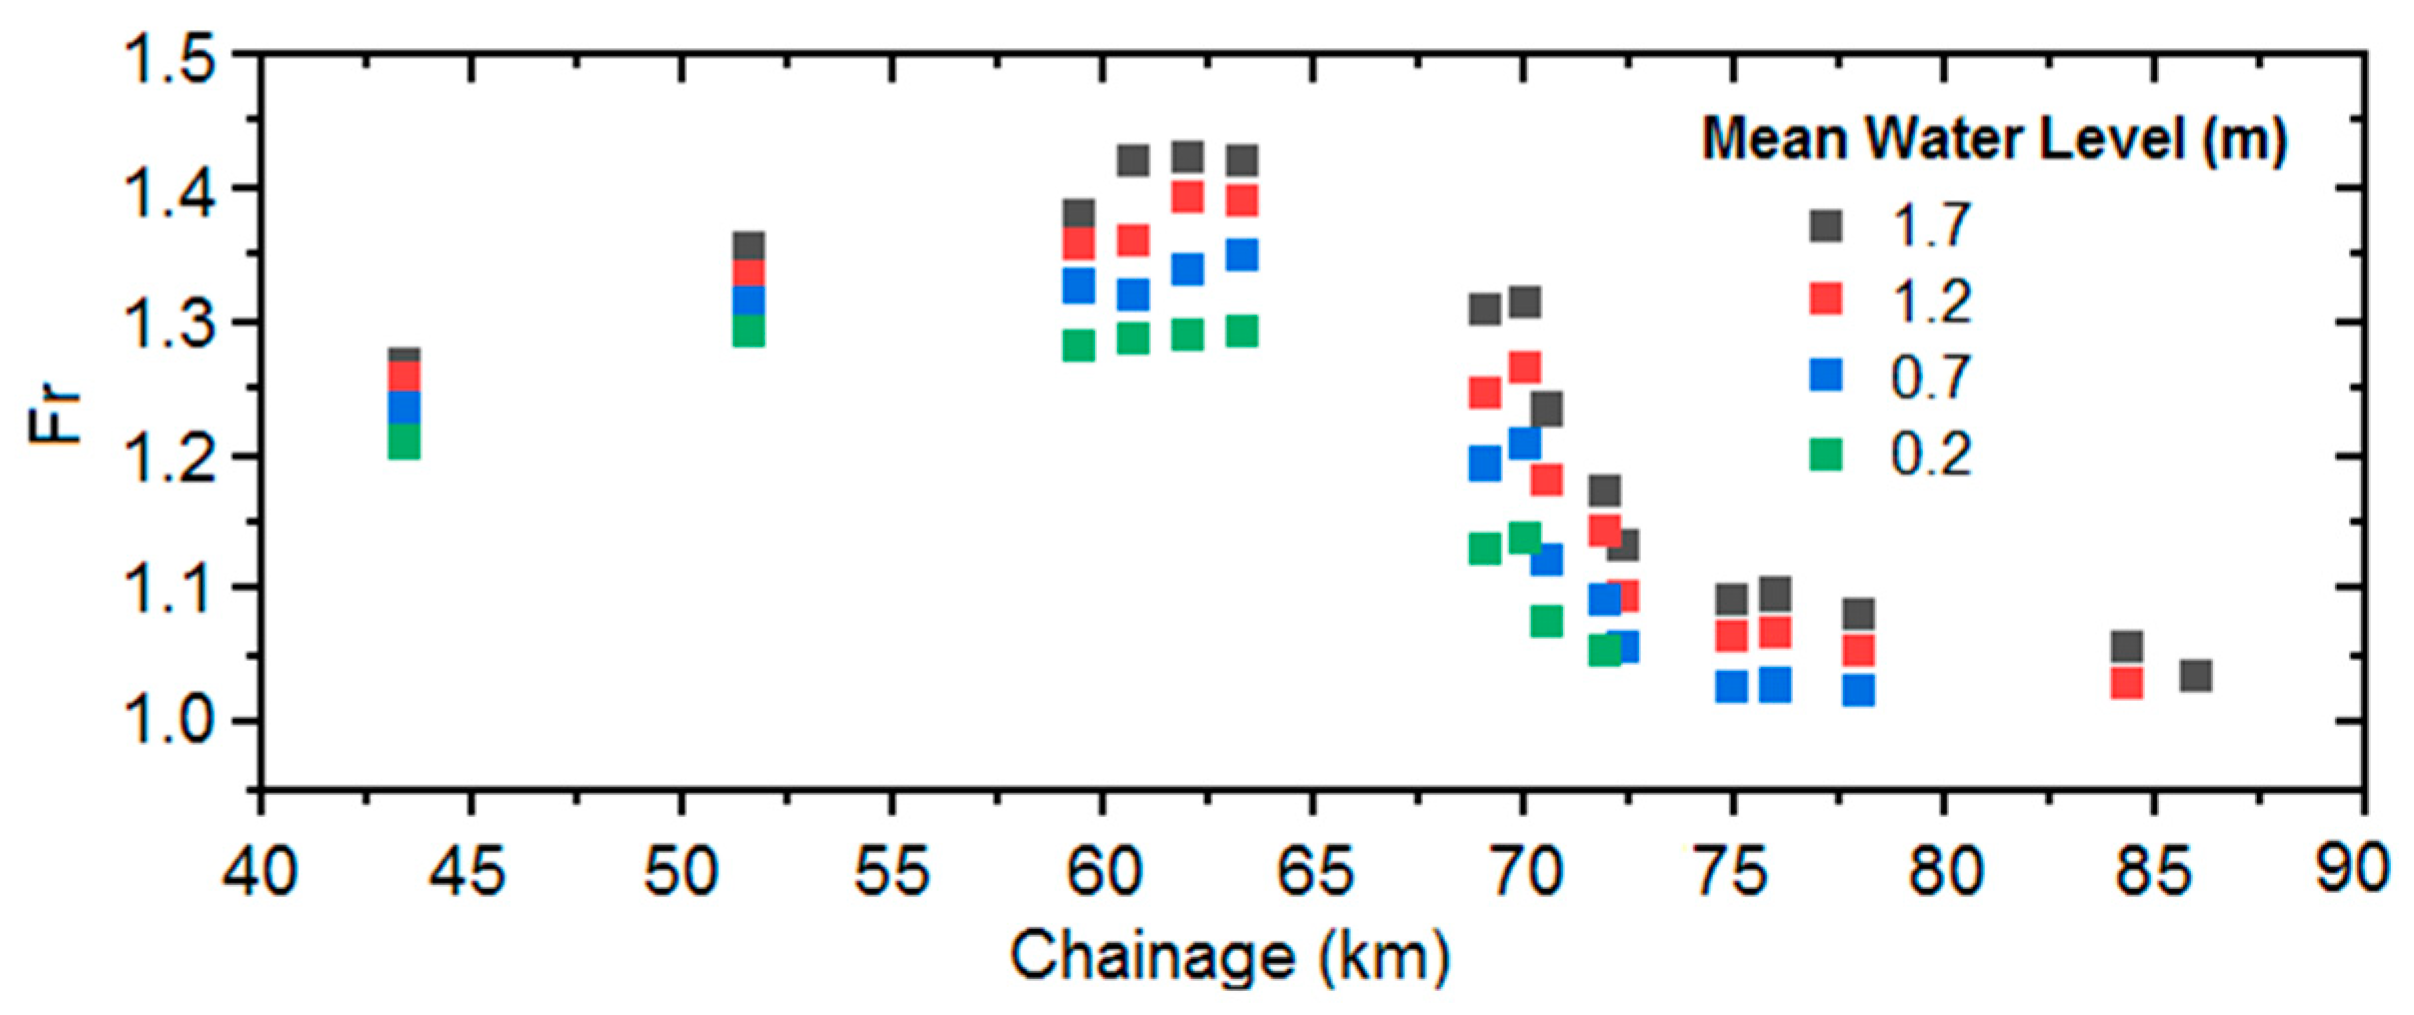
3.3. Influence of Downstream Mean Water Level

To examine the influence of the mean water level on the formation and propagation of the Severn Bore, the mean water level at Avonmouth was varied between 0.2 m and 1.7 m in tests 10–17. These simulations were conducted while keeping the discharge constant and using two different downstream tidal amplitudes—4 m and 7 m.
The results, presented in Figure 12, illustrate the impact of varying mean water level on the maximum water level, minimum water level, and tidal range along the middle line of the River Severn. These analyses provide insights into the combined effects of tidal amplitude and mean water level on the Severn Bore’s dynamics.
A comparison of Figure 12 with the results from previous analyses reveals that the trends are largely consistent. The impacts of increasing mean water level and tidal amplitude at Avonmouth on tidal range, maximum water level, and minimum water level follow similar patterns. This similarity is expected, as both a higher mean water level and increased tidal amplitude essentially elevate water levels and enhance tidal energy.
Raising the mean water level raises tidal curves across all locations, reflecting the direct influence of a higher baseline water level (Figure 13). This effect is particularly evident at downstream stations, such as Avonmouth and Beachley, where tidal forcing is most pronounced. A higher mean water level amplifies tidal wave asymmetry, particularly for larger tidal amplitudes. The flood phase becomes shorter and steeper, while the ebb phase elongates. This asymmetry intensifies at mid- and upstream locations beyond Northington, where the interaction between elevated water levels and the estuary’s geometry are more pronounced.
Higher mean water level also fosters conditions conducive to tidal bore formation, particularly in the estuary’s upper reaches. The steeper flood phase observed with elevated mean water level indicates that increased water levels amplify the energy of the tidal wave, thereby enhancing the likelihood and intensity of tidal bores. These findings underscore the critical role of mean water level in modulating estuarine hydrodynamics and tidal bore dynamics.
Figure 14 shows that a tidal bore forms at Northington and upstream of Sharpness, irrespective of the mean water level. The αmax values indicate that tidal bore intensity increases from Sharpness to Northington and exhibits a linear relationship with mean water level. Furthermore, a mean water level lower than 0.2 m could potentially shift the tidal bore’s formation to a location further upstream of Sharpness, highlighting the sensitivity of bore dynamics to changes in baseline water levels.
The Froude number along the river (Figure 15) exhibits a pattern consistent with previous analyzes. For all tested scenarios, Froude number values remain below 1.8, indicating that the tested changes in mean water level are insufficient to alter the tidal bore from an undular to a breaking nature. The tidal bore height at Minsterworth (Table 4) increases gradually with the rising mean water level, ranging from 0.3 m to 0.8 m as mean water level increases. These findings, in combination with the Froude number, confirm that tidal bore intensity changes linearly with mean water level.

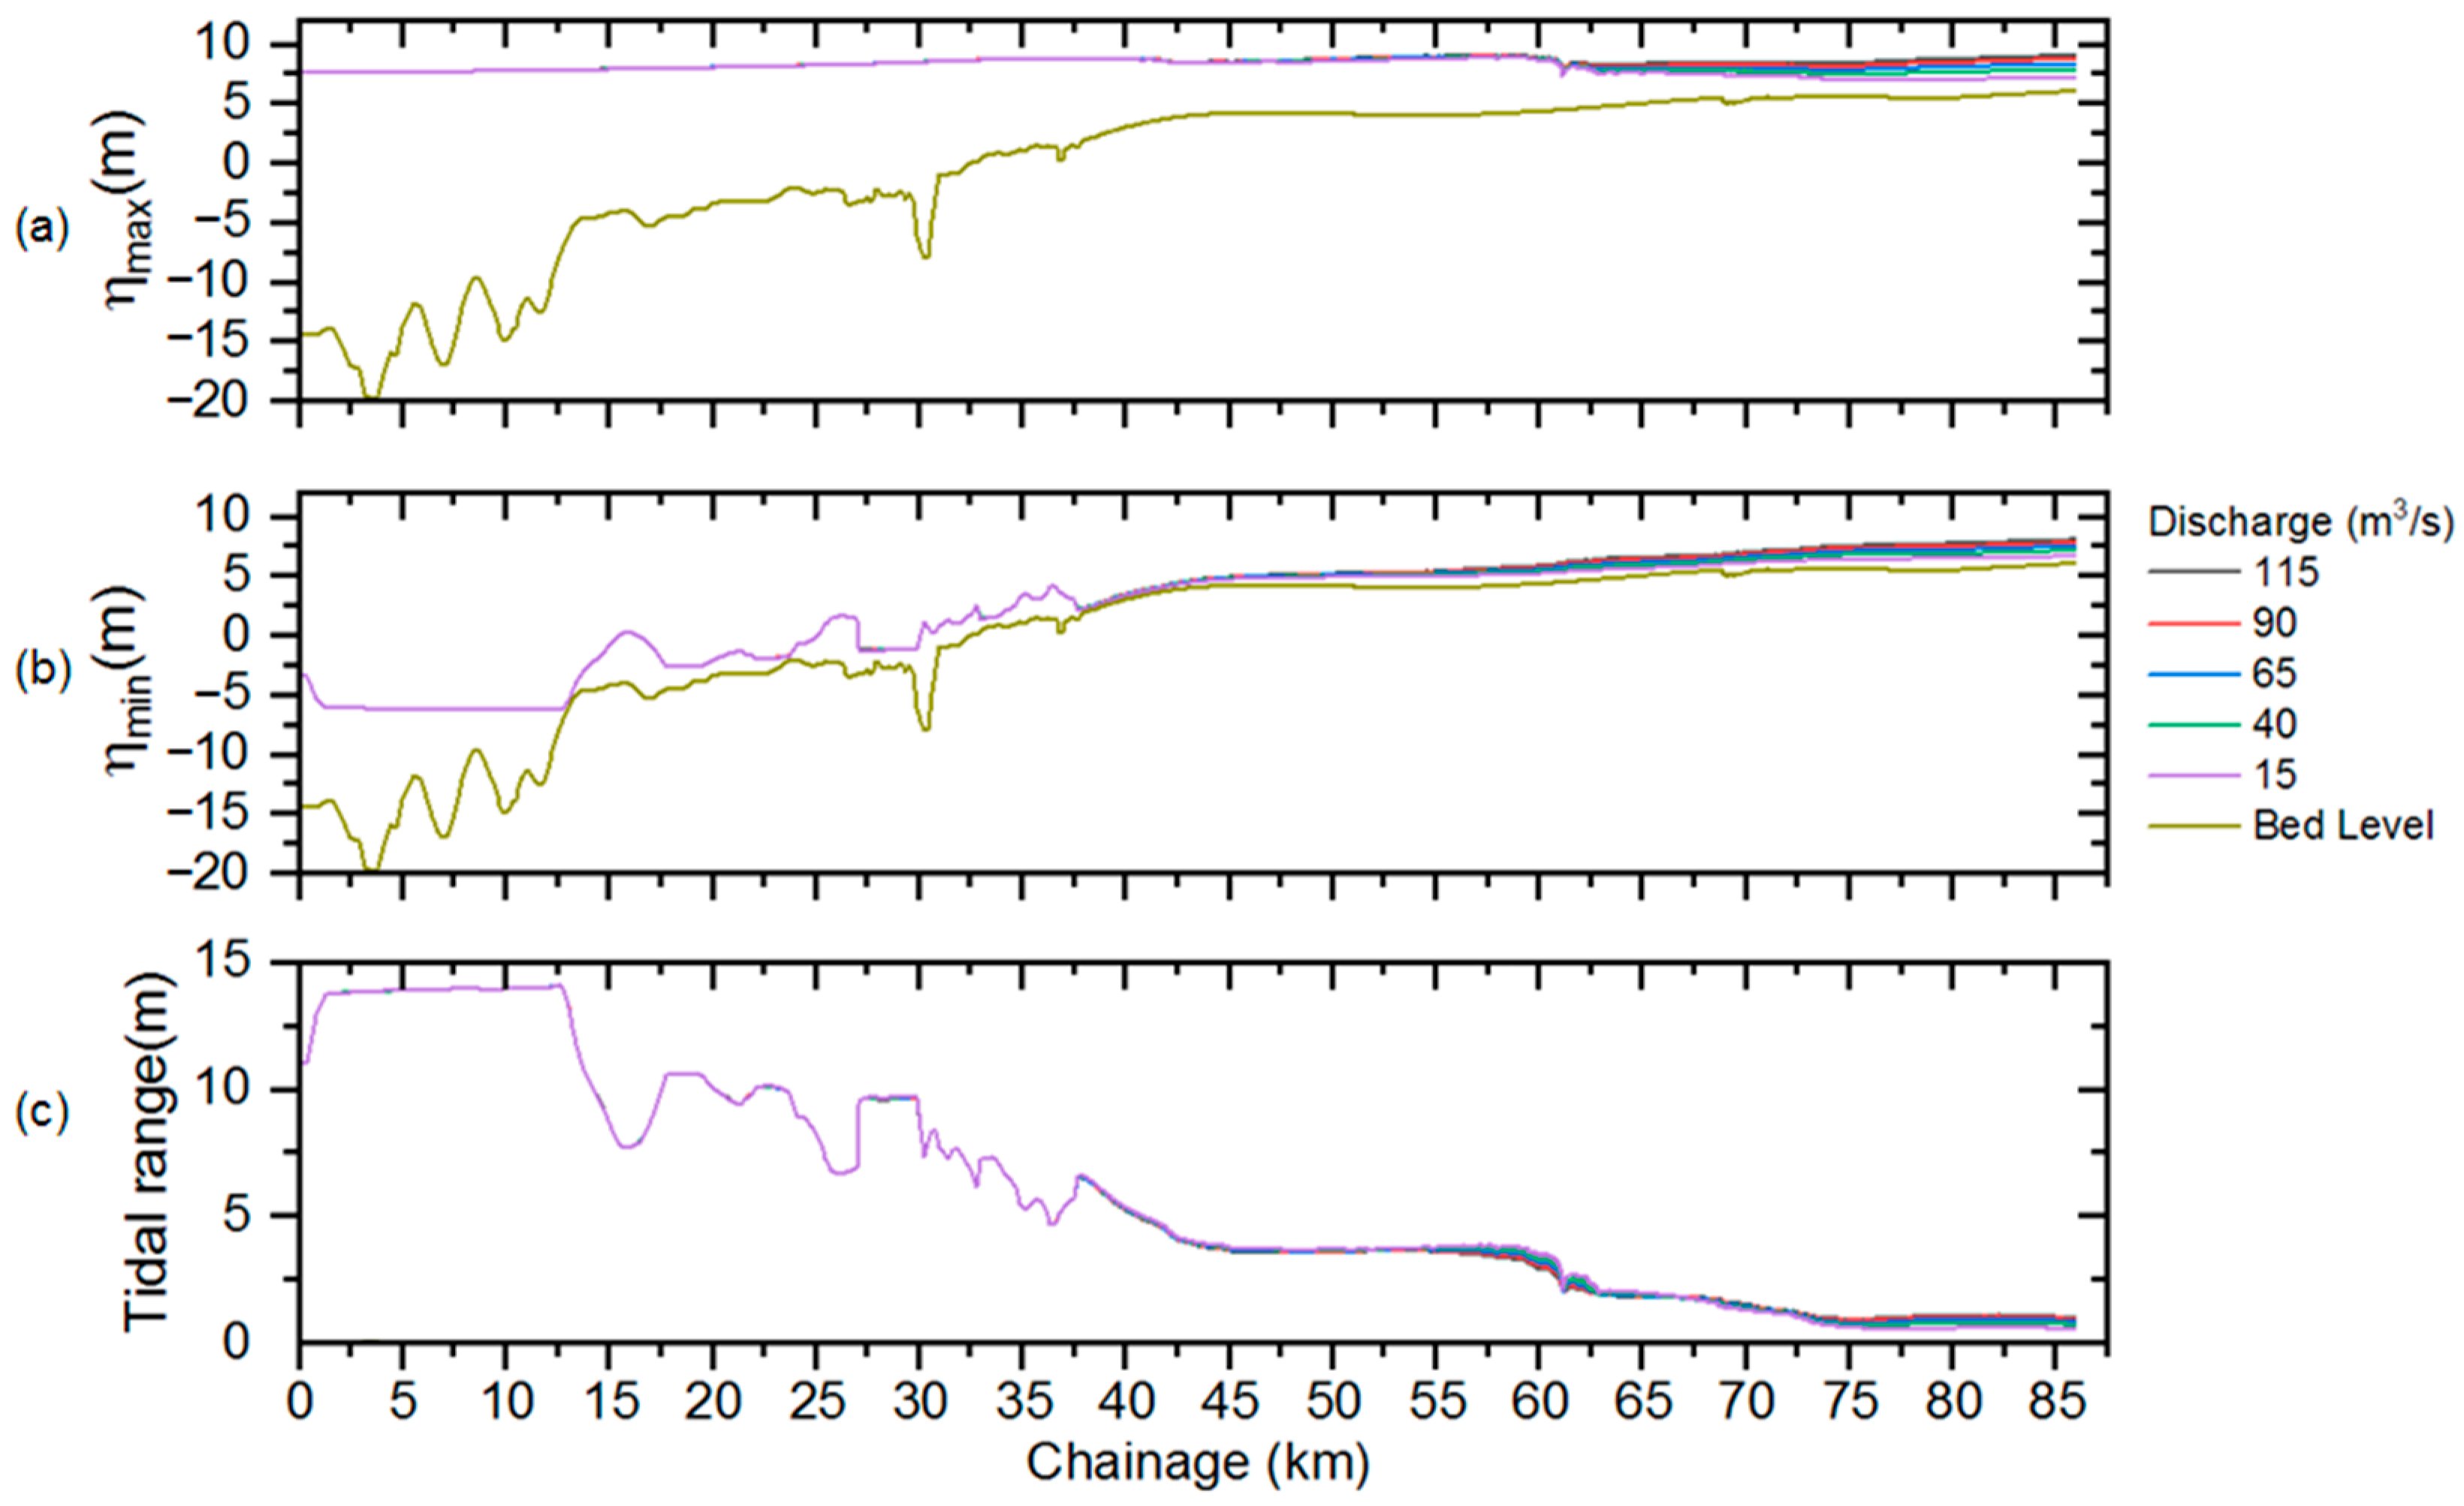
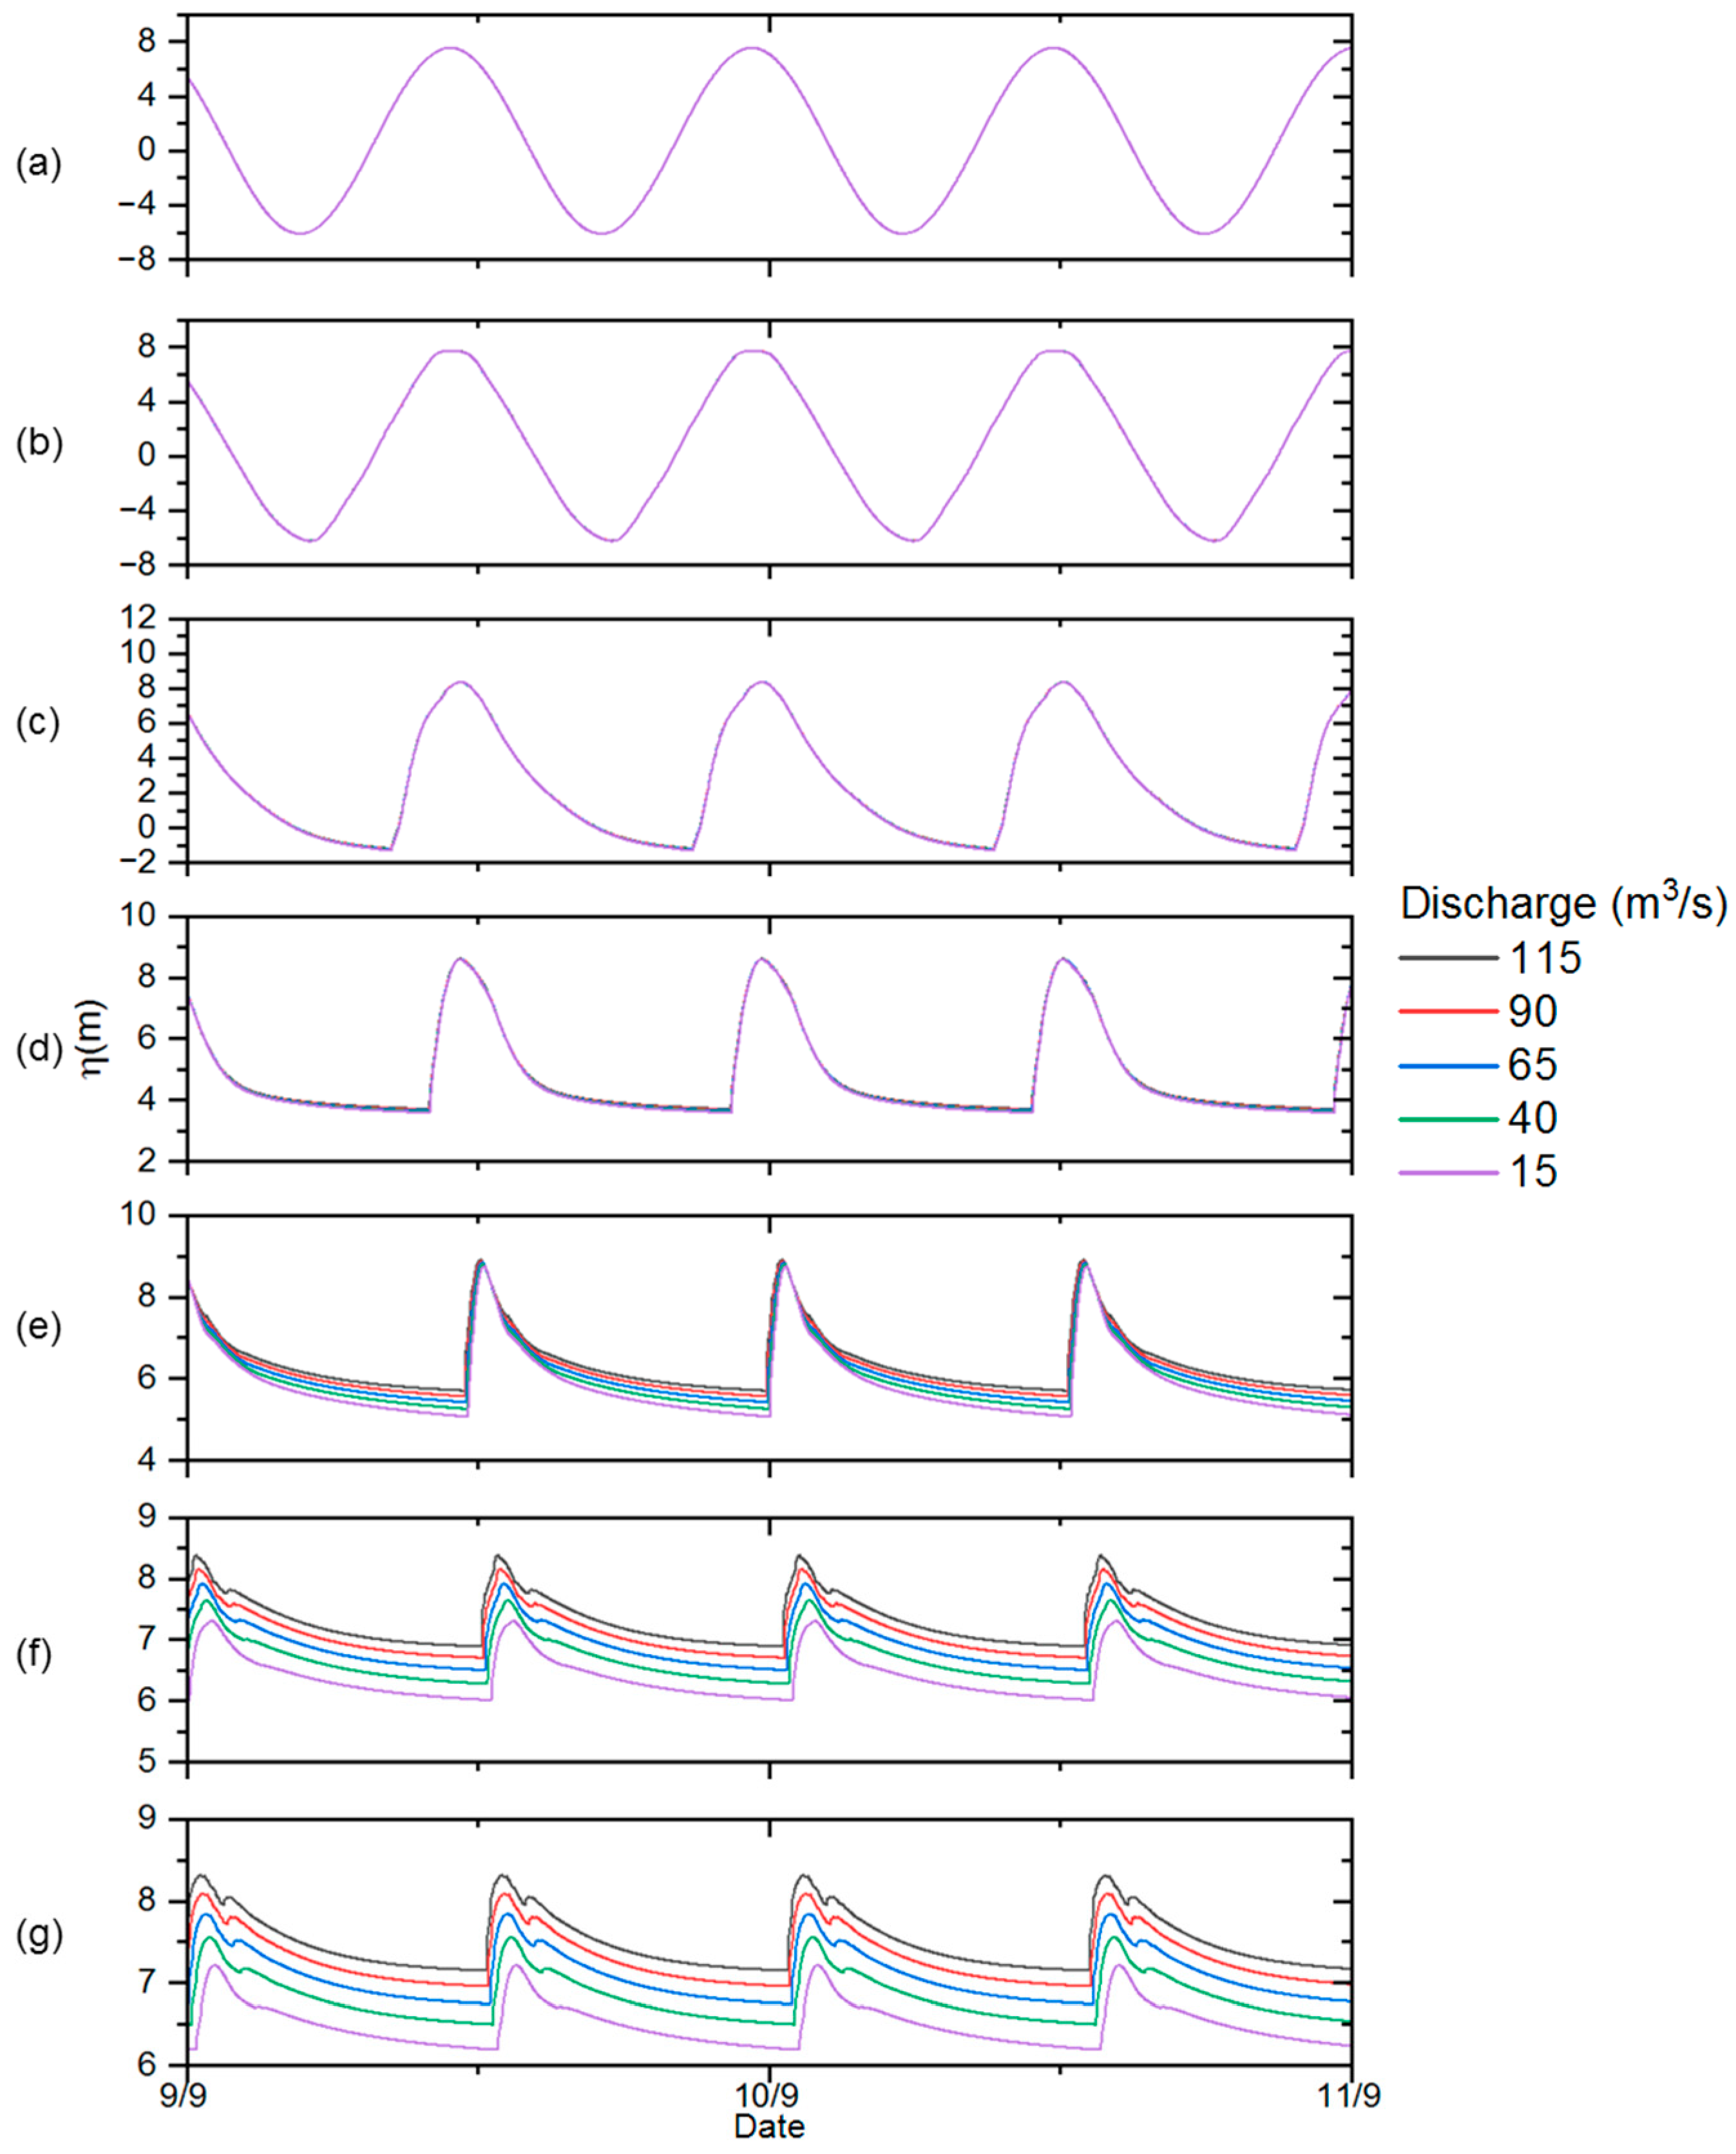
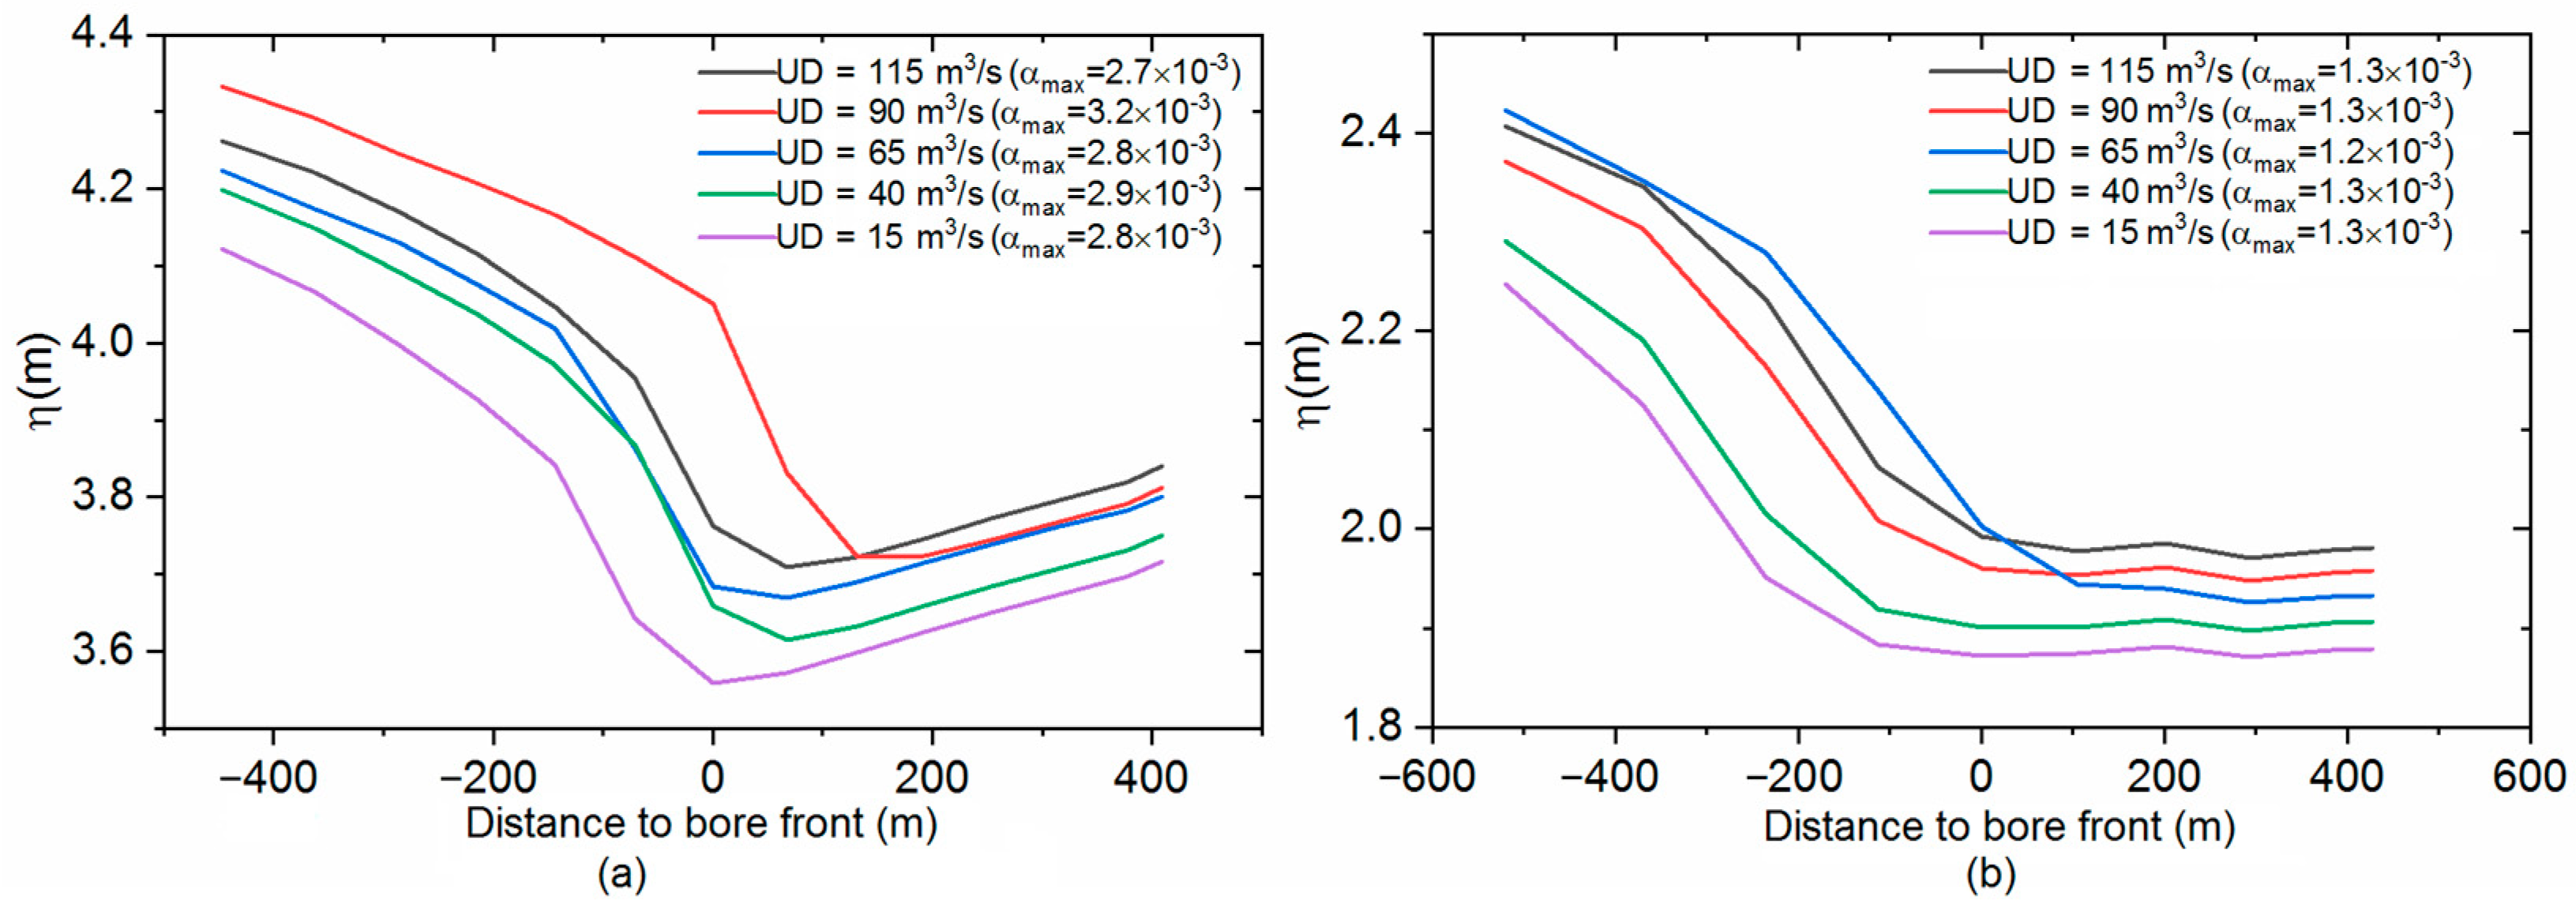
3.4. Influence of River Discharge

To examine the influence of river discharge on the formation and propagation of the Severn Bore, the upstream boundary discharge was varied between 15 m3/s and 115 m3/s in tests 18–22, while maintaining all other parameters constant. The results, presented in Figure 16, illustrate the maximum water level, minimum water level, and tidal range along the middle line of the River Severn, providing insights into the effects of varying discharge on bore dynamics and propagation.
From the upstream boundary to areas just upstream of Minsterworth, both the maximum and minimum water levels increase as river discharge rises. This reflects the damping effect of river discharge on the tidal wave, which becomes more pronounced as discharge increases. However, downstream from Northington, the influence of river discharge is minimal, as tidal forcing dominates this region.
Near Minsterworth, where the tidal wave undergoes significant amplification, the tidal range decreases with increasing river discharge. Upstream of Over Bridge (69.7 km) to the upstream boundary, the tidal range increases with rising discharge, particularly for lower discharge rates. This may be attributed to the backwater effect [39]. It was found that for a sloping channel, a very low discharge could allow tidal range to increase.
From Avonmouth to Northington (Figure 17), the tidal curves remain sinusoidal and show no variation across the tested discharge rates, indicating that river discharge has negligible influence on tidal dynamics near the estuary mouth, where tidal forcing dominates. At Minsterworth, the damping effect of river discharge interacts with tidal forcing, leading to a more gradual ebb phase. This damping effect intensifies beyond Minsterworth, where the influence of river discharge becomes more pronounced. Close to the upstream boundary and beyond the tidal limit, river discharge dominates the hydrodynamics entirely, with higher discharge rates causing a rise in both high tide and low tide levels, along with a slight increase in the tidal range.
Figure 18 shows that a tidal bore consistently forms at Northington and upstream of Sharpness, irrespective of the discharge rate. The αmax values remain constant near Sharpness and fluctuate only slightly at Northington, confirming that the impact of river discharge on bore formation is limited downstream of Northington. Thus, the formation of the Severn Bore is not significantly affected by the tested discharge rates, further highlighting the dominance of tidal forcing in bore development under these conditions.
The Froude number (Fr), shown in Figure 19, remains below 1.8 for all scenarios, indicating an undular nature of the tidal bore. Near Minsterworth, higher discharge levels (e.g., 115 m3/s and 90 m3/s) result in slightly lower Fr values, reflecting the damping effect of increased river discharge on the tidal wave, which reduces conditions favorable for bore formation. Beyond Minsterworth, the impact of river discharge on Fr becomes negligible, suggesting that discharge has minimal influence on the formation and propagation of the Severn Bore within the tested range of discharge rates.
At Minsterworth, the tidal bore height decreases with the increasing river discharge (Table 5). For the lowest discharge rate (15 m3/s), the bore height reaches 0.7 m, while at the highest discharge rate (115 m3/s), it decreases to 0.4 m. This demonstrates that higher river discharge opposes the incoming tidal wave, reducing its amplitude and consequently lowering the bore height. These results highlight the significant role of river discharge in modulating bore intensity, even though it has limited impact on bore formation under the tested conditions.

4. Discussions and Conclusions

This study provides a comprehensive hydrodynamic analysis of the Severn Bore, examining the influences of downstream tidal amplitude, mean water level, and upstream river discharge on its formation, propagation, and intensity. Using the Delft3D model, we demonstrated that downstream tidal amplitude is the primary driver of the bore’s intensity and reach. Tidal amplitudes below 6 m result in diminished propagation, hence the disappearance of the bore. The mean water level also plays a significant role, with elevated water levels enhancing bore intensity and enabling it to propagate further upstream. Although upstream river discharge has small impact on bore propagation, it does affect the tidal range and bore intensity, particularly near Minsterworth, emphasizing the interaction between tidal and fluvial processes.
The Severn Bore is in distinct contrast to other globally well-known bores, such as the Qiantang Bore in China, which forms under a smaller tidal range up to 9 m yet generates a larger bore height of over 2 m [40]. This discrepancy can be attributed to the extreme funneling and steep channel gradients in the Qiantang Estuary, which amplify tidal energy over a shorter distance. By comparison, the Severn Estuary relies on a combination of moderate funneling and tidal resonance over a broader tidal range to sustain the bore formation. These differences highlight the importance of estuarine geometry in modulating bore behavior and emphasize that tidal range alone does not dictate bore height or intensity [34].
Tidal bores, such as the Severn Bore, play a critical role in maintaining estuarine sediment dynamics and ecosystems by facilitating sediment transport and deposition processes [1,41]. The ecological implications of altered bore dynamics are multifaceted. Dampened bores could result in decreased mixing and net upstream advection of sediment materials and potential adverse ecological impact. For example, the Pororoca tidal bore in Brazil stirs organic matter into suspension, creating a nutrient-rich estuarine zone that supports species such as piranhas [2]. A reduction in bore activity would likely diminish such processes. Conversely, stronger bores under certain conditions could intensify bank erosion, destabilize vegetation, and alter the estuary’s morphological stability. The Qiantang Bore is known for its unpredictable and volatile behavior, frequently overtopping its banks and causing significant damage.
From a management perspective, this study emphasizes the need for cautious and informed planning when considering tidal energy extraction or other man-made interventions. The results underscore the potential risks posed by human activities, which can alter tidal amplitude and mean water level, thereby impacting the bore’s ecological and cultural values. Informed planning is needed in tidal energy extraction to preserve the estuarine hydrodynamics and maintain the unique characteristics of the Severn Estuary.
Future research should expand on these findings by examining higher-order tidal components, such as M4 and M6, to better understand nonlinear interactions that might shape the bore dynamics. Advanced numerical models, including full three-dimensional approaches like those used in the Qiantang River [42], can provide deeper insights into sediment transport and hydrodynamic responses under varying conditions. Integrating floodplain dynamics and overbank flows would offer a more comprehensive understanding of bore behavior during extreme flood events.

Author Contributions

B.C.—writing original draft; methodology; writing, review, and editing; investigation. H.H.—writing, review, and editing; J.M.—writing, review, and editing; D.L.—conceptualization; supervision; writing, review, and editing; resources. All authors have read and agreed to the published version of the manuscript.

Funding

This research was funded by the Natural Science Foundation of Henan Province, China (232300420454 and 2323004201052), the Major Special Science and Technology Project of Henan Province (Grant Nos. 221100320200 and 231100320100), the National Natural Science Foundation of China (Grant No. 41771511), the Key Research and Development Special Project of Henan Province (Nos. 231111320200 and 241111210300), Henan Science and Technology Key Projects Fund (202102310593), the EPSRC Centre for Doctoral Training in Future Infrastructure and Built Environment: Unlocking Net-Zero Infrastructure (EP/Y034643/1) and the Cambridge Centre for Smart Infrastructure and Construction (EP/N021614/1).

Institutional Review Board Statement

Not applicable.

Informed Consent Statement

Not applicable.

Data Availability Statement

Dataset available on request from the authors.

Conflicts of Interest

Author Jun Ma was employed by the company CHN Energy Technology & Economics Research Institute. The remaining authors declare that the research was conducted in the absence of any commercial or financial relationships that could be construed as a potential conflict of interest.

References

  1. Chanson, H. Environmental, Ecological and Cultural Impacts of Tidal Bores, Benaks, Bonos and Burros. In Proceedings of the International Workshop on Environmental Hydraulics: Theoretical, Experimental and Computational Solutions, Valencia, Spain, 29 October 2009; pp. 1–20. [Google Scholar]
  2. Chanson, H. Current Knowledge in Tidal Bores and Their Environmental, Ecological and Cultural Impacts. Environ. Fluid. Mech. 2011, 11, 77–98. [Google Scholar] [CrossRef]
  3. Jones, O.; Fairclough, L. Sounding Grief: The Severn Estuary as an Emotional Soundscape. Emot. Space Soc. 2016, 20, 98–110. [Google Scholar] [CrossRef]
  4. Dudley, M. River of Many Voices: Oral and Environmental Histories of the Severn. In Telling Environmental Histories: Intersections of Memory, Narrative and Environment; Holmes, K., Goodall, H., Eds.; Springer International Publishing: Cham, Switzerland, 2017; pp. 81–106. ISBN 978-3-319-63772-3. [Google Scholar]
  5. Bartsch-Winkler, S.; Lynch, D.K. Catalog of Worldwide Tidal Bore Occurrences and Characteristics; U.S. Geological Survey Circular; U.S. Government Publishing Office: Washington, DC, USA, 1988; Volume 1022.
  6. Chanson, H. Tidal Bores, Aegir, Eagre, Mascaret, Pororoca: Theory and Observations; World Scientific: London, UK, 2012. [Google Scholar]
  7. Lynch, D.K. Tidal Bores. Sci. Am. 1982, 247, 146–157. [Google Scholar] [CrossRef]
  8. Chanson, H.; Reungoat, D.; Simon, B.; Lubin, P. High-Frequency Turbulence and Suspended Sediment Concentration Measurements in the Garonne River Tidal Bore. Estuar. Coast. Shelf Sci. 2011, 95, 298–306. [Google Scholar] [CrossRef]
  9. Simpson, J.H.; Fisher, N.R.; Wiles, P. Reynolds Stress and TKE Production in an Estuary with a Tidal Bore. Estuar. Coast. Shelf Sci. 2004, 60, 619–627. [Google Scholar] [CrossRef]
  10. Wolanski, E.; Williams, D.; Spagnol, S.; Chanson, H. Undular Tidal Bore Dynamics in the Daly Estuary, Northern Australia. Estuar. Coast. Shelf Sci. 2004, 60, 629–636. [Google Scholar] [CrossRef]
  11. Bonneton, P.; Van de Loock, J.; Parisot, J.-P.; Bonneton, N.; Sottolichio, A.; Detandt, G.; Castelle, B.; Marieu, V.; Pochon, N. On the Occurrence of Tidal Bores—The Garonne River Case. J. Coast. Res. 2011, 64, 1462–1466. [Google Scholar]
  12. Xie, D.F.; Pan, C.H.; Wu, X.G. Modeling the Tidal Bore on the Qiantang River, China: An Application of FVCOM. In Proceedings of the the 6th International Symposium on Environmental Hydraulics, Athens, Greece, 23–25 June 2010. [Google Scholar]
  13. Pan, C.; Huang, W. Numerical Modeling of Suspended Sediment Transport Affected by Tidal Bore in Qiantang Estuary. J. Coast. Res. 2010, 26, 1123–1132. [Google Scholar] [CrossRef]
  14. Pan, C.-H.; Lu, H. 2D Numerical Simulation of Tidal Bore on Qiantang River Using KFVS Scheme. Int. Conf. Coastal. Eng. 2011, 1, 29. [Google Scholar] [CrossRef]
  15. Li, Y.; Pan, D.-Z.; Chanson, H.; Pan, C.-H. Real-Time Characteristics of Tidal Bore Propagation in the Qiantang River Estuary, China, Recorded by Marine Radar. Cont. Shelf Res. 2019, 180, 48–58. [Google Scholar] [CrossRef]
  16. Ting, H.; Huai, Z.; YaoLin, S.H.I. Numerical simulation of the tidal bore in the Qiantang River based on Boussinesq-type equations. Chin. J. Geophys. 2022, 65, 79–95. [Google Scholar] [CrossRef]
  17. Roy-Biswas, T.; Sen, D. Tidal Bore Dynamics of a Mixed Estuary: The Hooghly River, India. J. Waterw. Port Coast. Ocean Eng. 2023, 149, 05022005. [Google Scholar] [CrossRef]
  18. Bayu, A.; Pudjaprasetya, S.; Wisha, U.; Husrin, S. Numerical Simulation of Tidal Bore Bono at Kampar River. J. Appl. Fluid Mech. 2019, 12, 311–318. [Google Scholar] [CrossRef]
  19. Wu, W. Numerical Modelling of Shallow-Water Wave Propagation in Coastal and Estuarine Environments; University of Cambridge: Cambridge, UK, 2016. [Google Scholar]
  20. Kurniawan, A.; Wisha, U.J.; Husrin, S.; Karjadi, E.A. Tidal Bore Generation at Hte Estuaries of the East Coast of Sumatra. In Proceedings of the 37th IAHR World Congress, Kuala Lumpur, Malaysia, 13 August 2017; pp. 3587–3593. [Google Scholar]
  21. Abdullah, F.A.R.; Ningsih, N.; Rachmayani, R. Numerical Simulation of Tidal Bore in Kampar River: A Preliminary Study. IOP Conf. Ser. Earth Environ. Sci. 2019, 339, 012022. [Google Scholar] [CrossRef]
  22. Xia, J.; Falconer, R.A.; Lin, B. Hydrodynamic Impact of a Tidal Barrage in the Severn Estuary, UK. Renew. Energy 2010, 35, 1455–1468. [Google Scholar] [CrossRef]
  23. Ahmadian, R.; Falconer, R.; Bockelmann-Evans, B. Far-Field Modelling of the Hydro-Environmental Impact of Tidal Stream Turbines. Renew. Energy 2012, 38, 107–116. [Google Scholar] [CrossRef]
  24. Liang, D.; Xia, J.; Falconer, R.; Zhang, J. Study on Tidal Resonance in Severn Estuary and Bristol Channel. Coast. Eng. J. 2015, 56, 1. [Google Scholar] [CrossRef]
  25. Ma, Q.; Adcock, T.A.A. Modification of Tidal Resonance in the Severn Estuary by a Barrage and Lagoon. J. Ocean Eng. Mar. Energy 2020, 6, 171–181. [Google Scholar] [CrossRef]
  26. Severn Estuary Commission. Available online: https://www.severncommission.co.uk/ (accessed on 7 November 2024).
  27. Abbott, M.R.; Lighthill, M.J. A Theory of the Propagation of Bores in Channels and Rivers. Math. Proc. Camb. Philos. Soc. 1956, 52, 344–362. [Google Scholar] [CrossRef]
  28. Langston, W.J.; Jonas, P.J.C.; Millward, G.E. The Severn Estuary and Bristol Channel: A 25 Year Critical Review. Mar. Pollut. Bull. 2010, 61, 1–4. [Google Scholar] [CrossRef] [PubMed]
  29. Holgate, S.J.; Matthews, A.; Woodworth, P.L.; Rickards, L.J.; Tamisiea, M.E.; Bradshaw, E.; Foden, P.R.; Gordon, K.M.; Jevrejeva, S.; Pugh, J. New Data Systems and Products at the Permanent Service for Mean Sea Level. J. Coast. Res. 2012, 29, 493–504. [Google Scholar] [CrossRef]
  30. Hydrological Open Data—Data.Gov.UK. Available online: https://www.data.gov.uk/dataset/98a4d46e-23e7-4430-883c-9e5f14645e8f/hydrological-open-data (accessed on 8 November 2024).
  31. Bonneton, P.; Bonneton, N.; Parisot, J.-P.; Castelle, B. Tidal Bore Dynamics in Funnel-Shaped Estuaries. J. Geophys. Res. Ocean. 2015, 120, 923–941. [Google Scholar] [CrossRef]
  32. Rowbotham, F. The Severn Bore; David & Charles: London, UK, 1964. [Google Scholar]
  33. Pan, C.; Lin, B.; Mao, X. New Development in the Numerical Simulation of the Tidal Bore. In Proceedings of the International Conference on Estuaries & Coasts, Hangzhou, China, 9 November 2003. [Google Scholar]
  34. Viero, D.P.; Defina, A. Consideration of the Mechanisms for Tidal Bore Formation in an Idealized Planform Geometry. Water Resour. Res. 2018, 54, 5670–5686. [Google Scholar] [CrossRef]
  35. Treske, A. Undular Bores (Favre-Waves) in Open Channels—Experimental Studies. J. Hydraul. Res. 1994, 32, 355–370. [Google Scholar] [CrossRef]
  36. Mouaze, D.; Chanson, H.; Simon, B. Field Measurements in the Tidal Bore of the Sélune River in the Bay of Mont Saint Michel; The University of Queensland: Brisbane, Australia, 2010. [Google Scholar]
  37. Tu, J.; Fan, D. Flow and Turbulence Structure in a Hypertidal Estuary with the World’s Biggest Tidal Bore. J. Geophys. Res. Ocean. 2017, 122, 3417–3433. [Google Scholar] [CrossRef]
  38. Dalrymple, R.W. Sedimentation on High-Energy Sand Flats in the Bay of Fundy: The Record of Tidal-Bore Activity and Deposition from High-Concentration Suspensions of Sand. Sedimentology 2021, 68, 2195–2226. [Google Scholar] [CrossRef]
  39. Kästner, K.; Hoitink, A.J.F.; Torfs, P.J.J.F.; Deleersnijder, E.; Ningsih, N.S. Propagation of Tides along a River with a Sloping Bed. J. Fluid. Mech. 2019, 872, 39–73. [Google Scholar] [CrossRef]
  40. Pan, C.; Lin, B.-Y.; Mao, X.-Z. Case Study: Numerical Modeling of the Tidal Bore on the Qiantang River, China. J. Hydraul. Eng. 2007, 133, 130–138. [Google Scholar] [CrossRef]
  41. Liang, D.; Wang, X.; Bockelmann-Evans, B.N.; Falconer, R.A. Study on Nutrient Distribution and Interaction with Sediments in a Macro-Tidal Estuary. Adv. Water Resour. 2013, 52, 207–220. [Google Scholar] [CrossRef]
  42. Wang, Q.; Pan, C. Three-Dimensional Modelling of Sediment Transport under Tidal Bores in the Qiantang Estuary, China. J. Hydraul. Res. 2018, 56, 662–672. [Google Scholar] [CrossRef]
Figure 1. Locations of the Severn Estuary and gauging stations.
Jmse 12 02319 g001
Figure 2. (a) Computational mesh; (b) bathymetry of the study site.
Jmse 12 02319 g002
Figure 3. Comparison of water levels at Northington gauging station on 10 September 2023.
Jmse 12 02319 g003
Figure 4. Comparison of measured and simulated water level variations at (a) Sharpness (riverbed at the station is at −0.76 mAOD; data points at the riverbed are not considered in the comparison); (b) Epney; and (c) Minsterworth for the period of 9–16 September 2022, where the lines and symbols represent predicted and measured values, respectively.
Jmse 12 02319 g004
Figure 5. Time series of tide elevation on 12 September 2022, at different locations along the River Severn (distances measured from downstream boundary).
Jmse 12 02319 g005
Figure 6. Propagation of Severn Bore from t = 17:10 to t = 19:40 on 12 September 2022.
Jmse 12 02319 g006
Figure 7. Horizontal velocity magnitude distribution at the arrival of tidal bore.
Jmse 12 02319 g007
Figure 8. (a) Maximum water level; (b) minimum water level; (c) tidal range along the River Severn with different downstream tidal amplitudes.
Jmse 12 02319 g008
Figure 9. Water level variations for Scenarios 2–9 with different downstream tidal amplitudes at (a) Avonmouth; (b) Beachley; (c) Sharpness; (d) Northington; (e) Minsterworth; (f) Overbridge; (g) Upper Parting.
Jmse 12 02319 g009
Figure 10. Simulated free surface profiles along the channel during tidal wave passage at (a) Northington (40.5 km); (b) 7.8 km upstream of Sharpness (36.2 km), for different downstream tidal amplitudes.
Jmse 12 02319 g010
Figure 11. Maximum Froude numbers at stations along the River Severn with different downstream tidal amplitudes.
Jmse 12 02319 g011
Figure 12. (a) Maximum water level; (b) minimum water level; (c) tidal range along the River Severn with different downstream mean water levels.
Jmse 12 02319 g012
Figure 13. Water level variations with different downstream mean water levels at (a) Avonmouth; (b) Beachley; (c) Sharpness; (d) Northington; (e) Minsterworth; (f) Overbridge; (g) Upper Parting.
Jmse 12 02319 g013
Figure 14. Simulated free surface profiles along the channel during tidal wave passage at (a) Northington (40.5 km); (b) 7.8 km upstream Sharpness (36.2 km), for different downstream mean water levels with the downstream tidal amplitude of 7 m.
Jmse 12 02319 g014
Figure 15. Maximum Froude numbers at stations along the River Severn with different downstream mean water levels with the downstream tidal amplitude of 7 m.
Jmse 12 02319 g015
Figure 16. (a) Maximum water level; (b) minimum water level; (c) tidal range along the River Severn with different river discharge rates.
Jmse 12 02319 g016
Figure 17. Water level variations for scenarios with different river discharges at (a) Avonmouth; (b) Beachley; (c) Sharpness; (d) Northington; (e) Minsterworth; (f) Overbridge; (g) Upper Parting.
Jmse 12 02319 g017
Figure 18. Simulated free surface profiles along the channel during tidal wave passage at (a) Northington (40.5 km) and (b) 7.8 km upstream of Sharpness (36.2 km), for different river discharges.
Jmse 12 02319 g018
Figure 19. Maximum Froude numbers along the River Severn with different river discharges.
Jmse 12 02319 g019
Table 1. Observation of bore type and Froude number.
RiverDateBore TypeFrReference
Garonne10 August 2010Undular1.3[8]
Sélune24 September 2010Breaking2.35[36]
Qiantang25 October 2012Breaking1.92[37]
Hooghly9 April 2020Undular1.37[17]
Salmon21 June 2020Breaking2–3[38]
Table 2. Definition of test scenarios.
TestTidal Amplitude (m)Mean Water Level (m)Discharge (m3/s)
1 (validation) measurement (≈7)measurement (≈0.7)65
2–92, 3, 4, 5, 6, 7, 8, 90.765
10–1340.2, 0.7, 1.2, 1.765
14–1770.2, 0.7, 1.2, 1.765
18–2270.715, 40, 65, 90, 115
Table 3. Tidal bore heights at Minsterworth station for Tests 2–9.
Amplitude (m)9876
Bore Height (m)1.81.10.50.2
Table 4. Tidal bore heights at Minsterworth station for Tests 10–17.
Mean Water Level (m)1.71.20.70.2
Bore Height (m)0.80.70.50.3
Table 5. Tidal bore heights at Minsterworth station for Tests 18–22.
Discharge (m3/s)11590651540
Bore Height (m)0.40.40.50.70.6
Disclaimer/Publisher’s Note: The statements, opinions and data contained in all publications are solely those of the individual author(s) and contributor(s) and not of MDPI and/or the editor(s). MDPI and/or the editor(s) disclaim responsibility for any injury to people or property resulting from any ideas, methods, instructions or products referred to in the content.

