Article

Performance Analysis of a Floating Wind–Wave Power Generation Platform Based on the Frequency Domain Model

1
Key Laboratory of High Performance Ship Technology (Wuhan University of Technology), Ministry of Education, Wuhan 430063, China
2
School of Naval Architecture, Ocean and Energy Power Engineering, Wuhan University of Technology, Wuhan 430063, China
3
Sanya Science and Education Innovation Park of Wuhan University of Technology, Sanya 572019, China
4
China Southern Power Grid Technology Co., Ltd., Guangzhou 510080, China
5
China Ship Scientific Research Center, Wuxi 214000, China
6
Hubei Key Laboratory of Advanced Technology for Automotive Components, Wuhan University of Technology, Wuhan 430070, China
*
Author to whom correspondence should be addressed.
J. Mar. Sci. Eng. 2024, 12(2), 206; https://doi.org/10.3390/jmse12020206
Submission received: 6 December 2023 / Revised: 2 January 2024 / Accepted: 5 January 2024 / Published: 23 January 2024
(This article belongs to the Special Issue Offshore Renewable Energy)

Abstract

:
Integrating wave energy converters (WECs) onto floating offshore wind turbine platforms has emerged as a recent focal point of research aiming to achieve synergistic marine energy utilization and enhance the spatial efficiency of renewable energy. The power performance of WECs relies on hydrodynamic interactions with the floating platform. However, the coupled dynamic response and power generation mechanism remain unclear. This study establishes a multi-body model for the constrained motion of floating-platform and point-absorber WECs in the frequency domain. The power performance of WECs under different arrangements is compared and optimized. The performance of different hydrodynamic models in the South China Sea is analyzed further. The results indicate that exceptional peak performance is achieved when a single point absorber is placed on the floating platform. However, its performance under the full spectrum of wave frequencies in real sea conditions is suboptimal. Conversely, as the number of point absorbers on the floating platform increases, the performance of the hybrid system becomes more stable in real sea conditions. Furthermore, the array arrangement of point absorbers on the floating platform leads to multiple peaks in their power performance, and in selected array arrangements, the average power generation at specific frequencies is significantly superior to that of a single point absorber on the floating platform.

1. Introduction

In recent years, the development of floating offshore wind turbines has progressed rapidly as a crucial trend. A significant number of commercial and demonstrative projects have been constructed, such as Hywind Scotland wind farm (30 MW) in UK [1], Hywind Tampen wind farm (88 MW) in Norway [2], Floatgen (2 MW) in France [3], the Kincardine offshore wind farm (50.4 MW) in Britain [4], and “Haiyou Guanlan” demonstration project recently completed in China [5]. However, there are some limitations in the utilization of resources, construction cost, and energy stability of floating offshore wind turbines, and these limitations restrict their further development. Integrating WECs into a floating platform can address the variability in wind energy, allowing for the synergistic utilization of both energy sources and enhancing power generation stability and reliability [6]. Additionally, WECs can restrain the motion of the platform to a certain extent and improve the safety and stability of the overall structure [7].
Numerous scholars have undertaken conceptual designs and research for wind–wave power generation platforms. Based on different forms of floating foundations, wind–wave power generation platforms can be roughly categorized into four types. The first type is spar-type foundations with WECs, with typical representatives such as the “Spar-Torus Combination” (STC) [8,9,10,11,12,13] that combines a spar-type floating wind turbine with a torus point-absorber WEC, as shown in Figure 1a; the “Wind WEC” [14], which combines a spar-type floating wind turbine with the “Wavestar” WEC; and the “Hywind-Wavebob-NACA Combination” (HWNC) [15], which combines a spar-type floating wind turbine with wave energy and tidal energy converters. The second type is semi-submersible foundations with WECs. Typical representatives are the “Semi-submersible Flap Combination” (SFC) [16,17,18,19,20], which combines a semi-submersible floating wind turbine with three elliptical flap-type WECs, as shown in Figure 1b; “Wind-to-power” (W2P) [21], which combines a semi-submersible floating wind turbine with retractable blades and three-degrees-of-freedom (3-DOF) WECs; and the “Sea Flower” [22], which features gyro-stabilized devices on semi-submersible floating wind turbines with multiple WEC installations. The remaining two types are barge-type foundations with WECs and Tension Leg Platform (TLP) foundations with WECs, respectively. These are typically represented by the “D-Hyp” [23], which combines a barge floating platform with a semi-circular base with an oscillating water column WEC, which generates power using pitch motion, as shown in Figure 1c; the “C-Hyp” [24], which combines a barge floating platform with a WEC with a circular base; the “TWindWave” [25], which combines a TLP with four point-absorber WECs, as shown in Figure 1d; and the “ TLP-WT-WEC-Combination” (TWWC) [26], which combines a TLP with a heave-type WEC.
Among the above-mentioned wind–wave power generation platforms, the combination of a semi-submersible floating platform and a WEC is the most widely studied. The primary reasons for this widespread focus likely include the adaptability and high stability of a semi-submersible foundation, its ease of construction and maintenance, and its suitability for accommodating multiple WECs. In these studies, Luan et al. [16] carried out time-domain numerical simulation for an SFC, and linear rotational damping was used to simulate the influence of a Power Take-Off (PTO) system. The results show that the PTO damping coefficient and the mass of the WEC have great influences on the power generation of the WEC. Based on the concept of an SFC proposed by Luan [16], Michailides et al. [17] studied the influence of the WEC on the motion of the floating platform. They considered two different flap plate layouts and compared them with the case of a single floating wind turbine. The results show that power generation can be effectively improved by combining the flap WEC with the semi-submersible platform without significantly affecting the critical response of the semi-submersible platform. Gao et al. [18] carried out numerical simulation and experimental tests on an STC and SFC. The numerical and experimental results obtained under the combined action of wind and waves, considering the wind and wave conditions in operation and survival conditions, were compared for selected responses (such as motion, PTO force, and power generation efficiency). The results show that compared with the STC, the SFC had lower motion response under extreme conditions. Michailides et al. [19] conducted an experimental study on the survivability of the SFC and compared it with the numerical results. The results show that the numerical simulation overestimated some motion of the combined power generation system, which proves its good survivability in extreme sea conditions. Michailides et al. [20] conducted a study on the performance of an SFC under operating conditions through numerical analysis and physical model tests. The results indicate that when wind load is applied, the response of the platform in roll and pitch motion is greater under regular waves, while the power generation of the WEC is improved under irregular waves.
In addition to the extensively studied concepts of the STC and SFC, Chen et al. [21] conducted research on the W2P, showing the best wind coefficient of retractable blades can be achieved by adjusting the blade diameter and rotation speed, and a WEC with three degrees of freedom can effectively absorb wave energy. They integrated them and tested the power generation efficiency of the combined power generation platform under different arrangements. Fenu et al. [22] conducted a numerical simulation on the “Sea Flower” in adverse sea conditions, and the results indicate that the gyro device could significantly improve the pitch stability of the platform. Wang et al. [27] proposed combining a semi-submersible floating wind turbine with WECs. The study analyzed the hydrodynamic response of a combined structure through numerical simulation and analysis, focusing on the interaction between wind energy and wave energy. The difference between the scattering force and radiation force was compared with and without consideration of the hydrodynamic coupling effect. The results indicate that the combination of wind and wave energy alters the diffraction force and radiation force on the structure, ultimately affecting its hydrodynamic response. Gaspar et al. [28] analyzed the feasibility of using WECs to assist in the hydrodynamic compensation of floating platforms. The experimental results demonstrate that WECs can aid the hydrodynamic compensation system under the tested sea conditions and even expand the operating sea conditions. Additionally, it was observed that WECs located on the downwind and upwind sides of a platform have distinct functions in the dynamic compensation of the platform. Hallak et al. [29] combined DeepCwind with conical point-absorber WECs to investigate the linear hydrodynamic interaction between the platform and WECs. They explored the influence of changes in WEC diameter on the overall motion. Li et al. [30] studied the dynamic response of the system and investigated the influence of wind–wave coupling effects. They used numerical simulation and analysis to study the interaction between wind energy and wave energy in the combined system. The results show that the wind–wave coupling effect has a substantial influence on the dynamic response of the hybrid system. Si et al. [31] proposed the combination of a semi-submersible floating platform with three point absorbers. They conducted a preliminary feasibility study on the concept by performing verified numerical simulations of aero-hydro-servo-mooring dynamic integration. Shi et al. [32] presented a dimensionless optimization approach for shaping a hollow cylindrical WEC tailored for a wind–wave power generation platform. The optimal configuration was achieved using the differential evolution (DE) algorithm. Wang et al. [33] combined a semi-submersible floating wind turbine with a torus-type WEC. The results indicated that the use of a concave-type WEC led to improved dynamic response and increased power generation for the integrated system. The study examined four distinct geometries for WECs. Tian et al. [34] also investigated the impact of the number of WECs on motion, based on the model of Wang et al. [33]. The finding demonstrated that the combination concept with three WECs had the highest power generation efficiency. However, the authors only conducted time-domain numerical simulations for a limited number of WECs, without extending the model to address a frequency-domain model for an arbitrary number of WECs. In a comprehensive analysis, the primary challenges of a floating wind–wave power generation platform lie in determining the optimal combination of floating wind turbine platforms and WECs to achieve maximum performance. The aim is to find a balance between the high power generation efficiency of the hybrid system under typical sea states and its robust survivability in extreme sea states. Furthermore, it is crucial to explain how WECs reduce the motion response of floating platforms, allowing for peak-shaving and valley-filling electricity generation from the upper wind turbines.
Recently, Chen et al. [35] conducted a study on a wind–wave power generation platform consisting of an OC4 semi-submersible floating platform and a single point-absorber WEC positioned at the platform’s center. Zhang et al. [36] expanded on this by using computational fluid dynamics (CFD) to implement viscous damping corrections for the point absorbers. Additionally, extensive analysis was conducted on the hydrodynamic characteristics of the hybrid system. The study also investigated the impact of different sizes of floaters on wave energy conversion efficiency. However, if the point absorber is not centrally located, the motion of the platform interacts with the heave motion of the point absorber, affecting its response and power generation characteristics. Furthermore, the configuration of multiple point absorbers can also affect the performance of the hybrid system [37,38,39,40,41]. Hence, it is essential to investigate the coupled dynamics of this hybrid system. In this study, the work of Zhang et al. [36] has been reconsidered, and the effects of wind loads have been ignored. The research of Chen et al. [42] and Zou et al. [43] indicated that wind loads and the hydrodynamic interactions of a multi-body system had minimal impact on the performance of point absorbers in a floating wind–wave power generation platform. The primary focus was on investigating the variations in the power performance of point absorbers under non-centralized array configurations. The novelty of our research lies in the following aspects: While considering the placement of non-centralized point absorbers on the floating platform, a multi-body constrained motion model for the platform with an arbitrary number of point absorbers is established in the frequency domain. The parameters of the PTO system are optimized for different arrangements of WECs, revealing the best performance for various point-absorber configurations. Thirdly, this study calculates the expected power output of various models in the South China Sea, revealing the performance of different configurations under real sea conditions.
This article is arranged as follows: Section 2 outlines the derivation process of the multi-body constrained motion model in the frequency domain and provides a methodology for assessing the power generation of point absorbers as well as the computation procedure for expected power in real sea conditions. Section 3 introduces the key parameters of the wind–wave power generation platform and relevant structural features, presenting a comparative analysis of hydrodynamic coefficients in free-floating states among different hydrodynamic models. Section 4 presents the validation of the constructed frequency-domain model for constrained motion, which is followed by a parametric analysis of PTO system parameters for different hydrodynamic models, with performance evaluations conducted in the South China Sea. Finally, Section 5 summarizes the principal research findings.

2. Theory Background

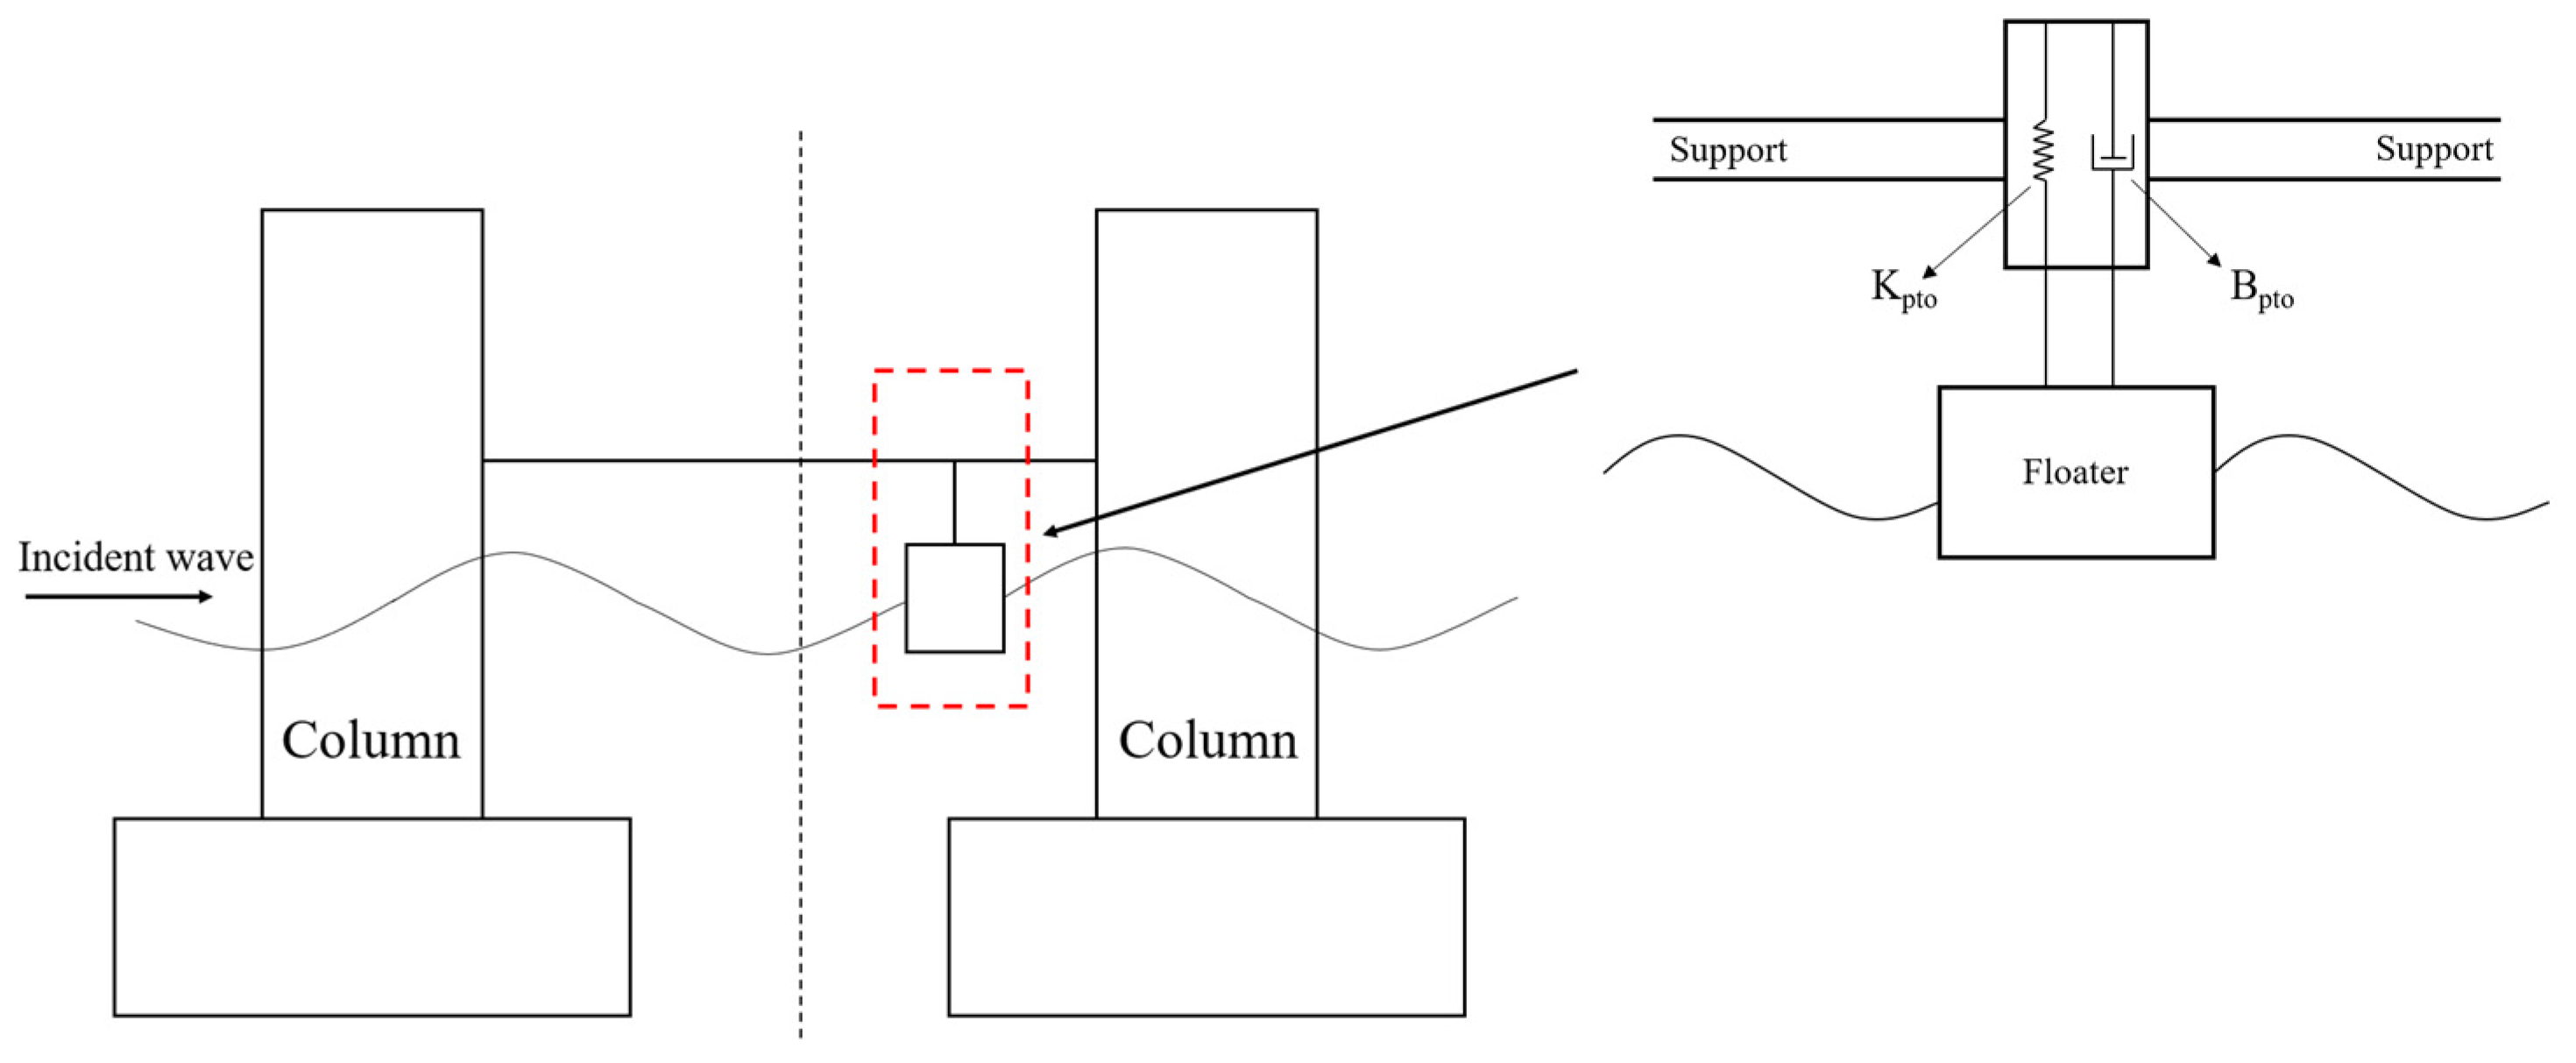
2.1. Frequency-Domain Model for Multiple Floating Bodies with Constraints

For a single point absorber, considering the effect of linearized fluid viscosity and a PTO system, the frequency-domain motion equation in the heave DOF can be expressed as follows [44]:
[ ω 2 ( M 33 + A 33 ( ω ) ) i ω B 33 ( ω ) + B p t o + B v + ( C 33 + K p t o ) ] x 3 ( i ω ) = f 3 e x c i ω
where  M 33 C 33 , and  f 3 e x c i ω  represent the mass, hydrostatic stiffness, and wave exciting force of the point absorber.  A 33 ( ω )  and  B 33 ( ω )  represent the added mass and radiation damping of the point absorber.  K p t o B p t o , and  B v  represent the stiffness and damping coefficients of the PTO and the viscous coefficient matrix.  x 3 ( i ω )  is the heave motion of the point absorber. The force applied to the PTO  f p t o  can be expressed as follows:
f p t o i ω = i ω B p t o x 3 ( i ω ) K p t o x 3 ( i ω )
Based on the frequency-domain model, considering the non-central placement of the point absorber, as shown in Figure 2, the two-body coupling model comprises seven degrees of freedom. However, it is the two DOFs associated with the roll and pitch of the floating platform that exert a substantial coupling influence on the heave motion of the point absorber. Considering the DOFs of heave, roll, and pitch for the platform, as well as the heave DOF for the point absorber, and based on the small-angle assumption, a transformation matrix E is defined to describe this coupling term:
E = 1 ( C O G 2 y C O G 1 y ) ( C O G 2 x C O G 1 x ) 1 1 × 4
where  C O G 1  and  C O G 2  represent the position of the center of gravity for the platform and point absorber. Subscripts x and y denote the specific values of the center of gravity positions in the x- and y-directions. Therefore, the relative displacement between the platform and the point absorber  x R e l a t i v e  can be expressed as follows:
x R e l a t i v e ( i ω ) = E x 3 ( i ω ) x 4 ( i ω ) x 5 ( i ω ) x 9 ( i ω )
The forces acting on the PTO can be determined as follows:
f p t o 3 i ω M 4 i ω M 5 i ω f p t o 9 i ω = i ω E T B p t o x R e l a t i v e ( i ω ) E T K p t o x R e l a t i v e ( i ω )
where  f p t o 3  and  f p t o 9  represent the PTO forces exerted on both the floating platform and the point absorber;  M 4  and  M 5  represent the moments exerted on the floating platform in the roll and pitch DOFs.
A coupled heave DOF frequency-domain hydrodynamic model under heave, pitch, and roll motions for the wind–wave power generation platform can be established as follows:
ω 2 M 33 + A 33 ( ω ) A 34 ( ω ) A 35 ( ω ) A 39 ( ω ) A 43 ( ω ) M 44 + A 44 ( ω ) A 45 ( ω ) A 49 ( ω ) A 53 ( ω ) A 54 ( ω ) M 55 + A 55 ( ω ) A 59 ( ω ) A 93 ( ω ) A 94 ( ω ) A 95 ( ω ) M 99 + A 99 ( ω ) i ω B 33 ( ω ) + B v 3 B 34 ( ω ) B 35 ( ω ) B 39 ( ω ) B 43 ( ω ) B 44 ( ω ) + B v 4 B 45 ( ω ) B 49 ( ω ) B 53 ( ω ) B 54 ( ω ) B 55 ( ω ) + B v 5 B 59 ( ω ) B 93 ( ω ) B 94 ( ω ) B 95 ( ω ) B 99 ( ω ) + B v 9 + E T B p t o E + C 33 C 44 C 55 C 99 + E T K p t o E x 3 ( i ω ) x 4 ( i ω ) x 5 ( i ω ) x 9 ( i ω ) = f 3 e x c i ω f 4 e x c i ω f 5 e x c i ω f 9 e x c i ω
If we apply this model to a semi-submersible platform with N point absorbers, the frequency-domain hydrodynamic model for heave motion must consider (3 + N) degrees of freedom. The first three degrees of freedom are allocated to the platform in the heave, roll, and pitch DOFs, while the next N degrees of freedom are allocated to the point absorbers in the heave DOF. The mass matrix M, hydrostatic stiffness matrix C, viscous damping matrix Bv, damping coefficient matrix of the PTO Bpto, and stiffness matrix of the PTO Kpto are all diagonal and can be expressed as follows:
M = d i a g ( M 11 , M 22 , M 33 , M 44 , , M ( N + 3 ) ( N + 3 ) )
C = d i a g ( C 11 , C 22 , C 33 , C 44 , , C ( N + 3 ) ( N + 3 ) )       
B v = d i a g ( B v 1 , B v 2 , B v 3 , B v 4 , , B v ( N + 3 ) )              
B p t o = d i a g ( B p t o 1 , B p t o 2 , B p t o 3 , , B p t o N )              
K p t o = d i a g ( K p t o 1 , K p t o 2 , K p t o 3 , , K p t o N )              
The added mass matrix  A ( ω )  and radiation damping matrix  B ( ω )  with coupling terms can be expressed as follows:
A ( ω ) = A 11 ( ω ) A 12 ( ω ) A 13 ( ω ) A 14 ( ω ) A 1 ( N + 3 ) ( ω ) A 21 ( ω ) A 22 ( ω ) A 23 ( ω ) A 24 ( ω ) A 2 ( N + 3 ) ( ω ) A 31 ( ω ) A 32 ( ω ) A 33 ( ω ) A 34 ( ω ) A 3 ( N + 3 ) ( ω ) A 41 ( ω ) A 42 ( ω ) A 43 ( ω ) A 44 ( ω ) A 4 ( N + 3 ) ( ω ) A ( N + 3 ) 1 ( ω ) A ( N + 3 ) 2 ( ω ) A ( N + 3 ) 3 ( ω ) A ( N + 3 ) 4 ( ω ) A ( N + 3 ) ( N + 3 ) ( ω )
B ( ω ) = B 11 ( ω ) B 12 ( ω ) B 13 ( ω ) B 14 ( ω ) B 1 ( N + 3 ) ( ω ) B 21 ( ω ) B 22 ( ω ) B 23 ( ω ) B 24 ( ω ) B 2 ( N + 3 ) ( ω ) B 31 ( ω ) B 32 ( ω ) B 33 ( ω ) B 34 ( ω ) B 3 ( N + 3 ) ( ω ) B 41 ( ω ) B 42 ( ω ) B 43 ( ω ) B 44 ( ω ) B 4 ( N + 3 ) ( ω ) B ( N + 3 ) 1 ( ω ) B ( N + 3 ) 2 ( ω ) B ( N + 3 ) 3 ( ω ) B ( N + 3 ) 4 ( ω ) B ( N + 3 ) ( N + 3 ) ( ω )
where the viscous coefficient in the heave DOF for the point absorber was determined through a free decay test conducted using STAR-CCM+ [36]. The viscous damping coefficients  B v 1 B v 2 , and  B v 3  for the floating platform are all set to 8% of their critical damping values [45,46]. Additionally, the constraint matrix E can be rewritten as follows:
E = 1 ( C O G 2 y C O G 1 y ) ( C O G 2 x C O G 1 x ) 1 0 0 0 1 ( C O G 3 y C O G 1 y ) ( C O G 3 x C O G 1 x ) 0 1 0 0 1 ( C O G 4 y C O G 1 y ) ( C O G 4 x C O G 1 x ) 0 0 1 0 1 ( C O G ( N + 1 ) y C O G 1 y ) ( C O G ( N + 1 ) x C O G 1 x ) 0 0 0 1 N × ( N + 3 )
where  C O G ( N + 1 )  represents the center of gravity of the Nth point absorber.

2.2. Assessment of Point-Absorber Power Generation

Based on the multi-body frequency-domain hydrodynamic coupling model for multiple point absorbers, the average power generation of the Nth point absorber  P a v e ( N )  can be determined as follows [47]:
P a v e ( N ) ( i ω ) = 1 2 B p t o N ω 2 x 3 ( i ω ) x ( 6 N + 3 ) ( i ω ) 2
The  q  factor represents the impact of wave interactions on power absorption for the WEC arrays and can be expressed as follows [48]:
q ( ω ) = P a v e ( 1 ) ( ω ) + P a v e ( 2 ) ( ω ) + + P a v e ( N ) ( ω ) N P i s o l a t e d ( ω )
If  q < 1 , it indicates that the average power generation of each WEC in the array is less than the power generation of an isolated WEC. Therefore, it can be considered that wave interactions have an adverse effect on the energy absorption of WECs in the wave field. Conversely, if  q > 1 , this effect is considered advantageous.
Additionally, the Capture Width Ratio (CWR) is a crucial metric for assessing the efficiency of a WEC in capturing wave energy. It can be expressed as follows [49]:
C W R = P D P w
where P represents the output power of the point absorber. D is the capture width, which refers to the diameter of the point absorber.  P w  is the incident power of the wave per unit width and can be expressed as follows:
P w = 1 16 ρ g H 2 ω k 0 1 + 2 k 0 d sinh 2 k 0 d
where  k 0  represents the wave number, d is the water depth, and H is the wave height.
To estimate the power generation of the point absorber in real sea conditions, the use of the Power Spectral Density (PSD) spectrum to describe the wave energy density and obtain the probability distribution of waves at different frequencies is proposed. This will be combined with information about the wave conditions at the testing site and the average power generation obtained from Equation (15) to obtain the expected power in the target marine area. The widely used JONSWAP spectrum, with its wave spectral density function  S ω , can be expressed as follows [50]:
S ω = 5 16 H s 2 ω p 4 ω 5 exp 5 ω p 4 4 ω 4 A γ γ a
where  H s  represents the significant wave height,  ω p  is the peak frequency,  γ  is the peak factor,  A γ = 1 0.287 ln ( γ )  is a normalizing factor, and the coefficient  a  can be expressed as follows:
a = exp [ ω ω p 2 2 σ 2 ω p 2 ]
When  ω ω p σ = 0.07 , and when  ω > ω p σ = 0.09 .
Therefore, the expected power of the point absorber  W E x p e c t e d  in the target marine area can be calculated as follows [51]:
W E x p e c t e d = F ω p , H s P a v e ω S ω 0 S ω d ω d ω
where  F ω p , H s  is the two-dimensional probability distribution related to the peak frequency and significant wave height, which is based on the wave conditions at the testing site.

3. Layout of Wind–Wave Platform and Hydrodynamic Analysis

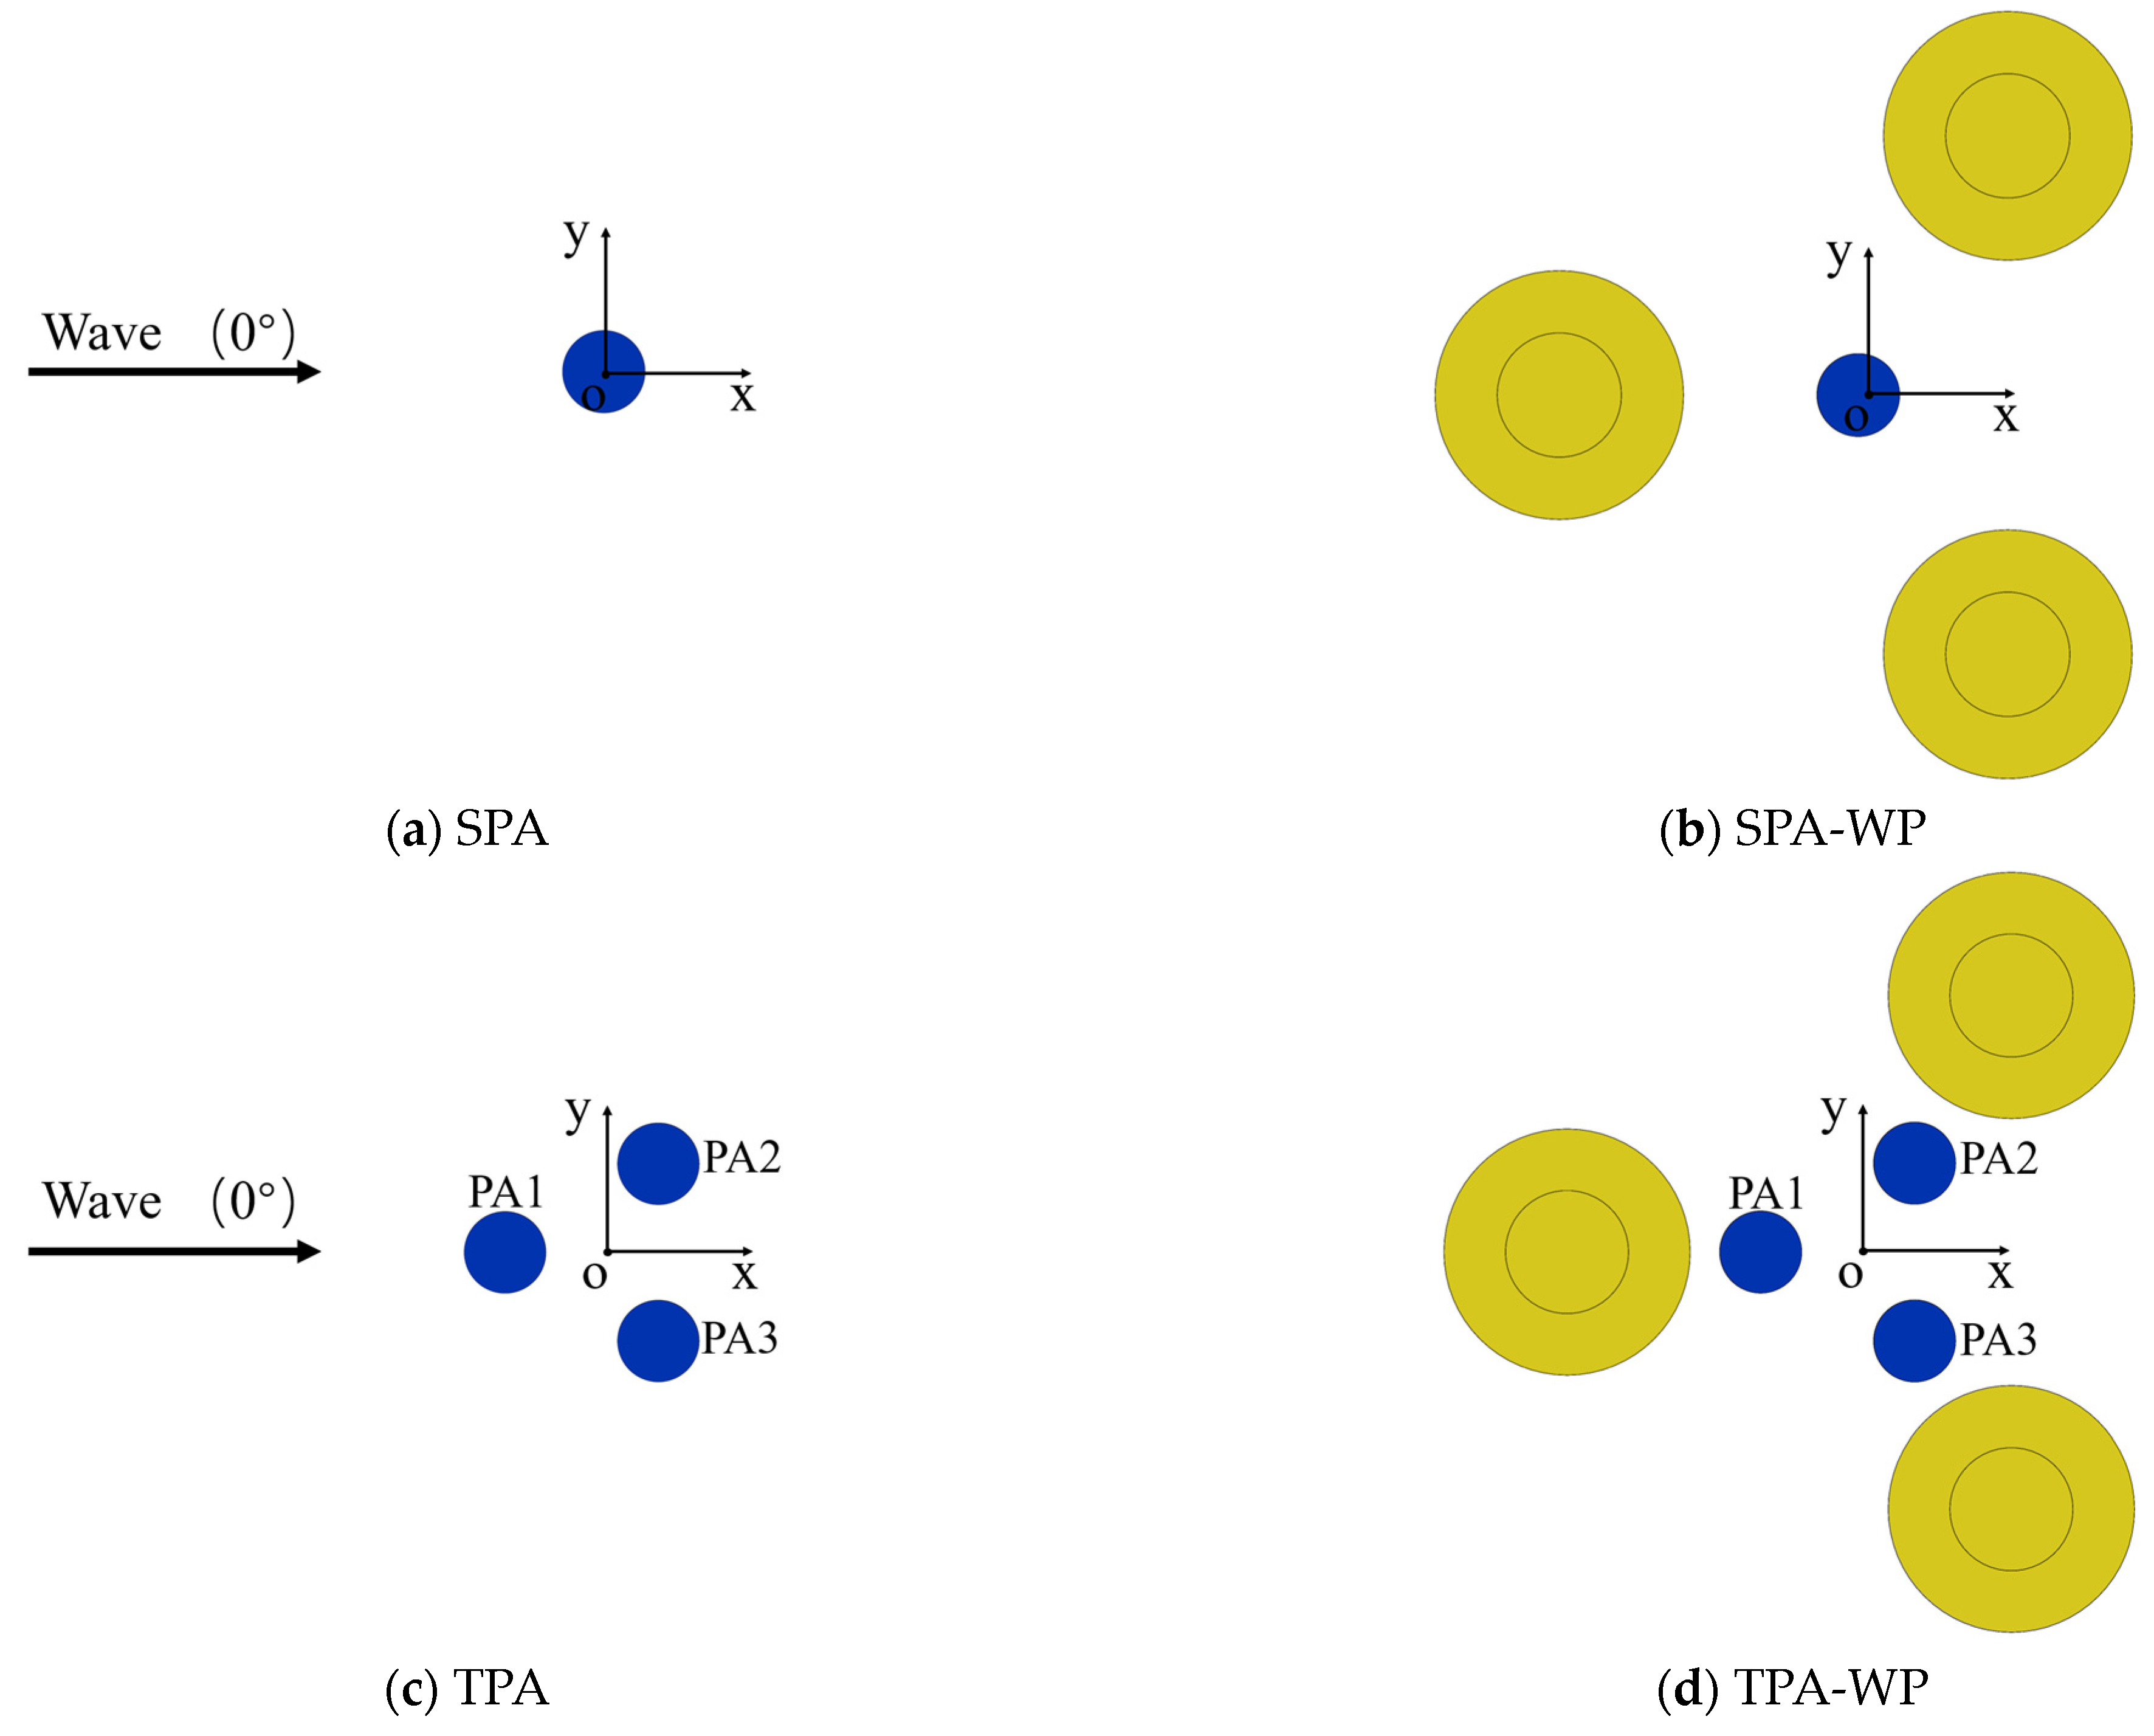
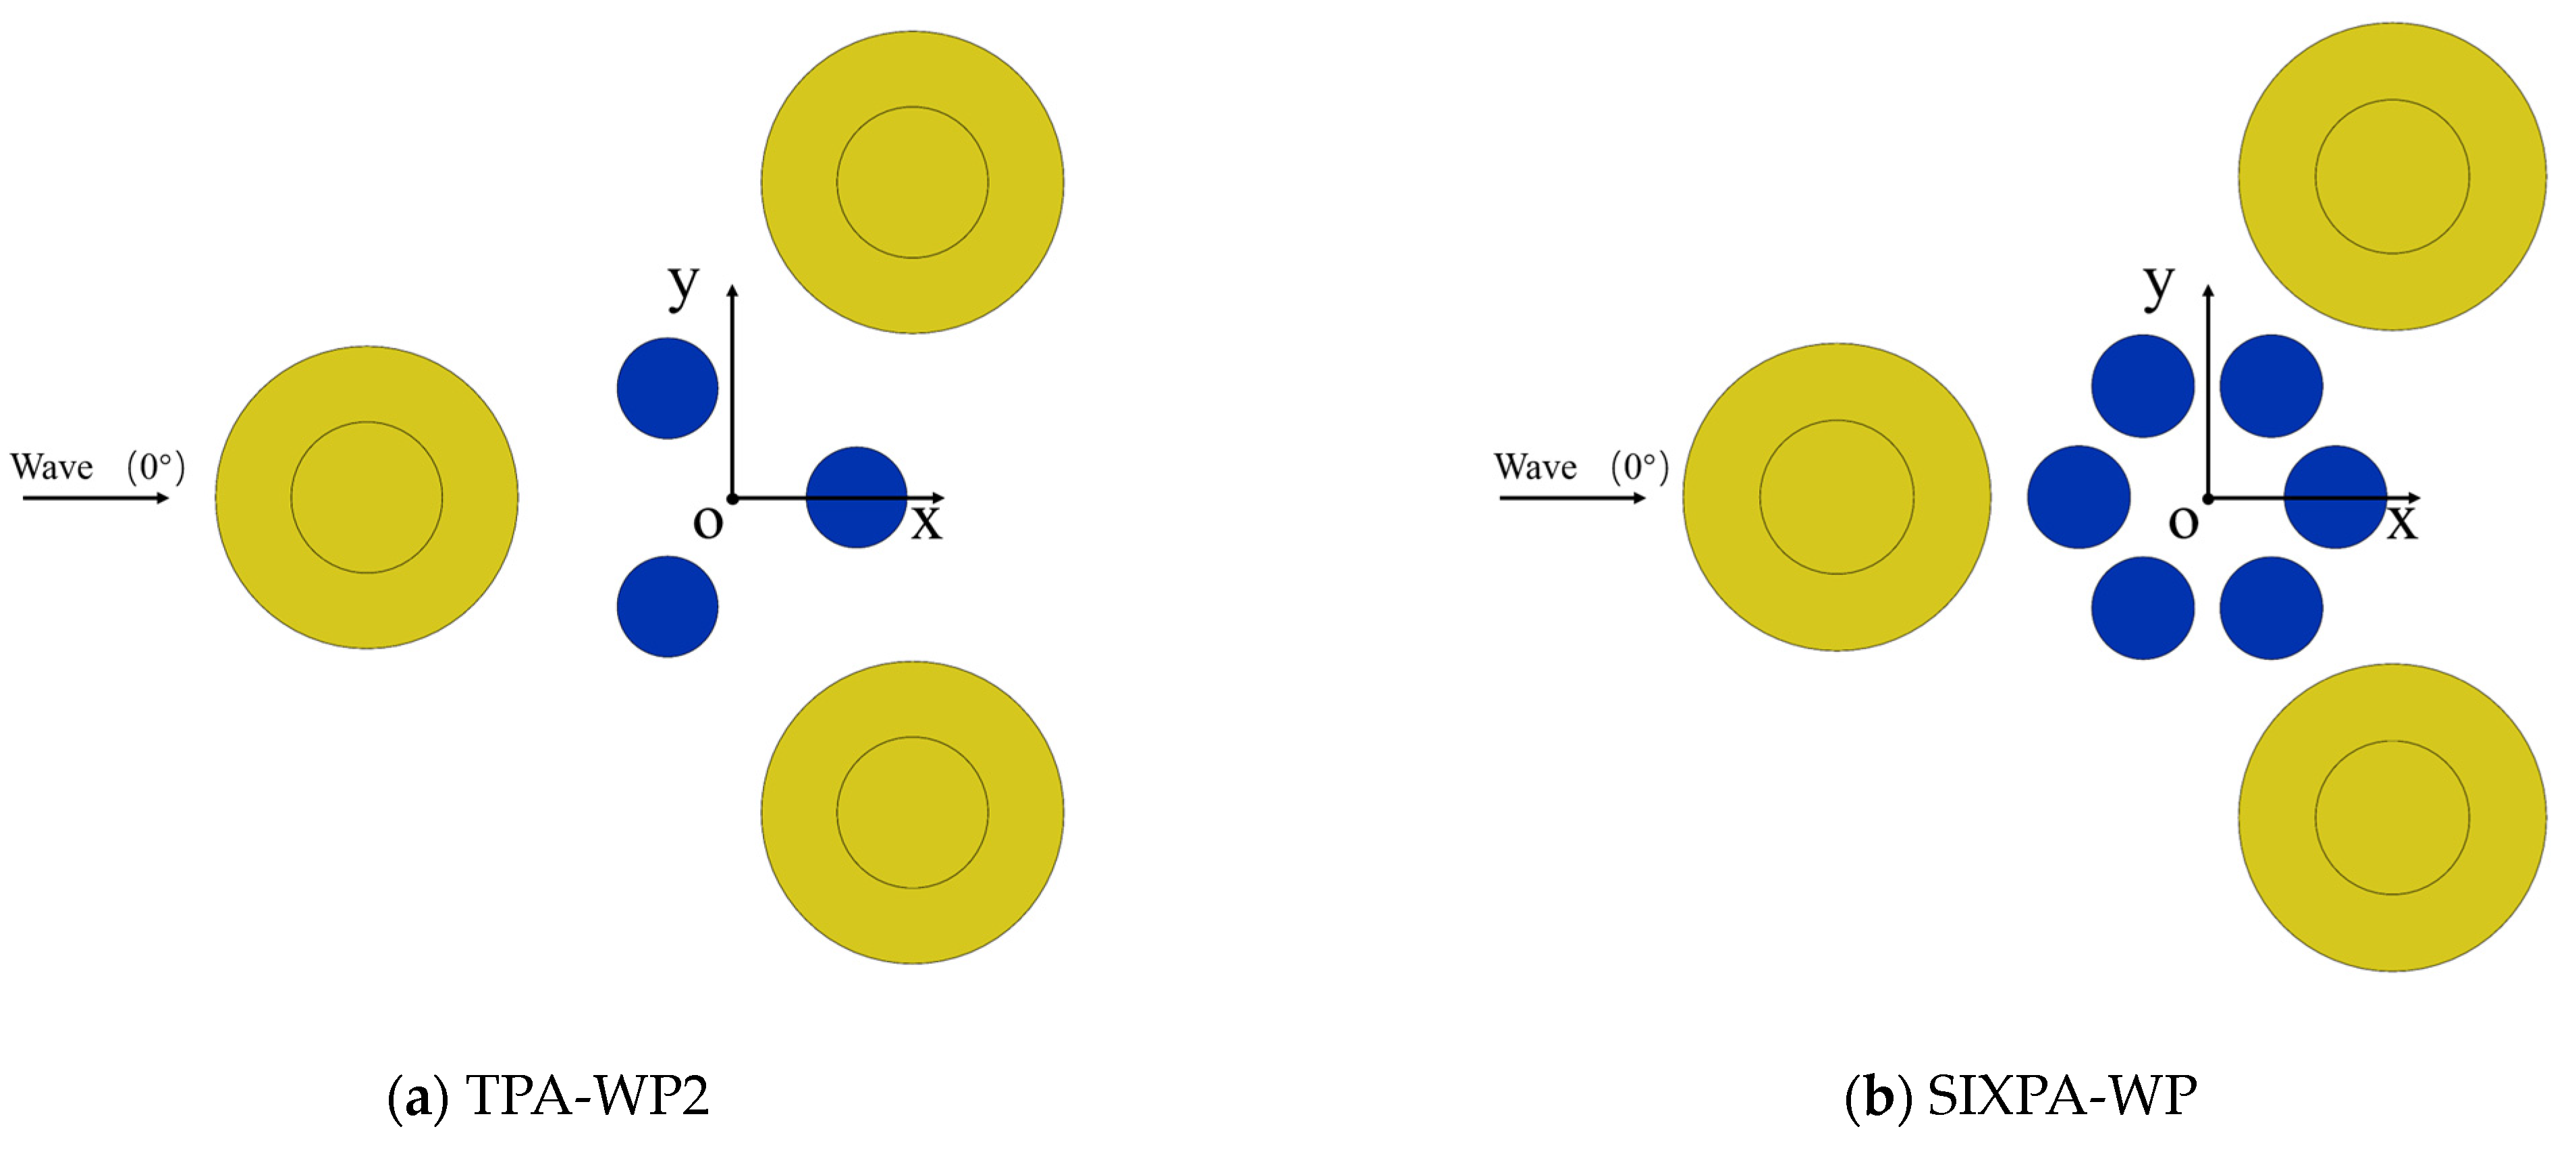
3.1. Layout of Floating Wind–Wave Power Generation Platform

The floating wind–wave power generation platform consists of an OC4 semi-submersible floating wind turbine [52] and point absorbers with identical sizes, as shown in Figure 3. The point absorbers and the floating platform only experience vertical relative motion. The PTO system is installed on top of the platform support, utilizing the relative motion for power generation. Table 1 and Table 2 provide detailed dimensions of the platform and point absorbers.

3.2. Multi-Body Hydrodynamic Analysis

Four models for different layouts were established in hydrodynamic analysis: single point absorber (SPA), single point absorber combined with a floating wind turbine platform (SPA-WP), three point absorbers (TPA), and three point absorbers combined with a floating wind turbine platform (TPA-WP), as shown in Figure 4. The wave exciting forces and hydrodynamic coefficients were determined using commercial software ANSYS-AQWA version 2023, and the simulation flow chart is shown in Figure 5. Waves with a frequency range of  ω = 0.03   rad / s 3.00   rad / s  were selected, and an increment of  0.03   rad / s  was used to ensure the accuracy of frequency-domain calculations. The results of the added mass and radiation damping for the point absorbers with different layouts are shown in Figure 6. Overall, the added mass of the point absorbers in different layouts tends to remain constant at high wave frequencies. When a floating platform exists (SPA-WP and TPA-WP in Figure 6), the added mass of the point absorbers increases slightly at a low wave frequency, and this effect is further amplified when three point absorbers are arranged. Additionally, regardless of whether a floating platform or an array arrangement is being considered, the radiation damping of the point absorbers tends to approach zero at low and high wave frequencies, with varying degrees of peak increase. Due to the presence of the platform, multiple peaks in radiation damping become significant, with the SPA-WP model demonstrating the most significant impact. When comparing the surface contour of waves for different layouts under an incident wave heading of 0 degrees, as illustrated in Figure 7, it becomes apparent that the floating platform induces a pronounced wave-focusing effect. This effect leads to a substantial increase in wave crest amplitudes within the interior of the platform. Further investigation into the changes in the Response Amplitude Operator (RAO) for the motion of each model is shown in Figure 8. It is observed that considering a floating platform significantly increases the peak RAO of the point absorbers, and a secondary peak of similar magnitude appears due to hydrodynamic interference. Additionally, when considering a point-absorber array, the peak RAO of two of the point absorbers is enhanced, while the peak of the other one decreases. Therefore, the impact of array arrangement on the performance of the power generation platform requires further study.

4. Optimization of Power Generation in Frequency Domain

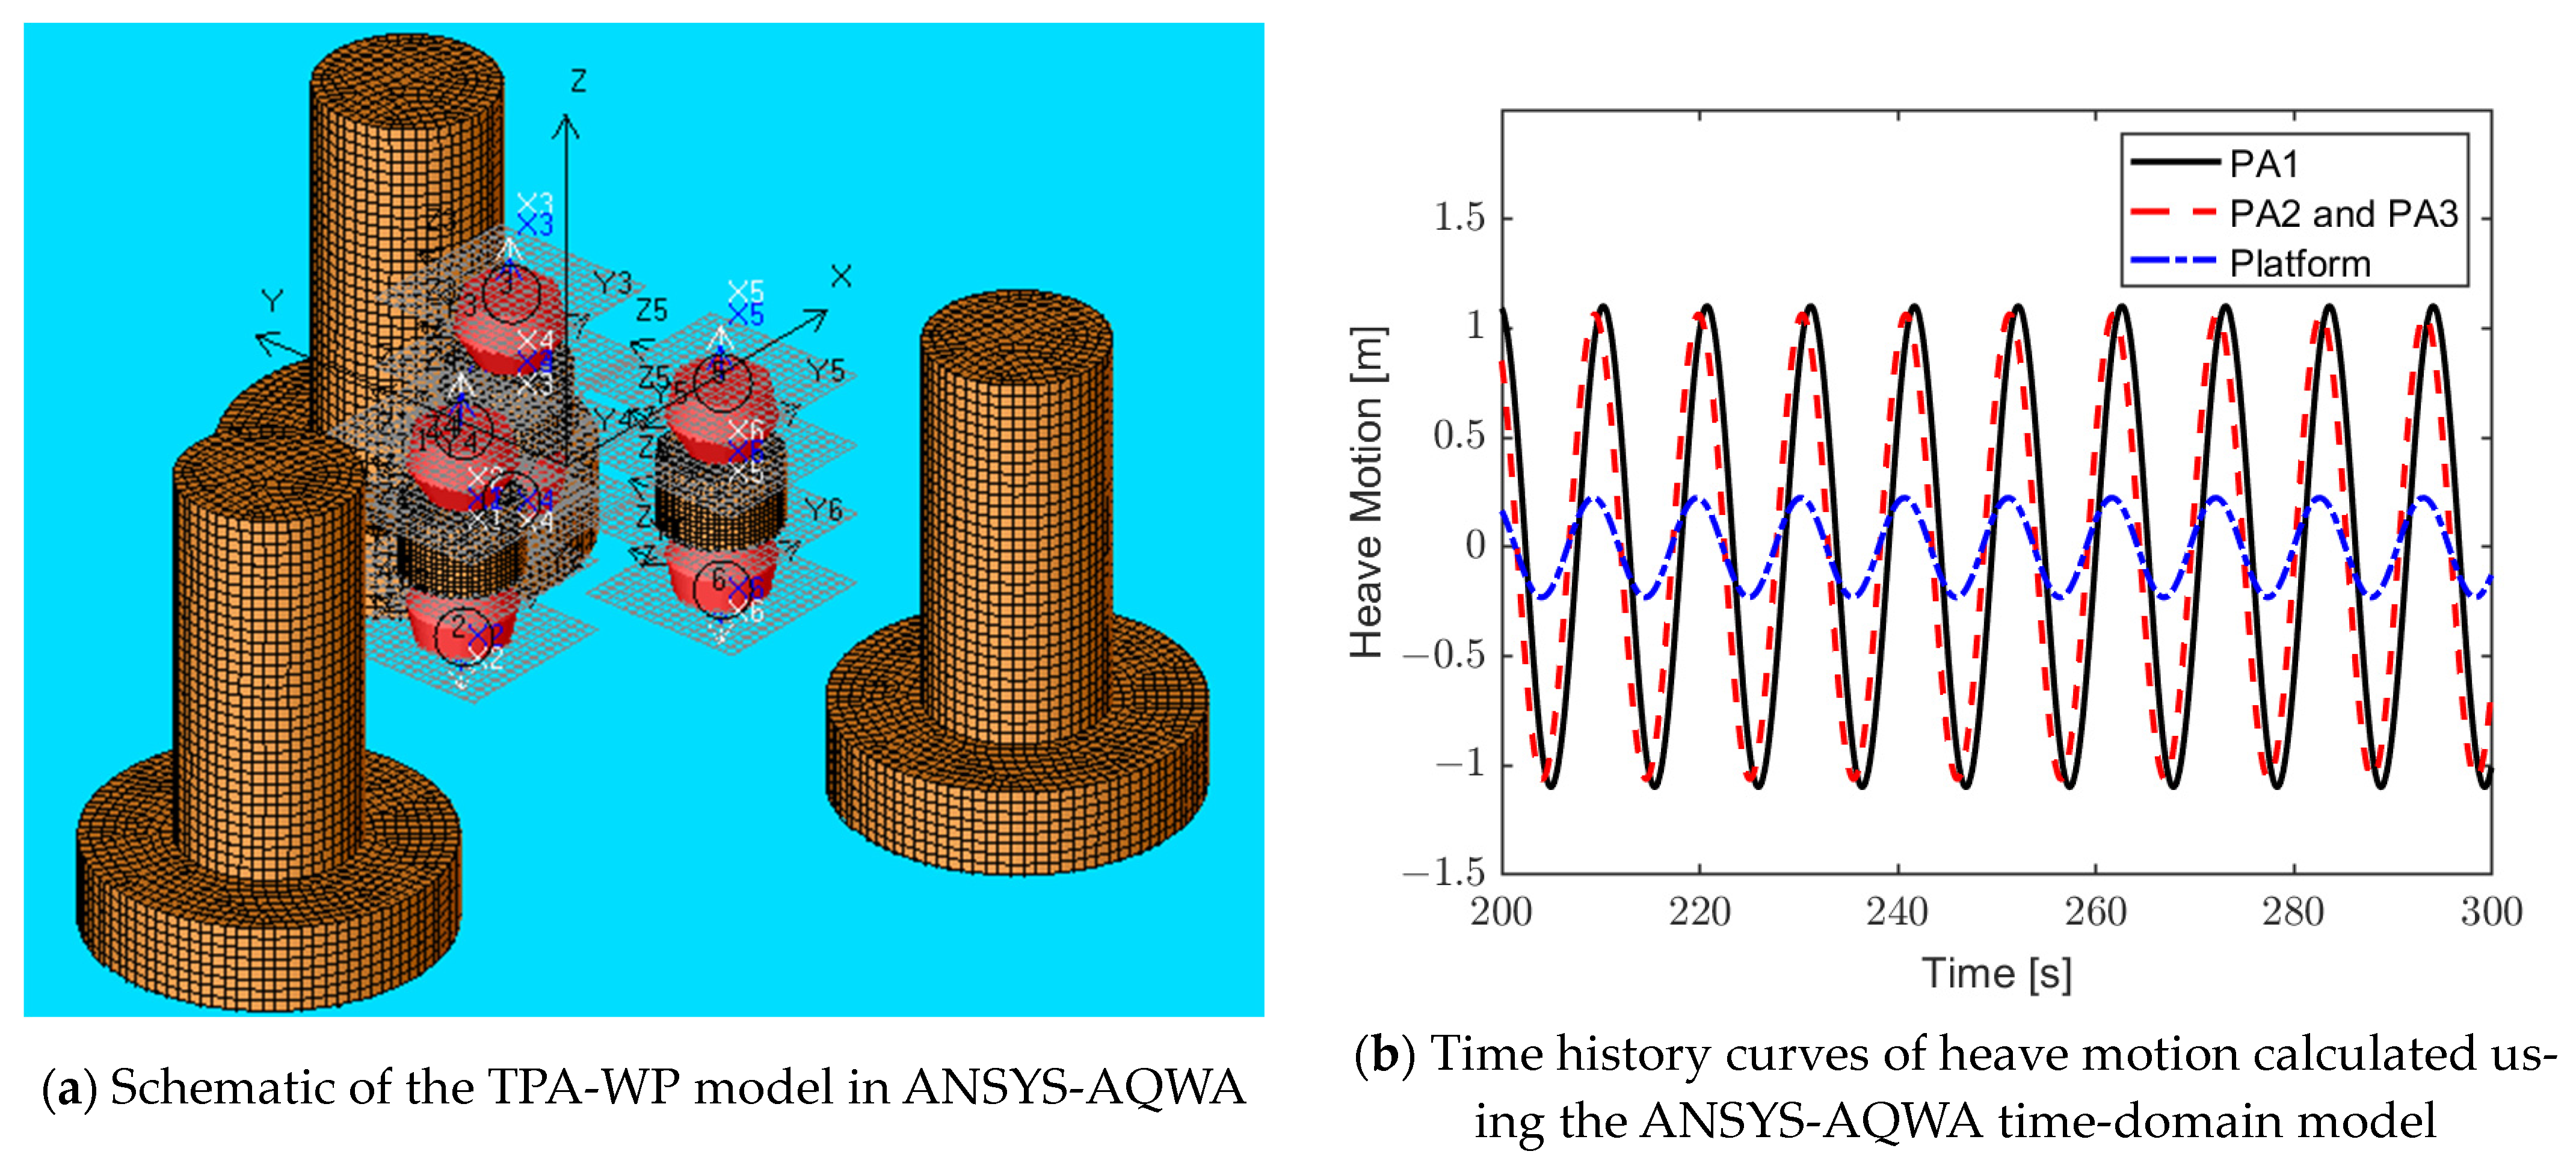
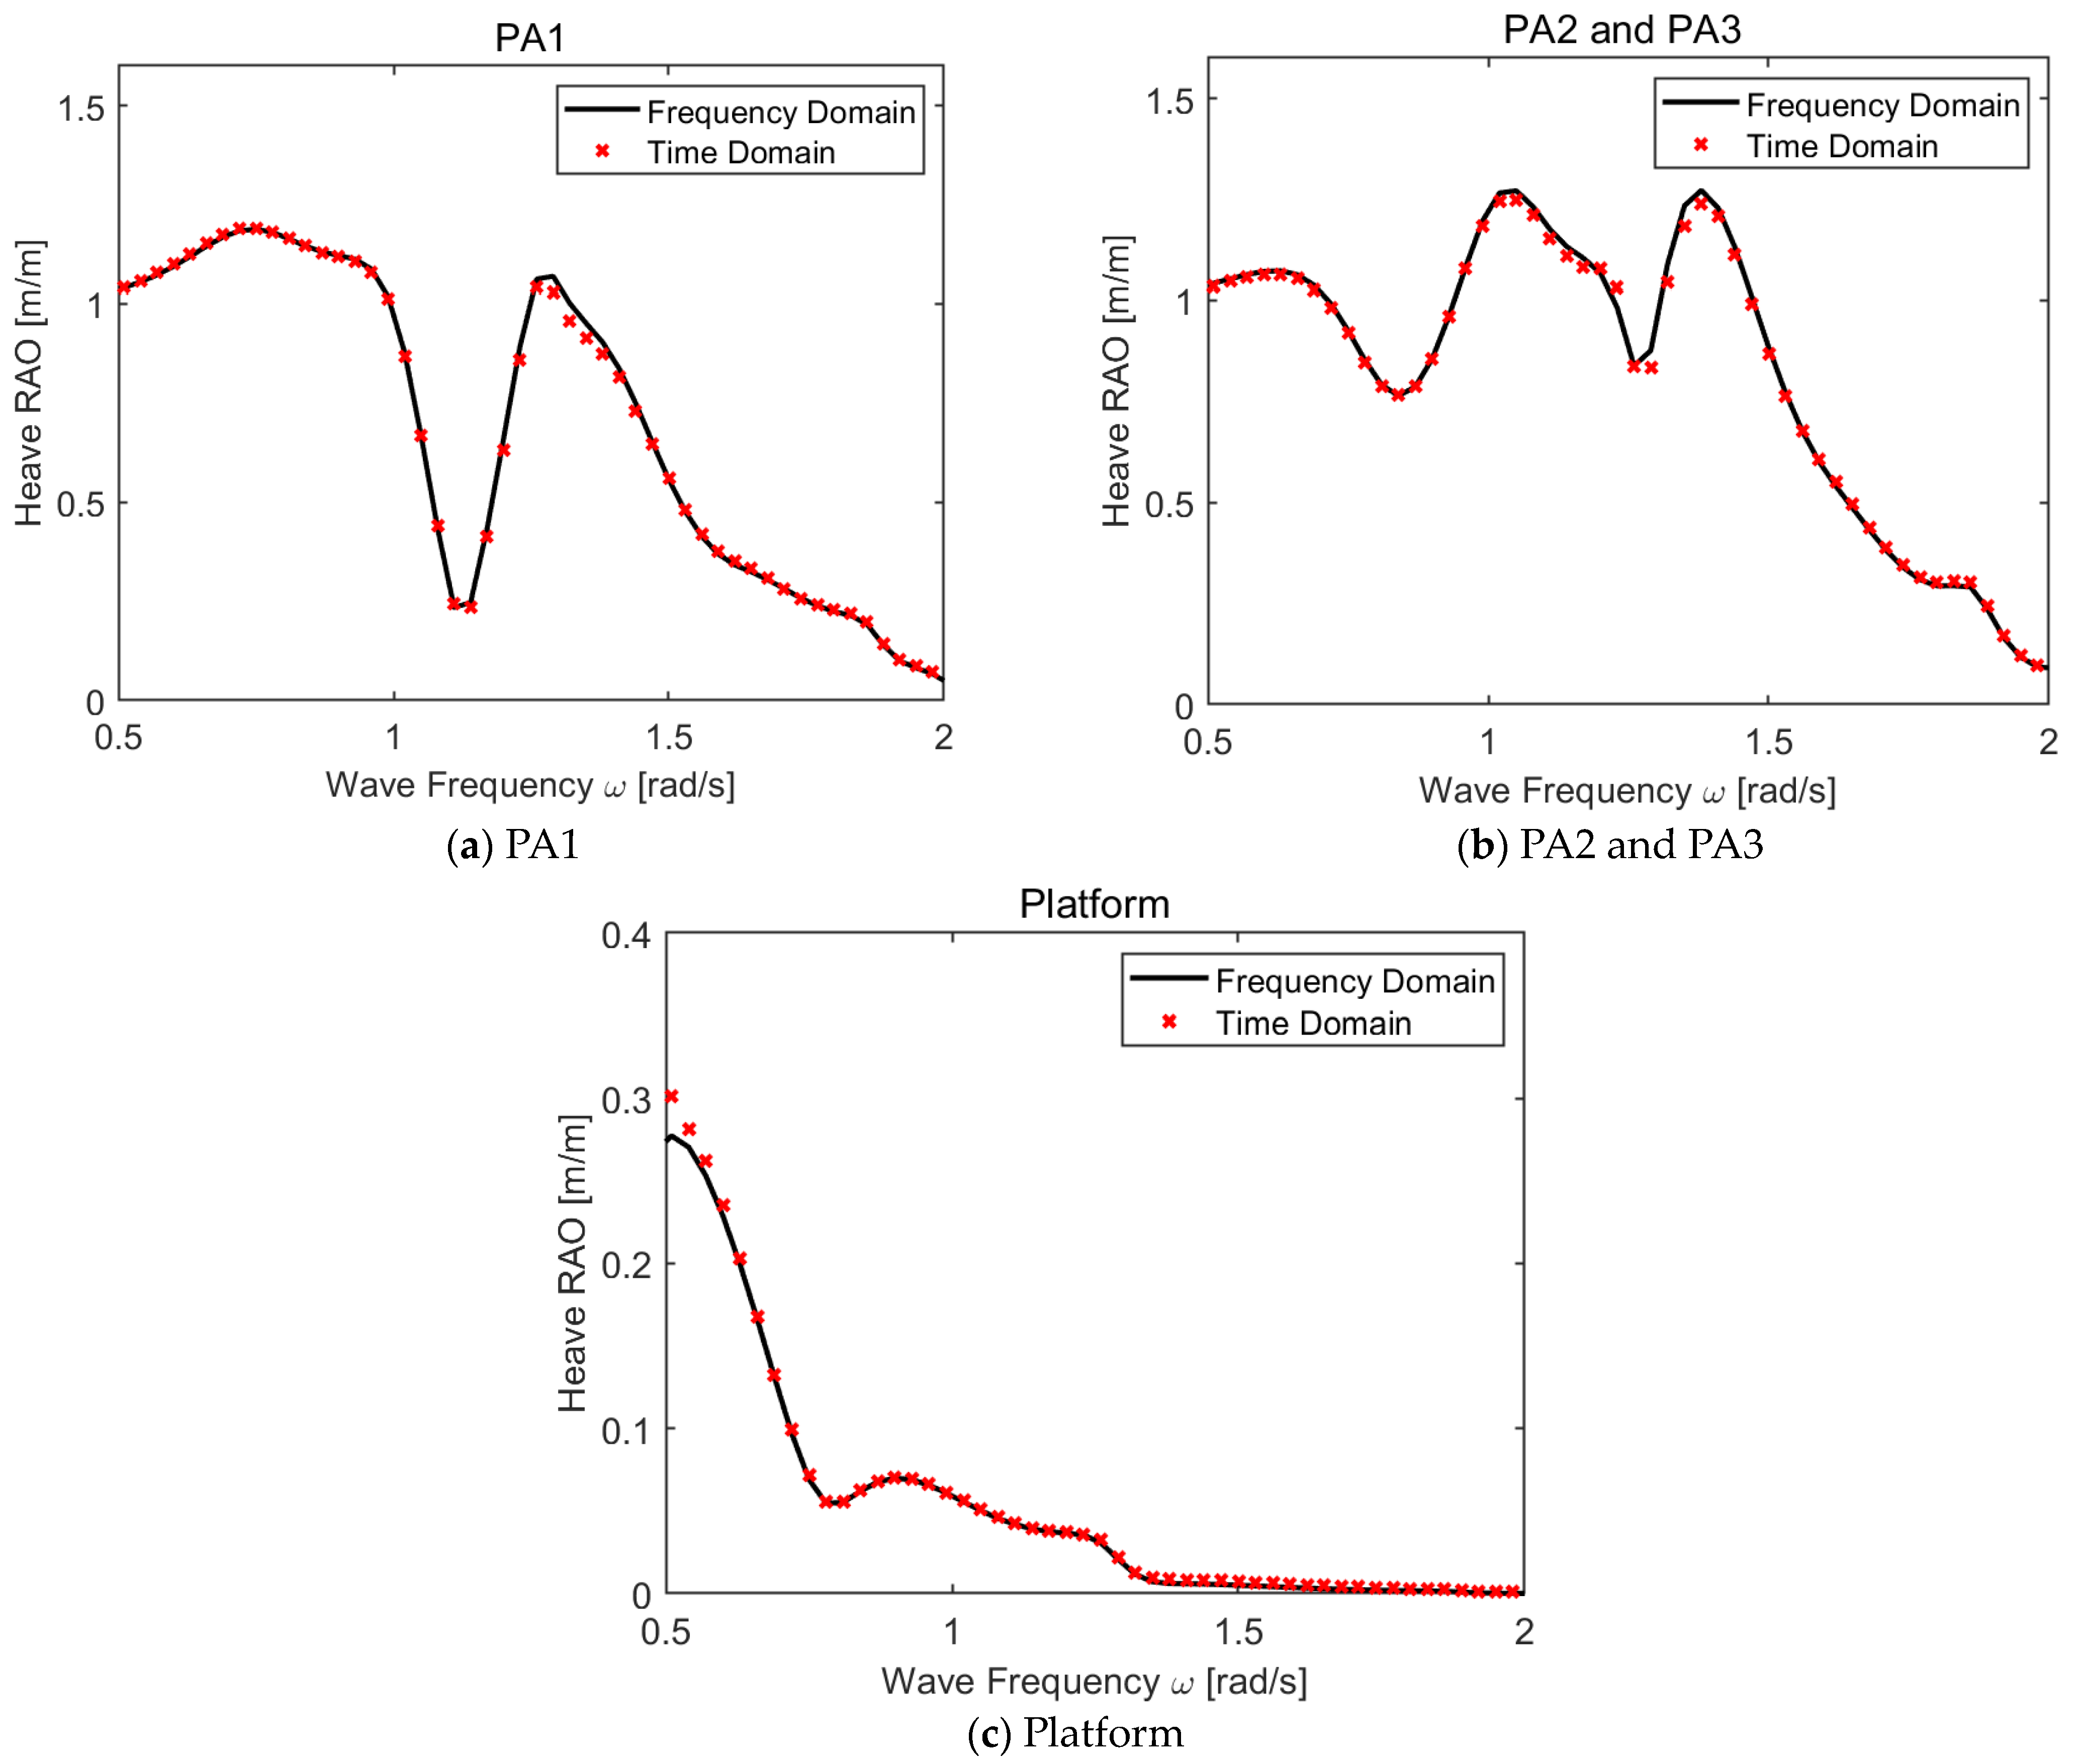
4.1. Verification of Motions of Multiple Floating Bodies with Constraints

To validate the accuracy of the developed frequency-domain model, a linear PTO was added to the hybrid system. Taking the TPA-WP model as an example, a PTO stiffness of 5000 N/m and a PTO damping coefficient of 45,000 Ns/m were selected. The research of Zou et al. [43] shows that the numerical simulation results of ANSYS-AQWA for a multi-body system have good agreement with the experimental data when in open water. Thus, a time-domain model for constrained motion was established using ANSYS-AQWA, and the Fender module was utilized to simulate the PTO system. An infinite distance Hinged Joint module was employed to represent the vertically constrained motion between the floating platform and the point absorber, as illustrated in Figure 9a, in ANSYS-AQWA. The heave motion of the point absorbers and platform under regular waves from a direction of −180° with a height of 2.0 m and frequency of 0.6 rad/s was calculated as shown in Figure 9b. The time histories of heave motion were statistically analyzed to derive response amplitudes. These amplitudes were then compared with the RAO directly computed through the frequency-domain model, as depicted in Figure 10. It can be observed that excellent agreements have been achieved between the results from present frequency-domain calculations and those obtained from the time domain using ANSYS-AQWA.

4.2. Optimization of PTO

The influence of the PTO on the performance of the point absorber was investigated. With a given PTO damping coefficient of 45,000 Ns/m, the contour diagrams in Figure 11 show the CWR of the point absorber under different PTO stiffness values and wave frequencies for a −180° head wave. In the simulated scenarios, the range of PTO stiffness was from 0 to 5 × 10⁵ N/m. The maximum CWR values in Figure 11 were statistically analyzed, as shown in Table 3. It can be observed that the CWR of the point absorber decreases as the PTO stiffness increases in all four models. The optimal PTO stiffness values are found within the range of 0–104 N/m, with the maximum CWR occurring at a stiffness value of 0, corresponding to wave frequencies near the natural frequency of the point absorber. Furthermore, comparing Figure 11b and Figure 11f, it is noted that when a floating platform is considered, the CWR exhibits a secondary peak near a wave frequency of 1.7 rad/s. The stiffness values corresponding to this secondary peak are different from those at the primary peak. Figure 12 illustrates the relative motion RAO comparison between the two models at the frequency corresponding to the secondary peak. It is observed that the RAO at the secondary peak frequency has increased, and the spectral width is wider compared to the case with a stiffness value of 0. This reflects that considering the floating platform alters the system’s motion characteristics and alters the original power generation mode of the point absorber. Therefore, to determine the optimal PTO parameters, a PTO stiffness of 10−6 N/m is selected for further research.
Further research on the influence of the PTO damping coefficient is presented. The contour diagrams in Figure 13 depict the CWR of the point absorber for different PTO damping coefficient values and wave frequencies. The statistical results for the maximum CWR are shown in Table 4. It is evident that considering the floating platform leads to a significant increase in CWR, regardless of the number of point absorbers. When a single point absorber is placed on the floating platform, the CWR increases 82%. Furthermore, when three point absorbers are placed on the floating platform, a more pronounced bimodal pattern in the CWR emerges. One peak is close to the natural frequency of the point absorber, indicating the dominance of the individual point absorbers in relative motion. The maximum CWR tends to reach another peak, with the corresponding wave frequency shifting towards the natural frequency of the platform. Additionally, the optimal PTO damping coefficient increases 372.3% and 386.7% separately. Comparing the CWR under the optimal damping coefficient for each model, as shown in Figure 14, it is evident that the SPA-WP model outperforms the SPA model overall. Under the TPA-WP model, the peak frequency shifts significantly towards lower wave frequency, and with increasing wave frequency, the CWR decreases more gradually compared to the other models. This suggests that placing point absorbers in an array configuration on a floating foundation can alter its working conditions to adapt to a wider range of wave frequencies.
To investigate the impact of array placement on the power generation performance of point absorbers placed within a floating platform, based on the TPA-WP model, two placement schemes were considered: the second placement scheme for three point absorbers combined with a floating wind turbine platform (TPA-WP2) and six point absorbers combined with a floating wind turbine platform (SIXPA-WP), as shown in Figure 15. Based on the previous analysis of PTO parameters, the contour diagrams in Figure 16 depict the total power generation of point absorbers in each model as a function of the PTO damping coefficient and wave frequency for a −180° head wave. The maximum total power generation for each model is recorded in Table 5. It is evident that the total power generation of point absorbers with a floating platform is significantly greater than without a floating platform. Additionally, in both array placement schemes, the number of peak power generation points increases as the number of point absorbers increases. This demonstrates that array placement enables point absorbers to adapt to a wider range of wave frequencies, expanding the operational range of the hybrid system.
To investigate the influence of wave angles on power generation, considering the model’s geometric symmetry, only wave angles of −180°, −165°, −150°, −135°, and −120° are considered. Figure 17 shows the comparison of the maximum total power generation for each model. It can be observed that when the floating platform is not considered, the maximum power generation of the three-point-absorber array is roughly three times that of a single point absorber, and it is not significantly affected by wave angles. However, when considering the floating platform, both single and multiple point absorbers show a significant increase in their maximum power generation. For the single point absorber on the floating platform, its maximum power generation at −120° wave angle is even close to the total maximum power generation of the three-point-absorber array. Nevertheless, it is significantly influenced by the wave angle, with a nearly two-fold difference in maximum power generation observed between different wave angles. When comparing the two layouts (TPA-WP and TPA-WP2) for three point absorbers on the floating platform, it was found that the first placement scheme has a slightly lower overall maximum power generation than the second one. However, it is less influenced by wave angles, demonstrating a more stable performance overall.
Previous research has demonstrated that considering a floating platform can lead to an improvement in the peak performance of point absorbers. A study was conducted to investigate whether a floating platform leads to better average performance of point-absorber arrays compared to a single point absorber. A PTO damping of 2.3 × 10⁵ Ns/m was selected, and two typical wave angles at −180° and −120° were compared in terms of the total power for each model, as shown in Figure 18. Subsequently, a comparison of the q factor for each model was conducted, as shown in Figure 19. The black dashed line represents a q factor of 1. It can be observed that at wave frequencies lower than 1 rad/s, the average performance of point absorbers in different arrays is close to that of a single point absorber. Additionally, the q factors for all three array arrangements are very similar. As the frequency increases, all three array arrangements display multiple peaks at the same frequency. The maximum peak of the q factor can reach up to 70 and occurs at high frequencies where the total power tends towards zero. This reflects that even though the motion responses of each model are small at high frequencies, the hydrodynamic resonance generated by the array of point absorbers on the floating platform significantly improves their average power performance at certain specific wave frequencies. Therefore, when conducting practical engineering design, it is advisable to select sea conditions that are close to these peak frequencies, which will also be the subject of future research.

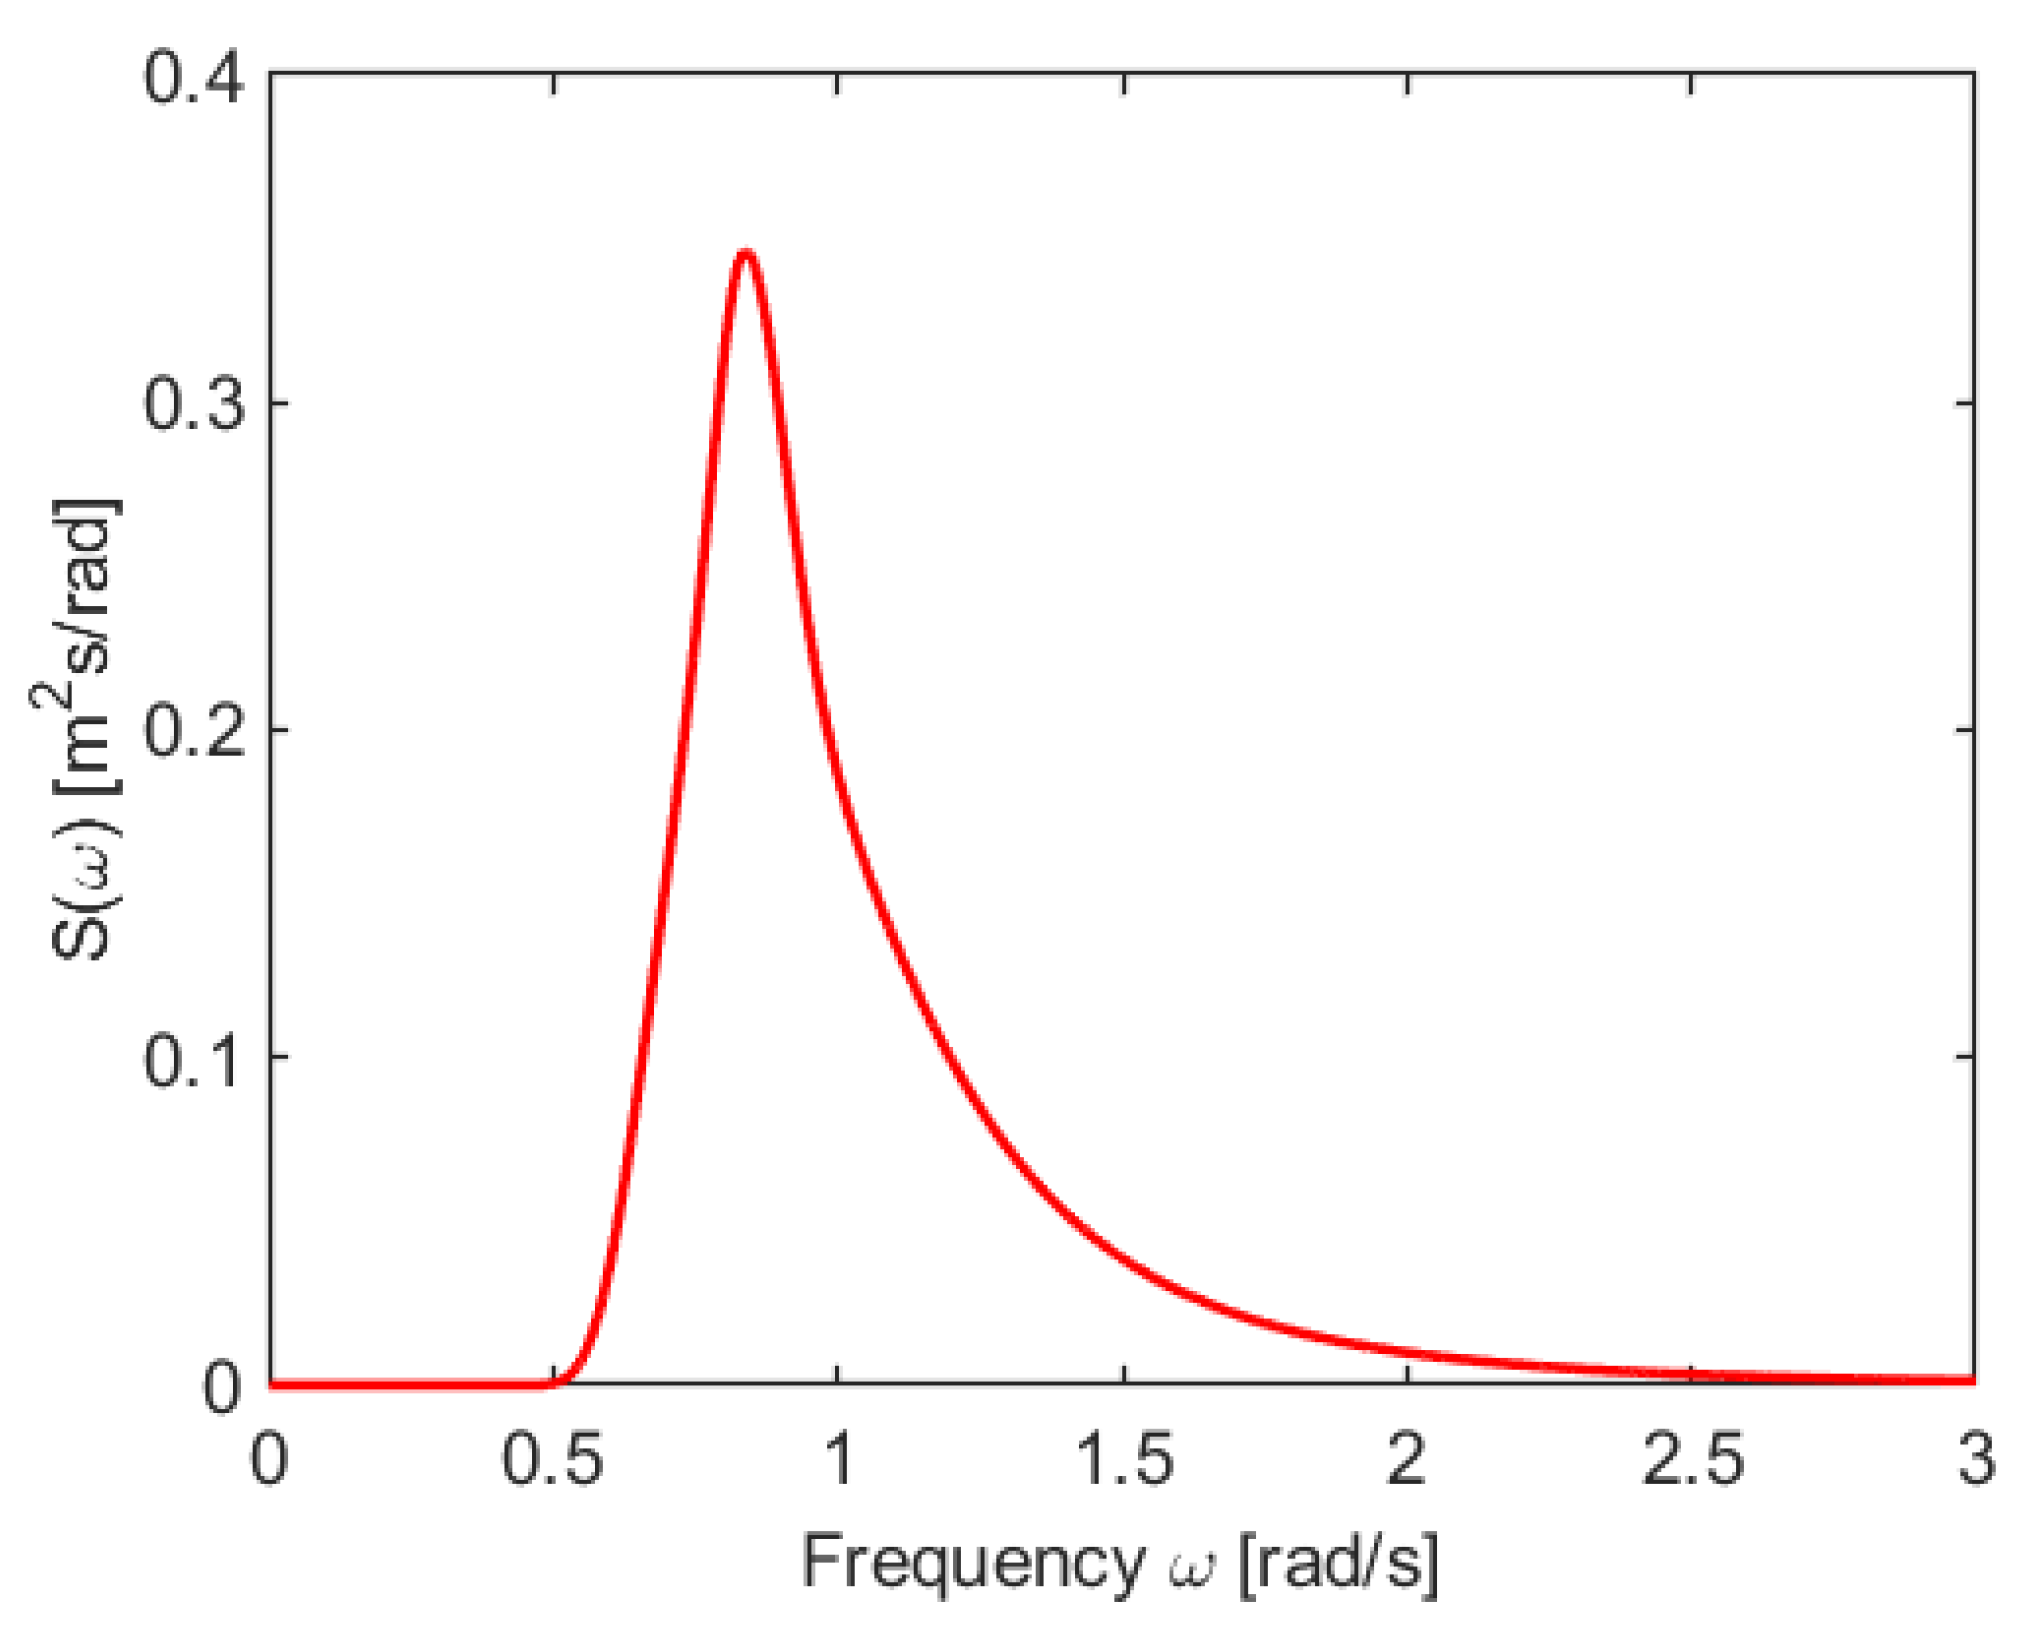
4.3. The Expected Power in the South China Sea

Previous studies have concentrated on parameter optimization for point absorbers under regular wave conditions, which may not be universally applicable. To predict the performance of the model under real sea conditions, data from the South China Sea were selected. Figure 20 presents wave scatter data obtained from multiple locations in the northern part of the South China Sea, where water depths exceed 150 m [53]. The numbers in the first row represent the peak wave period Tp (s), while the numbers in the first column represent significant wave height Hs (m).
According to Equation (19), the power density spectrum for each peak wave period and significant wave height was calculated, with a peak factor γ of 1.5 chosen based on the condition in the South China Sea. Figure 21 shows the PSD diagram for Tp = 7.5 s and Hs = 1.5 m. After the PSD was normalized and combined it with the total power generation results calculated in the frequency domain, two typical wave angles, −180° and −120°, were selected. The variation in expected power with PTO damping for each model was obtained using equation 1, as shown in Figure 22. The dotted lines and asterisks represent the coordinates of the highest expected power. It can be observed that, unlike regular wave analysis in the frequency domain, under real sea conditions, the optimal PTO damping coefficient for each model is around 3.5 × 10⁵ N/m, showing significant differences from the result in Table 1. Although the PA-WP model exhibits the best performance in terms of power generation, its expected power is only slightly improved compared to SPA and even occasionally falls below the performance of SPA. This suggests that while the SPA-WP solution may have better peak performance, its performance stability across all wave frequencies is relatively poor. Similarly, when comparing the two layout options for the three point absorbers (TPA-WP and TPA-WP2), it is evident that the second layout option yields significantly higher expected power than the first. The first layout option also exhibits performance close to that of TPA, indicating that it is more affected by the wave angle. Finally, the model with six point absorbers (SIXPA-WP) demonstrates more stable performance, suggesting that the placement scheme with six point absorbers is better suited for the sea conditions in the South China Sea.

5. Conclusions

This paper discusses the motion and power generation mechanisms of a floating wind–wave power generation platform composed of multiple point absorbers and a semi-submersible floating platform. A comparative analysis was conducted to investigate the differences between different layouts in the frequency domain. The time-domain outcomes obtained through ANSYS-AQWA were utilized to validate the frequency-domain model of the multi-body constrained motion that had been established. Subsequently, a parametric analysis of PTO parameters was carried out, leading to the determination of optimal PTO parameters for each model, along with an analysis of the performance variations of point absorbers under different layouts. Finally, the expected power in the South China Sea was calculated for each model, revealing variations compared to the parameter analysis. From this research, several conclusions can be drawn:
(1)
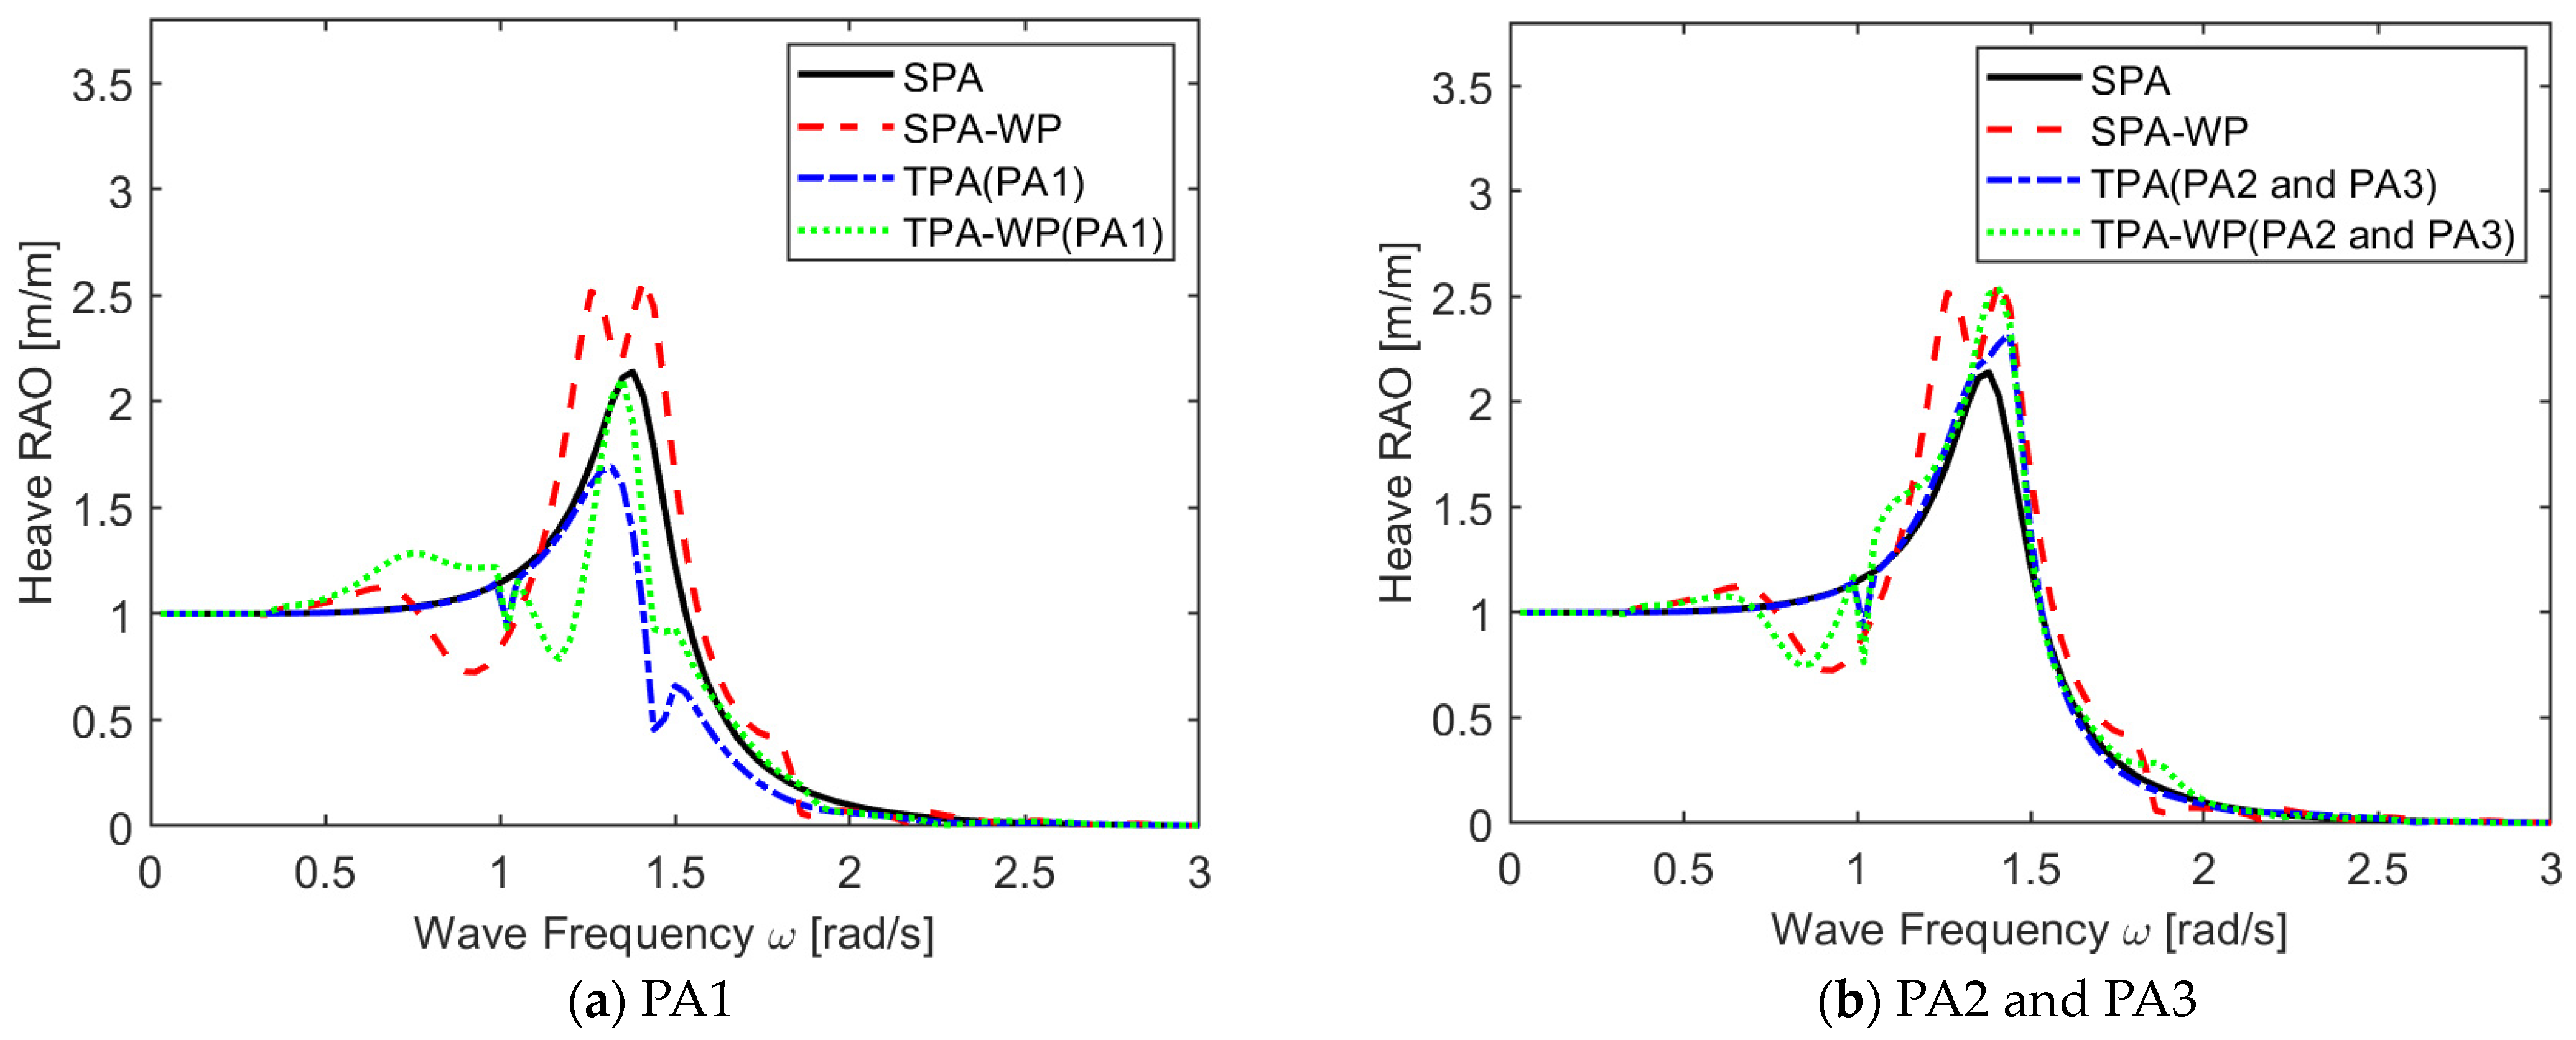
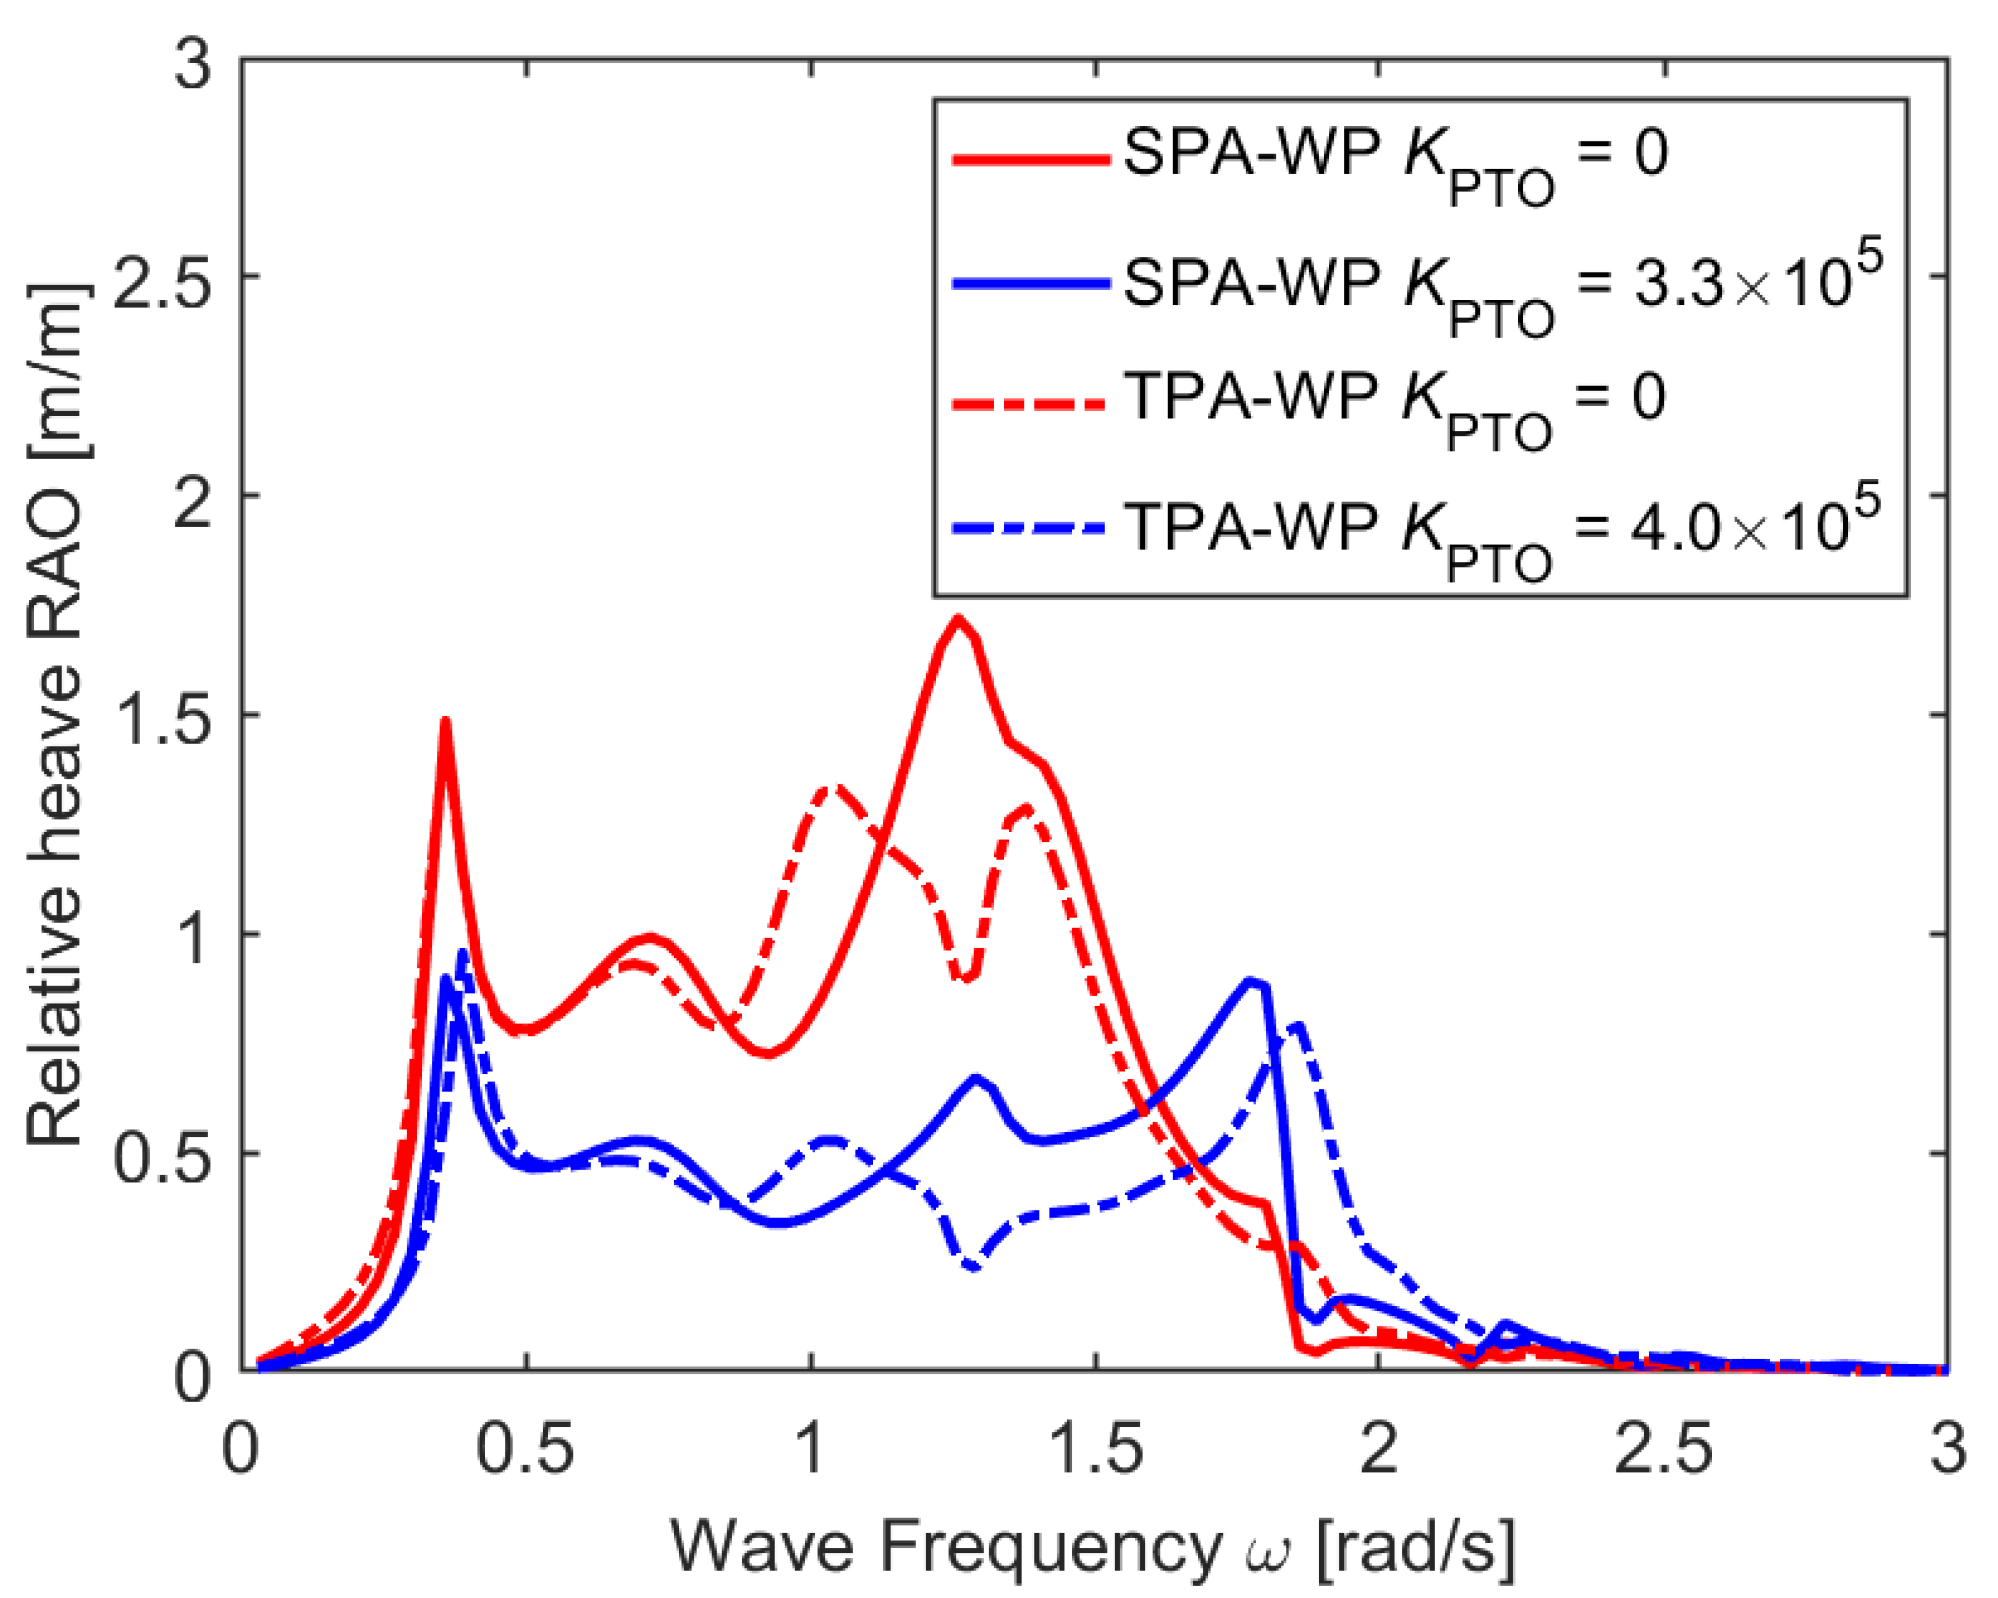
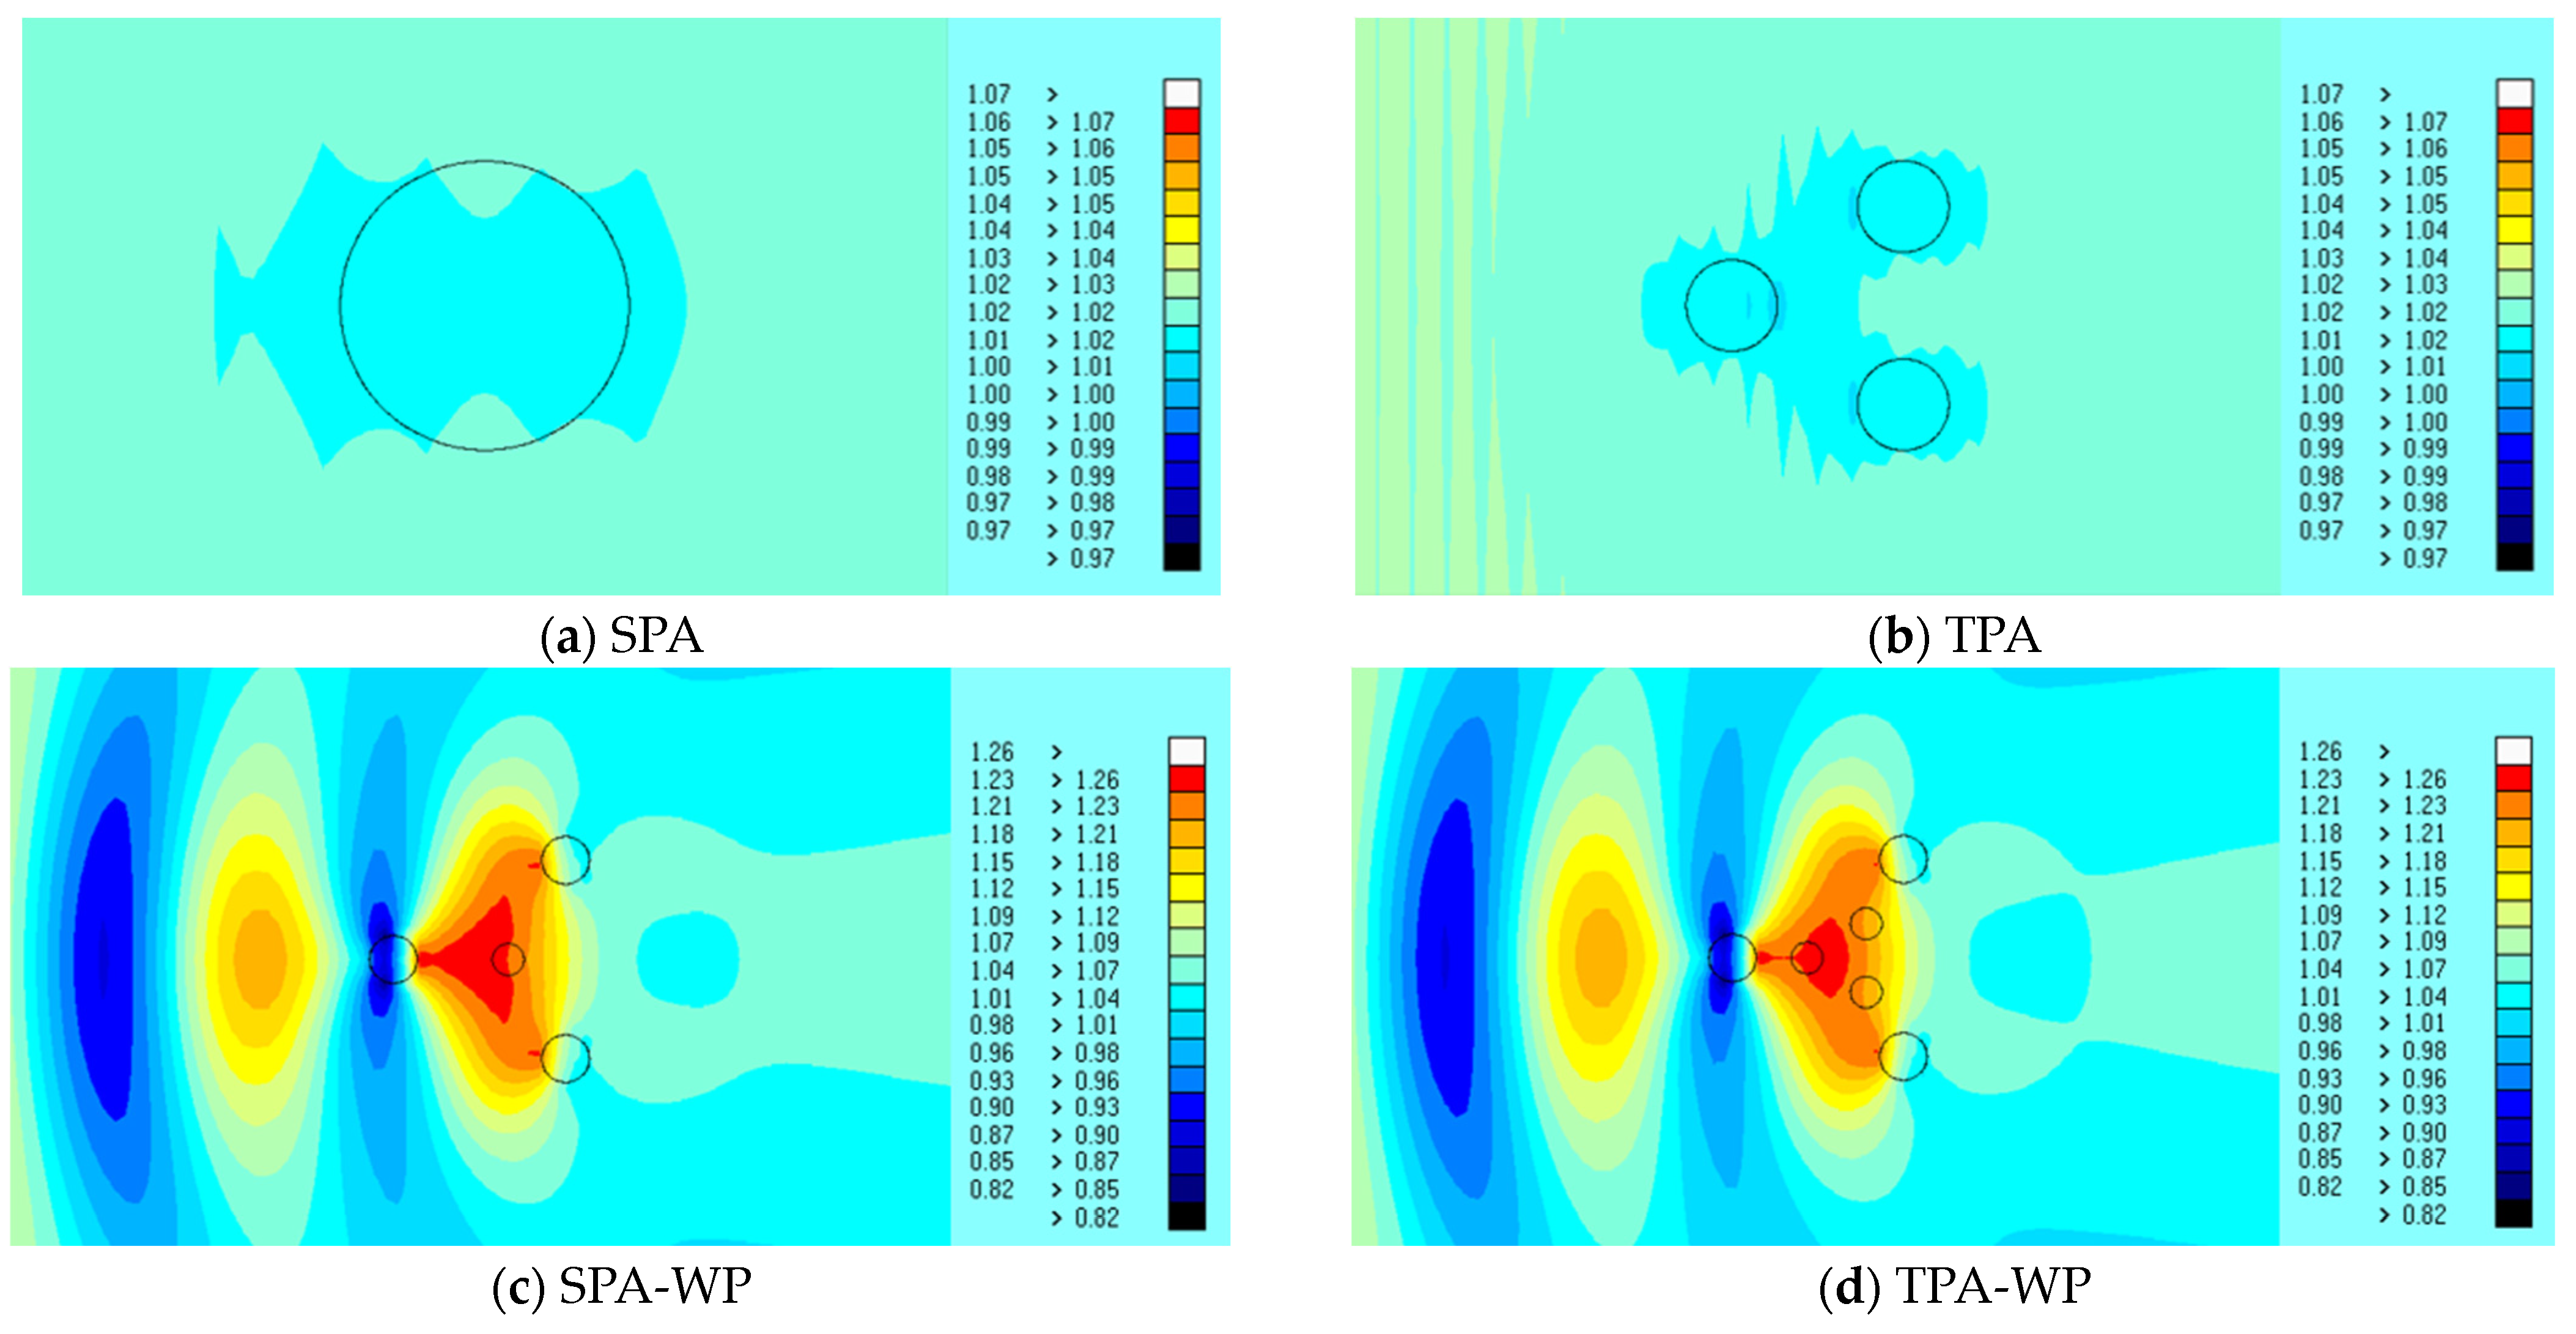
The hydrodynamic coefficients in the heave DOF of the point absorbers are significantly influenced by the floating platform. Regardless of the arrangement of point absorbers on the platform, both added mass and radiation damping exhibit varying degrees of increase. This leads to higher RAO peak values compared to the model without a floating platform. The hydrodynamic coefficients of the floating platform, however, are minimally affected by the point absorbers.
(2)
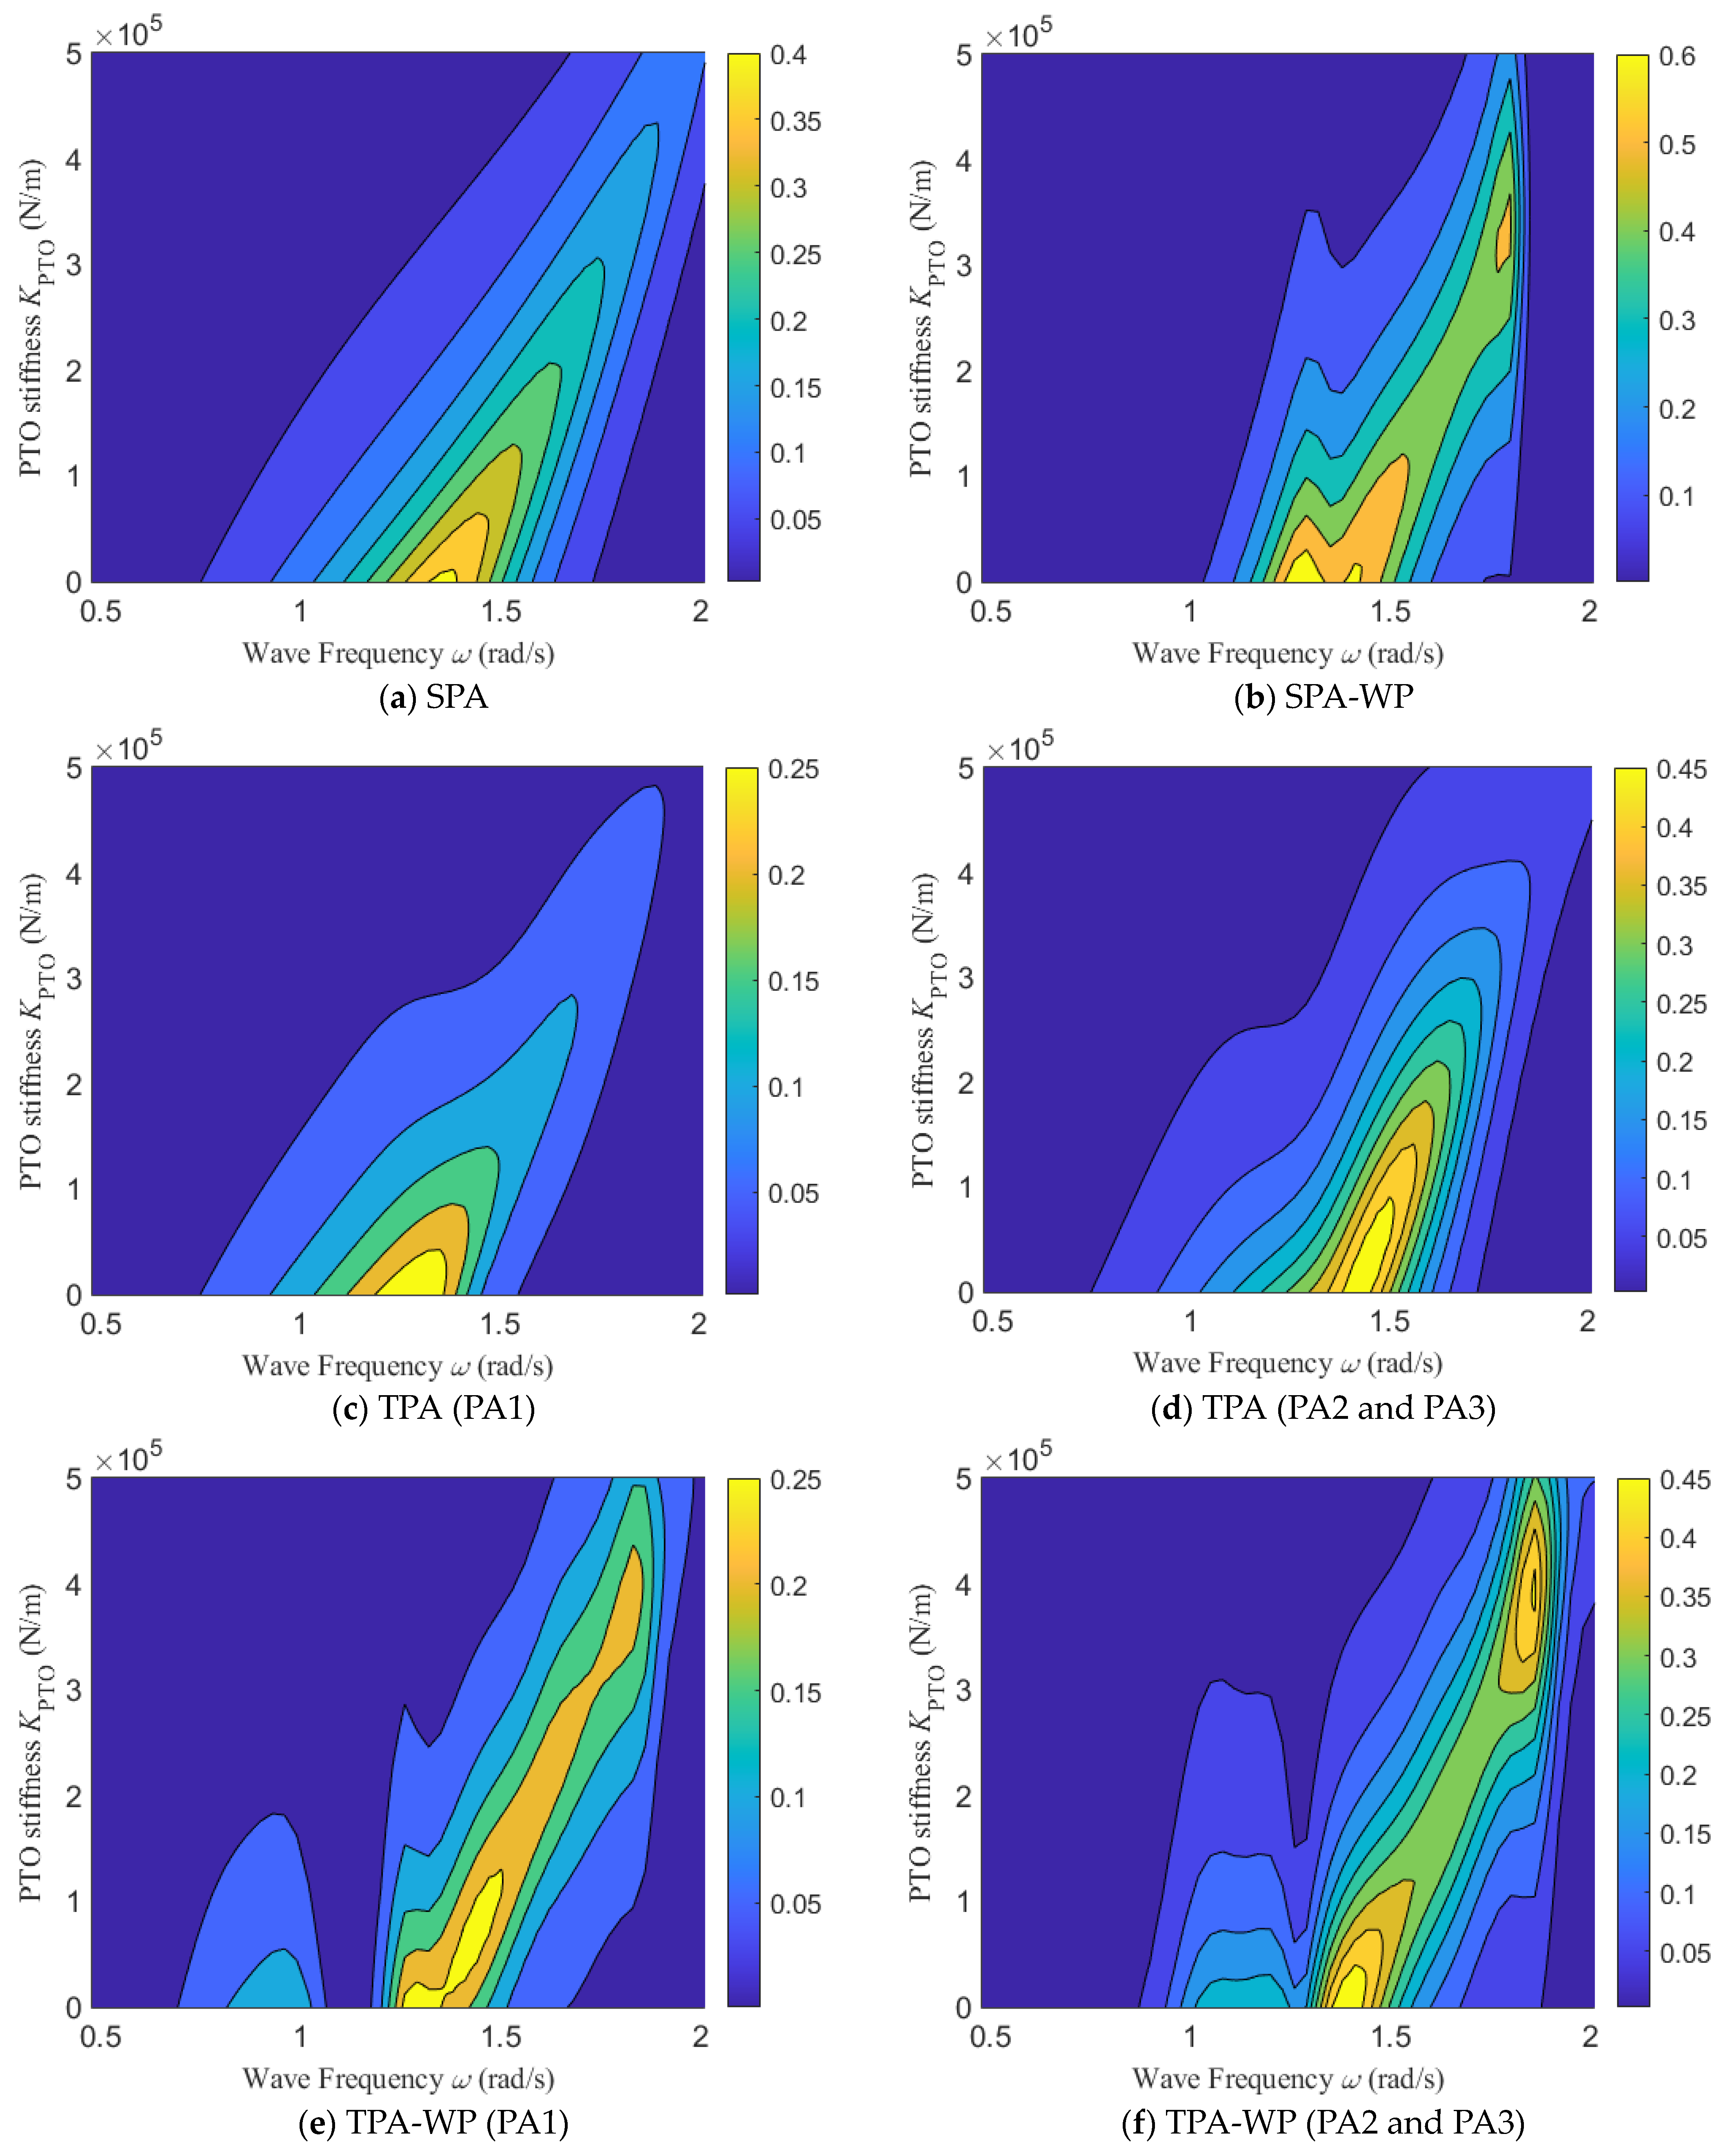
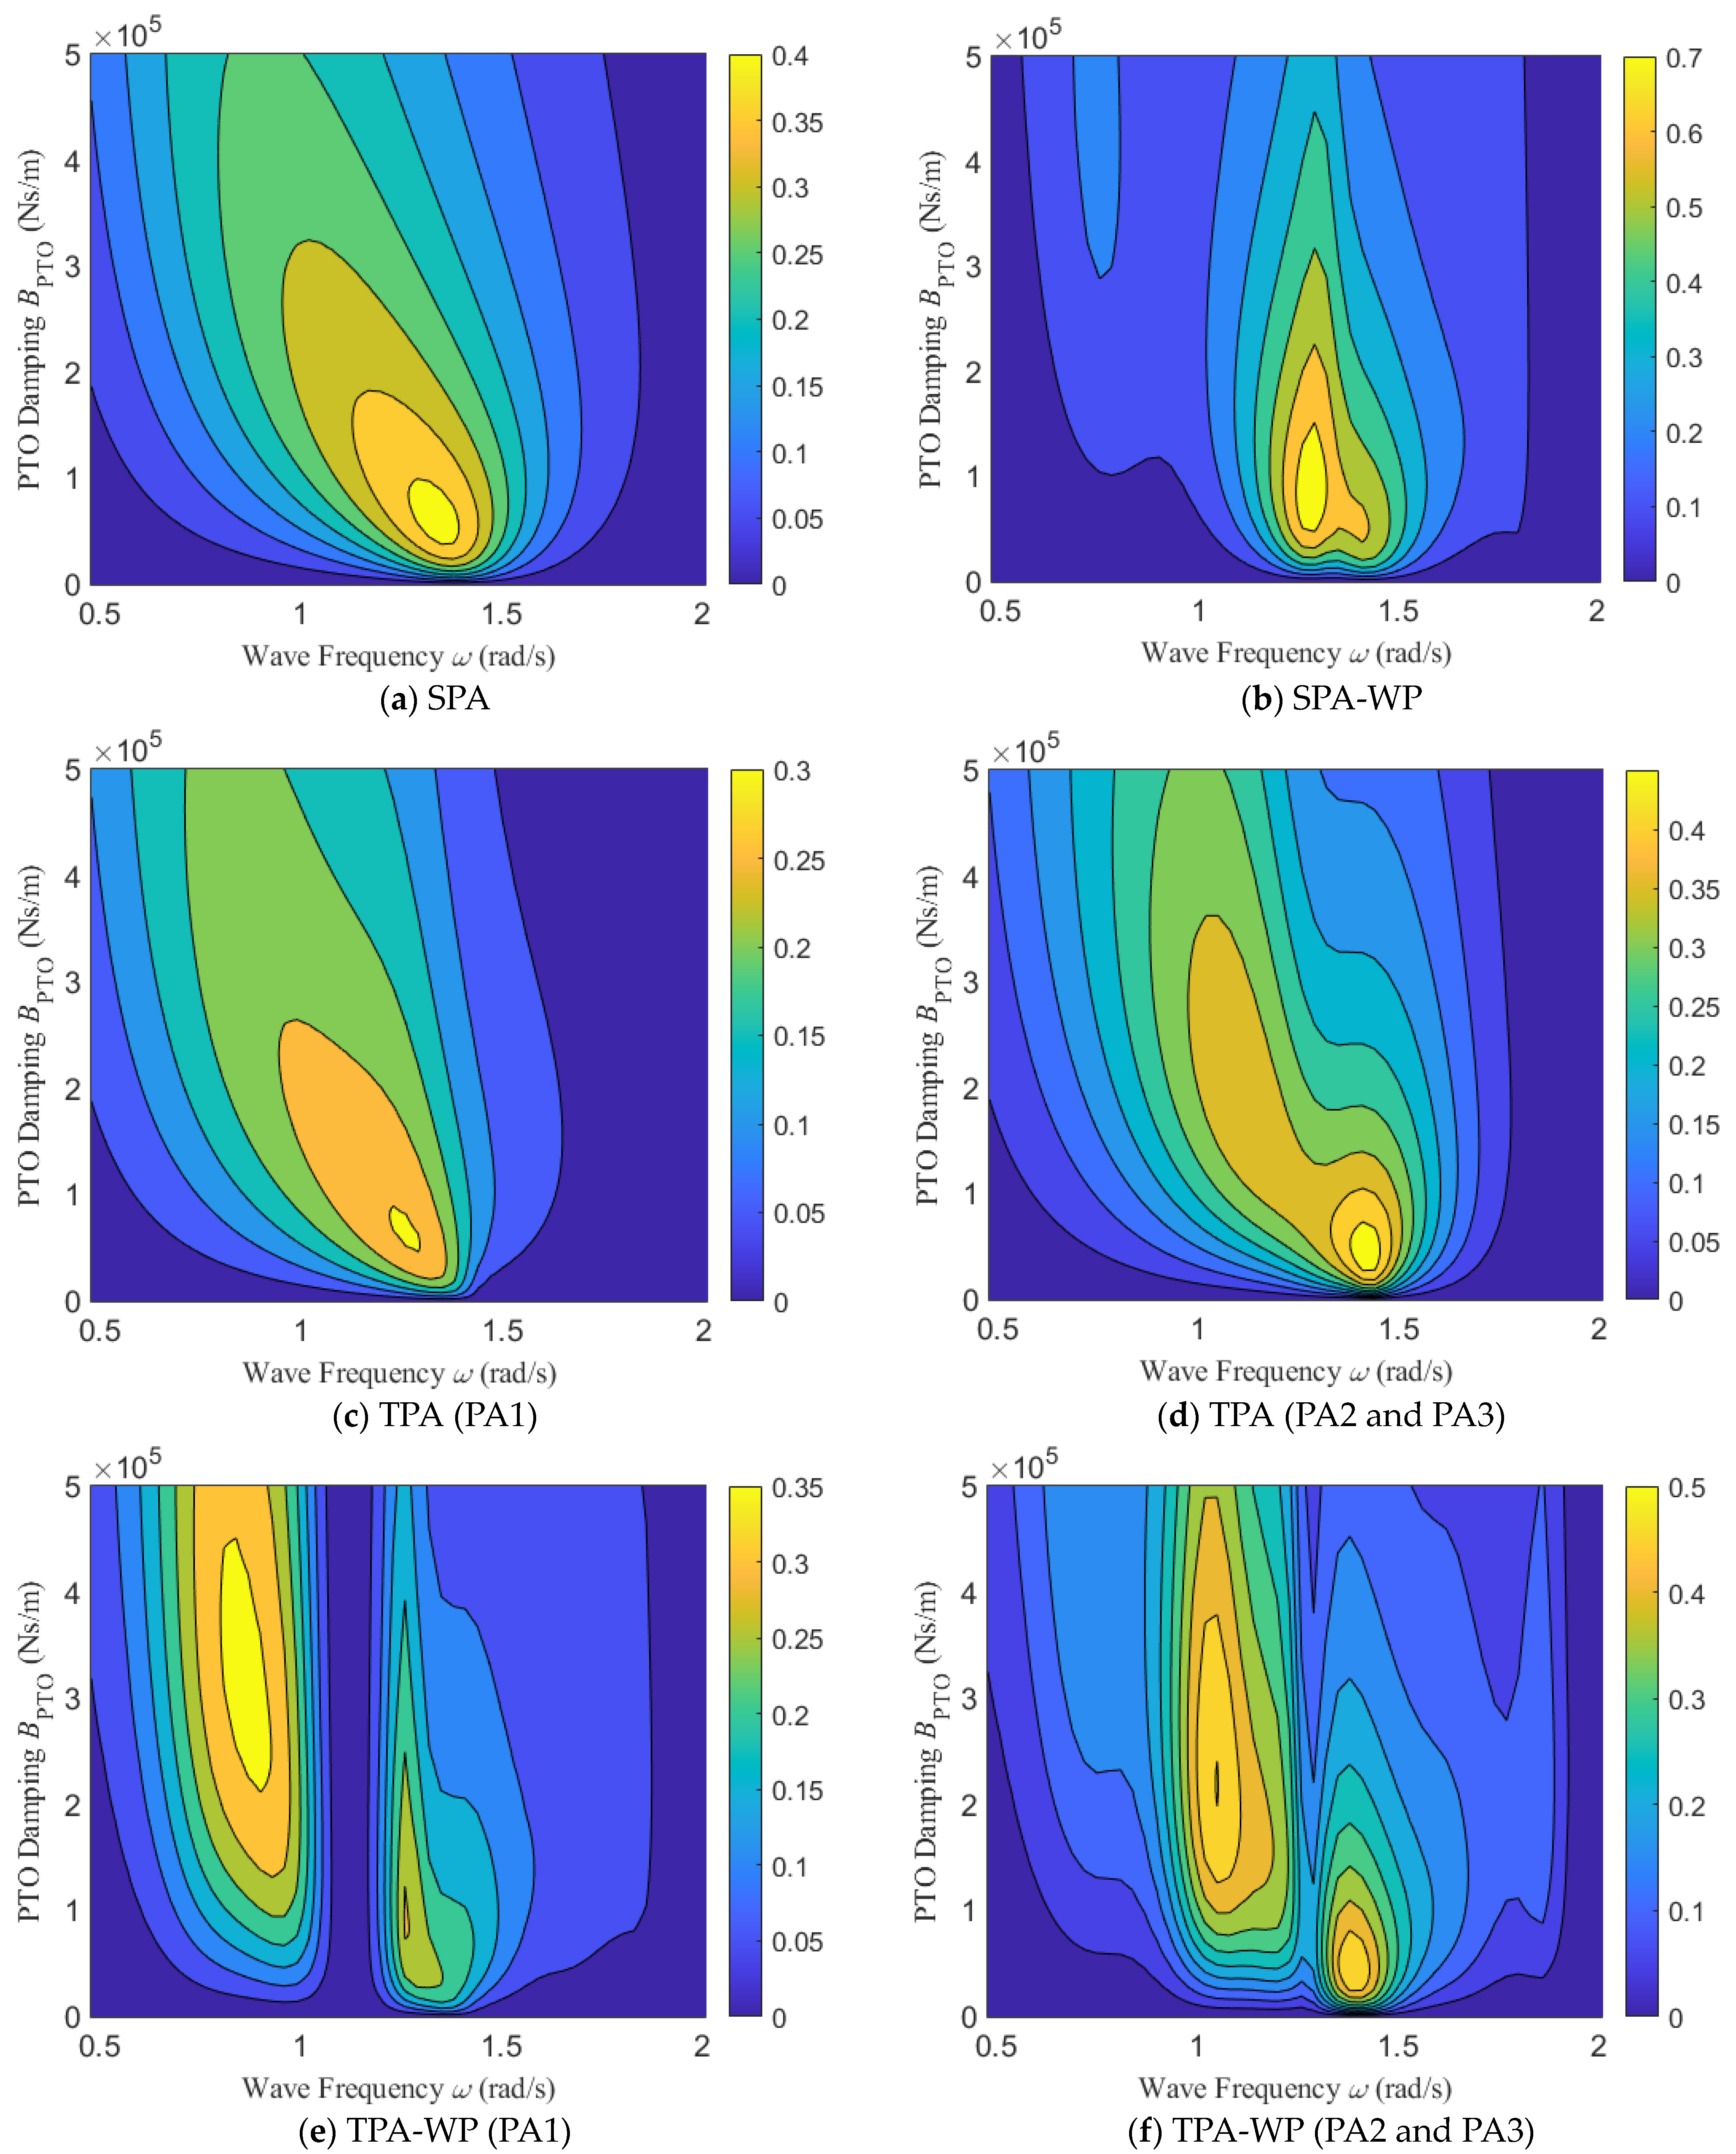
Regardless of the arrangement of point absorbers, the optimal PTO stiffness that maximizes the CWR tends towards zero. Only when the floating foundation is considered does the CWR exhibit a secondary peak, with the corresponding PTO stiffness of around 3 × 10⁵–4 × 10⁵ N/m. This suggests that increasing stiffness can change the resonance frequency of the hybrid system to some extent.
(3)
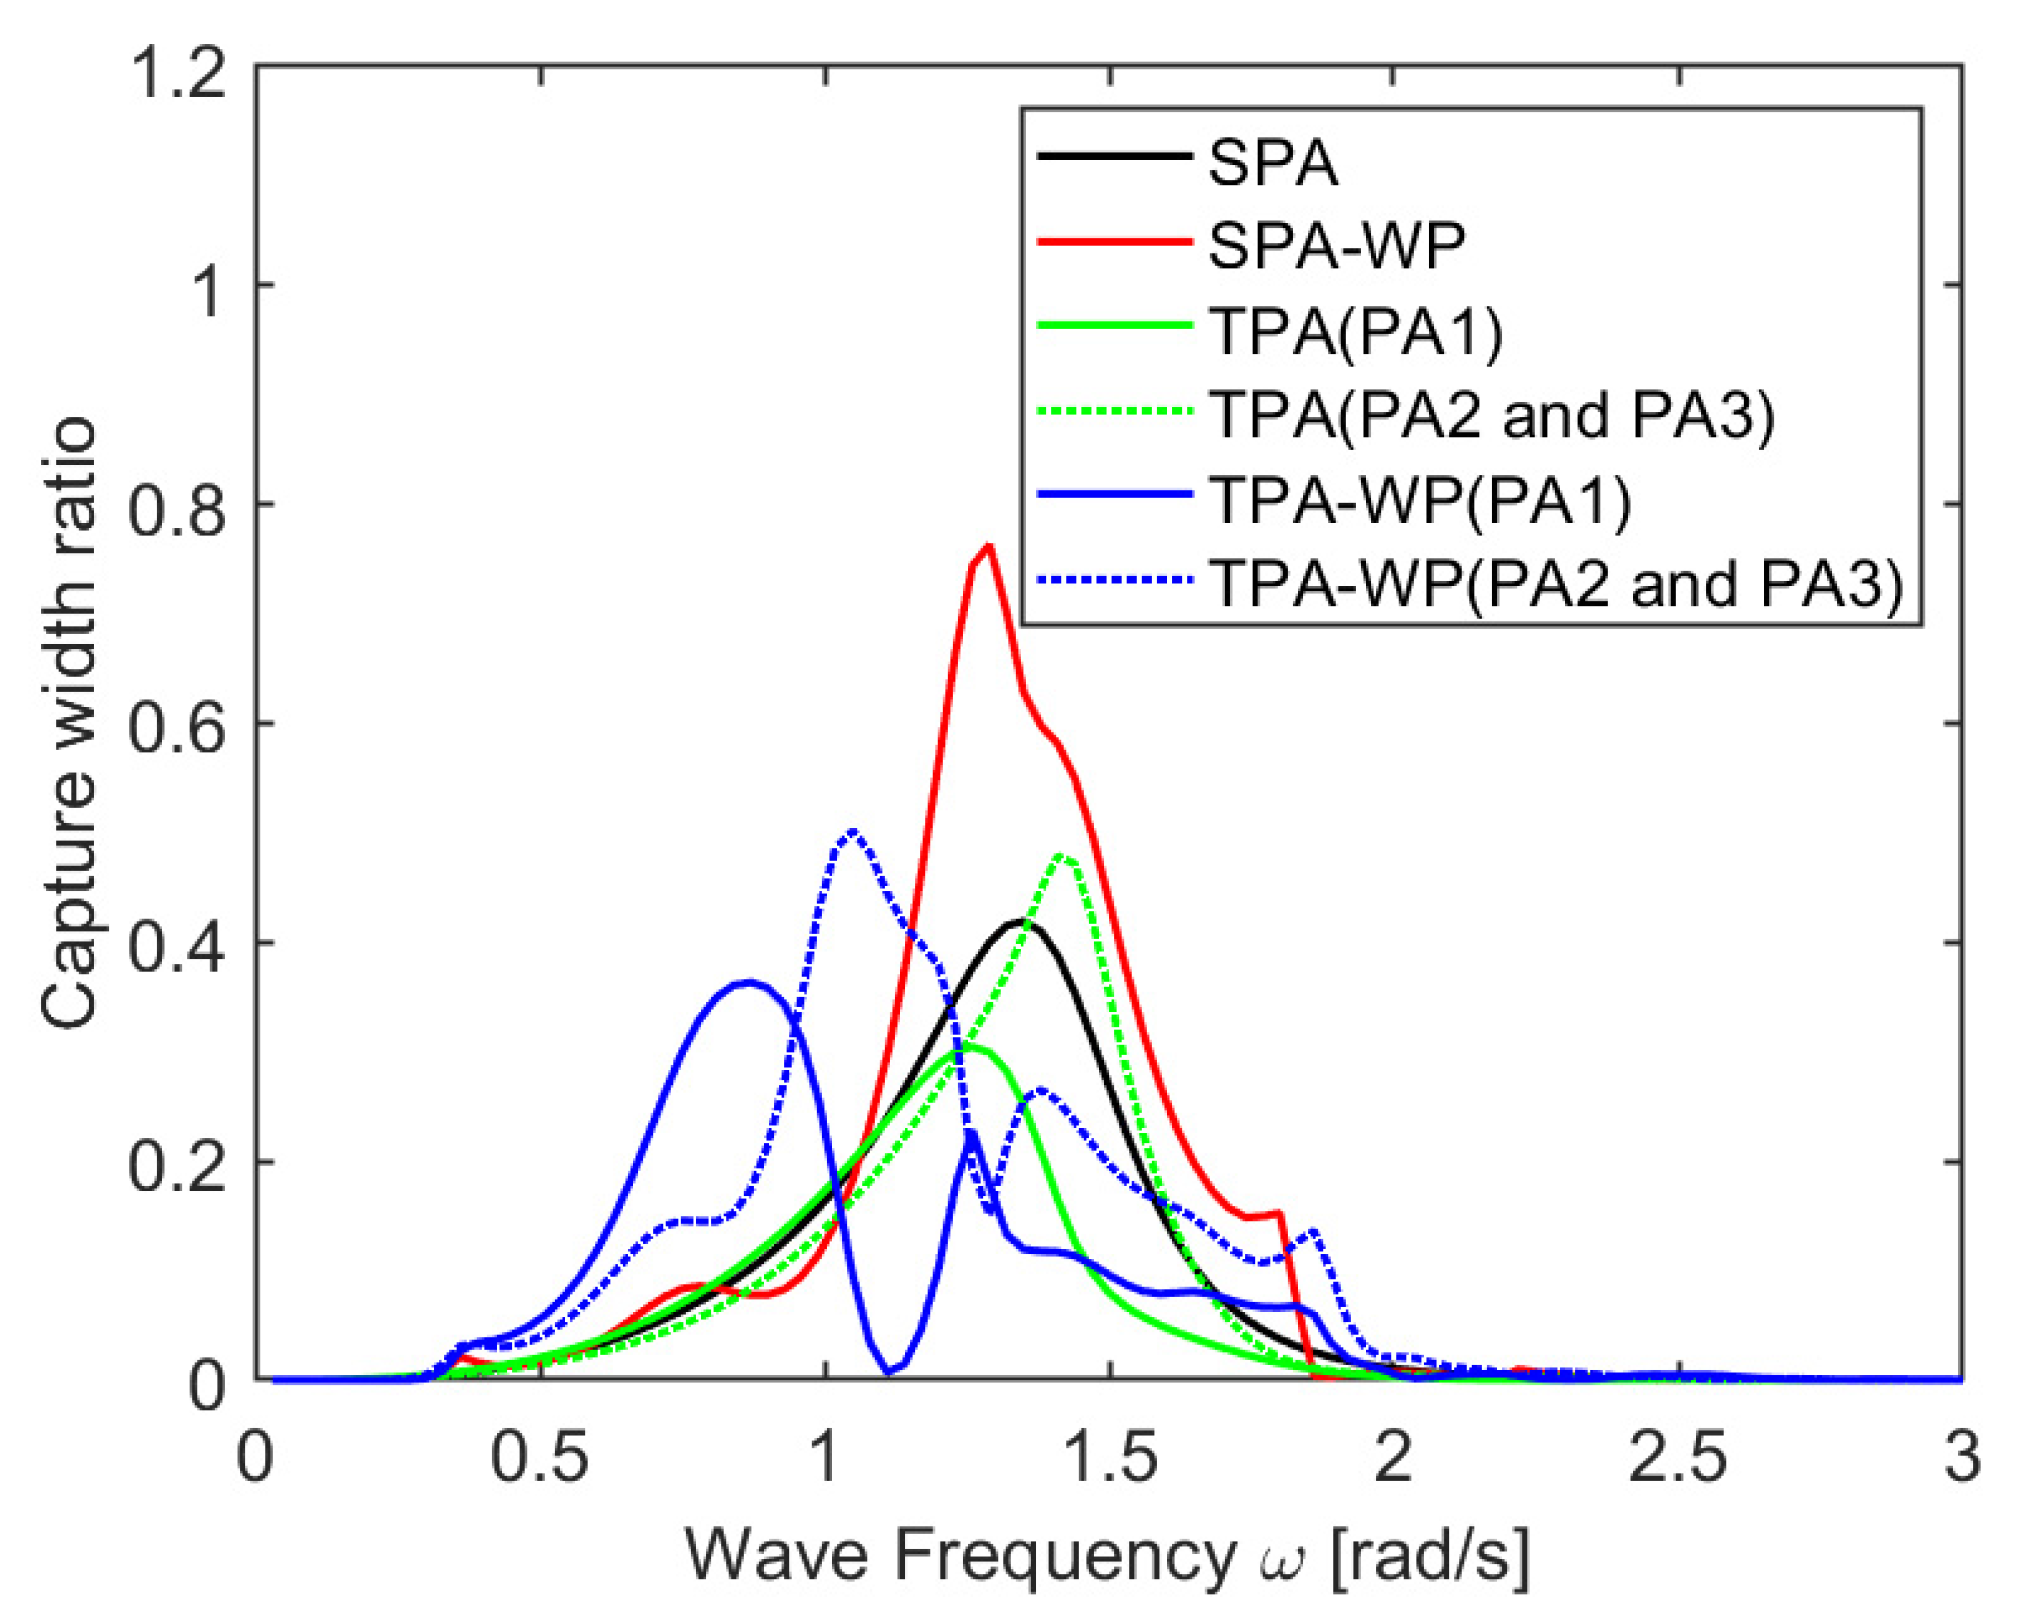
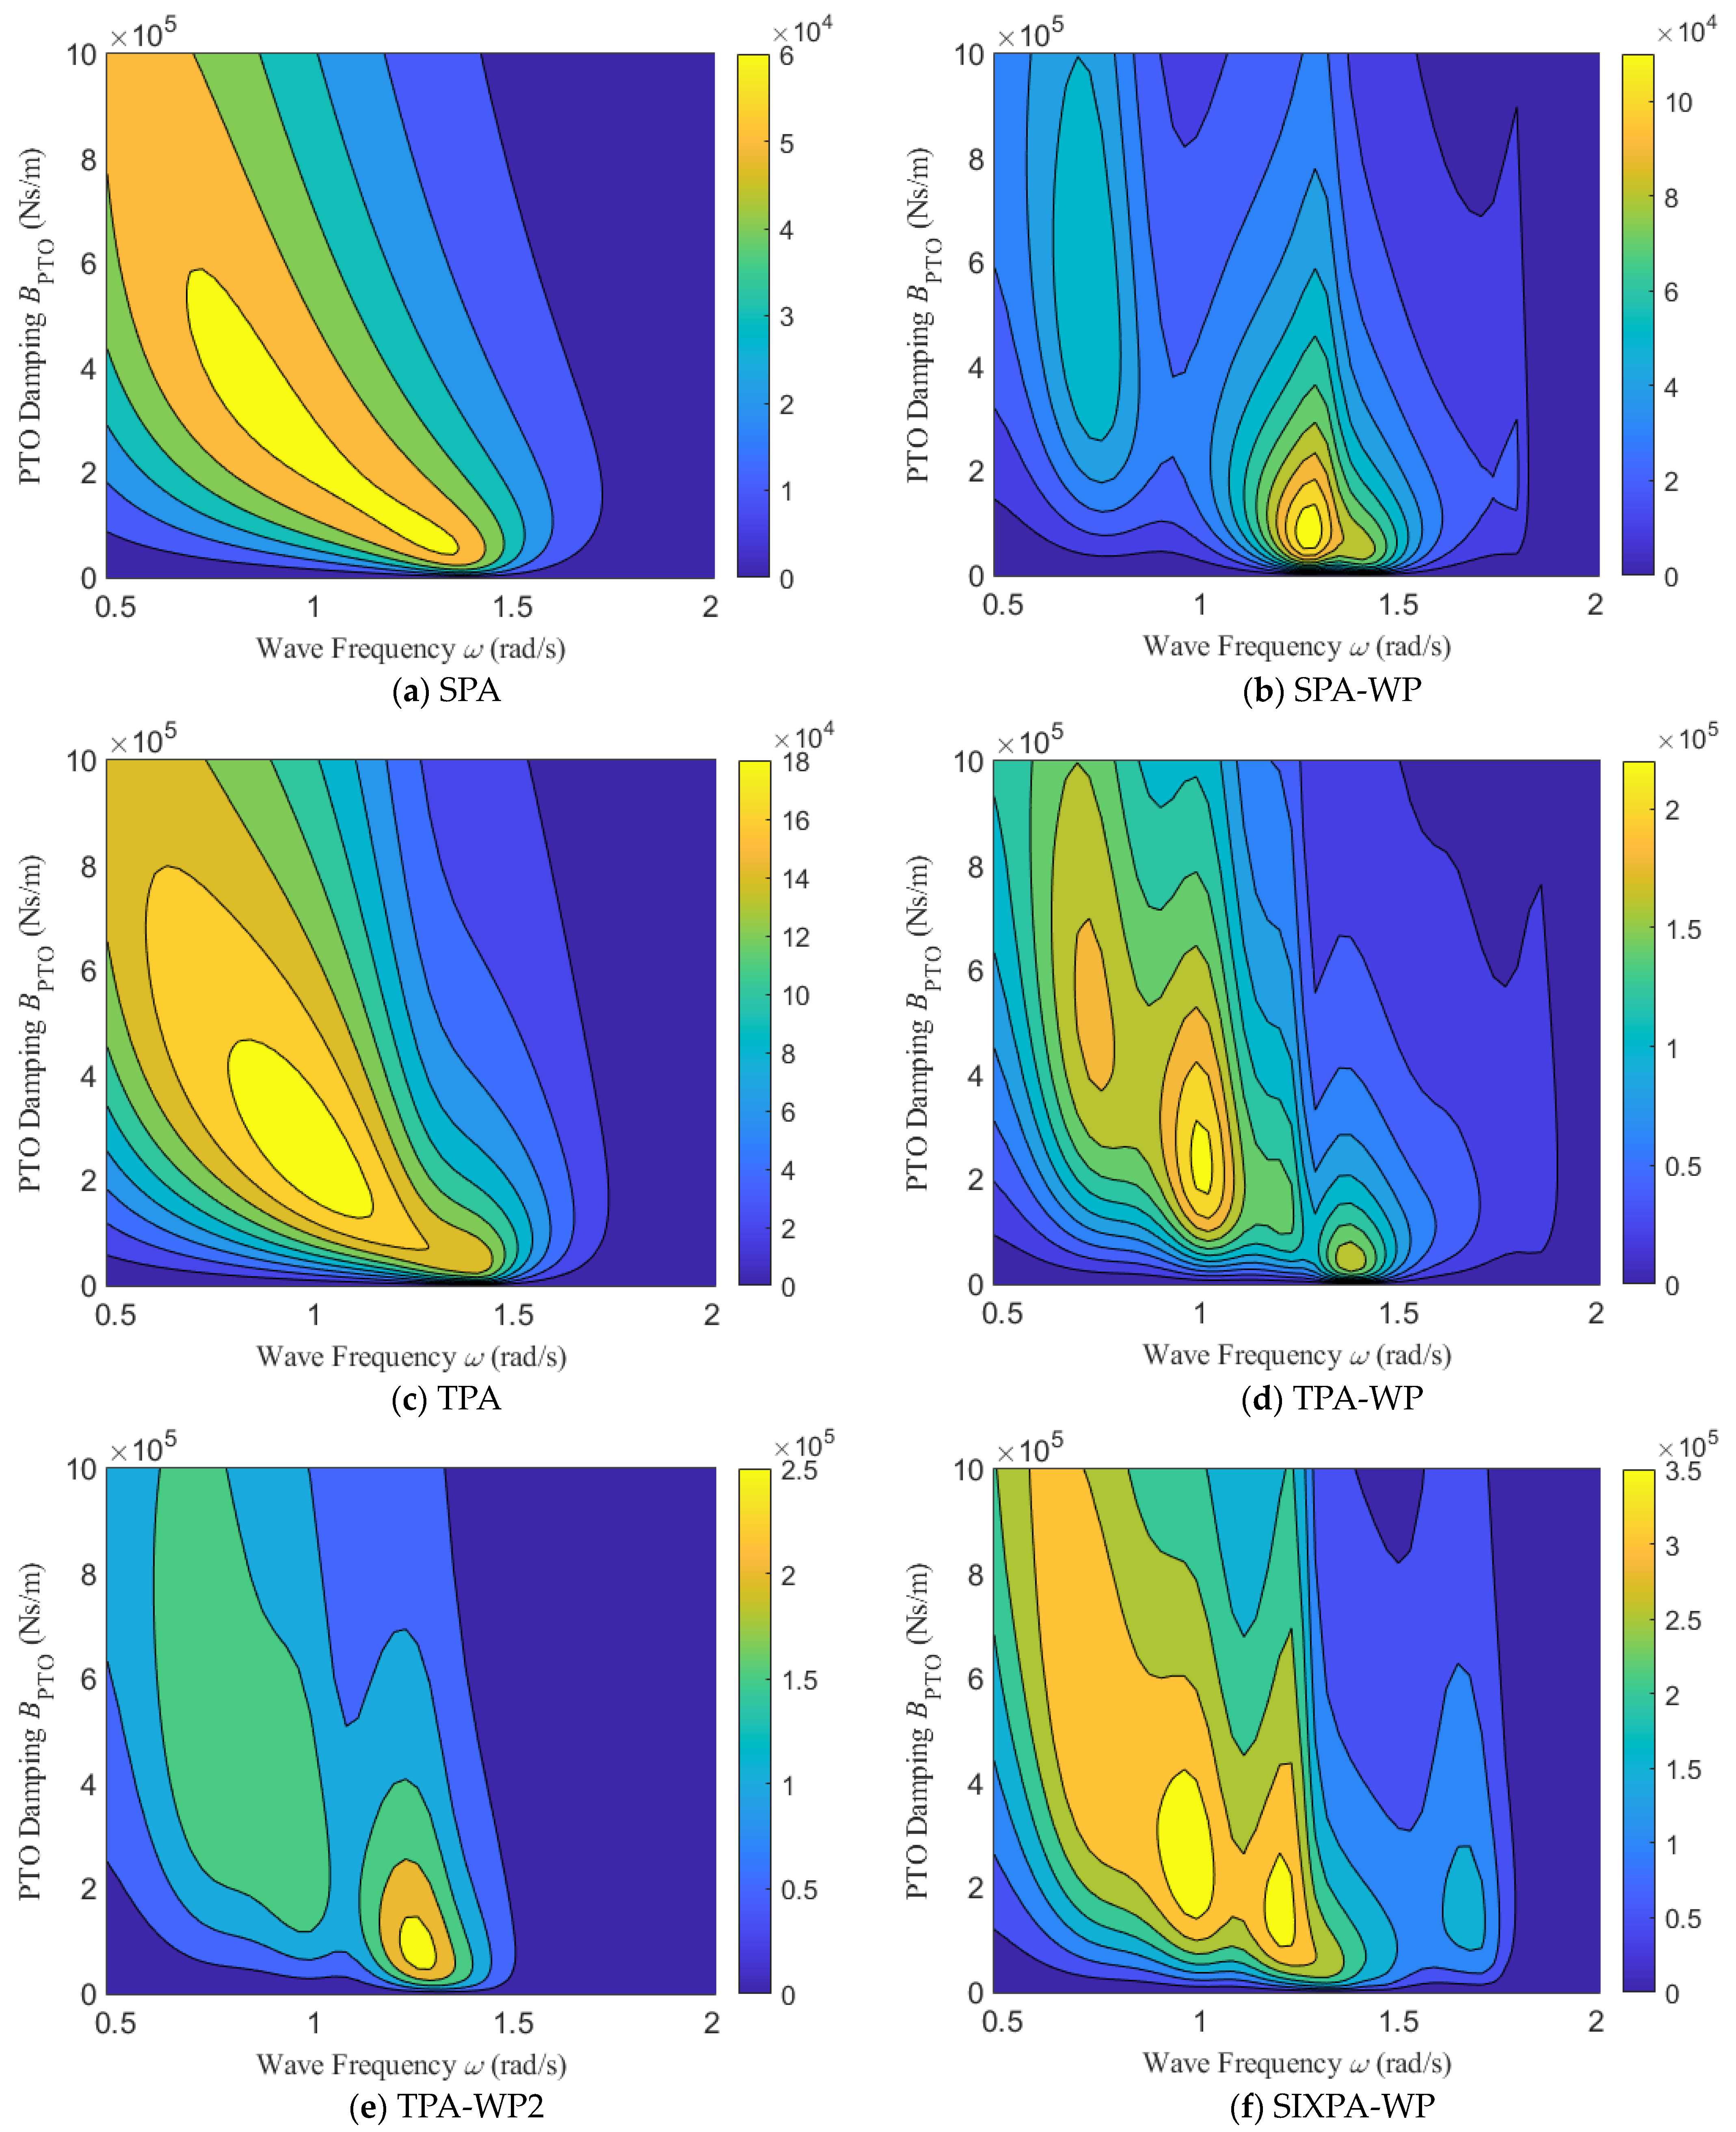
When considering the optimal PTO damping coefficient, the CWR values of the point absorbers all exhibit a peak near their natural frequencies. When a three-point-absorber array is arranged on the floating platform, the peak shifts towards the natural frequency of the platform, and the optimal PTO stiffness significantly increases. It can be inferred that array arrangements can alter the working conditions and adaptability range of point absorbers.
(4)
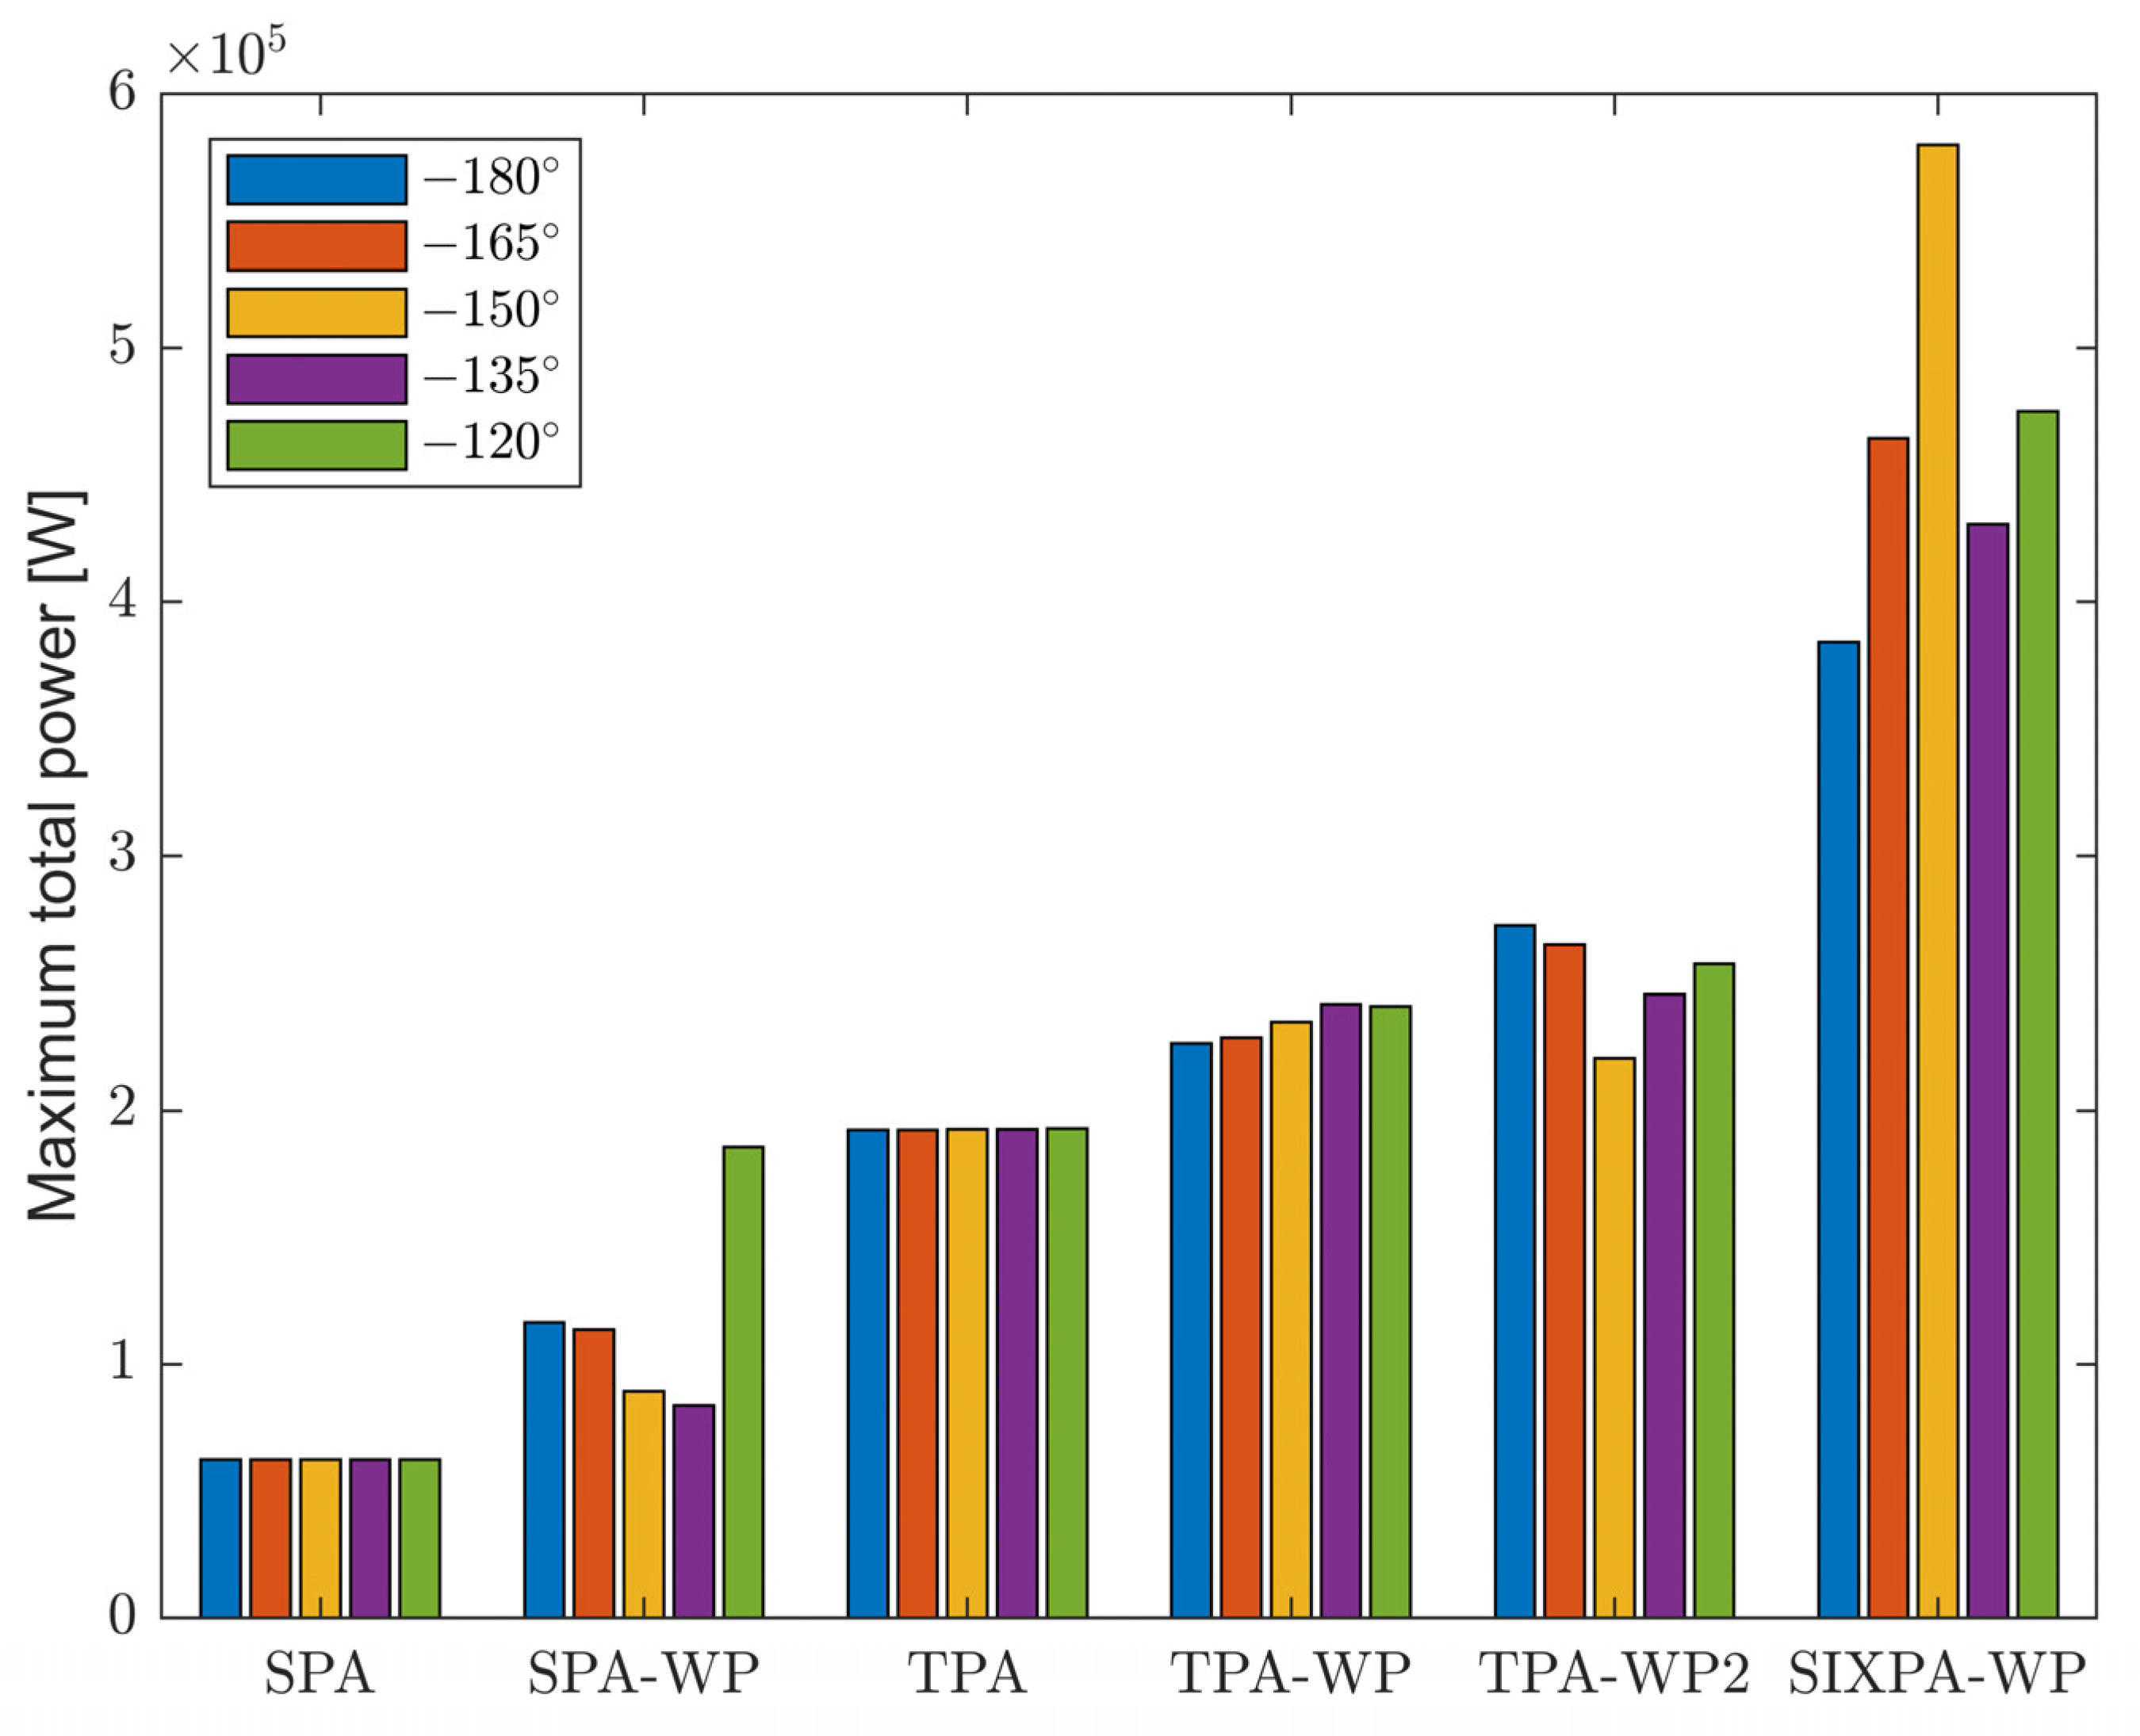
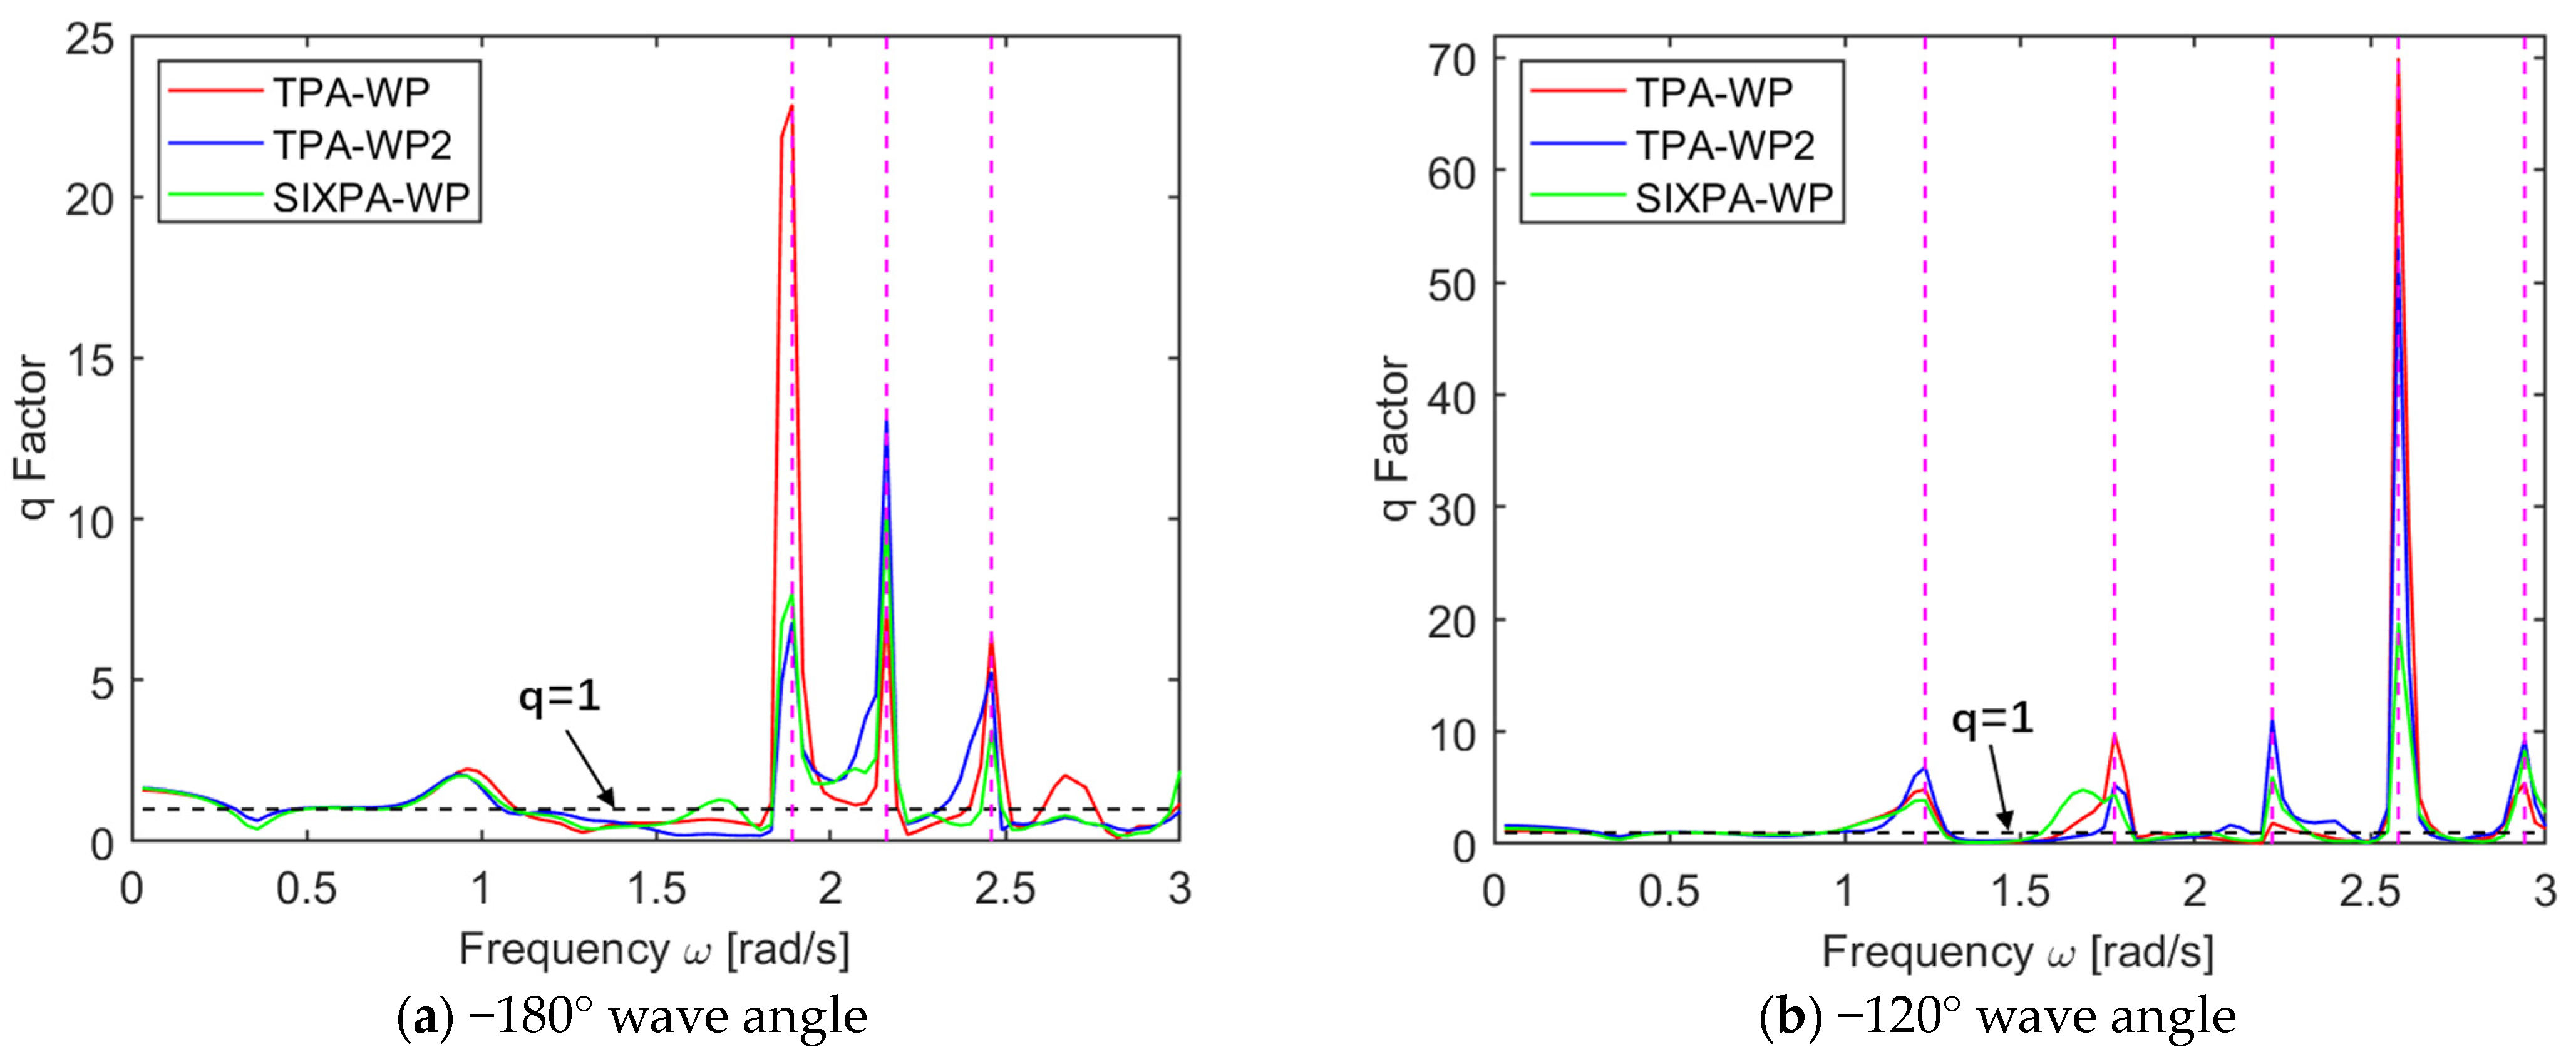
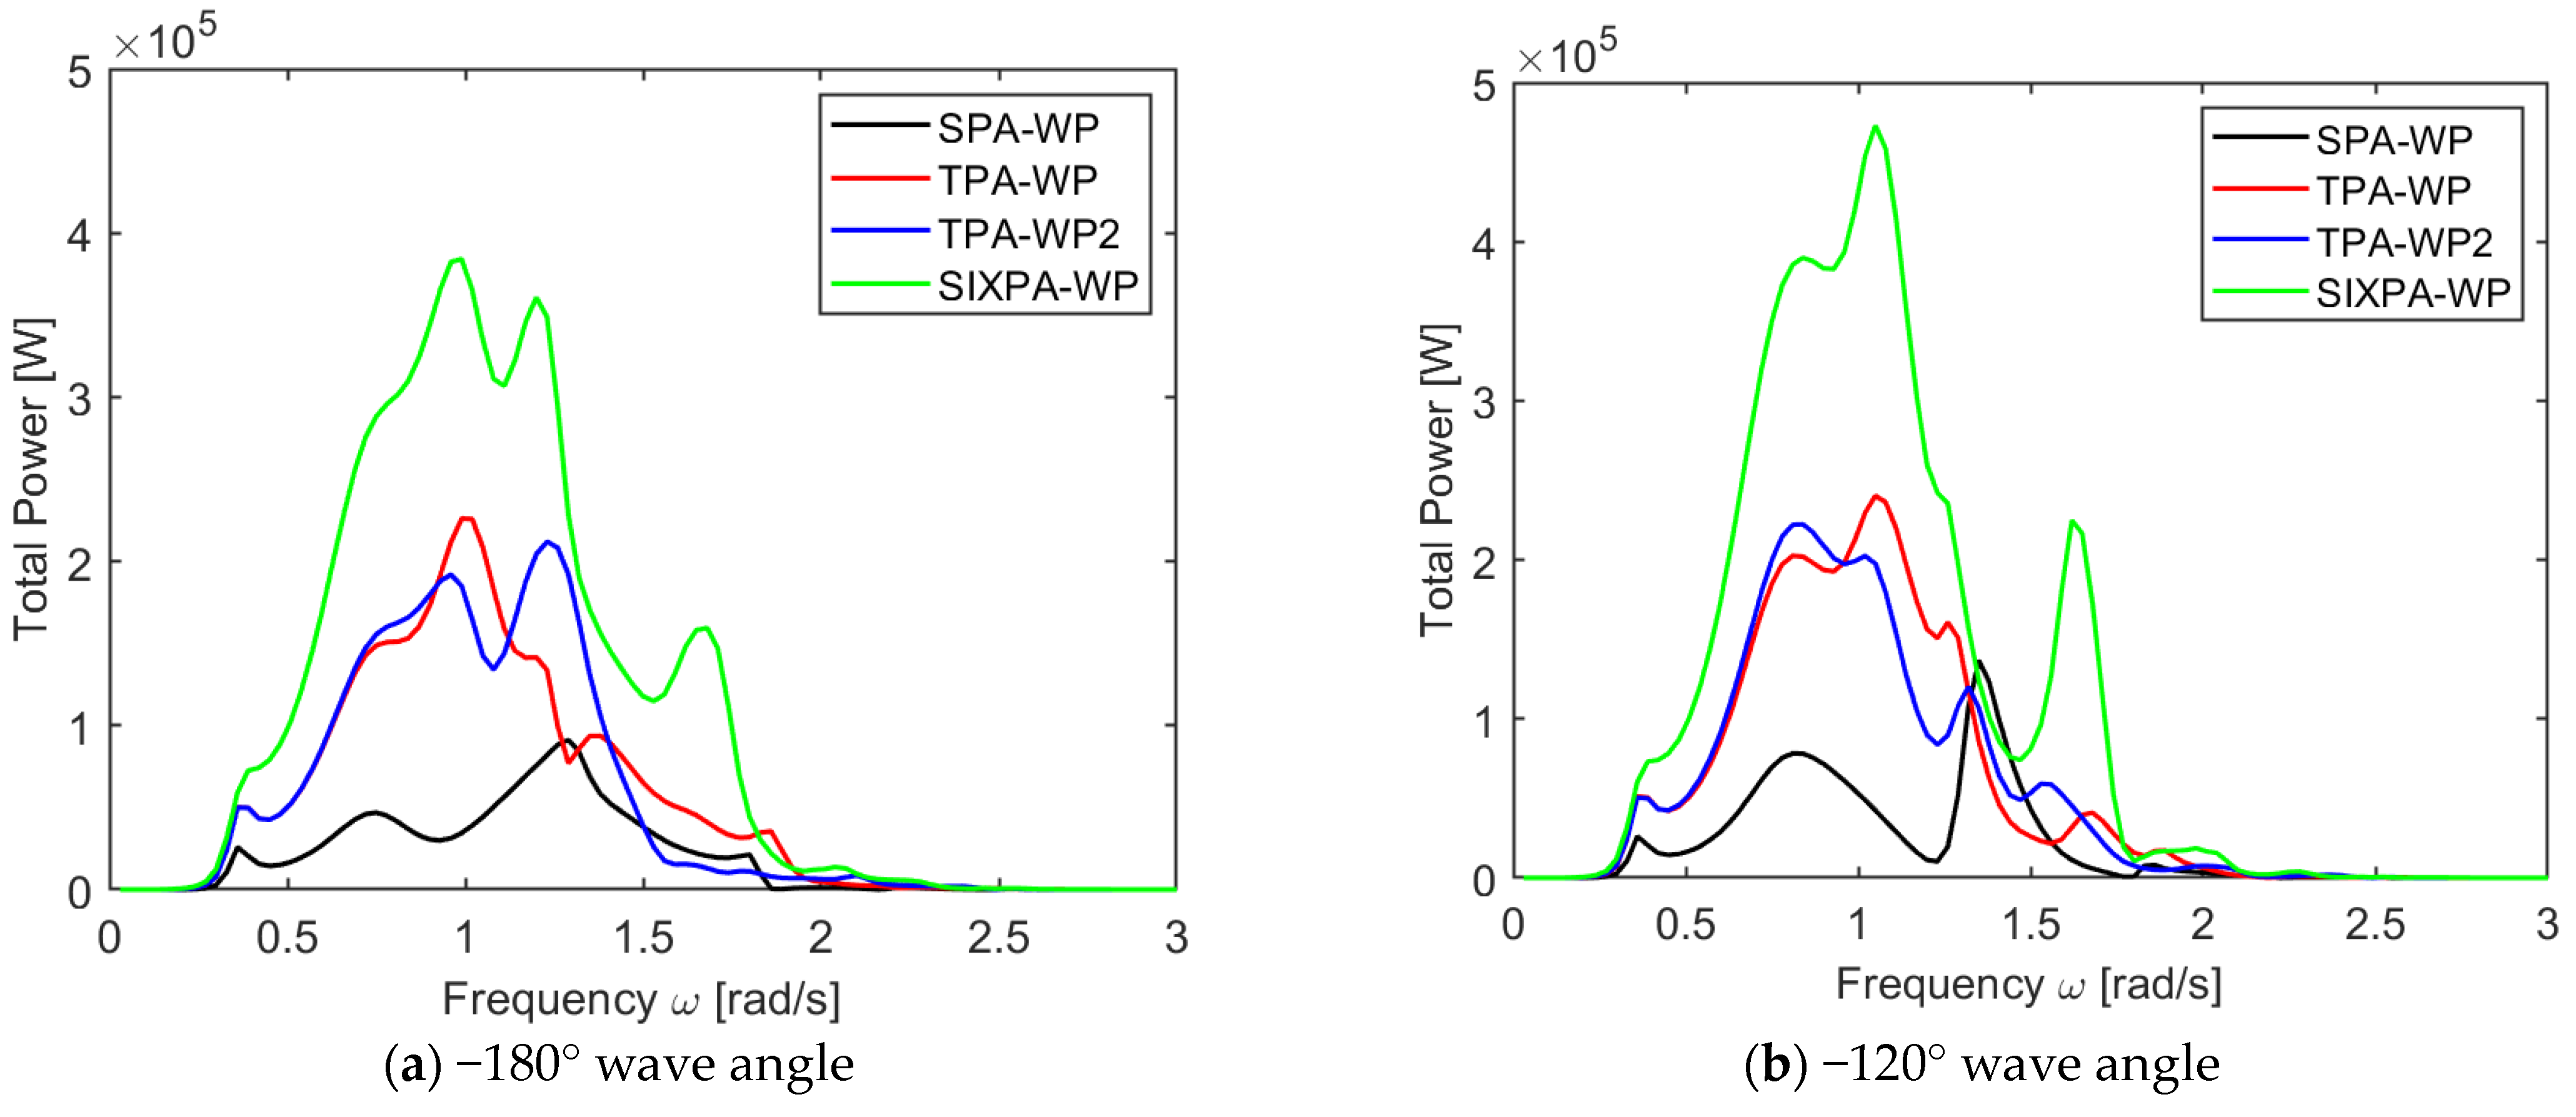
When considering different arrangements of point-absorber arrays on the floating platform, it is observed that when considering the floating platform, the point-absorber array’s maximum total power generation is minimally affected by the wave angle but offers little improvement over individual point absorbers. When considering a floating platform, the maximum power generation of each model is improved compared to that for individual point absorbers. The arrangement of a single point absorber on the floating platform results in the highest increase in maximum power generation, but it is significantly affected by the angle of waves. On the other hand, both arrangements of three point absorbers exhibit more stable performance. Similarly, the arrangement of six point absorbers is also significantly influenced by the wave angle. Additionally, when considering whether the average performance of point-absorber arrays on a floating platform is superior to that of a single point absorber on the same platform, it was observed that due to the hydrodynamic resonance generated by the array arrangements, multiple peaks occurred in the q factor at the same frequency.
(5)
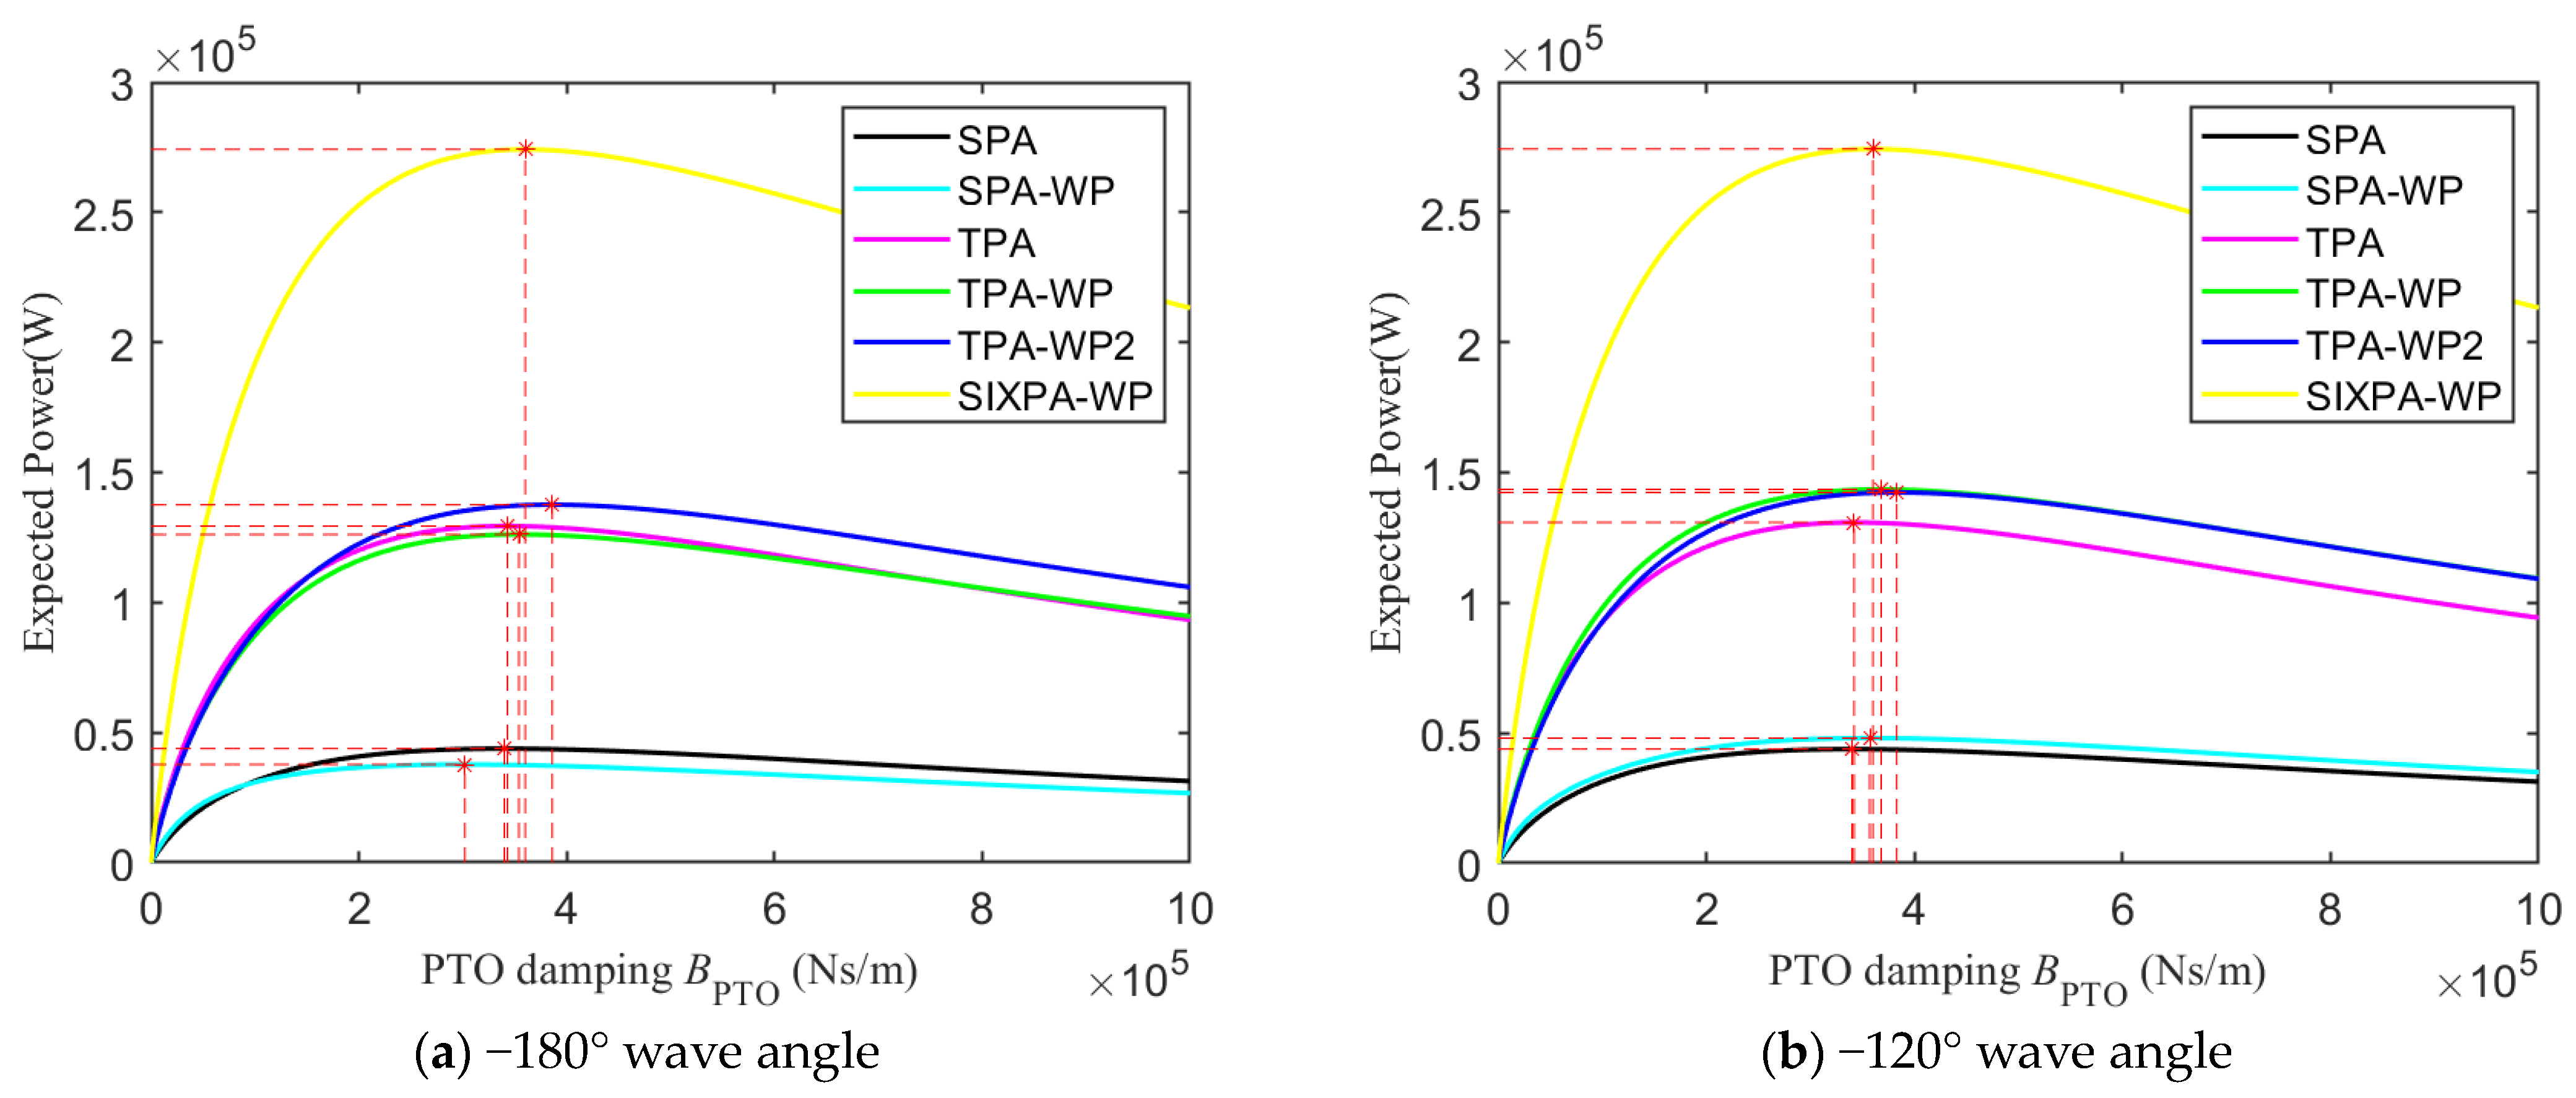
The expected power performance of point absorbers in different arrangements in the South China Sea differs significantly from their performance in the maximum power analysis. While arranging a single point absorber on a floating foundation yields the best peak performance, its stability across all wave frequencies is poor, even dropping below that of a single point absorber. The more point absorbers are arranged in an array, the more stable their performance becomes, demonstrating better adaptability.
However, limitations still exist in this study. It is worth noting that this paper only presents a frequency-domain analysis of the wind–wave power generation platform and does not consider nonlinear factors such as end-stop [44] or mooring systems [53]. Future research will develop corresponding time-domain analysis programs for this model. Additionally, only limited numerical simulations were conducted; further investigation of short-crested waves [54] and validation with physical model tests will be included in future studies.

Author Contributions

Conceptualization, M.C. and J.D.; methodology, M.C. and L.S.; software, M.C., H.Z. and J.D.; validation, J.D., M.C. and Y.Y.; formal analysis, T.T.; investigation, Y.Y. and L.S.; resources, L.S. and M.C.; data curation, J.D.; writing—original draft preparation, J.D. and M.C.; writing—review and editing, L.S., H.Z. and T.T.; visualization, J.D.; supervision, S.L. and M.C.; project administration, Y.Y., S.L. and T.T.; funding acquisition, M.C., Y.Y. and L.H. All authors have read and agreed to the published version of the manuscript.

Funding

This research was funded by the National Natural Science Foundation of China, grant numbers 52171275 and 51961125103, and the Natural Science Foundation of Hainan Province, China, grant number 520MS072. The work presented in this paper is part of the project “Research and development of offshore floating multi-energy complementary comprehensive energy supply system” supported by China Southern Power Grid Technology Co., Ltd., grant No. NYJS2020KJ005-23. The financial support is greatly appreciated.

Institutional Review Board Statement

Not applicable.

Informed Consent Statement

Not applicable.

Data Availability Statement

Data are contained within the article.

Conflicts of Interest

Author Yi Yang, Tao Tao, and Shi Liu were employed by the company China Southern Power Grid Technology Co., Ltd. The remaining authors declare that the research was conducted in the absence of any commercial or financial relationships that could be construed as a potential conflict of interest.

Nomenclature

  A ( ω ) Added mass matrix [-]   ω p Peak frequency [rad/s]
  B ( ω ) Radiation damping matrix [-]   x R e l a t i v e The relative displacement between the platform and the point absorber [m]
BptoDamping coefficient matrix of PTO [-]   γ Peak factor [-]
BvViscous damping matrix [-]Abbreviations
CHydrostatic stiffness matrix [-]
dWater depth [m]CFDComputational fluid dynamics
DCapture width [m]CWRCapture Width Ratio
EConstraint matrix [-]DOFDegree of freedom
  f p t o The force applied to the PTO [N]PSDPower Spectral Density
HWave height [m]PTOPower Take-Off
  H s Significant wave height [m]RAOResponse Amplitude Operator
KptoStiffness matrix of PTO [-]SIXPA-WPSix point absorbers combined with floating wind turbine platform
  k 0 Wave number [-]SPASingle point absorber
MMass matrix [-]SPA-WPSingle point absorber combined with floating wind turbine platform
  P a v e ( N ) The average power generation of the Nth point absorber [W]TPAThree point absorbers
PThe output power of the point absorber [W]TPA-WPThree point absorbers combined with floating wind turbine platform
  P w Incident power of the wave per unit width [W]TPA-WP2The second placement scheme for three point absorbers combined with floating wind turbine platform
  W E x p e c t e d The expected power [W]WECsWave energy converters

References

  1. Hill, J.S. Hywind Scotland, World’s First Floating Wind Farm, Performing Better than Expected. Available online: https://cleantechnica.com/2018/02/16/hywind-scotland-worlds-first-floating-wind-farm-performing-better-expected/ (accessed on 1 September 2023).
  2. Idcore. Equinor Officially Opens 88MW Hywind Tampen. Available online: https://renews.biz/87665/equinor-officially-opens-88mw-hywind-tampen/ (accessed on 1 September 2023).
  3. Floatgen. The First Operational Results Confirm the Excellent Performance of Ideol’s Floater. Available online: https://floatgen.eu/en/actualites/first-operational-results-confirm-excellent-performance-ideols-floater (accessed on 1 September 2023).
  4. Cobra Group. KOWL: World’s Largest Floating Windfarm Fully Operational. Available online: https://www.principlepower.com/news/kowl-worlds-largest-floating-windfarm-fully-operational (accessed on 1 September 2023).
  5. Yang, X.; Gao, L. China’s First Deep-Sea Floating Wind Power Platform “Haiyang Guanlan” Was Successfully Connected to the Grid and Put into Operation. Available online: http://finance.people.com.cn/n1/2023/0520/c1004-32690779.html (accessed on 1 September 2023).
  6. Castro-Santos, L.; Martins, E.; Guedes Soares, C. Cost assessment methodology for combined wind and wave floating offshore renewable energy systems. Renew. Energy 2016, 97, 866–880. [Google Scholar] [CrossRef]
  7. Slocum, A.; Kluger, J.; Mannai, S. Energy Harvesting and Storage System Stabilized Offshore Wind Turbines. In Proceedings of the 2019 Offshore Energy and Storage Summit (OSES), Brest, France, 10–12 July 2019; pp. 1–6. [Google Scholar]
  8. Muliawan, M.J.; Karimirad, M.; Moan, T.; Gao, Z. STC (Spar-Torus Combination): A Combined Spar-Type Floating Wind Turbine and Large Point Absorber Floating Wave Energy Converter—Promising and Challenging. In Proceedings of the International Conference on Offshore Mechanics and Arctic Engineering, Rio de Janeiro, Brazil, 1–6 July 2012; American Society of Mechanical Engineers: New York, NY, USA, 2012; pp. 667–676. [Google Scholar]
  9. Muliawan, M.J.; Karimirad, M.; Gao, Z.; Moan, T. Extreme responses of a combined spar-type floating wind turbine and floating wave energy converter (STC) system with survival modes. Ocean Eng. 2013, 65, 71–82. [Google Scholar] [CrossRef]
  10. Wan, L.; Gao, Z.; Moan, T.; Lugni, C. Experimental and numerical comparisons of hydrodynamic responses for a combined wind and wave energy converter concept under operational conditions. Renew. Energy 2016, 93, 87–100. [Google Scholar] [CrossRef]
  11. Wan, L.; Gao, Z.; Moan, T.; Lugni, C. Comparative experimental study of the survivability of a combined wind and wave energy converter in two testing facilities. Ocean Eng. 2016, 111, 82–94. [Google Scholar] [CrossRef]
  12. Wan, L.; Ren, N.; Zhang, P. Numerical investigation on the dynamic responses of three integrated concepts of offshore wind and wave energy converter. Ocean Eng. 2020, 217, 107896. [Google Scholar] [CrossRef]
  13. Mitra, A.; Sarkar, S.; Chakraborty, A.; Das, S. Sway vibration control of floating horizontal axis wind turbine by modified spar-torus combination. Ocean Eng. 2021, 219, 108232. [Google Scholar] [CrossRef]
  14. Karimirad, M.; Koushan, K. WindWEC: Combining wind and wave energy inspired by hywind and wavestar. In Proceedings of the 2016 IEEE International Conference on Renewable Energy Research and Applications (ICRERA), Birmingham, UK, 20–23 November 2016; pp. 96–101. [Google Scholar]
  15. Li, L.; Gao, Y.; Yuan, Z.; Day, S.; Hu, Z. Dynamic response and power production of a floating integrated wind, wave and tidal energy system. Renew. Energy 2018, 116, 412–422. [Google Scholar] [CrossRef]
  16. Luan, C.; Michailides, C.; Gao, Z.; Moan, T. Modeling and Analysis of a 5 MW Semi-Submersible Wind Turbine Combined with Three Flap-Type Wave Energy Converters. In Proceedings of the International Conference on Offshore Mechanics and Arctic Engineering, San Francisco, CA, USA, 8–13 June 2014; American Society of Mechanical Engineers: New York, NY, USA, 2014. [Google Scholar]
  17. Michailides, C.; Luan, C.; Gao, Z.; Moan, T. Effect of Flap Type Wave Energy Converters on the Response of a Semi-Submersible Wind Turbine in Operational Conditions. In Proceedings of the International Conference on Offshore Mechanics and Arctic Engineering, San Francisco, CA, USA, 8–13 June 2014; American Society of Mechanical Engineers: New York, NY, USA, 2014. [Google Scholar]
  18. Gao, Z.; Moan, T.; Wan, L.; Michailides, C. Comparative numerical and experimental study of two combined wind and wave energy concepts. J. Ocean Eng. Sci. 2016, 1, 36–51. [Google Scholar] [CrossRef]
  19. Michailides, C.; Gao, Z.; Moan, T. Experimental study of the functionality of a semisubmersible wind turbine combined with flap-type Wave Energy Converters. Renew. Energy 2016, 93, 675–690. [Google Scholar] [CrossRef]
  20. Michailides, C.; Gao, Z.; Moan, T. Experimental and numerical study of the response of the offshore combined wind/wave energy concept SFC in extreme environmental conditions. Mar. Struct. 2016, 50, 35–54. [Google Scholar] [CrossRef]
  21. Chen, W.; Gao, F.; Meng, X.; Chen, B.; Ren, A. W2P: A high-power integrated generation unit for offshore wind power and ocean wave energy. Ocean Eng. 2016, 128, 41–47. [Google Scholar] [CrossRef]
  22. Fenu, B.; Attanasio, V.; Casalone, P.; Novo, R.; Cervelli, G.; Bonfanti, M.; Sirigu, S.A.; Bracco, G.; Mattiazzo, G. Analysis of a Gyroscopic-Stabilized Floating Offshore Hybrid Wind-Wave Platform. J. Mar. Sci. Eng. 2020, 8, 439. [Google Scholar] [CrossRef]
  23. Soulard, T.; Babarit, A. Numerical Assessment of the Mean Power Production of a Combined Wind and Wave Energy Platform. In Proceedings of the International Conference on Offshore Mechanics and Arctic Engineering, Rio de Janeiro, Brazil, 1–6 July 2012; American Society of Mechanical Engineers: New York, NY, USA, 2012; pp. 413–423. [Google Scholar]
  24. Soulard, T.; Babarit, A.; Borgarino, B.; Wyns, M.; Harismendy, M. C-HyP: A Combined Wind and Wave Energy Platform with Balanced Contributions. In Proceedings of the International Conference on Offshore Mechanics and Arctic Engineering, Nantes, France, 9–14 June 2013; American Society of Mechanical Engineers: New York, NY, USA, 2013. [Google Scholar]
  25. Wright, C.; Pakrashi, V.; Murphy, J. Numerical Modelling of a Combined Tension Moored Wind and Wave Energy Convertor. In Proceedings of the European Wave and Tidal Energy Conference (EWTEC) Series 2017, Cork, Ireland, 27 August–1 September 2017. [Google Scholar]
  26. Ren, N.; Ma, Z.; Shan, B.; Ning, D.; Ou, J. Experimental and numerical study of dynamic responses of a new combined TLP type floating wind turbine and a wave energy converter under operational conditions. Renew. Energy 2020, 151, 966–974. [Google Scholar] [CrossRef]
  27. Wang, Y.; Zhang, L.; Michailides, C.; Wan, L.; Shi, W. Hydrodynamic Response of a Combined Wind–Wave Marine Energy Structure. J. Mar. Sci. Eng. 2020, 8, 253. [Google Scholar] [CrossRef]
  28. Gaspar, J.F.; Kamarlouei, M.; Thiebaut, F.; Guedes Soares, C. Compensation of a hybrid platform dynamics using wave energy converters in different sea state conditions. Renew. Energy 2021, 177, 871–883. [Google Scholar] [CrossRef]
  29. Ghafari, H.R.; Ghassemi, H.; He, G. Numerical study of the Wavestar wave energy converter with multi-point-absorber around DeepCwind semisubmersible floating platform. Ocean Eng. 2021, 232, 109177. [Google Scholar] [CrossRef]
  30. Li, J.; Shi, W.; Zhang, L.; Michailides, C.; Li, X. Wind–Wave Coupling Effect on the Dynamic Response of a Combined Wind–Wave Energy Converter. J. Mar. Sci. Eng. 2021, 9, 1101. [Google Scholar] [CrossRef]
  31. Si, Y.; Chen, Z.; Zeng, W.; Sun, J.; Zhang, D.; Ma, X.; Qian, P. The influence of power-take-off control on the dynamic response and power output of combined semi-submersible floating wind turbine and point-absorber wave energy converters. Ocean Eng. 2021, 227, 108835. [Google Scholar] [CrossRef]
  32. Shi, W.; Li, J.; Michailides, C.; Chen, M.; Wang, S.; Li, X. Dynamic Load Effects and Power Performance of an Integrated Wind—Wave Energy System Utilizing an Optimum Torus Wave Energy Converter. J. Mar. Sci. Eng. 2022, 10, 1985. [Google Scholar] [CrossRef]
  33. Wang, Y.; Shi, W.; Michailides, C.; Wan, L.; Kim, H.; Li, X. WEC shape effect on the motion response and power performance of a combined wind-wave energy converter. Ocean Eng. 2022, 250, 111038. [Google Scholar] [CrossRef]
  34. Tian, W.; Wang, Y.; Shi, W.; Michailides, C.; Wan, L.; Chen, M. Numerical study of hydrodynamic responses for a combined concept of semisubmersible wind turbine and different layouts of a wave energy converter. Ocean Eng. 2023, 272, 113824. [Google Scholar] [CrossRef]
  35. Chen, M.; Wang, R.; Xiao, P.; Zhu, L.; Li, F.; Sun, L. Numerical Analysis of a Floating Semi-Submersible Wind Turbine Integrated with a Point Absorber Wave Energy Convertor. In Proceedings of the 30th International Ocean and Polar Engineering Conference, Shanghai, China, 11–16 October 2020. [Google Scholar]
  36. Zhang, X.; Li, B.; Hu, Z.; Deng, J.; Xiao, P.; Chen, M. Research on Size Optimization of Wave Energy Converters Based on a Floating Wind-Wave Combined Power Generation Platform. Energies 2022, 15, 8681. [Google Scholar] [CrossRef]
  37. De Andrés, A.; Guanche, R.; Meneses, L.; Vidal, C.; Losada, I.J. Factors that influence array layout on wave energy farms. Ocean. Eng. 2014, 82, 32–41. [Google Scholar] [CrossRef]
  38. Mercadé Ruiz, P.; Nava, V.; Topper, M.B.; Ruiz Minguela, P.; Ferri, F.; Kofoed, J.P. Layout optimisation of wave energy converter arrays. Energies 2017, 10, 1262. [Google Scholar] [CrossRef]
  39. Sun, P.; Hu, S.; He, H.; Zheng, S.; Chen, H.; Yang, S.; Ji, Z. Structural optimization on the oscillating-array-buoys for energy-capturing enhancement of a novel floating wave energy converter system. Energy Convers. Manag. 2021, 228, 113693. [Google Scholar] [CrossRef]
  40. Liu, Y.; Zheng, S.; Liang, H.; Cong, P. Wave interaction and energy absorption from arrays of complex-shaped point absorbers. Phys. Fluids 2022, 34, 097107. [Google Scholar] [CrossRef]
  41. Zhong, Q.; Yeung, R.W. On optimal energy-extraction performance of arrays of wave-energy converters, with full consideration of wave and multi-body interactions. Ocean Eng. 2022, 250, 110863. [Google Scholar] [CrossRef]
  42. Chen, M.; Xiao, P.; Zhou, H.; Li, C.B.; Zhang, X. Fully coupled analysis of an integrated floating wind-wave power generation platform in operational sea-states. Front. Energy Res. 2022, 10, 931057. [Google Scholar] [CrossRef]
  43. Zou, M.; Chen, M.; Zhu, L.; Li, L.; Zhao, W. A constant parameter time domain model for dynamic modelling of multi-body system with strong hydrodynamic interactions. Ocean Eng. 2023, 268, 113376. [Google Scholar] [CrossRef]
  44. Chen, M.; Xiao, P.; Zhang, Z.; Sun, L.; Li, F. Effects of the end-stop mechanism on the nonlinear dynamics and power generation of a point absorber in regular waves. Ocean Eng. 2021, 242, 110123. [Google Scholar] [CrossRef]
  45. Hu, J.; Zhou, B.; Vogel, C.; Liu, P.; Willden, R.; Sun, K.; Zang, J.; Geng, J.; Jin, P.; Cui, L.; et al. Optimal design and performance analysis of a hybrid system combing a floating wind platform and wave energy converters. Appl. Energy 2020, 269, 114998. [Google Scholar] [CrossRef]
  46. Zhou, B.; Hu, J.; Jin, P.; Sun, K.; Li, Y.; Ning, D. Power performance and motion response of a floating wind platform and multiple heaving wave energy converters hybrid system. Energy 2023, 265, 126314. [Google Scholar] [CrossRef]
  47. Folley, M. Numerical Modelling of Wave Energy Converters: State-of-the-Art Techniques for Single Devices and Arrays; Academic Press: Cambridge, MA, USA, 2016. [Google Scholar]
  48. Babarit, A. Review on the park effect in arrays of oscillating wave energy converters. Renew. Energy 2013, 58, 68–78. [Google Scholar] [CrossRef]
  49. Eatock Taylor, R.; Taylor, P.; Stansby, P. A coupled hydrodynamic–structural model of the M4 wave energy converter. J. Fluids Struct. 2016, 63, 77–96. [Google Scholar] [CrossRef]
  50. GD04-2021; Application Guide for Design and Evaluation of Offshore Structures Environmental Conditions. China Classification Society: Beijing, China, 2021.
  51. Wen, Y.; Wang, W.; Liu, H.; Mao, L.; Mi, H.; Wang, W.; Zhang, G. A Shape Optimization Method of a Specified Point Absorber Wave Energy Converter for the South China Sea. Energies 2018, 11, 2645. [Google Scholar] [CrossRef]
  52. Robertson, A.; Jonkman, J.; Masciola, M.; Song, H.; Goupee, A.; Coulling, A.; Luan, C. Definition of the Semisubmersible Floating System for Phase II of OC4; NREL/TP–5000–60601; National Renewable Energy Laboratory (NREL): Golden, CO, USA, 2014.
  53. Liu, H.; Chen, M.; Han, Z.; Zhou, H.; Li, L. Feasibility Study of a Novel Open Ocean Aquaculture Ship Integrating with a Wind Turbine and an Internal Turret Mooring System. J. Mar. Sci. Eng. 2022, 10, 1729. [Google Scholar] [CrossRef]
  54. Sun, L.; Zang, J.; Taylor, R.E.; Taylor, P.H.; Chen, M. Sensitivity Analysis of Wave Energy Converters in Short-Crested Waves. In Proceedings of the Thirteenth ISOPE Pacific/Asia Offshore Mechanics Symposium, Jeju, Republic of Korea, 14–17 October 2018. [Google Scholar]
Figure 1. Four concepts of floating wind–wave power generation platforms.
Jmse 12 00206 g001
Figure 2. Schematic of non-central placement of point absorbers on a floating platform.
Jmse 12 00206 g002
Figure 3. The wind–wave power generation platform comprising the combination of the OC4 platform and point absorbers.
Jmse 12 00206 g003
Figure 4. Four different layouts of the point absorbers.
Jmse 12 00206 g004
Figure 5. Simulation flow chart for ANSYS-AQWA.
Jmse 12 00206 g005
Figure 6. Comparison of the hydrodynamic coefficients of the point absorber models.
Jmse 12 00206 g006
Figure 7. Surface contours under different layouts ( H = 2   m , ω = 0.66   rad / s ).
Jmse 12 00206 g007
Figure 8. Comparison of RAO for the point absorbers.
Jmse 12 00206 g008
Figure 9. Time-domain simulation in ANSYS-AQWA.
Jmse 12 00206 g009
Figure 10. Comparison of RAO between present frequency-domain model and time-domain model in ANSYS-AQWA.
Jmse 12 00206 g010
Figure 11. Contour diagram of the CWR of the point absorber for varying PTO stiffness values and wave periods under different models.
Jmse 12 00206 g011
Figure 12. Comparison of relative RAO between the peak and secondary peak of CWR.
Jmse 12 00206 g012
Figure 13. Contour diagram of the CWR of the point absorber for varying PTO damping coefficients and wave periods under different models.
Jmse 12 00206 g013
Figure 14. Comparison of CWR under the optimal PTO damping coefficient for different models.
Jmse 12 00206 g014
Figure 15. The other two layouts for the point-absorber array.
Jmse 12 00206 g015
Figure 16. Contour diagram of the total power generation of the point absorber for varying PTO damping coefficients and wave periods under different models.
Jmse 12 00206 g016
Figure 17. The variation in the maximum total power generation of point absorbers in different models.
Jmse 12 00206 g017
Figure 18. The variation in total power with wave frequency for different models.
Jmse 12 00206 g018
Figure 19. The variation in q factor with wave frequency for different models.
Jmse 12 00206 g019
Figure 20. Distribution of significant wave height and peak wave period.
Jmse 12 00206 g020
Figure 21. PSD based on JONSWAP spectrum.
Jmse 12 00206 g021
Figure 22. The expected power for different models.
Jmse 12 00206 g022
Table 1. Dimensions of OC4 platform.
ItemValueUnit
Diameter of base columns24m
Diameter of upper columns12m
Length of base columns6m
Length of upper columns26m
Column center to center50m
Operating draft20m
Bracing diameter1.6m
Distance between COG and SWL13.46m
Displacement tonnage1.3473 × 104t
Table 2. Dimensions of point absorbers.
ItemValueUnit
Radius4m
Length5m
Operating draft3m
Distance between COG and SWL1m
Displacement tonnage1.5457 × 102t
Table 3. The maximum CWR for each point absorber with optimal PTO stiffness.
ModelNumber of Point Absorbers Maximum CWROptimal PTO Stiffness
(N/m)
Optimal Wave Frequency
(rad/s)
SPA 0.412201.35
SPA-WP 0.687301.29
TPAPA10.299301.29
PA2 and PA30.483101.44
TPA-WPPA10.288701.29
PA2 and PA30.496901.38
Table 4. The maximum CWR for each point absorber with optimal PTO damping coefficient.
ModelNumber of Point AbsorbersMaximum CWROptimal PTO Damping Coefficient
(Ns/m)
Optimal Wave Frequency
(rad/s)
SPA 0.41935.80 × 1041.35
SPA-WP 0.76338.50 × 1041.29
TPAPA10.30446.50 × 1041.26
PA2 and PA30.47874.50 × 1041.41
TPA-WPPA10.36343.07 × 1050.87
PA2 and PA30.50172.19 × 1051.05
Table 5. The maximum total power generation under different models.
ModelMaximum Total Power Generation (W)Optimal PTO Damping Coefficient
(Ns/m)
Optimal Wave Frequency
(rad/s)
SPA6.2417 × 1047.60 × 1041.29
SPA-WP1.1666 × 1058.50 × 1041.29
TPA1.9231 × 1052.51 × 1050.99
TPA-WP2.2623 × 1052.39 × 1050.99
TPA-WP22.7278 × 1058.40 × 1041.26
SIXPA-WP3.8422 × 1052.38 × 1050.99
Disclaimer/Publisher’s Note: The statements, opinions and data contained in all publications are solely those of the individual author(s) and contributor(s) and not of MDPI and/or the editor(s). MDPI and/or the editor(s) disclaim responsibility for any injury to people or property resulting from any ideas, methods, instructions or products referred to in the content.

