Article

Estimation of Effective Internal Friction Angle by Ball Penetration Test: Large-Deformation Analyses

1
Powerchina Huadong Engineering Co., Ltd., Hangzhou 310030, China
2
MOE Key Laboratory of Marine Environment and Ecology, Ocean University of China, Qingdao 266100, China
*
Author to whom correspondence should be addressed.
J. Mar. Sci. Eng. 2024, 12(2), 230; https://doi.org/10.3390/jmse12020230
Submission received: 23 November 2023 / Revised: 21 January 2024 / Accepted: 22 January 2024 / Published: 27 January 2024
(This article belongs to the Section Geological Oceanography)

Abstract

:
The ball penetrometer is a full-flow penetrometer used as an alternative to the traditional cone penetrometer for characterizing the strength of soft sediments, particularly for offshore engineering, due to its large projection area. However, if the ball is penetrated under partially drained conditions, the resistance of the ball changes with the penetration velocity. The performance of ball penetration is examined employing a coupled large-deformation finite-element method. The reliability of numerical simulations under undrained and partially drained penetrations is verified by comparing with previous tests in the chamber and centrifuge. The backbone curve determining the penetration resistance on the spherical probe is proposed to quantify the influence of partially drained conditions, which captures the effect of the ratio of the diameters of the shaft and ball. Base on the backbone curve derived, an interpretation approach is proposed to predict the effective internal friction angle using the net resistance measured in the ball penetration tests with different penetration velocities.

1. Introduction

The reliability of a few soil laboratory tests is limited in offshore investigations since the soil samples are prone to be seriously disturbed during their extraction and transportation. Therefore, several types of penetrometers, such as those with conical or spherical probes, and the free-falling penetrometer, have been developed to obtain the in-situ stiffness, strength or permeability of soil [1,2,3]. Compared to the cone penetrometers used widely in practice, the ball penetrometer is more favorable for soft cohesive soils because of its much larger projection area. Another advantage of the ball penetrometer is that the effect of the overburden pressure on the penetration resistance can be minimized due to the spherical shape of the probe [4,5].
The cone resistance measured in the cone penetration test (CPT) is employed to estimate the effective internal friction angle of soil, φ′ [6,7]. The penetration velocity, v, in standard CPTs is 20 mm/s, with a conical probe of diameter 35.7 mm or 43.7 mm, indicating that the clayey soil around the moving probe is under undrained conditions. Most of the previous correlations between φ′ and the corrected cone resistance qt were against the penetrations under undrained conditions. For example, Lim et al. (2020) [8] proposed an empirical equation to estimate φ′ based on the normalized cone resistance Q.
Q = q t σ v 0 σ v 0 = 1.8 e 0 0.15 ( λ κ ) 0.1 M 0.7 OCR Λ
where σv0 and σv0 were total and effective vertical stress, respectively; e0 was the initial void ratio; M = 6sinφ′/(3 − sinφ′); OCR represented the over-consolidation ratio; and the power Λ = 1 − κ/λ, and λ and κ were the slopes of the normal consolidation line and the swelling line, respectively. Accounting for the practical ranges of e0, λ and κ, Zhang et al. (20234) [9] simplified Equation (1) with OCR = 1
Q = 2.8 M 0.7
When the CPTs are carried out in silty clays, partially drained conditions may be formed around the probe, as reported in Lehane et al. (2009) [10], Chow et al. (2020) [11] and Mo et al. (2020) [12]. The drainage conditions were distinguished through the normalized velocity of penetration, V, as suggested in DeJong and Randolph (2012) [13]
V = v D c c v
where Dc was the cone diameter and cv was the coefficient of consolidation. Drained and undrained conditions were approximately within V < 0.01 and V > 30, respectively. V = 0.01–30 indicated partial drainages, where the cone resistance was increased with the decreasing penetration velocity until the drained conditions were achieved [10,14]. Ouyang and Mayne (2021) [7] suggested an equation to predict φ′ (in degree) through CPTs under partially drained or undrained conditions, expressed as
φ = 29.5 B q 0.121 ( 0.256 + 0.336 B q + log Q ) ,   B q = Δ u 2 q t σ v 0
where Bq was the normalized pore pressure and Δu2 the excess pore pressure measured at the shoulder of the cone. The experimental evidence showed that the above equation is applicable for cohesive soils with φ′ ranging from 20° to 45°.
Compared to the studies of estimating φ′ through CPTs, few experimental or numerical results about the ball penetrometer have been reported publicly. The net ball resistance, qbn, was defined as [5]
q bn = q b σ v 0 d s D b
where qb was the corrected resistance of the spherical probe against the excess pore pressure measured at the equator of the ball; ds was the shaft diameter; and Db was the ball diameter. Similar to the cone penetrometer, the normalized resistance factors and penetration velocities of balls were expressed as
Q = q bn / σ v 0
V = v D b c v
There have been several experimental and theoretical studies on the penetration resistance of the spherical probe for soils under partially drained and undrained conditions [10,15]. Most of these studies focused on estimating the undrained shear strength of cohesive soil through the penetration resistance, such as Low et al. (2011) [16], Zhou et al. (2016) [17] and Chow et al. (2023) [18]. Additional efforts encompass numerical analyses of the tests in strain-softening and rate-dependent clays [19]. However, there is no publicly reported approach to predicting φ′ for the ball penetrometers, as far as we know. As more ball penetrometers have been used in offshore geotechnical investigations, the correlation between qbn and φ′ under various drainage conditions is required.
In this paper, a large-deformation finite-element (LDFE) approach incorporating the modified Cam-Clay (MCC) model is employed to simulate the penetration of the ball in cohesive soil, with an aim to predict the effective internal friction angle through the resistance of the spherical probe. The existing model tests in the chamber and the centrifuge are reproduced to validate the approach developed, where the penetrations were under nearly undrained or partially drained conditions. The change in ball resistance with the drainage condition can be quantified by a unique curve as a function of the normalized penetration velocity. Finally, an equation is proposed to derive the effective internal friction angle by accounting for the influences of the ball geometry and soil type.

2. Materials and Methods

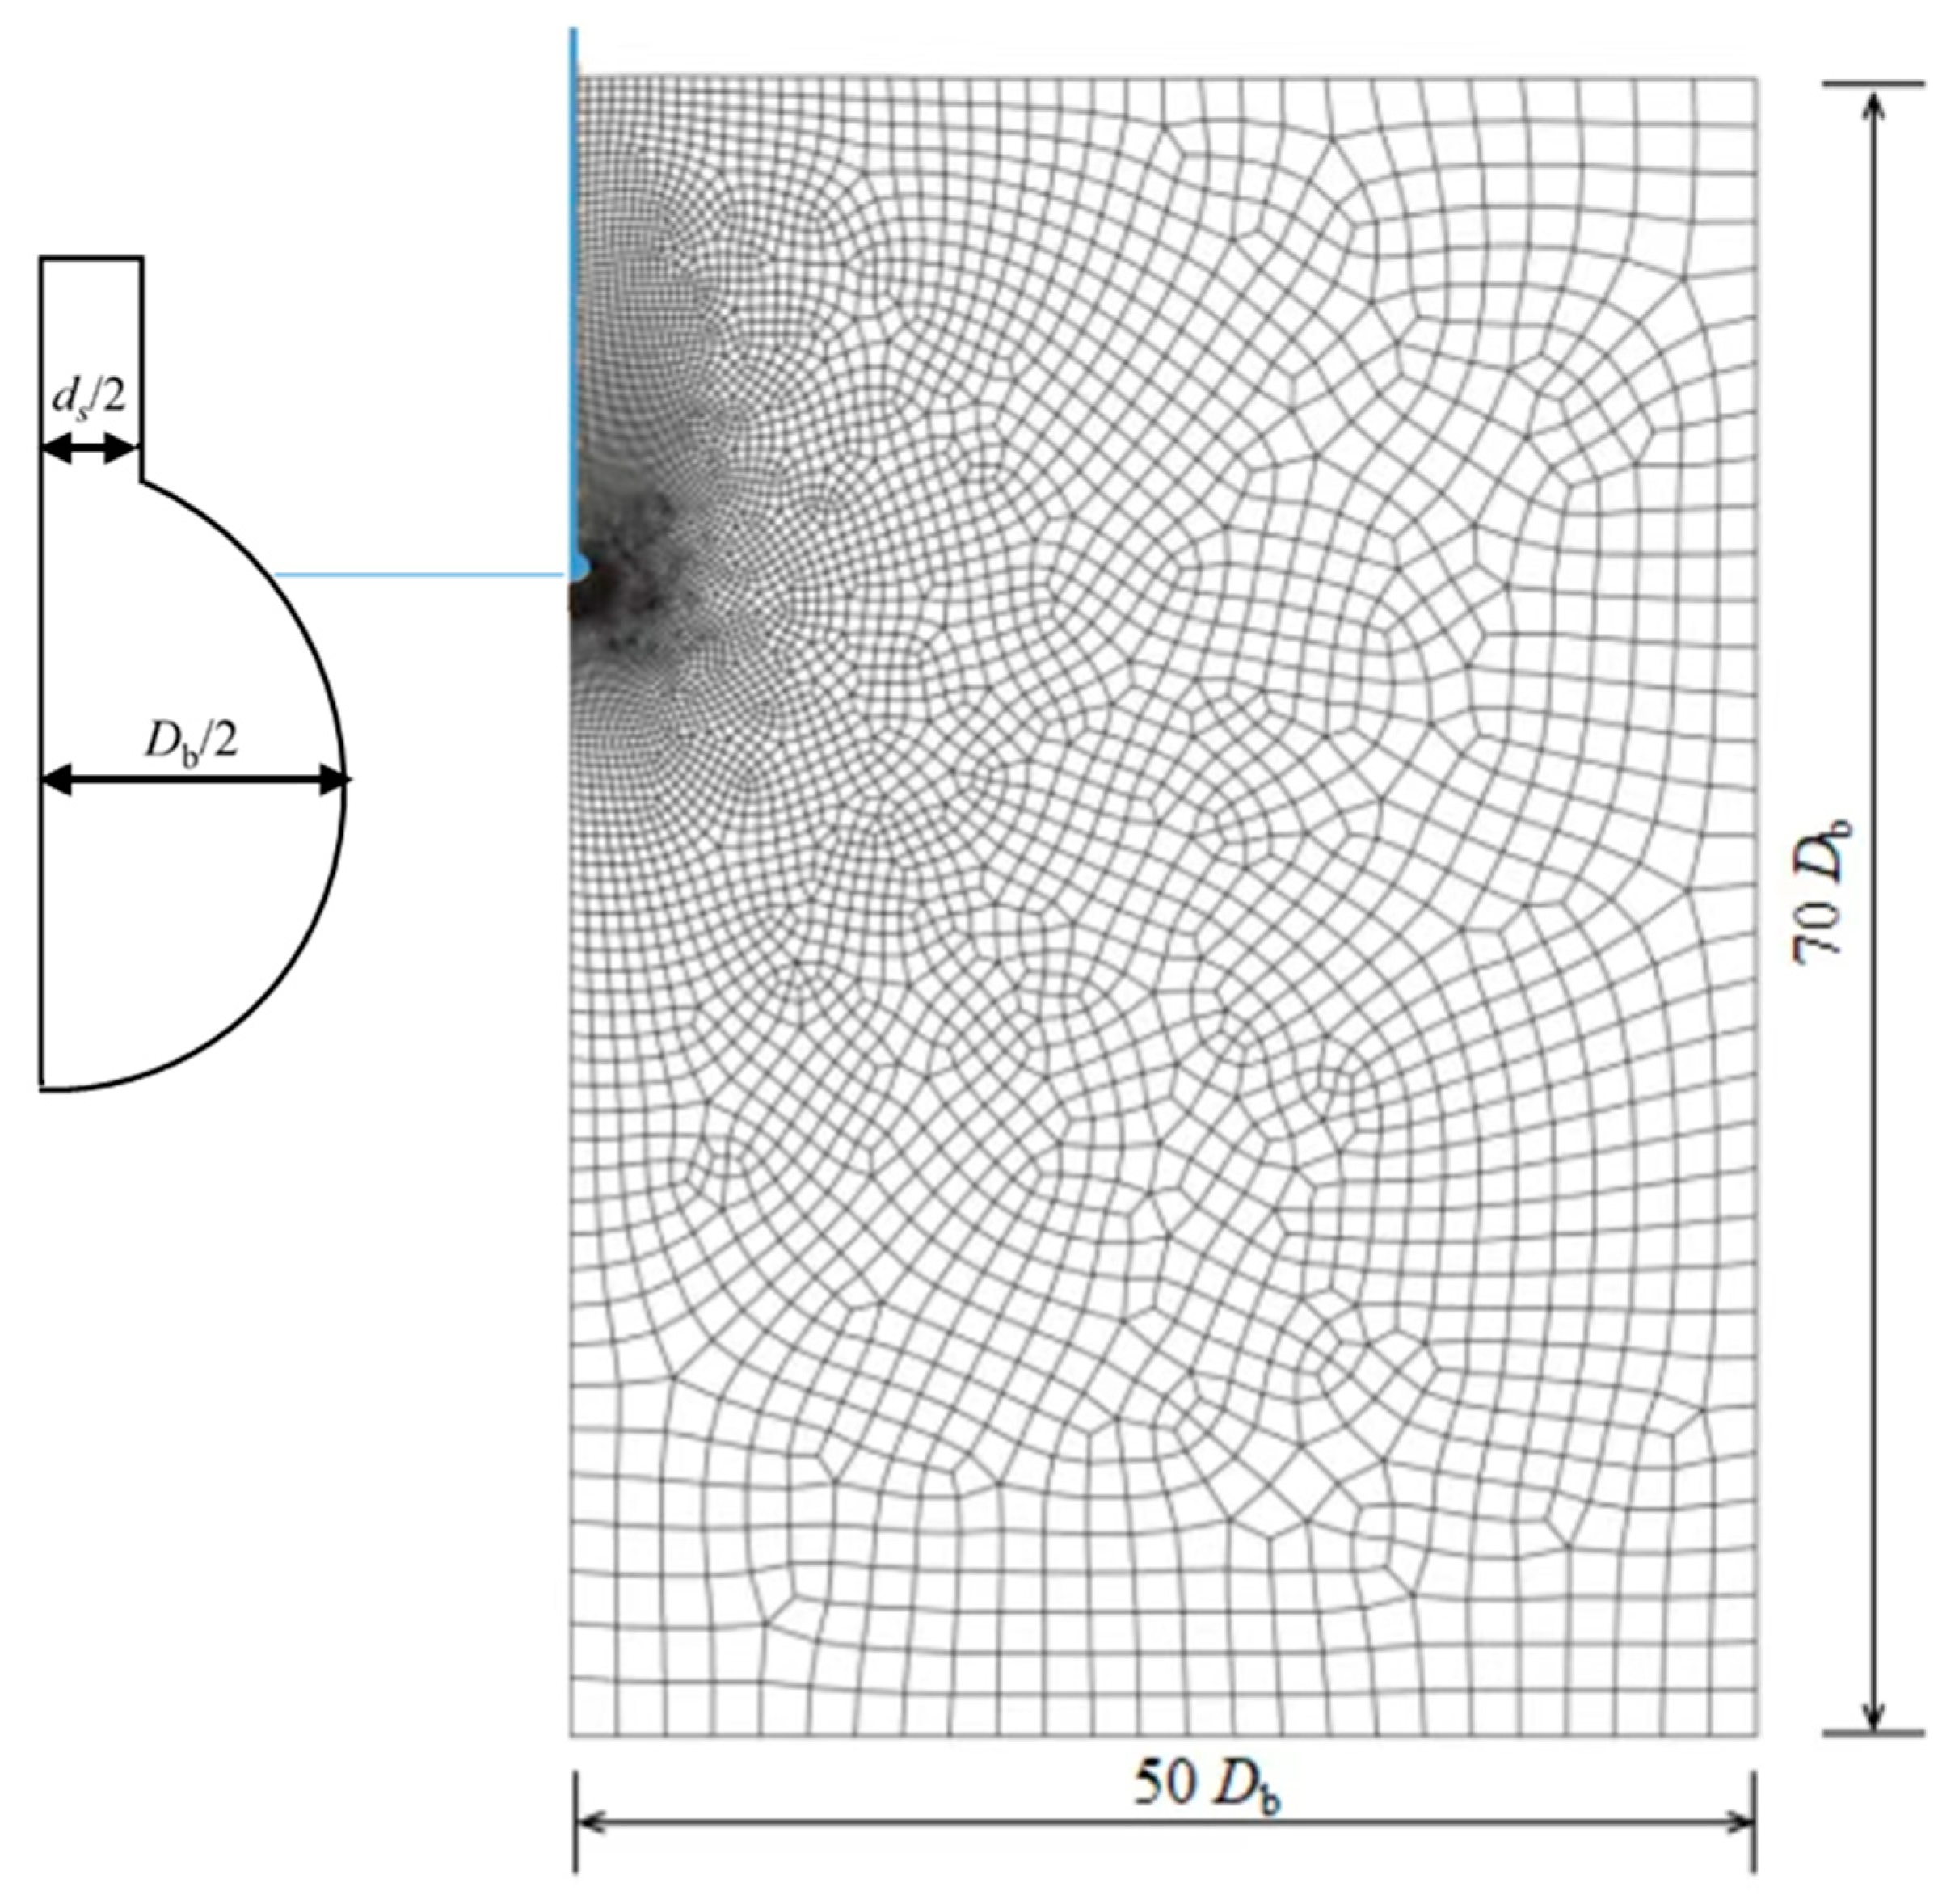
2.1. Strategies of Numerical Analysis

To prevent significant distortions of soil elements around the ball, an LDFE approach within the framework of effective stress-porous water coupled analysis, termed the remeshing and interpolation technique with small strain [20,21,22], was used. The effective stress–strain behaviors of cohesive soil were described by the MCC model. The penetration of the ball was divided into a series of incremental steps. During each of these steps, an updated Lagrangian calculation was conducted in the commercial package Abaqus, with an implicit integration scheme. At the start of every step, a new mesh was generated on the deformed soil, and the field variables, including the effective stresses and void ratio at each integration point and the excess pore pressures at each corner node, were mapped to this new mesh.
The penetration of the shafted ball was an axisymmetric problem, and the region of the soil was discretized using quadrilateral elements, which was referred to as CAX8RP within Abaqus. The sizes of the soil area were taken as 50 Db radially and 70 Db vertically, to avoid potential boundary effects, as presented in Figure 1. The base and vertical boundaries of the soil were constrained vertically and horizontally, respectively, and the soil surface was permeable. The ball–soil interaction was simplified as frictionless. The diameter of the ball Db was 15 mm, and the diameter of the shaft ds was 5 mm, unless otherwise indicated. To save computational efforts, the balls were pre-buried at a soil depth of no less than 8 Db and were then moved downwards with a depth of 2 Db. The strategy has been demonstrated to be sufficiently accurate for obtaining stable penetration resistance. The ball displacement of 0.05 Db per incremental step was selected through trial calculations to guarantee the computational convergence and accuracy. More details of the LDFE analyses for ball or cone penetrometers can be found in Zhang et al. (2023) [3].

2.2. Soil Properties

Three types of clay or clayey silt were taken as examples here: (a) UWA kaolin. This was used extensively in the centrifuge tests—for example, in the tests of penetrometers by Mahmoodzadeh and Randolph (2014) [23]. (b) Malaysian kaolin. Its permeability was one order higher than that of UWA kaolin [22], suggesting that partially drained conditions may appear easily during ball penetration. (c) Burswood clay. This soil had a high effective internal friction angle of 31.5°, which facilitated an insightful verification of the large-deformation analyses. UWA kaolin is typical clay, while the latter two soil types are classified as clayey silts [24,25,26]. All three soil types were regarded as MCC materials, and their properties were reported by Purwana et al. (2006) [27], Mahmoodzadeh and Randolph (2014) [23] and Low and Randolph (2010) [26], as shown in Table 1. The experimental findings for these commercial kaolins, such as those for CPT [10,11], spudcan footings [28,29], pipelines [30] and anchors [31,32], have been employed in recent offshore geotechnical practices. Therefore, the LDFE studies are to be for the Malaysian kaolin, UWA kaolin, and Burswood clay. According to Equation (8) in Wroth (1984) [33], for UWA and Malaysian kaolins at normally consolidated (NC) conditions, the profiles of undrained shear strength su deduced from the MCC model were both su = 1.46 z kPa, where z was soil depth. su = 1.55 z kPa for NC Burswood clay [23,26,27].
s u = ( 1 + 2 K 0 ) 3 σ v 0 M 2 ( η 2 + M 2 2 M 2 ) Λ
where K0 was the coefficient of earth pressure at rest and η = 3(1 − K0)/(1 + 2 K0).
A void ratio-dependent permeability function was suggested by Mahmoodzadeh and Randolph (2014) [23] to describe the permeabilities of soils. The permeability of soil is a function of the void ratio [28,34,35], and the void ratio-dependent permeability function has been used extensively in the coupled effective stress-pore pressure simulations of penetrometers [23] and spudcan footings [29]. The permeability, k, was assumed to be isotropic, calculated as
k = γ w m v c v = γ w λ c v ( 1 + e ) σ v 0
where γw was the unit weight of porous water, mv was the compressibility during one-dimensional consolidation, and e was the void ratio. The coefficient of consolidation cv is a traditional and widely used property in soil mechanics. It is a phenomenon covering the seepage and deformation of the porous material. cv is obtained from one-dimensional consolidation tests and could be fitted, as described by Low and Randolph (2010) [26] and Wang and Bienen (2016) [22].
c v = 39.7 ( σ v 0 / p a ) 0.45   m 2 / y   for   Malaysian   kaolin
c v = 1 + 14 σ v 0 / p a   m 2 / y   for   UWA   kaolin
c v = 1 . 56 ( σ v 0 / p a ) 0 . 824   m 2 / y   for   Burswood   clay
where pa was the atmospheric pressure. A flowchart about the processes of the methods used is shown in Figure 2.

3. Results

3.1. Validation

The model tests in the chamber and centrifuge conducted by Low and Randolph (2010) [26] and Mahmoodzadeh and Randolph (2014) [23], respectively, were reproduced to validate the reliability of the LDFE approach employed. The model balls were penetrated in NC Burswood clay or UWA kaolin, and the ball resistances measured were varied with the penetration velocities. In the following discussions, the normalized velocity of penetration V was obtained from Equation (7), and the values of cv were calculated by Equation (10). According to extensive trial calculations, it was found that the backbone curve discussed later can be fitted by including V, although cv is a function of soil depth. Therefore, the cv at the final depth of the ball penetrometer was adopted for normalizations.

3.1.1. Chamber Test by Low and Randolph (2010)

The effective internal friction angle was measured as φ′ = 31.5° through the triaxial compression tests against the Burswood clay [26]. The effective internal friction angle was measured as φ′ = 31.5° through the undrained triaxial tests against the Burswood clay, where the soil sample was consolidated anisotropically and was sheared in triaxial compression mode. More details of triaxial tests and the corresponding results can be found in [16]. A ball with Db = 11.9 mm and ds = 5 mm was penetrated at a velocity of 1 mm/s up to a depth of 13.3 Db. To prepare the sample, a surcharge of 35 kPa was applied at the soil surface. The surcharge represented a soil depth of 6.7 m with γ′ = 5.2 kN/m3 (see Table 1); therefore, the penetration depth of 13.3 Db indicated an actual depth of 6.9 m. The corresponding cv value was thus calculated as 0.6 m2/y by Equation (10c). V was found to be 619.8 by using Equation (7), suggesting that the penetration was essentially carried out under undrained conditions.
The experimental and numerical curves, qbn/su versus penetration depth normalized by Db, are plotted in Figure 3. The solid curve in the figure represents the results of the chamber test reported by Low and Randolph (2010) [26], while the dashed curve is the penetration profile found using the LDFE approach. A general agreement between the two curves is achieved. The experimental value of qbn/su increased quickly at the early stage of the penetration and then reached a stable value of 10.7 rapidly at around 1 Db. This rapid increase was attributed to the overburden stress of 35 kPa applied on the soil surface, as indicated by the experimental setup [26]. There existed an insignificant fluctuation of qbn/su within the depth of 2.5 Db–10 Db, potentially due to the fact that the soil in the chamber was not ideally uniform. To save computational efforts, the LDFE simulation was performed with the spherical probe pre-embedded at 8.67 Db. The penetration displacement was 5 Db in the LDFE simulation, to guarantee a sufficiently steady value of qbn/su. The undrained shear strength measured by the vane shear test was 14.2 kPa in Low and Randolph (2010) [26], and the resistance factor of the ball penetrometer was 10.7 in terms of su = 14.2 kPa. Zhou and Randolph (2009) [36] suggested a resistance factor of 10.5. In Figure 3, the experimental and numerical stable values of qbn/su are both around 10.7 at the penetration distance larger than 1 Db. The centrifuge data, LDFE results and existing empirical solutions agreed well with each other, validating the reliability of the LDFE approach.

3.1.2. Centrifuge Tests by Mahmoodzadeh and Randolph (2014) [23]

The centrifuge tests by Mahmoodzadeh and Randolph (2014) [23] were in terms of UWA kaolin, with a spinning acceleration of 110 g (g represents the gravitational acceleration). The effective internal friction angle of UWA kaolin was measured as 23° in the triaxial compression test. The model ball with Db = 15 mm and ds = 5 mm was moved deliberately at velocities of 0.01, 0.03, 0.05, 0.1 and 1 mm/s, respectively, to generate different drainage conditions in the soil around the probe. The final depth of the probe was around 10.67 Db, i.e., equivalent depth z = 17.6 m. Based on the properties of UWA kaolin in Table 1, cv was 4 m2/y at this depth. The normalized penetration velocities were thus calculated as 1.2, 3.6, 5.9, 11.8 and 118, indicating that the soil is under partially drained or undrained conditions. The spherical probe was pre-embedded at 5 Db in the LDFE simulations, followed by a penetration distance of 5.67 Db.
The variations of qbn/su with z/Db under different drainage conditions are compared in Figure 4, where the penetration velocities are selected deliberately to cover a wide range from 0.01 mm/s to 1 mm/s. The solid and dash curves represent the experimental and LDFE results, respectively. Fluctuations of the experimental curves were observed again, as in the chamber test discussed above [26], due to the non-uniform soil sample. Slight or moderate divergences between the numerical and experimental results were observed, but it was argued that the numerical curves agreed reasonably well with the experimental ones. Either experimental or numerical results highlighted a tendency that the normalized ball resistance was reduced with increasing V. The soil depth where the steady value of qbn/su was reached depended on the penetration velocity: this critical depth was shallower under undrained conditions, and the depth became deeper with decreasing penetration velocity. For example, in the LDFE simulations, the steady qbn/su value was reached at a penetration distance of 1 Db for V = 118 (v = 1 mm/s), while a penetration distance of 4 Db was required for V = 1.2 (v = 0.01 mm/s).

3.2. Interpretation of Ball Resistance under Partial Drainage Condition Penetrations

To explore the influence of the drainage condition on the normalized penetration resistance and then on the estimation of φ′, a parametric study based on the LDFE analyses was conducted. The velocity of penetration v range between 0.1 mm/s and 10 mm/s in Malaysian kaolin and v = 0.001–1 mm/s in Burswood clay was used to achieve the partially drained or undrained conditions. To investigate the penetration of the ball penetrometer in deep soils, a pressure of 100 kPa was applied to the soil surface in all groups. The numerical simulations were in terms of the ball, with Db = 15 mm at the acceleration of 1 g. The soil types and the diameter ratio of the shaft and probe of the ball, ds/Db, were varied deliberately. As shown in Table 2, the LDFE analyses are classified into four groups.

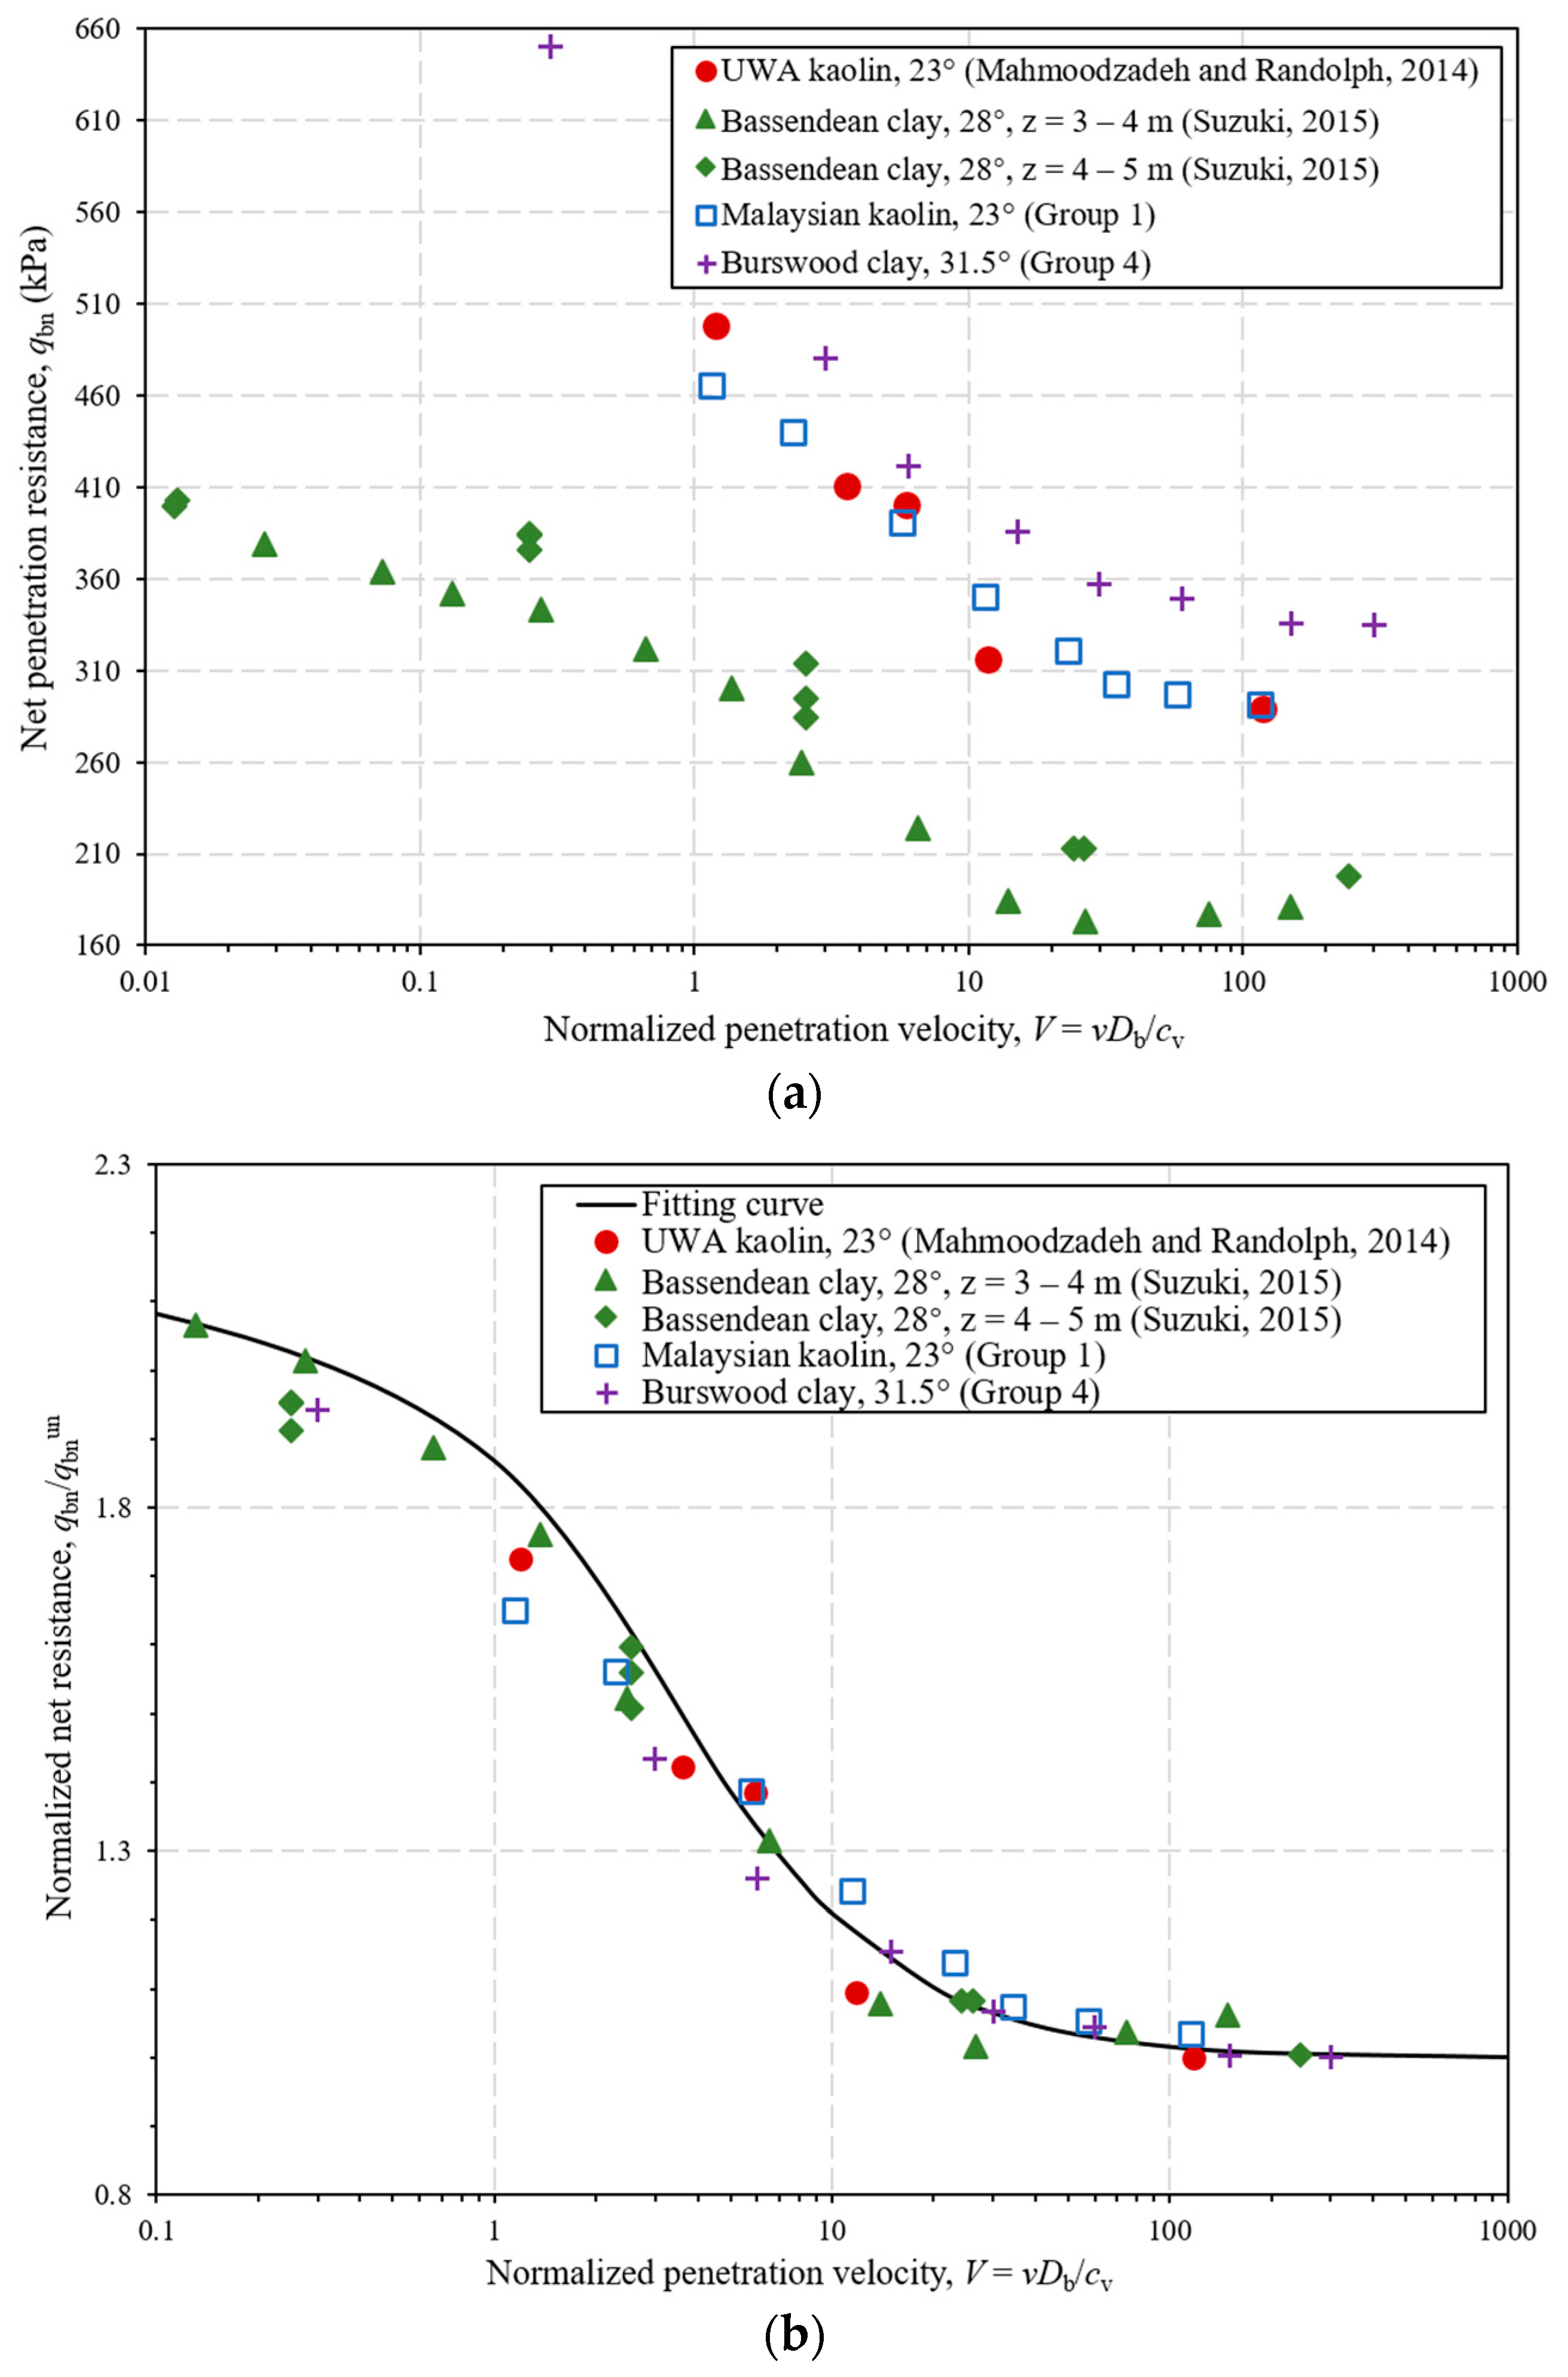
3.2.1. Backbone Curve

The results of Malaysian kaolin, group 1 of Table 2, are plotted in Figure 5. Similar to that observed in the centrifuge tests of UWA kaolin, the normalized resistance is a function of V. The steady qbn value decreases slightly as V is increased from 34.6 to 115.3, which suggests that the undrained conditions are nearly approached at V = 34.6. The qbn value at V = 34.6 is thus defined as qbnun, the resistance under undrained conditions.
For groups 1 and 4, which are in terms of two soil types, the variations of the normalized ball resistances with the normalized penetration rate are demonstrated in Figure 6a. The experimental data of UWA kaolin from Mahmoodzadeh and Randolph (2014) [23] and Bassendean clay from Suzuki (2015) [37] are plotted in Figure 6a as well. Obviously, the numerical and experimental data are scattered within a wide range. This indicates a significant divergence in ball resistances due to the soil types, effective internal friction angle of soil, and depth of the probe: (a) The effective internal friction angles of both UWA kaolin and Malaysian kaolin reported in Mahmoodzadeh and Randolph (2014) [23] are 23°, and hence, the qbn values of the two are close to each other for a given penetration velocity and a given depth. The angle of the Burswood clay (group 4 in Table 2) is 31.5°, which is much higher than that of UWA or Malaysian kaolin, resulting in larger qbn values. (b) Different qbn values of the spherical probe in Bassendean clay were observed at soil depths of 3–4 m and 4–5 m in Suzuki (2015) [37]. As demonstrated in Figure 6a, for a penetrometer in a given soil, a larger penetration resistance is reached due to higher overburden stress in a deeper soil. This is proven as well by the higher resistance in Malaysian kaolin in group 1, where the probe is penetrated to an equivalent depth of about 17 m (pressure 100 kPa applied on the soil surface). The higher overburden stress, similar to the higher confining stress in triaxial tests or vertical stress in direct simple shear tests, results in an enhanced shear strength under undrained or drained conditions.
If qbn is normalized by qbnun, all results are located near a unique curve, as shown in Figure 6b. This backbone curve may be expressed as
q bn q bn un = 1 + a 1 + ( V / V 50 ) b
where the coefficients are fitted as V50 = 3, a = 1.1 and b = 1.2 for ball penetrometers. According to Equation (11), the net ball resistance with extremely low penetration velocity (i.e., drained conditions are formed around the ball) is 2.1 times that under undrained conditions, which is similar to the observation in Figure 4. Based on the experimental and numerical observations, DeJong et al. (2012) [12] and Martinez et al. (2018) [38] adopted expressions similar to Equation (11) for cone penetrometers, with V50 ranged between 3 and 4, a between 1.5 and 2.25, and b between 1.0 and 1.6. In Figure 6b, the effective internal friction angles of the soils discussed are in the range of between 23° and 32°. Clearly, the numerical and existing experimental data can be fitted well by Equation (10).
The backbone curve in Figure 6b is composed of three parts: (a) qbn/qbnun = 1 occurs approximately at V > 50, indicating the undrained condition. This phenomenon is similar to that reported in Mahmoodzadeh and Randolph (2014) [23] and Chung et al. (2006) [39]. (b) As reported in Colreavy et al. (2016) [40], V < 0.7 represents nearly drained conditions. Here, qbn/qbnun varies slightly with V as V < 0.7, which is in accordance with the previous finding. and (c) The partially drained conditions occur at 0.7 < V < 50, therefore, V = 50 and 0.7 denote transitions of the drainage conditions.

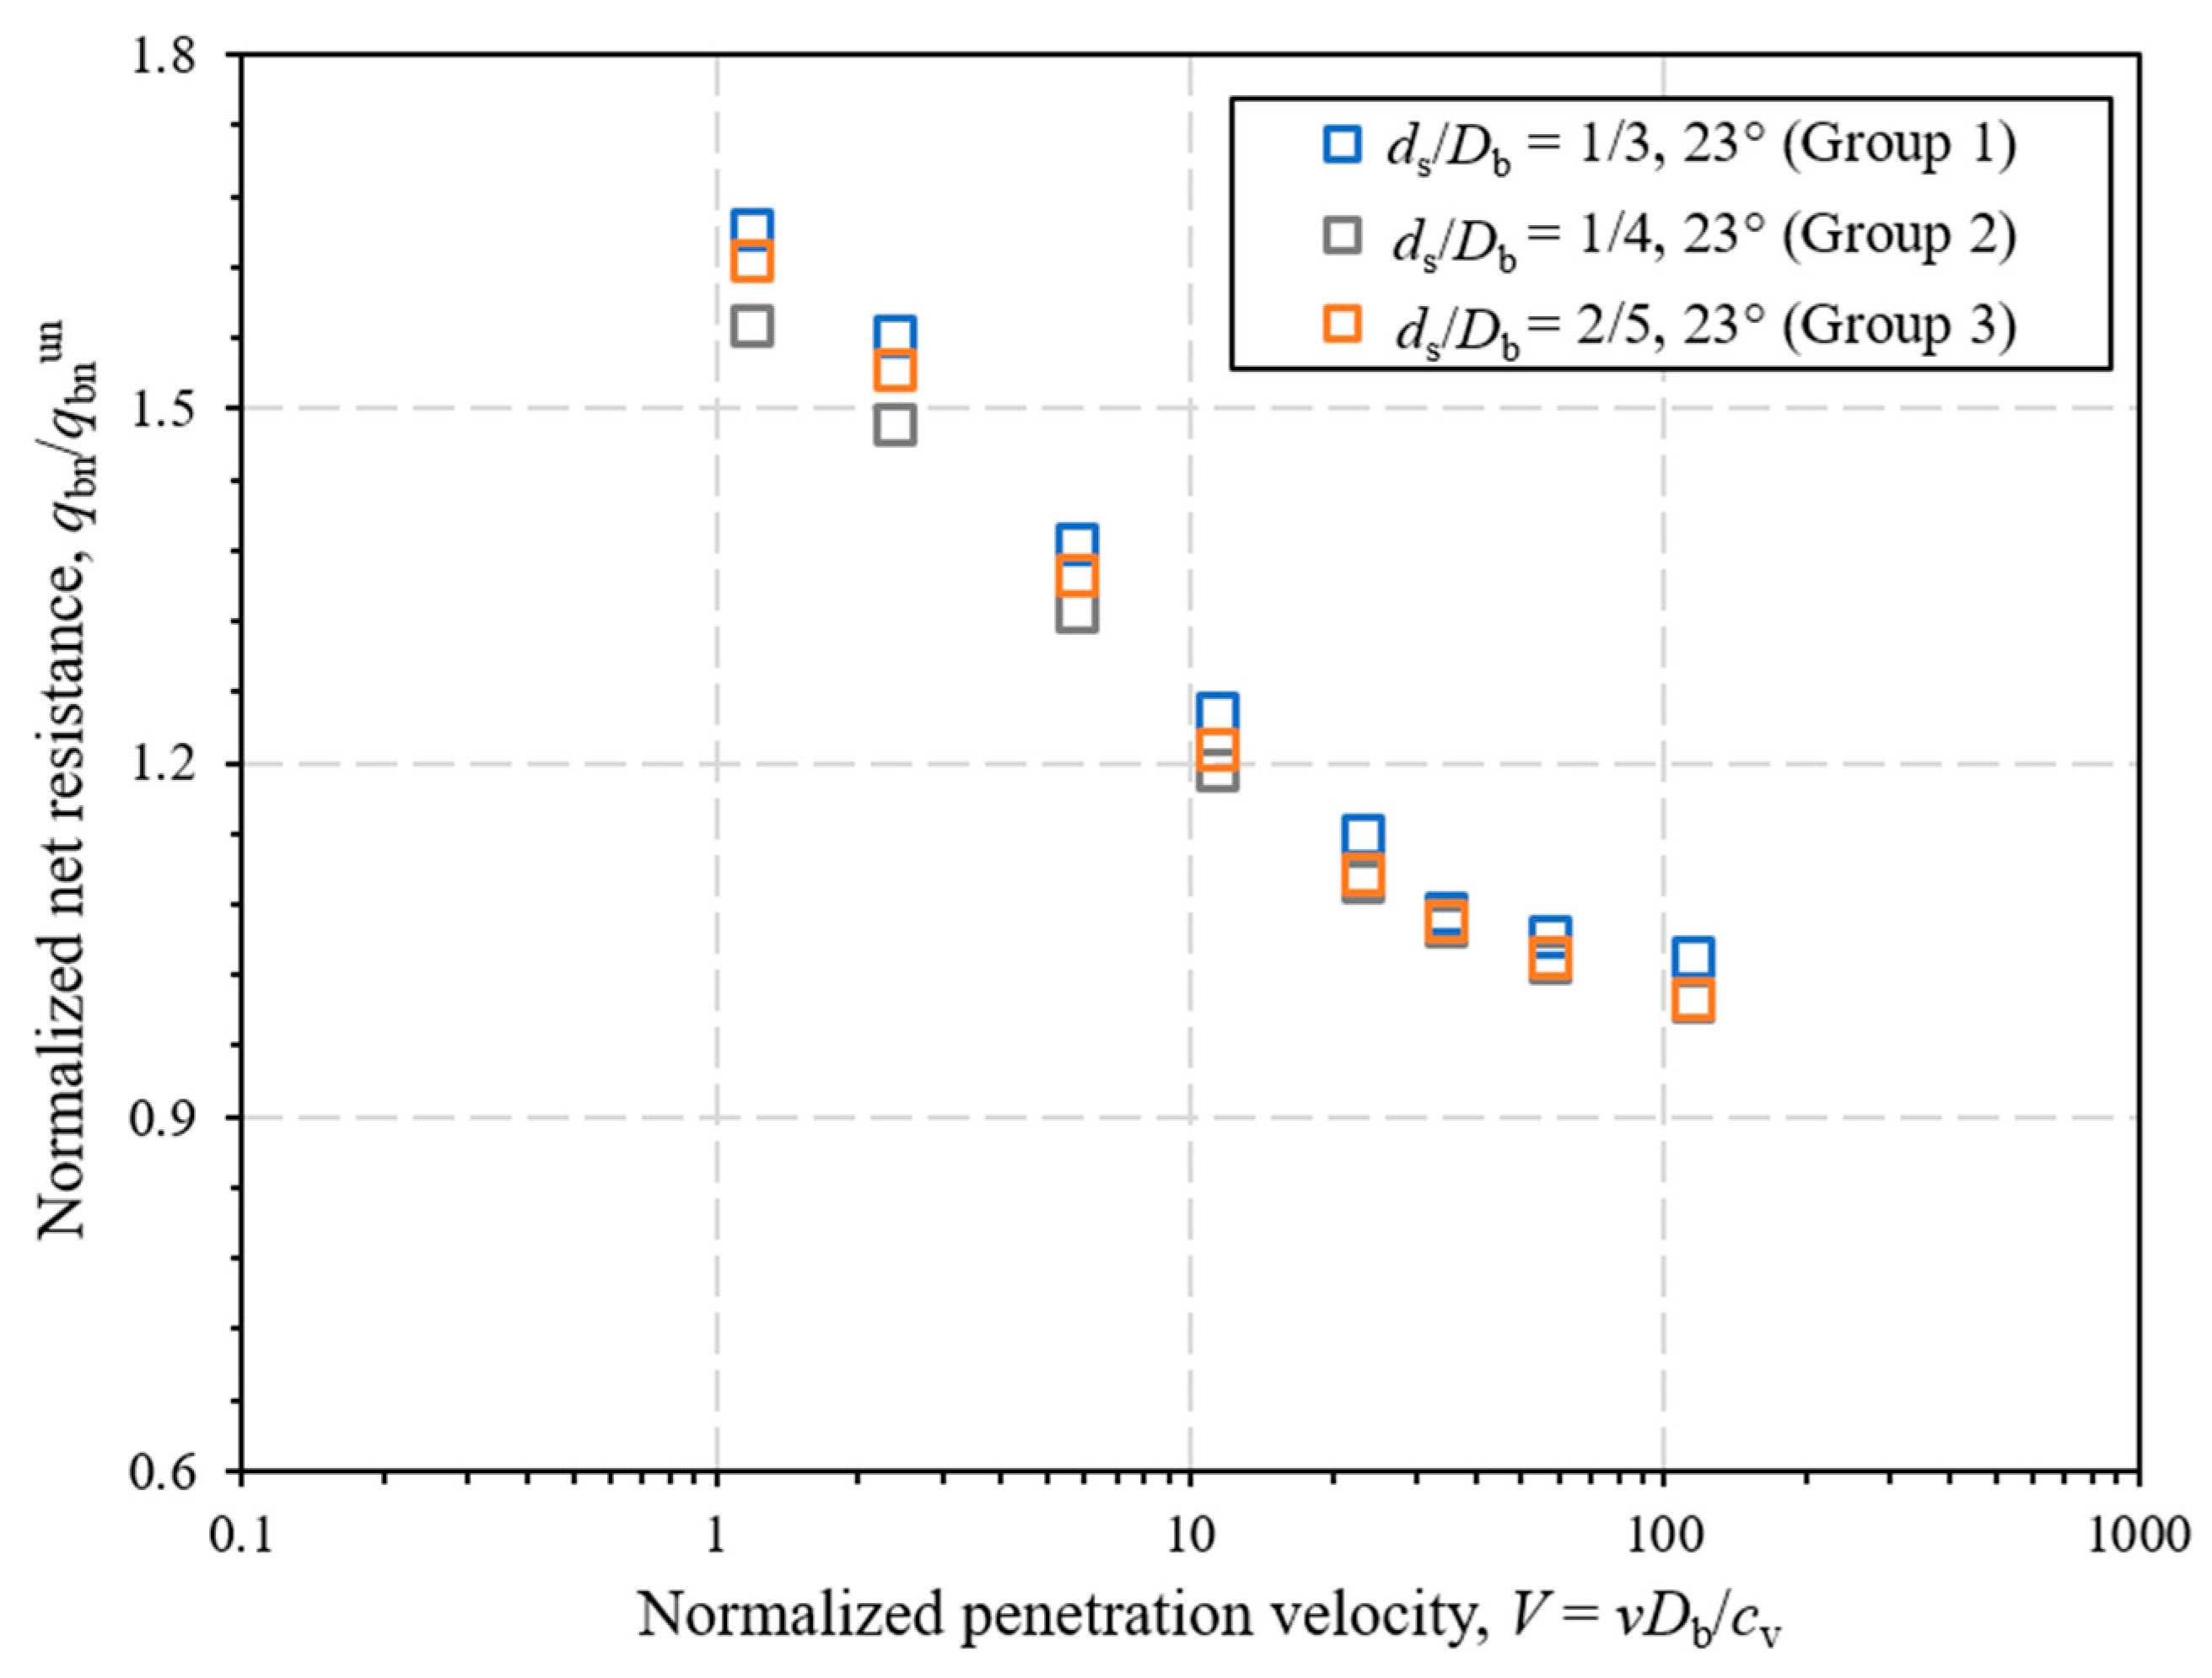
3.2.2. Effect of the Penetrometer Geometry

To investigate the influence of penetrometer geometry, the ratio between the diameters of the shaft and ball, ds/Db, is varied by following Zhou and Randolph (2009) [36]. The ball diameter is maintained as 15 mm, while the values of ds/Db are taken as 1/3, 1/4 and 2/5, respectively, in groups 1–3 in Table 2. As shown in Figure 7, the ratio of qbn and qbnun is changed slightly with varying ds/Db for a given normalized velocity of penetration V. All numerical data are scattered within a narrow range, suggesting that the backbone curve expressed by Equation (11) is near, regardless of the penetrometer geometry over the range of ds/Db ratios studied.

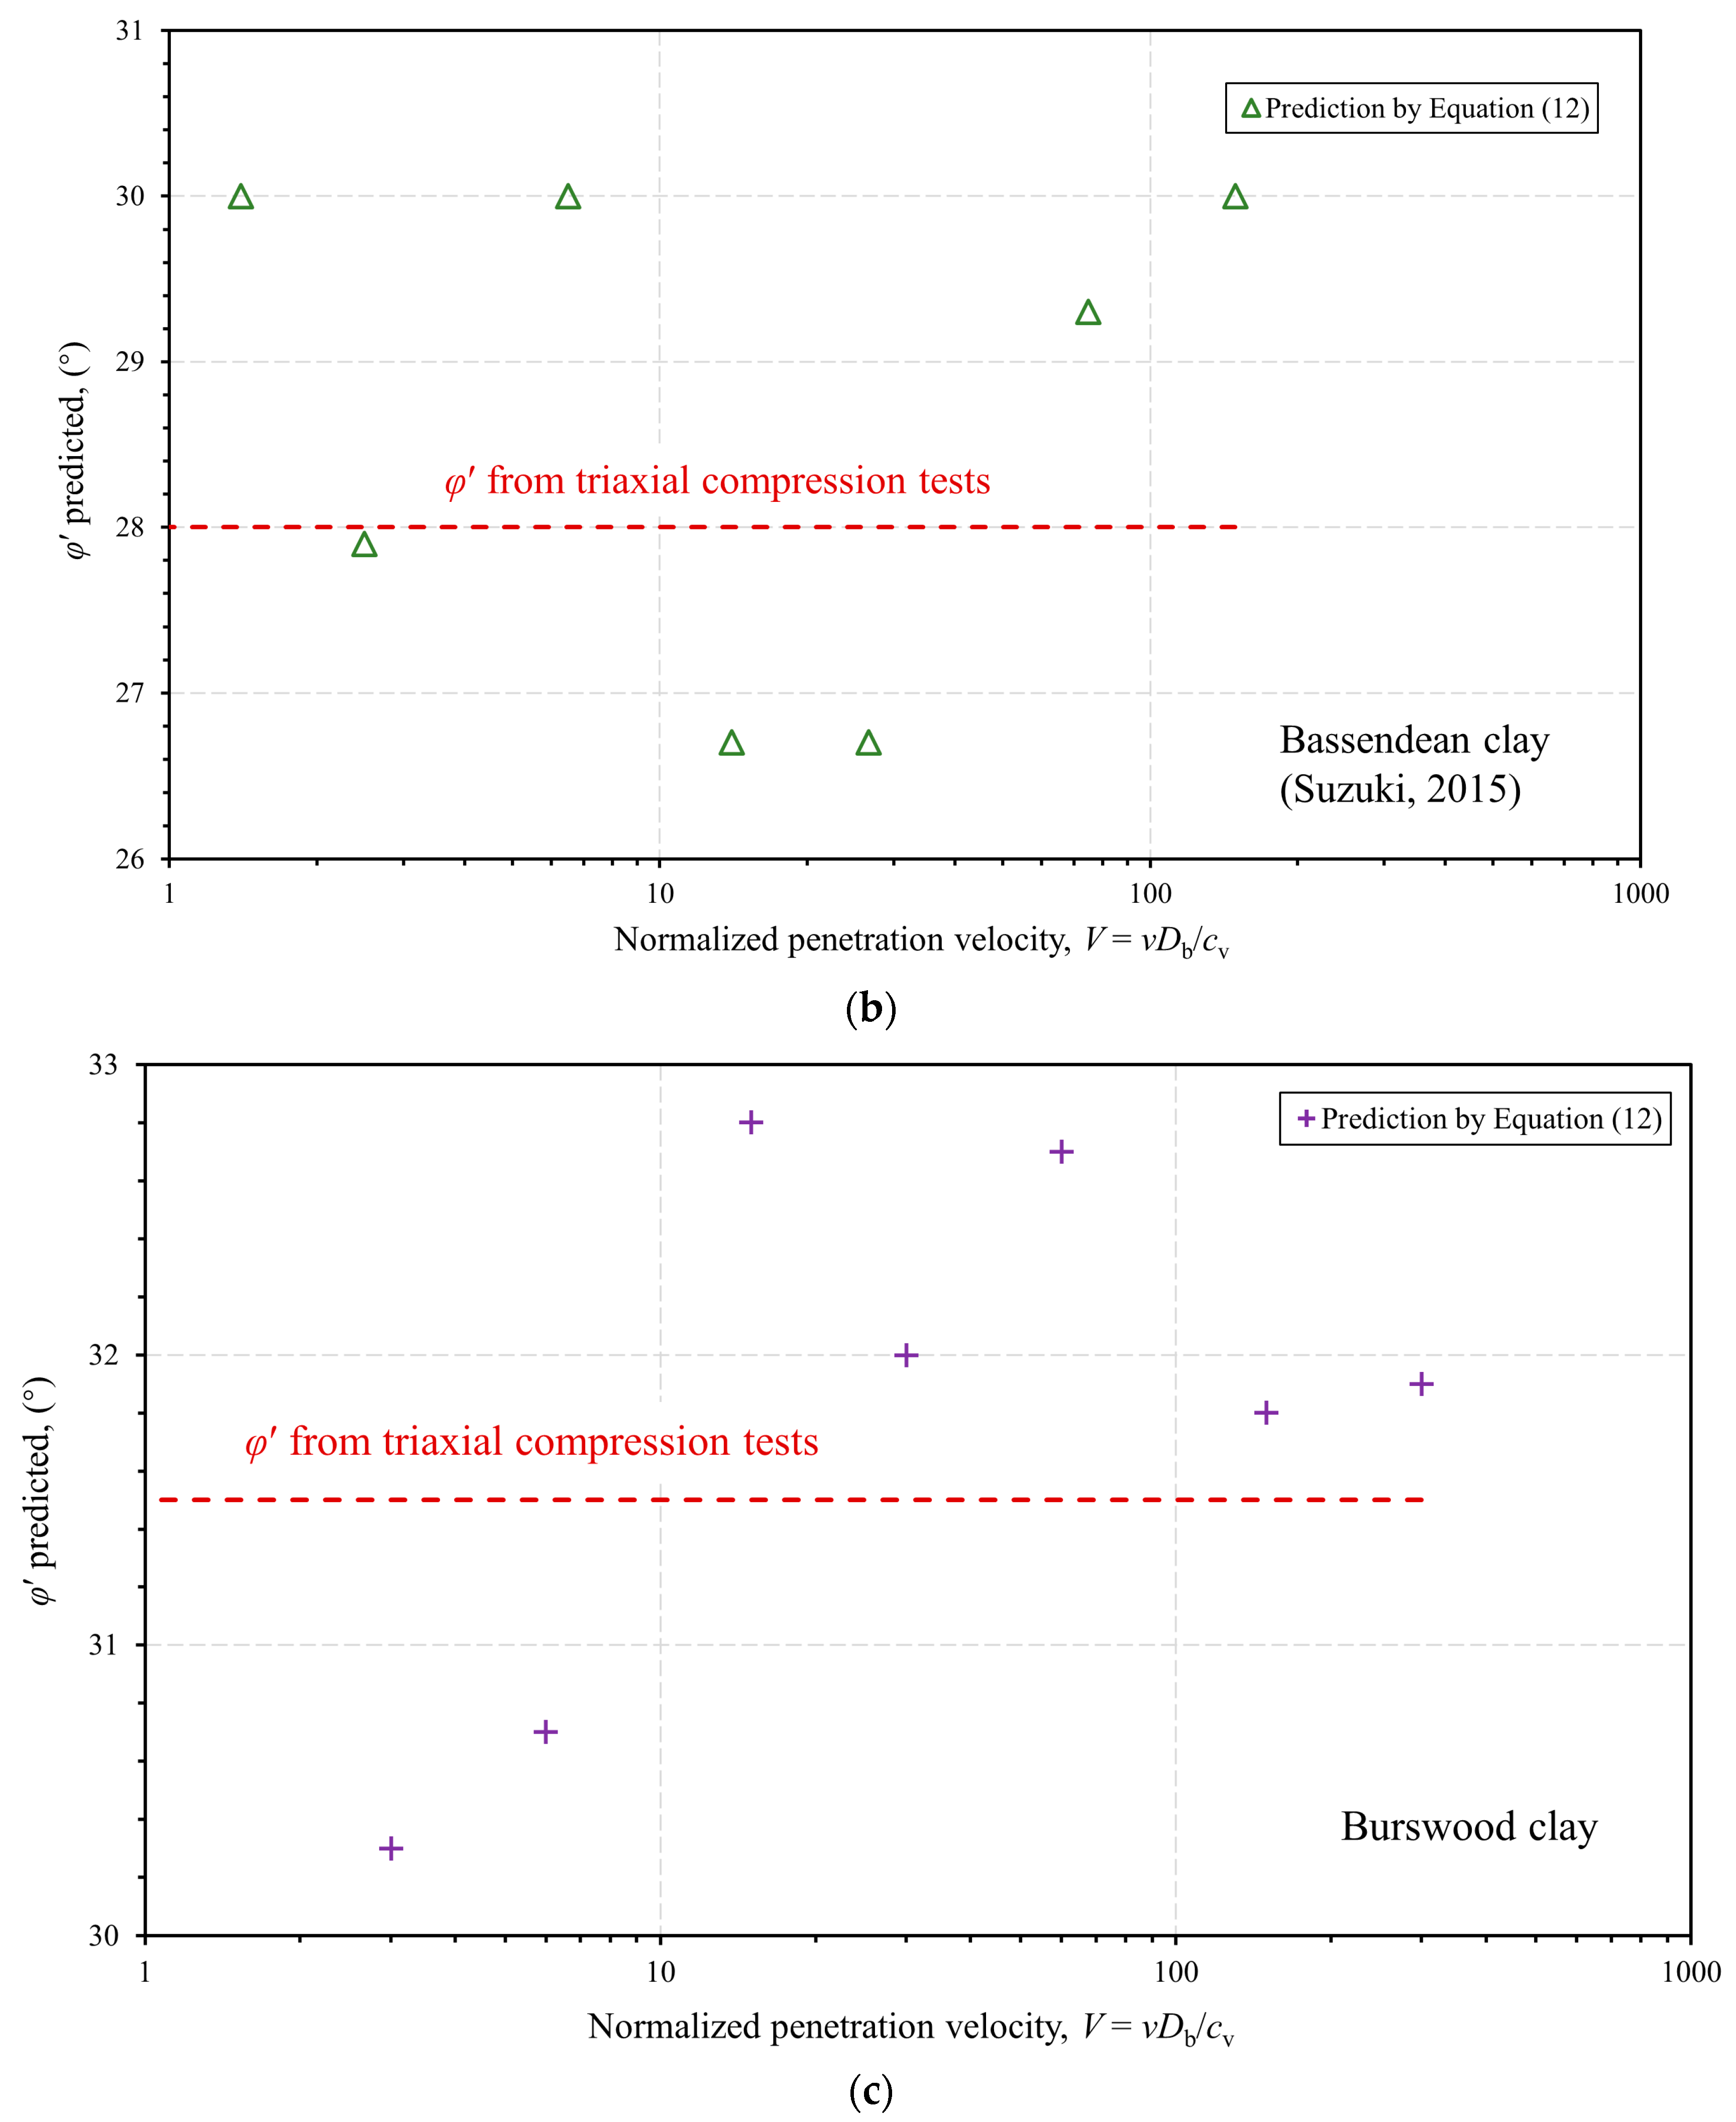
3.3. A New Method to Predict φ′ by Q and V

Based on the backbone curve, the expression between φ′ and Q under different drainage conditions is further developed. The net ball resistance factor of the ball is 10.5 [36], which is close to the factor of 10 for the cone. Therefore, the normalized ball resistances, Q, for the penetrometers of the ball and cone are similar. Equation (1) provides the empirical relationship between Q and φ′ for CPTs under undrained conditions. Here, the equation is expanded to the ball penetrometers under undrained conditions. By combining Equation (2), Equation (10) can be reorganized as qbn/qbnun = Q/(2.8 M0.7). Further, a relationship between Q and φ′ can be established, accounting for the effect of drainage conditions for NC soils
Q = 2.8 M 0.7 ( 1 + 1 1 + ( V / 3 ) 1.2 )
Once Q and V of the ball penetrometer are known, φ′ can be derived directly from Equation (12). Equation (12) fits for both undrained and partially drained conditions of soil around the probe.
The experimental and numerical data under different drainage conditions covering the φ′ ranged from 23° to 32°. These cases include the ball penetration tests in Malaysian kaolin, Burswood clay and Bassendean clay under different drainage conditions. The LDFE approach is used in the first two soil types and the data for Bassendean clay are reported by Suzuki (2015) [37]. The values of φ′ obtained by Equation (12) and measured from the triaxial compression tests for these soil types are plotted in Figure 8. The horizontal axis is the normalized penetration velocity on a logarithmic scale, and the vertical axis represents the effective friction angle (in degree) estimated by Equation (12). The red dashed lines in Figure 8 represent the φ′ values measured from the triaxial compression tests. The effective internal friction angles estimated are ranged between 21° and 24°, 26° and 31°, and 30° and 33°, respectively. It is found that the predicted values of φ′ at low velocities are underestimated for Malaysian kaolin (see Figure 8a), where various ds/Db ratios are distinguished by markers of different colors: φ′ is predicted as 21.1° at V = 1.2 and 21.7°–22.2° at V = 2.4. As V > 3, the estimated values of φ′ are in the range of 22.2°–23.7°, close to 23° measured in the triaxial compression tests. The predicted values of φ′ are located around the red dash line for Bassendean clay and Burswood clay, which ranged between 26.6°–30° and 30.3°–32.8°, respectively, i.e., the estimation errors are no more than ±2° (see Figure 8b,c). Totally, all estimated φ′ values of three soil types are scattered in narrow ranges, while the divergences between the measured and predicted become relatively large under nearly drained conditions.

4. Discussions

Almost all existing experimental, numerical and analytical studies for ball penetrometers were aimed at obtaining the undrained shear strength or coefficient of consolidation of cohesive soil [16,17,18,22]. The new method developed here is based on insights from Lim et al. (2020) [8] and Zhang et al. (2024) [9] on predicting φ′ through the in-situ tests. The advantages of the new method are: (a) Penetrations of the ball under undrained or partially drained conditions can be tackled within a general framework, and (b), The measurement of pore pressure is not mandatory. However, this method is proved against normally consolidated soils only, and it remains unclear if the method can be expanded to overconsolidated soils.
The procedure below is presented to estimate the effective internal friction angle through in-situ tests using ball penetrometers:
(a)
Given that the ball diameter, the coefficient of consolidation of soil, and the penetration velocity are known, the normalized penetration rate is calculated through Equation (7).
(b)
As the net resistance (Equation (5)) and the effective vertical stress are recorded, the normalized ball resistance Q is determined through Equation (6).
(c)
Equation (12) is employed to estimate the slope of the critical state line M and then the value of φ′.

5. Conclusions

A large-deformation finite-element approach is developed to investigate the ball penetration resistance under varying drainage conditions, followed by estimating the effective internal friction angle of cohesive soil through the penetration resistance. The numerical approach is validated by comparing with the model tests in the chamber and in the centrifuge under both undrained and partially drained conditions. A comprehensive parametric study is conducted to explore the key factors, including the soil type, the ratio between the shaft and probe diameters, the penetration velocity, and the soil depth. From the large-deformation analyses and previous data from tests, the following conclusions can be drawn.
The net penetration resistance under partially drained conditions is normalized against that under undrained conditions, i.e., qbn/qbnun. It is found that the value of qbn/qbnun is a function of the normalized penetration velocity V. A unique backbone curve between qbn/qbnun and V is proposed, suitable for a wide range of drainage conditions of cohesive soil around the advancing spherical probe. According to a large quantity of parametric studies, the backbone curve is nearly independent of the ratio between the shaft and probe diameters and the soil types. By expanding the backbone curve, a novel empirical equation denoted as Equation (12) is suggested to estimate the effective internal friction angle.

Author Contributions

Conceptualization, D.W., B.Z. and W.Z.; methodology, B.Z. and W.Z.; validation, B.Z. and W.Z.; formal analysis, B.Z., W.Z. and D.F.; data curation, W.Z.; writing—original draft preparation, B.Z.; writing—review and editing, W.Z., D.W. and D.F. All authors have read and agreed to the published version of the manuscript.

Funding

This research was funded by the National Natural Science Foundation of China and the Young Experts of Taishan Scholars, grant numbers No. 42025702 and No. tsqn202211071.

Institutional Review Board Statement

Not applicable.

Informed Consent Statement

Not applicable.

Data Availability Statement

Data are contained within the article.

Conflicts of Interest

Author Bohan Zhou was employed by the company Powerchina Huadong Engineering Co., Ltd., Hangzhou. The remaining authors declare that the research was conducted in the absence of any commercial or financial relationships that could be construed as a potential conflict of interest.

References

  1. DeJong, J.T.; Yafrate, N.J.; Degroot, D.J. Evaluation of Undrained Shear Strength Using Full-Flow Penetrometers. J. Geotech. Geoenviron. Eng. 2011, 137, 14–26. [Google Scholar] [CrossRef]
  2. Lunne, T.; Andersen, K.H.; Low, H.E.; Randolph, M.F.; Sjursen, M. Guidelines for offshore in situ testing and interpretation in deepwater soft clays. Can. Geotech. J. 2011, 48, 543–556. [Google Scholar] [CrossRef]
  3. Zhang, W.; Liu, K.; Wang, D.; Zheng, J. Coefficient of consolidation measured by cone penetration tests in overconsolidated cohesive soils. Ocean Eng. 2023, 276, 114301. [Google Scholar] [CrossRef]
  4. Peuchen, J.; Adrichem, J.; Hefer, P.A. Practice notes on push-in penetrometers for offshore geotechnical investigation. In Proceedings of the 1st International Symposium on Frontiers in Offshore Geotechnics, London, UK, 19–21 September 2005. [Google Scholar]
  5. Nguyen, T.D.; Chung, S.G. Ball penetration test for characterisation of soft clays. Proc. Inst. Civil Eng.-Geotech. Eng. 2018, 171, 133–146. [Google Scholar] [CrossRef]
  6. Mayne, P.W.; Campanella, R.G. Versatile site characterization by seismic cone. In Proceedings of the 16th International Conference on Soil Mechanics and Geotechnical Engineering, Osaka, Japan, 12–16 September 2005. [Google Scholar]
  7. Ouyang, Z.; Mayne, P.W. Variable rate piezocone data evaluated using NTH limit plasticity solution. Geotech. Test. J. 2021, 44, 174–190. [Google Scholar] [CrossRef]
  8. Lim, Y.X.; Tan, S.A.; Phoon, K. Friction angle and overconsolidation ratio of soft clays from cone penetration test. Eng. Geol. 2020, 274, 105730. [Google Scholar] [CrossRef]
  9. Zhang, W.; Wang, D.; Zheng, J.; Fu, D. A new method to predict the effective internal friction angle of cohesive soil through cone penetration test. Eng. Geol. 2024; under review. [Google Scholar]
  10. Lehane, B.M.; O’Loughlin, C.D.; Gaudin, C.; Randolph, M.F. Rate effects on penetrometer resistance in kaolin. Géotechnique 2009, 59, 41–52. [Google Scholar] [CrossRef]
  11. Chow, S.H.; O’Loughlin, C.D.; Zhou, Z.; White, D.J.; Randolph, M.F. Penetrometer testing in a calcareous silt to explore changes in soil strength. Géotechnique 2020, 70, 1160–1173. [Google Scholar] [CrossRef]
  12. Mo, P.; Gao, X.; Yang, W.; Yu, H. A cavity expansion-based solution for interpretation of CPTu data in soils under partially drained conditions. Int. J. Numer. Anal. Methods Geomech. 2020, 44, 1053–1076. [Google Scholar] [CrossRef]
  13. DeJong, J.T.; Randolph, M. Influence of Partial Consolidation during cone penetration on estimated soil behavior type and pore pressure dissipation measurements. J. Geotech. Geoenviron. Eng. 2012, 138, 777–788. [Google Scholar] [CrossRef]
  14. Dientmann, G.; Schnaid, F.; Maghous, S.; Dejong, J. Piezocone penetration rate effects in transient gold tailings. J. Geotech. Geoenviron. Eng. 2018, 144, 04017116. [Google Scholar] [CrossRef]
  15. Peuchen, J.; Terwindt, J. Critical appraisal of T-bar penetration tests. In Proceedings of the 5th International Conference on Geotechnical and Geophysical Site Characterization, Gold Coast, Queensland, Australia, 5–9 September 2016; pp. 351–356. [Google Scholar]
  16. Low, H.E.; Landon Maynard, M.; Randolph, M.F.; DeGroot, D.J. Geotechnical characterization and engineering properties of Burswood clay. Géotechnique. 2011, 61, 575–591. [Google Scholar] [CrossRef]
  17. Zhou, M.; Hossain, M.S.; Hu, Y.; Liu, H. Scale issues and interpretation of ball penetration in stratified deposits in centrifuge testing. J. Geotech. Geoenviron. Eng. 2016, 142, 04015103. [Google Scholar] [CrossRef]
  18. Chow, S.H.; O’Loughlin, C.D.; Goh, C.L.V.; Mcllduff, R.; White, D.J.; Chow, F.C. A comparative field study of free-fall cone and sphere penetrometers in soft sediment. Ocean Eng. 2023, 280, 114094. [Google Scholar] [CrossRef]
  19. Liyanapathirana, D. Evaluation of penetration resistance of a Ball penetrometer in strain softening clay. In Futures in Mechanics of Structures and Materials, 2nd ed.; Aravinthan, T., Karunasena, W., Wang, H., Eds.; Taylor and Francis Group: London, UK, 2009; pp. 255–260. [Google Scholar]
  20. Hu, Y.; Randolph, M.F. A practical numerical approach for large deformation problems in soil. Int. J. Numer. Anal. Methods Geomech. 1998, 22, 327–350. [Google Scholar] [CrossRef]
  21. Wang, D.; White, D.J.; Randolph, M.F. Large-deformation finite element analysis of pipe penetration and large-amplitude lateral displacement. Can. Geotech. J. 2010, 47, 842–856. [Google Scholar] [CrossRef]
  22. Wang, D.; Bienen, B. Numerical investigation of penetration of a large-diameter footing into normally consolidated kaolin clay with a consolidation phase. Géotechnique 2016, 66, 947–952. [Google Scholar] [CrossRef]
  23. Mahmoodzadeh, H.; Randolph, M.F. Penetrometer testing: Effect of partial consolidation on subsequent dissipation response. J. Geotech. Geoenviron. Eng. 2014, 140, 04014022. [Google Scholar] [CrossRef]
  24. Purwana, O.A. Centrifuge Model Study on Spudcan Extraction in Soft Clay. Ph.D. Thesis, National University of Singapore, Singapore, 2006. [Google Scholar]
  25. Stewart, D.P. Lateral Loading of Pile Bridge Abutments Due to Embankment Construction. Ph.D. Thesis, University of Western Australia, Perth, Australia, 1992. [Google Scholar]
  26. Low, H.E.; Randolph, M.F. Strength measurement for near-seabed surface soft soil using manually operated miniature full-flow penetrometer. J. Geotech. Geoenviron. Eng. 2010, 136, 1565–1573. [Google Scholar] [CrossRef]
  27. Purwana, O.A.; Leung, C.F.; Chow, Y.K.; Foo, K.S. Influence of base suction on extraction of jack-up spudcans. Géotechnique 2005, 55, 741–753. [Google Scholar] [CrossRef]
  28. Hossain, M.S.; Hu, Y.; Randolph, M.F.; White, D.J. Limiting cavity depth for spudcan foundations penetrating clay. Géotechnique 2005, 55, 679–690. [Google Scholar] [CrossRef]
  29. Zhang, Y.; Wang, D.; Cassidy, M.J.; Bienen, B. Effect of installation on the bearing capacity of a spudcan under combined loading in soft clay. J. Geotech. Geoenviron. Eng. 2014, 140, 04014029. [Google Scholar] [CrossRef]
  30. Satchithananthan, U.; Ullah, S.N.; Lee, F.H.; Gu, H. Axial sliding resistance of partially embedded offshore pipelines. Géotechnique 2021, 71, 893–910. [Google Scholar] [CrossRef]
  31. Gaudin, C.; O’loughlin, C.D.; Randolph, M.F.; Lowmass, A.C. Influence of the installation process on the performance of suction embedded plate anchors. Géotechnique. 2006, 56, 381–391. [Google Scholar] [CrossRef]
  32. Hossain, M.S.; Kim, Y.; Gaudin, C. Experimental investigation of installation and pullout of dynamically penetrating anchors in clay and silt. J. Geotech. Geoenviron. 2014, 140, 04014026. [Google Scholar] [CrossRef]
  33. Wroth, C.P. The interpretation of in situ soil tests. Geotechnique 1984, 34, 449–489. [Google Scholar] [CrossRef]
  34. Bryant, W.R.; Hottman, W.; Trabant, P. Permeability of unconsolidated and consolidated marine sediments, Gulf of Mexico. Mar. Georesources Geotechnol. 1975, 1, 1–14. [Google Scholar] [CrossRef]
  35. Lekha, K.R.; Krishnaswamy, N.R.; Basak, P. Consolidation of clays for variable permeability and compressibility. J. Geotech. Geoenviron. Eng. 2003, 129, 1001–1009. [Google Scholar] [CrossRef]
  36. Zhou, H.; Randolph, M.F. Numerical investigations into cycling of full-flow penetrometers in soft clay. Géotechnique 2009, 59, 801–812. [Google Scholar] [CrossRef]
  37. Suzuki, Y. Investigation and interpretation of cone penetration rate effects. Ph.D. Thesis, University of Western Australia, Crawley, Australia, 2015. [Google Scholar]
  38. Martinez, M.G.; Tonni, L.; Gottardi, G.; Rocchi, I. Analysis of CPTU data for the geotechnical characterization of intermediate sediments. In Cone Penetration Testing: Proceedings of the 4th International Symposium on Cone Penetration Testing; CRC Press: Boca Raton, FL, USA, 2018; pp. 281–287. [Google Scholar]
  39. Chung, S.F.; Randolph, M.F.; Schneider, J.A. Effect of penetration rate on penetrometer resistance in clay. J. Geotech. Geoenviron. Eng. 2006, 132, 1188–1196. [Google Scholar] [CrossRef]
  40. Colreavy, C.; O’Loughlin, C.D.; Randolph, M.F. Estimating consolidation parameters from field piezoball tests. Géotechnique 2016, 66, 333–343. [Google Scholar] [CrossRef]
Figure 1. Soil mesh.
Jmse 12 00230 g001
Figure 2. Process of the methodology.
Jmse 12 00230 g002
Figure 3. Comparison with chamber test by Low and Randolph (2010) [26].
Jmse 12 00230 g003
Figure 4. Comparison with centrifuge tests by Mahmoodzadeh and Randolph (2014) [23].
Jmse 12 00230 g004
Figure 5. Effect of drainage conditions on net ball resistance.
Jmse 12 00230 g005
Figure 6. The normalized curves of ball resistance and penetration velocity [23,37]: (a) The curves of qbn against V for various soil types; (b) Backbone curve of qbn/qbnun.
Jmse 12 00230 g006
Figure 7. Effect of penetrometer geometry for Malaysian kaolin.
Jmse 12 00230 g007
Figure 8. Comparison of estimated and measured φ′ values under different drainage conditions [37]: (a) Malaysian kaolin; (b) Bassendean clay; (c) Burswood clay.
Jmse 12 00230 g008aJmse 12 00230 g008b
Table 1. Properties of soils used in large-deformation simulations.
PropertyUWA
Kaolin
Malaysian
Kaolin
Burswood
Clay
Angle of internal friction, φ : degree232331.5
Void ratio at p′ = 1 kPa on virgin consolidated line, e N 2.252.352.25
Slope of normal consolidation line, λ 0.2050.2440.330
Slope of swelling line, κ 0.0440.0530.036
Poisson’s ratio, ν 0.30.30.3
Submerged unit weight, γ : kN/m3665.2
Table 2. Numerical analyses of balls.
GroupSoilz/Dbds/Dbv: mm/sV = vDb/cv
1Malaysian kaolin10.671/310115.3
557.6
334.6
223.1
111.5
0.55.8
0.22.4
0.11.2
2Malaysian kaolin10.671/410115.3
557.6
334.6
223.1
111.5
0.55.8
0.22.4
0.11.2
3Malaysian kaolin10.672/510115.3
557.6
334.6
223.1
111.5
0.55.8
0.22.4
0.11.2
4 Burswood clay10.671/31300
0.5150
0.260
0.130
0.0515
0.026
0.013
0.0010.3
Note: the diameter of the probe is 15 mm in all groups.
Disclaimer/Publisher’s Note: The statements, opinions and data contained in all publications are solely those of the individual author(s) and contributor(s) and not of MDPI and/or the editor(s). MDPI and/or the editor(s) disclaim responsibility for any injury to people or property resulting from any ideas, methods, instructions or products referred to in the content.

