Article

Investigation on the Influence of Different Coating Surfaces on the Adhesive Force of Hydrate Particles

1
School of Petroleum Engineering, China University of Petroleum (East China), Qingdao 266580, China
2
Key Laboratory of Unconventional Oil & Gas Development, Ministry of Education, Qingdao 266580, China
3
National Engineering Research Center for Oil & Gas Drilling and Completion Technology, Qingdao 266580, China
*
Author to whom correspondence should be addressed.
J. Mar. Sci. Eng. 2024, 12(2), 232; https://doi.org/10.3390/jmse12020232
Submission received: 14 January 2024 / Revised: 24 January 2024 / Accepted: 26 January 2024 / Published: 28 January 2024
(This article belongs to the Section Geological Oceanography)

Abstract

:
In the process of oil and gas extraction and transportation, the aggregation and deposition of hydrate particles within oil and gas pipelines is a primary cause of pipeline blockage, with adhesion being the fundamental cause of hydrate particle aggregation. With the development of crude oil and natural gas transportation technology, the application of pipeline internal coating technology is becoming increasingly widespread. It is essential to compare the physical properties and practicality of various coating materials and conduct preliminary screening. Adhesion experiments on coating materials suitable for the conditions of oil and gas pipeline transport have been conducted. The experimental results indicate that the PTFE/PPS composite coating has advantages in reducing the adhesive force of hydrate particles under low temperatures and different degrees of subcooling. As the degree of subcooling increases, the adhesive force between the hydrate particles and the PTFE/PPS composite coating substrate gradually increases from 8.36 mN·m−1 to 10.26 mN·m−1. With a 3 °C increase in subcooling, the adhesion force increases by 1.92 mN·m−1, which is about 68% lower on average compared to an uncoated substrate. Epoxy resin E-51 coatings and polyurea coatings also demonstrate certain anti-hydrate adhesion properties, but their performance is slightly inferior compared to the PTFE/PPS composite coating. These research results can provide an important reference for hydrate prevention technology in oil and gas transportation pipelines.

1. Introduction

The aggregation of hydrate particles is a significant factor leading to hydrate blockages within pipelines, with adhesion being the essential cause of particle aggregation. Within the pipeline, there is adhesion between hydrate particles themselves, as well as between the particles and the pipeline wall. Under certain conditions, the inner wall of the pipeline is not only the nucleation site where hydrates start to form but also acts as a subcooling point. The main factor for hydrate deposition is the adhesion between the hydrate particles and the inner wall. Therefore, exploring the adhesive forces between hydrate particles and the substrate surface is fundamental to hydrate prevention using coatings. Applying functional coatings to the inner wall surfaces of pipelines to reduce the interaction forces between hydrate particles and the inner wall surfaces is an innovative method for preventing hydrate blockages in oil and gas pipelines [1,2,3].
The fundamental cause of hydrate aggregation and deposition in pipeline blockages is attributable to the adhesive forces between hydrate particles as well as between hydrate particles and the pipeline wall. The surface energy of the pipeline wall material determines the adhesion between the hydrate particles and the pipeline wall. Consequently, the application of coatings to prevent hydrate deposition and blockages has gradually garnered attention in research. Aspenes et al. [4] investigated the adhesion between cyclopentane hydrates and solid surfaces, as well as the influence of water decomposition on the adhesive force of hydrates. The results indicate that the adhesion between hydrates and solid surfaces is contingent upon the surface material, with solids possessing low surface free energy exhibiting the minimal adhesive force. Adhesion is strongly dependent on the presence of water in the system; when water droplets adhere to a solid surface, the adhesive force between the hydrate and the solid surface is more than tenfold greater than that between hydrate particles. The presence of a water–oil saturated phase also leads to an increase in the adhesion between hydrate particles. The adhesion is highest when the solid surface is water-wetted, while the addition of oleic acid to the oil phase can significantly reduce the adhesive force. Smith et al. [2] utilized functionalized coatings to diminish the adhesion of hydrates to surfaces, examining the relationship between the cohesive strength of tetrahydrofuran hydrates and both hydrophobic surfaces coated with these coatings and bare substrates. The findings demonstrate that coatings can effectively reduce the cohesive strength of hydrates. The adhesion strength of tetrahydrofuran hydrates on the treated solid surfaces was reduced by more than fourfold in comparison to bare steel. Aman and colleagues [5,6] measured the adhesion force between cyclopentane hydrates and heterogeneous quartz and calcite substrates using a micromechanical force apparatus. The micromechanical adhesion data revealed that the hydrate adhesion forces for calcite and quartz minerals were 5–10 times greater than those for stainless steel. The influence of five different physicochemical modifications—oleamide, graphite, citrate ester, nonanediol, and Rain-X anti-moisture agent—on hydrate adhesion forces was investigated. Using a micromechanical force device under dry and water-wet surface conditions, the cohesive forces of hydrates were measured. The results indicated that crystal growth could provide a potent pathway for adhesion between hydrates and other crystal structures. Further testing showed that the citrate ester reduced hydrate cohesion by 50%, suggesting that as a mixed anti-agglomerant, it has moderate activity and can inhibit hydrate deposition and particle aggregation. Hossein and others [3] conducted macroscopic studies on the formation and adhesion strength of CyC5 hydrate deposits on bilayer polymer coatings with a range of wettability. The results indicated that iCVD coatings exhibit strong emulsion-repelling properties, and hydrophobic coatings can effectively reduce hydrate cohesive strength. DasA et al. [7] mitigated the adhesion of cyclopentane hydrates on solid surfaces by introducing a cyclopentane barrier film between the hydrate and the solid interface. The presence of this interfacial liquid film is contingent upon the relative spreading of cyclopentane on the solid surface in the presence of water. Concurrently, the influence of surface chemistry and surface structure on the spreading characteristics of such interfacial films and their impact on hydrate adhesion was examined. Sojoudi et al. [8] employed initiated chemical vapor deposition (iCVD) to develop a durable and mechanically robust bilayer coating of poly(divinylbenzene) (pDVB) and poly(perfluorodecylacrylate) (pPFDA), aimed at reducing the adhesive strength of ice/hydrates to underlying substrates, such as silicon and steel. The study demonstrated that the pDVB/pPFDA polymer coating exhibited excellent anti-icing, hydrophobic, and hydrate-phobic properties, making it a promising candidate for future industrial applications. Filarsky et al. [9] investigated the hydrate formation time in the presence of various silane-based coatings under both static and transient conditions. The findings indicated that an increase in the carbon chain length of the silanes promotes the formation of methane hydrates, as evidenced by the induction time, gas uptake, and gas consumption rates. Wang et al. [10] conducted a study on the adhesion of type II hydrate particles formed from CH4/C2H6 gas mixtures, considering the influence of varying salinity levels and the extent of corrosion on carbon steel surfaces. The experimental results indicated that the presence of NaCl solution could reduce the adhesion between hydrate particles. The addition of NaCl altered the contact angle between the liquid bridge and the hydrate particle surface, which could be a contributing factor to the reduced adhesive force of the hydrate particles. Guo R et al. [11] employed polytetrafluoroethylene (PTFE) as a material with low surface energy and constructed coating roughness with hydrophobic vapor-phase SiO2. By incorporating polyphenylene sulfide (PPS) as a composite material and using anhydrous ethanol as a co-solvent, a hydrate-repelling coating was fabricated via a dip-coating process. The study explored the adhesive force between hydrates and the coating, with the experimental results leading to a set of coating compositions with superior performance in hydrate mitigation. Jamil [12] and colleagues introduced a hydrophobic soot coating that reduced hydrate adhesion by forming a hydrocarbon blocking film between hydrates and the soot coating, which inhibited the formation of liquid bridges between the hydrate and the soot layer. Cyclopentane hydrates and tetrahydrofuran hydrates exhibited lower adhesion strengths and higher contact angles on the soot coating. Zhao et al. [13] discovered that the organic coatings on natural sedimentary nano-clays could shorten the induction time for hydrate formation. It was proposed that the abundant functional groups in the coated organics could act as a protective shell, ensuring their sustained promotion of hydrate formation. Ma et al. [14]. used large-scale molecular simulations to study hydrate adhesion on solid surfaces, to compare the fracture behavior of hydrate–solid surface systems with different structures, and also to reveal the source of the large differences in adhesion strengths between different water structures such as ice and hydrates. Jamil [15] and colleagues introduced a hydrophobic soot coating that reduced hydrate adhesion by forming a hydrocarbon blocking film between hydrates and the soot coating, which inhibited the formation of liquid bridges between the hydrate and the soot layer. Cyclopentane hydrates and tetrahydrofuran hydrates exhibited lower adhesion strengths and higher contact angles on the soot coating.
Hydrophobic coating methods involve modifying the inner wall surfaces of pipelines to create a hydrophobic surface coating. This modification reduces the liquid bridge area between the hydrate particles and the substrate surface, thereby decreasing the adhesion of hydrate particles to the pipeline inner walls [16]. As a result, hydrate particles have difficulty adhering stably or may not adhere at all to the inner pipeline walls, thus achieving the effect of mitigating hydrates in oil and gas pipelines [17].
Traditional hydrate prevention methods (chemical and physical) primarily manipulate kinetics and thermodynamics to control hydrate formation, focusing mainly on the hydrates themselves. Coating methods for hydrate mitigation, however, study not only the characteristics of hydrate particles but also involve examining the properties of pipeline inner walls in conjunction with hydrate prevention technologies. Investigating the adhesive properties of substrate surfaces requires a solid theoretical foundation. Among the plethora of adhesion theories, capillary bridge theory is considered a well-established theory explaining the adhesiveness of hydrate particles. This paper also utilizes this theory as a basis for studying the adhesion characteristics between hydrate particles and coatings.
The classical equations of capillary fluid bridge theory are as follows [4].
F R = 2 π γ sin α sin θ p + α + 2 π γ cos θ p 1 + H / 2 d
where F is the capillary force in N. α is the external contact angle in °. θ p is the surface wetting angle in °. d is the liquid bridge depth in m. H is the separation displacement in m. R is the hydrate particle radius in m. γ is the liquid surface tension in N/m. These variables are shown in Figure 1.
The presence of liquid bridges facilitates the adhesion of hydrate particles to the inner walls of pipelines, leading to the continued growth of hydrates on the pipe wall. Additionally, hydrate particles in the liquid phase may adhere to one another due to these liquid bridges, resulting in particle deposition on the pipe wall and ultimately causing pipeline blockage. From Equation (1), it is known that capillary forces are related to the liquid’s surface tension and the contact angle of the particles with water. By modifying the inner walls of the pipelines, the adhesive force between hydrate particles and the pipeline wall can be reduced or eliminated, allowing the particles to move with the fluid inside the pipeline without depositing and accumulating on the walls. Therefore, this paper applies to the investigation of materials for the prevention and control of hydrates in the coating of pipelines, and then, through the conduct of hydrate adhesion experiments, the coating adhesion, the coating contact angle, and the adhesion between the coating and the hydrate are assessed as the evaluation criteria for the preferred coating materials.

2. Experimental Setup and Methods

2.1. Experimental Materials and Instruments

The main experimental apparatus required for this experiment is shown in Table 1.
To facilitate the experimental measurement of hydrate microforces under high-pressure conditions, a high-pressure visualized microscopic force measurement apparatus, as illustrated in Figure 2, was constructed. This equipment, inspired by the design of atmospheric pressure hydrate microforce measurement experimental setups, comprises three main components: a micro-manipulation system, a microscopic information acquisition system, and a temperature control system. This micro-mechanical force measurement instrument offers advantages such as ease of operation, time efficiency, and low safety risks. It also permits the observation of hydrate particle nucleation, growth, microscopic morphology, and the process of particle adhesion, as well as the effects of chemical agents on hydrate interactions.
The temperature control system consists of a constant temperature bath, a circulation loop, and a cold stage for operations. The circulating medium is cooled by the constant temperature bath before being output, entering the cold stage’s jacketed cooling bath circulation loop and providing a stable low-temperature environment. The cold stage itself is a stainless-steel vessel, surrounded by a sealed cooling jacket, which is wrapped in insulating material and connected to the constant temperature bath to form the circulation loop. The exterior of the insulation layer is made of polytetrafluoroethylene (PTFE) material, which can alleviate water vapor condensation and suppress hydrate wall climbing, thus offering a controlled environment for hydrate formation, decomposition, and microscopic force testing.
The micro-manipulation system includes a three-dimensional (3D) motion manipulator and a microscopic manipulation arm. The 3D motion manipulator consists of a manual adjustment slide stage based on cross-roller guides. During experiments, the manipulation arm is mounted on the slide stage, allowing for precise control of the mechanical arm’s displacement through manual adjustments. Two mechanical arms are required for the experiments: a fixed arm and a moving arm. Both arms are controlled in their displacement by the moving slide stage. Glass fibers are installed at the end of the mechanical arms to serve as the carriers for hydrate particles. The selection of the glass fiber diameter must consider the elastic force values involved in the experiments and the corresponding bending displacement values of the glass fibers.

2.2. Preparation and Testing of Coatings

Compared to traditional energy sources, natural gas offers a multitude of advantages and is increasingly utilized in industrial production and domestic applications. Overland long-distance transportation of natural gas is predominantly conducted via steel pipelines. When the transported natural gas contains acidic gases, water vapor, and other impurities, it can induce corrosive reactions on the inner walls of steel pipelines, leading to a reduction in local wall thickness and, consequently, posing safety risks. Internal coatings can effectively mitigate the occurrence of corrosion within pipelines, while also enhancing the efficiency of natural gas transportation. Materials for natural gas pipeline internal coatings are categorized into organic and inorganic types. Organic materials boast more mature technological development, cost effectiveness, and broader applications. Conversely, inorganic materials represent an emerging technology that has been the focus of research and development in recent years. Organic materials include liquid epoxy coatings, powder epoxy coatings, phenolic epoxy resin E-51, and coal tar epoxy resin E-51. Inorganic materials comprise corrosion-resistant metal coatings, ceramic-type coatings, diamond-like carbon films, and fiberglass-reinforced plastic [18,19,20].
The internal coating of a deep-water oil and gas transportation pipeline should have the following characteristics:
(1)
Good corrosion resistance.
(2)
Strong pressure resistance.
(3)
Easy to paint.
(4)
Chemically stable.
(5)
Strong adhesion and bending resistance.
(6)
Abrasion resistance.
(7)
Heat resistance.
(8)
Smooth coating surface.
As an innovative hydrate inhibition method, hydrate-phobic coating involves applying a water-repellent coating layer on the inner walls of transportation pipelines to prevent hydrates from adhering to and accumulating on the walls, which can lead to blockages. The research on hydrate-phobic coating is still relatively limited, with most studies focusing on the adhesive forces between hydrate particles and between hydrate particles and different surfaces. The adhesion of hydrate particles to a solid surface primarily depends on the characteristics of that surface and the liquid-phase environment in which the particles are situated. Under identical testing conditions, the lower the surface energy of the solid, the weaker the adhesive force between the particles and the surface. Therefore, the prepared coating should exhibit a low surface energy structure.
Based on the selection criteria derived from the coating characteristics mentioned above, preliminary choices such as epoxy coatings, PTFE/PPS composite coatings, polyurea coatings, and diamond-like carbon films are evaluated for their different physical properties and practical performance [4,8,21,22,23,24,25,26].
Considering the internal environment of deepwater oil and gas pipelines, and taking into account complex conditions such as temperature, pressure, and acidic or alkaline environments, it can be determined that PTFE/PPS composite coatings, epoxy resin E-51 coatings, and polyurea coatings are materials that better meet the experimental conditions. Therefore, this study will analyze these three experimental materials, measure the adhesion force between hydrate particles and the coatings, and analyze the impact of different coatings on the adhesion mechanism of hydrate particles.
The preparation process for the coating materials is as follows:
(1)
Weigh the coating materials and add them to a beaker, incorporating leveling agents, dispersants, and defoaming agents. Stir thoroughly until all components are uniformly mixed, filter, and let the coating mature before use.
(2)
Mechanically clean the coating substrate by sanding, then remove any particles and rust resulting from the sanding process. Control the surface roughness of the substrate within a certain range; a certain degree of roughness is retained to aid in the adhesion of the coating to the substrate surface.
(3)
Wash with deionized water and dry in a high-temperature oven.
(4)
Apply the coating to the substrate uniformly in three separate spray applications.
(5)
After spraying, dry the coating in a high-temperature oven for 2 h.

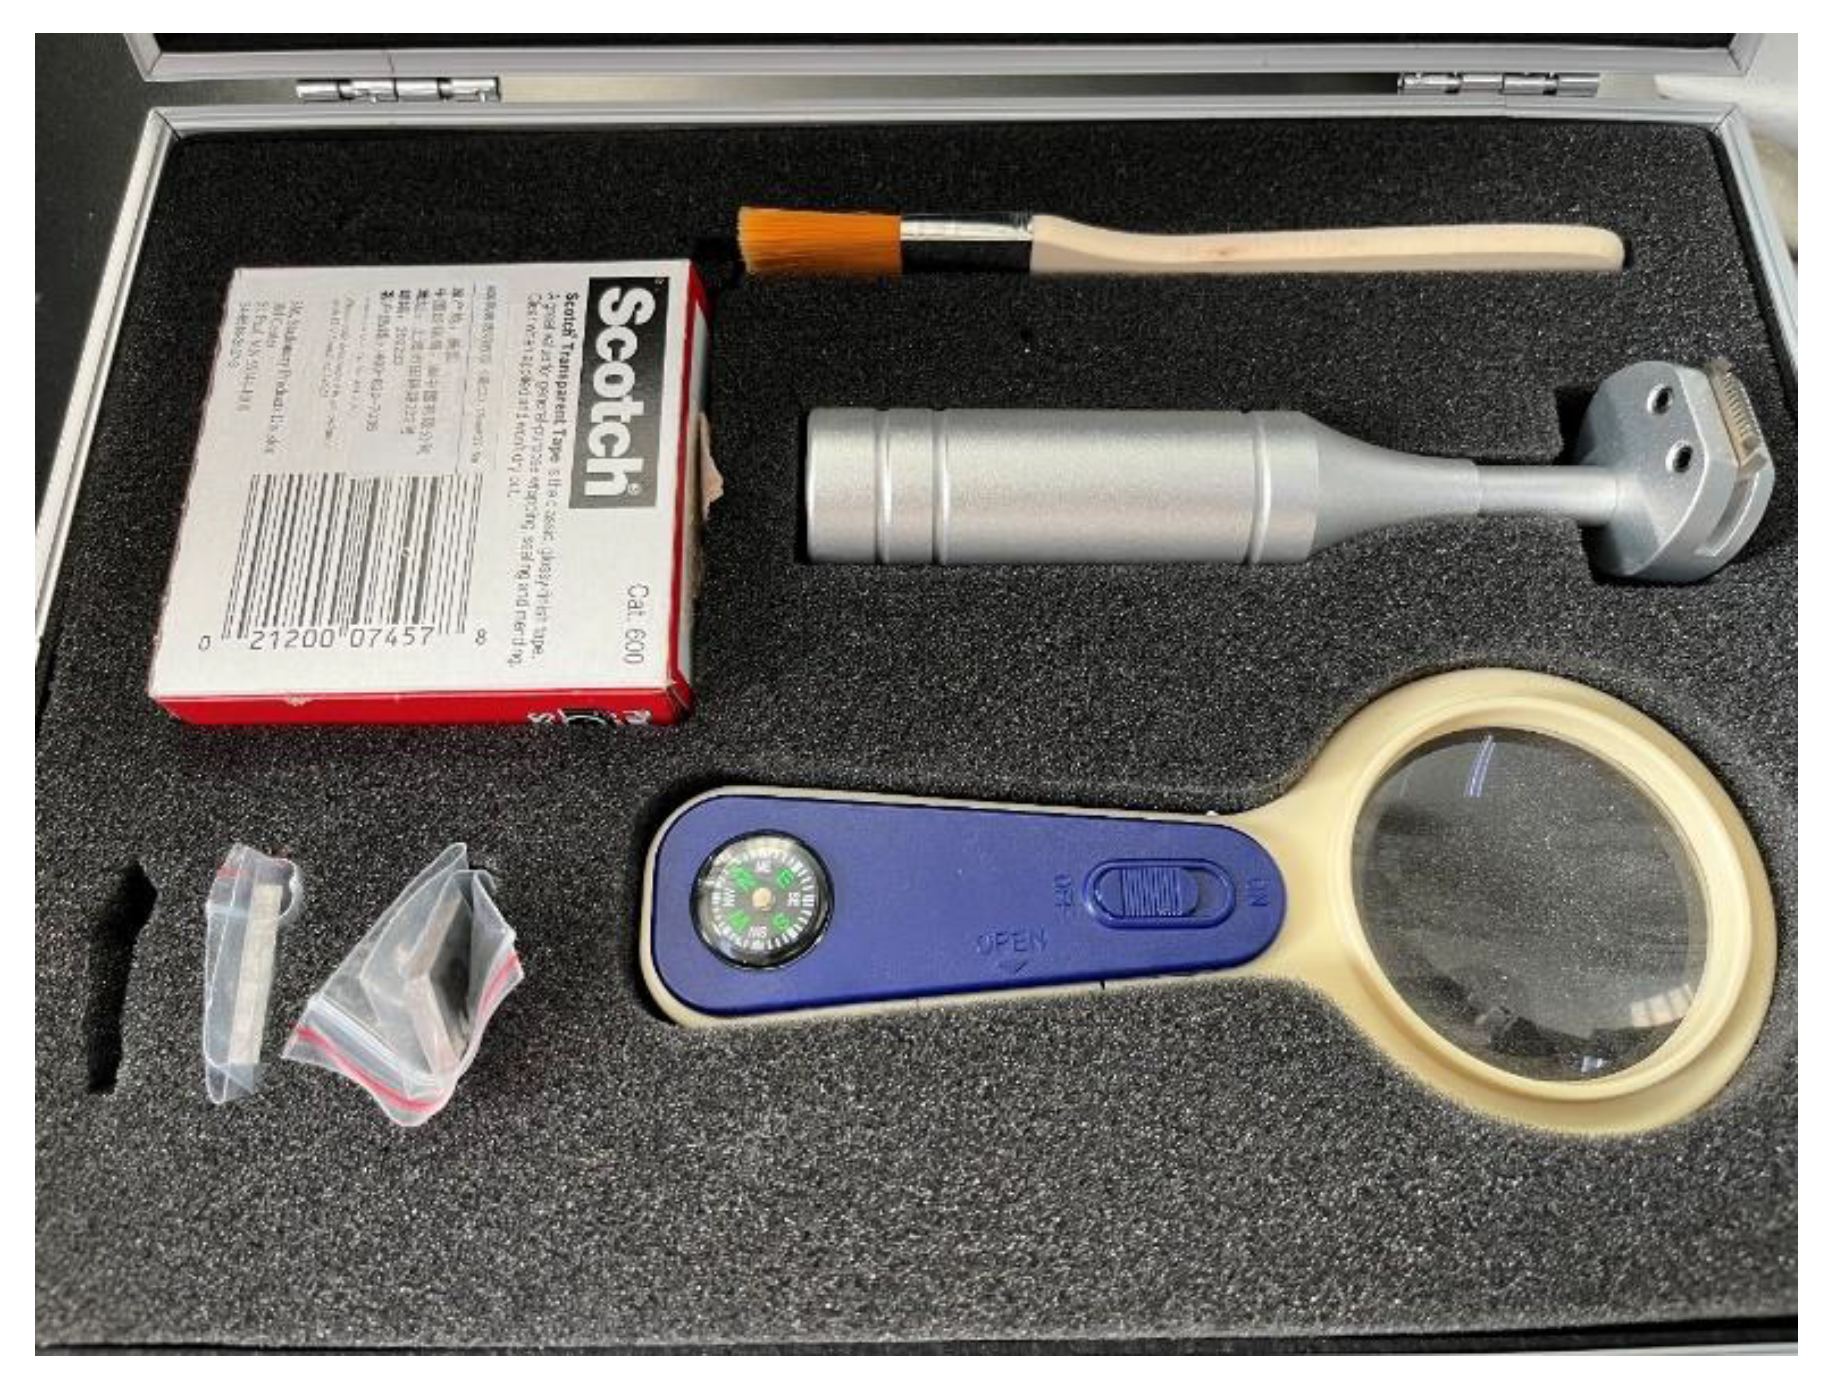
2.3. Coating Adhesion Test

The adhesion of a coating refers to the bonding strength between the coating and the substrate, that is, the ability of the coating to adhere to the surface. Adequate coating adhesion is a critical factor in ensuring that the coating can maintain its integrity, durability, and performance over the long term. Poor adhesion may result in the coating peeling, detaching, or blistering, subsequently diminishing the effectiveness and lifespan of the coating. The assessment of coating adhesion typically involves standard test methods, such as cross-cut tests, peel tests, and pull-off tests. These evaluations are instrumental in determining the adhesive strength and performance of the coating.
The crosshatch test, also known as the cross-cut test, is a method employed to evaluate the adhesion of a coating. Typically used in quality control of coatings and validation of coating processes, the crosshatch test serves to measure the adhesive strength between the coating and the substrate. By employing this method, one can determine whether the coating possesses sufficient adhesive force to prevent future delamination or detachment. In this experiment, the adhesion of the applied coatings is assessed using the crosshatch test method, with the evaluation criteria referencing ISO 2409-2007 [27] “Paints and Varnishes—Cross-cut test”.
The steps for conducting a crosshatch adhesion test are as follows:
(1)
Sample Preparation: The substrate with the coating to be tested must be dry, cured, and under appropriate conditions for testing. Typically, the coating should be fully dried to ensure the accuracy of the test results.
(2)
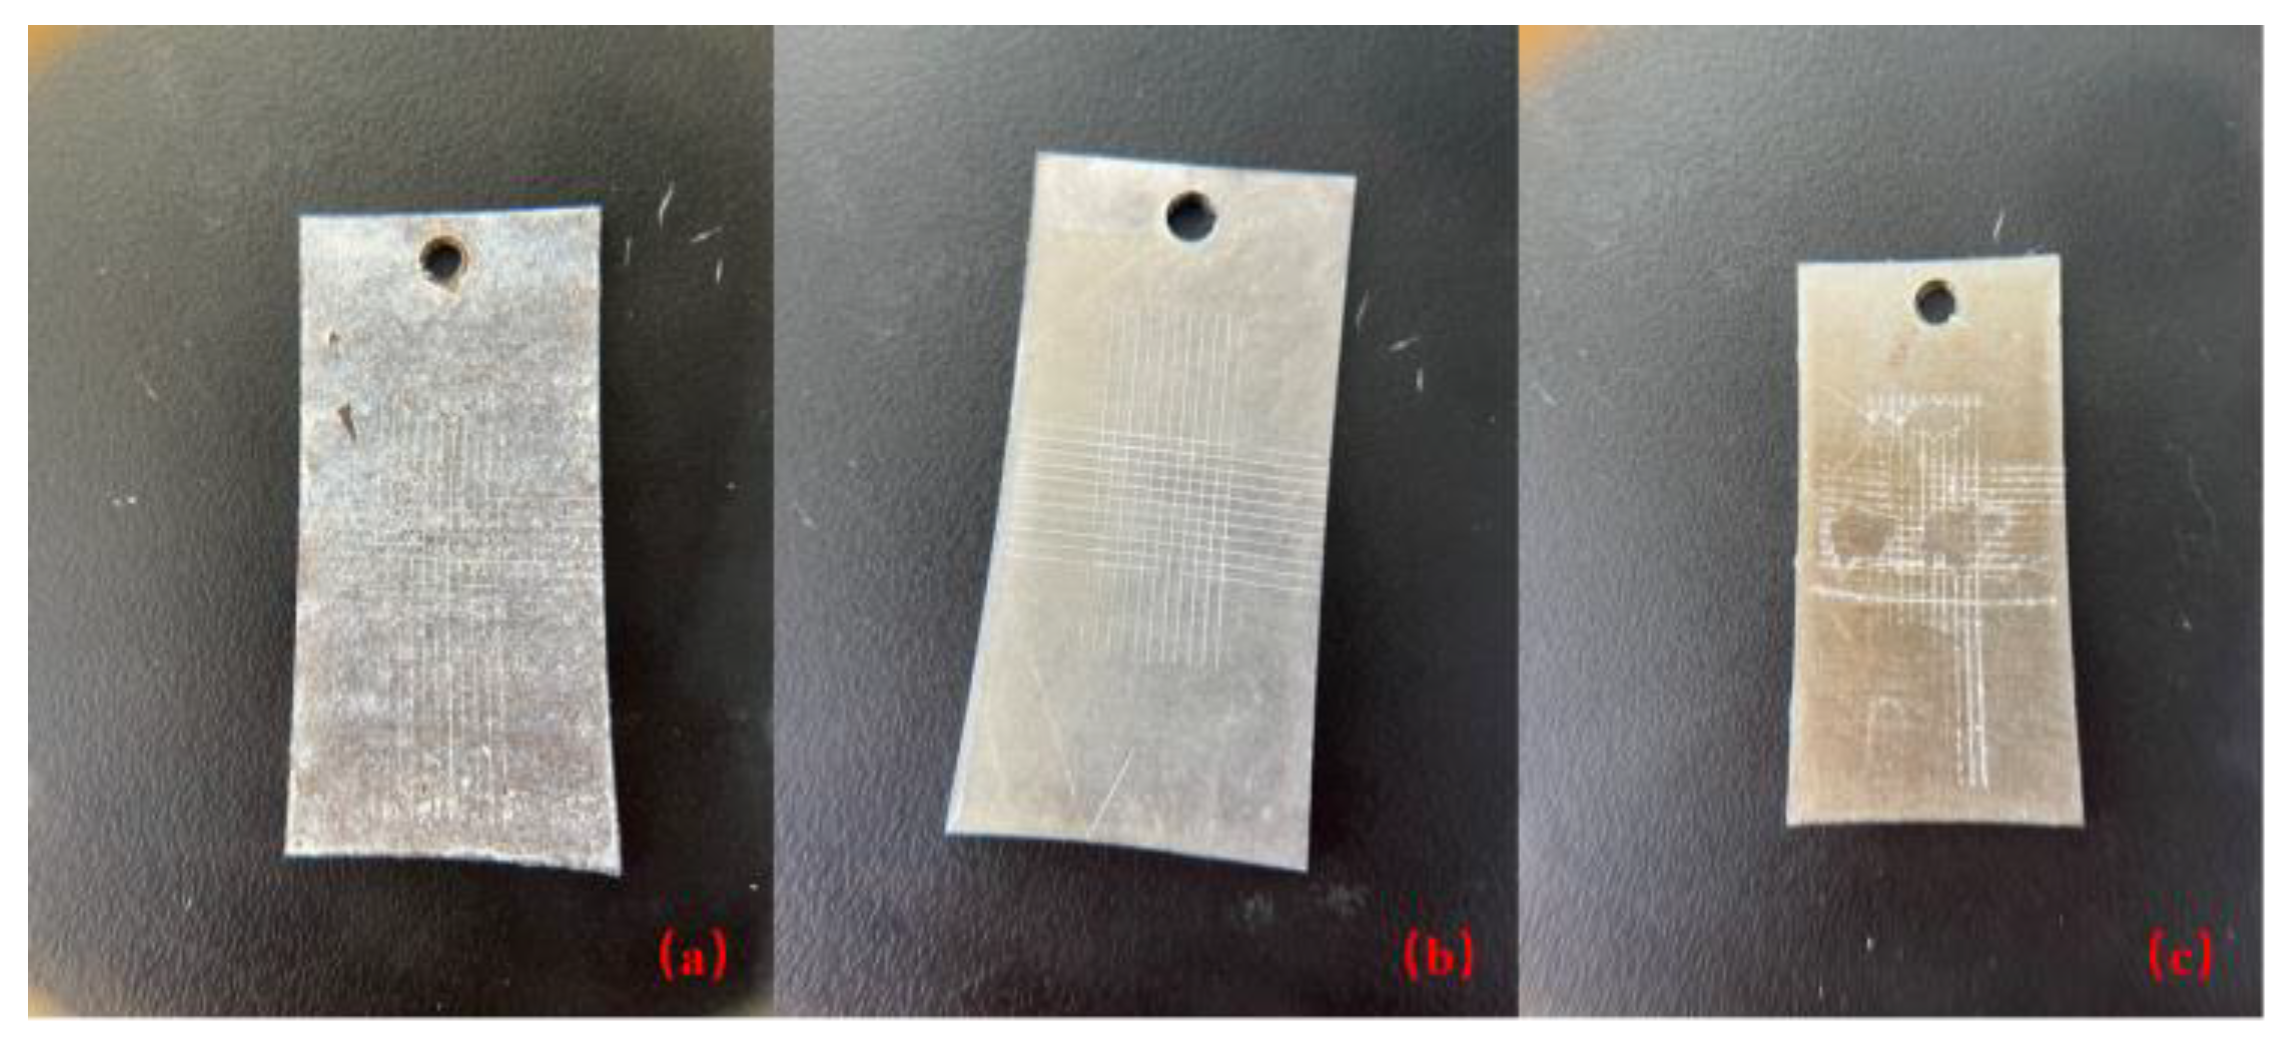
Scribing: Use a crosshatch cutter (Figure 3) or other appropriate tool to scribe a series of perpendicular lines onto the surface of the coating, creating a lattice or grid pattern. The spacing between lines is usually 1 to 2 mm in each direction.
(3)
Cleaning: Ensure that the substrate is thoroughly cleaned before and after scribing to remove any impurities that may affect the test outcome.
(4)
Applying Tape: Apply a piece of transparent adhesive tape over the scribed grid, making sure the tape makes tight contact with the coating surface and press down gently to ensure adhesion.
(5)
Tape Removal: Quickly and evenly remove the adhesive tape. This will cause parts of the coating to be detached along with the tape.
(6)
Evaluation: Examine the area from which the tape was removed to check the condition of the peeled coating. The quality of the coating adhesion is assessed by visual inspection or with a microscope, depending on the extent of the detachment and the condition of the flaked-off coating.

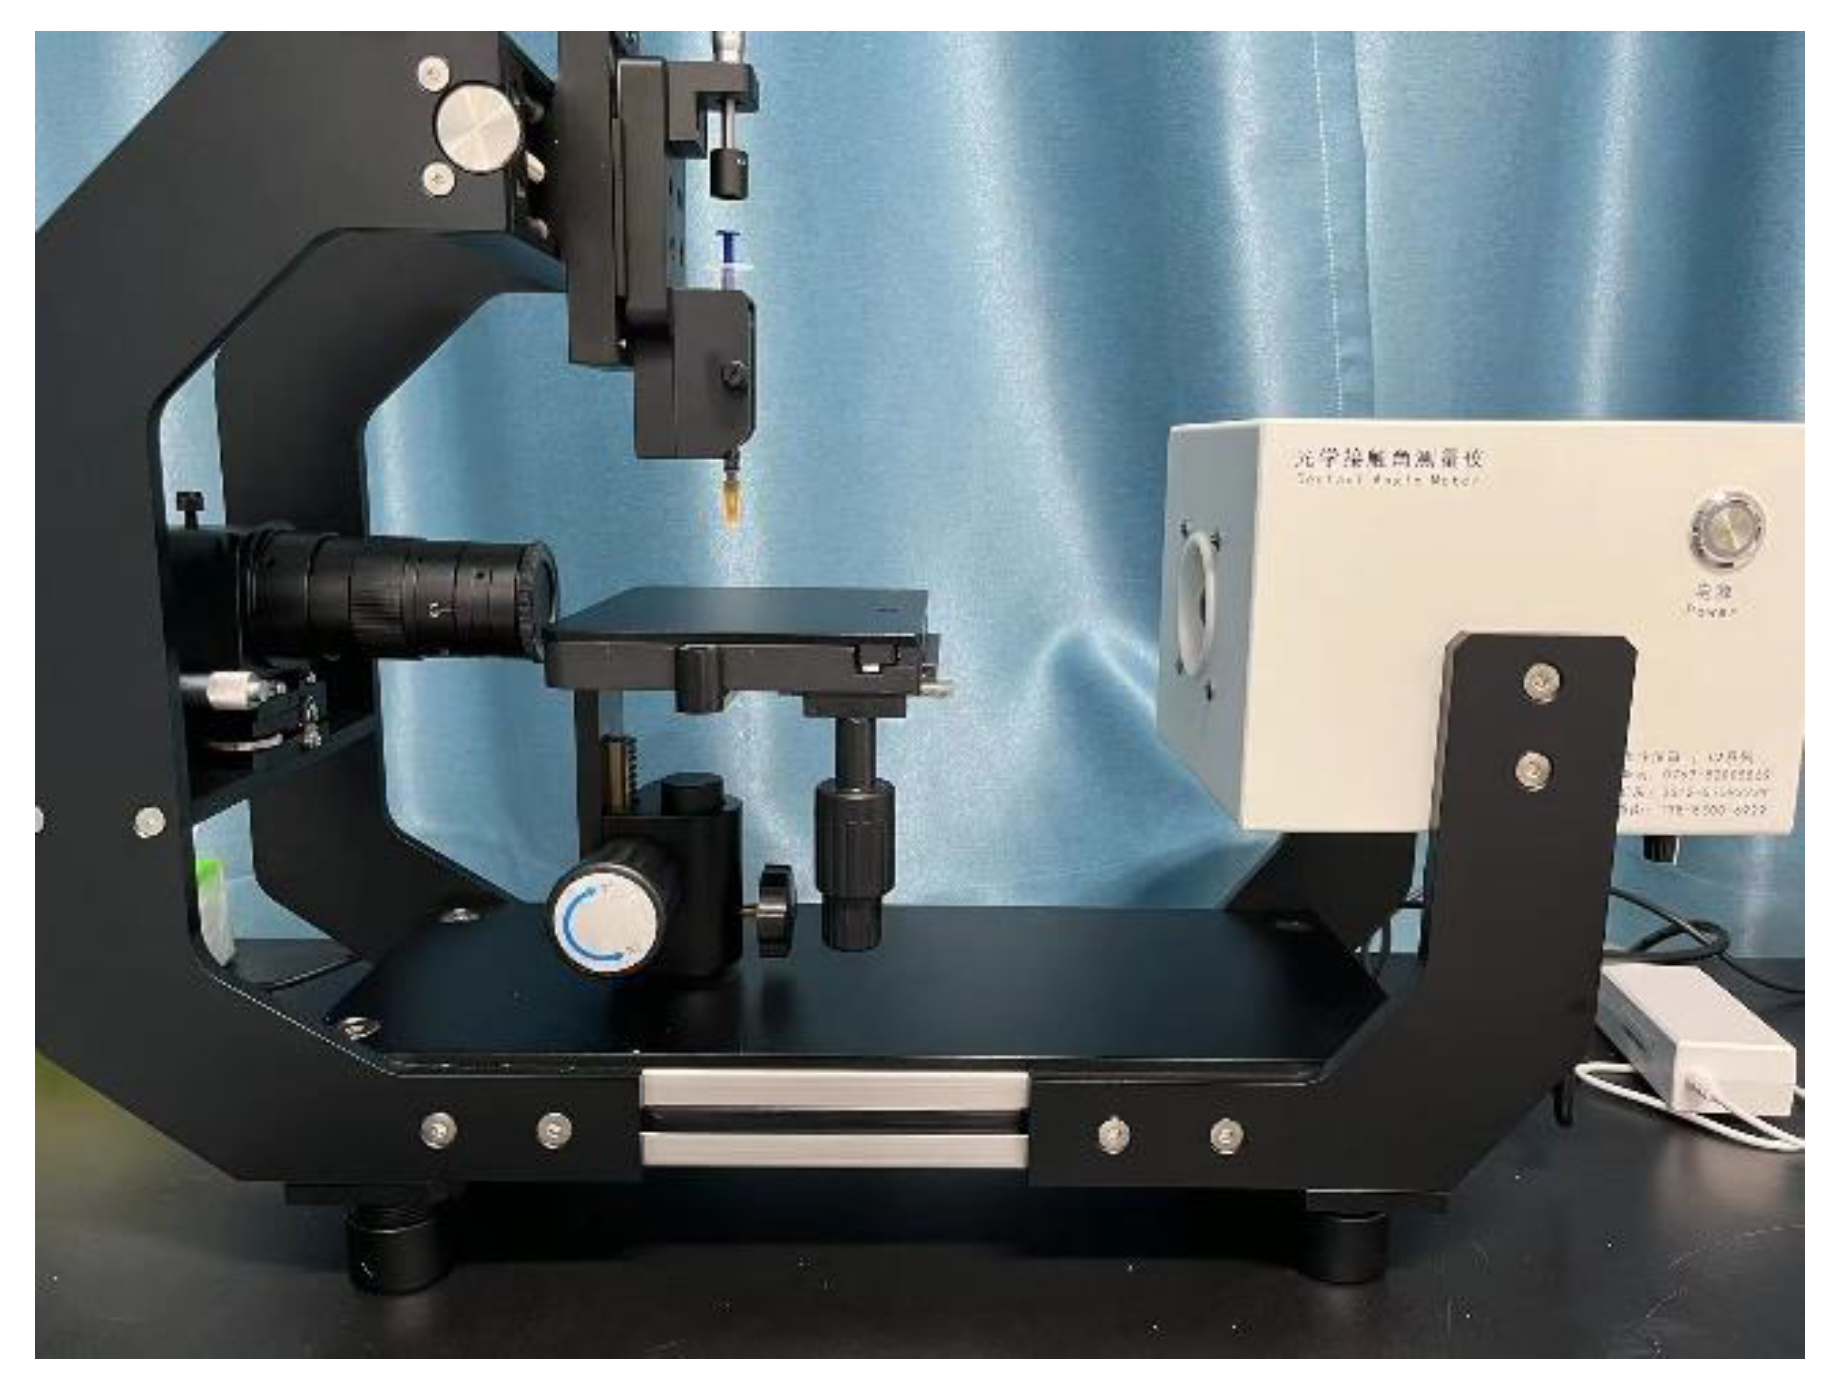
2.4. Coating Contact Angle Test

The contact angle test for coatings is a method used to assess the wettability and adhesion properties of a coating surface. The contact angle is the angle formed between a liquid droplet and the coating surface, providing information about the surface properties of the coating and the wetting capability of the liquid on that surface. Different types of coatings and surface characteristics can have varying effects on the liquid wettability.
The contact angle test can be conducted by measuring the angle between the droplet and the coating surface, with water often being the test liquid of choice. The typical procedure for this test generally includes the following steps:
(1)
Sample Preparation: Prepare the substrate coated with the coating to be tested, ensuring that the surface is clean, dry, and free from impurities such as dust or dirt.
(2)
Droplet Deposition: Deposit a liquid droplet onto the surface of the coating, making sure that the size and shape of the droplet are uniform and stable. A single droplet is commonly used for testing to ensure consistency.
(3)
Image Acquisition: Use an optical contact angle meter (Figure 4) to capture the image of the droplet on the coating surface. Ensure the image quality is high enough for accurate contact angle measurement.
(4)
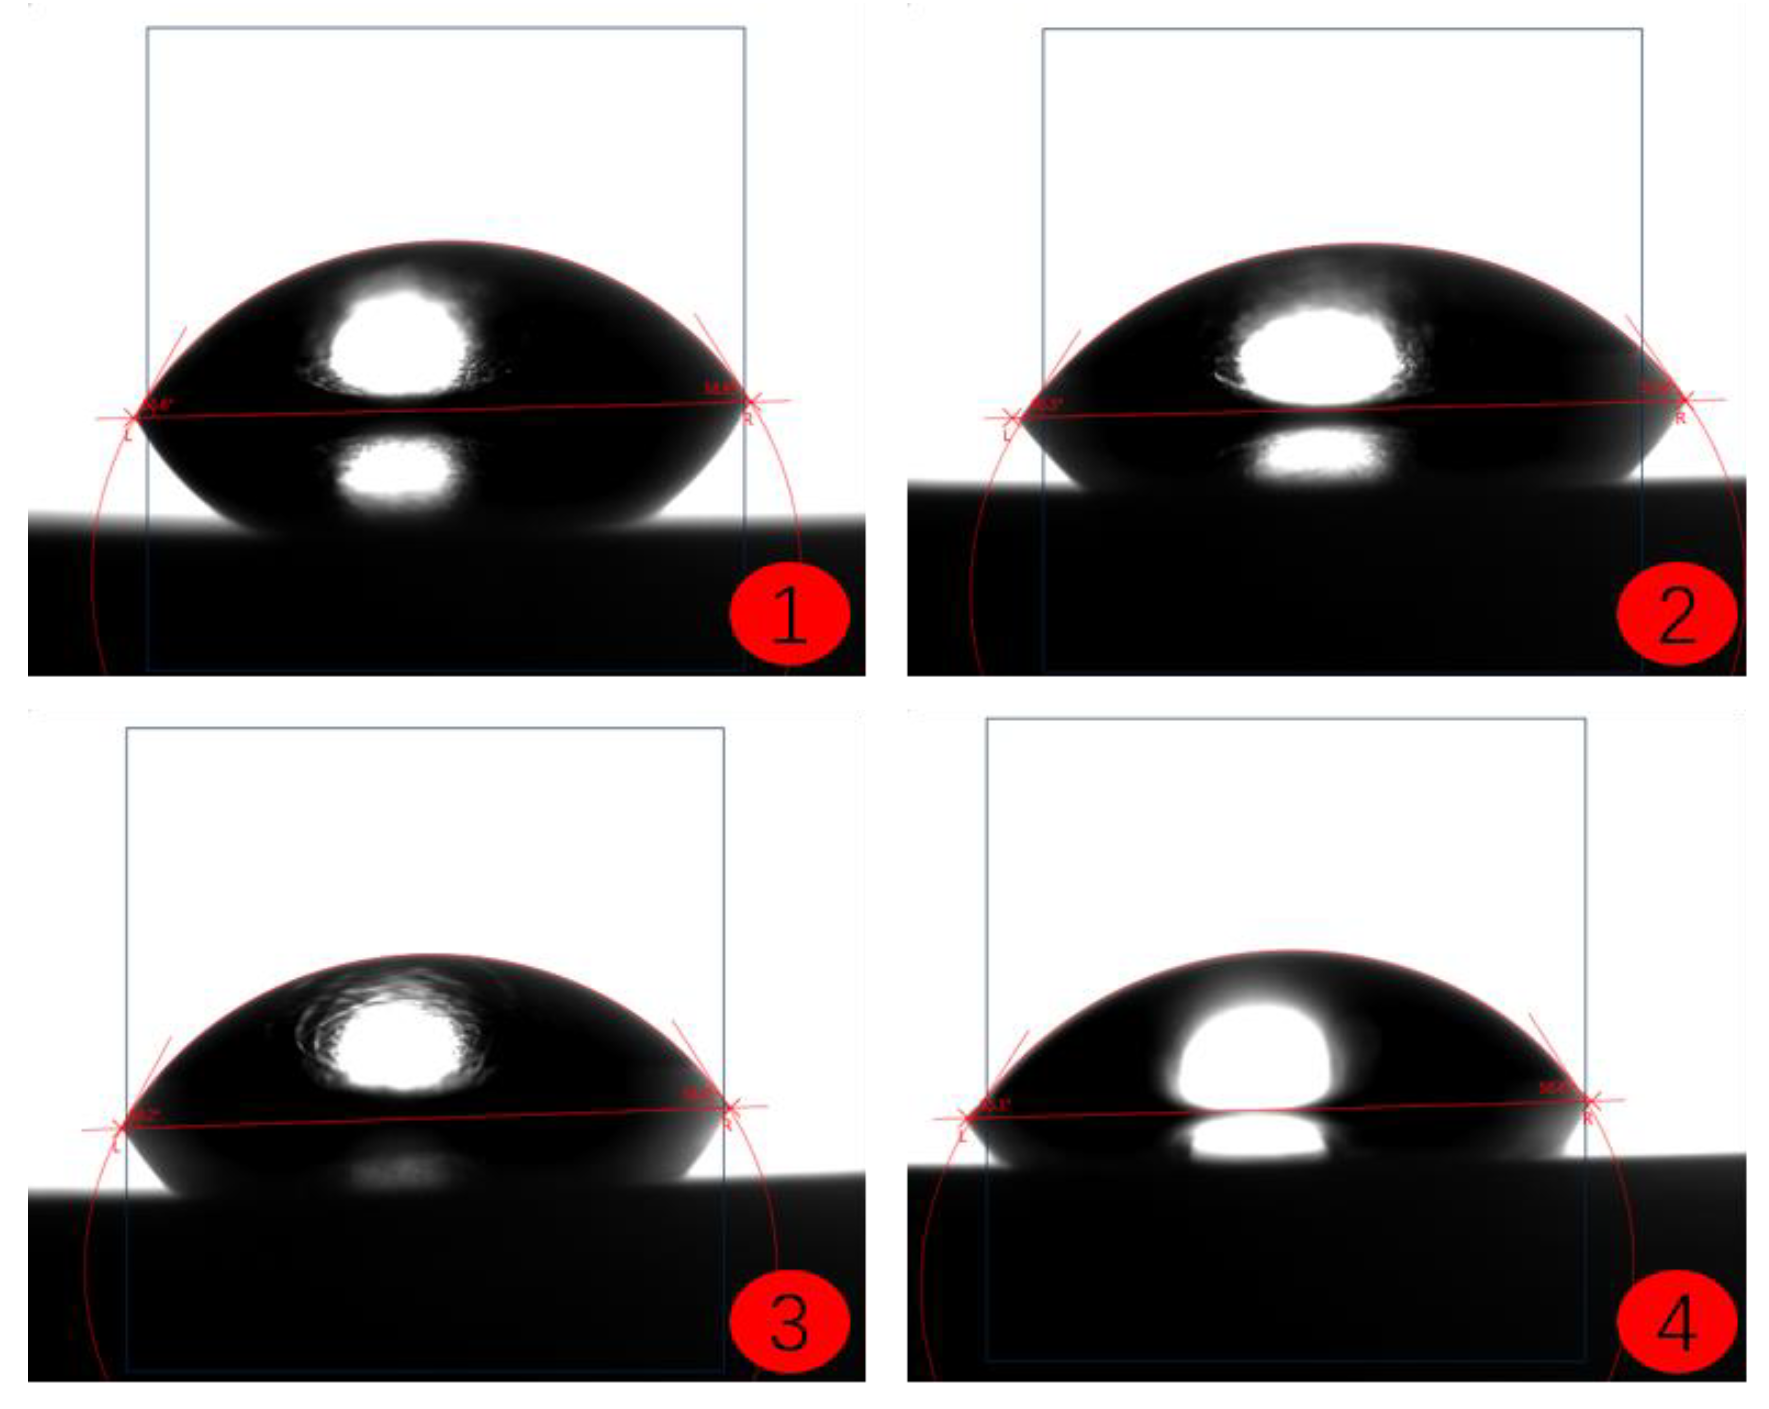
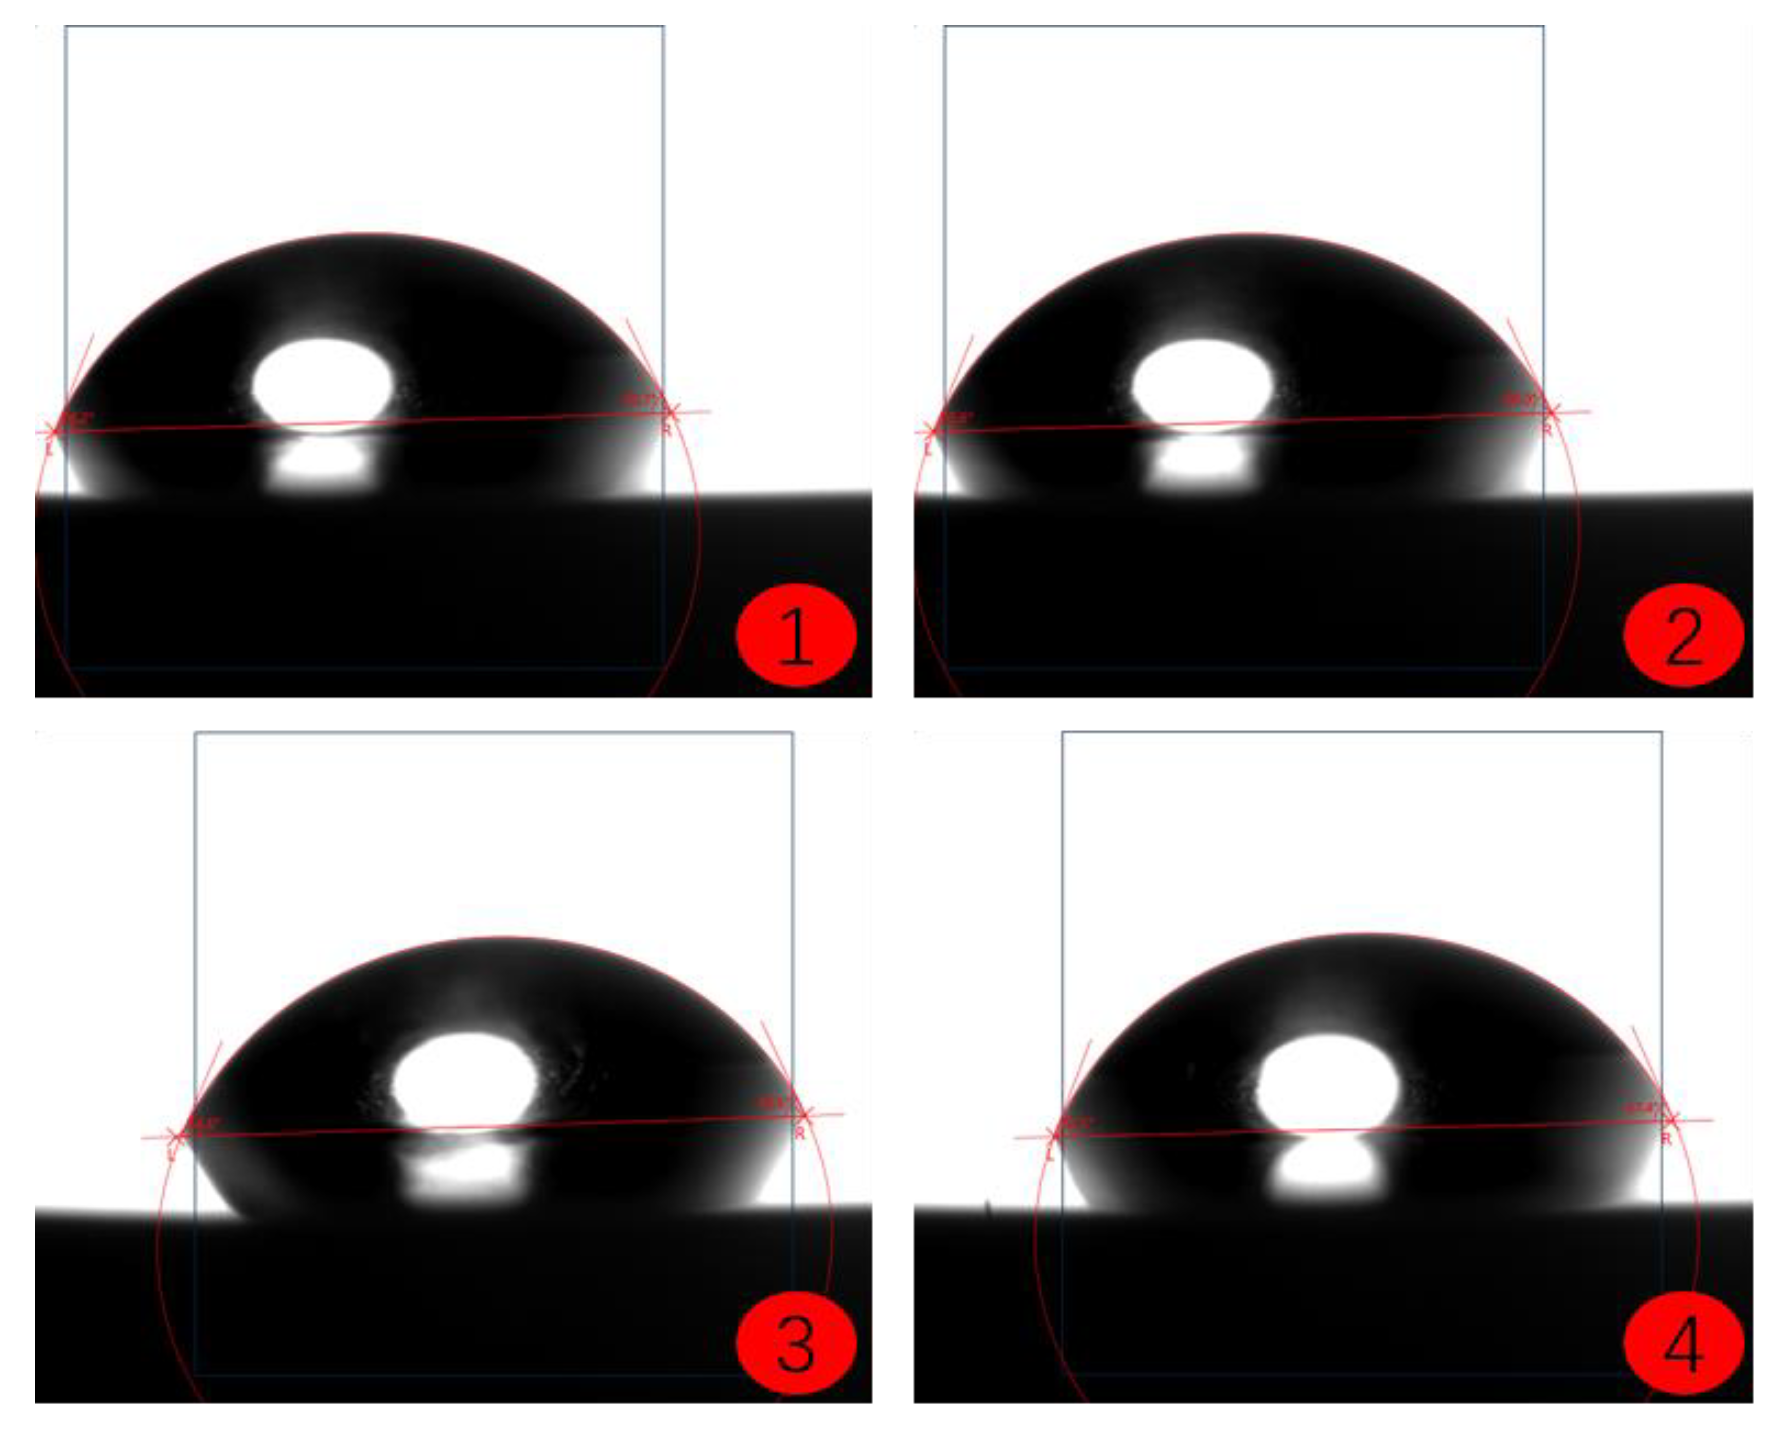
Contact Angle Measurement: Measure the contact angle on the captured image using image analysis software. The contact angle is the angle at which the liquid droplet edge meets the coating surface and is typically expressed in degrees (°).
(5)
Repeat Tests: To obtain more reliable results, perform multiple tests on the same coating sample and calculate the average contact angle.
Contact angles on different coating surfaces can reveal the wettability and adhesion characteristics of the coatings. Generally:
(1)
Contact angles less than 90 degrees are typically indicative of hydrophilic surfaces due to the liquid’s ability to spread across the surface.
(2)
Contact angles greater than 90 degrees are usually indicative of hydrophobic surfaces, as the liquid does not spread across the surface, but instead forms spherical beads.

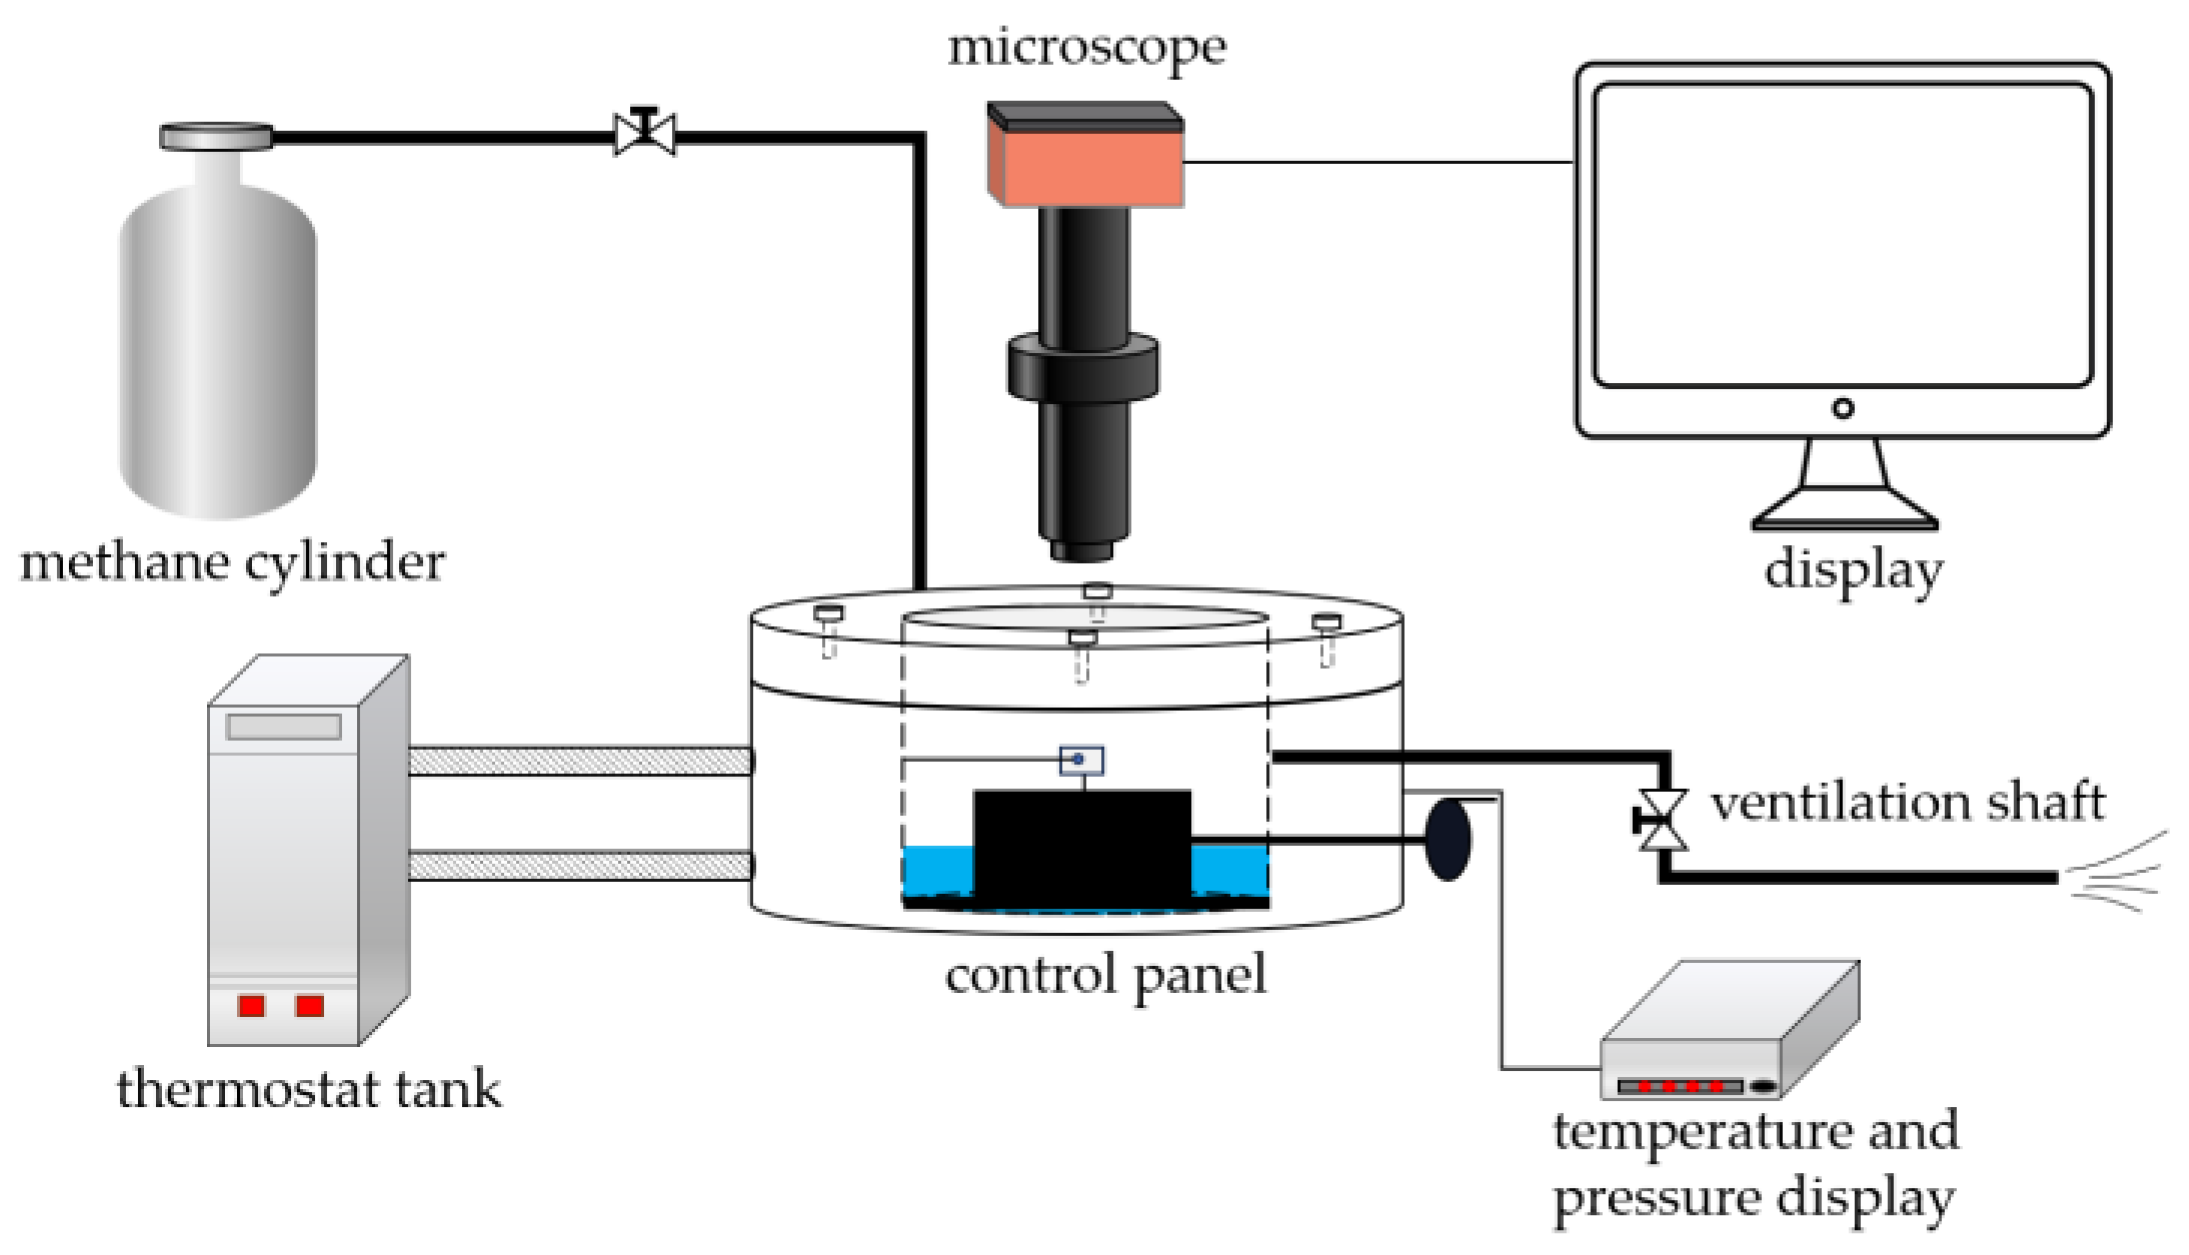
2.5. Testing of the Adhesion of Coatings to Hydrate Particles

To measure the elastic deformation of two glass fibers (Glass Fiber 1 and Glass Fiber 2), a certain load force was applied to one known coefficient of elasticity glass fiber (Glass Fiber 1) in a uniaxial testing machine. The specific test process is shown in Figure 5. First, Glass Fiber 1 was given a certain load force; then it was released from contact so that both Glass Fiber 1 and steel wire returned to the stress-free state due to elastic deformation. The bending displacements caused by elastic deformation at the ends of Glass Fiber 1 and Glass Fiber 2 were measured as δ 1 and δ 2 , respectively. Given that the forces on Glass Fiber 1 and Glass Fiber 2 during the deformation displacement process were of the same magnitude, relationship Equation (2) was derived as follows [28]:
k 1 δ 1 = k 2 δ 2
where δ 1 and δ 2 are, respectively, the stress-bending displacement of Glass Fiber 1 and Glass Fiber 2 in m. k 1 and k 2 are the elastic coefficients of Glass Fiber 1 and Glass Fiber 2, respectively.
As shown in Figure 5, according to Equation (2), the elastic modulus of the glass fiber used in this experiment can be determined to be k = 50.81.
According to Hooke’s Law, the adhesive force F between hydrate particles and the substrate coating is related to the displacement and the elastic modulus of the glass fiber. The adhesive force can be calculated using Equation (3).
F = k δ
where F is the particle adhesion in N/m. k is the coefficient of elasticity of the glass fiber. δ is the adhesion displacement in m.
The steps for testing the adhesive force of hydrate particles are as follows:
(1)
Start the thermostatic water bath to cool the solution to the specified temperature and maintain a constant temperature.
(2)
Fix the substrate coating (5 mm× 5 mm× 0.3 mm) on the fixed operating arm, ensuring that the coating attachment surface is perpendicular to the overhead microscope.
(3)
The experiment utilizes ice particles to induce the formation of hydrate particles. Firstly, place a spherical droplet on the tip of the cantilever glass fiber, freeze it in liquid nitrogen, expose it to air for 2 s, freeze it in liquid nitrogen for 2 s, and repeat this process several times until the surface of the ice particle becomes smooth.
(4)
Rapidly place the ice particle into the reaction vessel and tightly seal the lid.
(5)
Open the inlet valve and slowly increase the pressure to 0.5 MPa.
(6)
Open the outlet valve and slowly release the methane gas.
(7)
Close the outlet valve, open the inlet valve, and gradually increase the pressure to the experimental pressure during the gas introduction process, maintaining the temperature of the reaction vessel below the freezing point of the reagent.
(8)
After the gas introduction is completed, start heating, and gradually raise the temperature of the sealed chamber to the experimental temperature.
(9)
During the heating process, a thin layer of hydrate forms gradually on the surface of the ice particle. The ice particle gradually transforms into hydrate from the outside to the inside, and the hydrate layer thickens while the particle transparency decreases.
(10)
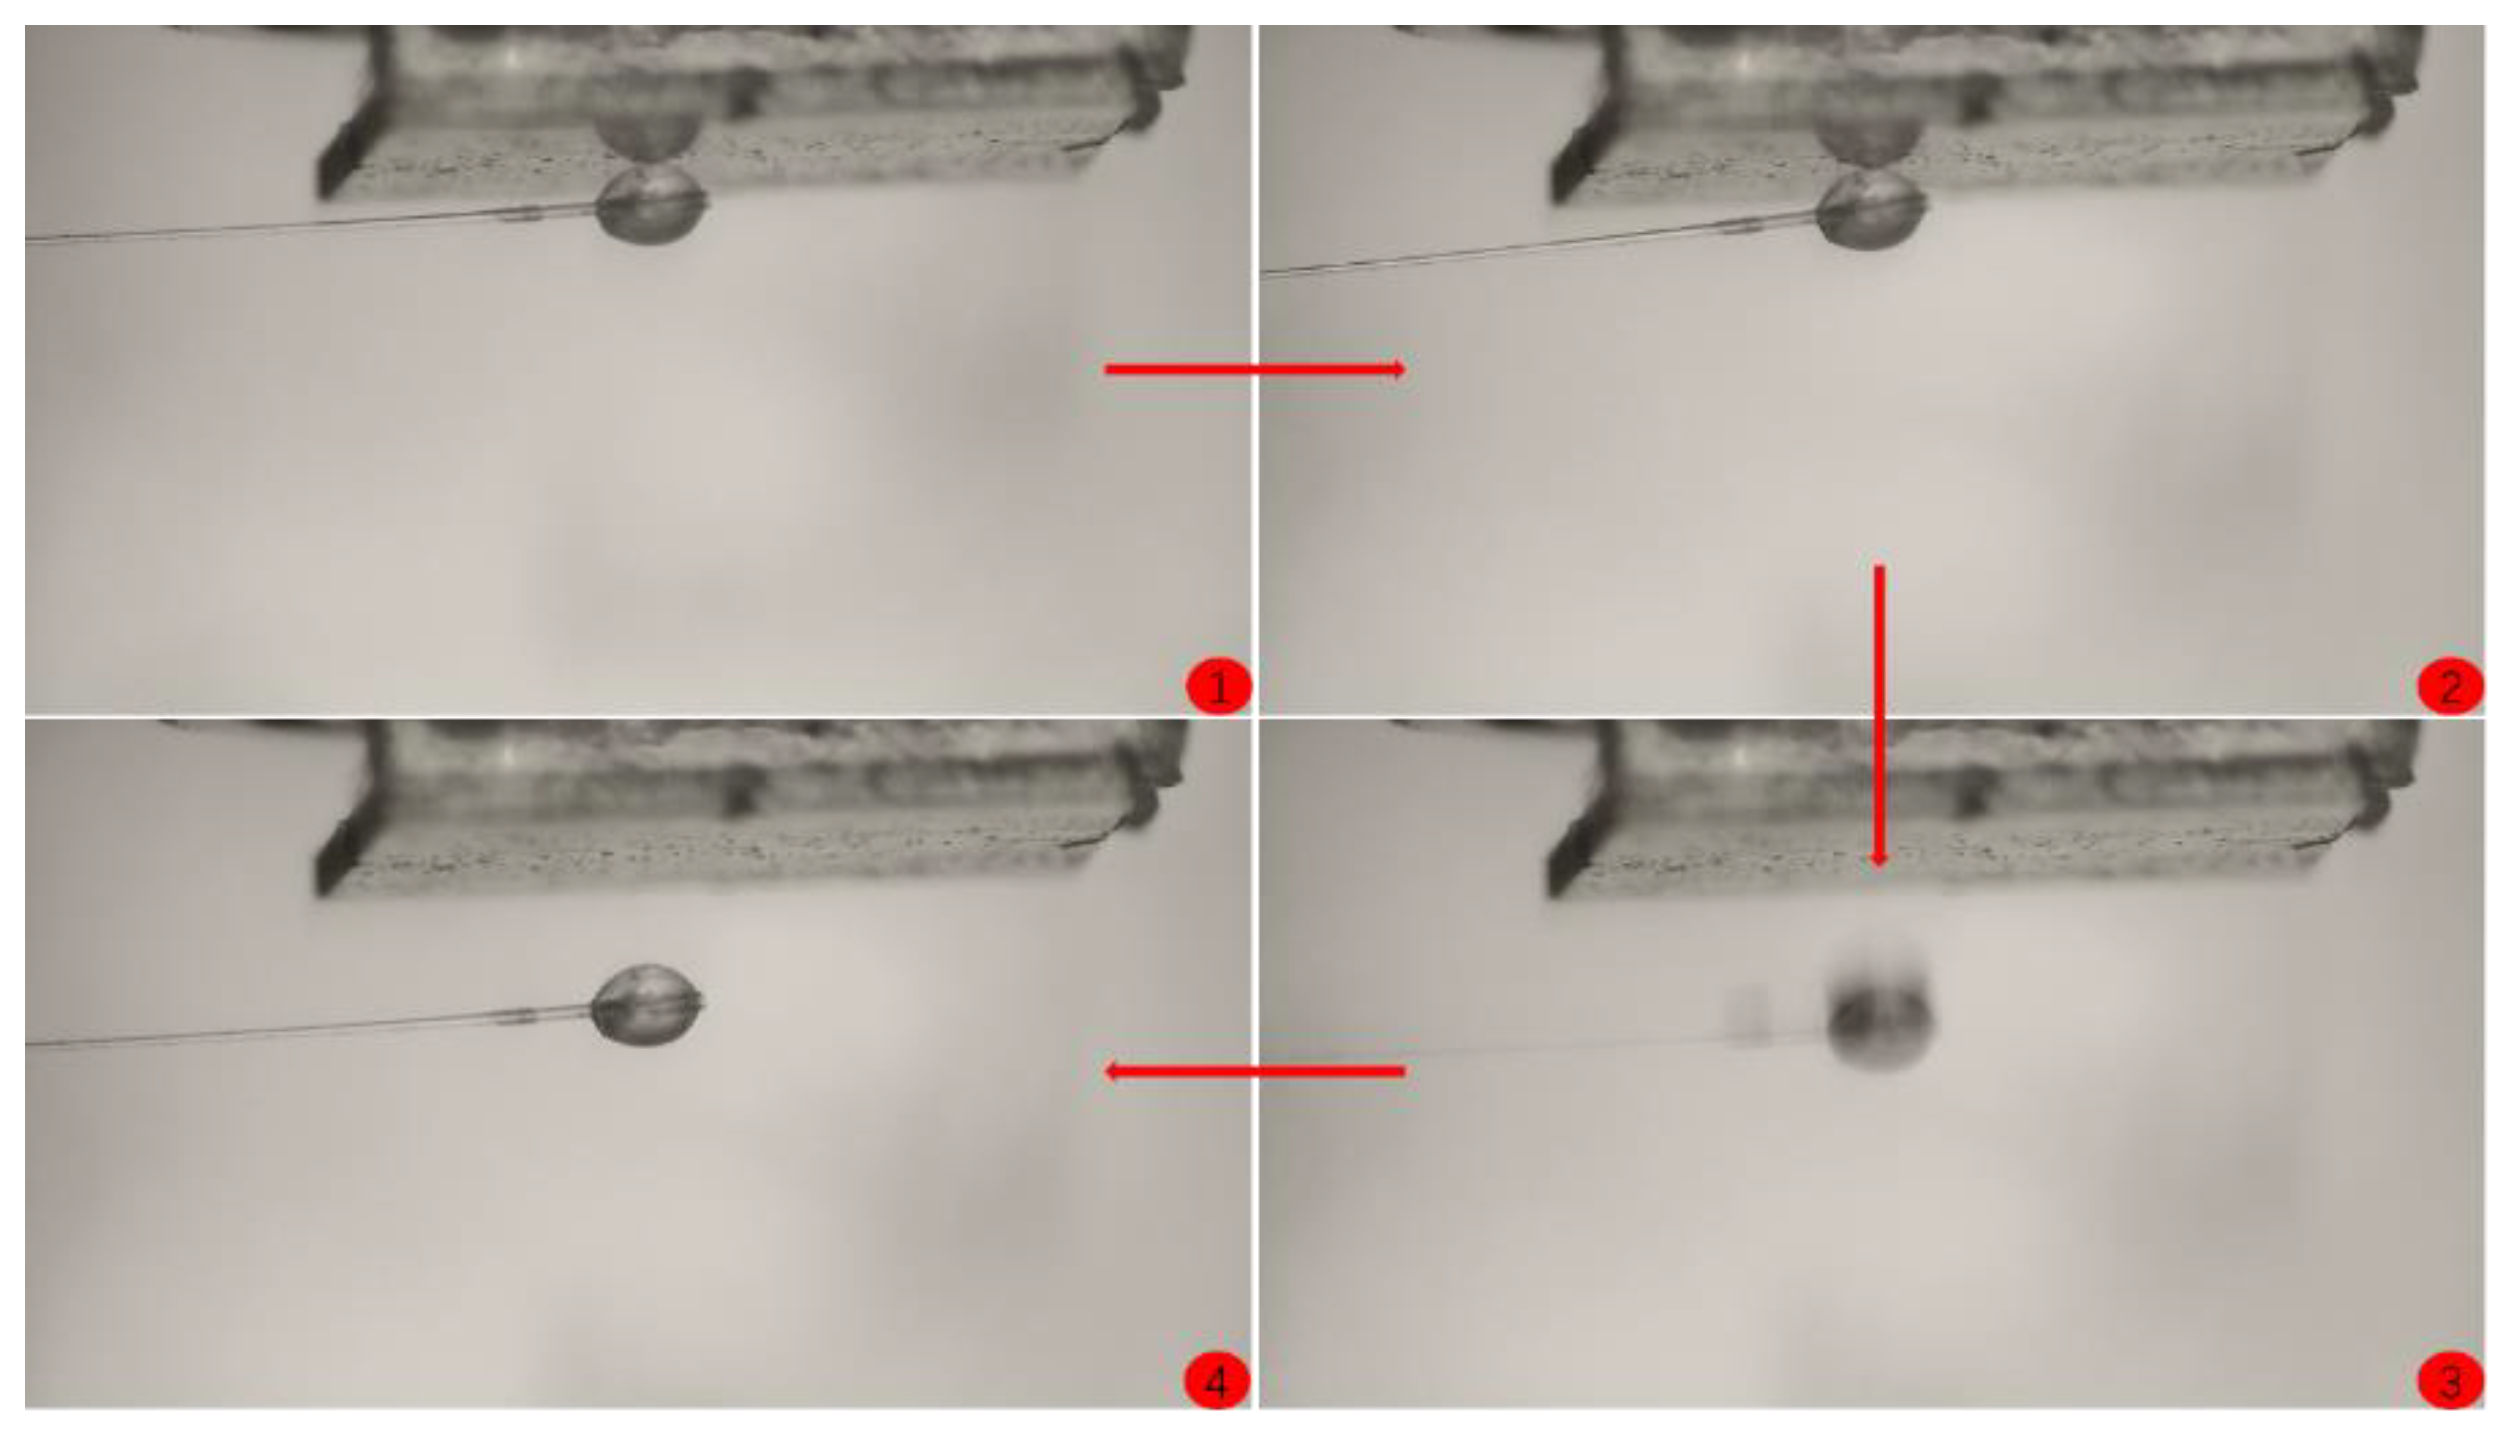
Move the hydrate particle at the end of the glass fiber within the line of sight and ensure that the glass fiber is parallel to the substrate coating.
(11)
Keep the position of the substrate fixed, move the manual operating arm to make the hydrate particle contact the substrate, and apply a certain pressure for 5 s. Slowly pull the manual cantilever, causing the glass fiber at the end of the operating arm to bend, resulting in the separation of the hydrate particle from the substrate.
This process is recorded using a microscopic information collection system and processed using ImageJ and AE to obtain the final data. To ensure data accuracy, each adhesion force test should be conducted at least forty times, with at least four sets of experiments under different conditions.
Figure 6 shows the diagram of the microscopic process of the measurement of the adhesion force between the hydrate particles and the wall: (1) the hydrate particles are in full contact with the wall; (2) the glass fibers of the hydrate particles are deflected by pulling; (3) the pulling force exceeds the adhesion force between the particles and the wall so that the particles are separated from the wall; (4) the relative position of the hydrate particles from the wall after the stabilization of the hydrate particles.

3. Results and Discussion

3.1. Coating Adhesion Test Results

According to the ISO 2409-2007 standard [27], adhesion tests were conducted on three different coatings, and the adhesion grade test results for each coating are shown in Figure 7 and Table 2.
It can be observed that the PTFE/PPS composite coating only shows minimal peeling at the grid lines, with no peeling in other areas. Therefore, it has an adhesion grade of 1, indicating that the adhesion test is successful. The epoxy resin E-51 coating exhibits completely smooth edges at the cuts, with no peeling at the grid lines, indicating a very strong adhesion. Therefore, it has an adhesion grade of 0, and the adhesion test is successful. In comparison, the polyurea coating shows partial or extensive peeling along the edges of the cuts, resulting in an adhesion grade of 3, indicating that it does not meet the adhesion requirements for internal pipeline coatings.

3.2. Coating Contact Angle Test Results

This experiment conducted four sets of tests on the same coating sample, with ten image captures and average contact angle calculations performed for each test. The contact angle measurement images for each coating are shown in Figure 8, Figure 9, Figure 10 and Figure 11, and the contact angle measurement values for each coating are presented in Table 3.
According to Table 3, the uncoated substrate, epoxy resin E-51-coated substrate, and polyurea-coated substrate exhibit hydrophilic properties, while the PTFE/PPS-coated substrate shows hydrophobic properties. Polytetrafluoroethylene (PTFE) and polyphenylene sulfide (PPS) are typically highly hydrophobic materials, and their combination in the coating increases the hydrophobicity, resulting in higher contact angles. Although the epoxy resin E-51 coating and polyurea coating show relatively small differences in contact angle compared to the uncoated substrate, they still exhibit better hydrophobic properties than the uncoated substrate. Therefore, from the perspective of coating wettability, the PTFE/PPS composite coating has a larger contact angle and stronger hydrophobicity, making it more suitable for the coating’s performance requirements in preventing hydrate formation. The epoxy resin E-51 coating and polyurea coating have slightly larger contact angles than the uncoated substrate. Further analysis is needed for each coating before making a selection based on coating properties.

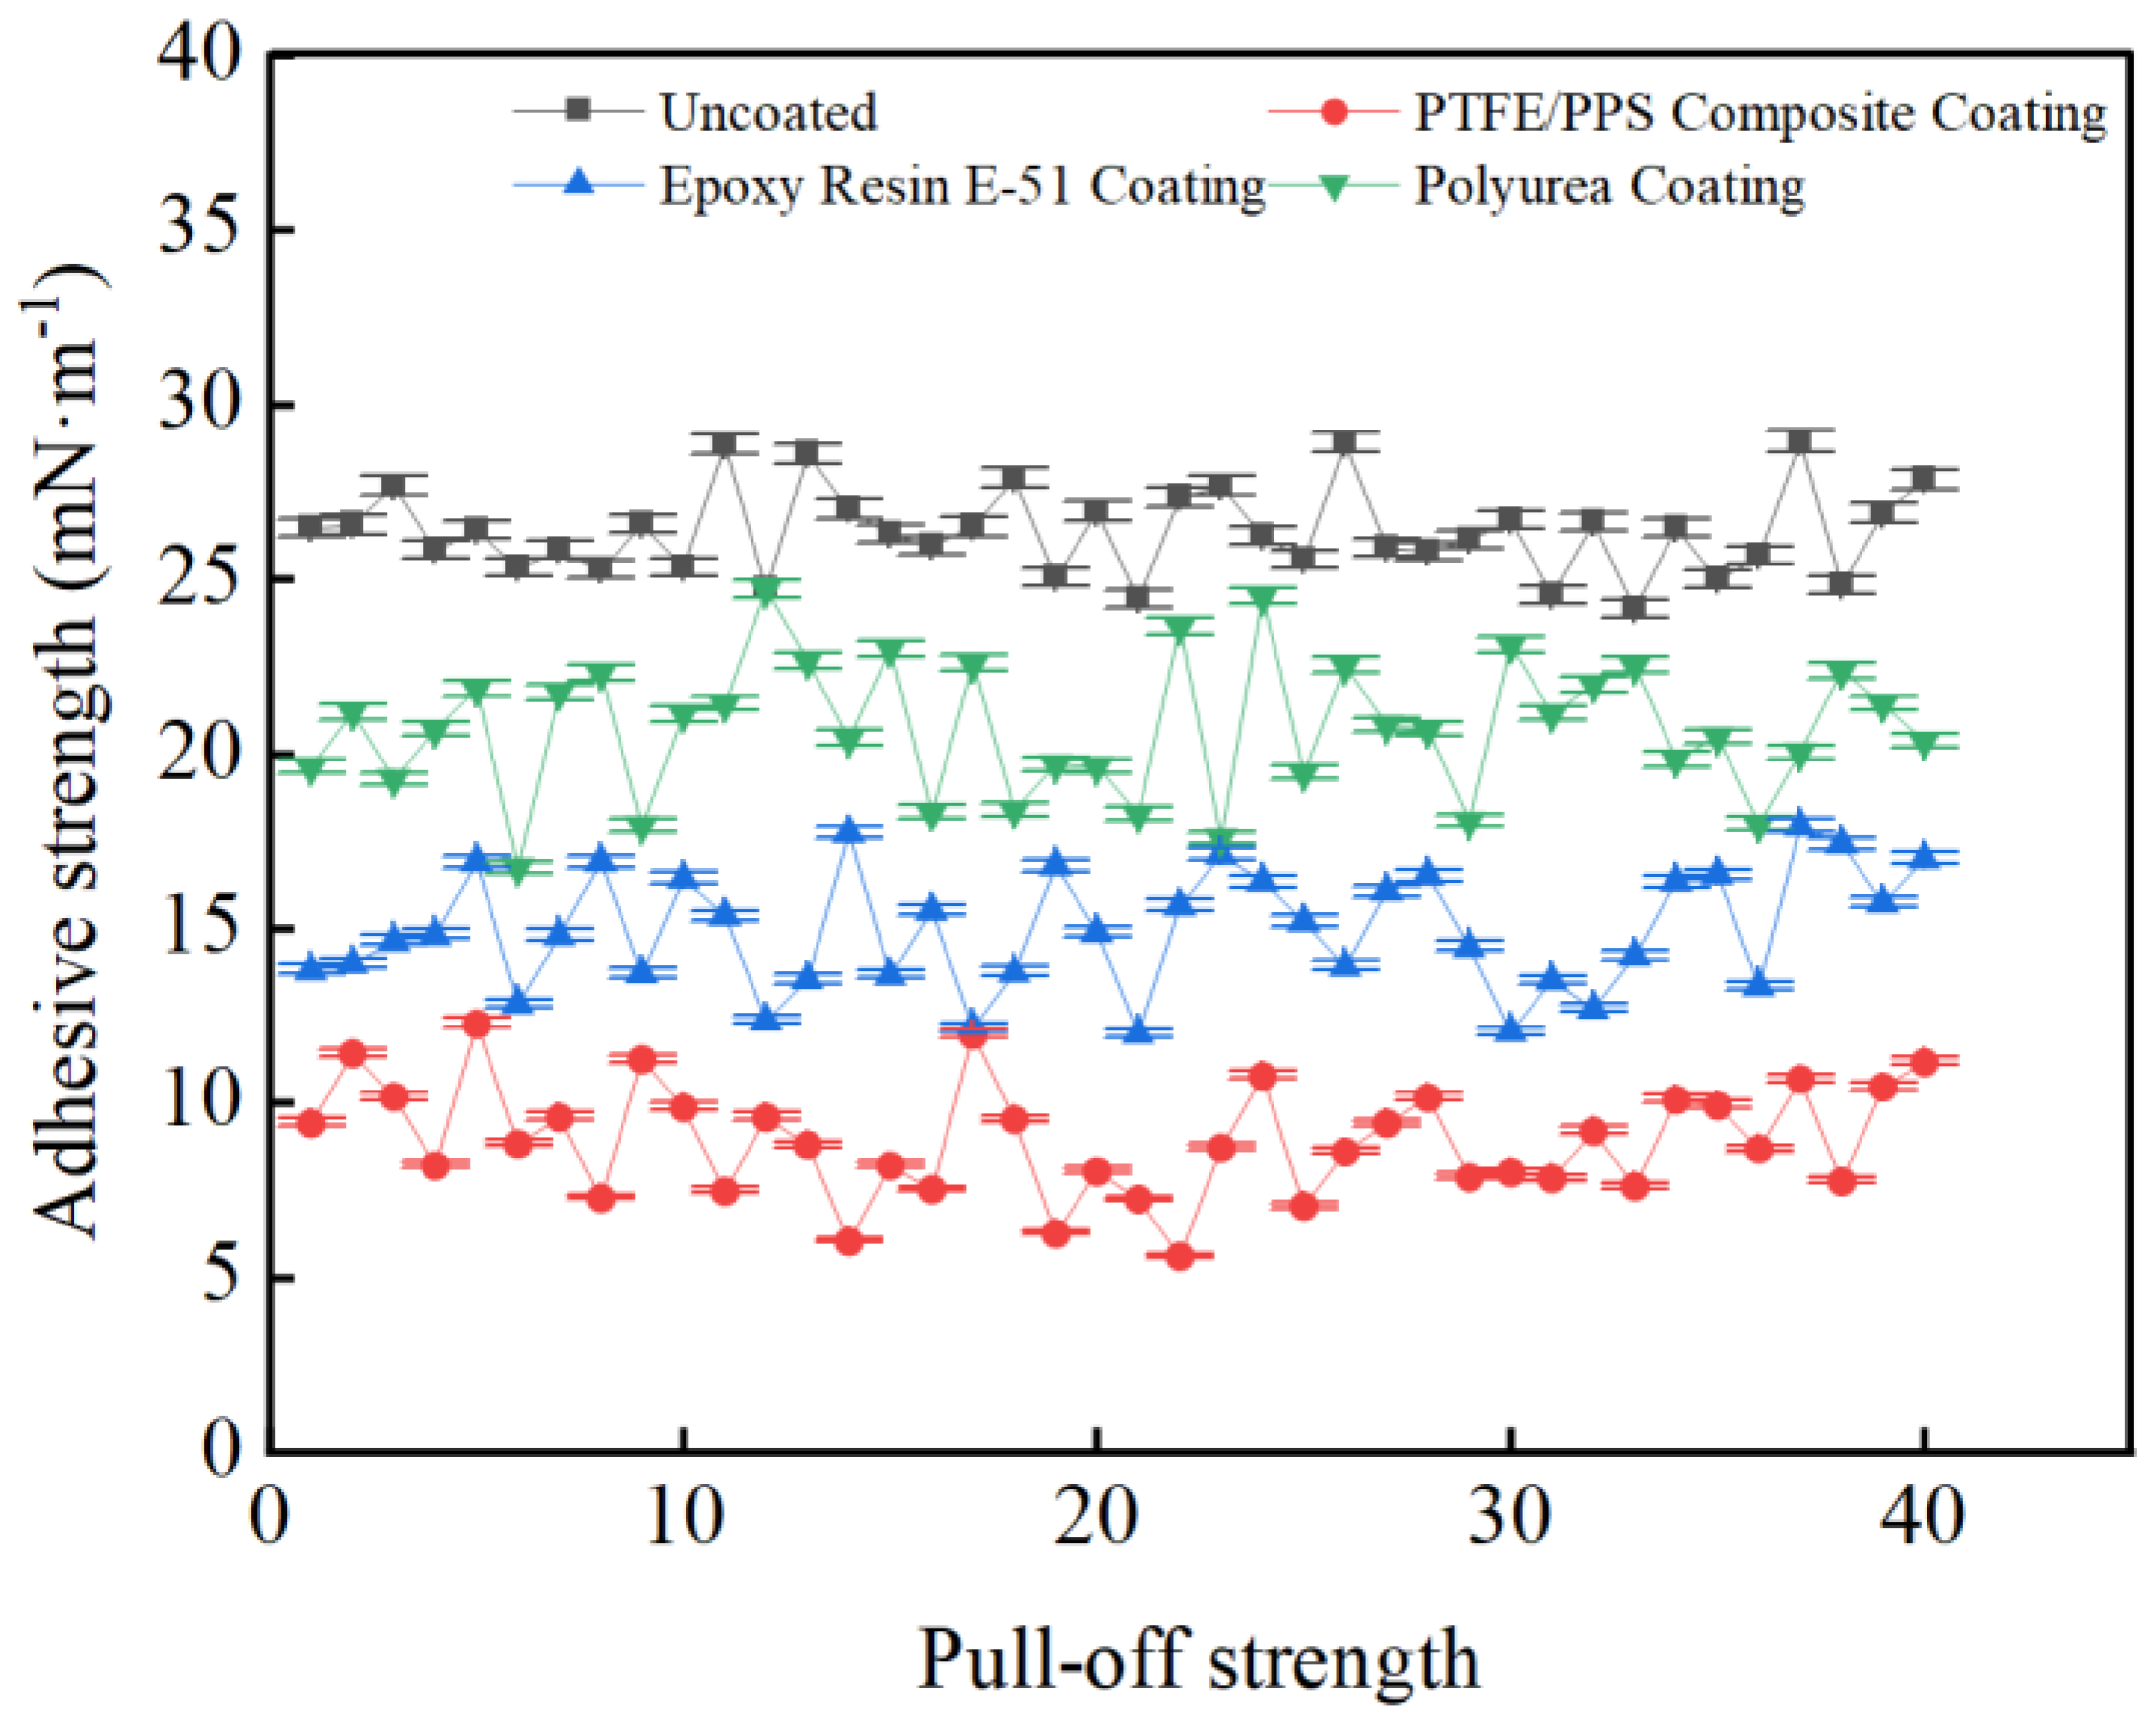
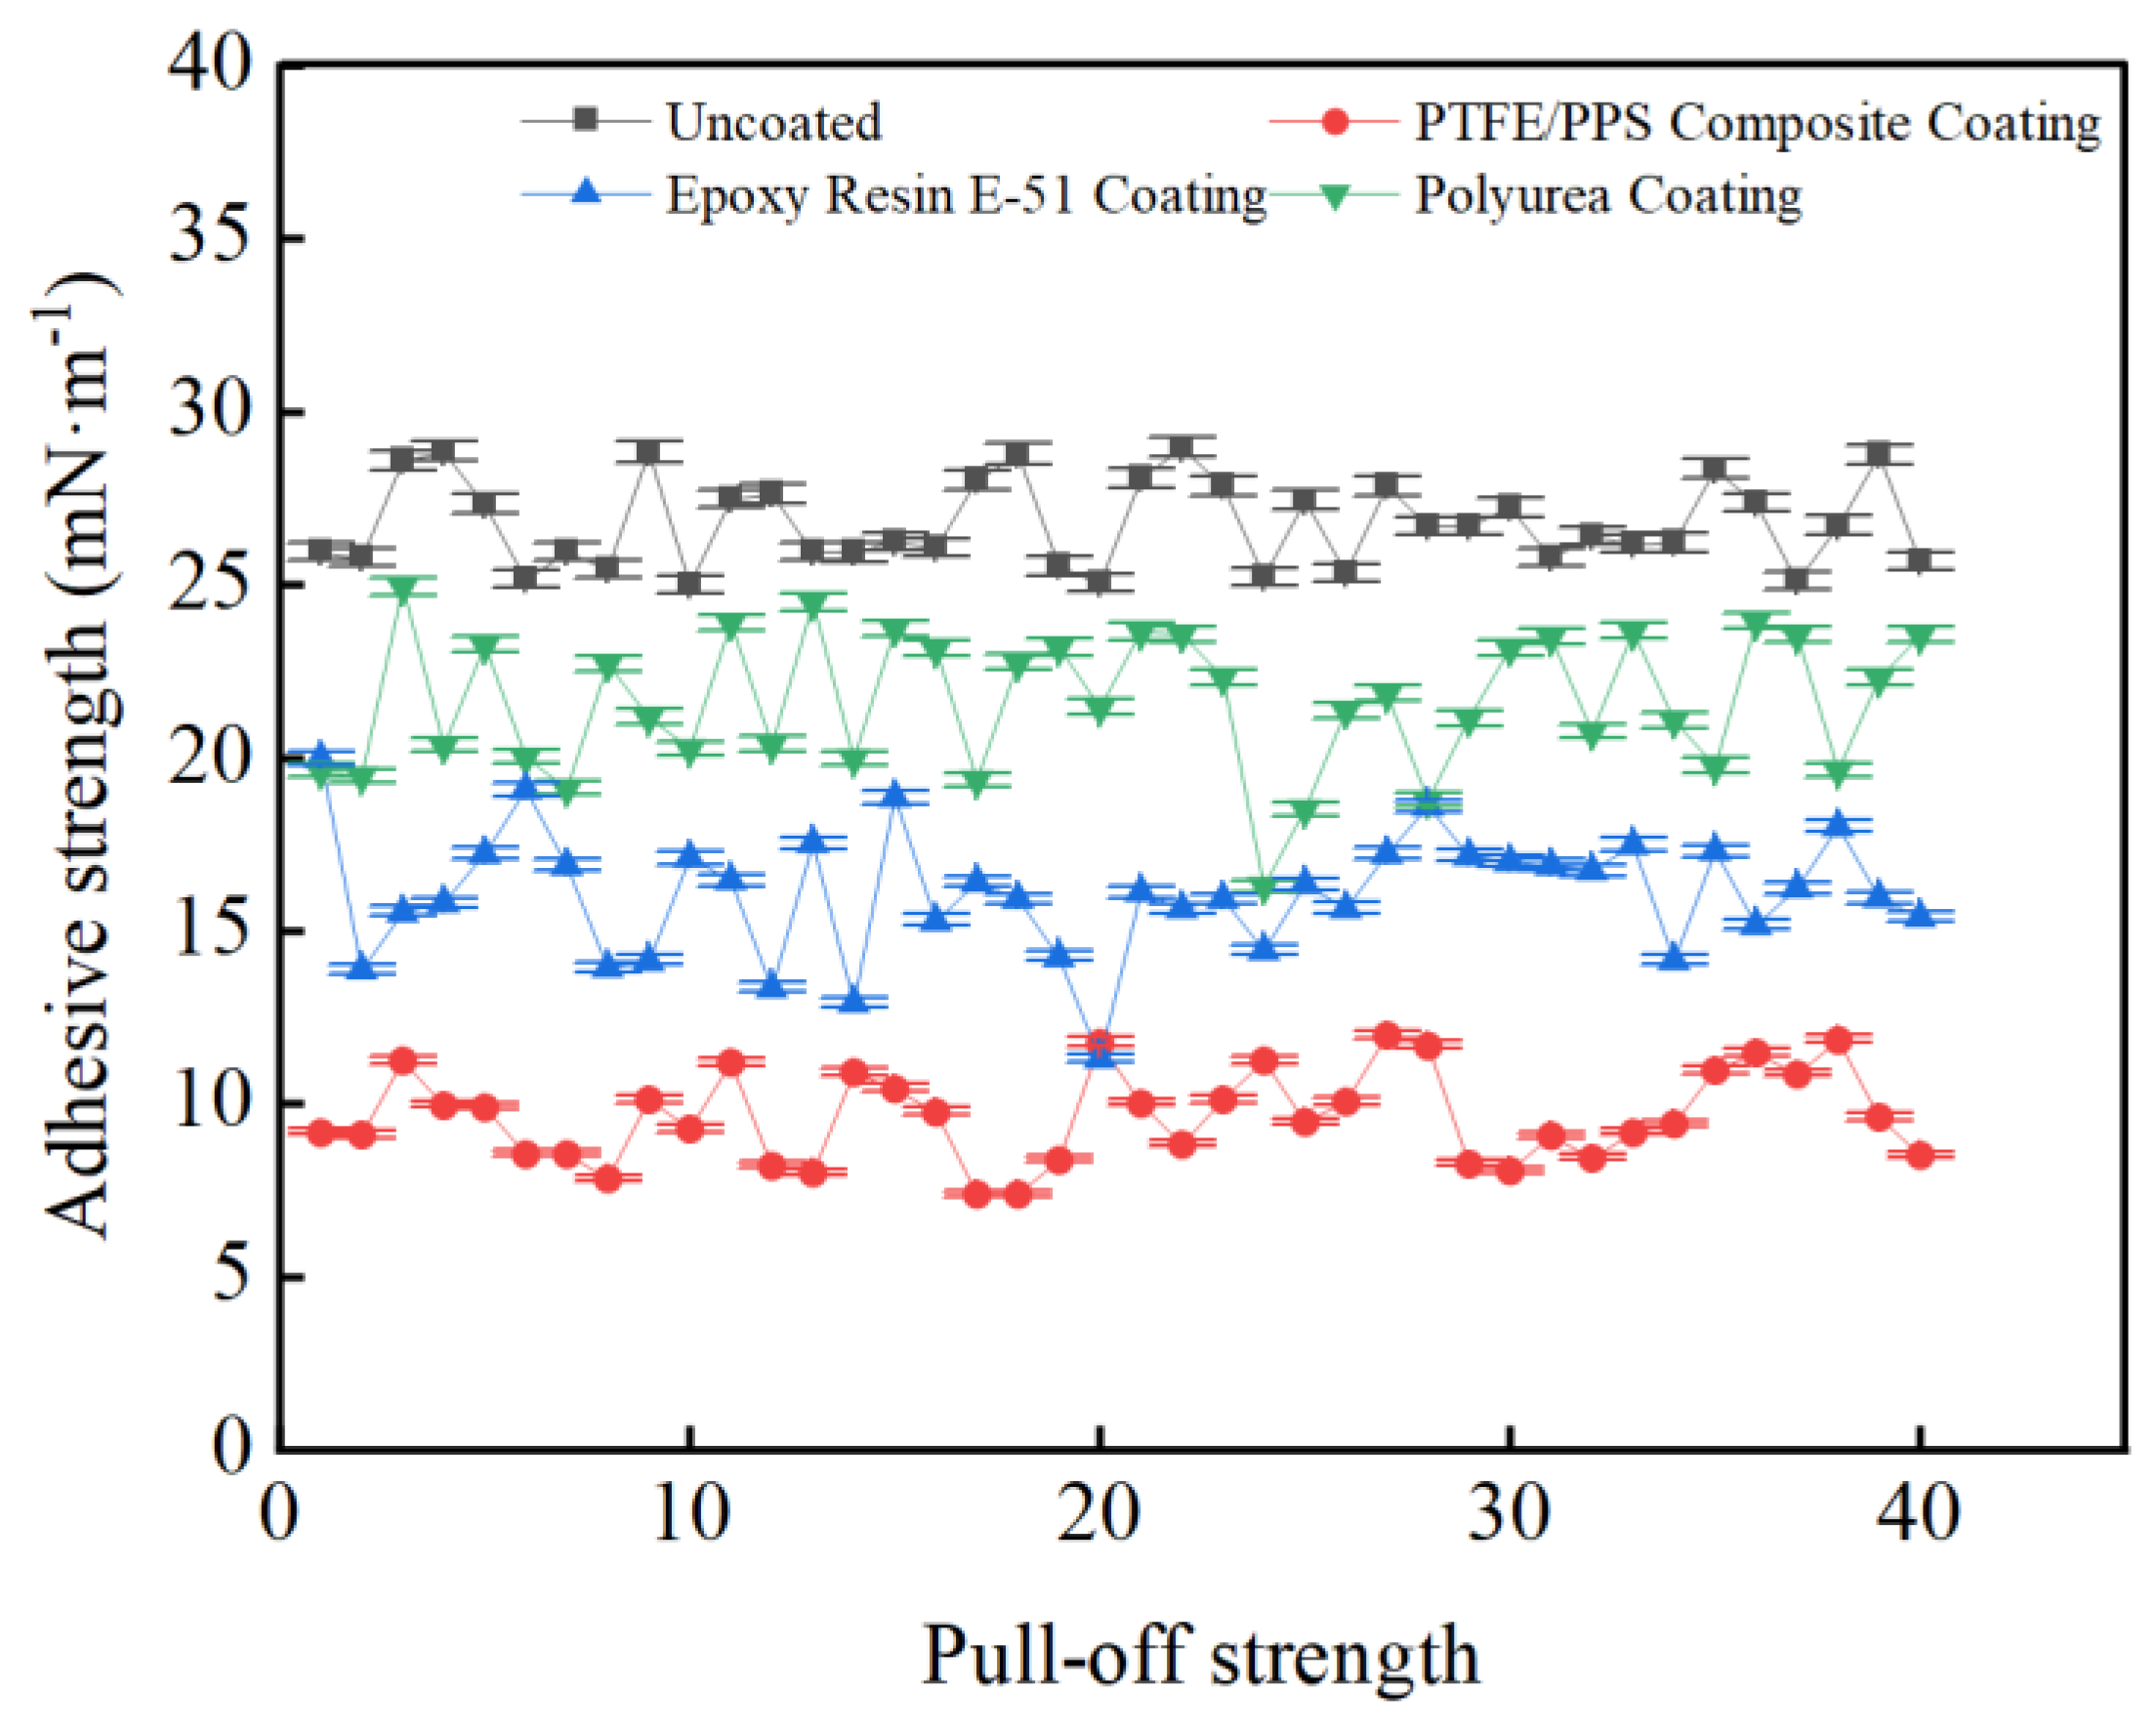
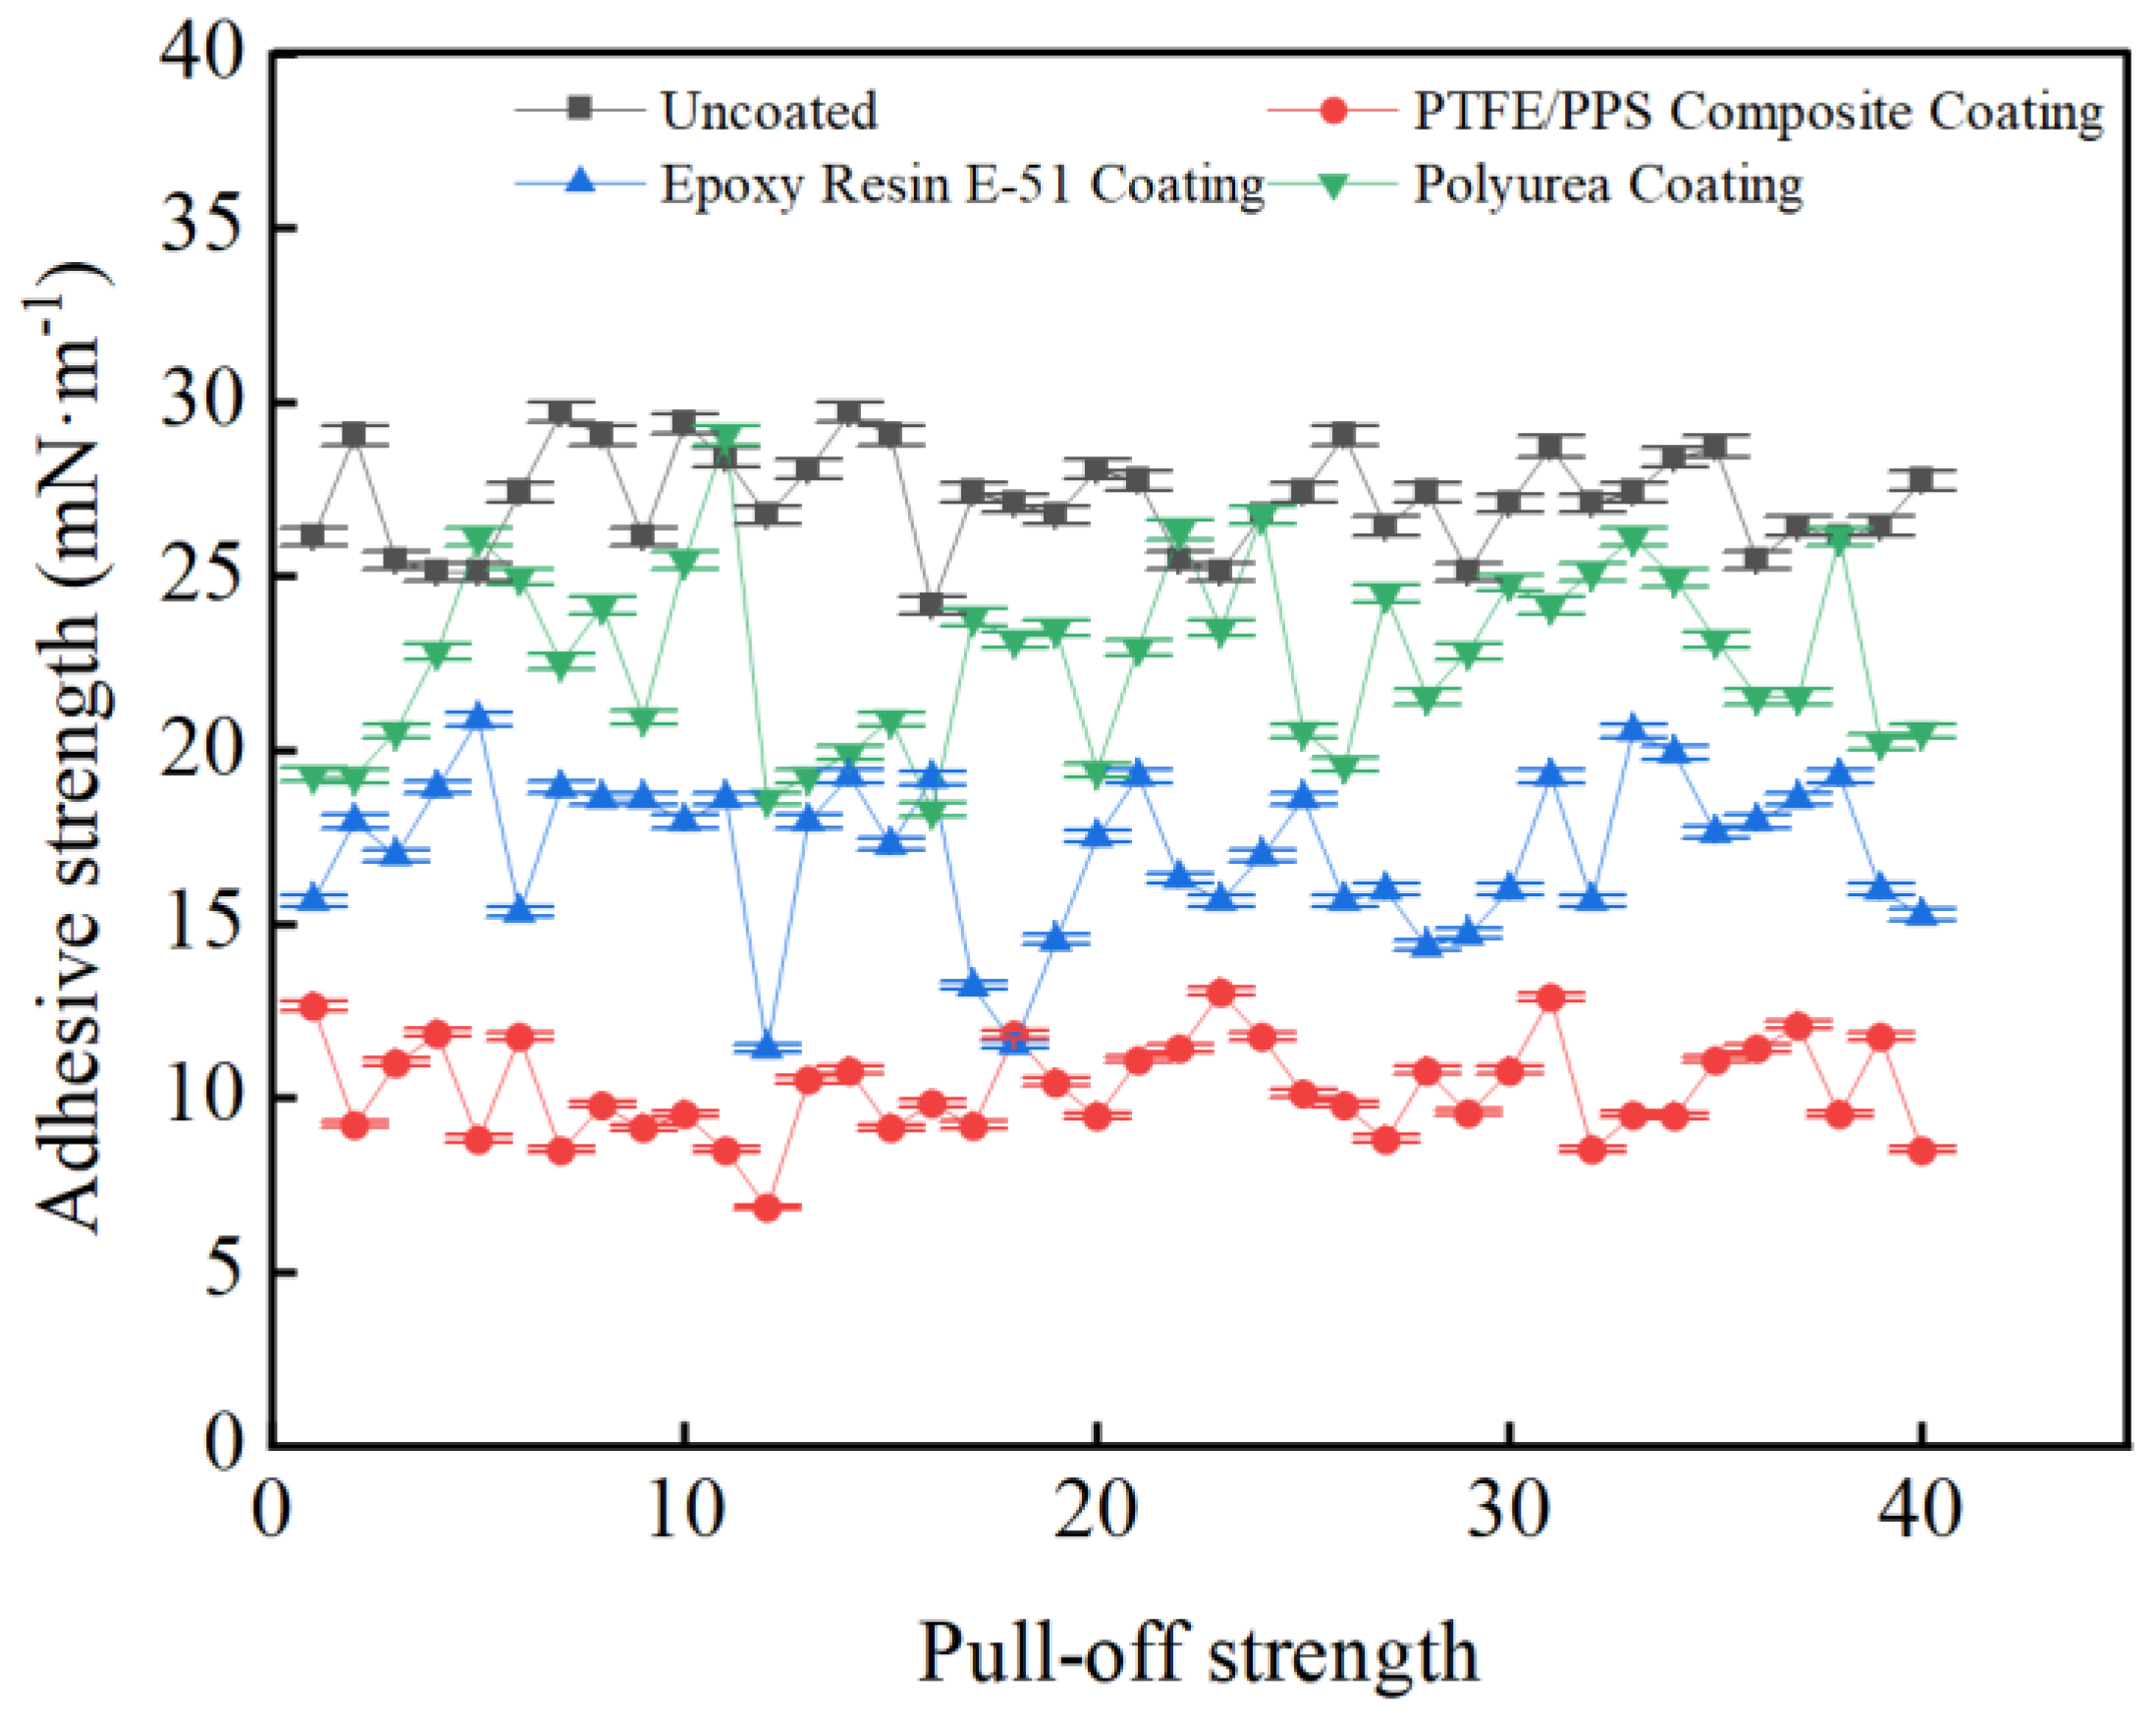
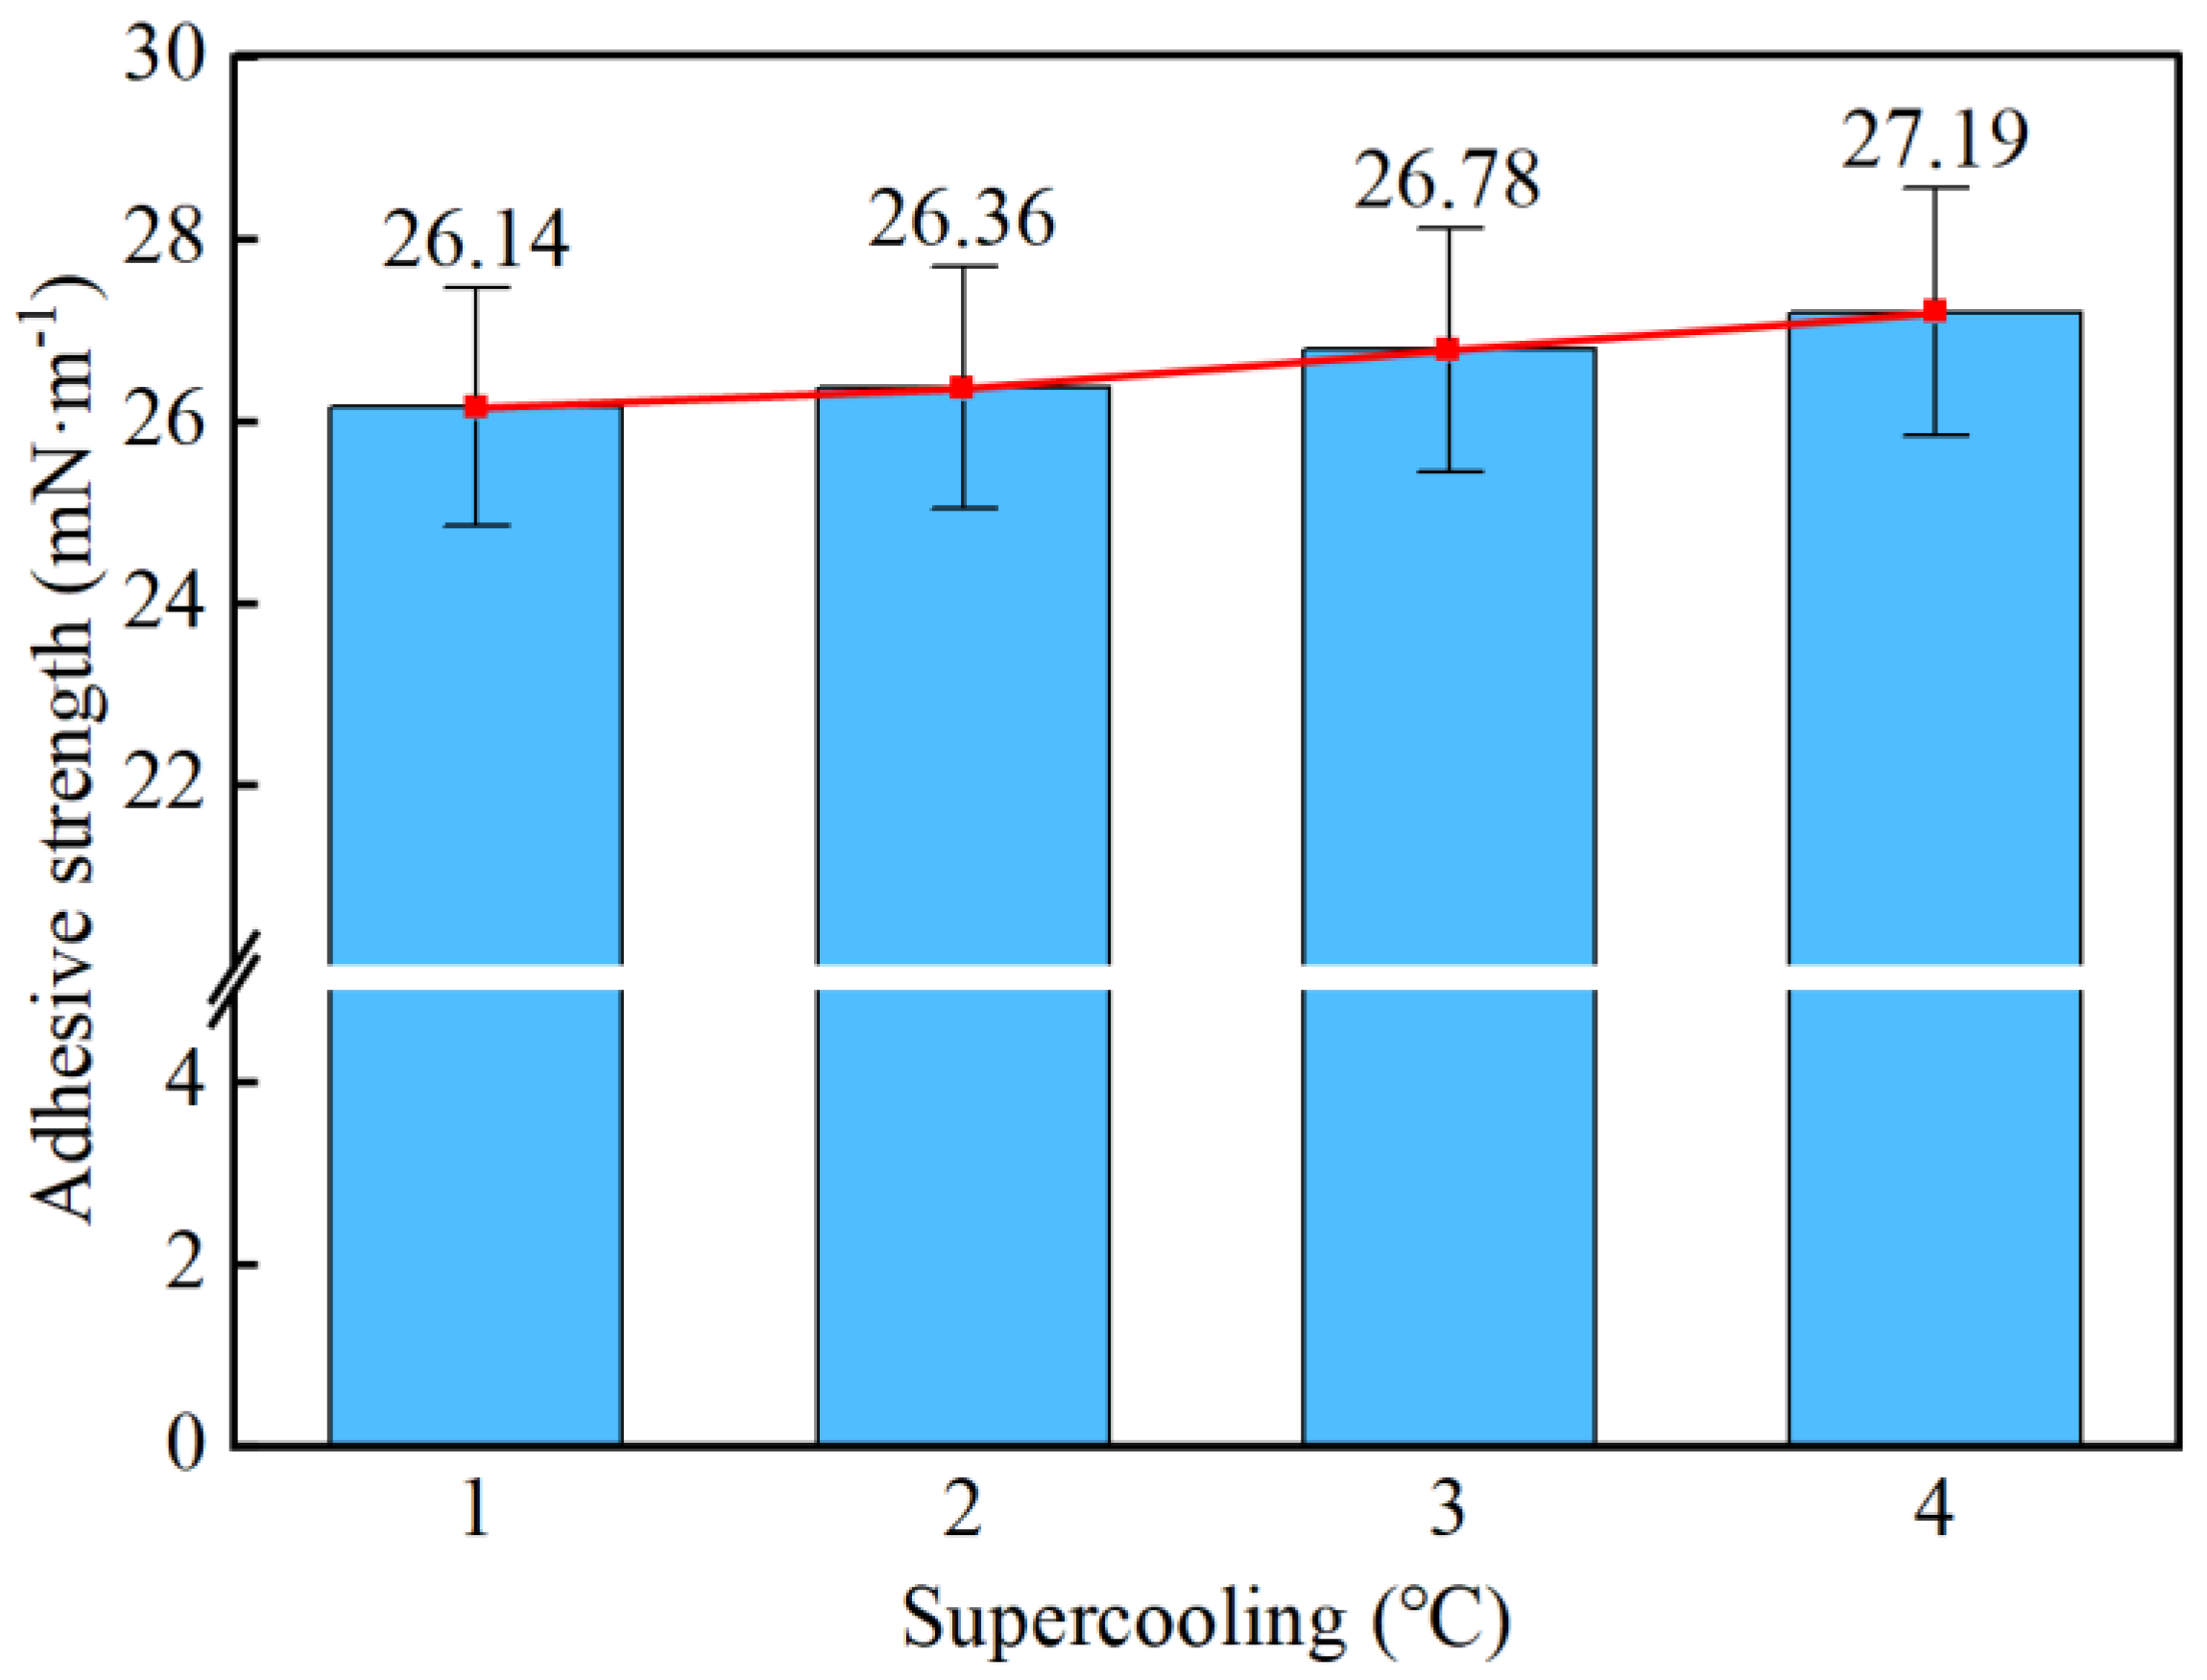
3.3. Coating Adhesion to Hydrate Particles Test Results

According to the hydrate equilibrium theory, the adhesive force between hydrate particles and different substrates was measured at subcooling temperatures of 1 °C, 2 °C, 3 °C, and 4 °C in a reaction vessel. The contact time between particles and substrates was set at 5 s to analyze the effect of different coatings on the adhesion force between hydrate particles and substrates. In this experiment, four different substrates were analyzed, and for each substrate, four sets of repeated experiments were conducted under the same subcooling conditions. Each experiment involved 40 detachment cycles, and the average value of each detachment was recorded, resulting in a total of 64 sets of experiments. Factors that may affect the results of this experiment include: variations in temperature and pressure with hydrate formation; irregularities in the hydrate particles; uneven coating of the substrate surface; and errors in the measurement of the pull-off distance. Therefore, several sets of experiments were conducted to minimize the influence of these factors on the experimental results.
According to the experimental results shown in Figure 12, at a subcooling temperature of 1 °C, the adhesion force between hydrate particles and the uncoated conventional substrate is mainly concentrated between 23.16 mN·m−1 and 28.71 mN·m−1, with an average adhesion force of 26.14 mN·m−1. The adhesion force between hydrate particles and the PTFE/PPS composite-coated conventional substrate is mainly concentrated between 4.89 mN·m−1 and 11.42 mN·m−1, with an average adhesion force of 8.36 mN·m−1. The adhesion force between hydrate particles and the epoxy resin E-51-coated conventional substrate is mainly concentrated between 10.77 mN·m−1 and 17.62 mN·m−1, with an average adhesion force of 14.27 mN·m−1. The adhesion force between hydrate particles and the polyurea-coated conventional substrate is mainly concentrated between 14.36 mN·m−1 and 24.47 mN·m−1, with an average adhesion force of 19.42 mN·m−1.
According to the experimental results shown in Figure 13, at a subcooling temperature of 2 °C, the adhesion force between hydrate particles and the uncoated conventional substrate is mainly concentrated between 24.16 mN·m−1 and 28.89 mN·m−1, with an average adhesion force of 26.36 mN·m−1. The adhesion force between hydrate particles and the PTFE/PPS composite-coated conventional substrate is mainly concentrated between 5.62 mN·m−1 and 12.27 mN·m−1, with an average adhesion force of 8.69 mN·m−1. The adhesion force between hydrate particles and the epoxy resin E-51-coated conventional substrate is mainly concentrated between 11.97 mN·m−1 and 17.74 mN·m−1, with an average adhesion force of 14.96 mN·m−1. The adhesion force between hydrate particles and the polyurea-coated conventional substrate is mainly concentrated between 16.76 mN·m−1 and 24.71 mN·m−1, with an average adhesion force of 20.76 mN·m−1.
According to the experimental results shown in Figure 14, at a subcooling temperature of 3 °C, the adhesion force between hydrate particles and the uncoated conventional substrate is mainly concentrated between 25.04 mN·m−1 and 28.96 mN·m−1, with an average adhesion force of 26.78 mN·m−1. The adhesion force between hydrate particles and the PTFE/PPS composite-coated conventional substrate is mainly concentrated between 7.38 mN·m−1 and 11.97 mN·m−1, with an average adhesion force of 9.65 mN·m−1. The adhesion force between hydrate particles and the epoxy resin E-51-coated conventional substrate is mainly concentrated between 12.91 mN·m−1 and 19.09 mN·m−1, with an average adhesion force of 16.28 mN·m−1. The adhesion force between hydrate particles and the polyurea-coated conventional substrate is mainly concentrated between 18.51 mN·m−1 and 24.95 mN·m−1, with an average adhesion force of 21.64 mN·m−1.
According to the experimental results shown in Figure 15, at a subcooling temperature of 4 °C, the adhesion force between hydrate particles and the uncoated conventional substrate is mainly concentrated between 24.14 mN·m−1 and 29.67 mN·m−1, with an average adhesion force of 27.19 mN·m−1. The adhesion force between hydrate particles and the PTFE/PPS composite-coated conventional substrate is mainly concentrated between 6.85 mN·m−1 and 13.03 mN·m−1, with an average adhesion force of 10.26 mN·m−1. The adhesion force between hydrate particles and the epoxy resin E-51-coated conventional substrate is mainly concentrated between 14.35 mN·m−1 and 20.55 mN·m−1, with an average adhesion force of 17.09 mN·m−1. The adhesion force between hydrate particles and the polyurea-coated conventional substrate is mainly concentrated between 18.26 mN·m−1 and 26.31 mN·m−1, with an average adhesion force of 22.71 mN·m−1.
As shown in Figure 16, Figure 17, Figure 18 and Figure 19, the average adhesion force between PTFE/PPS composite-coated, epoxy resin E-51-coated, and polyurea-coated substrates and hydrate particles is reduced by 68.01%, 45.41%, and 25.71% compared to the uncoated conventional substrate, respectively. Therefore, the PTFE/PPS composite-coated substrate exhibits the best resistance to hydrate particle adhesion, with the lowest average adhesion force, making it a potentially effective choice in applications where preventing hydrate adhesion is desired. The epoxy resin E-51-coated substrate and the polyurea-coated substrate have adhesion forces between the uncoated conventional substrate and the PTFE/PPS composite-coated substrate, still demonstrating some level of resistance to hydrate particle adhesion, but slightly lower compared to the PTFE/PPS composite-coated substrate.
The adhesion force between hydrate particles and the uncoated conventional substrate increases slightly with the increase in subcooling temperature. According to Figure 16, as the subcooling temperature increases from 1.7 °C to 4.7 °C, the increase in adhesion force is 1.05 mN·m−1. This indicates that under lower subcooling temperature conditions, there is a slight increase in the adhesion force between hydrate particles and the substrate, but the magnitude of this increase is relatively small.
The adhesion force between hydrate particles and the PTFE/PPS-coated substrate under different subcooling conditions is shown in Figure 17. As the subcooling temperature increases from 1.7 °C to 4.7 °C, the adhesion force between hydrate particles and the substrate gradually increases from 8.36 mN·m−1 to 10.26 mN·m−1. With a 3 °C increase in the subcooling temperature, the adhesion force increases by 1.92 mN·m−1.
The adhesion force between hydrate particles and the epoxy resin E-51-coated substrate under different subcooling conditions is shown in Figure 18. As the subcooling temperature increases from 1.7 °C to 4.7 °C, the adhesion force between hydrate particles and the substrate gradually increases from 14.27 mN·m−1 to 17.09 mN·m−1. With a 3 °C increase in the subcooling temperature, the adhesion force increases by 2.82 mN·m−1.
The adhesion force between hydrate particles and the polyurea-coated substrate under different subcooling conditions is shown in Figure 19. As the subcooling temperature increases from 1.7 °C to 4.7 °C, the adhesion force between hydrate particles and the substrate gradually increases from 19.42 mN·m−1 to 22.71 mN·m−1. With a 3 °C increase in the subcooling temperature, the adhesion force increases by 3.29 mN·m−1.
Further analysis shows that among the three types of coated substrates, namely PTFE/PPS composite coating, epoxy resin E-51 coating, and polyurea coating, when the adhesion force between the coating and hydrate particles is greater, the more it is affected by subcooling. Among them, the PTFE/PPS composite coating has the smallest adhesion force with hydrate particles and is least affected by subcooling, followed by the epoxy resin E-51 coating, while the polyurea coating has the least effect on reducing the adhesion force between the substrate and hydrate particles.

4. Conclusions

(1)
The adhesion test results indicate that among the three selected coating materials, the PTFE/PPS composite coating has an adhesion grade of 1, while the epoxy resin E-51 coating has an adhesion grade of 0, demonstrating good adhesion performance and meeting the adhesion requirements of practical working conditions. In comparison, the polyurea coating has an adhesion grade of 3, indicating poor adhesion and a significant peeling phenomenon, thus not meeting the requirements for coating usage.
(2)
The contact angle test results of the coatings show that among the three selected coating materials, the PTFE/PPS composite coating has an average contact angle of 105.63°, exhibiting the best hydrophobicity. The epoxy resin E-51 coating has an average contact angle of 67.75°, and the polyurea coating has an average contact angle of 66.04°, indicating some hydrophobicity compared to the uncoated substrate. In comparison, the PTFE/PPS composite coating is more suitable for the coating method to prevent hydrate formation in gas pipelines.
(3)
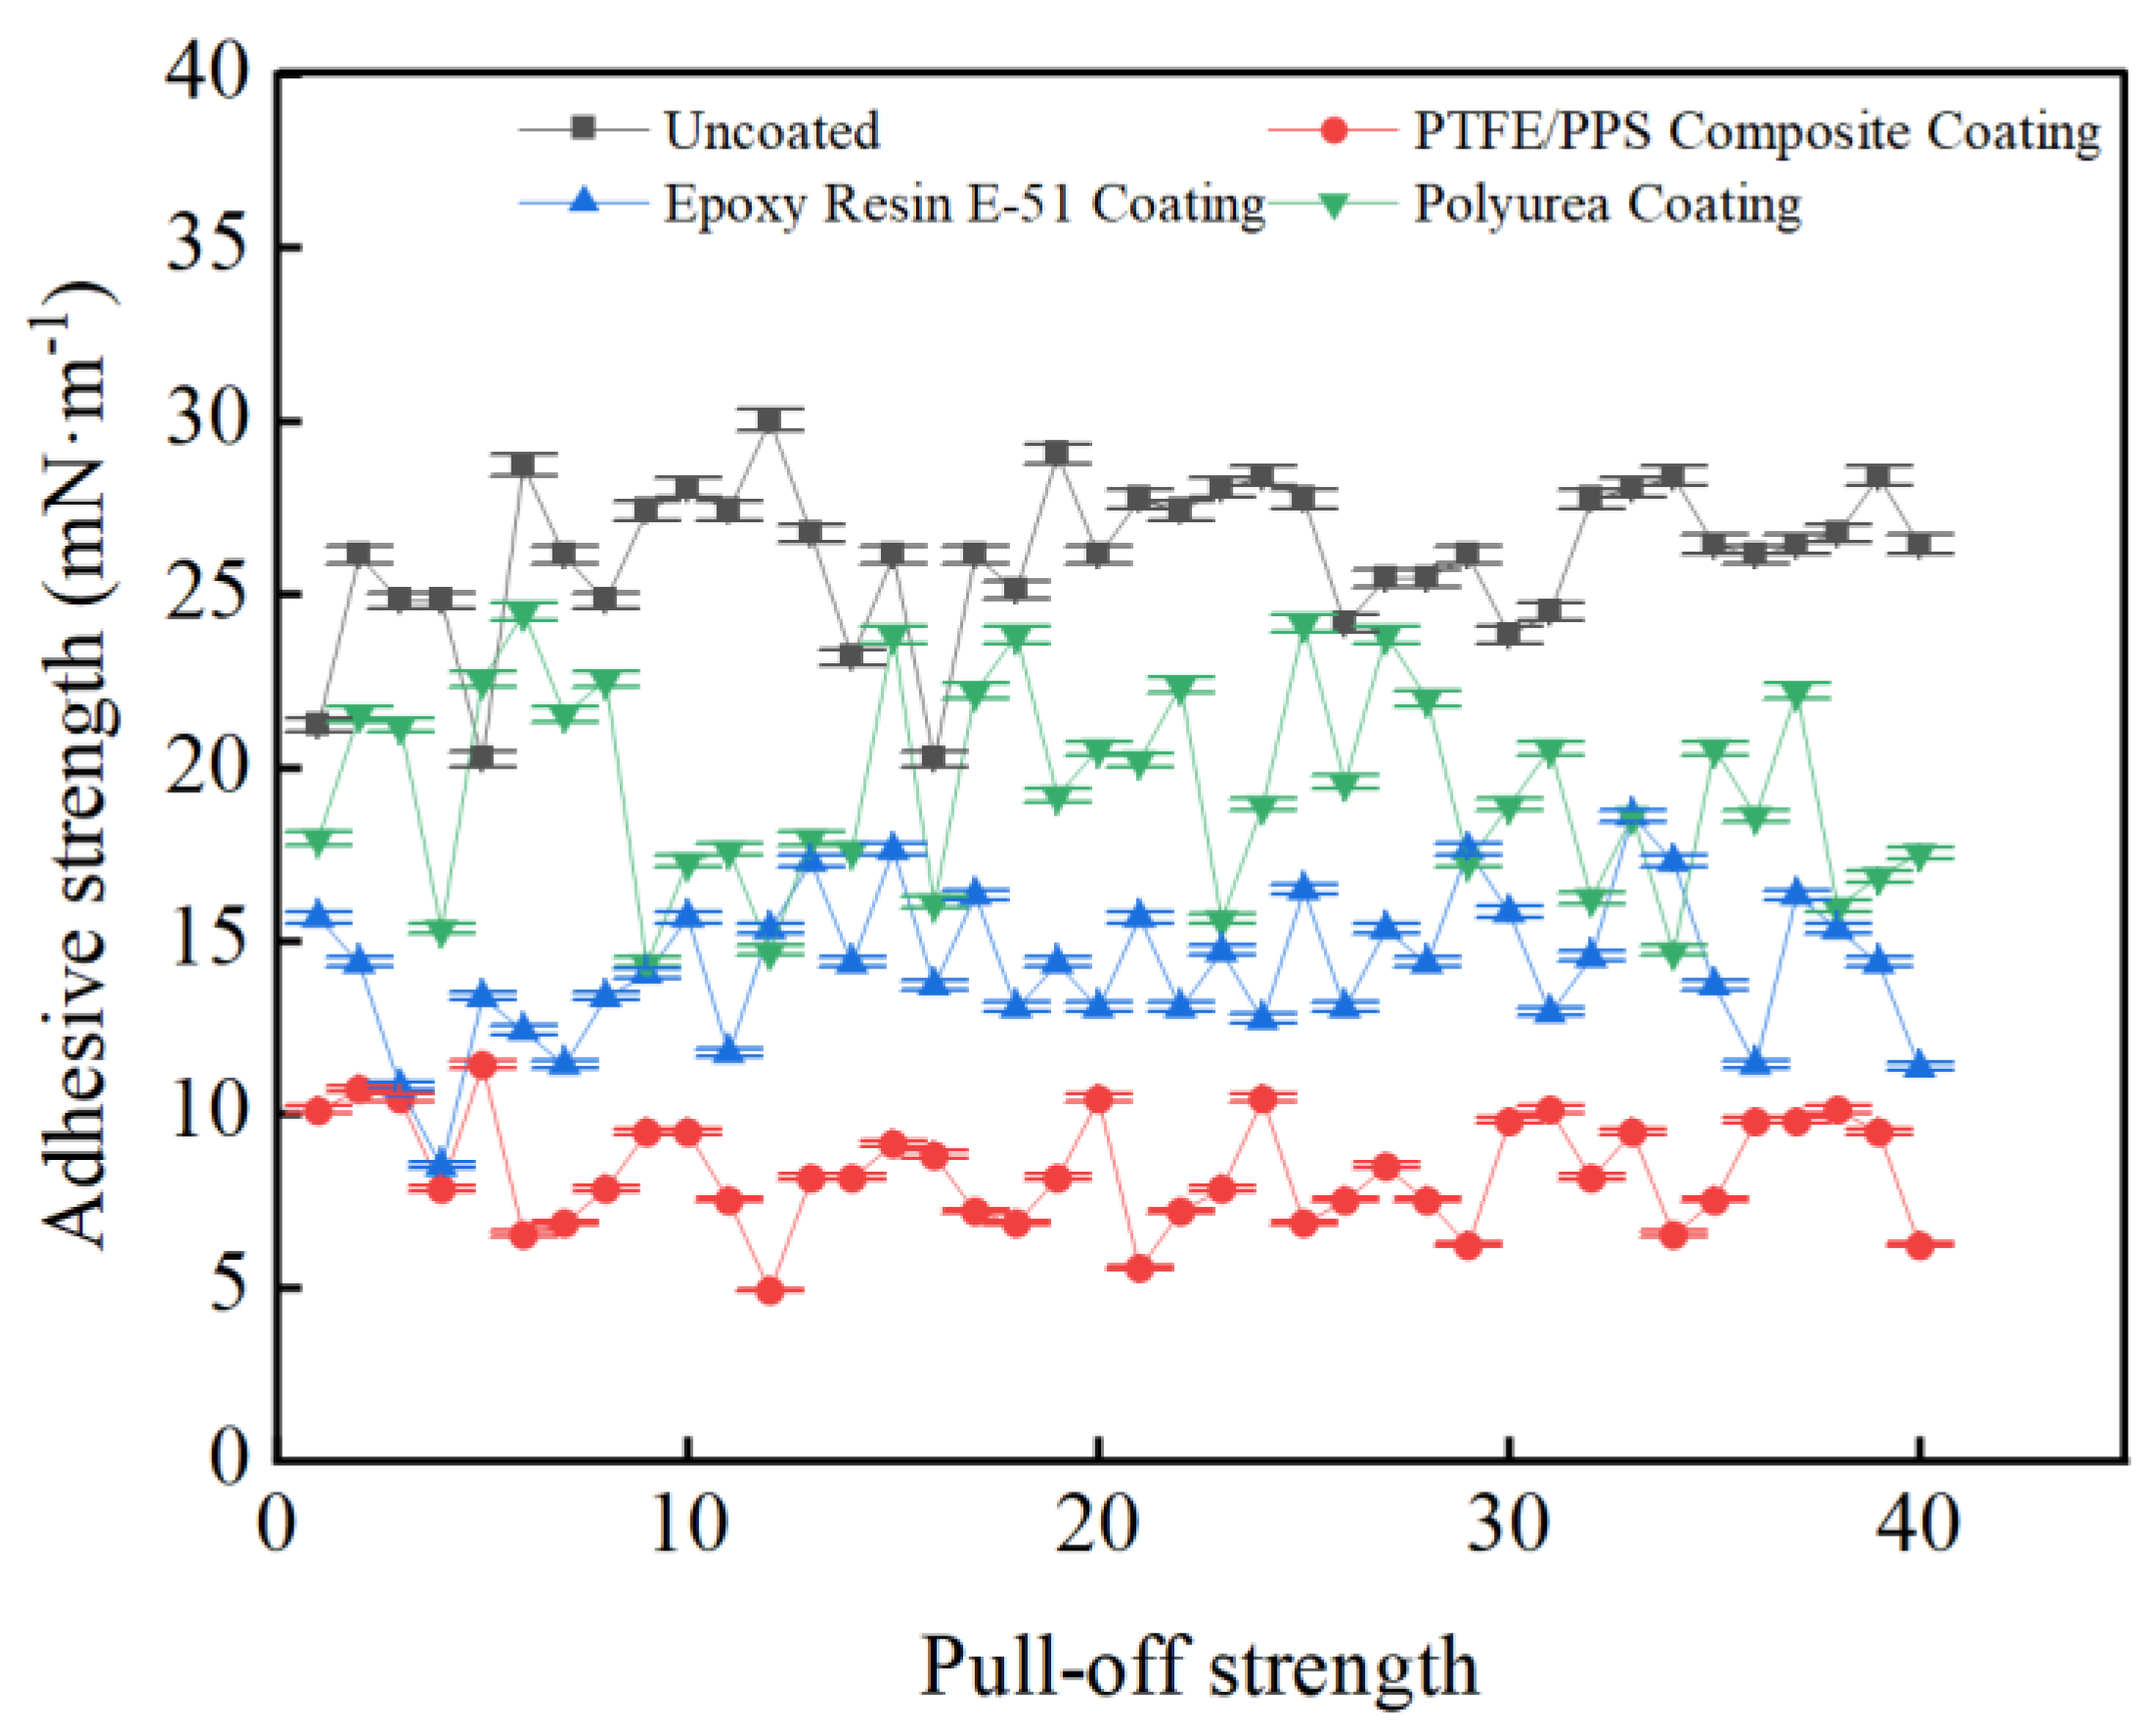
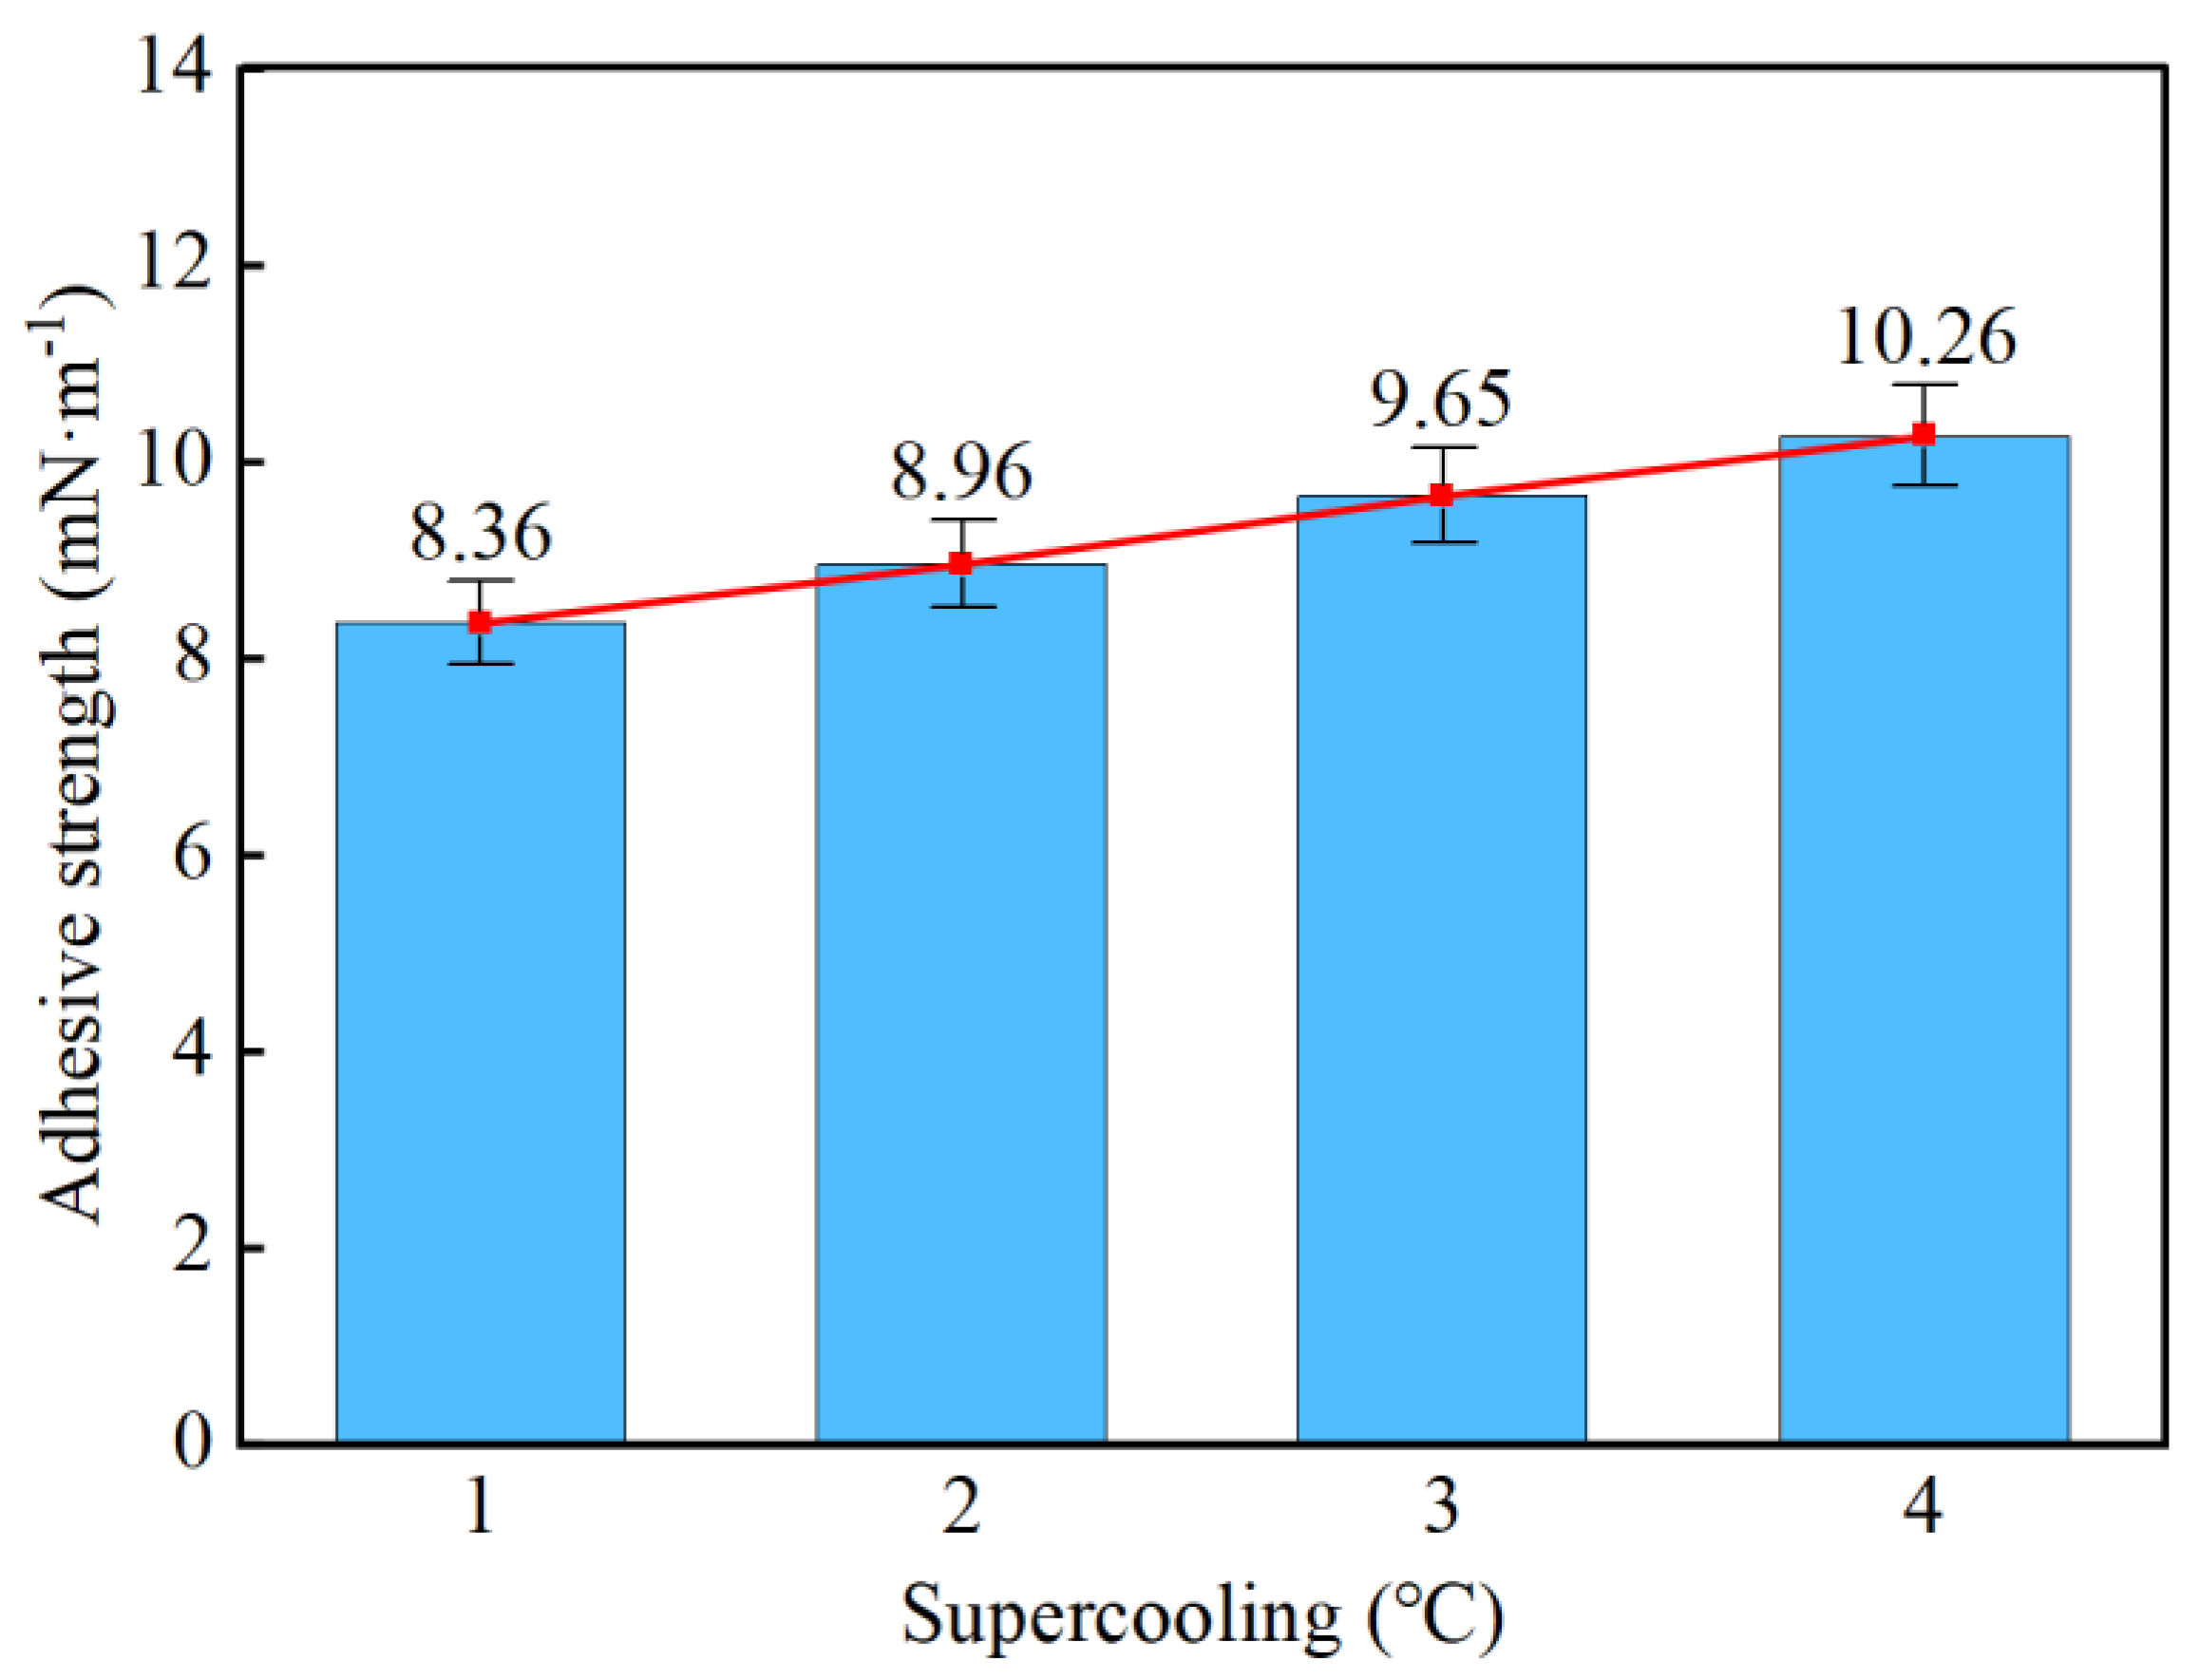
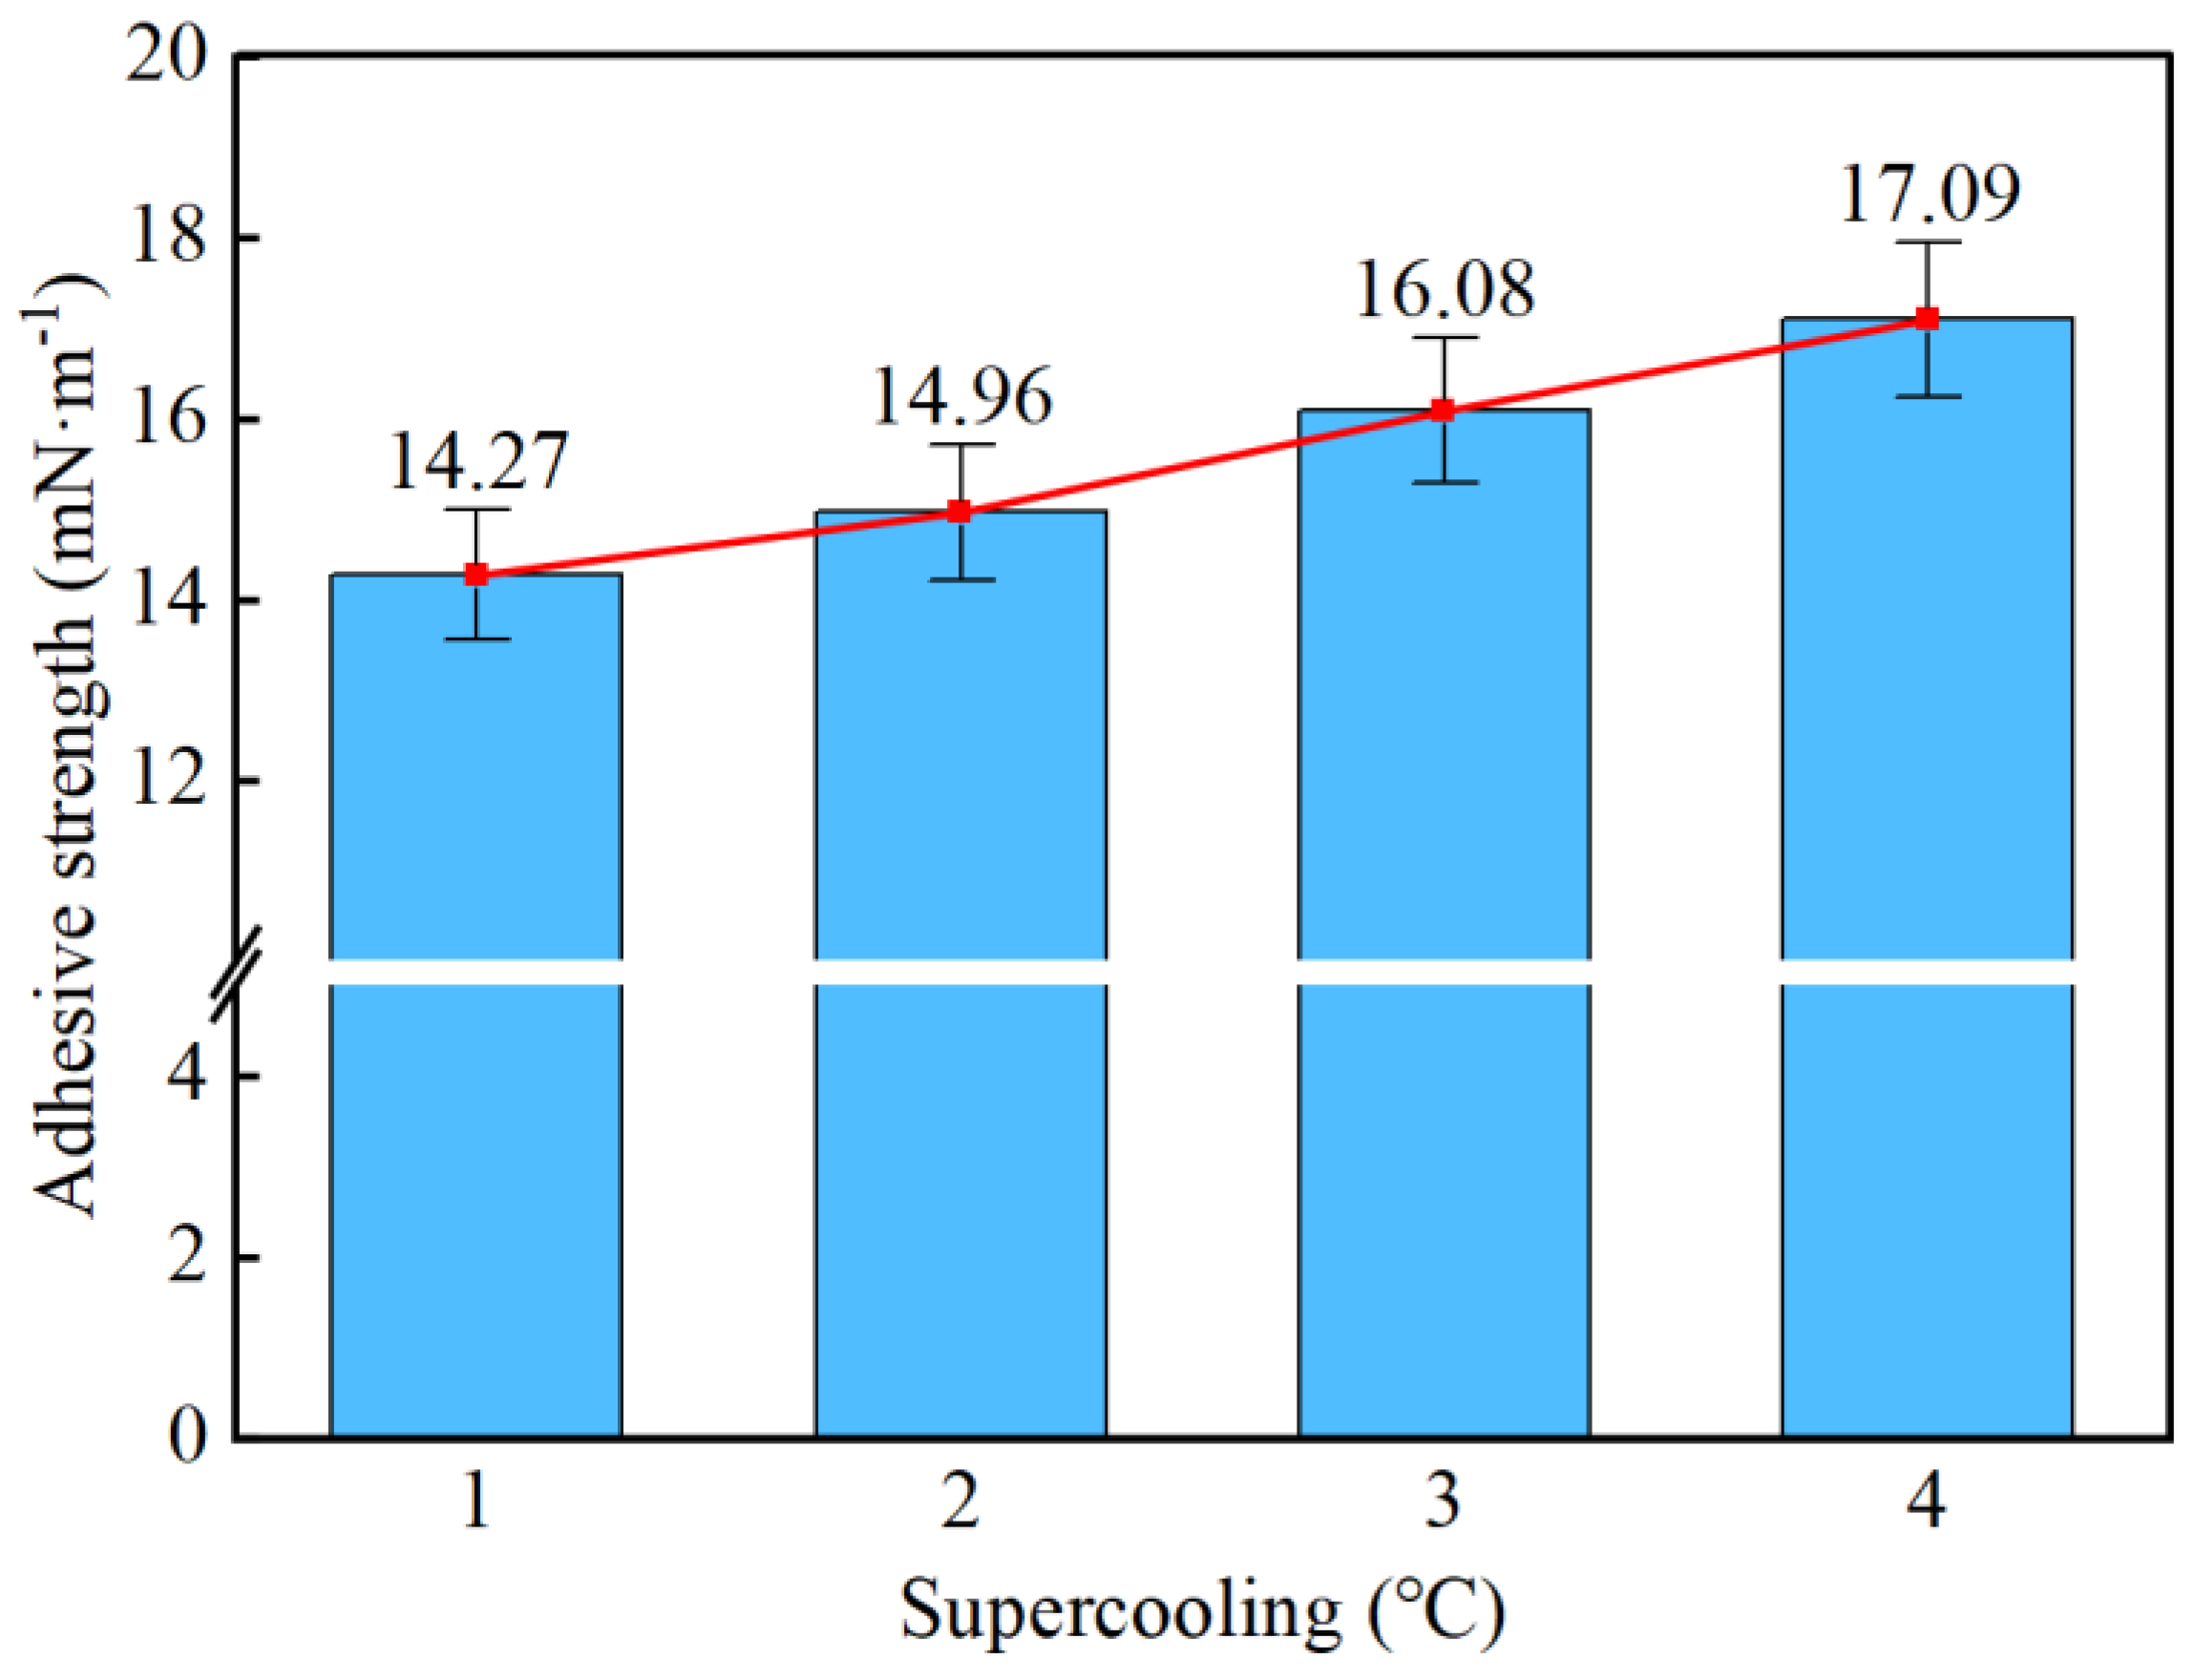
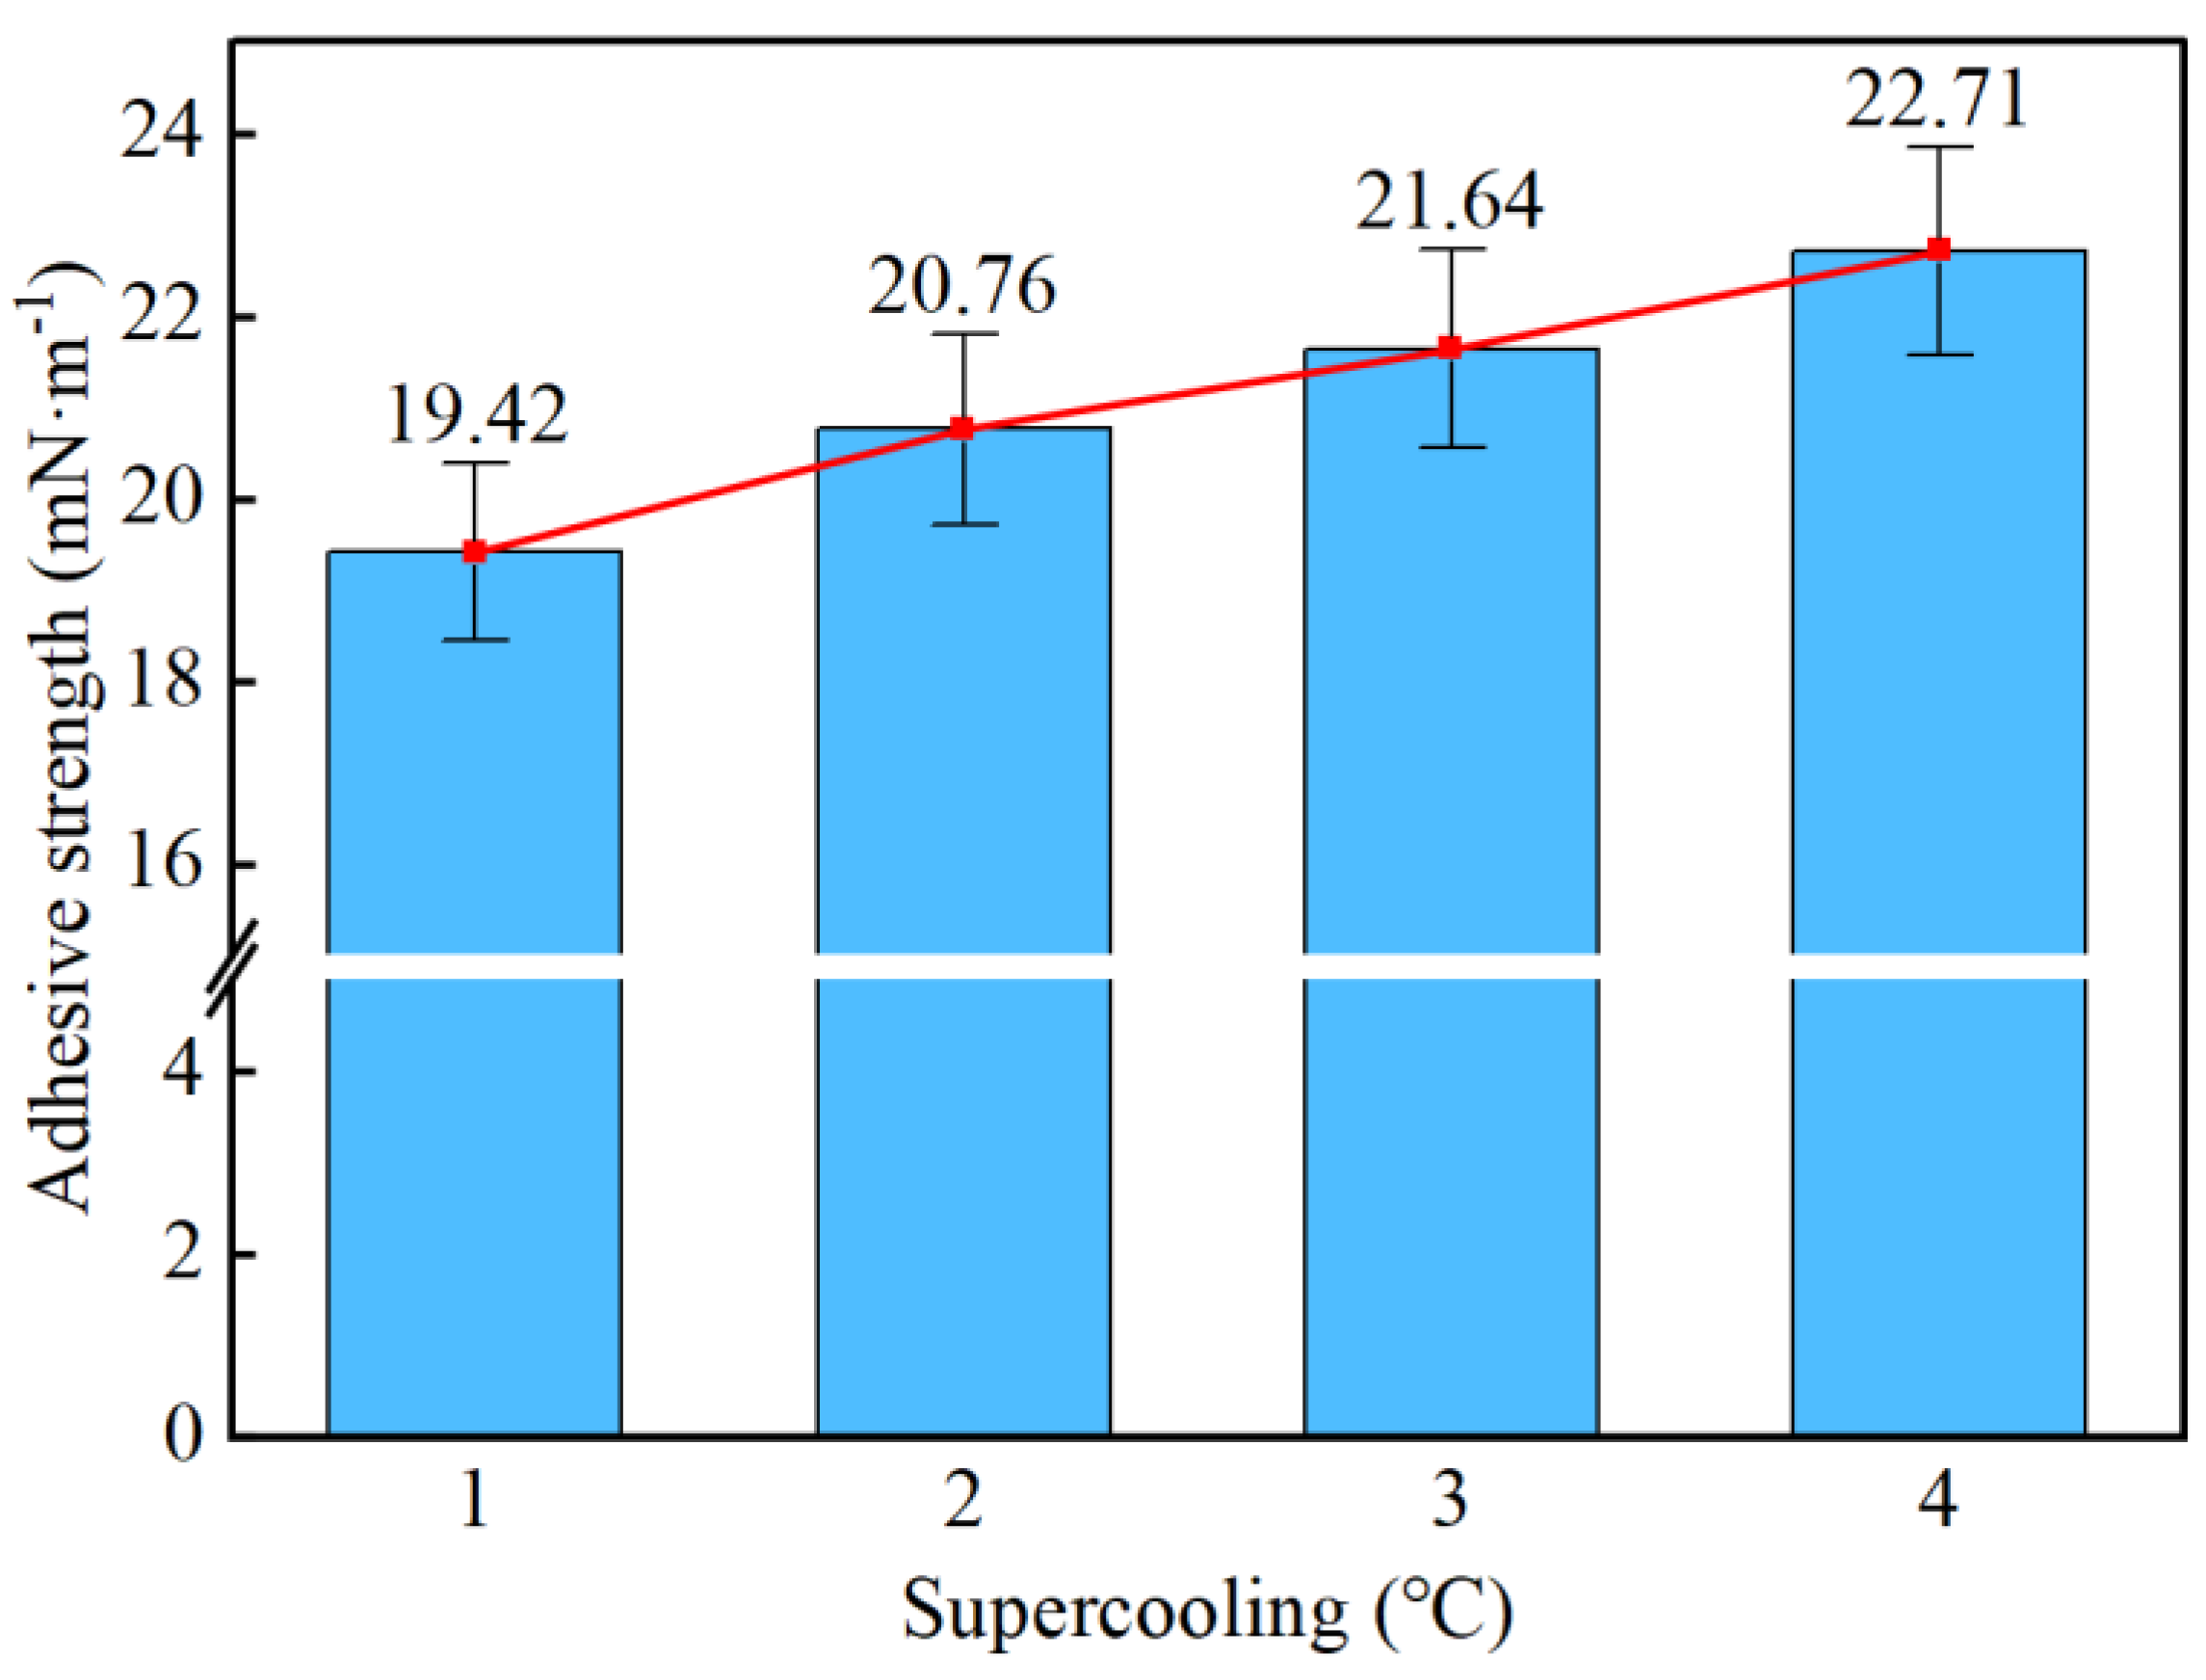
Taking a subcooling temperature of 1 °C as an example, the average adhesion force between hydrate particles and the uncoated conventional substrate is 26.14 mN·m−1. The average adhesion force between hydrate particles and the PTFE/PPS composite-coated substrate is 8.36 mN·m−1, between hydrate particles and the epoxy resin E-51-coated substrate is 14.27 mN·m−1, and between hydrate particles and the polyurea-coated substrate is 19.42 mN·m−1. This indicates that the PTFE/PPS composite coating has an advantage in reducing the adhesion force of hydrate particles under low temperatures and different subcooling conditions. Choosing the PTFE/PPS composite coating as the wall coating is a preferable option for preventing hydrate accumulation. Additionally, the epoxy resin E-51 coating and polyurea coating also demonstrate certain anti-adhesion performance characteristics, but their performance is slightly inferior compared to the PTFE/PPS composite coating.
(4)
The epoxy resin E-51 coating and polyurea coating also exhibit some resistance to hydrate adhesion, especially under lower subcooling conditions. Although their performance is relatively inferior to the PTFE/PPS composite coating, they still have the ability to reduce the adhesion force of hydrate particles in certain specific application scenarios.

Author Contributions

X.S.: Conceptualization, Methodology, Writing—Original Draft, Validation; Y.G.: Investigation; F.Y.: Formal Analysis; S.L.: Writing—Review and Editing. All authors have read and agreed to the published version of the manuscript.

Funding

The authors gratefully acknowledge the financial support of the Key R&D Plan of Shandong Province (2022CXGC020407), the National Natural Science Foundation of China (No. 52274022 and No. U21B2065), and the Fundamental Research Project of the Central Universities (22CX01003A).

Data Availability Statement

Data are contained within the article.

Conflicts of Interest

The authors declare no conflicts of interest.

References

  1. Sojoudi, H.; Walsh, M.R.; Gleason, K.K.; McKinley, G.H. Designing Durable Vapor-Deposited Surfaces for Reduced Hydrate Adhesion. Adv. Mater. Interfaces 2015, 2, 1500003. [Google Scholar] [CrossRef]
  2. Smith, J.D.; Meuler, A.J.; Bralower, H.L.; Venkatesan, R.; Subramanian, S.; Cohen, R.E.; McKinley, G.H.; Varanasi, K.K. Hydrate-phobic surfaces: Fundamental studies in clathrate hydrate adhesion reduction. Phys. Chem. Chem. Phys. 2012, 14, 6013–6020. [Google Scholar] [CrossRef]
  3. Sojoudi, H.; Walsh, M.R.; Gleason, K.K.; McKinley, G.H. Investigation into the Formation and Adhesion of Cyclopentane Hdyrates on Mechanically Robust Vapor-Deposited Polymeric Coatings. Langmuir 2015, 31, 6186–6196. [Google Scholar] [CrossRef]
  4. Aspenes, G.; Dieker, L.E.; Aman, Z.M.; Høiland, S.; Sum, A.K.; Koh, C.A.; Sloan, E.D. Adhesion force between cyclopentane hydrates and solid surface materials. J. Colloid Interface Sci. 2009, 343, 529–536. [Google Scholar] [CrossRef]
  5. Aman, Z.M.; Leith, W.J.; Grasso, G.A.; Sloan, E.D.; Sum, A.K.; Koh, C.A. Adhesion force between cyclopentane hydrate and mineral surfaces. Langmuir 2013, 29, 15551–15557. [Google Scholar] [CrossRef]
  6. Aman, Z.M.; Sloan, E.D.; Sum, A.K.; Koh, C.A. Adhesion force interactions between cyclopentane hydrate and physically and chemically modified surfaces. Phys. Chem. Chem. Phys. 2014, 16, 25121–25128. [Google Scholar] [CrossRef]
  7. Das, A.; Farnham, T.A.; Bengaluru Subramanyam, S.; Varanasi, K.K. Designing Ultra-Low Hydrate Adhesion Surfaces by Interfacial Spreading of Water-Immiscible Barrier Films. ACS Appl. Mater. Interfaces 2017, 9, 21496–21502. [Google Scholar] [CrossRef]
  8. Sojoudi, H.; Arabnejad, H.; Raiyan, A.; Shirazi, S.A.; McKinley, G.H.; Gleason, K.K. Scalable and durable polymeric icephobic and hydrate-phobic coatings. Soft Matter 2018, 14, 3443–3454. [Google Scholar] [CrossRef]
  9. Filarsky, F.; Schmuck, C.; Schultz, H.J. Development of a Surface-Active Coating for Promoted Gas Hydrate Formation. Chem. Ing. Tech. 2019, 91, 85–91. [Google Scholar] [CrossRef]
  10. Wang, S.; Fan, S.; Song, Y.; Lang, X.; Wang, Y.; Li, G.; Chen, J. The effect of NaCl concentration and corrosion on cohesion/adhesion forces of structure-II hydrate particles. Sci. Sin. Phys. Mech. Astron. 2018, 49, 034608. [Google Scholar] [CrossRef]
  11. Guo, R.; Guo, X.; Pei, H.; Liu, W.; Guo, W.; Fang, M.; Liu, N.; Mo, Z. Polyphenylene sulfide hydrophobic composite coating with high stability, corrosion resistance and antifouling performance. Surf. Interfaces 2021, 27, 101577. [Google Scholar] [CrossRef]
  12. Liu, C.; Wang, Z.; Tian, J.; Yan, C.; Li, M. Fundamental investigation of the adhesion strength between cyclopentane hydrate deposition and solid surface materials. Chem. Eng. Sci. 2020, 217, 115524. [Google Scholar]
  13. Zhao, J.; Liu, Y.; Yang, L.; Zhang, L.; Song, Y. Organics-coated nanoclays further promote hydrate formation kinetics. J. Phys. Chem. Lett. 2021, 12, 3464–3467. [Google Scholar] [CrossRef]
  14. Ma, R.; Wang, F.; Chang, Y.; Xiao, S.; English, N.J.; He, J.; Zhang, Z. Unraveling adhesion strength between gas hydrate and solid surfaces. Langmuir 2021, 37, 13873–13881. [Google Scholar] [CrossRef] [PubMed]
  15. Jamil, M.I.; Qian, T.; Ahmed, W.; Zhan, X.; Chen, F.; Cheng, D.; Zhang, Q. Durable Hydrate-phobic Coating with In Situ Self-Replenishing Hydrocarbon Barrier Films for Low Clathrate Hydrate Adhesion. Langmuir 2022, 38, 11621–11630. [Google Scholar] [CrossRef]
  16. Meuler, A.J.; Smith, J.D.; Varanasi, K.K.; Mabry, J.M.; McKinley, G.H.; Cohen, R.E. Relationships between water wettability and ice adhesion. ACS Appl. Mater. Interfaces 2010, 2, 3100–3110. [Google Scholar] [CrossRef] [PubMed]
  17. Smith, J.D. Hydrate-Phobic Surfaces. Master’s Thesis, Massachusetts Institute of Technology, Cambridge, MA, USA, 2011. [Google Scholar]
  18. Ning, L. Application research on inner coating of natural gas pipeline. Coal & Chemicals, 2021. Available online: http://www.mtyhg.com.cn/EN/10.19286/j.cnki.cci.2021.03.043 (accessed on 1 November 2023).
  19. Asante, B. Justification for Internal Coating of Natural Gas Pipelines. ASME 1995, 211, 1111–1130. [Google Scholar]
  20. Raymond, H. Crowe: Internal Coating of Gas Pipelines. OilGas J. 1959, 4, 233–251. [Google Scholar]
  21. Conradi, M.; Kocijan, A.; Zorko, M.; Jerman, I. Effect of silica/PVC composite coatings on steel-substrate corrosion protection. Prog. Org. Coat. 2012, 75, 392–397. [Google Scholar] [CrossRef]
  22. Wu, W.; Liu, T.; Zhou, Q. Preparation of nanocomposite inner coating for natural gas pipeline. Ferroelectrics 2021, 581, 287–301. [Google Scholar] [CrossRef]
  23. Xiao, W.; Shen, Z. Research progress of diamond-like carbon films for biomedical use. Int. J. Biomed. Eng. 2008, 31, 123–125. [Google Scholar]
  24. Al-Hadhrami, L.M.; Maslehuddin, M.; Ali, M.R. Chemical resistance and mechanical properties of glass fiber–reinforced plastic pipes for oil, gas, and power-plant applications. J. Compos. Constr. 2016, 20, 04015031. [Google Scholar] [CrossRef]
  25. Yang, F.; Feng, L.; Li, G.; Luo, H.; Zhai, Z. Performance experiment on preparation of composite SiO2/EP wear-resistant coating through electrostatic spraying. Oil Gas Storage Transp. 2016, 1, 63–67. [Google Scholar]
  26. Lin, Z.; Qin, Y.; Huang, X. Research and Application of Flow Coat for Natural Gas Pipeline. Corros. Prot. -Nanchang 2003, 24, 206–209. [Google Scholar]
  27. ISO 2409:2007; Paints and Varnishes—Cross-Cut Test. International Organization for Standardization: Geneva, Switzerland, 2007.
  28. Dong, S.; Firoozabadi, A. Hydrate anti-agglomeration and synergy effect in normal octane at varying water cuts and salt concentrations. J. Chem. Thermodyn. 2018, 117, 214–222. [Google Scholar] [CrossRef]
Figure 1. Schematic calculation of the adhesion of hydrate particles to a substrate.
Jmse 12 00232 g001
Figure 2. High-pressure visualization microscopic force test set.
Jmse 12 00232 g002
Figure 3. Cross-cut tester.
Jmse 12 00232 g003
Figure 4. Optical contact angle measuring instrument.
Jmse 12 00232 g004
Figure 5. Schematic diagram for determining the coefficient of elasticity of glass fibers.
Jmse 12 00232 g005
Figure 6. Diagram of the microscopic process of hydrate-particle–wall adhesion measurement.
Jmse 12 00232 g006
Figure 7. Grid method diagram: (a) PTFE/PPS composite coating; (b) Epoxy resin E-51 coating; (c) Polyurea coating.
Jmse 12 00232 g007
Figure 8. Uncoated substrate contact angle measurement chart.
Jmse 12 00232 g008
Figure 9. Measured contact angle of the PTFE/PPS composite coating substrate.
Jmse 12 00232 g009
Figure 10. Measured contact angle of the epoxy resin E-51 coating substrate.
Jmse 12 00232 g010
Figure 11. Measured contact angle of the polyurea coating substrate.
Jmse 12 00232 g011
Figure 12. Schematic representation of the adhesion between hydrate particles and different coating substrates at a subcooling of 1 °C.
Jmse 12 00232 g012
Figure 13. Schematic representation of the adhesion between hydrate particles and different coating substrates at a subcooling of 2 °C.
Jmse 12 00232 g013
Figure 14. Schematic representation of the adhesion between hydrate particles and different coating substrates at a subcooling of 3 °C.
Jmse 12 00232 g014
Figure 15. Schematic representation of the adhesion between hydrate particles and different coating substrates at a subcooling of 4 °C.
Jmse 12 00232 g015
Figure 16. Adhesion between hydrate particles and uncoated conventional substrates under different supercooling conditions.
Jmse 12 00232 g016
Figure 17. Adhesion between hydrate particles and PTFE/PPS-coated substrates under different subcooling conditions.
Jmse 12 00232 g017
Figure 18. Adhesion between hydrate particles and epoxy resin E-51-coated substrates under different supercooling conditions.
Jmse 12 00232 g018
Figure 19. Adhesion between hydrate particles and polyurea-coated substrates under different subcooling conditions.
Jmse 12 00232 g019
Table 1. Details of main parameters of the model.
NameModel Number
Microscopic force test system4700 m
Magnetic stirrerLC-DMS-PRONI
High-temperature drying ovenXMTA-600
Electronic multifunction ovenK-98-II
Electronic balancesYP 1002
Constant temperature water bath boxTMS8035-R30
Cross-cut testerQFH-A
Optical contact angle measuring instrumentCA-Series
Microscopic force test system4700 m
Table 2. Coating adhesion grade.
Coating TypeAdhesion Level
PTFE/PPS composite coating1
Epoxy resin E-51 coating0
Polyurea coating3
Table 3. Measured contact angles for different coating substrates.
Coating TypeGroup 1Group 2Group 3Group 4Average Contact Angle (°)
Uncoated58.7355.6659.0456.8257.56
PTFE/PPS103.97106.88102.95108.74105.63
Epoxy resin E-5169.4067.3367.5966.6867.75
Polyurea65.8465.3765.5067.4366.04
Disclaimer/Publisher’s Note: The statements, opinions and data contained in all publications are solely those of the individual author(s) and contributor(s) and not of MDPI and/or the editor(s). MDPI and/or the editor(s) disclaim responsibility for any injury to people or property resulting from any ideas, methods, instructions or products referred to in the content.

