Article

Chronology and Sedimentary Processes in the Western Ross Sea, Antarctica since the Last Glacial Period

1
State Key Laboratory of Lithospheric Evolution, Institute of Geology and Geophysics, Chinese Academy of Sciences, Beijing 100029, China
2
College of Earth and Planetary Sciences, University of Chinese Academy of Sciences, Beijing 100029, China
3
Key Laboratory of Submarine Geosciences & Second Institute of Oceanography, Ministry of Natural Resources, Hangzhou 310012, China
4
Key Laboratory of Marine Resources, Ministry of Nature Resources, Guangzhou Marine Geological Survey, China Geological Survey, Guangzhou 510075, China
5
State Key Laboratory of Marine Geology, Tongji University, Shanghai 200092, China
6
Key Laboratory of Polar Geology and Marine Mineral Resources (China University of Geosciences, Beijing), Ministry of Education, Beijing 100083, China
7
Key Laboratory of Cenozoic and Environment, Institute of Geology and Geophysics, Chinese Academy of Sciences, Beijing 100029, China
*
Authors to whom correspondence should be addressed.
J. Mar. Sci. Eng. 2024, 12(2), 254; https://doi.org/10.3390/jmse12020254
Submission received: 27 December 2023 / Revised: 26 January 2024 / Accepted: 29 January 2024 / Published: 31 January 2024
(This article belongs to the Section Geological Oceanography)

Abstract

:
The stability of contemporary ice shelves is under threat due to global warming, and the geological records in the Ross Sea offer such an opportunity to test the linkage between them. However, the absence of calcareous microfossils in the sediments of the Ross Sea results in uncertainties in establishing a precise chronology for studies. Hence, three sediment cores were collected and studied in terms of radiocarbon dating, magnetic susceptibility, and sediment grain size to reconstruct the environmental processes in the Ross Sea since the last glacial period. The main results are as follows: (1) two grain-size components were identified for the studied cores, which can be correlated to ice-shelf and sea-ice transport, respectively; (2) due to old-carbon contamination and an inconsistent carbon reservoir, the radiocarbon dates were generally underestimated, and as an alternative, changes in magnetic susceptibility of the studied cores can be tuned to the ice-core records to establish a reliable age–depth model and; (3) integrating sediment grain-size changes and comparisons with other paleoenvironmental proxies in the Antarctic, a process from a sub-ice sheet in the last glacial period to a sub-ice shelf in the glacial maximum, and, finally, to a glaciomarine state since the last deglacial period was identified in the western Ross Sea. Integrating these findings, the warming processes in the Antarctic were highlighted in the retreat processes of the Ross Ice Shelf in the past.

1. Introduction

Climatic changes in the Southern Ocean and Antarctica are critical in Earth’s climate evolution [1,2,3,4,5,6] due to their unique geographical location, environmental processes, and climate characteristics [7,8,9]. The Ross Sea is the second largest bay in the Southern Ocean (72–77° S, 160° E–160° W), and studies on sediments in this key region have attracted great attention in the past [10,11,12,13,14], such as sedimentary processes, ice-shelf dynamics, sea-ice variation, and oceanic currents [15,16,17,18,19,20,21]. For instance, integrating geophysical surveys and multiple cores in the Ross Sea, Bart et al. [22] inferred that the collapse of the Ross Ice Shelf occurred at 12.3 ± 0.2 ka, followed by a retreat of the grounding line at 11.5 ± 0.3 ka. By examining grain size, diatoms, silicon flagellates, and foraminifera, it was determined that the central Ross Sea was primarily influenced by calving the front of the ice shelf during 24–17 ka [23].
The use of sediment particle size parameters to estimate changes In sedimentary environments is limited and often yields multiple solutions, making it challenging to accurately determine the complex provenance, transport, and deposition processes of paleomarine environment changes. Employing varimax-rotated principal component analysis (VPCA) of the sediment grain size can address the limitations of only using grain-size parameters, at least partially, to understand paleoenvironmental evolution [24,25]. This method is crucial in exploring marine sediment sources and hydrodynamic environments. For example, by employing PCA, Zhao et al. [26] obtained three environmental-sensitive components and discussed glacial sedimentation and sedimentary dynamics in the Ross Sea.
Establishing stratigraphic chronology is of the utmost importance for palaeoceanographic research in the Antarctic [7,27]. However, due to the abundance of siliceous microfossils, primarily diatoms, and the scarcity of calcareous microfossils [28,29,30], as well as carbon reservoirs and contamination from old carbon [15,29], geochronological studies on the sediments in the Southern Ocean by radiocarbon dating are broadly limited [27,31]. As an alternative, a series of geochronological methods have been tested [18,32,33], such as environmental magnetism, 230Th, and 10Be. For example, tuning the magnetic susceptibility of the sediments to the Antarctic climate records can be employed to establish a precise age–depth model [31,34].
Thus, to test the application of various geochronological methods and to reveal the sedimentary processes in the Ross Sea since the last glacial period, we present a study on the cores ANT31-JB03, ANT31-JB06, and ANT32-RB16C. The age–depth model was developed based on radiocarbon dating and tuning magnetic susceptibility and verified by comparing the sedimentary dynamics of the three cores. Finally, the regional processes were reconstructed by combining sedimentary grain-size changes and comparisons to other paleoenvironmental proxies.

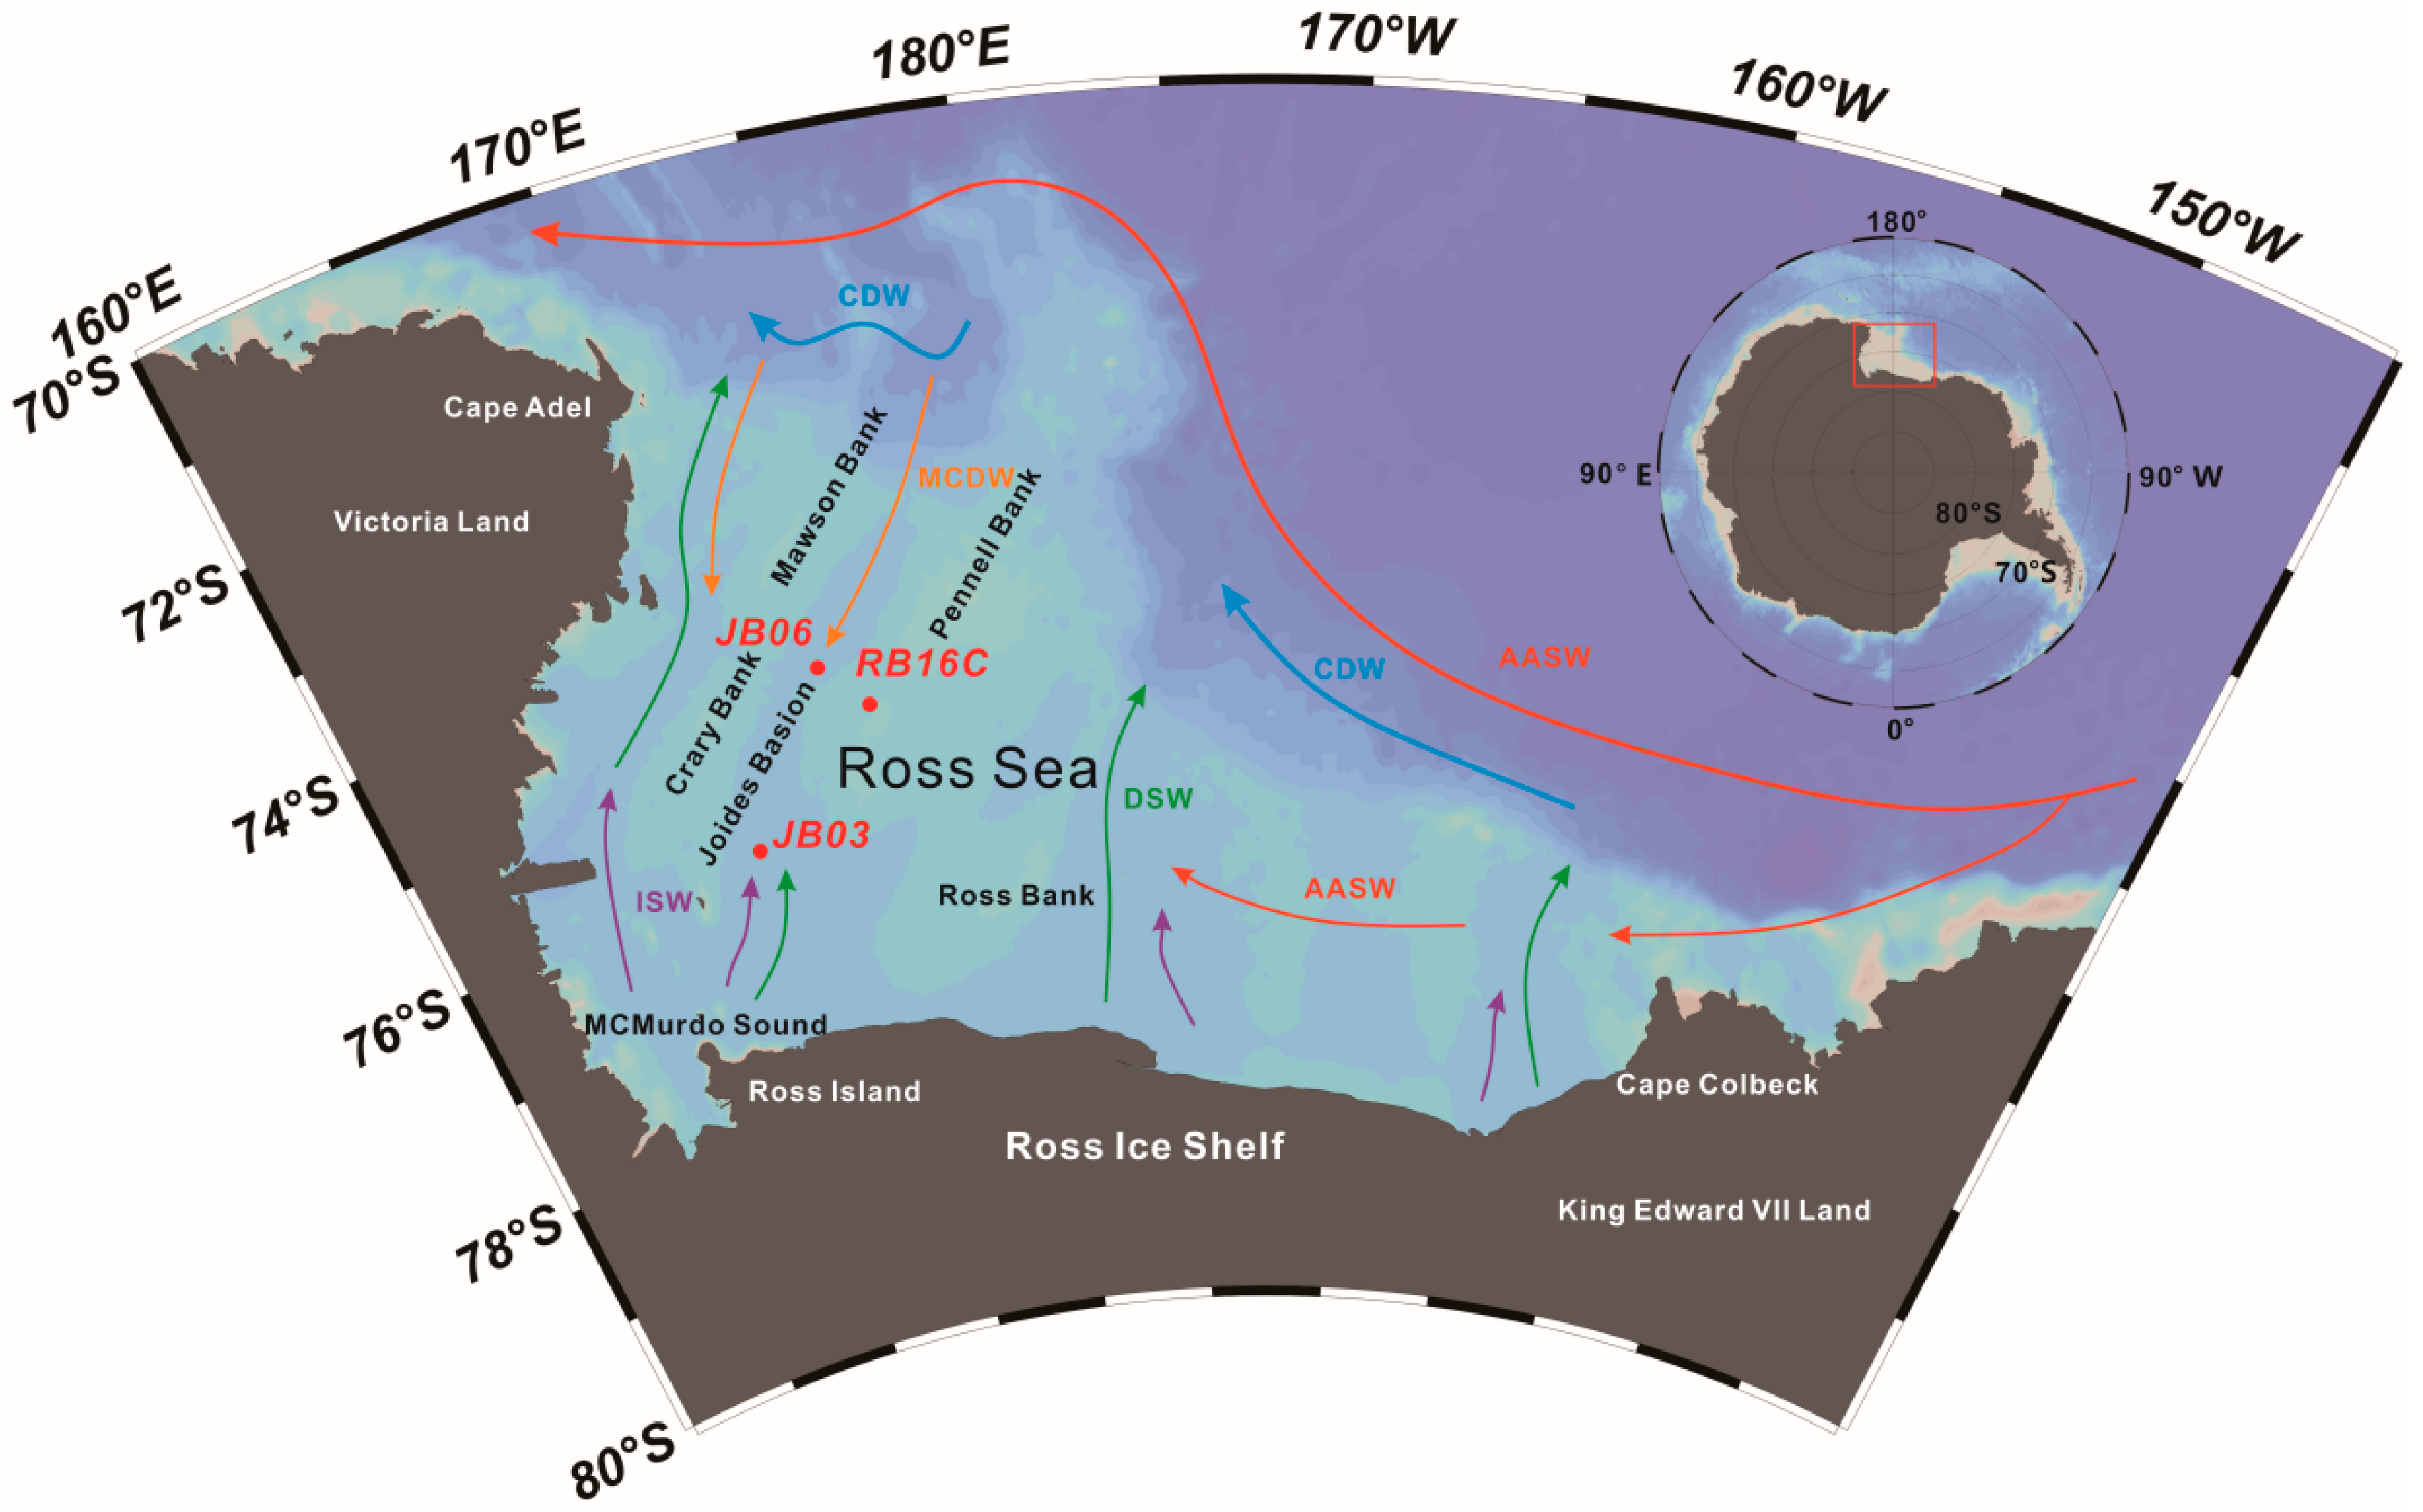
2. Regional Settings

The Ross Sea, situated in the Pacific sector (Figure 1), is the second-largest bay in the Southern Ocean (72° S–77° S, 160° E–160° W). The bay is bounded by Cape Adel and Victoria Land to the northwest, Cape Colbeck and King Edward VII Land to the east, and the Ross Ice Shelf and Ross Island to the south. The area is about 4.66 × 10⁵ km2, and the average water depth is ~530 m [35].
The Ross Ice Shelf, located in Antarctica, is the largest ice shelf globally, covering an approximate area of 5.2 × 10⁵ km2 and possessing an average thickness of 370 m [35]. The primary sources of ice for the Ross Ice Shelf are the East Antarctic Ice Sheet (EAIS) and the West Antarctic Ice Sheet (WAIS) [15], which have drainage areas of 1.6 × 10⁶ km2 and 7.5 × 10⁵ km2, respectively [37]. Since the last deglaciation, the Ross Ice Shelf has undergone a retreat due to the upwelling of warm Circumpolar Deep Water (CDW) [23,38].
There are a series of troughs to the north, serving as paleodrainage channels for the Antarctic Ice Sheet [37]. These troughs, which have been shaped by the Ross Ice Shelf, play a significant role in governing various processes on the continental shelf, including ocean circulation, sedimentation, biogeochemical, and biological processes [15]. The water masses present on the Ross Sea Shelf consist of Dense Shelf Water (DSW), Ice Shelf Water (ISW), Antarctic Surface Water (AASW), and Modified Circumpolar Deep Water (MCDW) [35,39]. MCDW undergoes mixing with other water masses during the upwelling of CDW onto the Ross Sea Shelf. It is relatively warm and has low salinity, exerting a significant influence on sea ice and biological productivity on the shelf [23]. The surface water on the Ross Sea shelf exhibits a clockwise circulation pattern, and the bottom water is capable of transporting fine particles in suspension [40].

3. Materials and Methods

3.1. Sediment Cores

The materials analyzed in this study were sourced from gravity cores ANT31-JB03 and ANT31-JB06, which were collected from the northwest shelf of the Ross Sea during the Chinese 31st Antarctic expedition by R/V “XUELONG” icebreaker in 2014–2015. Additionally, core ANT32-RB16C from the 32nd expedition in 2015–2016 was also included in the analysis (Table 1).
For core ANT31-JB03, the upper layer (0–56 cm) consisted of gray to olive green clay. From 56 to 77 cm, the middle layer contained gray–green medium sand, with a potential hiatus at 77 cm. The lower layer, from 77 to 117 cm, contained black–gray clay, with gravels at depths of 86–87 cm, 89–90 cm, and 99–100 cm. At the bottom (117–132 cm), gray clay silt was observed.
For core ANT32-RB16C, the top (0–6 cm) consisted of yellow–green clay with diatoms. From 6 to 66 cm, the upper layer comprised gray–green clay with sandy clay. The underlying layer, from 66 to 133 cm, was composed of black soft clay. Notably, gravels were present at 75–79 cm and 131–132 cm. The lower layer from 133 to 232 cm consisted of black compacted clay.
For core ANT31-JB06, the layers of 0–82 cm, 116–145 cm, 218–240 cm, and 277–279 cm contained olive gray clay. Dark gray clays with gravels were found at depths of 82–116 cm and 145–218 cm. For the rest part, the depths of 240–277 cm and 279–299 cm consisted of homogenous gray silt clay. The core has been well studied by Huang et al. [36], such as sediment grain size, magnetic susceptibility, and radiocarbon dating, which are included here for comparison. The utilization of the core ANT31-JB06 data referenced in this paper has received authorization from research group of Huang et al. [36].

3.2. Methods

3.2.1. AMS 14C Dating

A total of 26 samples from cores ANT31-JB03 and ANT32-RB16C were collected for radiocarbon dating at Beta Analytic Inc., Miami, FL, USA, using the acid insoluble organic (AIO) fractions in the sediments. All radiocarbon dates were converted and reported as calendar years before present with the Calib 8.20 software program with the Marine20 calibration dataset [41]. Additionally, AMS 14C data for ANT31-JB06 were obtained from the study conducted by Huang et al. [36].

3.2.2. Grain Size

Based on considerations of core length and the duration of the sedimentary records, we collected 132 samples and 202 samples from cores ANT31-JB03 and ANT32-RB16C, respectively, for grain-size analysis, with a sampling interval of 2 cm. The grain-size samples were pretreated with 10–20 mL of 30% H2O2 to remove organic matter, washed with 10% HCl to remove carbonates, rinsed with deionized water, and then placed in an ultrasonic vibrator for several minutes to facilitate dispersion. Grain-size distributions were measured using a Malvern Mastersizer 2000 grain-size analyzer in the Key Laboratory of Submarine Science, Second Institute of Oceanography, Ministry of Natural Resources. A total of 83 grain-size classes between 0.02 and 2000.00 μm were exported for further analysis, and the results were combined with previously published grain-size data of core ANT31-JB06 [36].
The grain-size distributions were then analyzed using the VPCA, and the common signal of deep-sea dynamics was extracted by a PCA on the studied cores for paleoenvironmental inferences, following the procedures reported in previous studies [24,42,43,44,45].

3.2.3. Magnetic Measurements

Magnetic samples were first dried in vacuum and placed in standard 8 cm3 cubic plastic boxes. All magnetic measurements were conducted in the laboratory at the Paleomagnetism and Geochronology Laboratory, Institute of Geology and Geophysics, Chinese Academy of Sciences. Magnetic susceptibility was measured using an AGICO MFK1–FA Multi-Frequency Kappabridge magnetic susceptibility meter. A total of 66 samples from core ANT31-JB03 and 116 samples from core ANT32-RB16C were measured, respectively, and the mass susceptibility χ (m3/kg) was determined by dividing the volume susceptibility κ (SI) by the samples’ density. Additionally, the magnetic susceptibility data of core ANT31-JB06 were from Huang et al. [36].
Measurements of anhysteretic remanent magnetization (ARM) and saturation isothermal remanent magnetization (SIRM) were conducted utilizing a 2G Enterprises SQUID magnetometer. ARM was acquired in a 0.05 mT direct current field, overlaid on a peak alternating field (AF) of 100 mT, and quantified as the susceptibility of ARM (χARM). SIRM was induced in a 1 T field. Hysteresis loops, isothermal remanent magnetization (IRM) acquisition curves, and first-order reversal curves (FORC) were measured using a Princeton Measurements Corporation MicroMag 3900 Vibrating Sample Magnetometer (VSM) at room temperature, with maximum fields of 0.5 T, 1 T, and 1.5 T, respectively. The saturation magnetization (Ms), saturation remanence (Mrs), and coercivity (Bc) were derived from hysteresis loops after adjusting for the slope at high fields. Subsequently, the SIRM was demagnetized in a stepwise back-field up to 1 T to determine the coercivity of remanence (Bcr).

4. Results

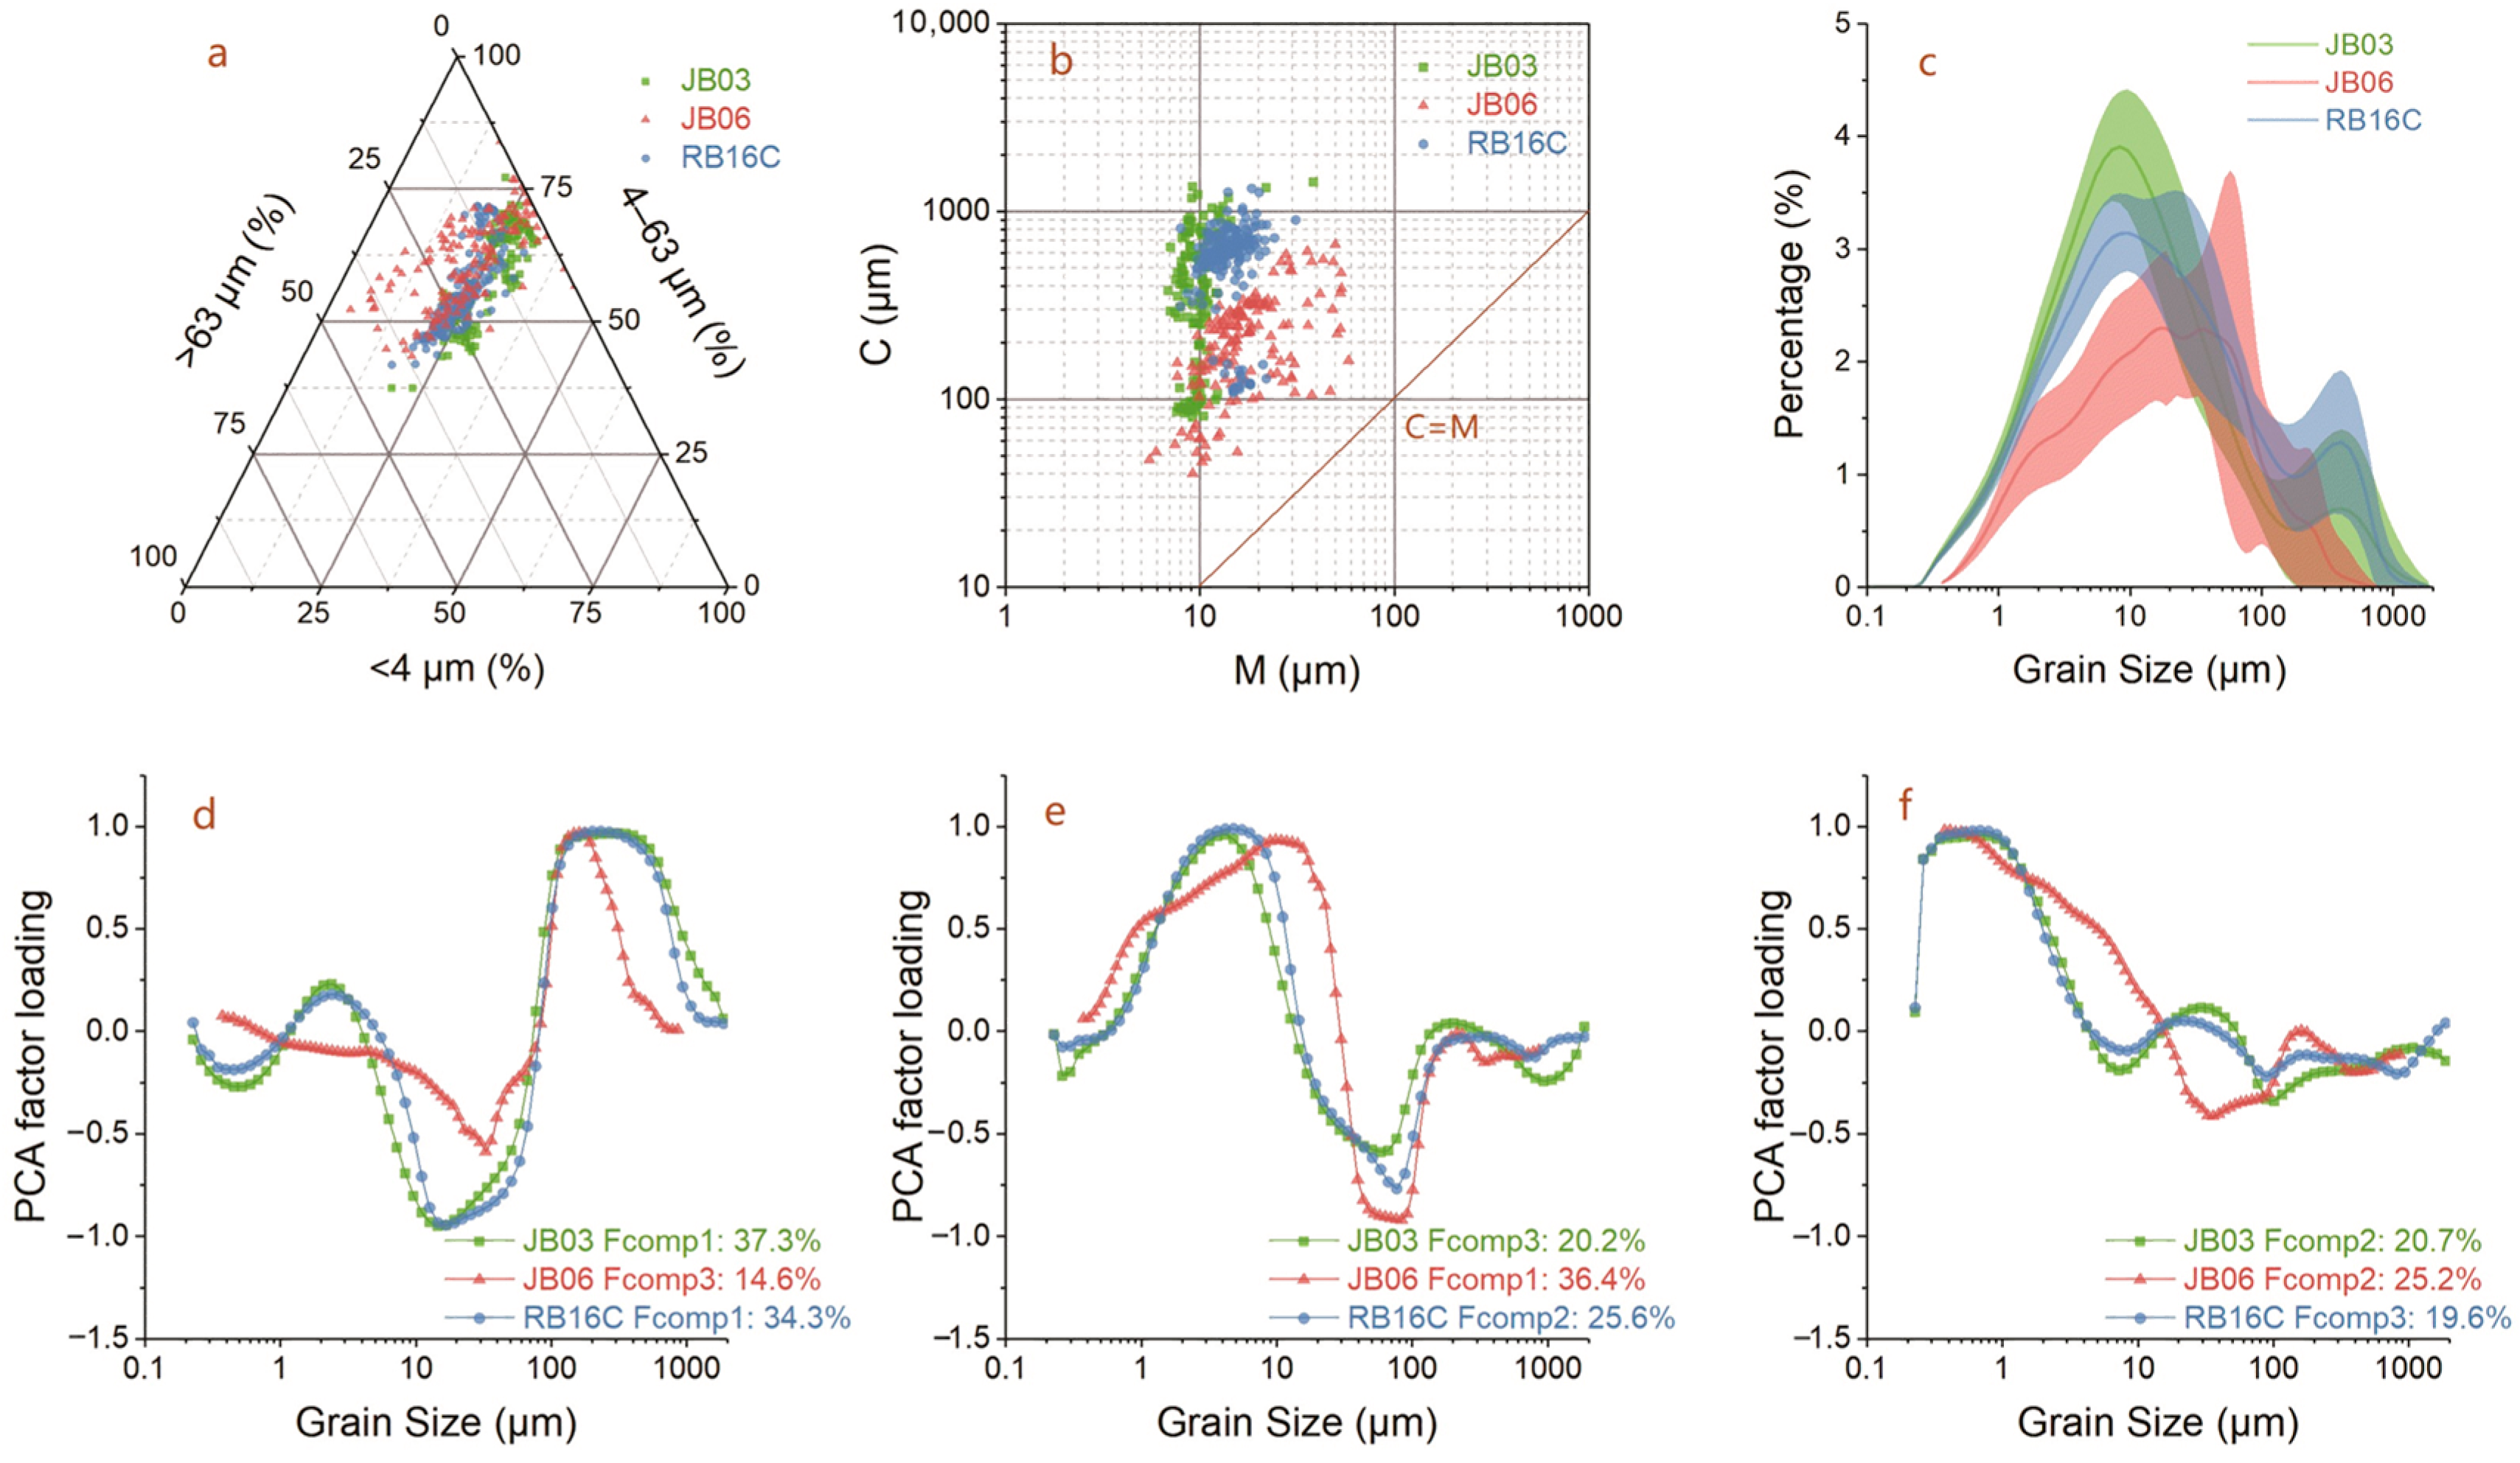
4.1. Grain-Size Properties

As shown in Figure 2, the sand content of the core ANT31-JB03 is 12.96% with a standard deviation of 9.06%. Within 132–91 cm, the sand content is high with fluctuations, while within 91–0 cm, it is relatively low. For the silt content, it is 60.23 ± 8.89% with an opposite trend to sand. The clay content is 26.81 ± 2.77%. The clay content is high and shows considerable variability within 132–68 cm. In the 68–0 cm layer, the clay content is low and displays minimal fluctuations. For the core ANT32-RB16C, the sand content is 21.82 ± 7.23%, descending to the top. The silt content is 54.89 ± 7.16% and, similarly, varies inversely. The clay content is relatively low, with an average value of 23.30 ± 2.38%.
The major and secondary peaks of the sediment grain size are located at 9.6 μm and 406.1 μm, respectively, in the cores ANT31-JB03 and ANT32-RB16C, while the main peak of the core ANT31-JB06 is relatively coarser at 36.3 μm (Figure 3c). In the C–M diagram proposed by Passega [46], in which C represents the particle size corresponding to the cumulative content of 1% and M represents the median size, the C–M relationship of the cores ANT31-JB03 and ANT32-RB16C do not exhibit a clear pattern (Figure 3b), while a weak correlation was observed in the core ANT31-JB06 (r = 0.39, p < 0.01).
The VPCA results of the grain-size data identify three components (Table 2), which account for 78.17%, 76.19%, and 79.52% of the total variance in the cores ANT31-JB03, ANT31-JB06, and ANT32-RB16C, respectively. Furthermore, the eigenvalues and variances of the fourth principal components exhibit a notable decrease (Table 2), thus excluding them for later analyses.
For PCA results (Figure 3d–f), three components, including (1) JB03 F1 (134.0–466.5 μm), JB06 F3 (121.8–213.2 μm), and RB16C F1 (116.6–535.9 μm), (2) JB03 F3 (3.2–4.8 μm), JB06 F1 (5.1–17.2 μm), and RB16C F2 (2.1–8.4 μm), and (3) JB03 F2 (0.3–1.0 μm), JB06 F2 (0.4–0.8 μm), and RB16C F3 (0.3–1.2 μm), observed in the cores ANT31-JB03, ANT31-JB06, and ANT32-RB16C, are comparable with each other and with the grain-size distribution. The coarsest components are correlated to ice-rafted debris (IRD), which originates from terrigenous debris carried by the ice shelf, icebergs, and large ice masses, while the medium components may be related to sea-ice transport [40,47]. However, for the finest component, it could be linked to the laser method [43,44,48,49], and thus excluded for later analysis.

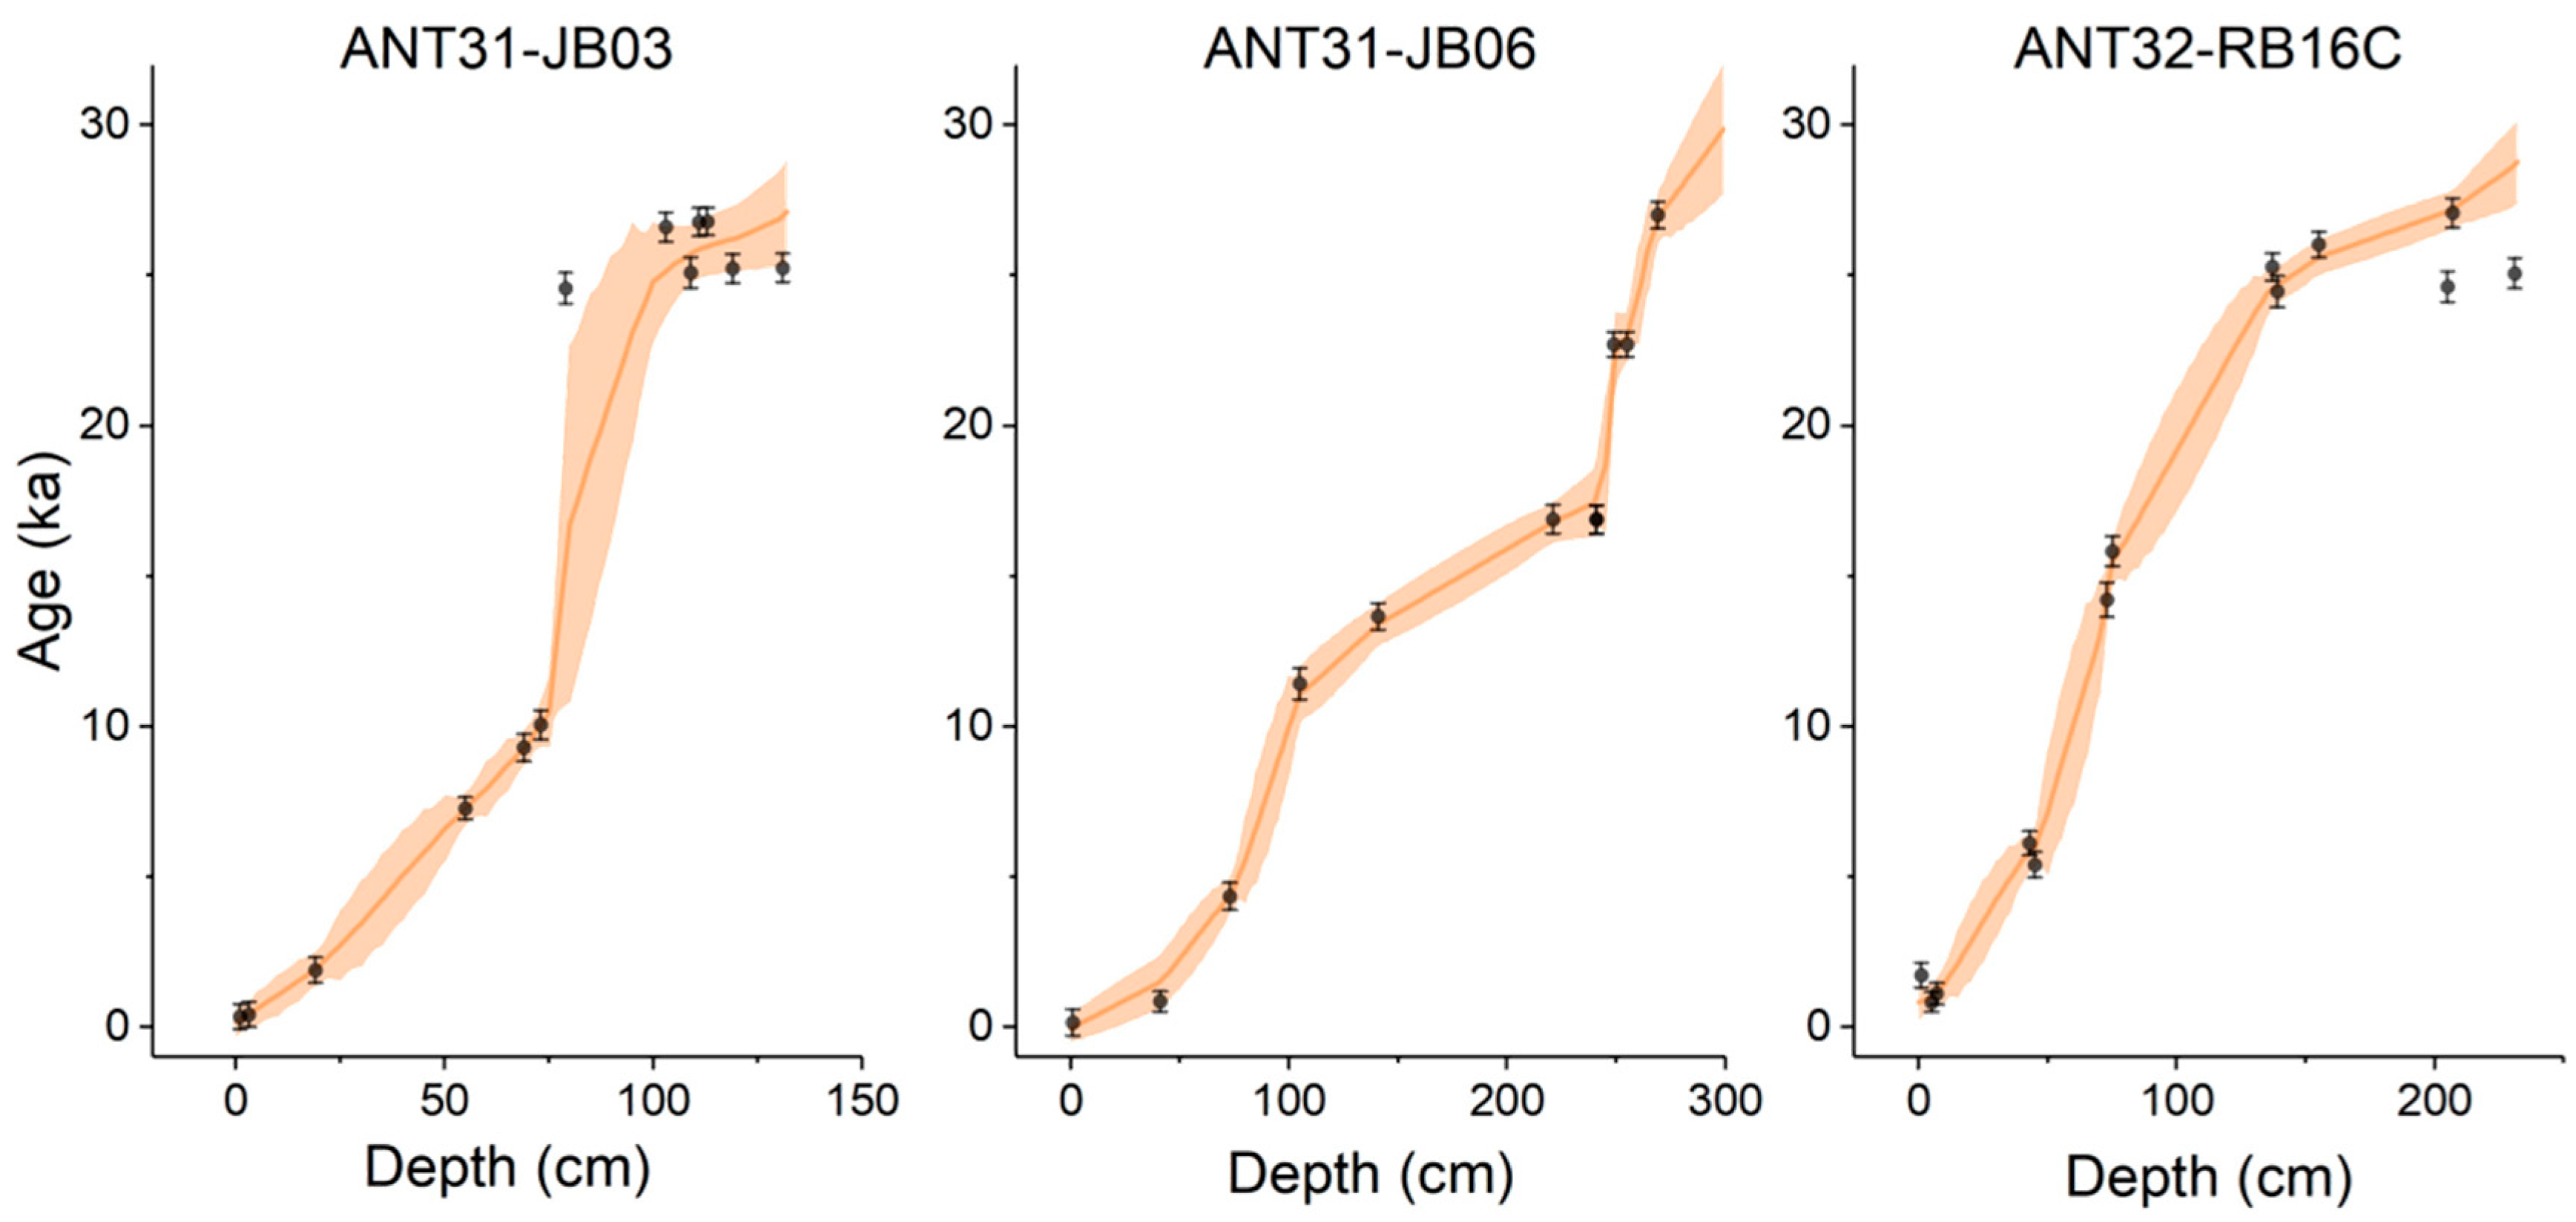
4.2. Radiocarbon Dates

The obtained radiocarbon dates are listed in Table 3. As shown, the Holocene dates increase stratigraphically in general, while for the dates prior to the Holocene, there is no such stratigraphic change observed. To calibrate the measured dates to the calendar ones, the reservoir age should first be determined for the organic matters. Licht et al. [30] conducted a linear regression analysis on the date difference between the organic and inorganic matters and found that the offset between them is consistent. Based on this, Huang et al. [36] calibrated the radiocarbon dates to the calendar ones by using the difference between different dating materials, which are 3713 and 668 years for organic matter and foraminiferal fossils, respectively. Taking these values as the regional reservoirs, the calendar dates of the three studied cores were obtained (Table 3). Based on these data, a preliminary age–depth model was established by the Bacon 2.5.8 program [50], in which Bayesian statistical techniques were employed to reduce the uncertainties (Figure 4).

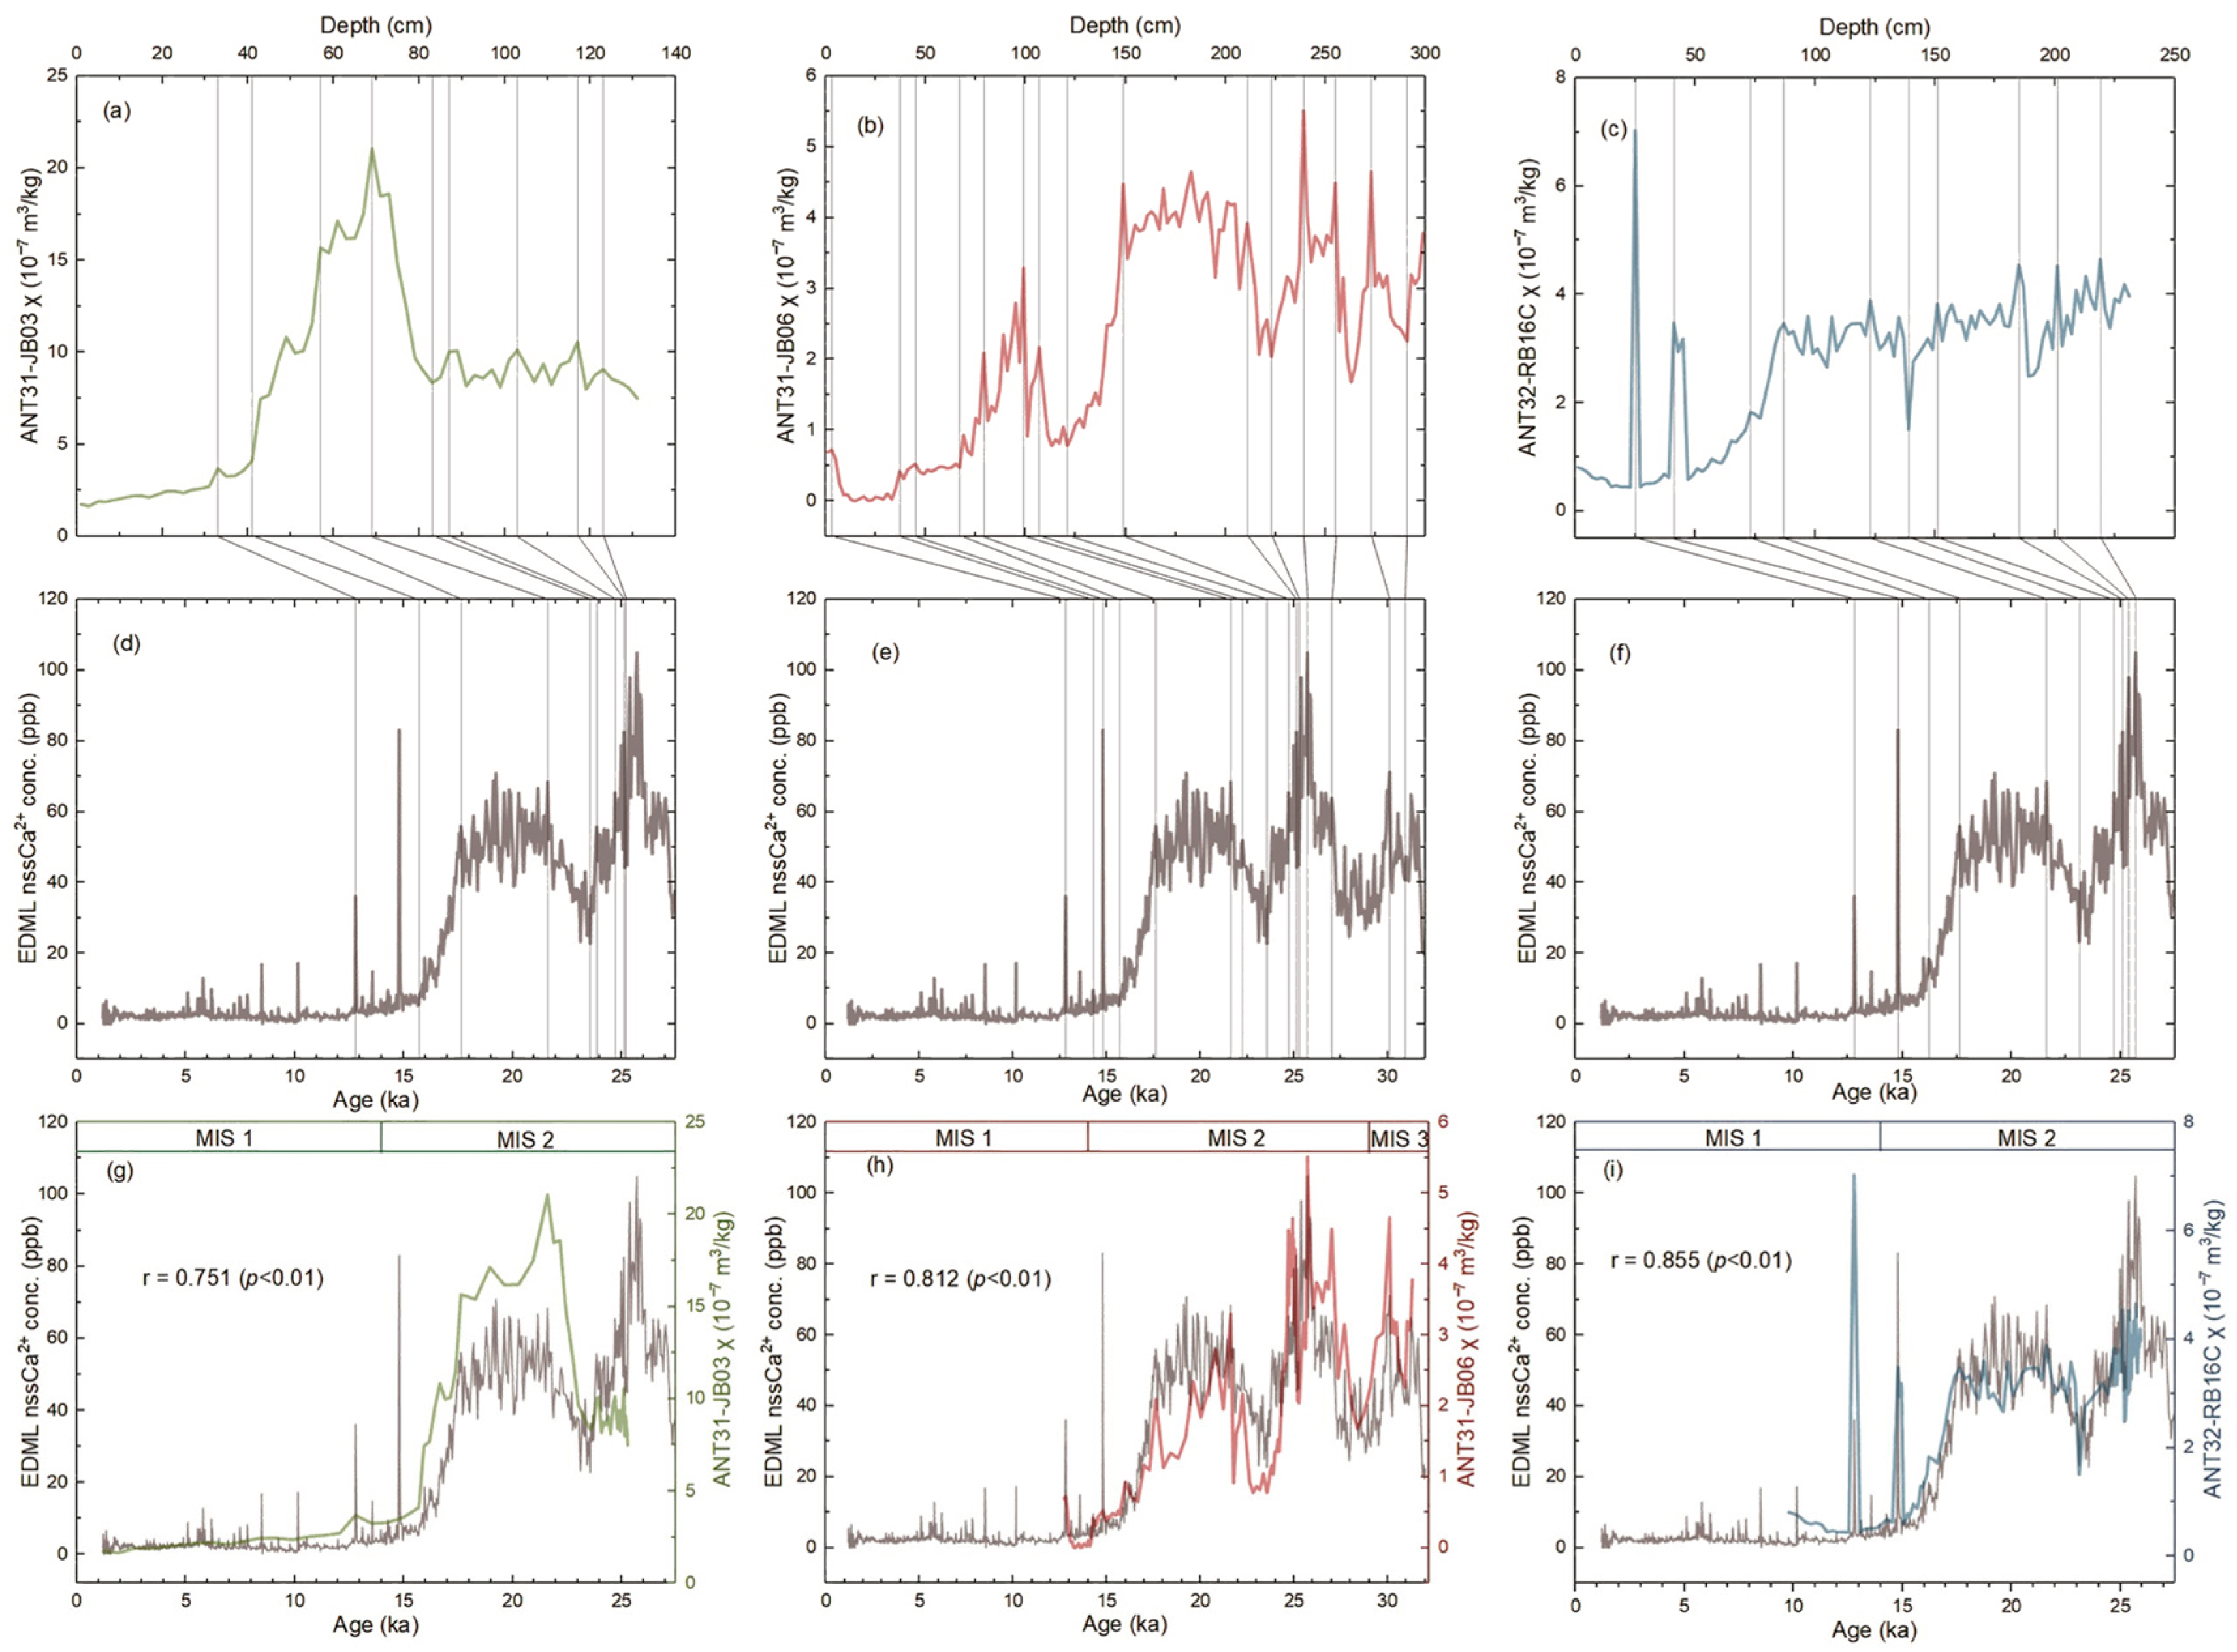
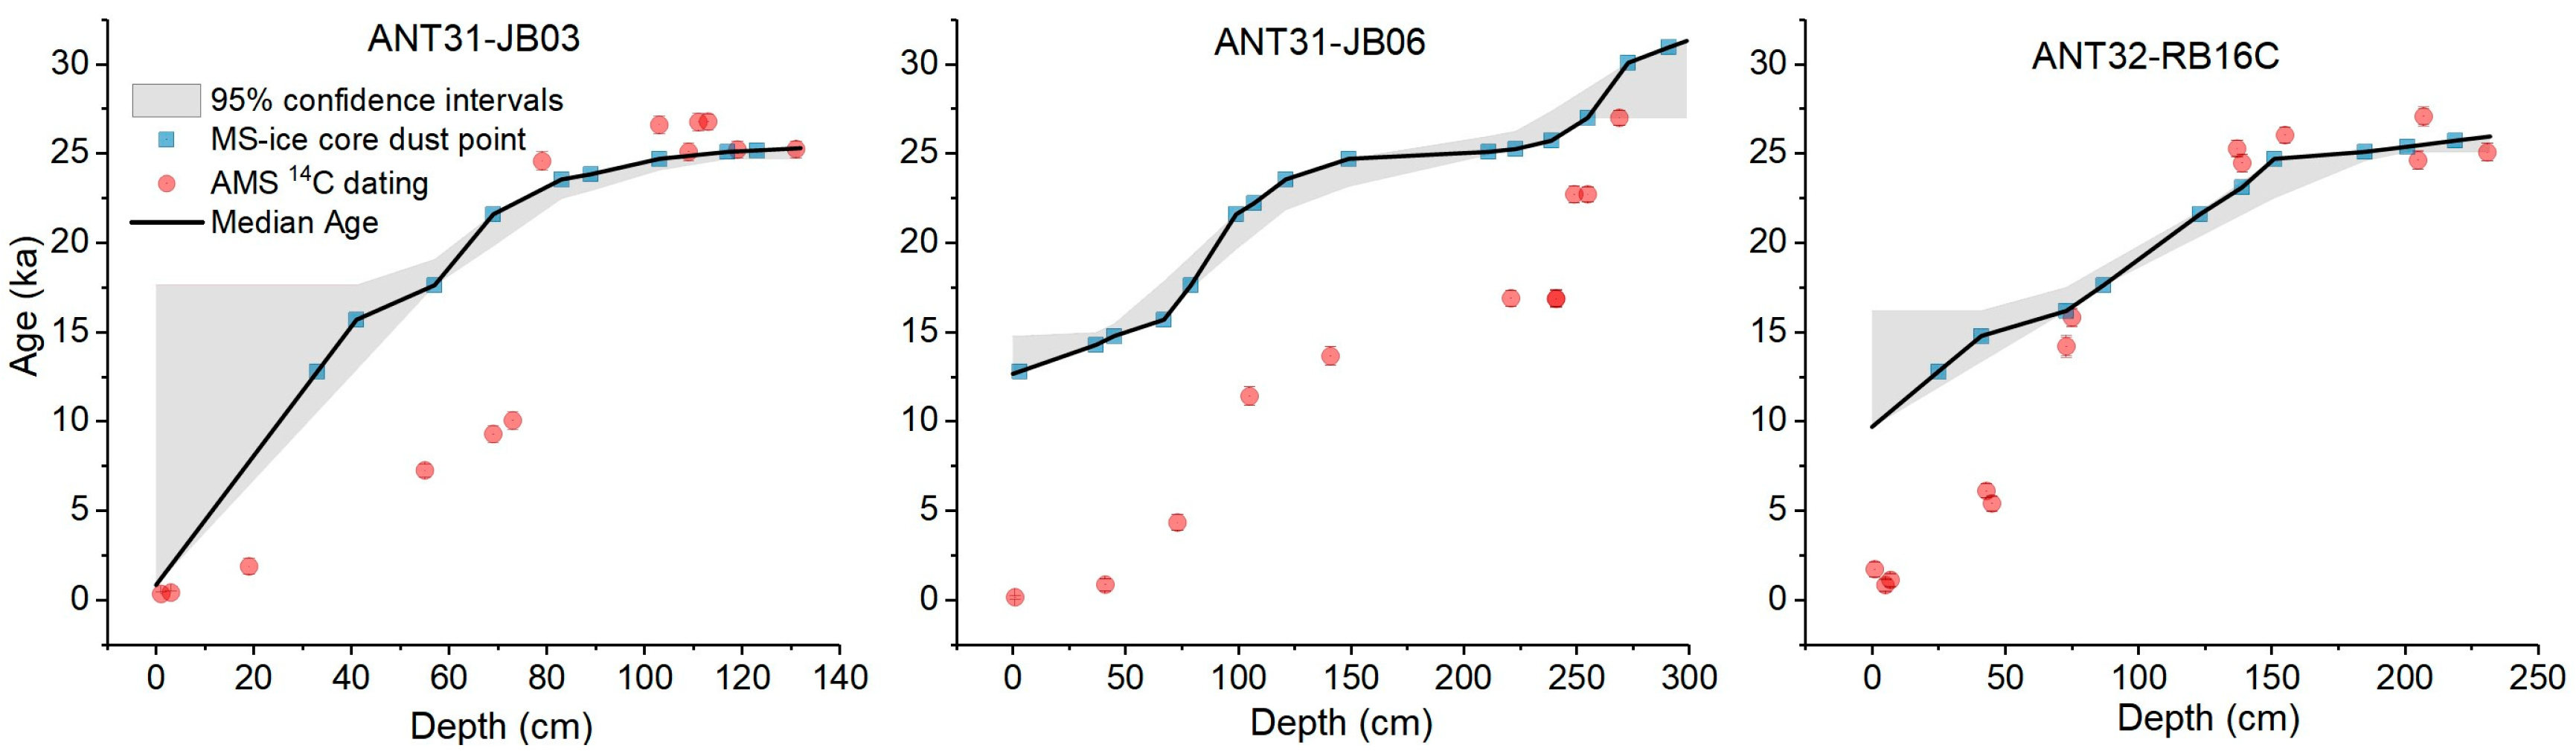
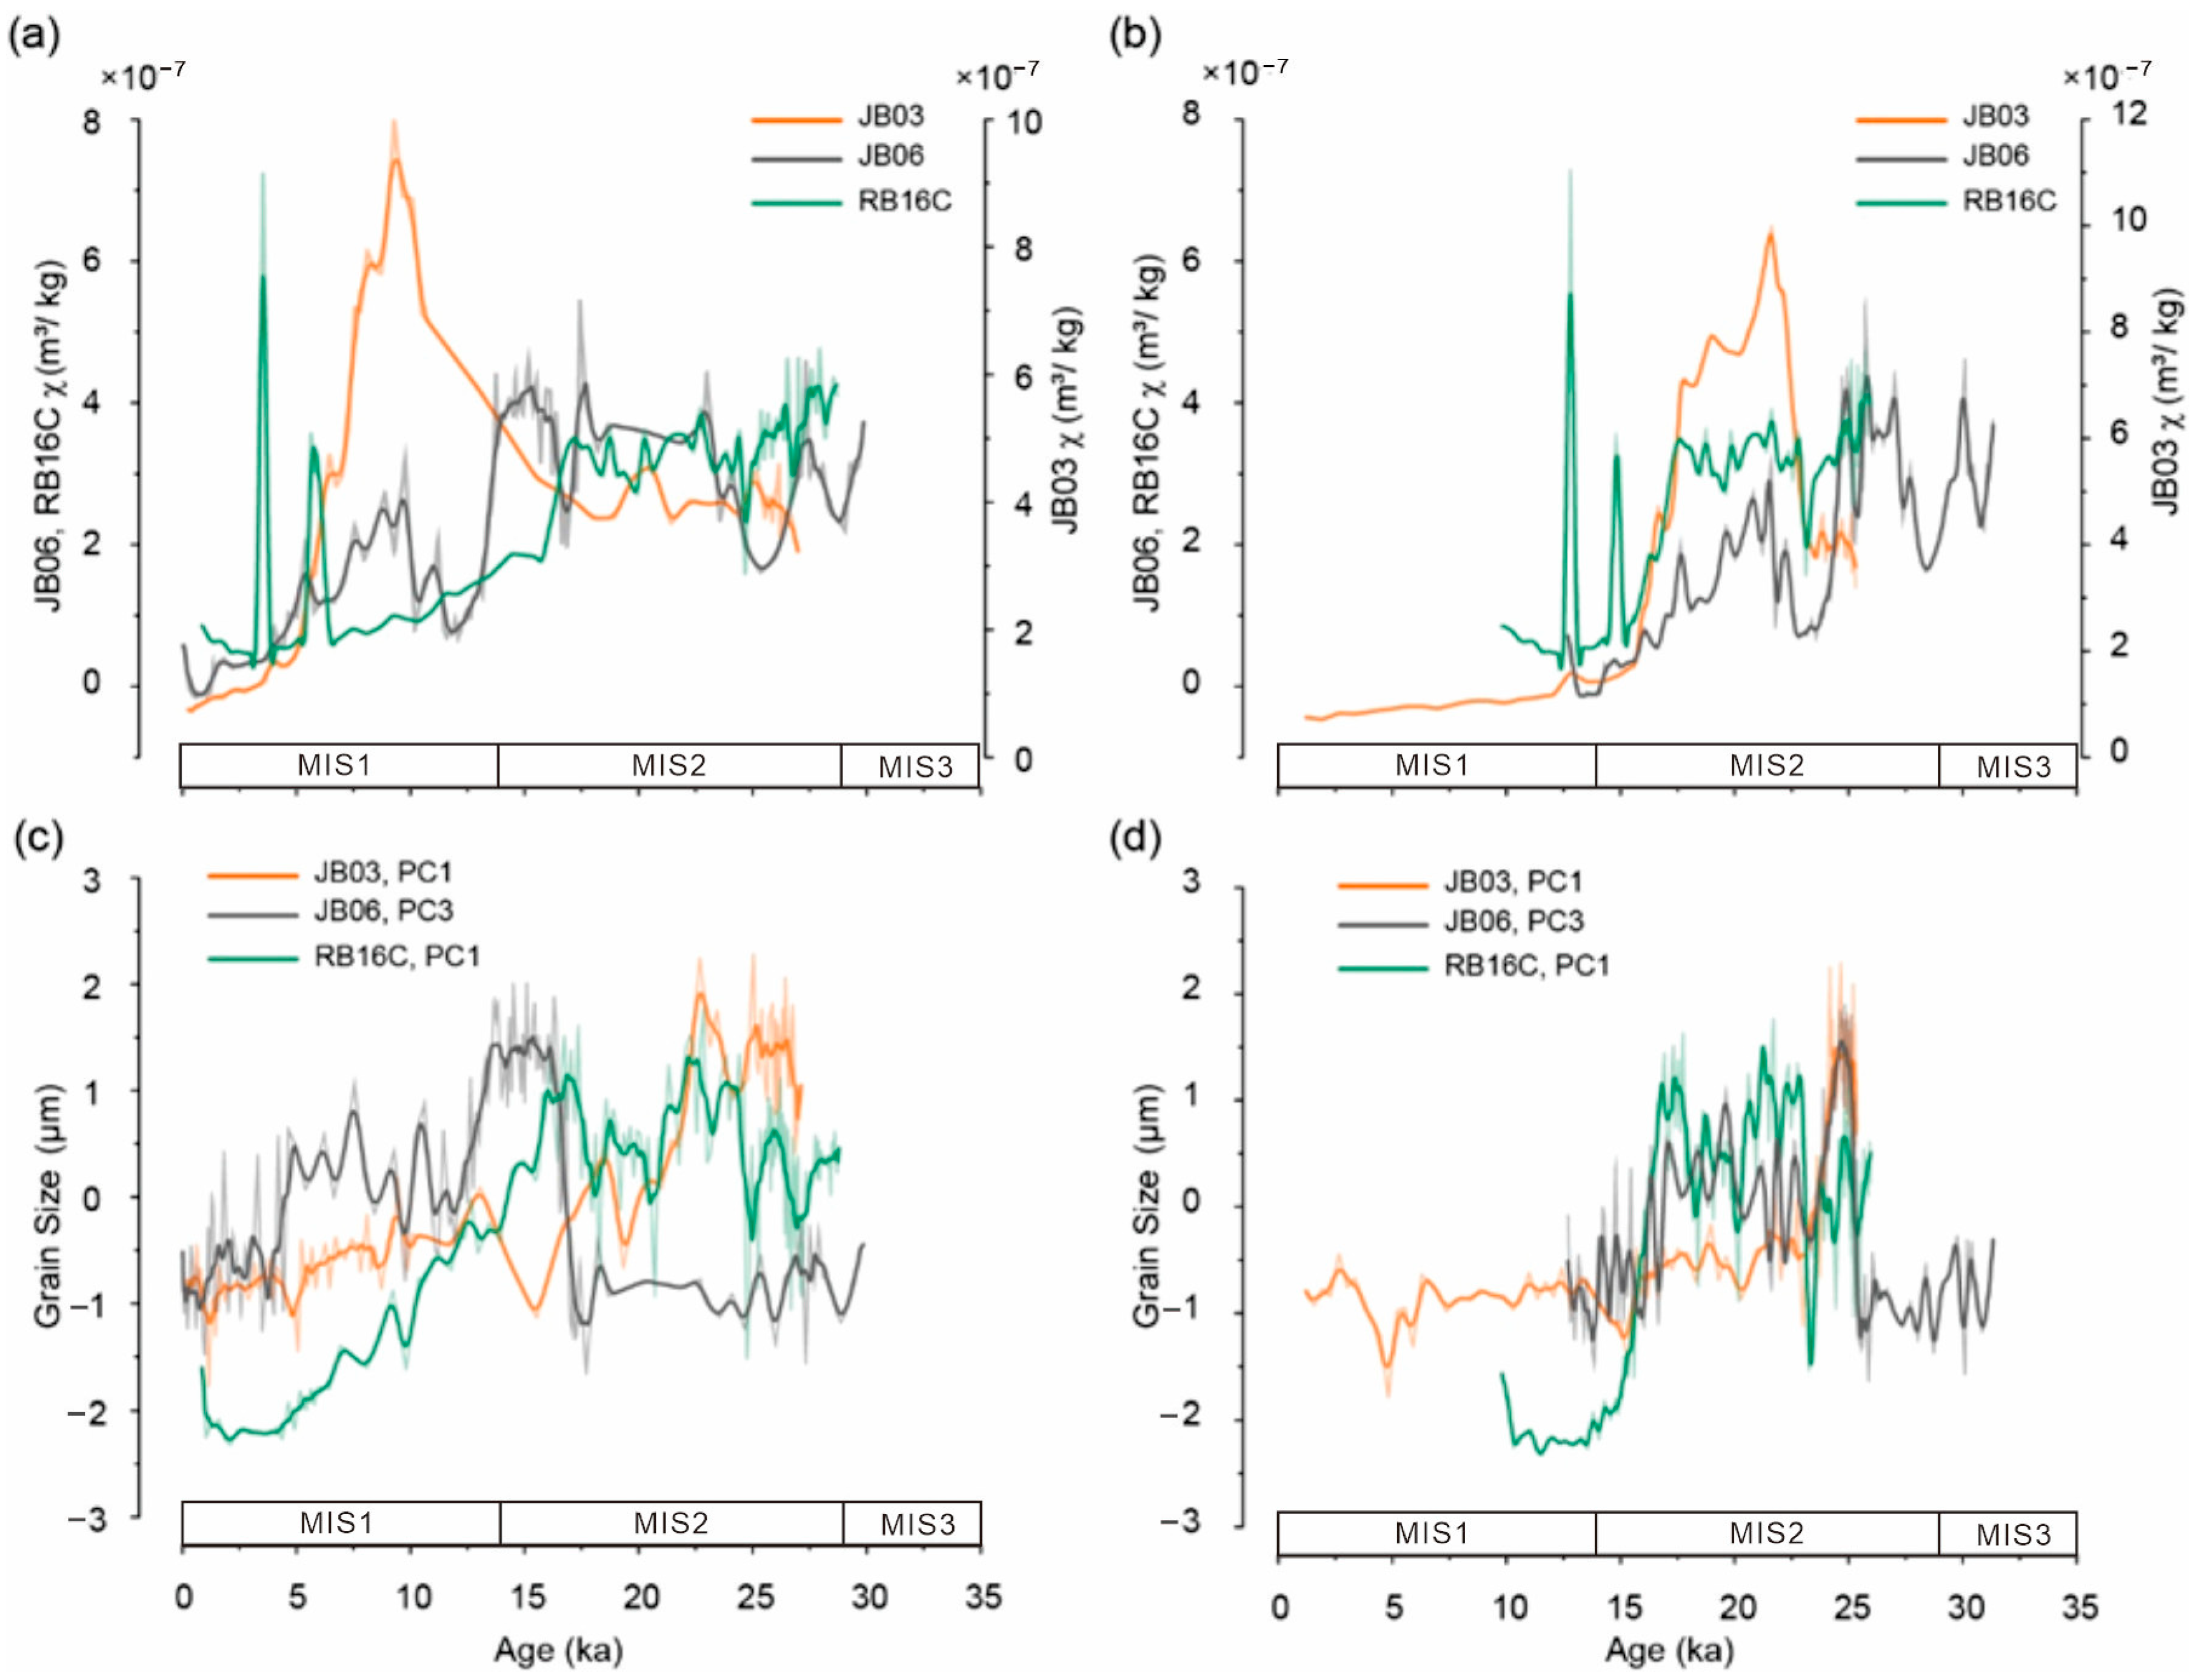
4.3. Tuning Magnetic Susceptibility

Previous research has proposed that the consistency between changes in sediment magnetic susceptivity and paleoenvironmental variation in the Southern Ocean can be used to obtain additional information in geochronology [31,34]. By comparing the records of the magnetic susceptibility of the studied cores with the record of atmospheric non-sea-salt Ca2+ (nssCa2+) from the Antarctic EPICA Droning Maud Land (EDML) [53], a clear glacial/interglacial cycle and a high agreement for the cores ANT31-JB03, ANT31-JB06, and ANT32-RB16C (r = 0.737, 0.812, and 0.855, respectively) were observed (Figure 5). Weber et al. [34] proposed that the coupling between the magnetic susceptibility of the sediments in the Southern Ocean and the EDML nssCa2+ record tends to link to changes in eolian dust from Patagonia, rather than iceberg transport, sea-ice extent, and ocean currents.
Considering the radiocarbon dates prior to the Holocene aforementioned, we attempted to tune the records of the magnetic susceptibility of the studied cores to the EDML nssCa2+ record [53]. The tuning processes were dependent on the agreement between these proxies (Figure 5) and a series of age controls were obtained for further comparison (Table 4).

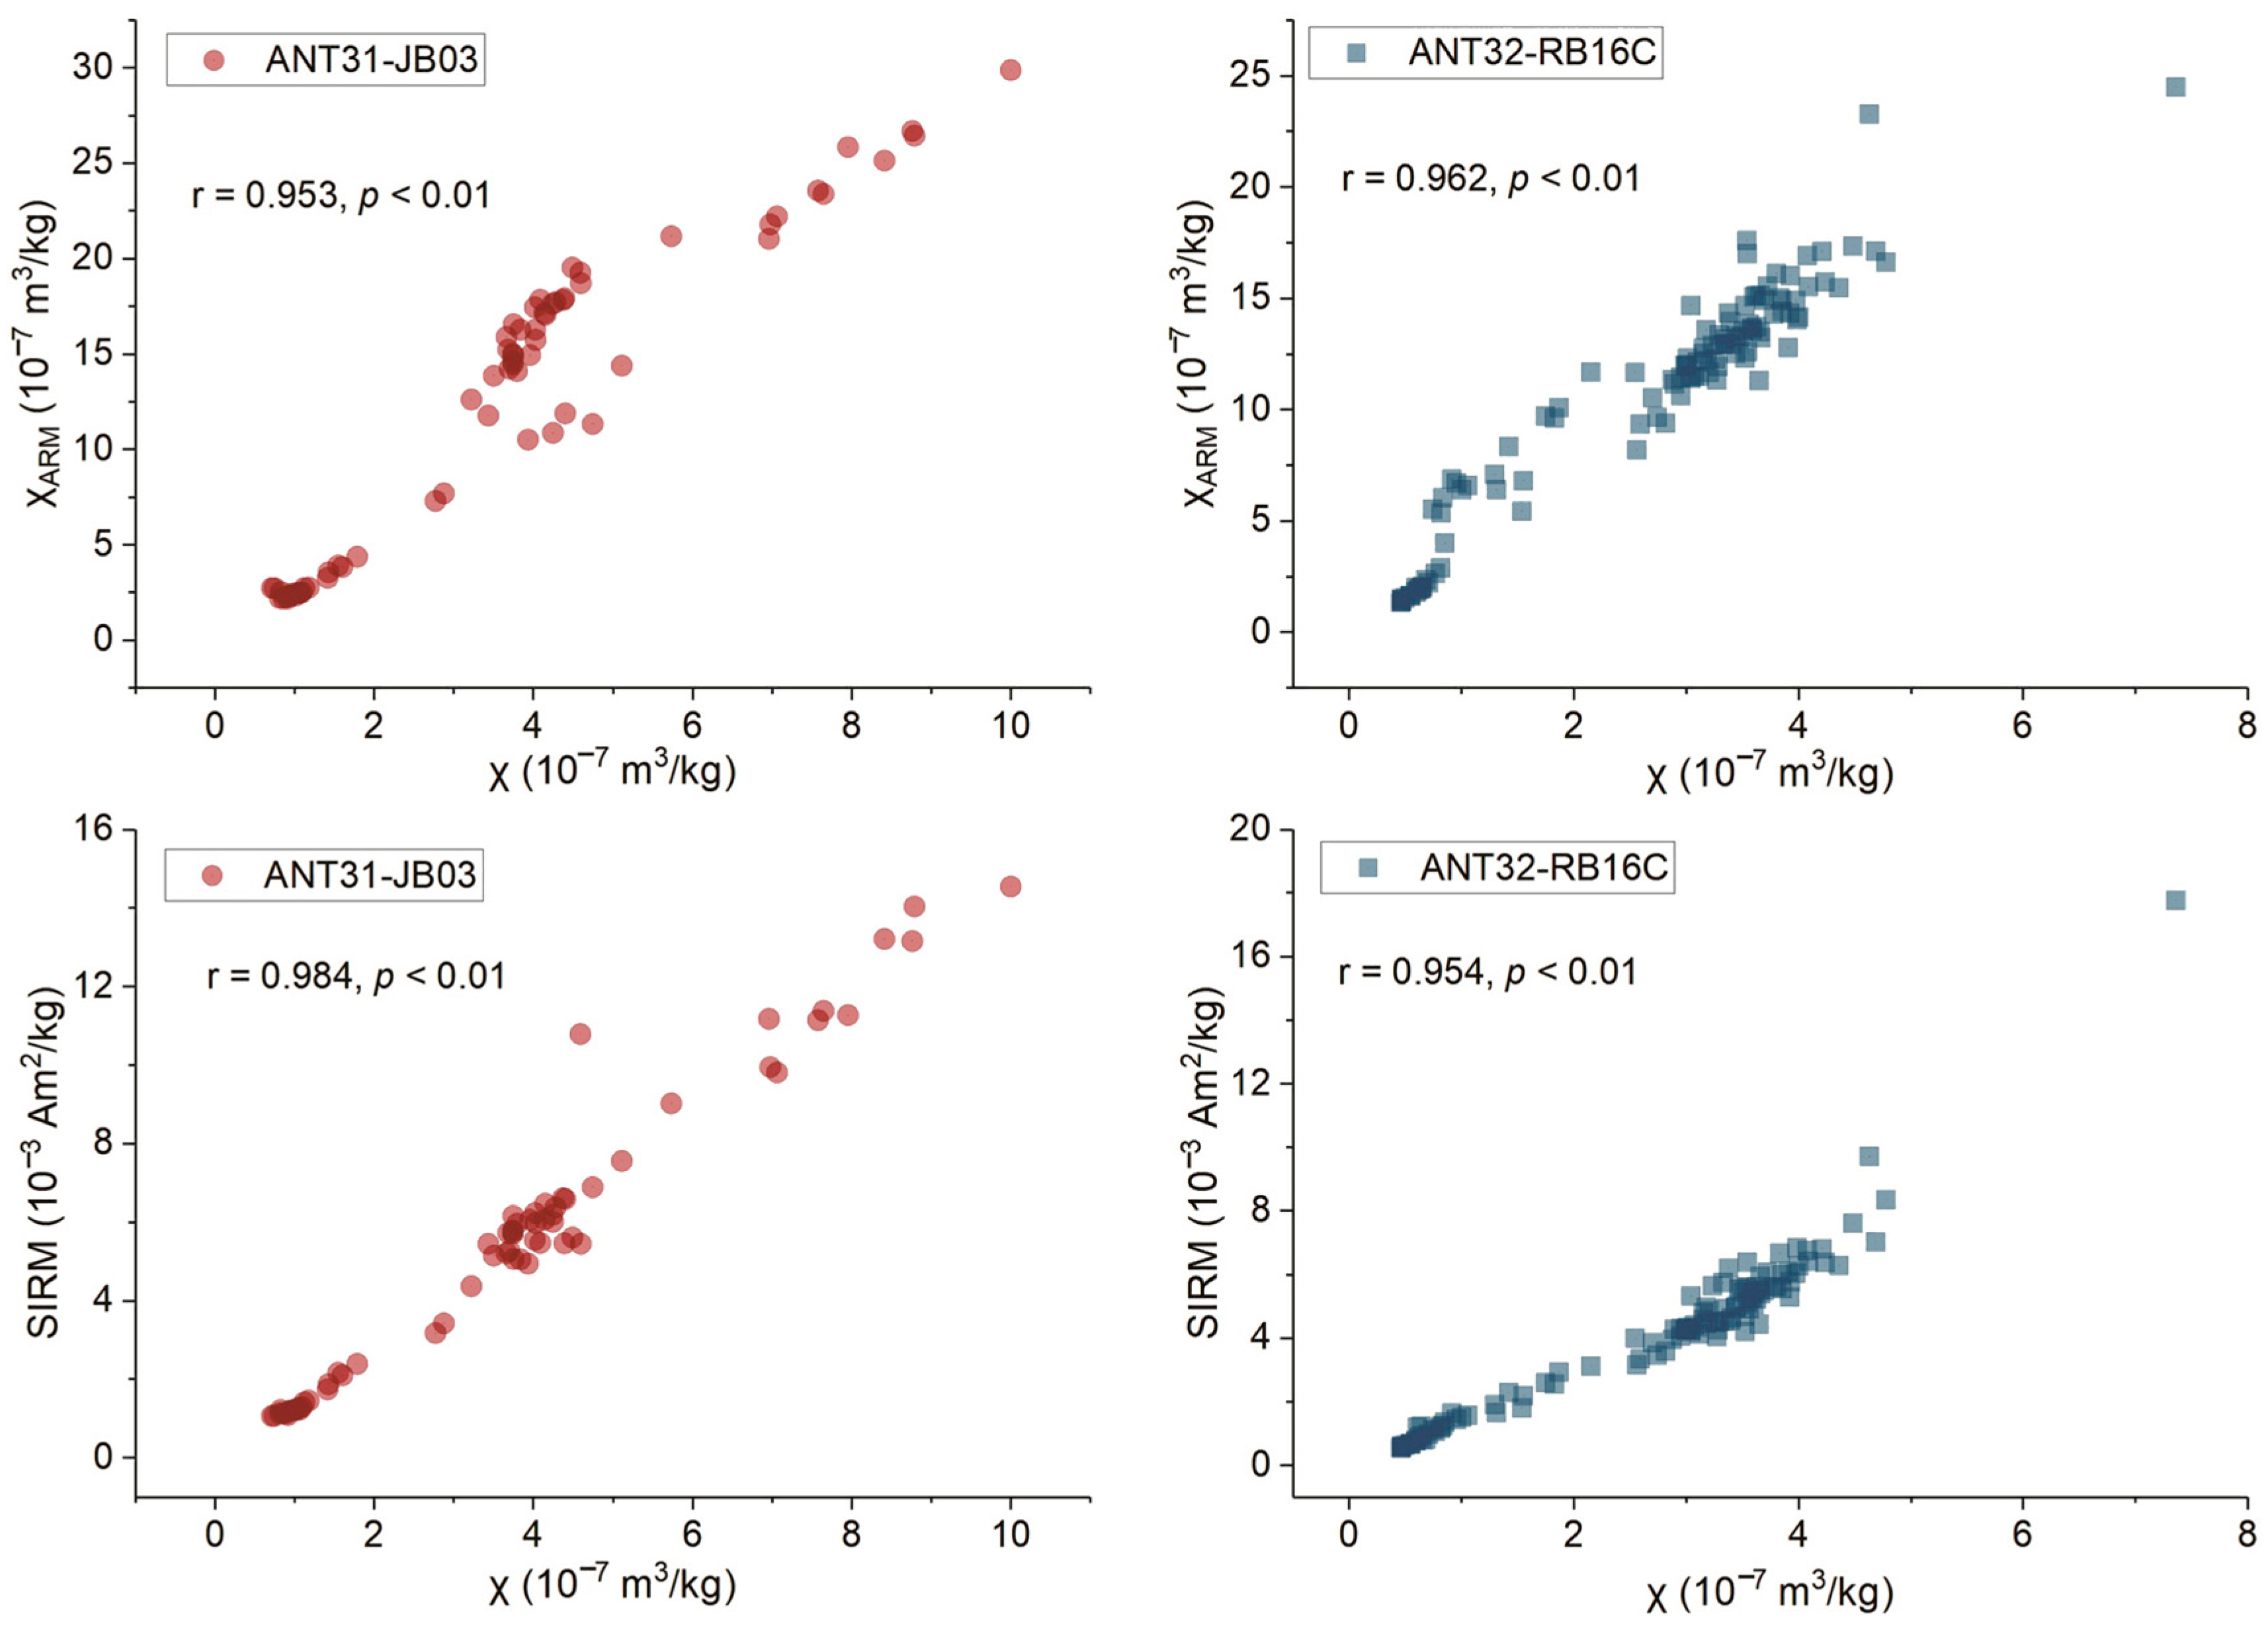
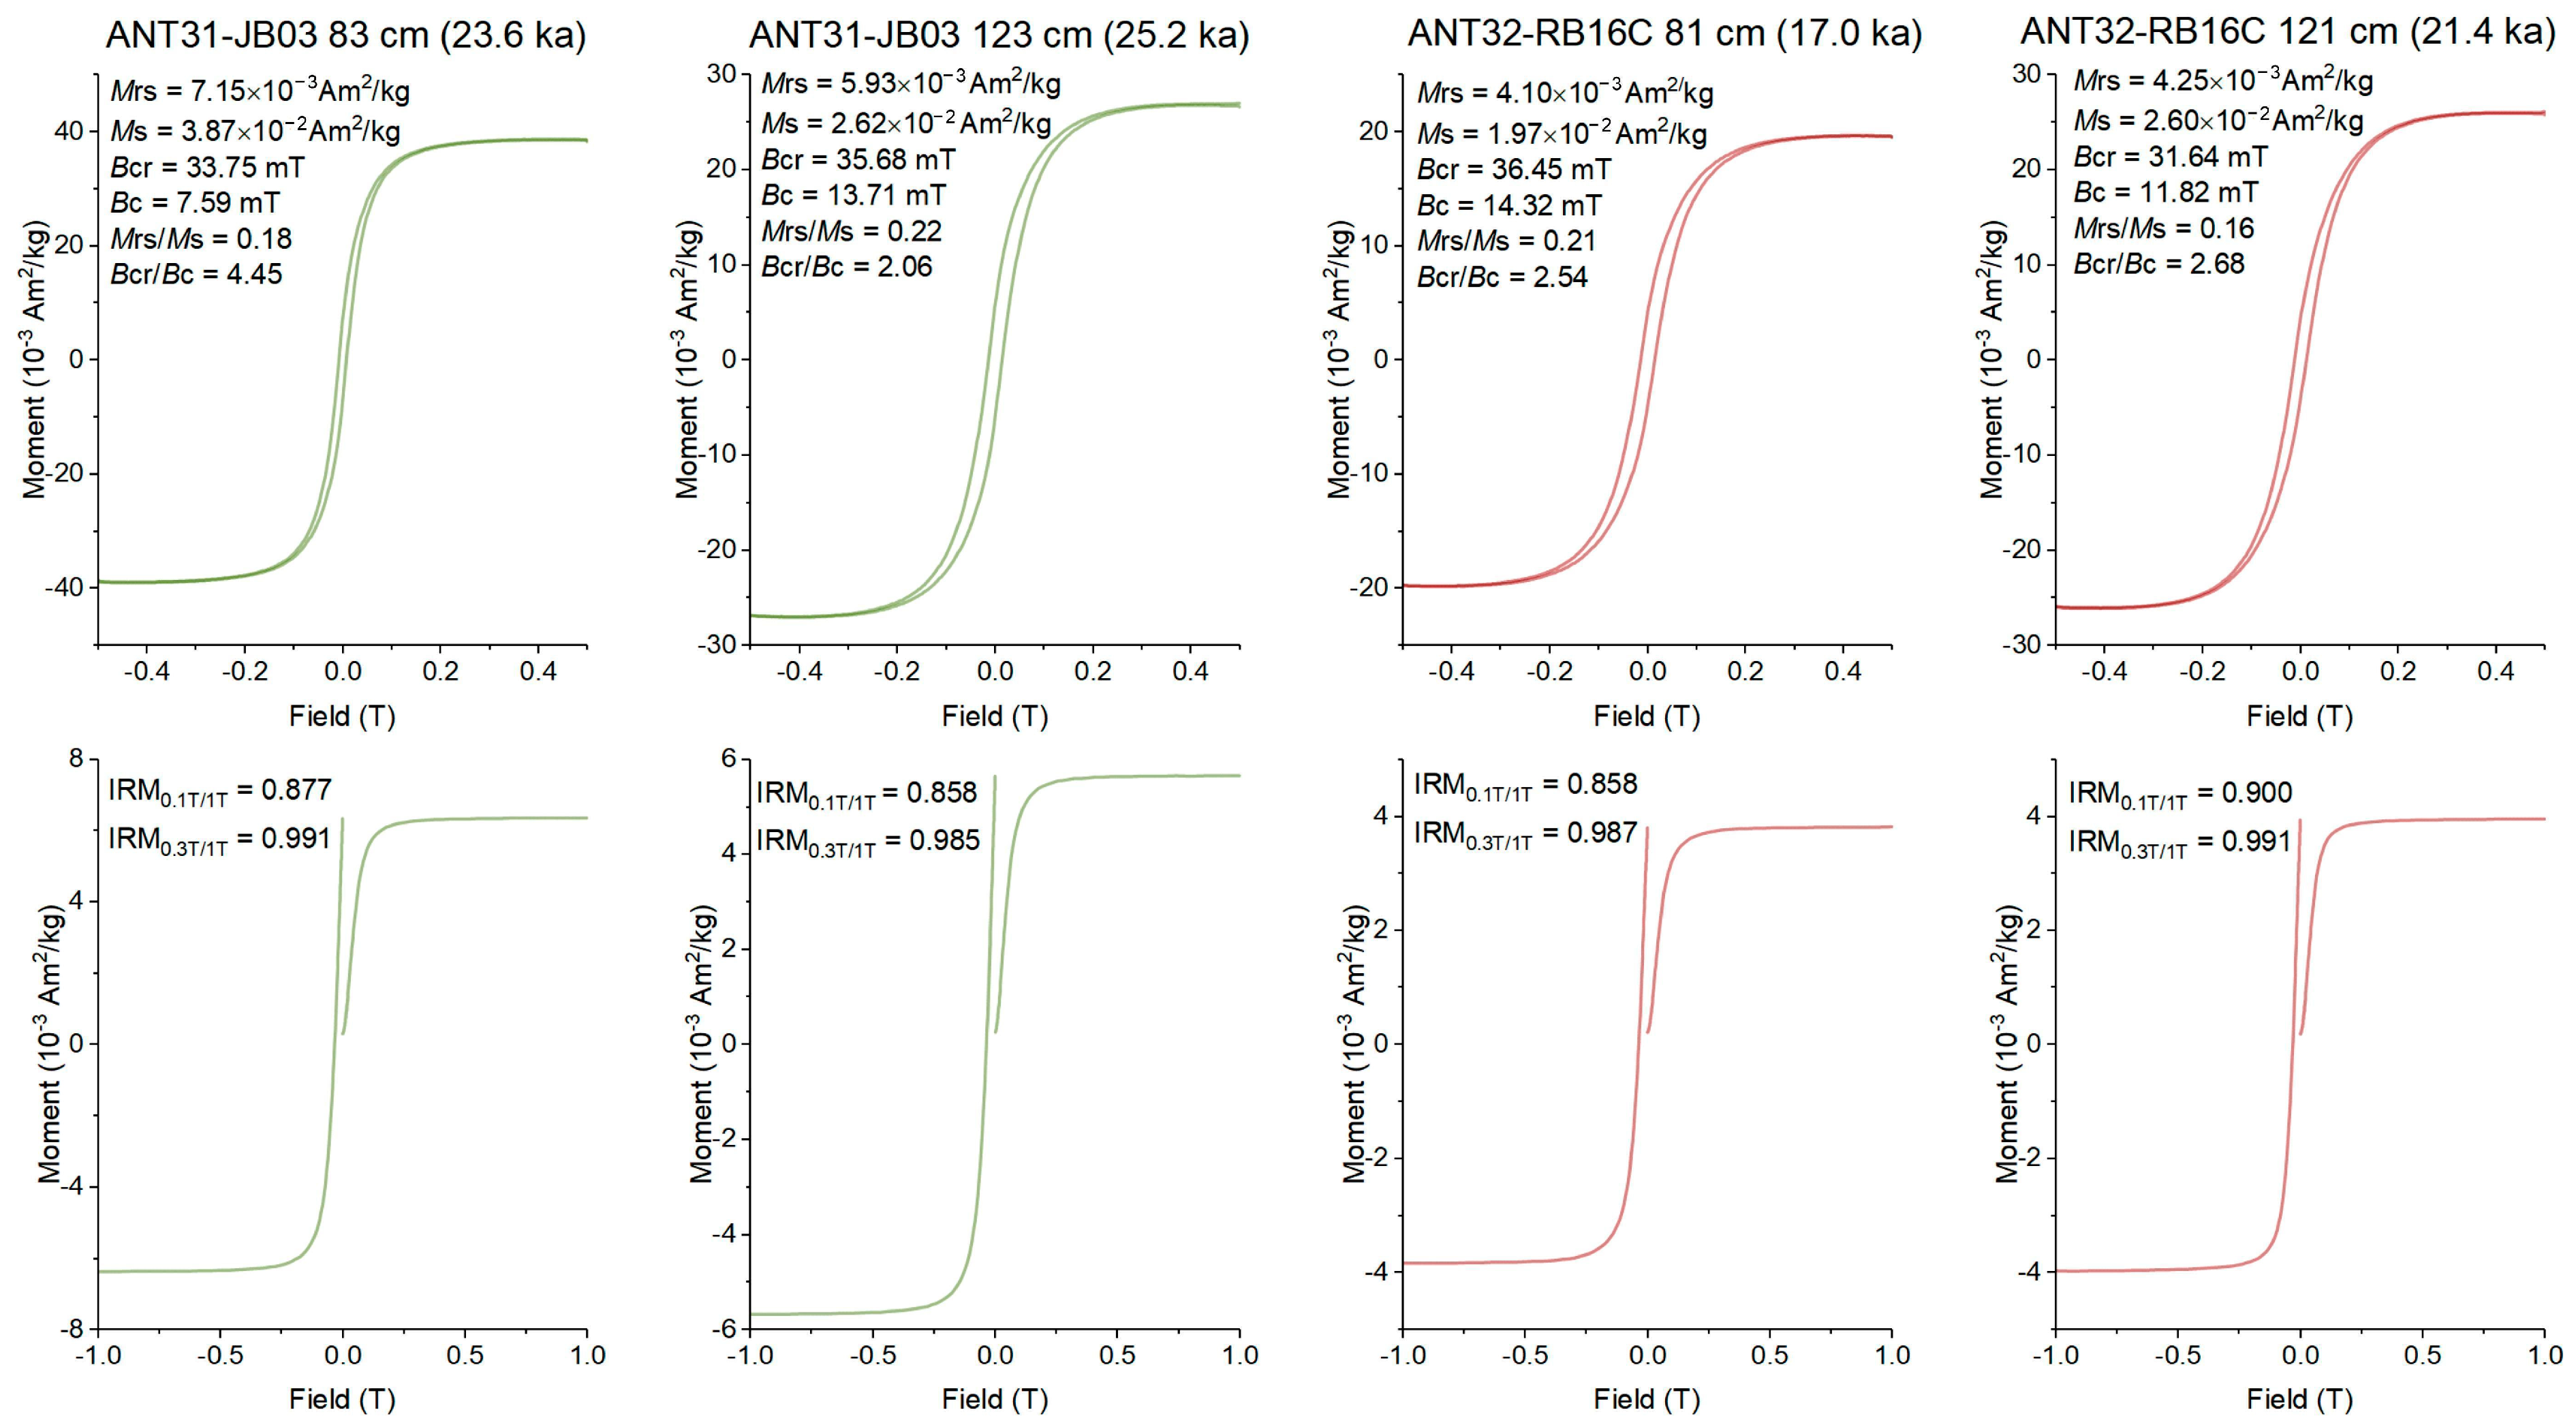
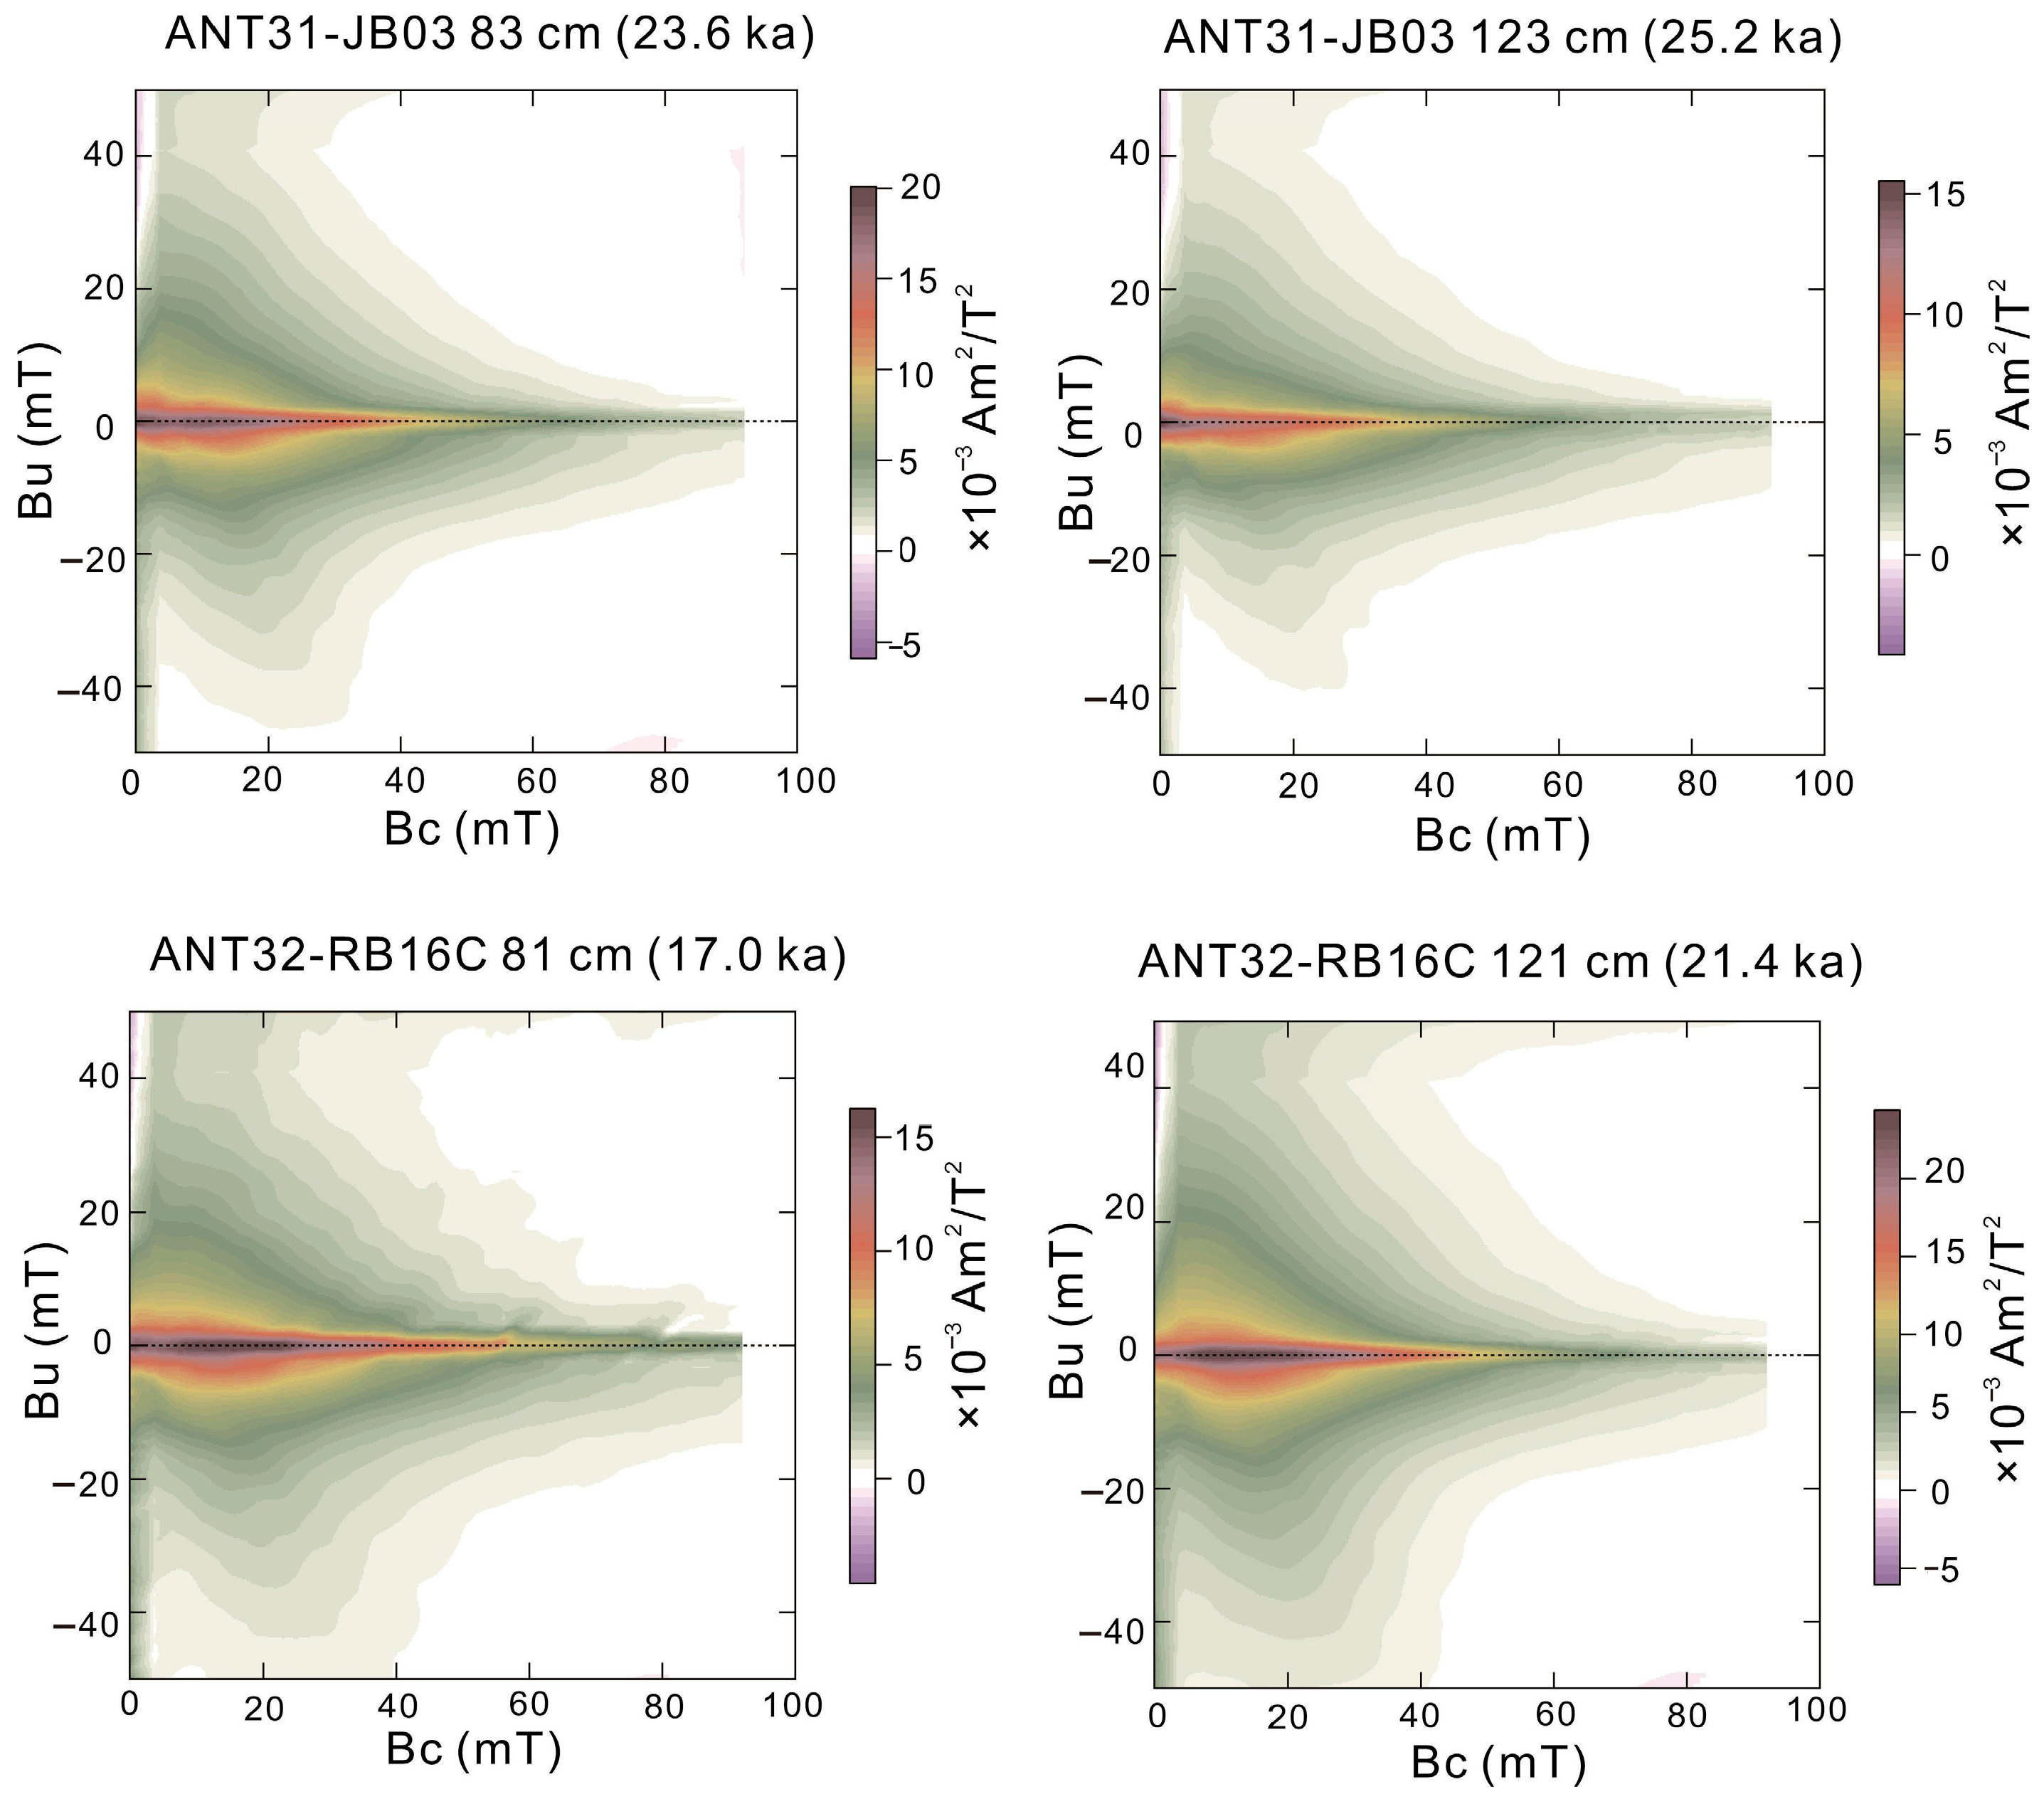
4.4. Influences on Magnetic Susceptibility

The concentration-dependent magnetic parameters (χ, χARM, and SIRM) of the cores ANT31-JB03 and ANT32-RB16C show similar variations (Figure 6). Given the high correlation coefficients observed among these magnetic parameters (Figure 6), it is inferred that there are negligible disparities in magnetic properties, and consequently, the magnetic mineral sources at the research sites were similar. Nevertheless, the substantial variations in the concentration-dependent magnetic parameters suggest significant discrepancies in the magnetic mineral content within these sediment samples.
Magnetic hysteresis loops and IRM acquisition curves of the cores ANT31-JB03 and ANT32-RB16C exhibit similar shapes, as depicted in Figure 7. Specifically, magnetic hysteresis loops demonstrate a closure below 300 mT, while IRM acquisition curves reach saturation below 250 mT, with IRM0.3T/1T values ranging from 0.985 to 0.991 (Figure 7). These findings suggest that the sediments are predominantly composed of low-coercivity magnetic minerals. The Bc, Bcr, and Mrs/Ms values fall within ranges of 7–15 mT, 31–37 mT, and 0.16–0.22, respectively, indicating that magnetic grains in the sediments are primarily within the pseudosingle domain (PSD) [56].
Furthermore, FORC diagrams of the cores ANT31-JB03 and ANT32-RB16C indicate that the majority of the coercivity distribution falls within 5–50 mT, with a notable peak at ~17 mT (Figure 8). Considering all available evidence, it can be inferred that the primary magnetic mineral present is magnetite.
To investigate the potential factors in the changes in the record of magnetic susceptibility of the sediments, we compared the two proxies, magnetic susceptibility, and sediment grain-size components. As shown, the comparison between the IRD proxies, including ANT31-JB03 (F1), ANT31-JB06 (F3), and ANT32-RB16C (F1), and the magnetic susceptibility show correlation coefficients of 0.619, 0.436, and 0.644 for them, respectively (Table 5). For sea-ice transport, the correlation coefficients between magnetic susceptibility and ANT31-JB03 (F3), ANT31-JB06 (F1), and ANT32-RB16C (F2) are 0.453, −0.669, and 0.525, respectively (Table 5). These correlation coefficients are relatively weaker than the ones with the EDML nssCa2+ record. The correlation between the IRD proxies and magnetic susceptibility may be due to climate driving. Similar to the glacial–interglacial cycles of MS, during cold periods, the Ross Ice Shelf likely extended to the research sites [18,32,33], resulting in more IRDs; meanwhile, the ice-shelf front might be away from the research sites during a warm climate, leading to a decrease in IRD materials.

5. Discussion

5.1. Difference in Age Models

Based on radiocarbon dating, the average sedimentation rates of the cores ANT31-JB03, ANT31-JB06, and ANT32-RB16C were estimated as 4.86 cm/kyr, 9.97 cm/kyr, and 8.26 cm/kyr, respectively. On the other hand, the tuning processes yielded 5.40 cm/kyr, 16.03 cm/kyr, and 14.26 cm/kyr for the cores ANT31-JB03, ANT31-JB06, and ANT32-RB16C, respectively. Comparisons between the two types of age–depth models indicate that the calendar dates of AMS 14C exceeding ~25 ka align with the tuning-based ages, while the younger ones of AMS 14C are generally underestimated (Figure 9).
In specific, the AMS 14C dates of the core ANT31-JB03 are underestimated by 0.9–12.3 kyr relative to turning ages, with the maximum deviation above the unconformity. The AMS 14C dates of the core ANT31-JB06 are underestimated by 3.8–13.7 kyr, with the maximum deviation around 15 ka, when extensive melting and the rapid retreat of the Ross Ice Shelf occurred as a meltwater pulse 1A (MWP-1A) [34]. Similarly, since 16 ka, the AMS 14C dates of the core ANT32-RB16C are 2.0–9.6 kyr younger, with the maximum deviation around 15 ka. A similar case of the core TPC290 in the Scotia Sea was reported by comparing AMS 14C dates and tuning ages [32]. This discrepancy may be explained, at least partially, by the adsorption of modern atmospheric CO2 involved in the opal-rich marine sediments [57].
Moreover, it is claimed that uncertainties could be introduced by old-carbon contamination and an undetected carbon reservoir [31,37]. Although it is usually assumed that contamination and the carbon reservoir are consistent over time [29,36], the difference between the two types of age–depth models may suggest that this hypothesis may be not applicable to our study.
To verify the reliability of these age–depth models, we testified the consistency between magnetic susceptibility and the sediment grain-size components between the studied cores. As shown in Figure 10, for both the records of magnetic susceptibility and the grain-size components, no consistency is observed based on the AMS 14C dates, while an agreement is highlighted based on the tuning ages. Hence, the inconsistent variation of the AMS 14C-based model may illustrate uncertainties related to contamination and the carbon reservoir, and the tuning ages were employed for further analysis.

5.2. Paleoenvironmental Processes in the Ross Sea

Integrating the tuning ages and paleoenvironmental proxies of the studied cores with other Antarctic climatic records, the paleoenvironmental processes in the Ross Sea since the last glacial period can be recovered (Figure 11).
The ANT31-JB03 F1 record, relating to IRD content, was relatively high during 25.3–22.7 ka, with an unconformity occurring at 22.7 ka, inferring a sub-ice-sheet depositional environment, and the record had stable low values during 22.7–19.1 ka. By analyzing the deposition processes of ice sheets, ice shelves, and open seas, Domack et al. [29] claimed that the sediments beneath the ice shelf were finer than those at the front of the ice shelf. During 19.1–15.5 ka, the δ18O record of the WDC ice core and the sea surface temperature (SST) record of the Southern Ocean showed a persistent increase [7,58], indicating a continuous retreat of the Ross Ice Shelf. During this period, the ANT31-JB03 F1 record was relatively high, likely suggesting a transition from a sedimentary environment below the ice shelf into the ice-shelf front. Low values of the ANT31-JB03 F1 record likely suggested a transition from the ice-shelf front to an open sea at 15.5 ka.
Similarly, the ANT31-JB06 F3 record, which is also related to IRD content, was low and decreased slightly from 31.3 to 25.5 ka (Figure 11), thus inferring a stable sub-shelf environment. Around 25.5 ka, the SST record of the Southern Ocean increased evidently [7], possibly inferring a collapse of the Ross Ice Shelf, thus causing a rapid increase in the ANT31-JB06 F3 record. The WDC ice-core δ18O record increased during 25.5–16 ka, and during this period, the ANT31-JB06 F3 record indicates an evident presence of debris associated with ice shelves. Since the coarser debris was usually released from the sediment-rich bottom of the ice shelf near its front [29], it can be inferred that the Ross Ice Shelf retreated from 25.5 to 16 ka, and the core ANT31-JB06 was located at the calving front. In addition, a potential transition ice-shelf front to an open sea could be identified at ~16 ka, when a descending in the ANT31-JB06 F3 record was observed.
Moreover, the coarse materials inferred from the ANT32-RB16C F1 record increased during 26–15.7 ka (Figure 11), possibly implying a calving front of the ice shelf. Since 15.7 ka, a shift from the ice-shelf front to a glaciomarine condition was inferred, accompanied by a gradual temperature increase [7].
Therefore, integrating this evidence and these analyses, it is inferred that the sedimentary environment changed from a sub-ice sheet to an ice-shelf front in the Ross Sea in the last glacial period. It is also worth noting that the ice-shelf transport proxies of the cores ANT31-JB03, ANT31-JB06, and ANT32-RB16C significantly increased during the Antarctic Isotopic Maxima (AIM) 2 and 1 (Figure 11) when the increased temperature might cause the retreat of the front edge of the Ross Ice Shelf [7]. Similarly, Lee et al. highlighted the importance of sea-ice transport in the Ross Ice Shelf [38], which could be related to deep-water temperature [60], as previously reported [61,62,63].
In addition, the ages of the retreat of the Ross Ice shelf identified in the cores ANT31-JB06, ANT32-RB16C, and ANT31-JB03 show a spatial agreement from 16 ka to 15.7 ka and to 15.5 ka (Figs. 1 and 11). Since 15.5 ka, the IRD proxy of the cores ANT31-JB03, ANT31-JB06, and ANT32-RB16C are consistent with the WDC ice-core δ18O record and the SST record of the Southern Ocean (Figure 11), likely indicating the ice-shelf front moving further away from the studied sites. It is thus concluded that the warming processes in the Antarctic have played a substantial role in the retreat of the Ross Ice Shelf.

6. Conclusions

By analyzing radiocarbon dating, magnetic susceptibility, and the sediment grain size of the three cores, geochronology and sedimentary processes were obtained in the western Ross Sea in the past ~30 kyr. The main findings are listed as follows:
(1)
There are two grain-size components identified for the studied cores. The coarse component includes F1 (134.0–466.5 μm) of the core ANT31-JB03, F3 (121.8–213.2 μm) of the core ANT31-JB06, and F1 (116.6–535.9 μm) of the core ANT32-RB16C, which can serve as proxies of IRD. The fine component contains F3 (3.2–4.8 μm) of the core ANT31-JB03, F1 (5.1–17.2 μm) of the core ANT31-JB06, and F2 (2.1–8.4 μm) of the core ANT32-RB16C, which are associated with sea-ice transport.
(2)
Based on the high consistency between the magnetic susceptibility of the studied cores and the EDML ice-core nssCa2+ record, the age model can be established. Relatively, the radiocarbon dates are generally underestimated due to old-carbon contamination and an inconsistent carbon reservoir.
(3)
Integrating sediment grain-size changes and comparisons with other paleoenvironmental proxies in the Antarctic, the regional processes in the Ross Sea are reconstructed as a sub-ice sheet in the last glacial period, then to a sub-ice shelf in the glacial maximum, and, finally, to a glaciomarine state since the last deglacial period.
Combining these results, we concluded that the warming processes in the Antarctic have played a substantial role in the retreat of the Ross Ice Shelf. The sediment susceptibility tuning is valuable as a dating method. Nevertheless, further investigation is required to fully comprehend the underlying factors contributing to the strong association between sediment magnetic susceptibility and the nssCa2+ record in Antarctic ice cores.

Author Contributions

Conceptualization and methodology, G.L., H.W., and Z.S.; sample collection, X.H., Y.Z. and P.M.; measurements, G.L., W.C., Y.L., Y.C. and P.X.; data analysis, H.Q. and C.Z.; original draft preparation, G.L. All authors contributed to the data interpretation and provided significant input into the final manuscript. All authors have read and agreed to the published version of the manuscript.

Funding

This work was funded by the National Natural Science Foundation of China (42304084), the National Key R&D Program of China (2022YFC2905500), the Impact and Response of Antarctic Seas to Climate Change (IRASCC2020-2022), the open foundation project of the Key Laboratory of Polar Geology and Marine Mineral Resources (China University of Geosciences, Beijing), Ministry of Education (PGMR-2023-205), and the China Postdoctoral Science Foundation (2023M743469).

Institutional Review Board Statement

Not applicable.

Informed Consent Statement

Not applicable.

Data Availability Statement

Data are contained within the article.

Acknowledgments

We are very grateful to all staff in the R/V “XUELONG” icebreaker during the 31st and 32nd Chinese Antarctic Research Expeditions.

Conflicts of Interest

The authors declare no conflicts of interest.

References

  1. Westerhold, T.; Marwan, N.; Drury, A.J.; Liebrand, D.; Agnini, C.; Anagnostou, E.; Barnet, J.S.; Bohaty, S.M.; De Vleeschouwer, D.; Florindo, F. An astronomically dated record of Earth’s climate and its predictability over the last 66 million years. Science 2020, 369, 1383–1387. [Google Scholar] [CrossRef]
  2. Morgan, V.; Delmotte, M.; van Ommen, T.; Jouzel, J.; Chappellaz, J.; Woon, S.; Masson-Delmotte, V.; Raynaud, D. Relative timing of deglacial climate events in Antarctica and Greenland. Science 2002, 297, 1862–1864. [Google Scholar] [CrossRef]
  3. Miller, K.G.; Browning, J.V.; Schmelz, W.J.; Kopp, R.E.; Mountain, G.S.; Wright, J.D. Cenozoic sea-level and cryospheric evolution from deep-sea geochemical and continental margin records. Sci. Adv. 2020, 6, eaaz1346. [Google Scholar] [CrossRef]
  4. Yi, L.; Medina-Elizalde, M.; Tan, L.; Kemp, D.B.; Li, Y.; Kletetschka, G.; Xie, Q.; Yao, H.; He, H.; Deng, C.; et al. Plio-Pleistocene deep-sea ventilation in the Eastern Pacific and potential linkages with Northern Hemisphere glaciation. Sci. Adv. 2023, 9, eadd1467. [Google Scholar] [CrossRef] [PubMed]
  5. Convey, P.; Peck, L.S. Antarctic environmental change and biological responses. Sci. Adv. 2019, 5, eaaz0888. [Google Scholar] [CrossRef] [PubMed]
  6. Consortium*†, C.C.P.I.P.; Hönisch, B.; Royer, D.L.; Breecker, D.O.; Polissar, P.J.; Bowen, G.J.; Henehan, M.J.; Cui, Y.; Steinthorsdottir, M.; McElwain, J.C. Toward a Cenozoic history of atmospheric CO2. Science 2023, 382, eadi5177. [Google Scholar] [CrossRef]
  7. Anderson, H.J.; Pedro, J.B.; Bostock, H.C.; Chase, Z.; Noble, T.L. Compiled Southern Ocean sea surface temperatures correlate with Antarctic Isotope Maxima. Quat. Sci. Rev. 2021, 255, 106821. [Google Scholar] [CrossRef]
  8. Crosta, X.; Kohfeld, K.E.; Bostock, H.C.; Chadwick, M.; Du Vivier, A.; Esper, O.; Etourneau, J.; Jones, J.; Leventer, A.; Müller, J.; et al. Antarctic sea ice over the past 130,000 years—Part 1: A review of what proxy records tell us. Clim. Past 2022, 18, 1729–1756. [Google Scholar] [CrossRef]
  9. Weber, M.E.; Golledge, N.R.; Fogwill, C.J.; Turney, C.S.M.; Thomas, Z.A. Decadal-scale onset and termination of Antarctic ice-mass loss during the last deglaciation. Nat. Commun. 2021, 12, 6683. [Google Scholar] [CrossRef]
  10. Tesi, T.; Belt, S.; Gariboldi, K.; Muschitiello, F.; Smik, L.; Finocchiaro, F.; Giglio, F.; Colizza, E.; Gazzurra, G.; Giordano, P. Resolving sea ice dynamics in the north-western Ross Sea during the last 2.6 ka: From seasonal to millennial timescales. Quat. Sci. Rev. 2020, 237, 106299. [Google Scholar] [CrossRef]
  11. Silvano, A.; Foppert, A.; Rintoul, S.R.; Holland, P.R.; Tamura, T.; Kimura, N.; Castagno, P.; Falco, P.; Budillon, G.; Haumann, F.A. Recent recovery of Antarctic Bottom Water formation in the Ross Sea driven by climate anomalies. Nat. Geosci. 2020, 13, 780–786. [Google Scholar] [CrossRef]
  12. Robinson, D.E.; Menzies, J.; Wellner, J.S.; Clark, R.W. Subglacial sediment deformation in the Ross Sea, Antarctica. Quat. Sci. Adv. 2021, 4, 100029. [Google Scholar] [CrossRef]
  13. Ha, S.; Colizza, E.; Torricella, F.; Langone, L.; Giglio, F.; Kuhn, G.; Macrì, P.; Khim, B.-K. Glaciomarine sediment deposition on the continental slope and rise of the central Ross Sea since the Last Glacial Maximum. Mar. Geol. 2022, 445, 106752. [Google Scholar] [CrossRef]
  14. Ha, S.; Lee, J.I.; Bak, Y.-S.; Yoo, K.-C.; Khim, B.-K. Paleoenvironmental reconstruction of glaciomarine sediments in the Drygalski Basin of the western Ross Sea since the Last Glacial Maximum. Sediment. Geol. 2023, 456, 106495. [Google Scholar] [CrossRef]
  15. Greenwood, S.L.; Gyllencreutz, R.; Jakobsson, M.; Anderson, J.B. Ice-flow switching and East/West Antarctic Ice Sheet roles in glaciation of the western Ross Sea. GSA Bull. 2012, 124, 1736–1749. [Google Scholar] [CrossRef]
  16. Kim, S.; De Santis, L.; Hong, J.K.; Cottlerle, D.; Petronio, L.; Colizza, E.; Kim, Y.-G.; Kang, S.-G.; Kim, H.J.; Kim, S.; et al. Seismic stratigraphy of the Central Basin in northwestern Ross Sea slope and rise, Antarctica: Clues to the late Cenozoic ice-sheet dynamics and bottom-current activity. Mar. Geol. 2018, 395, 363–379. [Google Scholar] [CrossRef]
  17. King, M.V.; Gales, J.A.; Laberg, J.S.; McKay, R.M.; De Santis, L.; Kulhanek, D.K.; Hosegood, P.J.; Morris, A. Pleistocene depositional environments and links to cryosphere-ocean interactions on the eastern Ross Sea continental slope, Antarctica (IODP Hole U1525A). Mar. Geol. 2022, 443, 106674. [Google Scholar] [CrossRef]
  18. Li, G.; Bu, R.; Yi, L.; Hu, B.; Li, Y.; Ji, Y.; Li, Y.; Wang, L. Geochronology and Paleoenvironmental Changes of Late Pleistocene Sediments in the Ross Sea, Antarctica. Front. Earth Sci. 2022, 10, 863336. [Google Scholar] [CrossRef]
  19. Li, G.; Li, Y.; Bu, R.; Ji, Y.; Li, Y.; Zhao, X.; Li, C.; Duan, L. Geochemical characteristics and paleoenvironmental implications of major elements in sediments from the continental slope of the Ross Sea, Antarctica since late Pleistocene. Mar. Geol. Quat. Geol. 2022, 42, 1–11. [Google Scholar] [CrossRef]
  20. Rosenblume, J.A.; Powell, R.D. Glacial sequence stratigraphy of ANDRILL-1B core reveals a dynamic subpolar Antarctic Ice Sheet in Ross Sea during the late Miocene. Sedimentology 2019, 66, 2072–2097. [Google Scholar] [CrossRef]
  21. Jin, J.; Chen, X.; Xu, L.; Nie, Y.; Wang, X.; Huang, H.; Emslie, S.D.; Liu, X. Chronology and paleoclimatic implications of lacustrine sediments at Inexpressible Island, Ross Sea, Antarctica. Palaeogeogr. Palaeoclimatol. Palaeoecol. 2021, 576, 110497. [Google Scholar] [CrossRef]
  22. Bart, P.J.; DeCesare, M.; Rosenheim, B.E.; Majewski, W.; McGlannan, A. A centuries-long delay between a paleo-ice-shelf collapse and grounding-line retreat in the Whales Deep Basin, eastern Ross Sea, Antarctica. Sci. Rep. 2018, 8, 12392. [Google Scholar] [CrossRef] [PubMed]
  23. Torricella, F.; Melis, R.; Malinverno, E.; Fontolan, G.; Bussi, M.; Capotondi, L.; Del Carlo, P.; Di Roberto, A.; Geniram, A.; Kuhn, G.; et al. Environmental and Oceanographic Conditions at the Continental Margin of the Central Basin, Northwestern Ross Sea (Antarctica) Since the Last Glacial Maximum. Geosciences 2021, 11, 155. [Google Scholar] [CrossRef]
  24. Yi, L.; Chen, S.; Ortiz, J.D.; Chen, G.; Peng, J.; Liu, F.; Chen, Y.; Deng, C. 1500-year cycle dominated Holocene dynamics of the Yellow River delta, China. Holocene 2016, 26, 222–234. [Google Scholar] [CrossRef]
  25. Liu, G.; Han, X.; Chen, Y.; Li, J.; Song, L.; Zhou, X.; Hu, B.; Yi, L. Early-Holocene Paleo-Tropical Cyclone Activity Inferred from a Sedimentary Sequence in South Yellow Sea, East Asia. J. Earth. Sci. 2022, 33, 789–801. [Google Scholar] [CrossRef]
  26. Zhao, R.; Chen, Z.; Liu, H.; Tang, Z.; Huang, Y.; Li, Y.; Ge, S. Sediment record and paleoceanographic implications of the core on the continental shelf off the Ross Sea since 15 ka. Acta Oceanol. Sin. 2017, 39, 78–88. [Google Scholar] [CrossRef]
  27. Andrews, J.T.; Cunningham, W.L.; DeMaster, D.J.; Domack, E.W.; Jennings, A.E.; Jull, A.J.T.; Leventer, A.; Licht, K.J. Problems and Possible Solutions Concerning Radiocarbon Dating of Surface Marine Sediments, Ross Sea, Antarctica. Quat. Res. 1999, 52, 206–216. [Google Scholar] [CrossRef]
  28. Cunningham, W.L.; Leventer, A.; Andrews, J.T.; Jennings, A.E.; Licht, K.J. Late Pleistocene-Holocene marine conditions in the Ross Sea, Antarctica: Evidence from the diatom record. Holocene 1999, 9, 129–139. [Google Scholar] [CrossRef]
  29. Domack, E.W.; Jacobson, E.A.; Shipp, S.; Anderson, J.B. Late Pleistocene–Holocene retreat of the West Antarctic Ice-Sheet system in the Ross Sea: Part 2—Sedimentologic and stratigraphic signature. GSA Bull. 1999, 111, 1517–1536. [Google Scholar] [CrossRef]
  30. Licht, K.J.; Cunningham, W.L.; Andrews, J.T.; Domack, E.W.; Jennings, A.E. Establishing chronologies from acid-insoluble organic 14C dates on Antarctic (Ross Sea) and Arctic (North Atlantic) marine sediments. Polar Res. 1998, 17, 203–216. [Google Scholar] [CrossRef]
  31. Xiao, W.; Frederichs, T.; Gersonde, R.; Kuhn, G.; Esper, O.; Zhang, X. Constraining the dating of late Quaternary marine sediment records from the Scotia Sea (Southern Ocean). Quat. Geochronol. 2016, 31, 97–118. [Google Scholar] [CrossRef]
  32. Pugh, R.S.; McCave, I.N.; Hillenbrand, C.D.; Kuhn, G. Circum-Antarctic age modelling of Quaternary marine cores under the Antarctic Circumpolar Current: Ice-core dust–magnetic correlation. Earth Planet. Sci. Lett. 2009, 284, 113–123. [Google Scholar] [CrossRef]
  33. Yokoyama, Y.; Anderson, J.B.; Yamane, M.; Simkins, L.M.; Miyairi, Y.; Yamazaki, T.; Koizumi, M.; Suga, H.; Kusahara, K.; Prothro, L.; et al. Widespread collapse of the Ross Ice Shelf during the late Holocene. Proc. Natl. Acad. Sci. USA 2016, 113, 2354–2359. [Google Scholar] [CrossRef] [PubMed]
  34. Weber, M.E.; Kuhn, G.; Sprenk, D.; Rolf, C.; Ohlwein, C.; Ricken, W. Dust transport from Patagonia to Antarctica—A new stratigraphic approach from the Scotia Sea and its implications for the last glacial cycle. Quat. Sci. Rev. 2012, 36, 177–188. [Google Scholar] [CrossRef]
  35. Smith, W.O.J.; Sedwick, P.N.; Arrigo, K.R.; Ainley, D.G.; Orsi, A.H. The Ross Sea in a sea of change. Oceanography 2012, 25, 90–103. [Google Scholar] [CrossRef]
  36. Hang, M.; Wang, R.; Xiao, W.; Wu, L.; Chen, Z. Retreat process of Ross Ice Shelf and hydrodynamic changes on Northwestern Ross continental shelf since the Last Glacial. Mar. Geol. Quat. Geol. 2016, 36, 97–108. [Google Scholar] [CrossRef]
  37. Anderson, J.B.; Conway, H.; Bart, P.J.; Witus, A.E.; Greenwood, S.L.; McKay, R.M.; Hall, B.L.; Ackert, R.P.; Licht, K.; Jakobsson, M.; et al. Ross Sea paleo-ice sheet drainage and deglacial history during and since the LGM. Quat. Sci. Rev. 2014, 100, 31–54. [Google Scholar] [CrossRef]
  38. Lee, J.I.; McKay, R.M.; Golledge, N.R.; Yoon, H.I.; Yoo, K.-C.; Kim, H.J.; Hong, J.K. Widespread persistence of expanded East Antarctic glaciers in the southwest Ross Sea during the last deglaciation. Geology 2017, 45, 403–406. [Google Scholar] [CrossRef]
  39. Cui, C.; Tang, Z.; Rebesco, M.; Santis, L.D. Sedimentary records of enhanced deep ventilation during the last deglaciation in the Ross Sea, Southern Ocean. Quat. Sci. 2021, 41, 678–690. [Google Scholar] [CrossRef]
  40. Shao, H.; He, J.; Wu, L.; Wei, L. Elemental and Sr–Nd isotopic compositions of surface clay-size sediments in the front end of major ice shelves around Antarctica and indications for provenance. Deep Sea Res. Part II Top. Stud. Oceanogr. 2022, 195, 105011. [Google Scholar] [CrossRef]
  41. Reimer, P.J.; Austin, W.E.N.; Bard, E.; Bayliss, A.; Blackwell, P.G.; Bronk Ramsey, C.; Butzin, M.; Cheng, H.; Edwards, R.L.; Friedrich, M.; et al. The IntCal20 Northern Hemisphere Radiocarbon Age Calibration Curve (0–55 cal kBP). Radiocarbon 2020, 62, 725–757. [Google Scholar] [CrossRef]
  42. Yi, L.; Hu, B.; Zhao, J.; Jiang, X.; Shu, Y.; Wang, X.; Guo, J.; Wang, F.; Ding, X.; Liu, G.; et al. Magnetostratigraphy of Abyssal Deposits in the Central Philippine Sea and Regional Sedimentary Dynamics during the Quaternary. Paleoceanogr. Paleoclimatology 2022, 37, e2021PA004365. [Google Scholar] [CrossRef]
  43. Chen, Y.; Li, Y.; Lyu, W.; Xu, D.; Han, X.; Fu, T.; Yi, L. A 5000-Year Sedimentary Record of East Asian Winter Monsoon from the Northern Muddy Area of the East China Sea. Atmosphere 2020, 11, 1376. [Google Scholar] [CrossRef]
  44. Chen, Y.; Lyu, W.; Fu, T.; Li, Y.; Yi, L. Centennial Impacts of the East Asian Summer Monsoon on Holocene Deltaic Evolution of the Huanghe River, China. Appl. Sci. 2021, 11, 2799. [Google Scholar] [CrossRef]
  45. Li, Y.; Chen, Y.; Jiang, X.; Yi, L. Color Reflectance of Coastal Sediments in the South Bohai Sea and its Implication to Orbital Forcing of East Asian Summer Monsoon. Front. Earth Sci. 2021, 9, 760216. [Google Scholar] [CrossRef]
  46. Passega, R. Grain size representation by CM patterns as a geologic tool. J. Sediment. Res. 1964, 34, 830–847. [Google Scholar] [CrossRef]
  47. Weltje, G.J.; Prins, M.A. Genetically meaningful decomposition of grain-size distributions. Sediment. Geol. 2007, 202, 409–424. [Google Scholar] [CrossRef]
  48. Sun, D.; Bloemendal, J.; Rea, D.K.; Vandenberghe, J.; Jiang, F.; An, Z.; Su, R. Grain-size distribution function of polymodal sediments in hydraulic and aeolian environments, and numerical partitioning of the sedimentary components. Sediment. Geol. 2002, 152, 263–277. [Google Scholar] [CrossRef]
  49. Lei, G.; Zhang, H.; Zhang, W.; Niu, J.; Yang, M.; Chen, Y.; Fan, H.; Chang, F.; Li, B. The reliability and significance of the grainsize obtained by Mastersize 2000 laser analyzer. Acta Sedimentol. Sin. 2006, 24, 531–539. [Google Scholar] [CrossRef]
  50. Blaauw, M.; Christen, J.A. Flexible paleoclimate age-depth models using an autoregressive gamma process. Bayesian Anal. 2011, 6, 457–474. [Google Scholar] [CrossRef]
  51. Heaton, T.J.; Köhler, P.; Butzin, M.; Bard, E.; Reimer, R.W.; Austin, W.E.N.; Bronk Ramsey, C.; Grootes, P.M.; Hughen, K.A.; Kromer, B.; et al. Marine20—The Marine Radiocarbon Age Calibration Curve (0–55,000 cal BP). Radiocarbon 2020, 62, 779–820. [Google Scholar] [CrossRef]
  52. Stuiver, M.; Reimer, P.J. Extended 14C Data Base and Revised CALIB 3.0 14C Age Calibration Program. Radiocarbon 1993, 35, 215–230. [Google Scholar] [CrossRef]
  53. Fischer, H.; Fundel, F.; Ruth, U.; Twarloh, B.; Wegner, A.; Udisti, R.; Becagli, S.; Castellano, E.; Morganti, A.; Severi, M.; et al. Reconstruction of millennial changes in dust emission, transport and regional sea ice coverage using the deep EPICA ice cores from the Atlantic and Indian Ocean sector of Antarctica. Earth Planet. Sci. Lett. 2007, 260, 340–354. [Google Scholar] [CrossRef]
  54. Kotov, S.; Paelike, H. QAnalySeries—A cross-platform time series tuning and analysis tool. ESS Open Archive, 18 December 2018. [Google Scholar]
  55. Lisiecki, L.E.; Raymo, M.E. A Pliocene-Pleistocene stack of 57 globally distributed benthic δ18O records. Paleoceanography 2005, 20, PA1003. [Google Scholar] [CrossRef]
  56. Roberts, A.P.; Tauxe, L.; Heslop, D.; Zhao, X.; Jiang, Z. A Critical Appraisal of the “Day” Diagram. J. Geophys. Res. Solid Earth 2018, 123, 2618–2644. [Google Scholar] [CrossRef]
  57. Zheng, Y.; Anderson, R.F.; Beck, W.; Froelich, P.N.; Guilderson, T.; McNichol, A.P. Challenges in Radiocarbon Dating Organic Carbon in Opal-Rich Marine Sediments. Radiocarbon 2002, 44, 123–136. [Google Scholar] [CrossRef]
  58. Buizert, C.; Adrian, B.; Ahn, J.; Albert, M.; Alley, R.B.; Baggenstos, D.; Bauska, T.K.; Bay, R.C.; Bencivengo, B.B.; Bentley, C.R.; et al. Precise interpolar phasing of abrupt climate change during the last ice age. Nature 2015, 520, 661–665. [Google Scholar] [CrossRef]
  59. Barbante, C.; Barnola, J.M.; Becagli, S.; Beer, J.; Bigler, M.; Boutron, C.; Blunier, T.; Castellano, E.; Cattani, O.; Chappellaz, J.; et al. One-to-one coupling of glacial climate variability in Greenland and Antarctica. Nature 2006, 444, 195–198. [Google Scholar] [CrossRef]
  60. Etourneau, J.; Sgubin, G.; Crosta, X.; Swingedouw, D.; Willmott, V.; Barbara, L.; Houssais, M.-N.; Schouten, S.; Damsté, J.S.S.; Goosse, H.; et al. Ocean temperature impact on ice shelf extent in the eastern Antarctic Peninsula. Nat. Commun. 2019, 10, 304. [Google Scholar] [CrossRef]
  61. Denton, G.H.; Marchant, D.R. The geologic basis for a reconstruction of a grounded ice sheet in McMurdo Sound, Antarctica, at the Last Glacial Maximum. Geogr. Ann. Ser. A Phys. Geogr. 2000, 82, 167–211. [Google Scholar] [CrossRef]
  62. Hall, B.L.; Baroni, C.; Denton, G.H. Holocene relative sea-level history of the southern Victoria Land coast, Antarctica. Glob. Planet. Chang. 2004, 42, 241–263. [Google Scholar] [CrossRef]
  63. Jones, R.S.; Mackintosh, A.N.; Norton, K.P.; Golledge, N.R.; Fogwill, C.J.; Kubik, P.W.; Christl, M.; Greenwood, S.L. Rapid Holocene thinning of an East Antarctic outlet glacier driven by marine ice sheet instability. Nat. Commun. 2015, 6, 8910. [Google Scholar] [CrossRef] [PubMed]
Figure 1. Locations of the studied sites, and circulation patterns in the Ross Sea. AASW: Antarctic Surface Water (red arrows); CDW: Circumpolar Deep Water (blue arrows); MCDW: Modified Circumpolar Deep Water (orange arrows); DSW: Dense Shelf Water (green arrows); ISW: Ice Shelf Water (purple arrows). Circulation patterns of the Ross Sea were modified from the work of Smith et al. [35]. Data of core ANT31-JB06 were from Huang et al. [36].
Jmse 12 00254 g001
Figure 2. Grain size variation of cores ANT31-JB03, ANT31-JB06, and ANT32-RB16C. The red triangle points represent AMS 14C dates. Data of core ANT31-JB06 were from Huang et al. [36].
Jmse 12 00254 g002
Figure 3. Grain-size properties of cores ANT31-JB03, ANT31-JB06, and ANT32-RB16C. (a) Triangle diagram. (b) C–M diagram. (c) Frequency distribution. The solid line represents the average curve and the ribbon is 1σ error. (df) PCA results. Data of core ANT31-JB06 were from Huang et al. [36].
Jmse 12 00254 g003
Figure 4. The age–depth model of the studied cores. Black dots represent calendar dates with 2σ errors. The plot was derived from the Bacon program. Data of core ANT31-JB06 were from Huang et al. [36].
Jmse 12 00254 g004
Figure 5. Magnetic susceptibility records (χ) of cores ANT31-JB03, ANT31-JB06, and ANT32-RB16C (ac). EDML nssCa2+ data (df) were from Fischer et al. [53]. Tuning the magnetic susceptibility records (χ) of cores ANT31-JB03, ANT31-JB06, and ANT32-RB16C to the Antarctic ice-core nssCa2+ record (gi). The tuning processes were performed using the QAnalySeries 151 software developed by Kotov et al. [54]. Data of core ANT31-JB06 were from Huang et al. [36]. Marine Isotopic Stages (MIS) based on global δ18O changes were labeled [55].
Jmse 12 00254 g005
Figure 6. Scatterplot between various magnetic parameters of cores ANT31-JB03 and ANT32-RB16C.
Jmse 12 00254 g006
Figure 7. Hysteresis loops (calibrated) and IRM acquisition curves of cores ANT31-JB03 (green) and ANT32-RB16C (red).
Jmse 12 00254 g007
Figure 8. FORC diagram for four representative samples of cores ANT31-JB03 and ANT32-RB16C.
Jmse 12 00254 g008
Figure 9. Chronological difference between two age–depth models.
Jmse 12 00254 g009
Figure 10. Comparisons of magnetic susceptibility and sediment grain-size components between the two age–depth models of the studied cores. (a,c) AMS 14C-based model; (b,d) tuning-based model. The thin lines represent the original values, and the bold lines indicate 1 kyr moving average. Marine Isotopic Stages (MIS) based on global δ18O changes were labeled [55].
Jmse 12 00254 g010
Figure 11. Paleoenvironmental processes recorded in the studied cores and their linkage to Antarctic climate changes. The WDC δ18O record (11-point smoothed green curve) [58]. The stacked anomaly of sea surface temperature in the Southern Ocean (SO SST) [7]. The Antarctic Cold Reversal (ACR, blue) and Antarctic Isotopic Maxima (AIM 0–2, orange) were labeled [59]. Data of core ANT31-JB06 were from Huang et al. [36]. Marine Isotopic Stages (MIS) based on global δ18O changes were labeled [55].
Jmse 12 00254 g011
Table 1. Coordinates, water depths, and lengths of the studied cores.
StationLatitudeLongitudeWater Depths (m)Length (cm)
ANT31-JB0375°49′00″ S170°41′14″ E614.0 132
ANT31-JB0674°28′22″ S173°54′24″ E567.5 299
ANT32-RB16C74°31′06″ S175°07′15″ E471.0 232
Table 2. Results of principal component analysis of sediment grain size of cores ANT31-JB03, ANT31-JB06, and ANT32-RB16C.
Initial Eigenvalues/Extraction
ComponentTotal% of VarianceCumulative %
ANT31-JB03124.63737.32937.329
213.63420.65857.987
313.32320.18678.173
46.73310.20188.374
ANT31-JB06130.54336.36136.361
221.16925.20161.562
312.29114.63276.194
46.5827.83684.029
ANT32-RB16C122.60934.25634.256
216.90525.61359.869
312.96619.64679.515
45.5398.39287.908
Table 3. AMS 14C dating results of the three studied cores.
CoreDepth (cm)SourceConventional Age ± 1σ (a BP)Calendar Age ± 2σ (cal a BP)
ANT31-JB030–2O4060 ± 30347 ± 413
2–4O4140 ± 30427 ± 421
18–20O6140 ± 301898 ± 425
54–56O10,690 ± 407280 ± 368
68–70O12,530 ± 409299 ± 467
72–74O13,130 ± 5010,059 ± 488
78–80O25,000 ± 10024,583 ± 517
102–104O26,940 ± 12026,615 ± 491
108–110O25,440 ± 11025,103 ± 509
110–112O27,120 ± 14026,787 ± 474
112–114O27,130 ± 13026,799 ± 462
118–120O25,560 ± 11025,239 ± 480
130–132O25,580 ± 11025,260 ± 475
ANT31-JB060–2O3870 ± 15157 ± 439
40–42O5175 ± 15858 ± 337
72–74O8110 ± 204354 ± 454
104–106O14,100 ± 3011,427 ± 526
140–142O16,010 ± 4013,666 ± 439
220–222O18,360 ± 5016,898 ± 480
240–242O18,355 ± 4516,892 ± 477
240–242B 15,310 ± 3516,892 ± 471
248–250B 20,300 ± 6022,721 ± 414
254–256B 20,300 ± 6022,721 ± 414
268–270B 24,290 ± 9027,019 ± 449
ANT32-RB16C0–2O6000 ± 301730 ± 414
4–6O5150 ± 30835 ± 337
6–8O5440 ± 301118 ± 369
42–44O9620 ± 406122 ± 399
44–46O8960 ± 305406 ± 427
72–74O16,400 ± 5014,222 ± 573
74–76O17,520 ± 5015,831 ± 498
136–138O25,610 ± 10025,292 ± 457
138–140O24,910 ± 9024,475 ± 513
154–156O26,390 ± 11026,037 ± 434
204–206O25,040 ± 10024,631 ± 513
206–208O27,410 ± 13027,086 ± 492
230–232O25,420 ± 10025,080 ± 504
Notes: 14C dates are converted to calendar ones (2 sigma) using the CALIB 8.20 with Marine 20 calibration curves [51,52]. Carbon sources for dating: O, organic materials; and B, benthic foraminifera Cassidulina sp. Radiocarbon dates of core ANT31-JB06 were from Huang et al. [36].
Table 4. The age–depth model of the studied cores based on tuning magnetic susceptibility records to the Antarctic ice-core nssCa2+ record.
JB03
Depth (cm)
Age (ka)JB06
Depth (cm)
Age (ka)RB16C
Depth (cm)
Age (ka)
3312.80 312.80 2512.80
4115.70 3714.29 4114.80
5717.63 4514.80 7316.21
6921.62 6715.70 8717.63
8323.57 7917.63 12321.62
8923.87 9921.62 13923.12
10324.71 10722.25 15124.71
11725.12 12123.57 18525.12
12325.20 14924.71 20125.40
21125.12 21925.72
22325.27
23925.72
25527.02
27330.10
29130.95
Table 5. Correlation analysis between magnetic susceptibility and sediment grain size of the studied cores and the EDML nssCa2+ record.
ANT31-JB03ANT31-JB06ANT32-RB16C
χ χ χ
EDML nssCa2+0.737EDML nssCa2+0.812EDML nssCa2+0.855
F1
(134.0–466.5 μm)
0.619F3
(121.8–213.2 μm)
0.436F1
(116.6–535.9 μm)
0.644
F3
(3.2–4.8 μm)
0.453F1
(5.1–17.2 μm)
−0.669F2
(2.1–8.4 μm)
0.525
Notes: all correlation coefficients are significant at p < 0.01 level.
Disclaimer/Publisher’s Note: The statements, opinions and data contained in all publications are solely those of the individual author(s) and contributor(s) and not of MDPI and/or the editor(s). MDPI and/or the editor(s) disclaim responsibility for any injury to people or property resulting from any ideas, methods, instructions or products referred to in the content.

