4.1. Actual Ship Experiment
The experiment is divided into two parts: actual ship experiment and simulation experiment. The actual ship experiment uses a built-in intelligent ship navigation test system to record the movement data during ship collision avoidance, and the test evaluation system evaluates the entire process of collision avoidance. This actual ship experiment was operated by an experienced captain. The simulation experiment uses the Matlab simulation platform to simulate ship collision avoidance using the improved VO algorithm and the traditional VO algorithm and record movement data during the collision avoidance process. Finally, the established evaluation system evaluates manual collision avoidance, traditional algorithm collision avoidance, and improved algorithm collision avoidance.
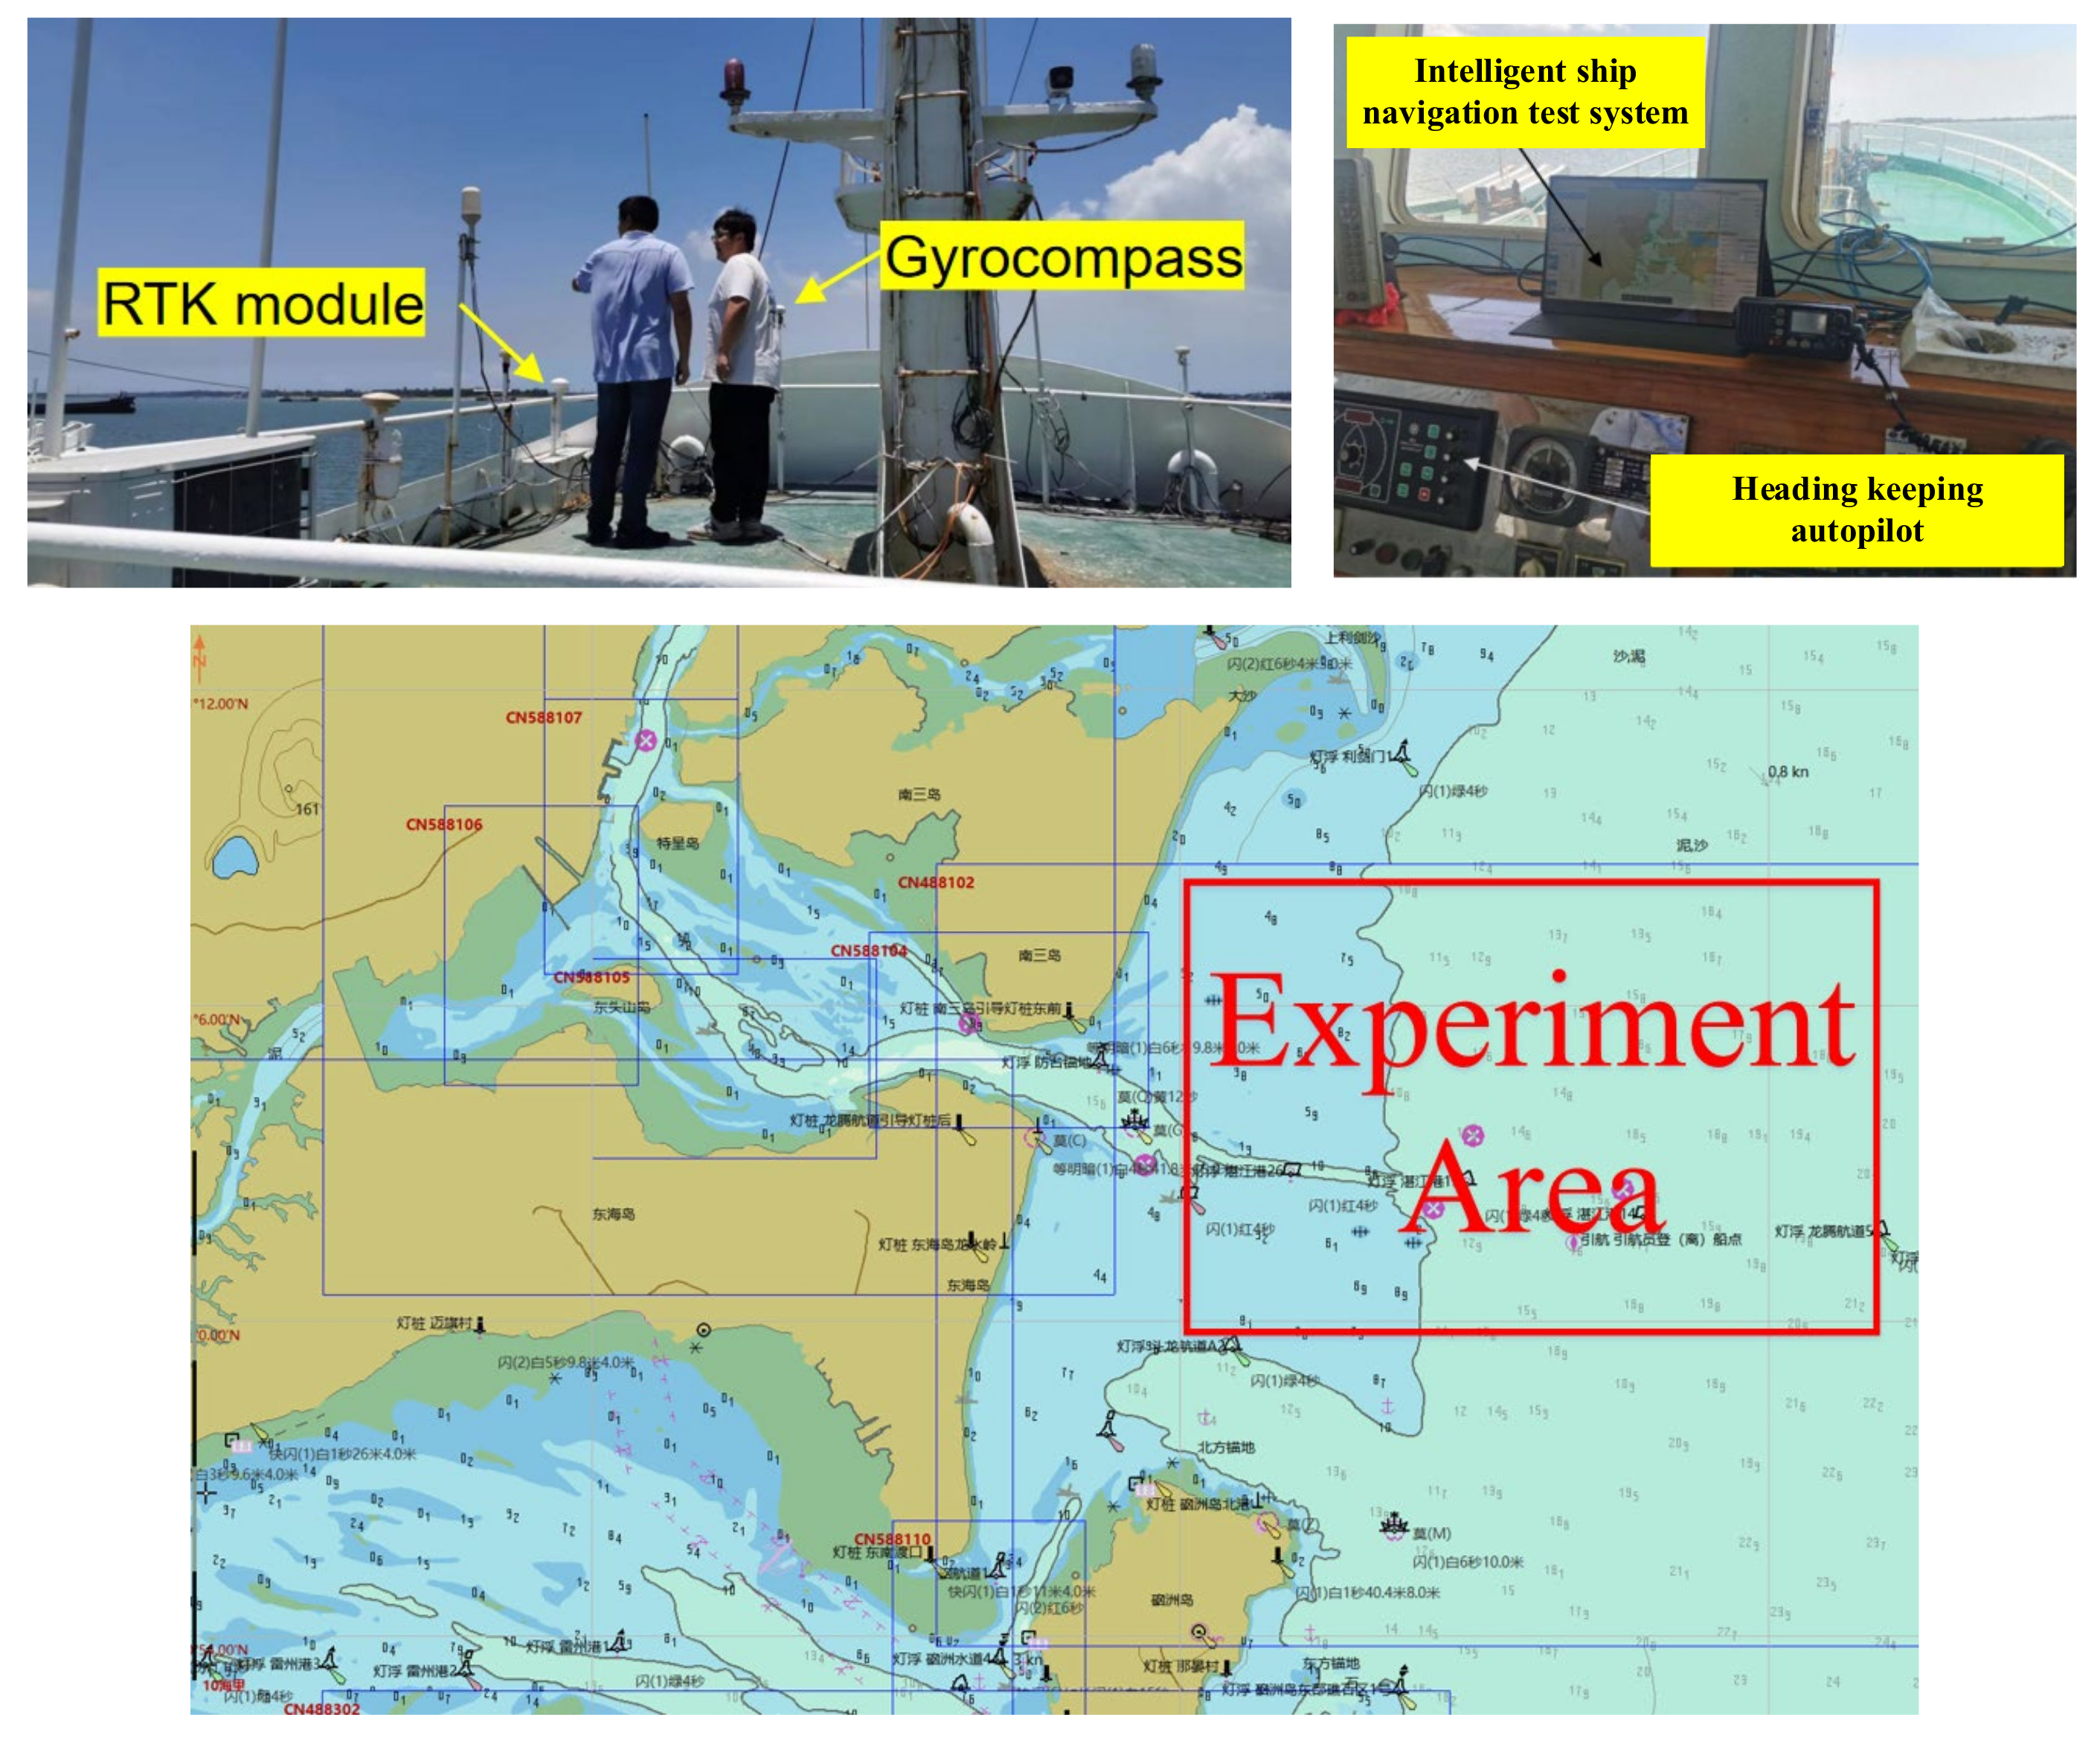
For the actual ship experiment, a sea-going fishing vessel was updated as the test platform, which is equipped with a course keeping autopilot, achieving the course keeping error between 1 and 2° during the test. To collect the vessel’s movement and turning data, a real time kinematic (RTK) module based on GPS and a gyrocompass. The test was conducted in Zhanjiang Bay area, as shown in
Figure 9.
The specific parameters of the experimental platform are shown in
Table 3.
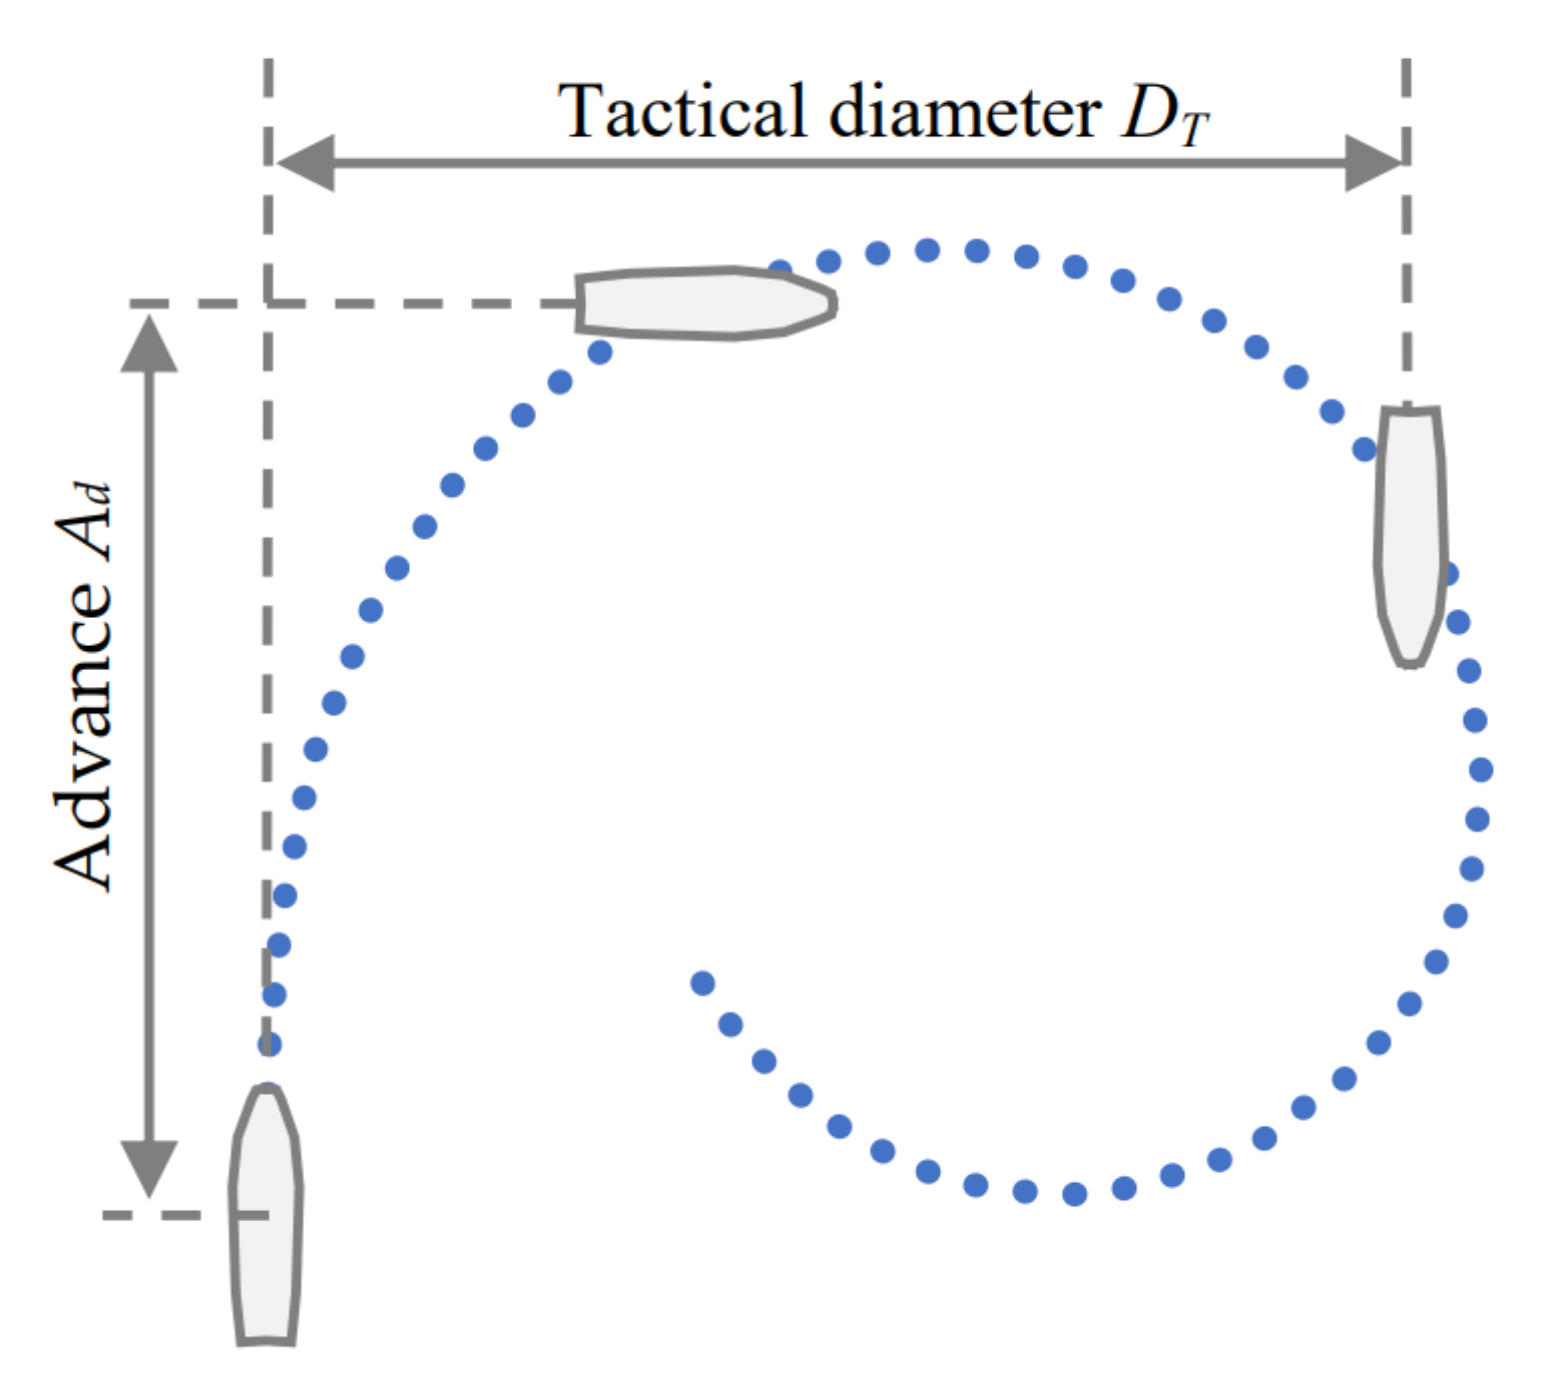
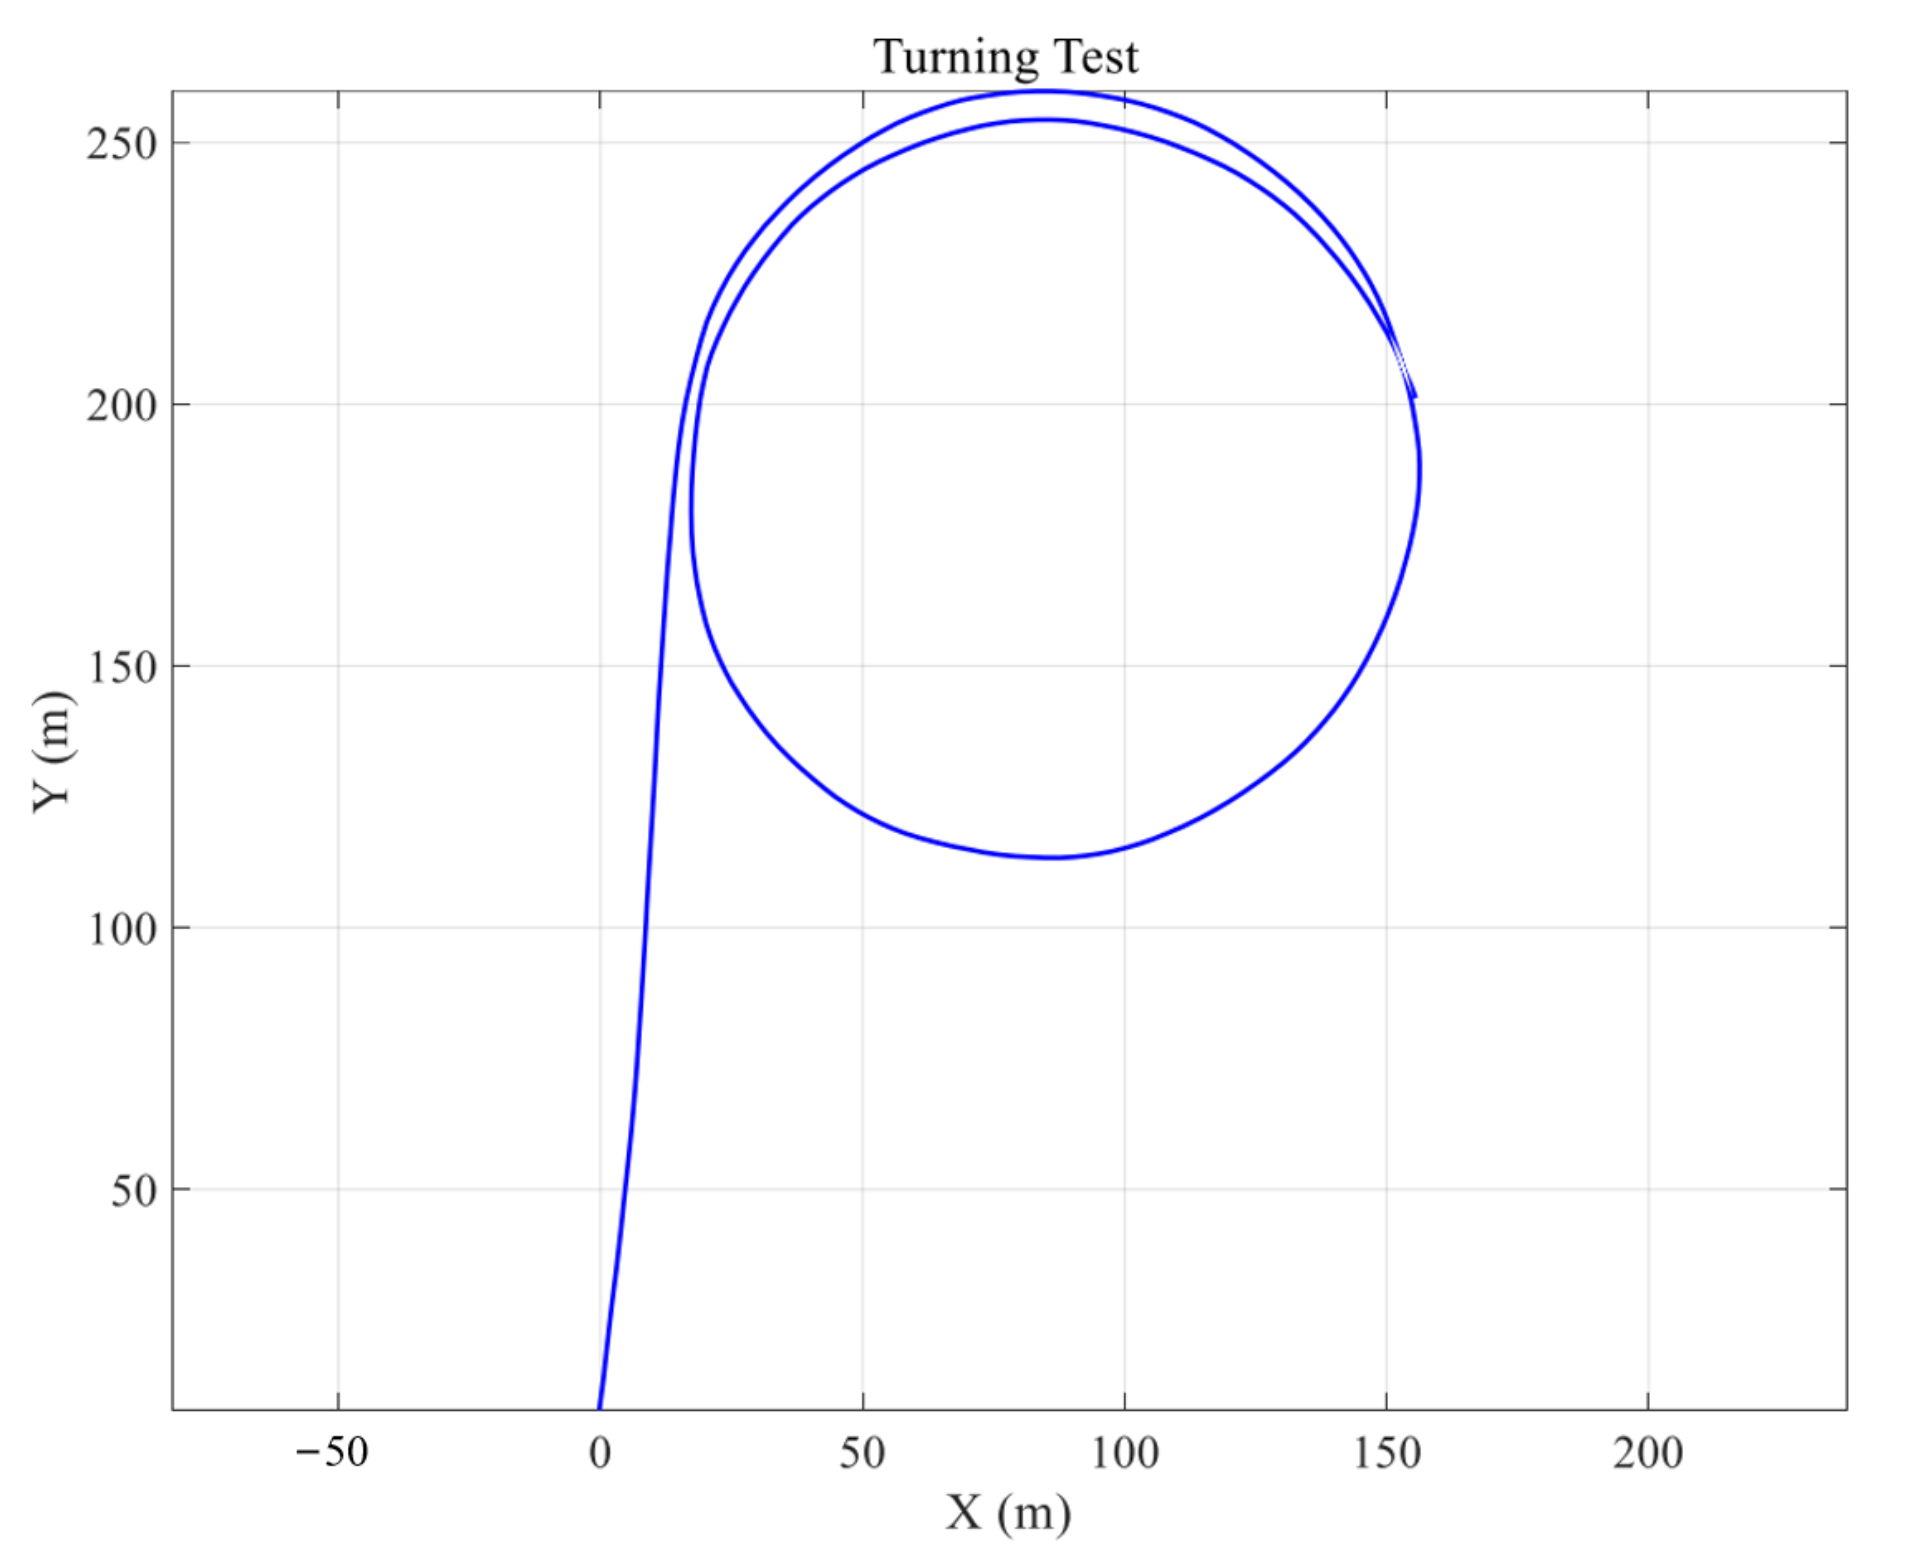
To verify the
value in OV model, this paper conducted an actual ship turning test and obtained specific parameters as shown in
Table 4.
The full rudder turning test of the test ship is shown in
Figure 10:
The following is a brief introduction to the evaluation index system of the ship’s intelligent navigation test system: the collision avoidance process is evaluated from three aspects: safety, economy, and practicality. The safety evaluation index is mainly used to judge whether the collision avoidance process meets the regulatory requirements and ensures the safety of the ship, including whether it enters imminent danger, the minimum encounter distance, etc. The economic evaluation index is used to evaluate whether the collision avoidance process is economical, whether it can shorten the operation time, and shorten the distance, including deviation factor, maximum alteration of course, total collision avoidance time, and other indicators. Practicality evaluation indicators are used to judge whether it meets the requirements of simple operation and whether it is suitable for actual ship operations, including indicators such as steering frequency. The analytic hierarchy process (AHP) is used to study the weights of the above indicators to form a final complete evaluation system.
Actual ship experiment collision avoidance test method process: The test ship maintains a constant speed and travels in the designated test waters, coordinates are converted to the preset encounter situation according to the longitude, latitude, and course of the test ships, and ships’ courses are generated by the AIS simulator. The distance between the two ships is about 1–6 NM (nautical mile). The own ship is operated by the captain to avoid collisions. In order to improve the efficiency of the actual ship experiment, when there is no collision risk between these two test ships and the own ship returns ±2° to the original course, the collision avoidance is ended. During this process, the experiment evaluation system records the navigation data of the collision avoidance process and generates an evaluation report.
4.2. The Evaluation of Experimental Data
In accordance with the international rules for avoiding collisions at sea, this article simulates encounter situations in three situations: head-on, crossing, and overtaking, in which the ship has the duty to avoid. In order to make the experiment results of the improved VO algorithm, the traditional VO algorithm, and the actual ship experiment comparable in these three situations, it is necessary to maintain situation consistency between the actual ship experiment and the simulation experiment. The initial parameter settings of the actual ship experiment are shown in
Table 5.
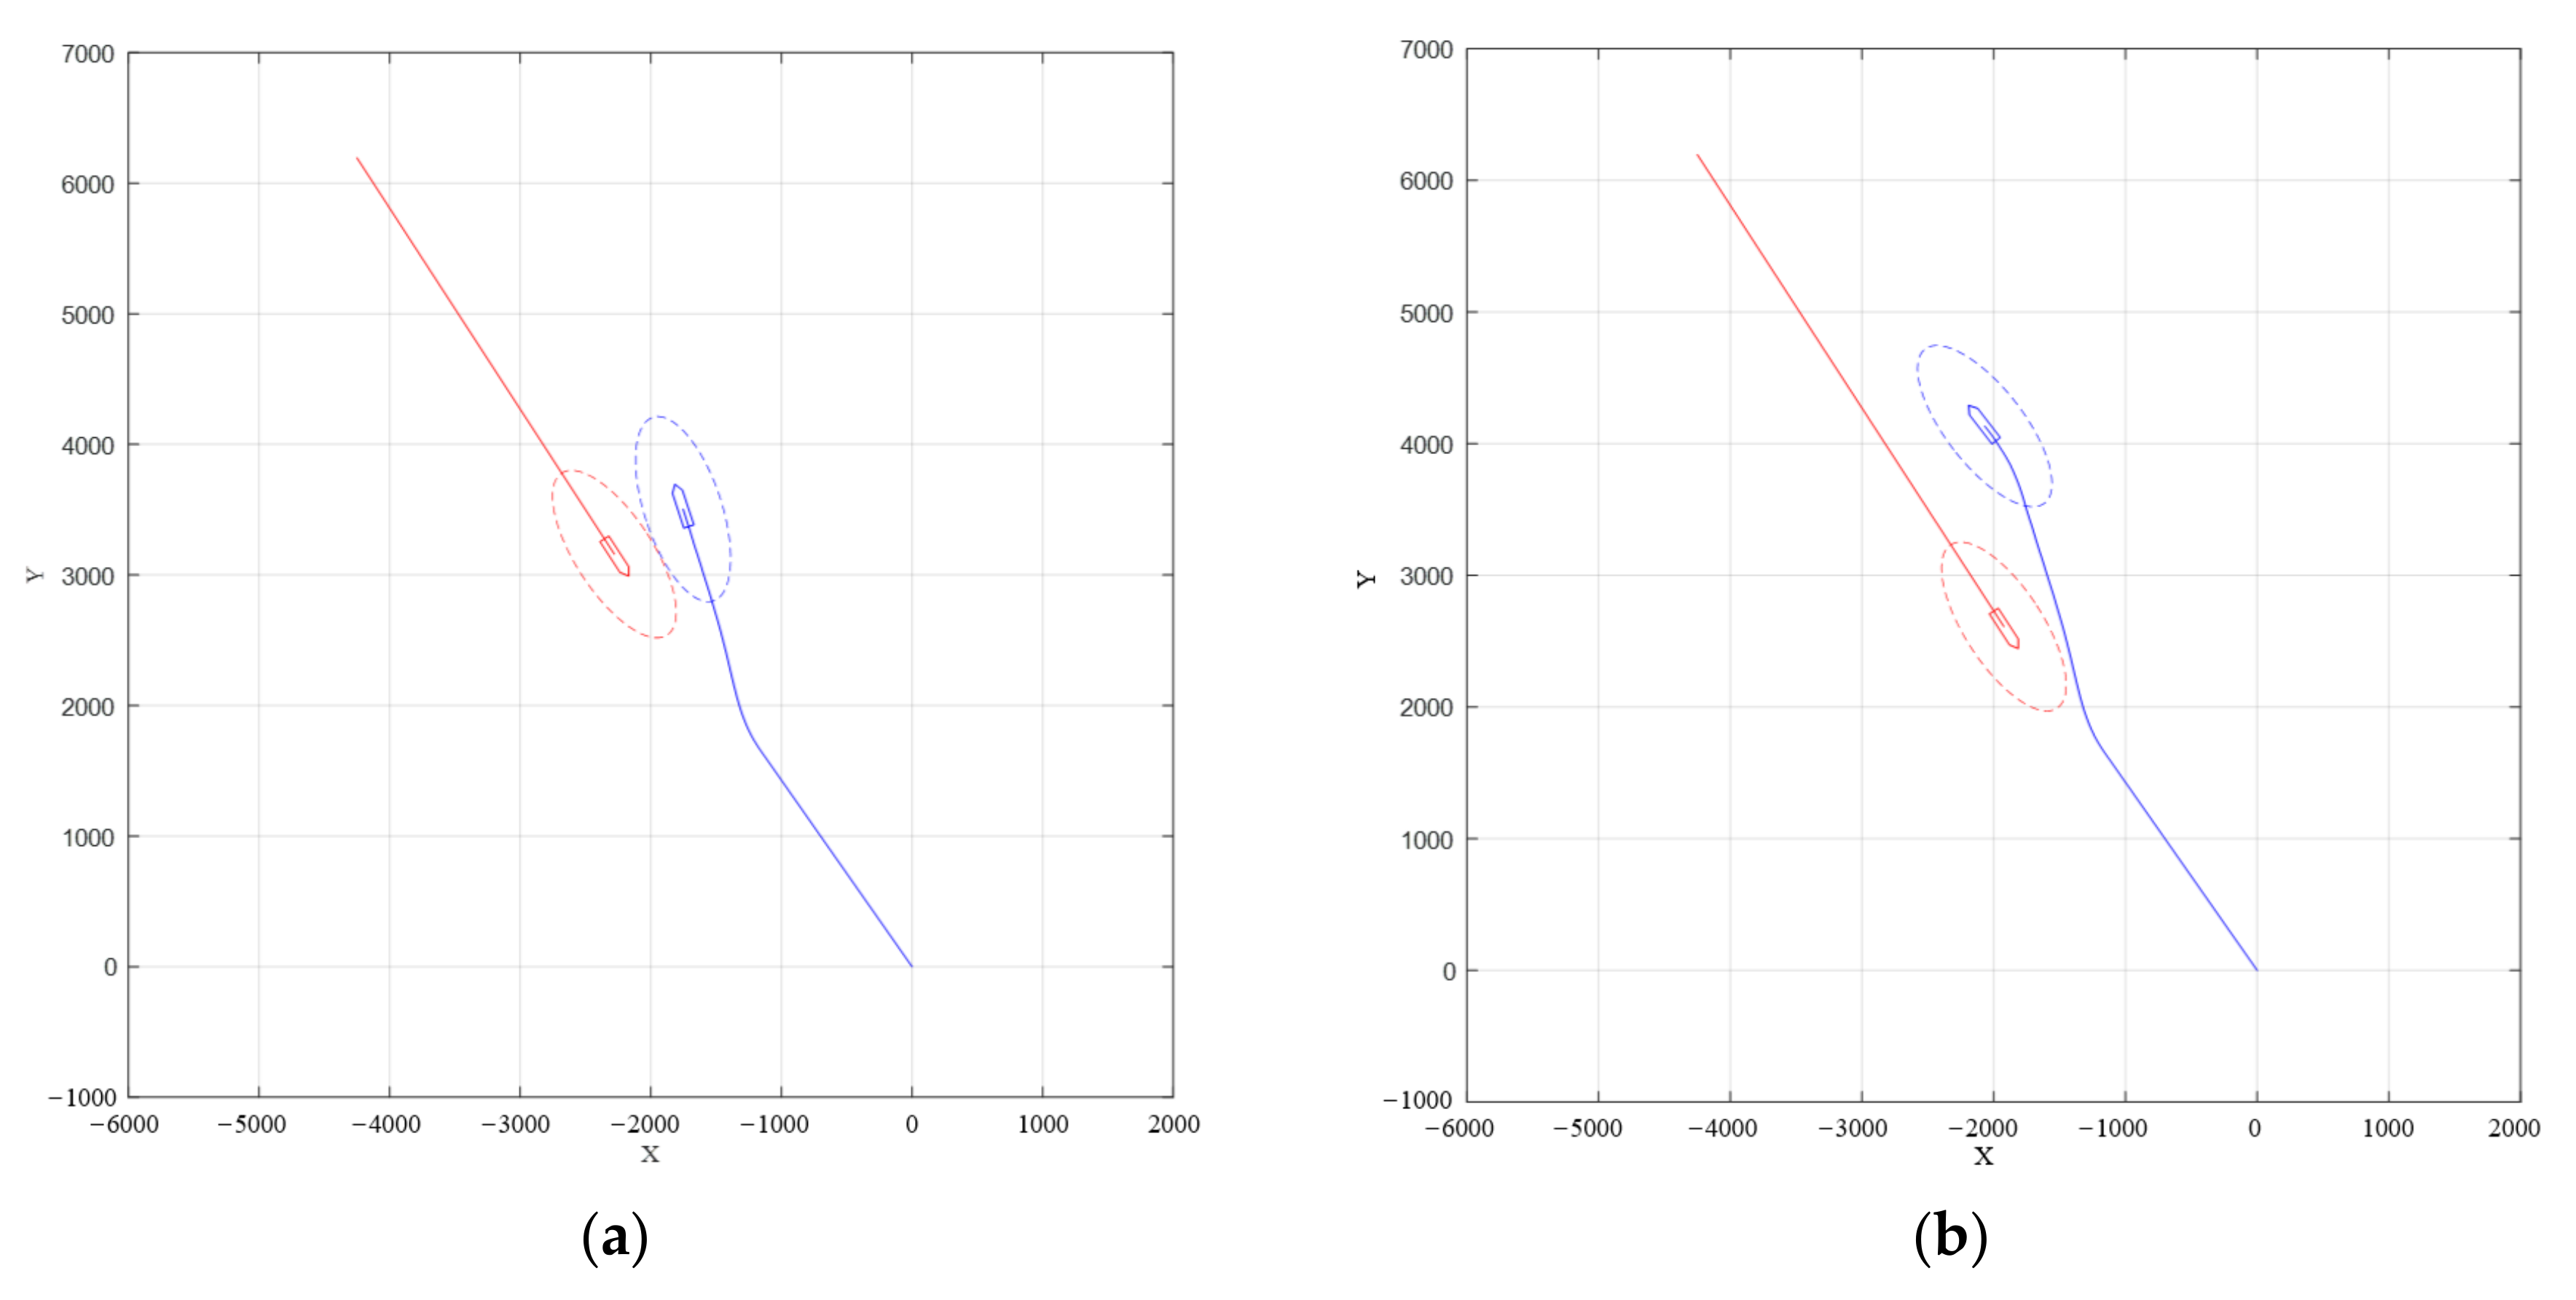
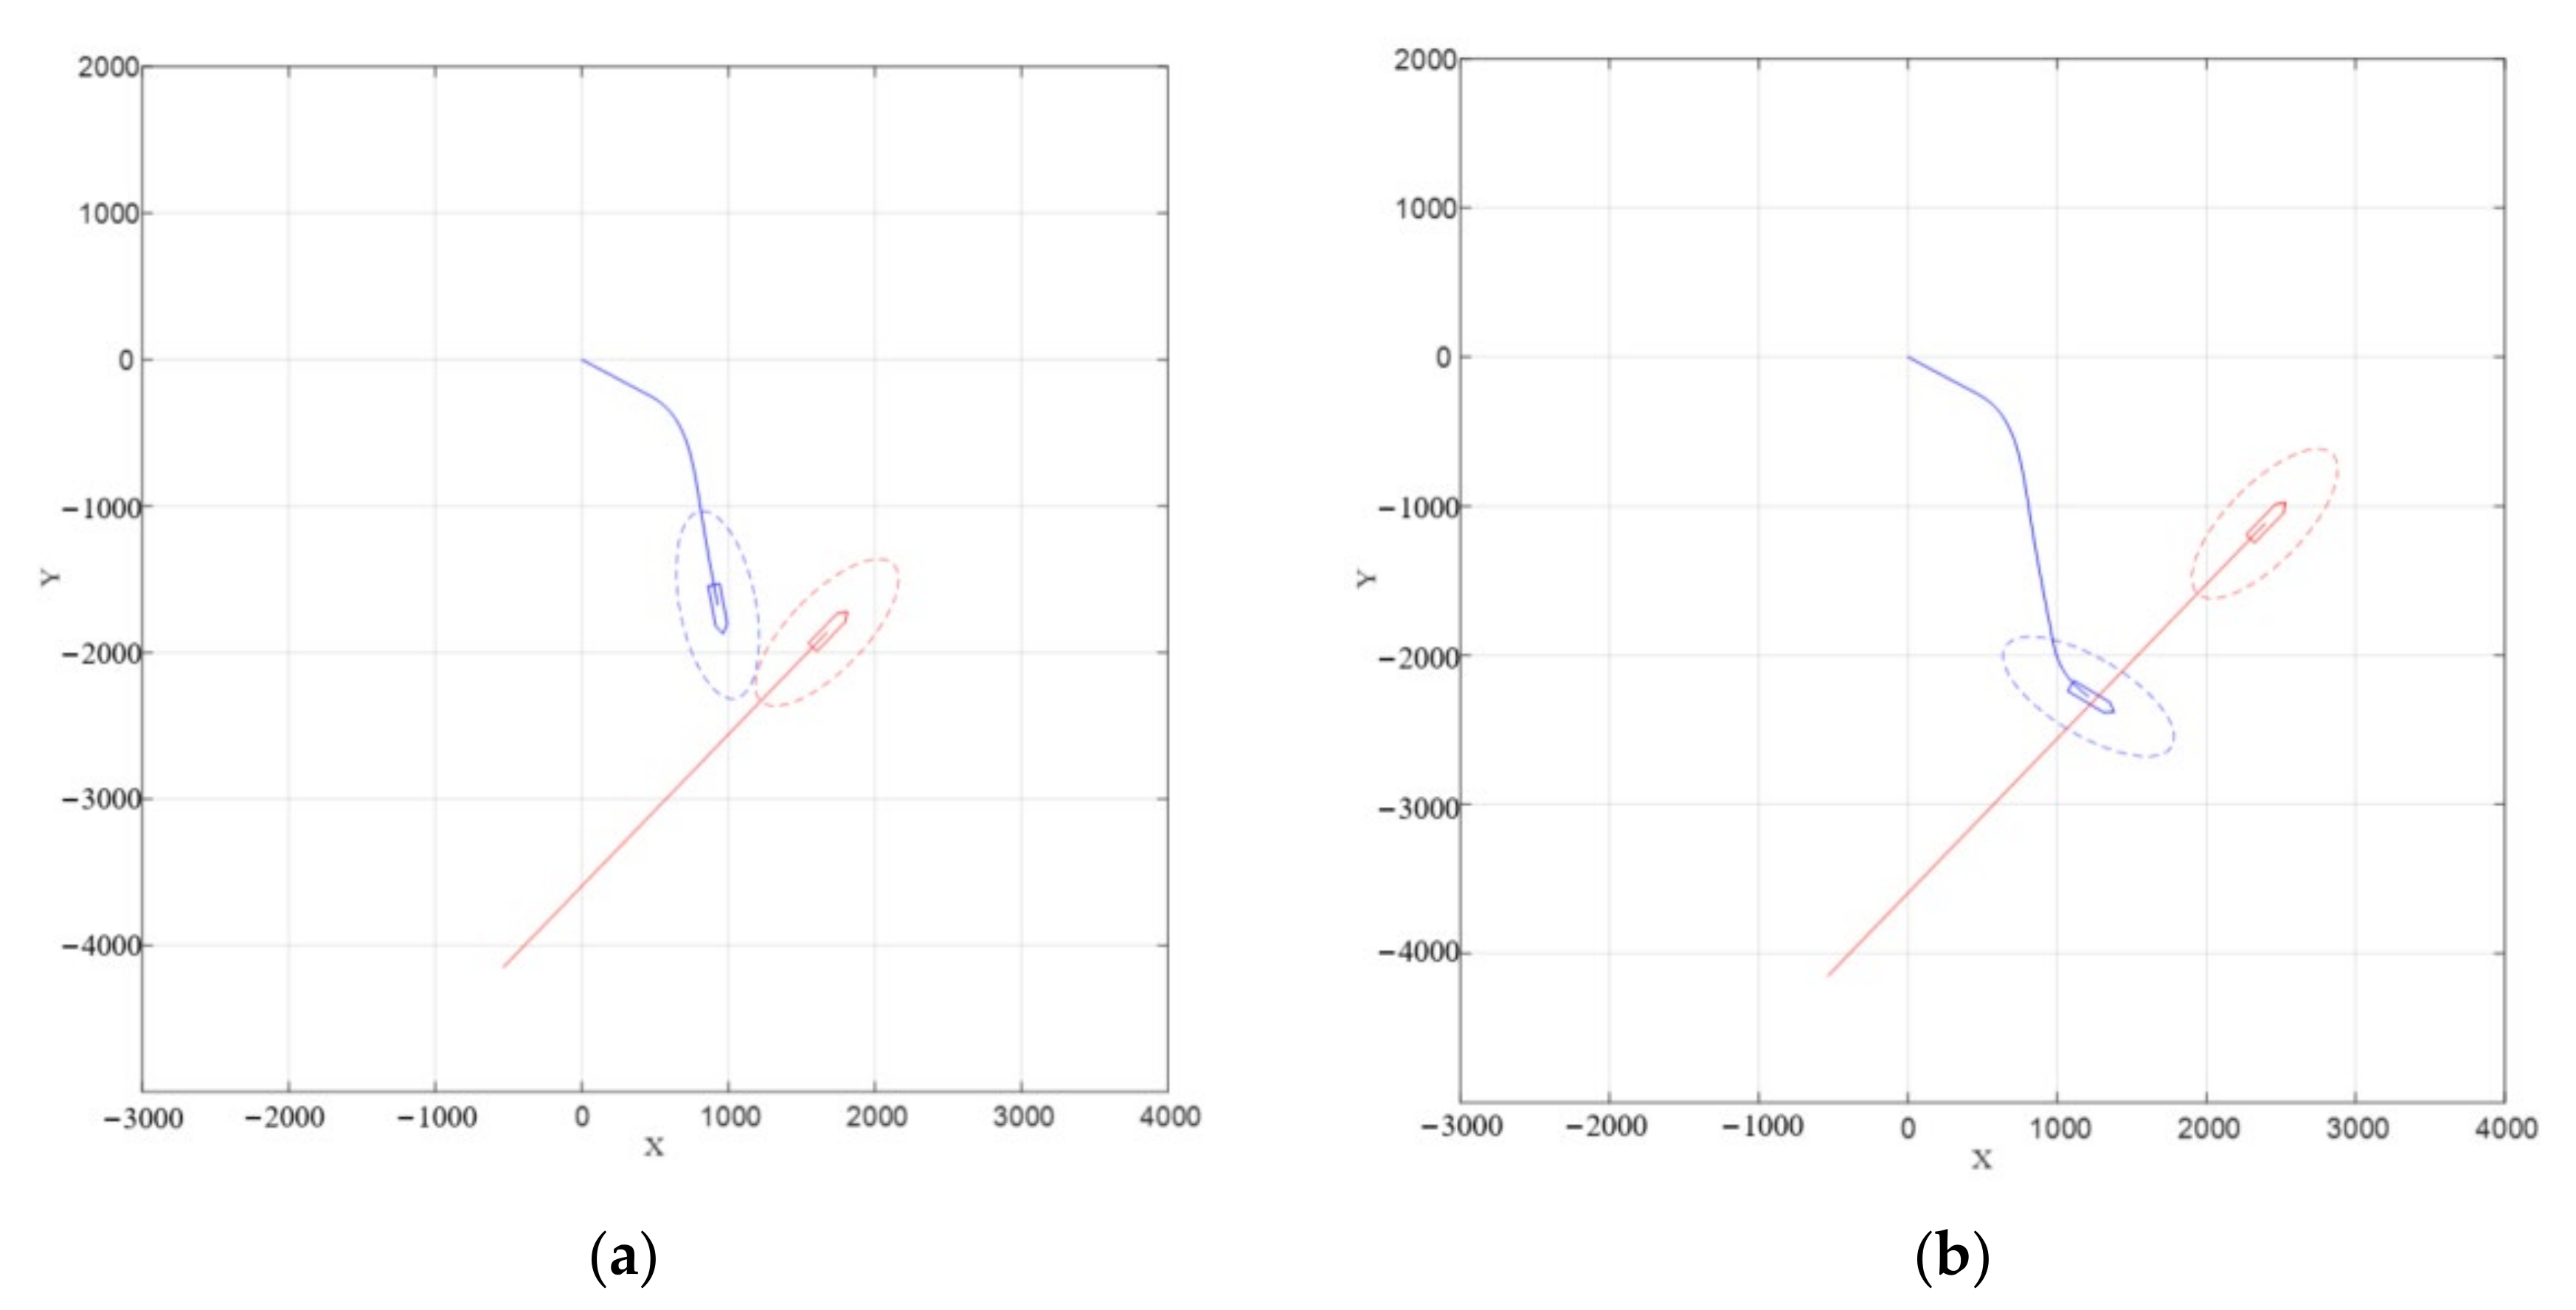
Figure 11,
Figure 12 and
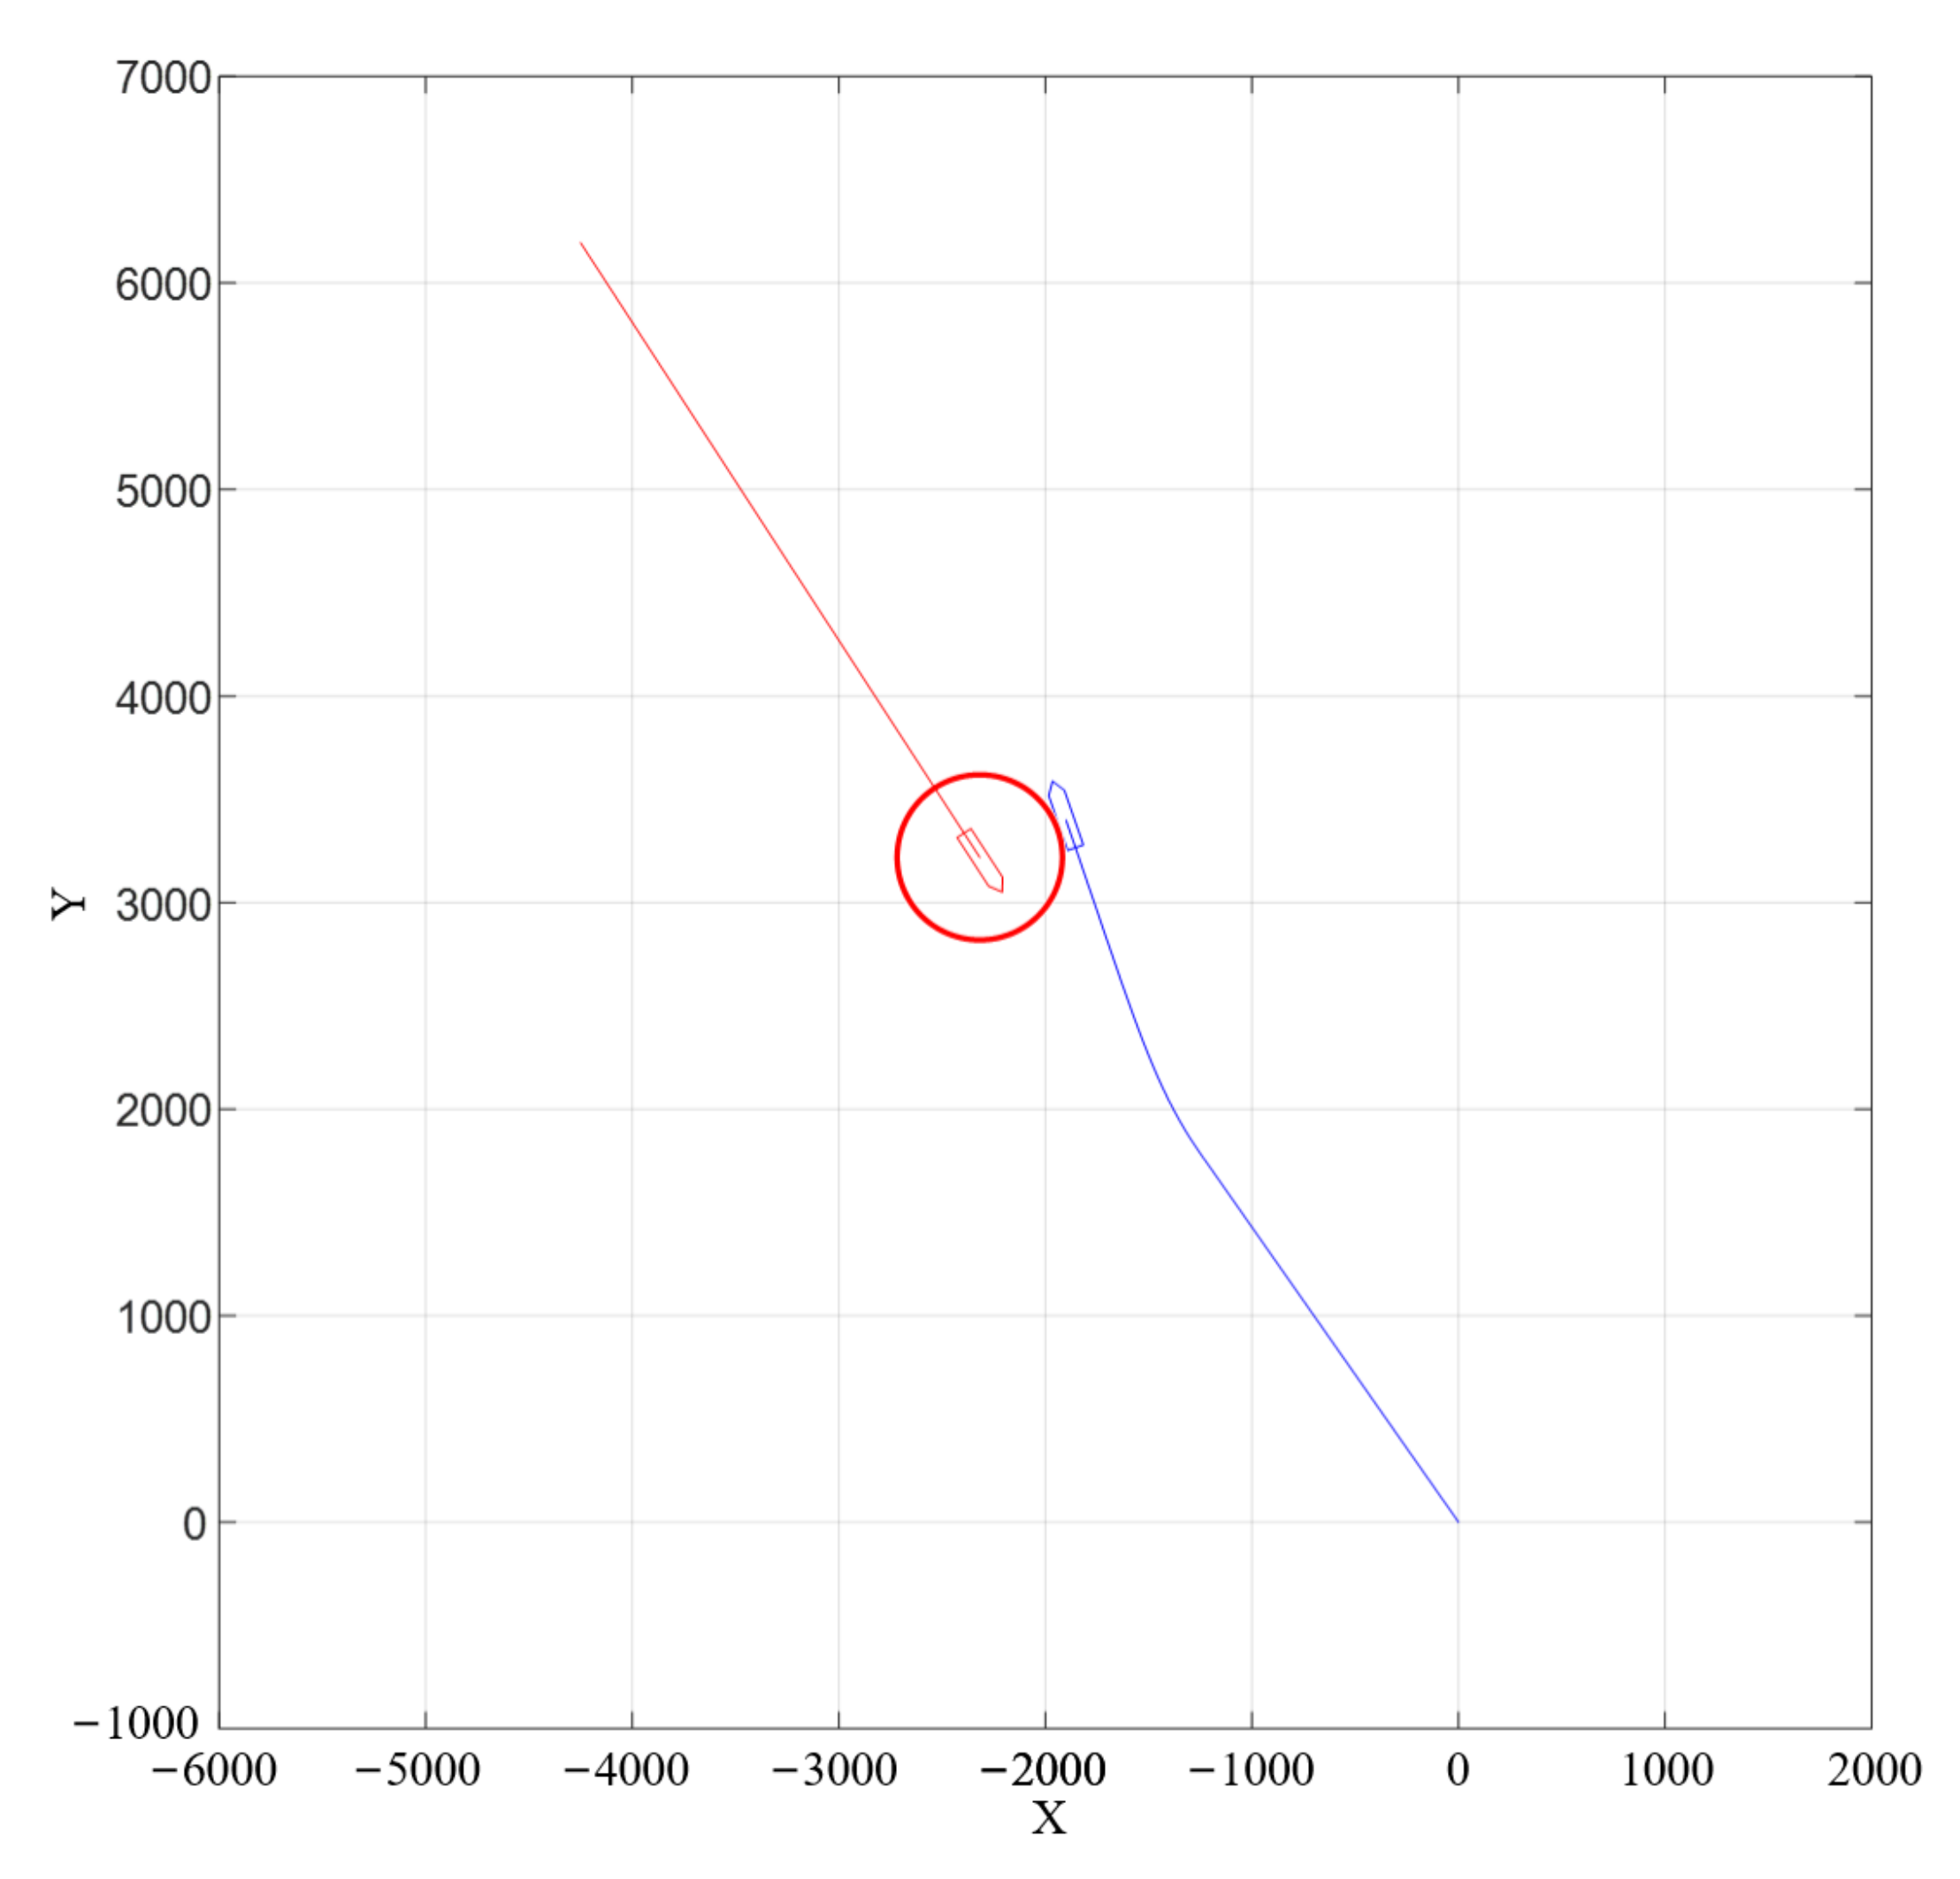
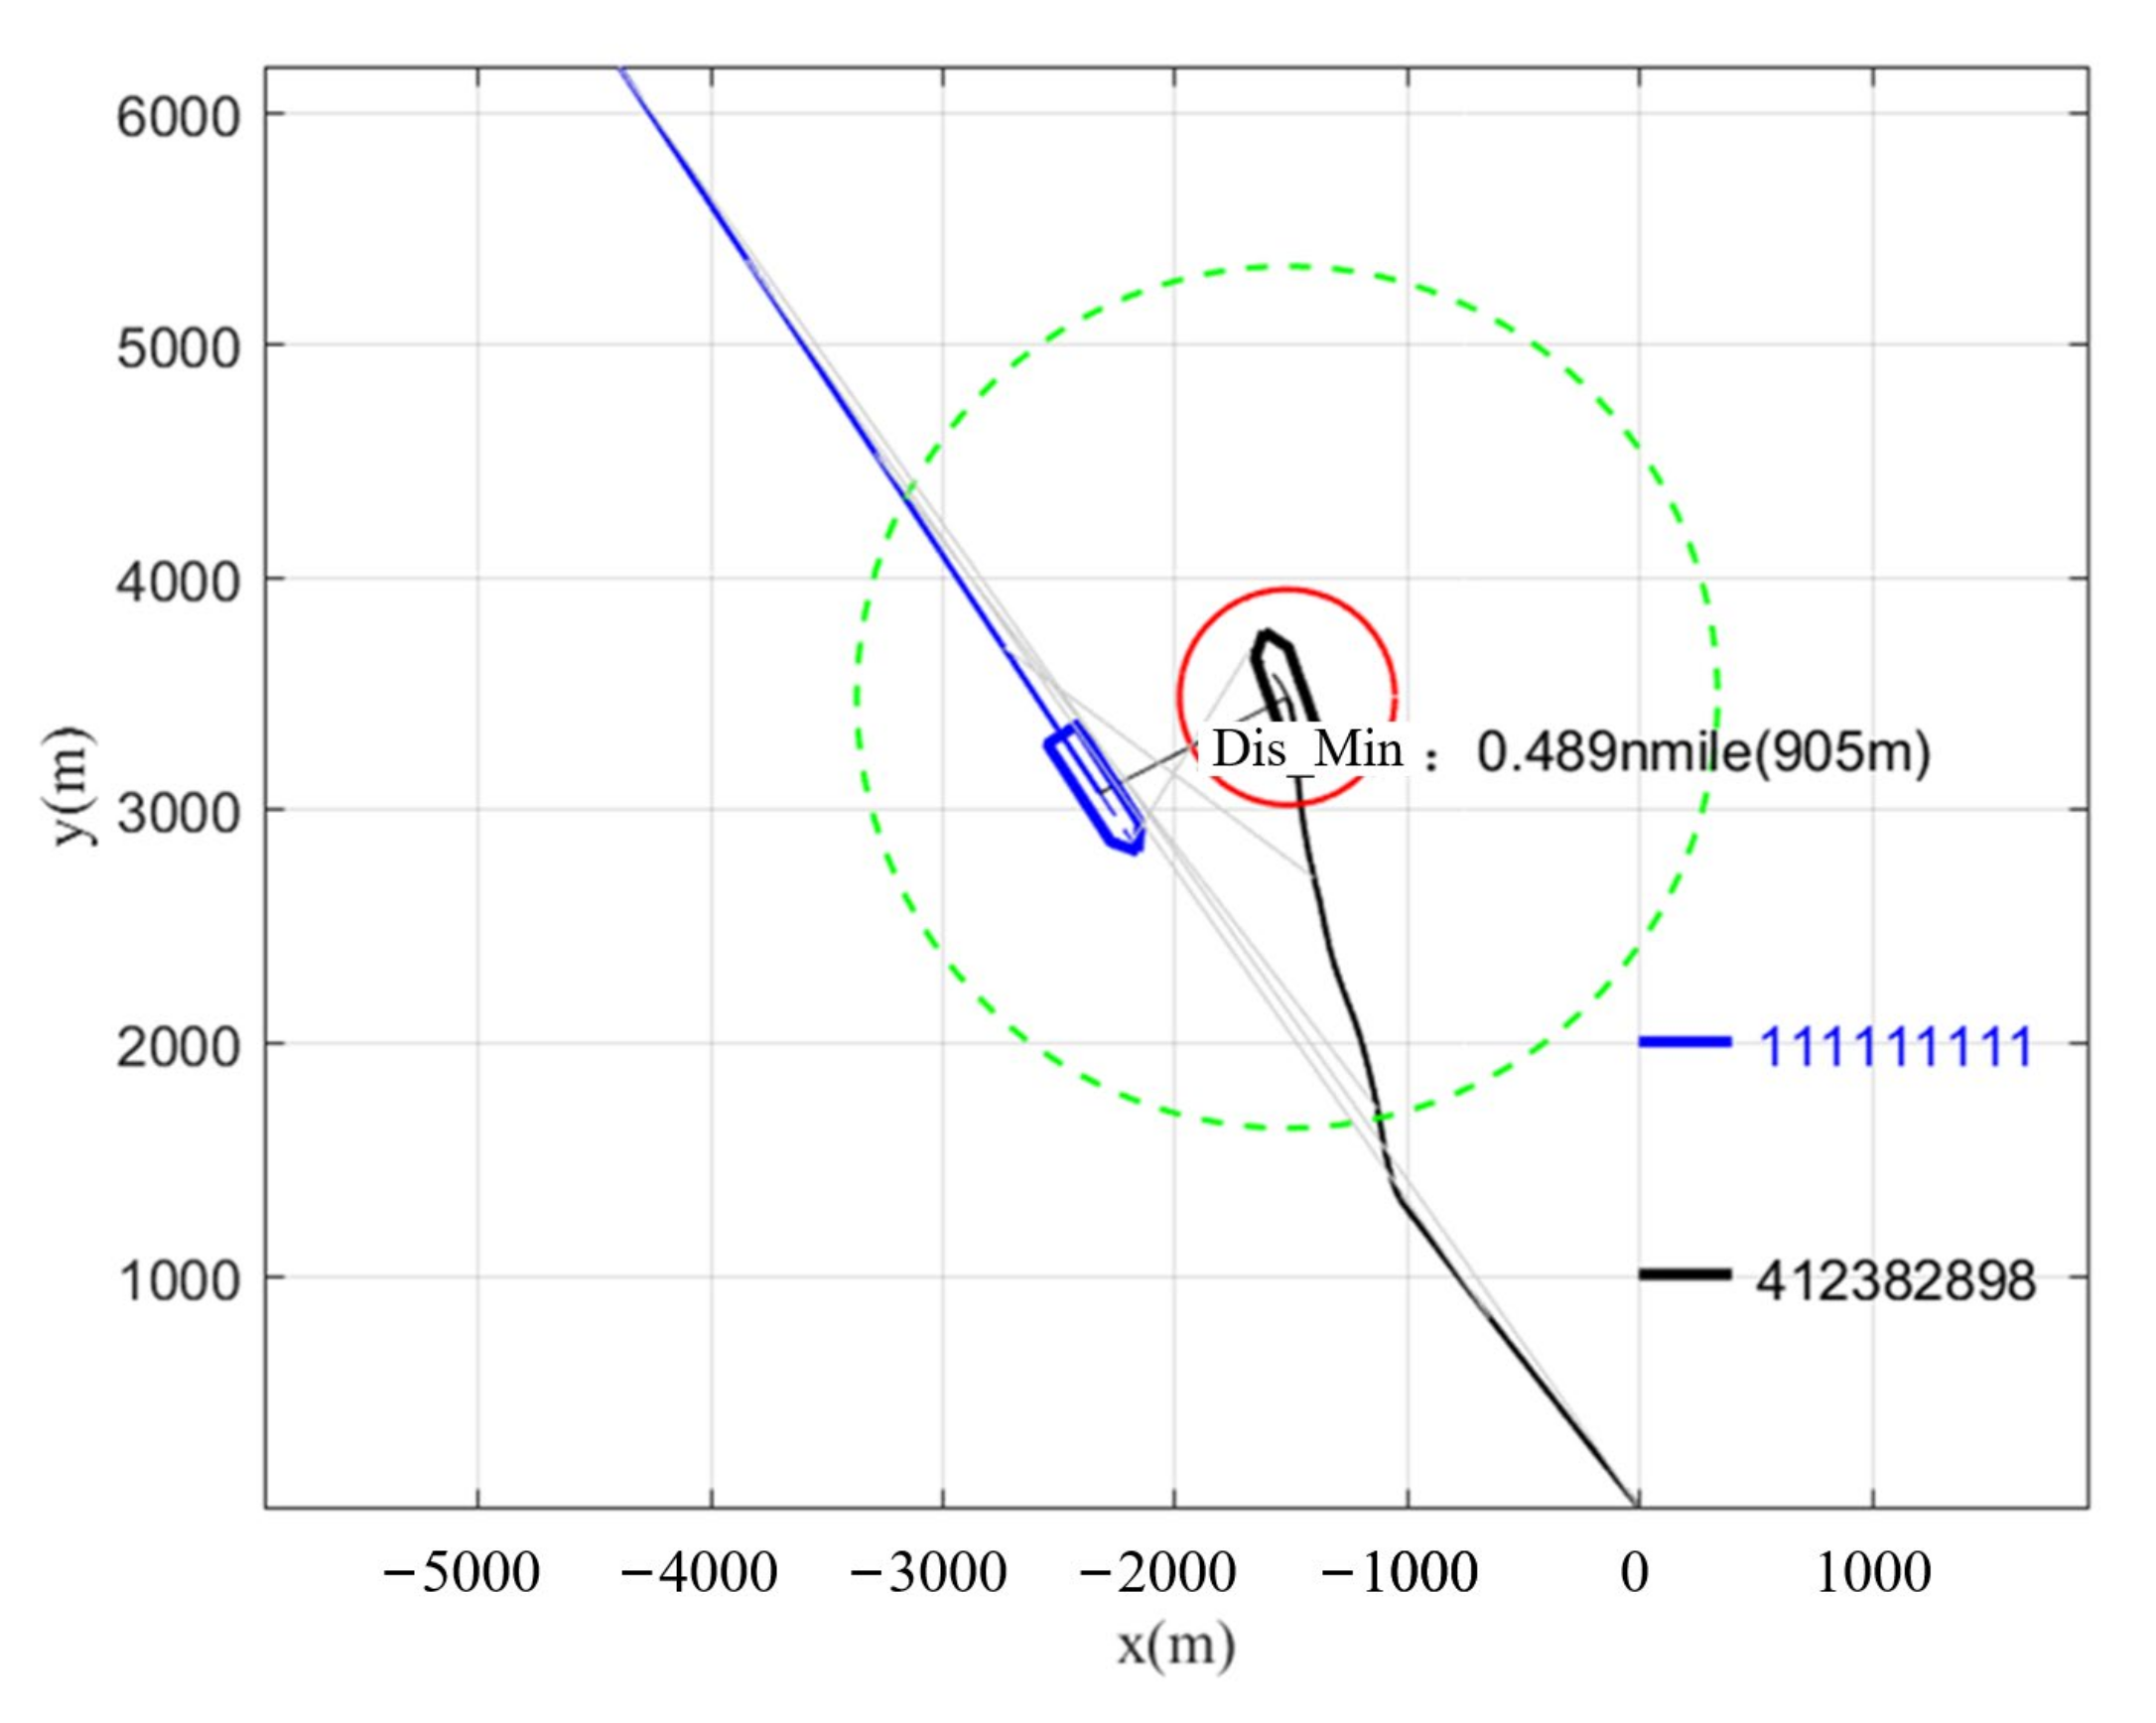
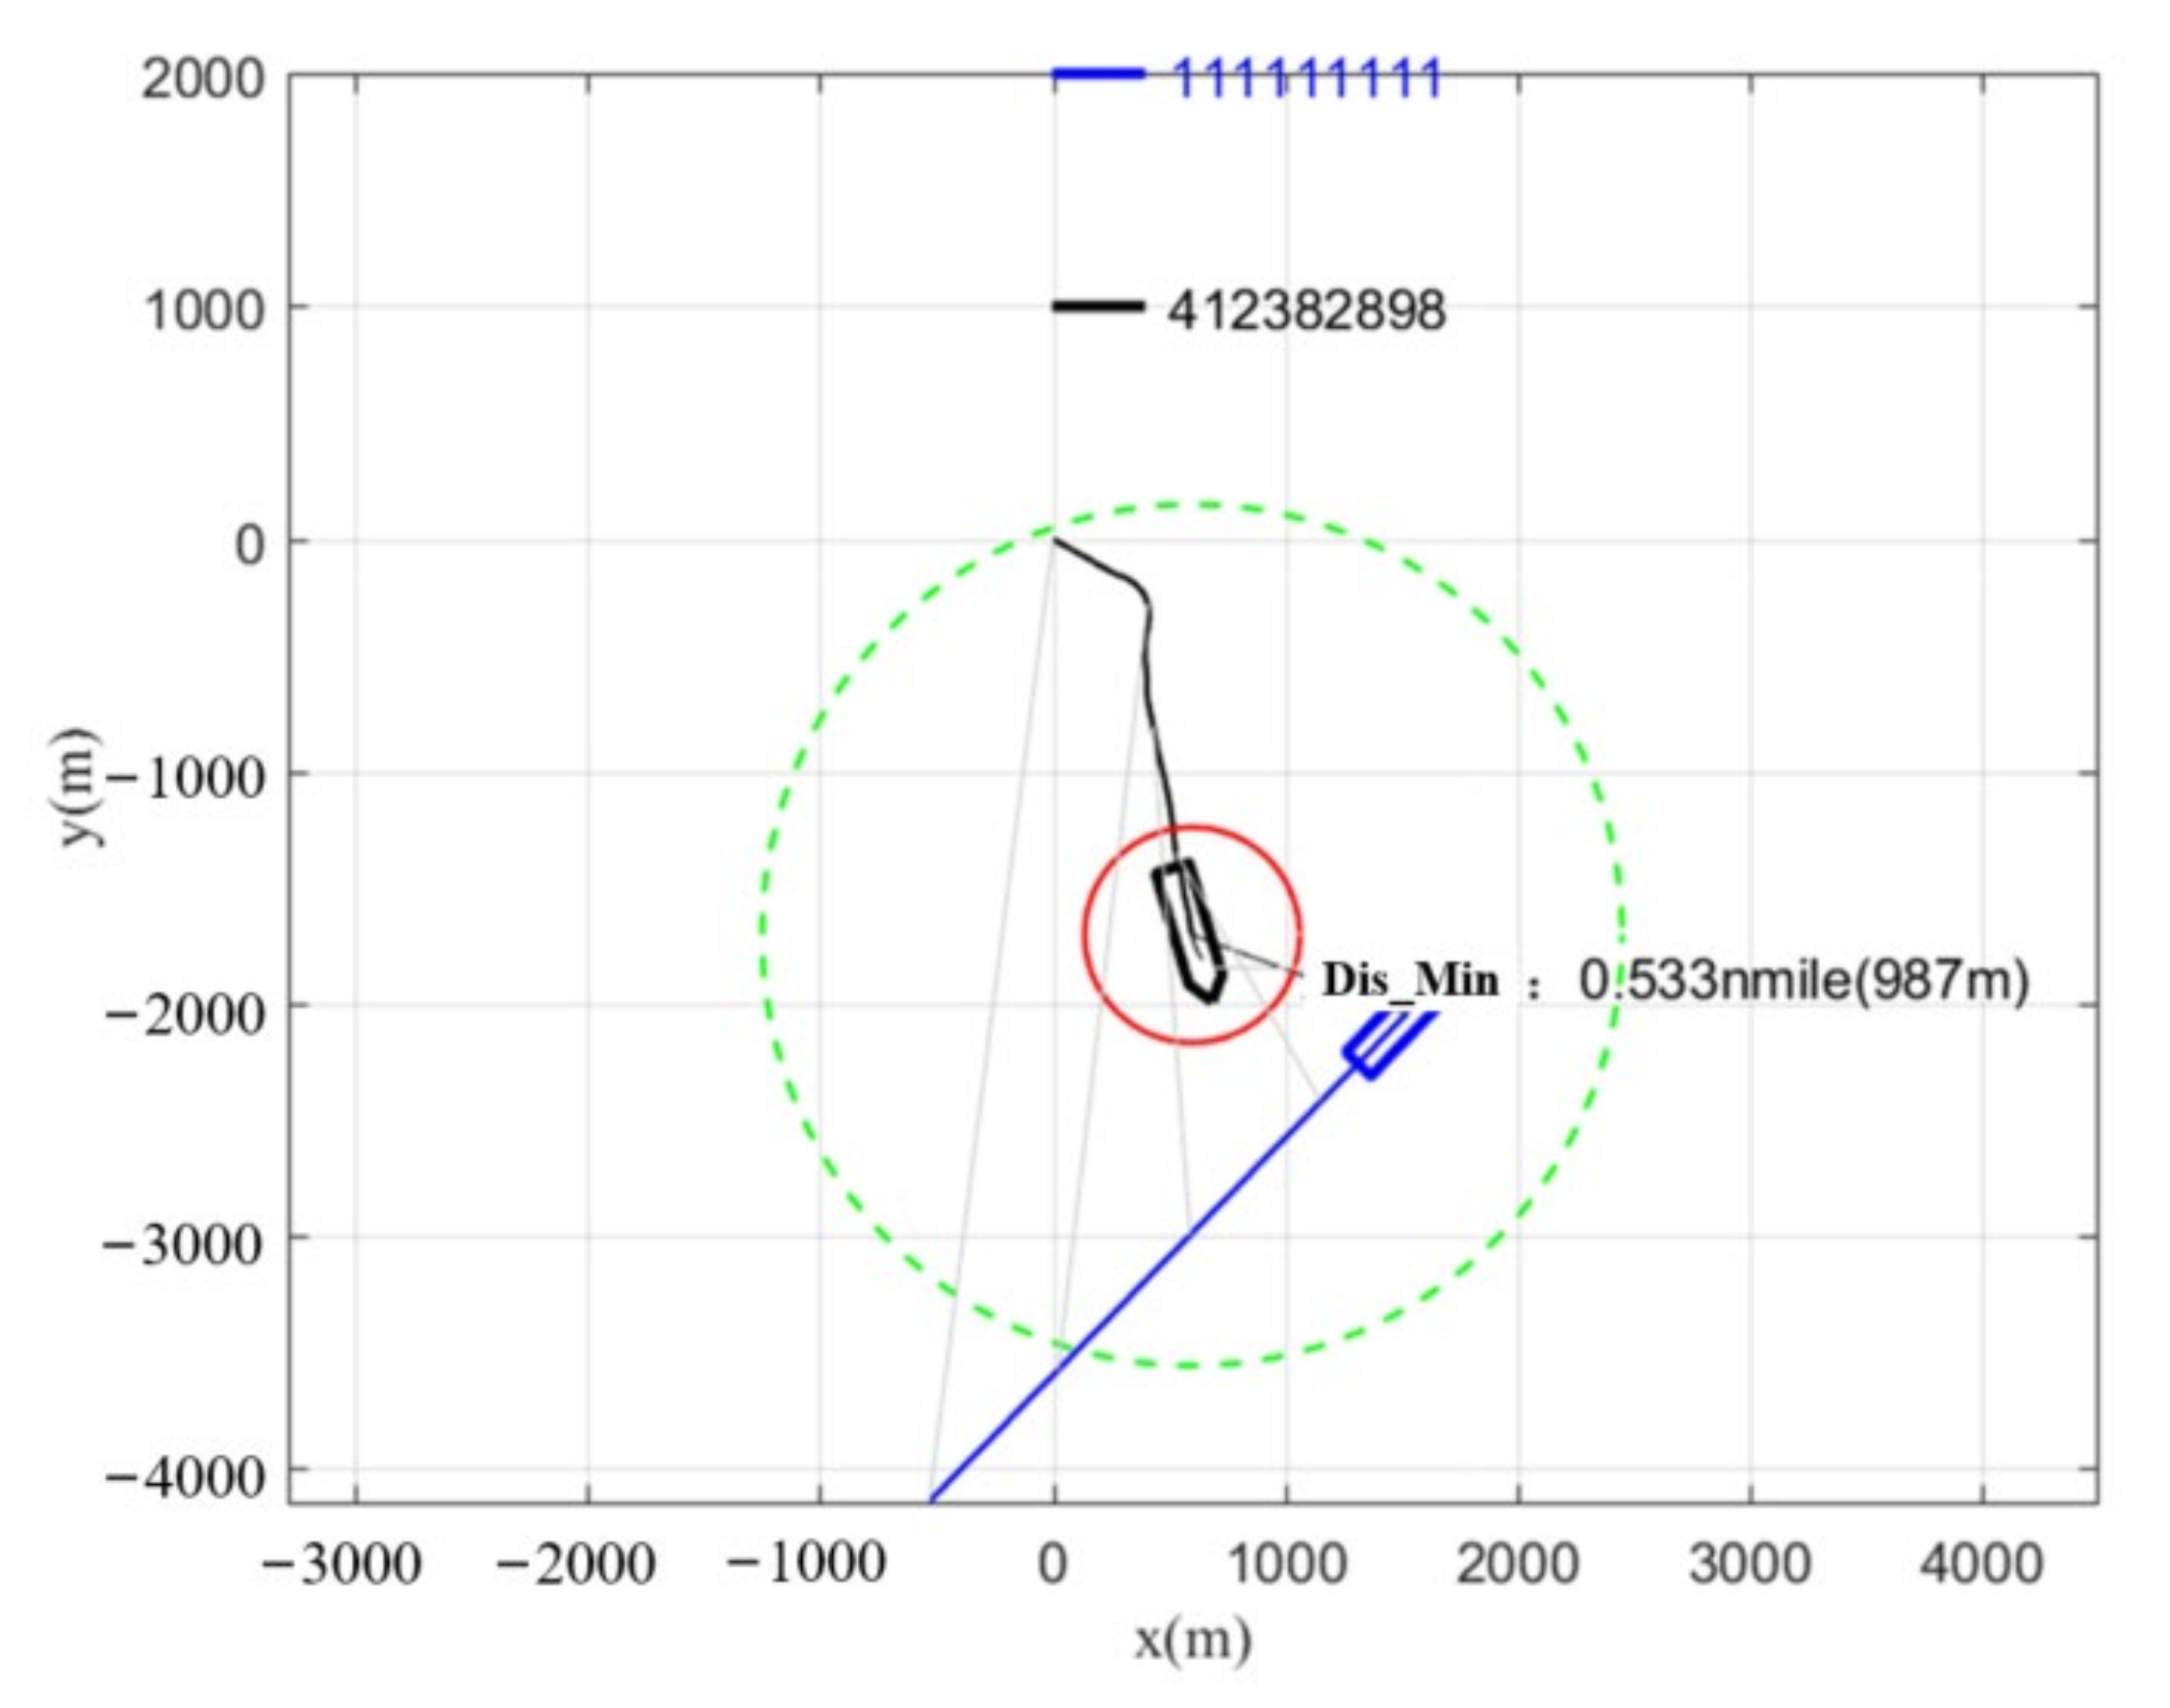
Figure 13 are, respectively, the collision avoidance trajectories of the improved VO, the traditional VO, and the actual ship experiment in the head-on situation. In the improved VO, the red line is the navigation trajectory of the target ship, and the blue line is the navigation trajectory of the own ship. The closed graphics around the two ships represent the ship domain, with the long axis being 0.4 NM and the short axis being 0.16 NM. In the traditional VO, the red line is the navigation trajectory of the target ship, and the blue line is the navigation trajectory of the own ship, and the closed figure around the target ship represents the size of the collision circle of the traditional algorithm, with a radius of 0.25 NM. In the actual ship experiment, MMSI: 111111111 represents the navigation trajectory of the target ship (In order to facilitate the identification of AIS simulation ships, the MMSI is specially set to 111111111), MMSI: 412382898 represents the navigation trajectory of the own ship, and the green enclosed shape around the own ship represents the 1 NM marked circle, while the red enclosed shape represents the 0.25 NM marked circle. When collision avoidance begins, the improved algorithm calculates the ship collision risk in real time. When
, the ship starts to avoid collision. The collision avoidance timing for the traditional algorithm is when the distance between two ships
is less than 3600 m. The collision avoidance timing in the actual ship experiment is determined by the captain’s discretion. The ship will turn right to avoid the situation in accordance with the COLREGs rules and return to the original course after the danger is eliminated.
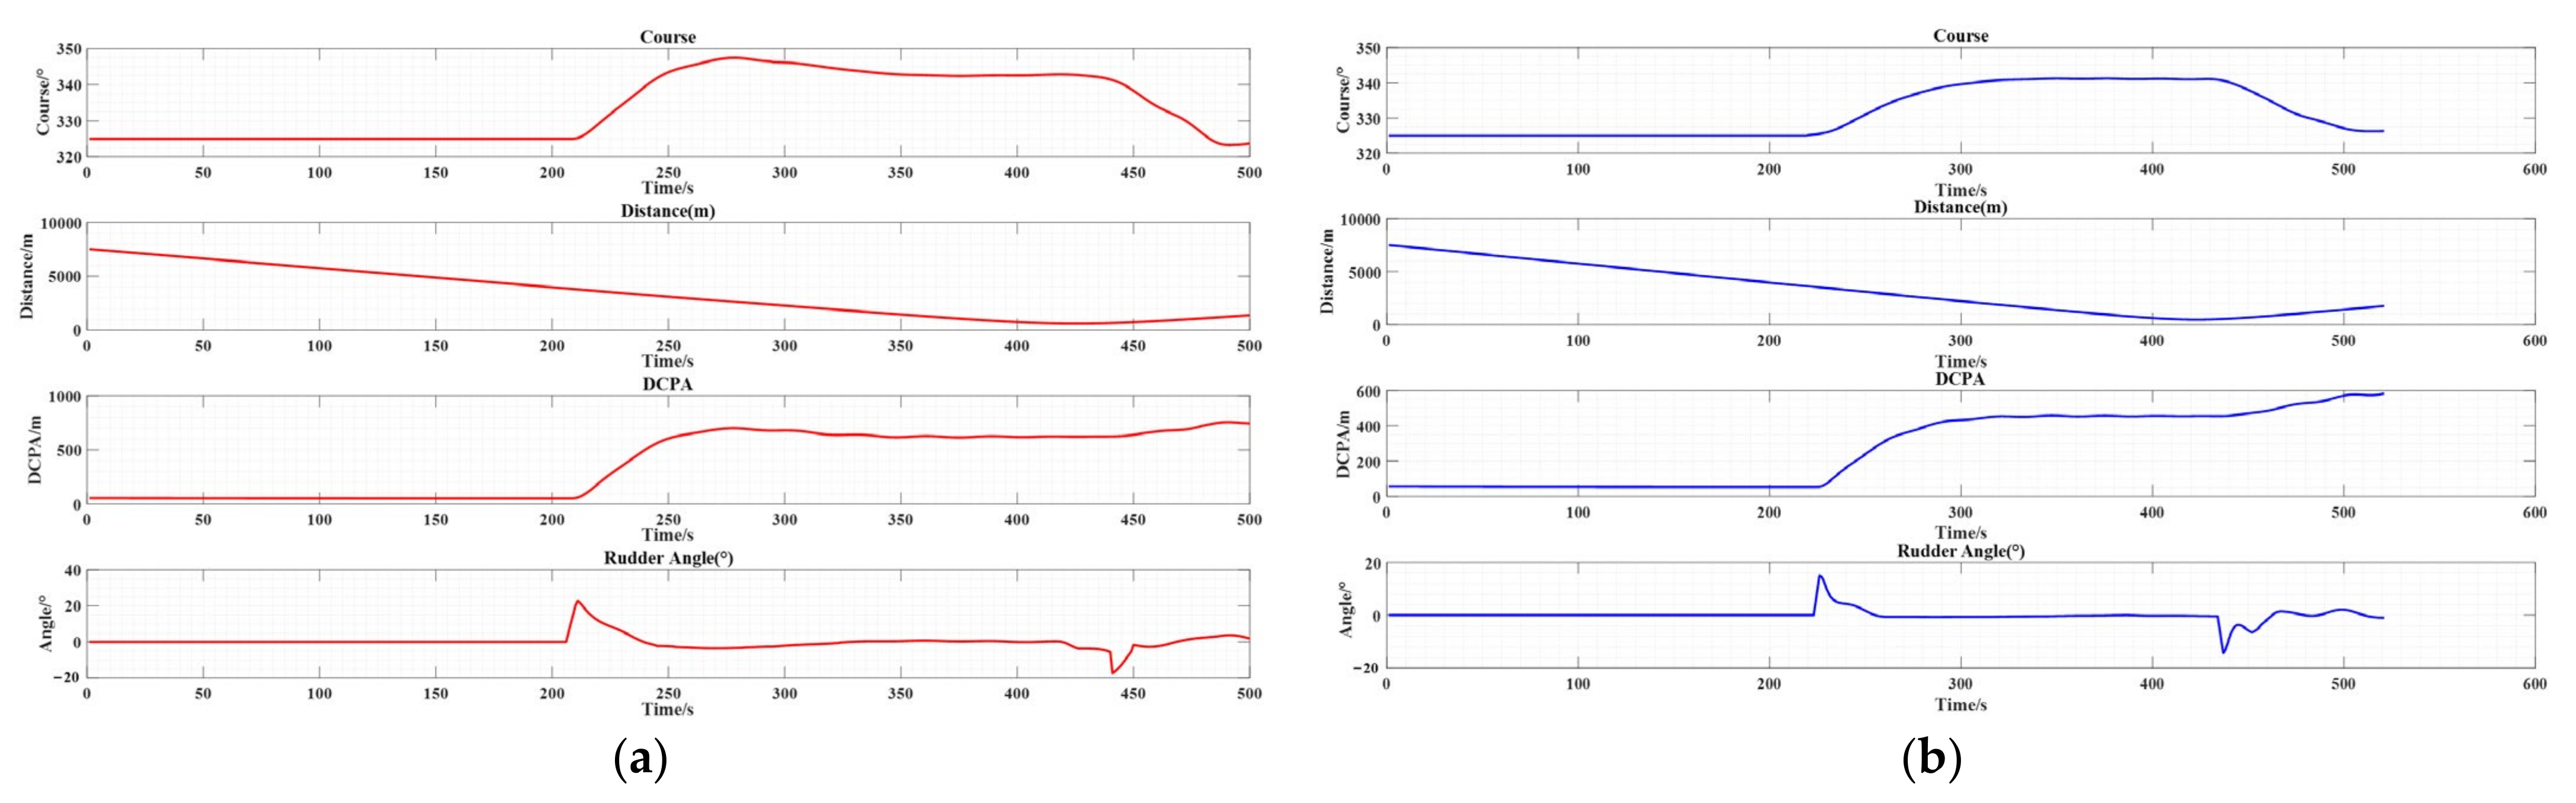
Figure 14a,b and
Figure 15 show the parameter changes of the improved VO, the traditional VO, and the actual ship experiment in the head-on situation. The rudder angle, course,
and DCPA were analyzed under three experiments. In the improved VO, the own ship started to avoid collision at 207 s, 3900 m away from the target ship, turned right to the maximum course of 347.4°, and started returning to the original course at 426 s. The minimum of
was 622 m. In the traditional VO algorithm, the own ship started to avoid collision at 223 s, 3600 m away from the target ship, turned right to the maximum course of 341.8°, and started returning to the original course at 434 s. The minimum of
was 482 m. In the actual ship experiment, the own ship started to avoid collision at 179 s, 4200 m away from the target ship, turned right to the maximum course of 355°, and started returning to the original course at 398 s. The minimum of
was 905 m.
As shown in
Table 6, it is the evaluation system’s ranking of each index score of the three collision avoidance methods.
Figure 16,
Figure 17 and
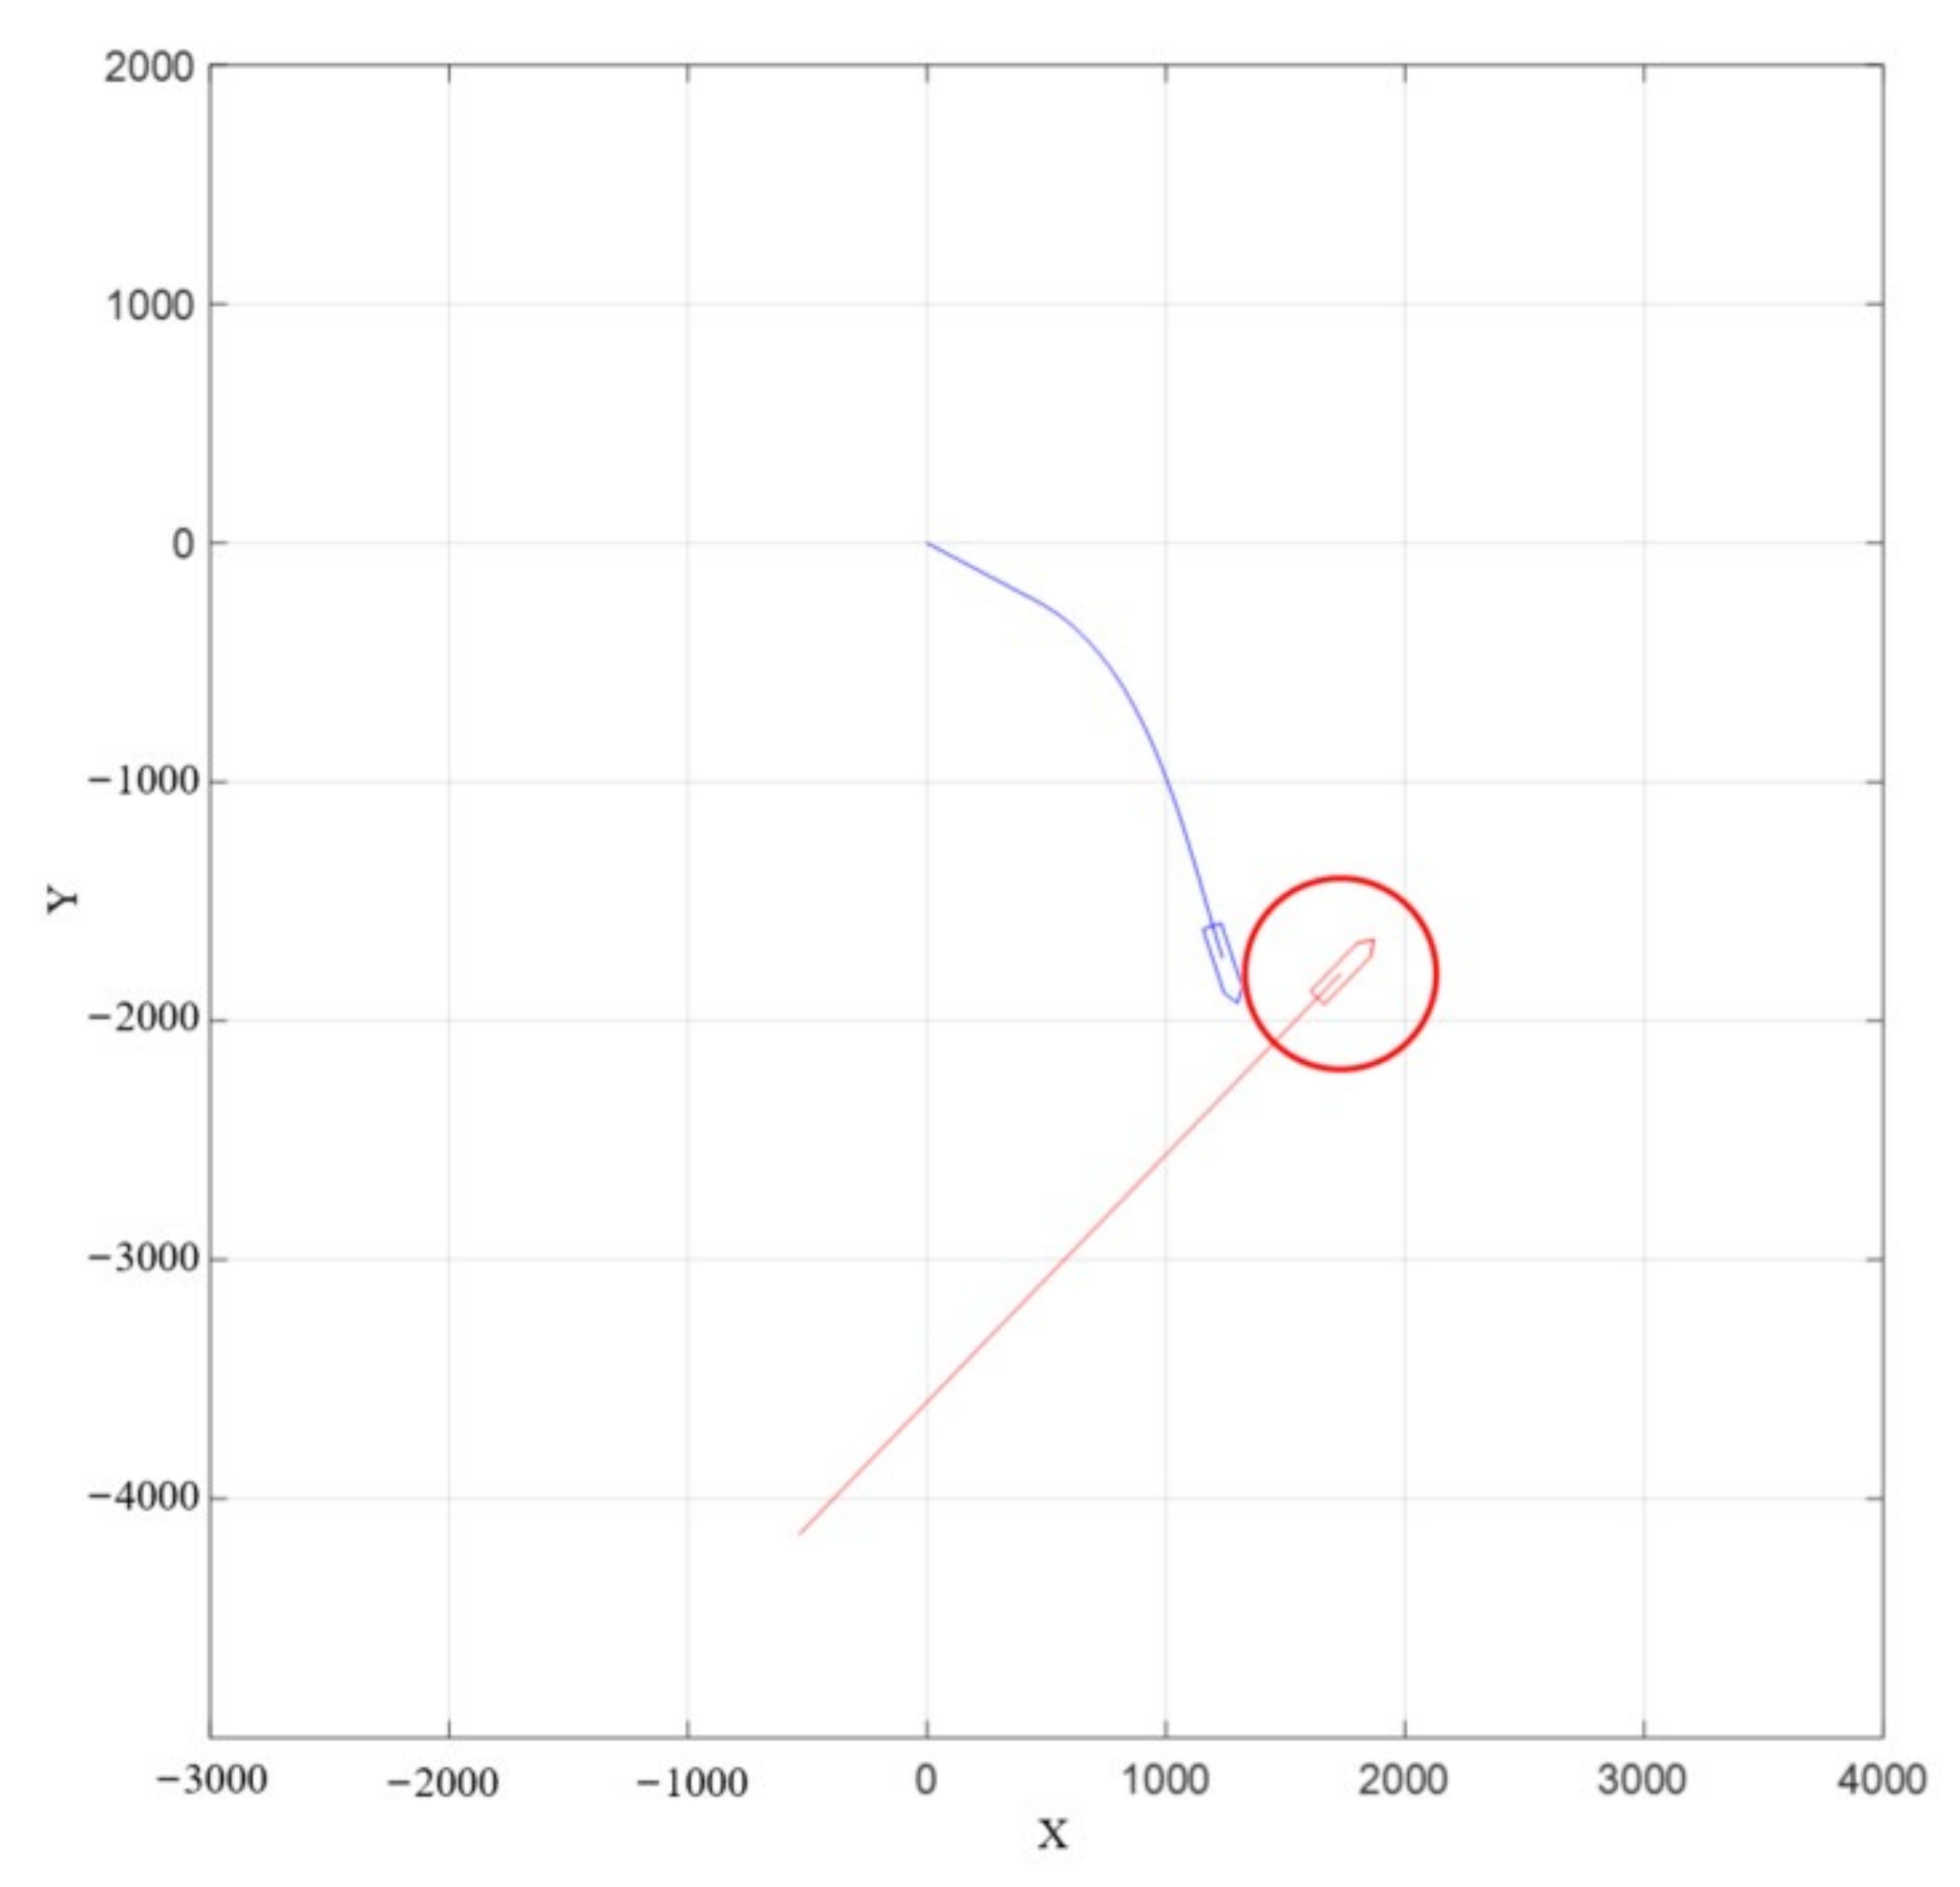
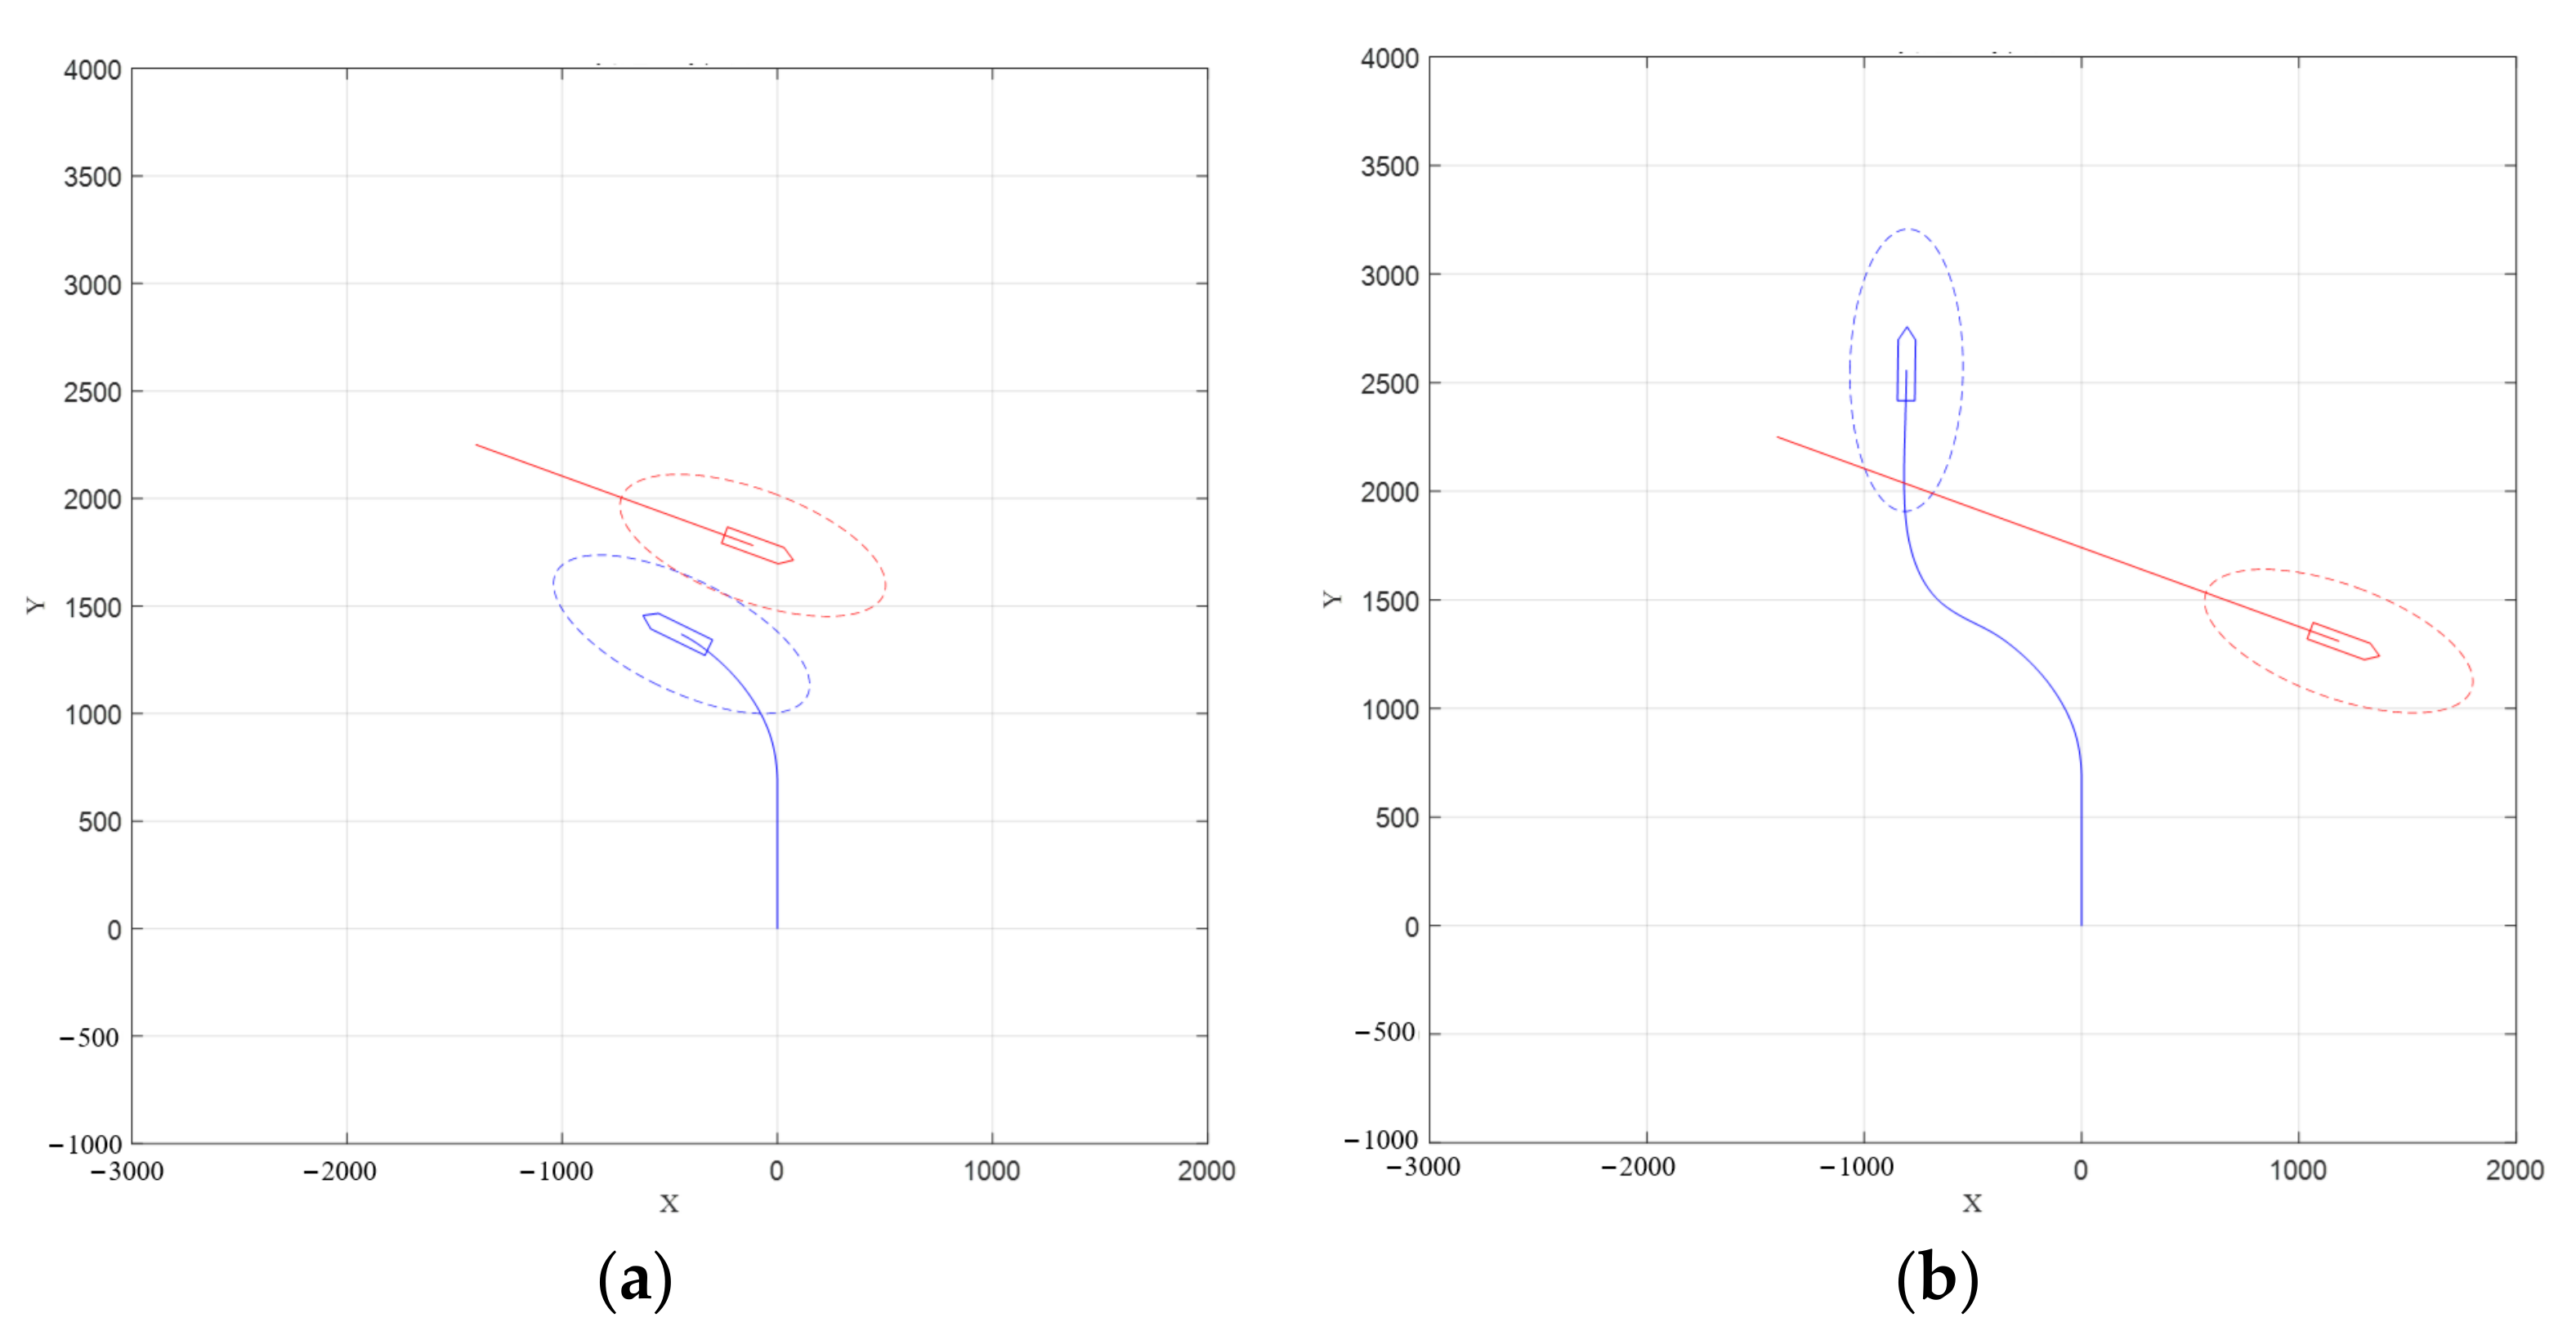
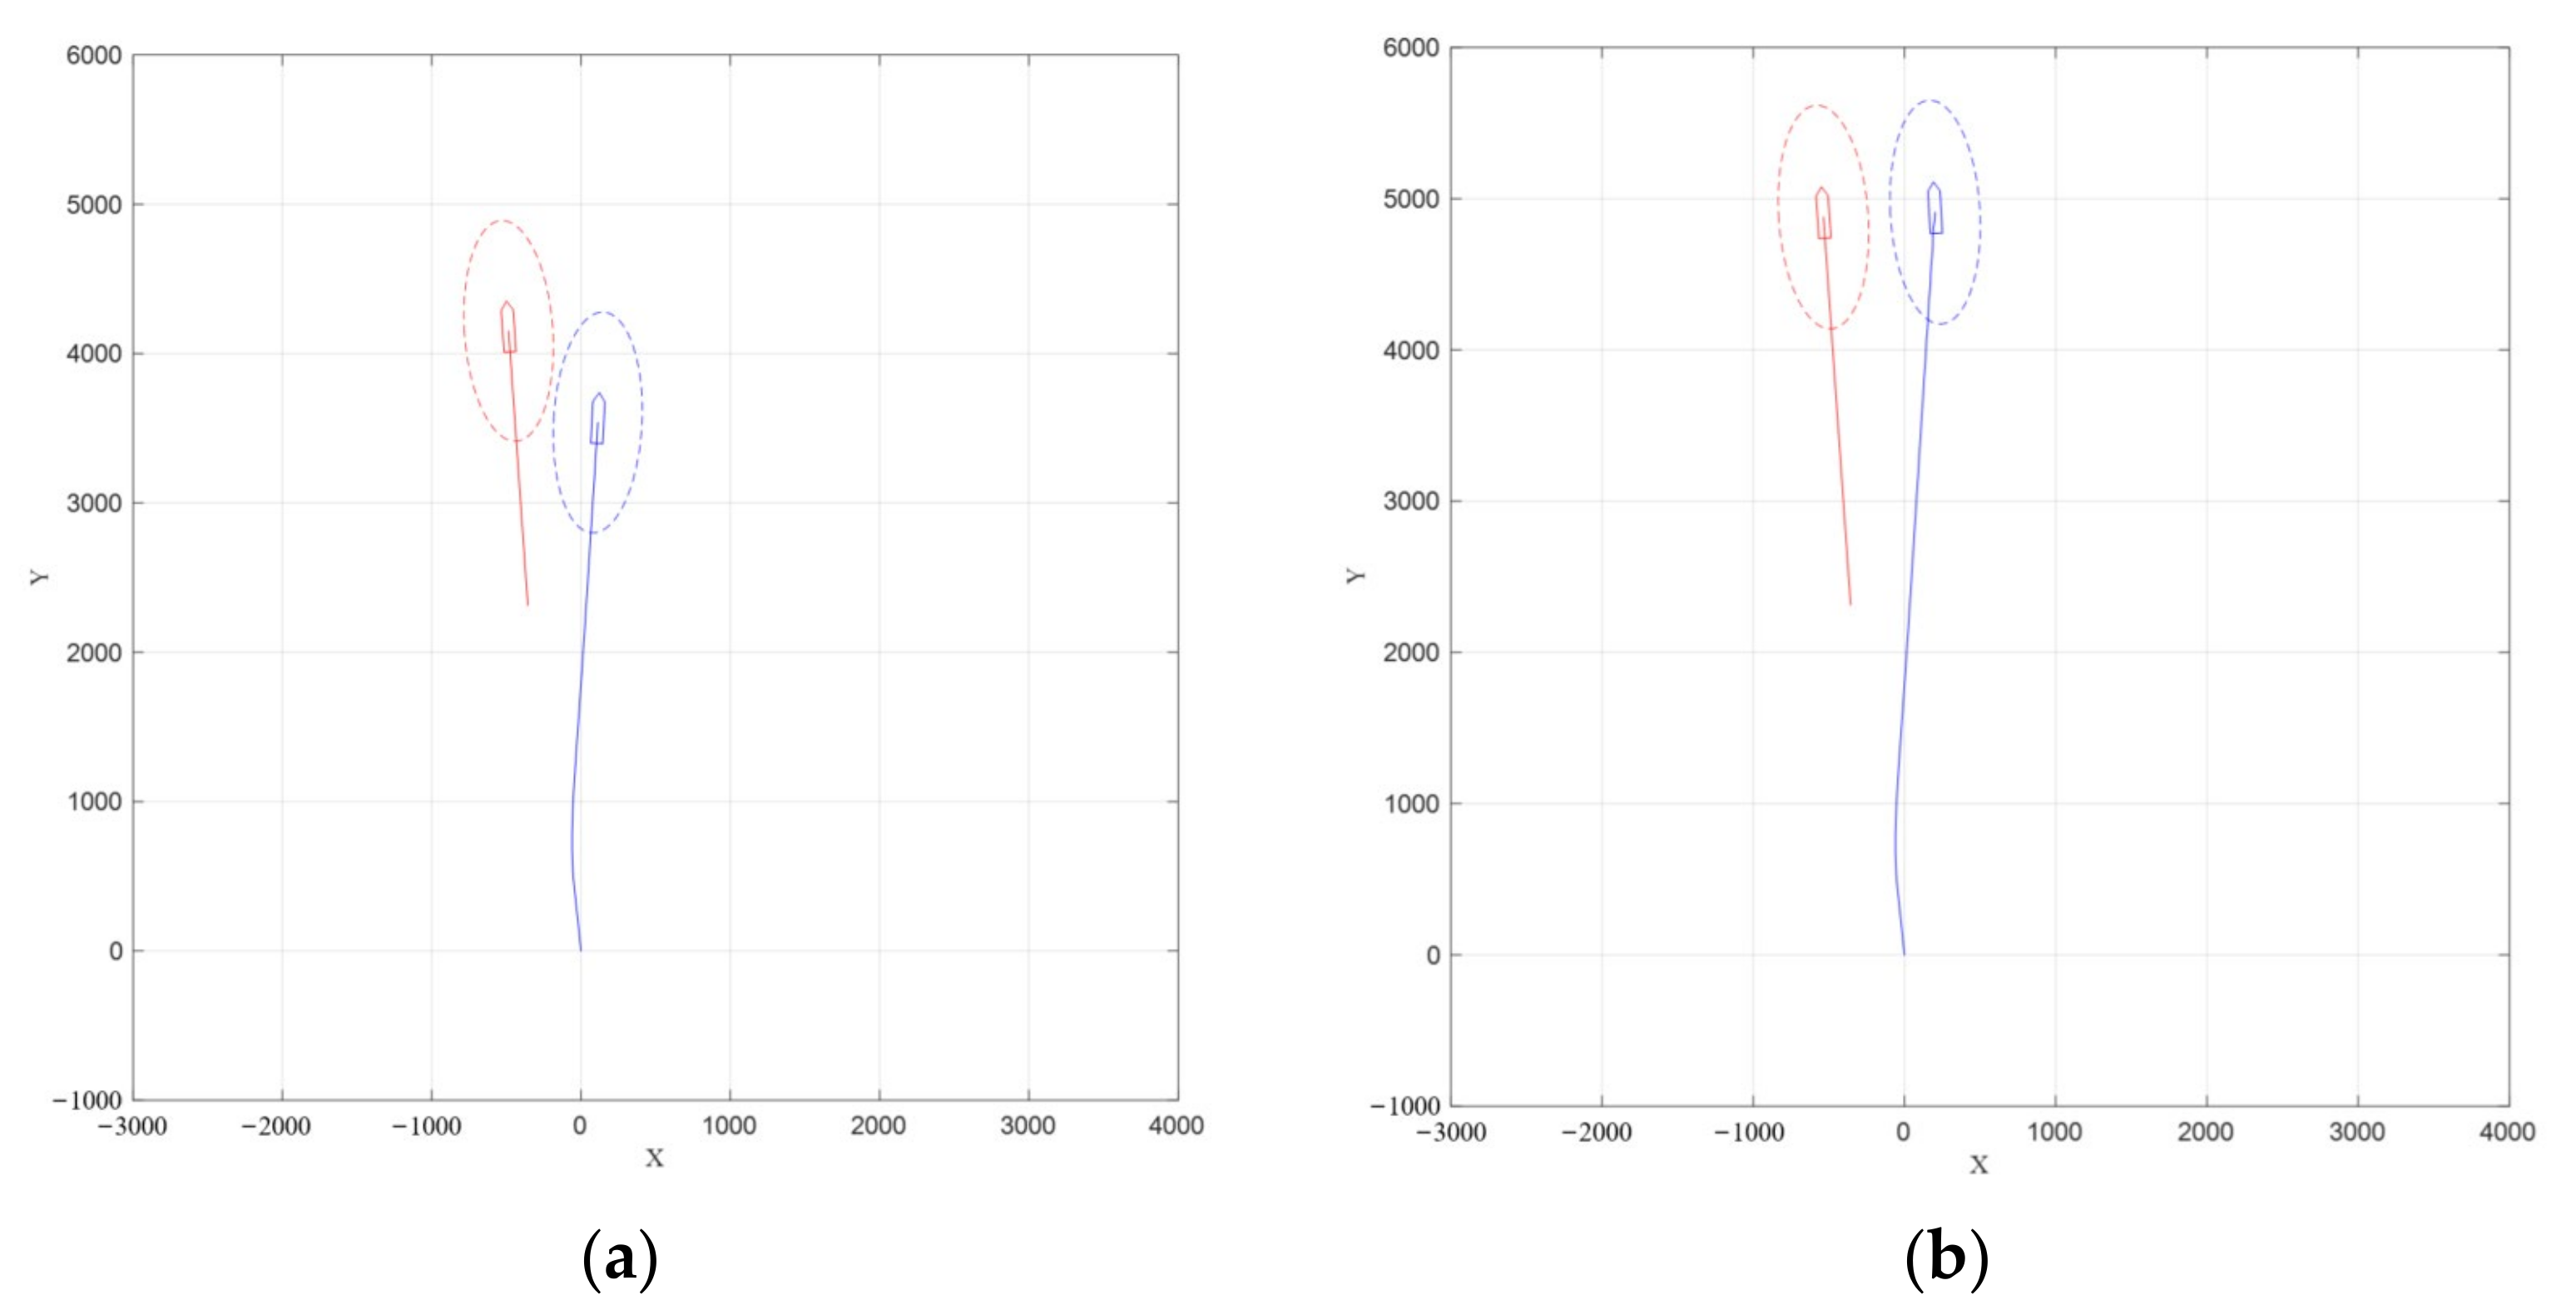
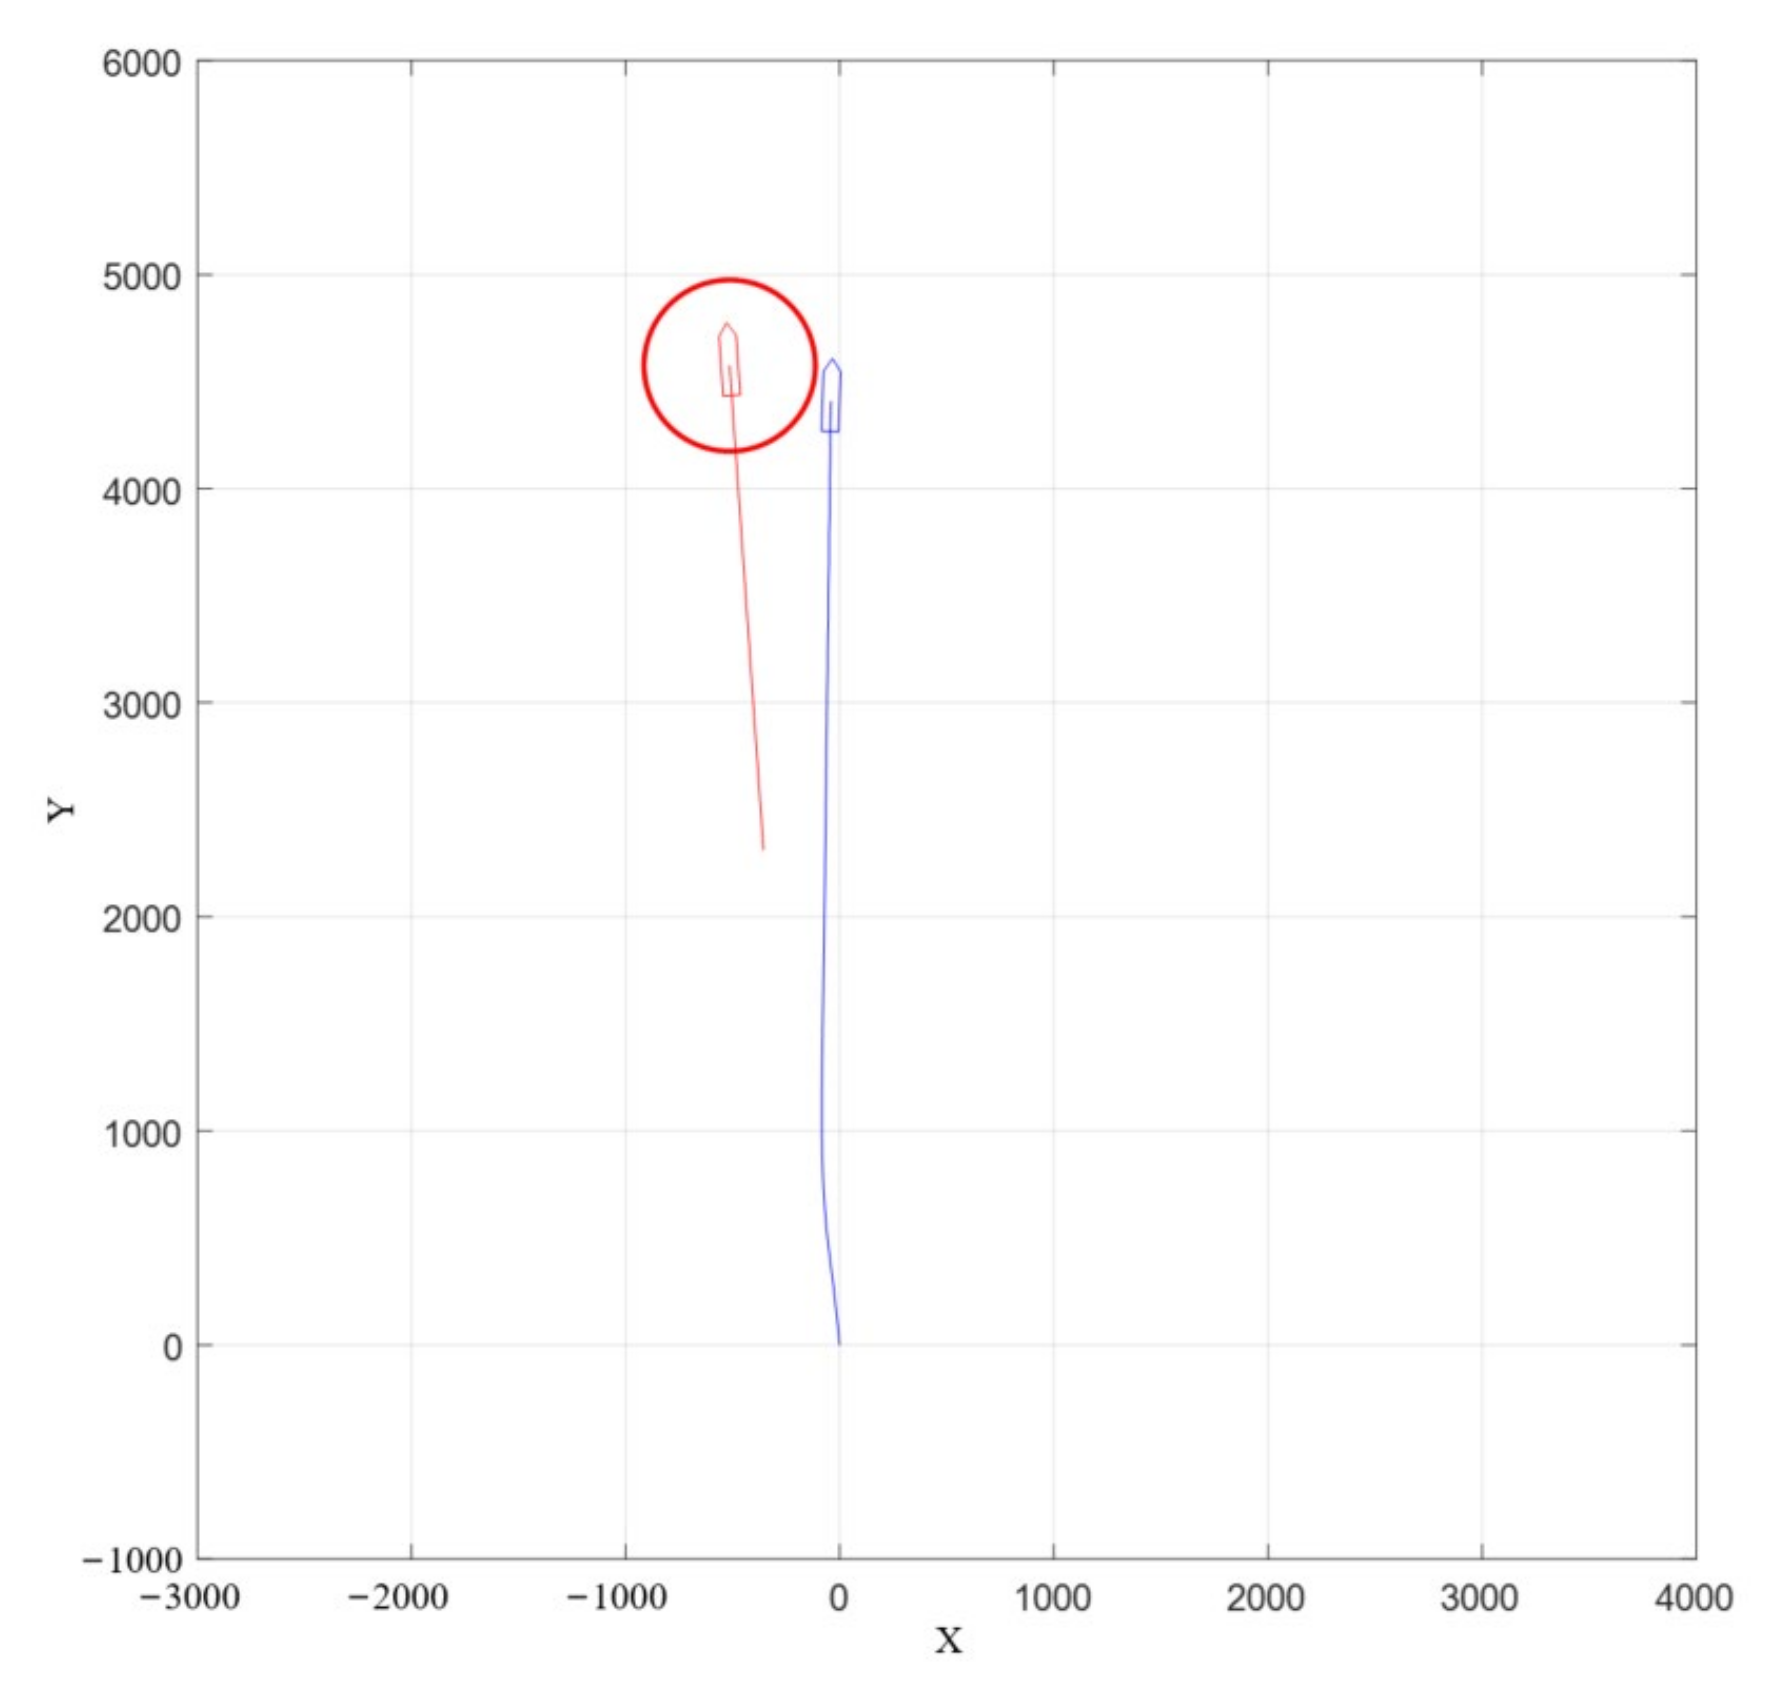
Figure 18 show the collision avoidance trajectories of the improved VO, traditional VO, and actual ship experiment in crossing situation. In the improved VO, the red line is the navigation trajectory of the target ship, and the blue line is the navigation trajectory of the own ship. The closed graphics around the two ships represent the ship domain, with the long axis being 0.35 NM and the short axis being 0.14 NM.
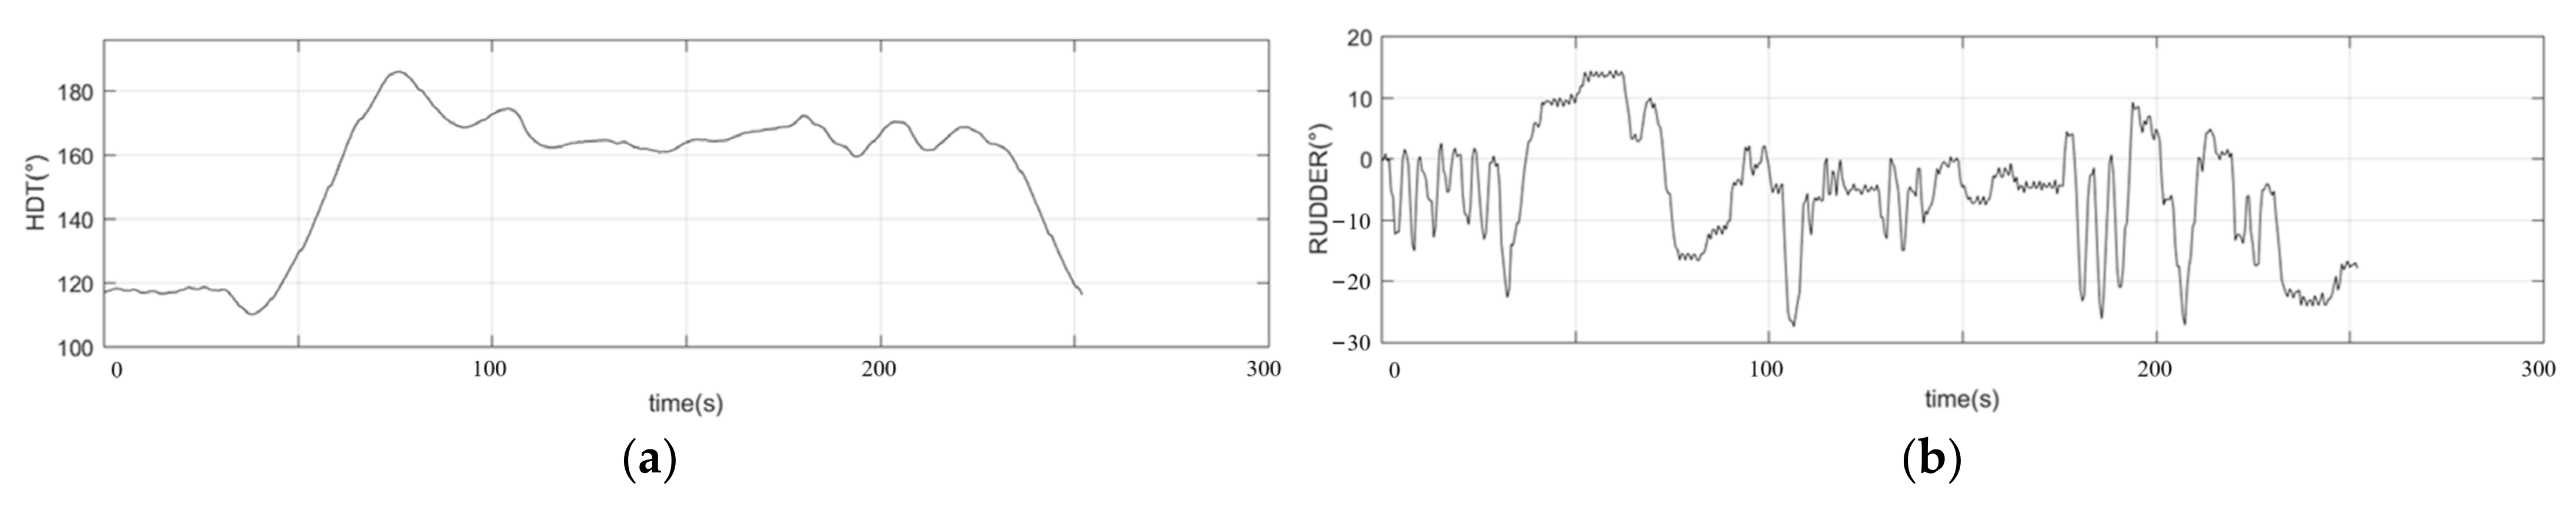
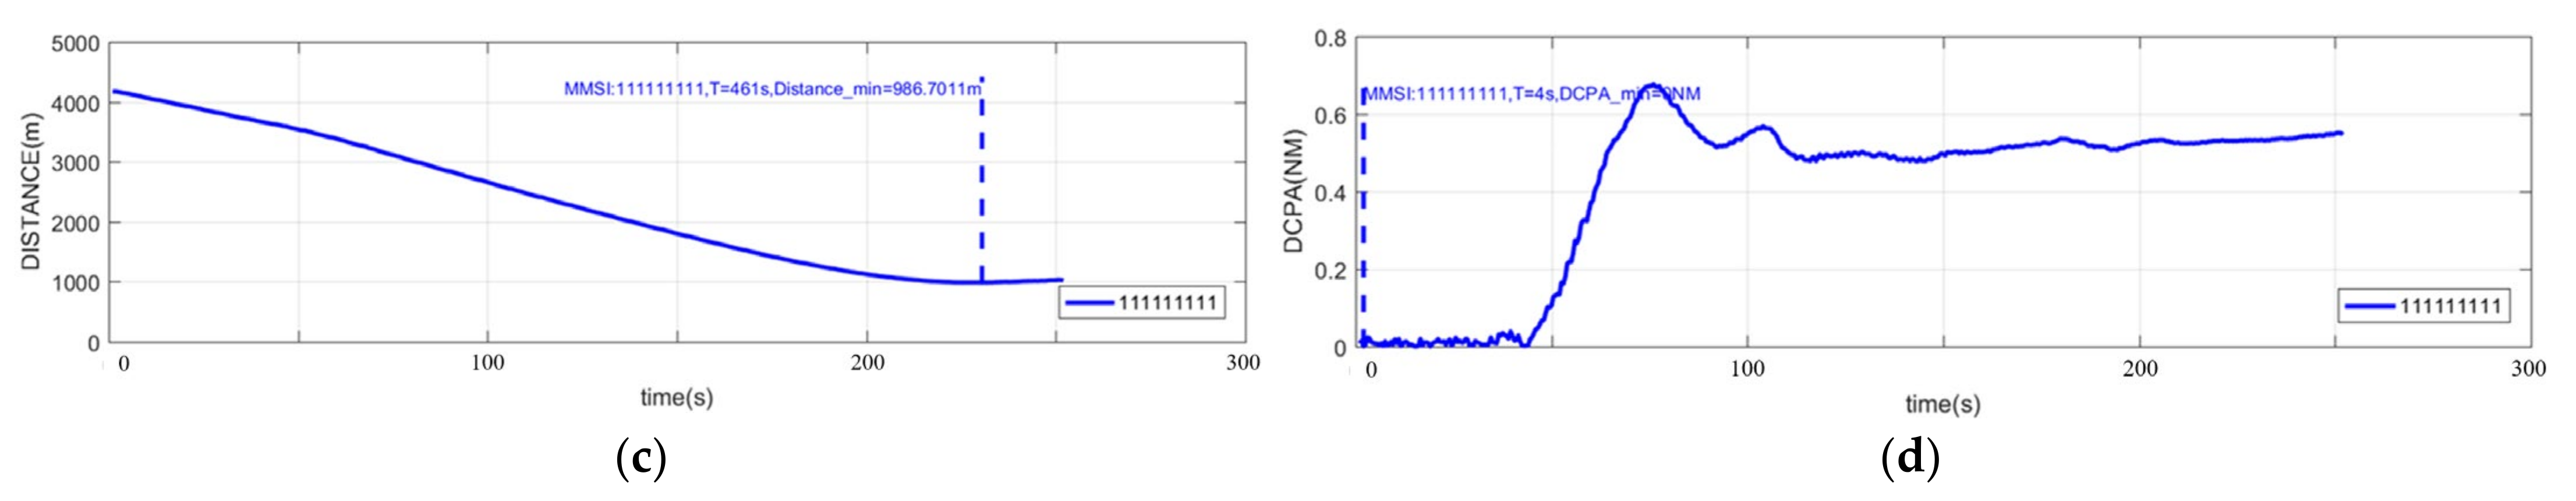
Figure 19a,b and
Figure 20 show the parameter changes of the improved VO, the traditional VO, and the actual ship experiment in the crossing situation. The rudder angle, course,
and DCPA were analyzed under three experiments. In the improved VO, the own ship started to avoid collision at 44 s, 3600 m away from the target ship, turned right to the maximum course of 171.4°, and started returning to the original course at 213 s. The minimum of
was 762 m. In the traditional VO, the own ship started to avoid collision at 44 s, 3600 m away from the target ship, turned right to the maximum course of 163.6°, and started returning to the original course at 220 s. The minimum of
was 489 m. In the actual ship experiment, the own ship started to avoid collision at 39 s, 3800 m away from the target ship, turned right to the maximum course of 188°, and started returning to the original course at 208 s. The minimum of
was 987 m.
As shown in
Table 7, it is the evaluation system’s ranking of each index score of the three collision avoidance methods.
Figure 21 shows the collision avoidance trajectories of the improved VO in the port side crossing situation. In the improved VO, the red line is the navigation trajectory of the target ship, and the blue line is the navigation trajectory of the own ship. The closed graphics around the two ships represent the ship domain, with the long axis being 0.35 NM and the short axis being 0.14 NM. When the target ship is on the port side of the own ship, this ship has no responsibility for avoidance. If the target ship does not take avoidance measures, this ship will start emergency collision avoidance and return to its original course after the collision danger is eliminated.
Figure 22 shows the parameter changes of the improved VO in the port side crossing situation. The rudder angle, course,
and DCPA were analyzed under the experiment. In the improved VO, the own ship started to avoid collision at 55 s, 1850 m away from the target ship, turned right to the minimum course of −64.4°, and started returning to the original course at 130 s. The minimum of
was 515 m.
Figure 23,
Figure 24 and
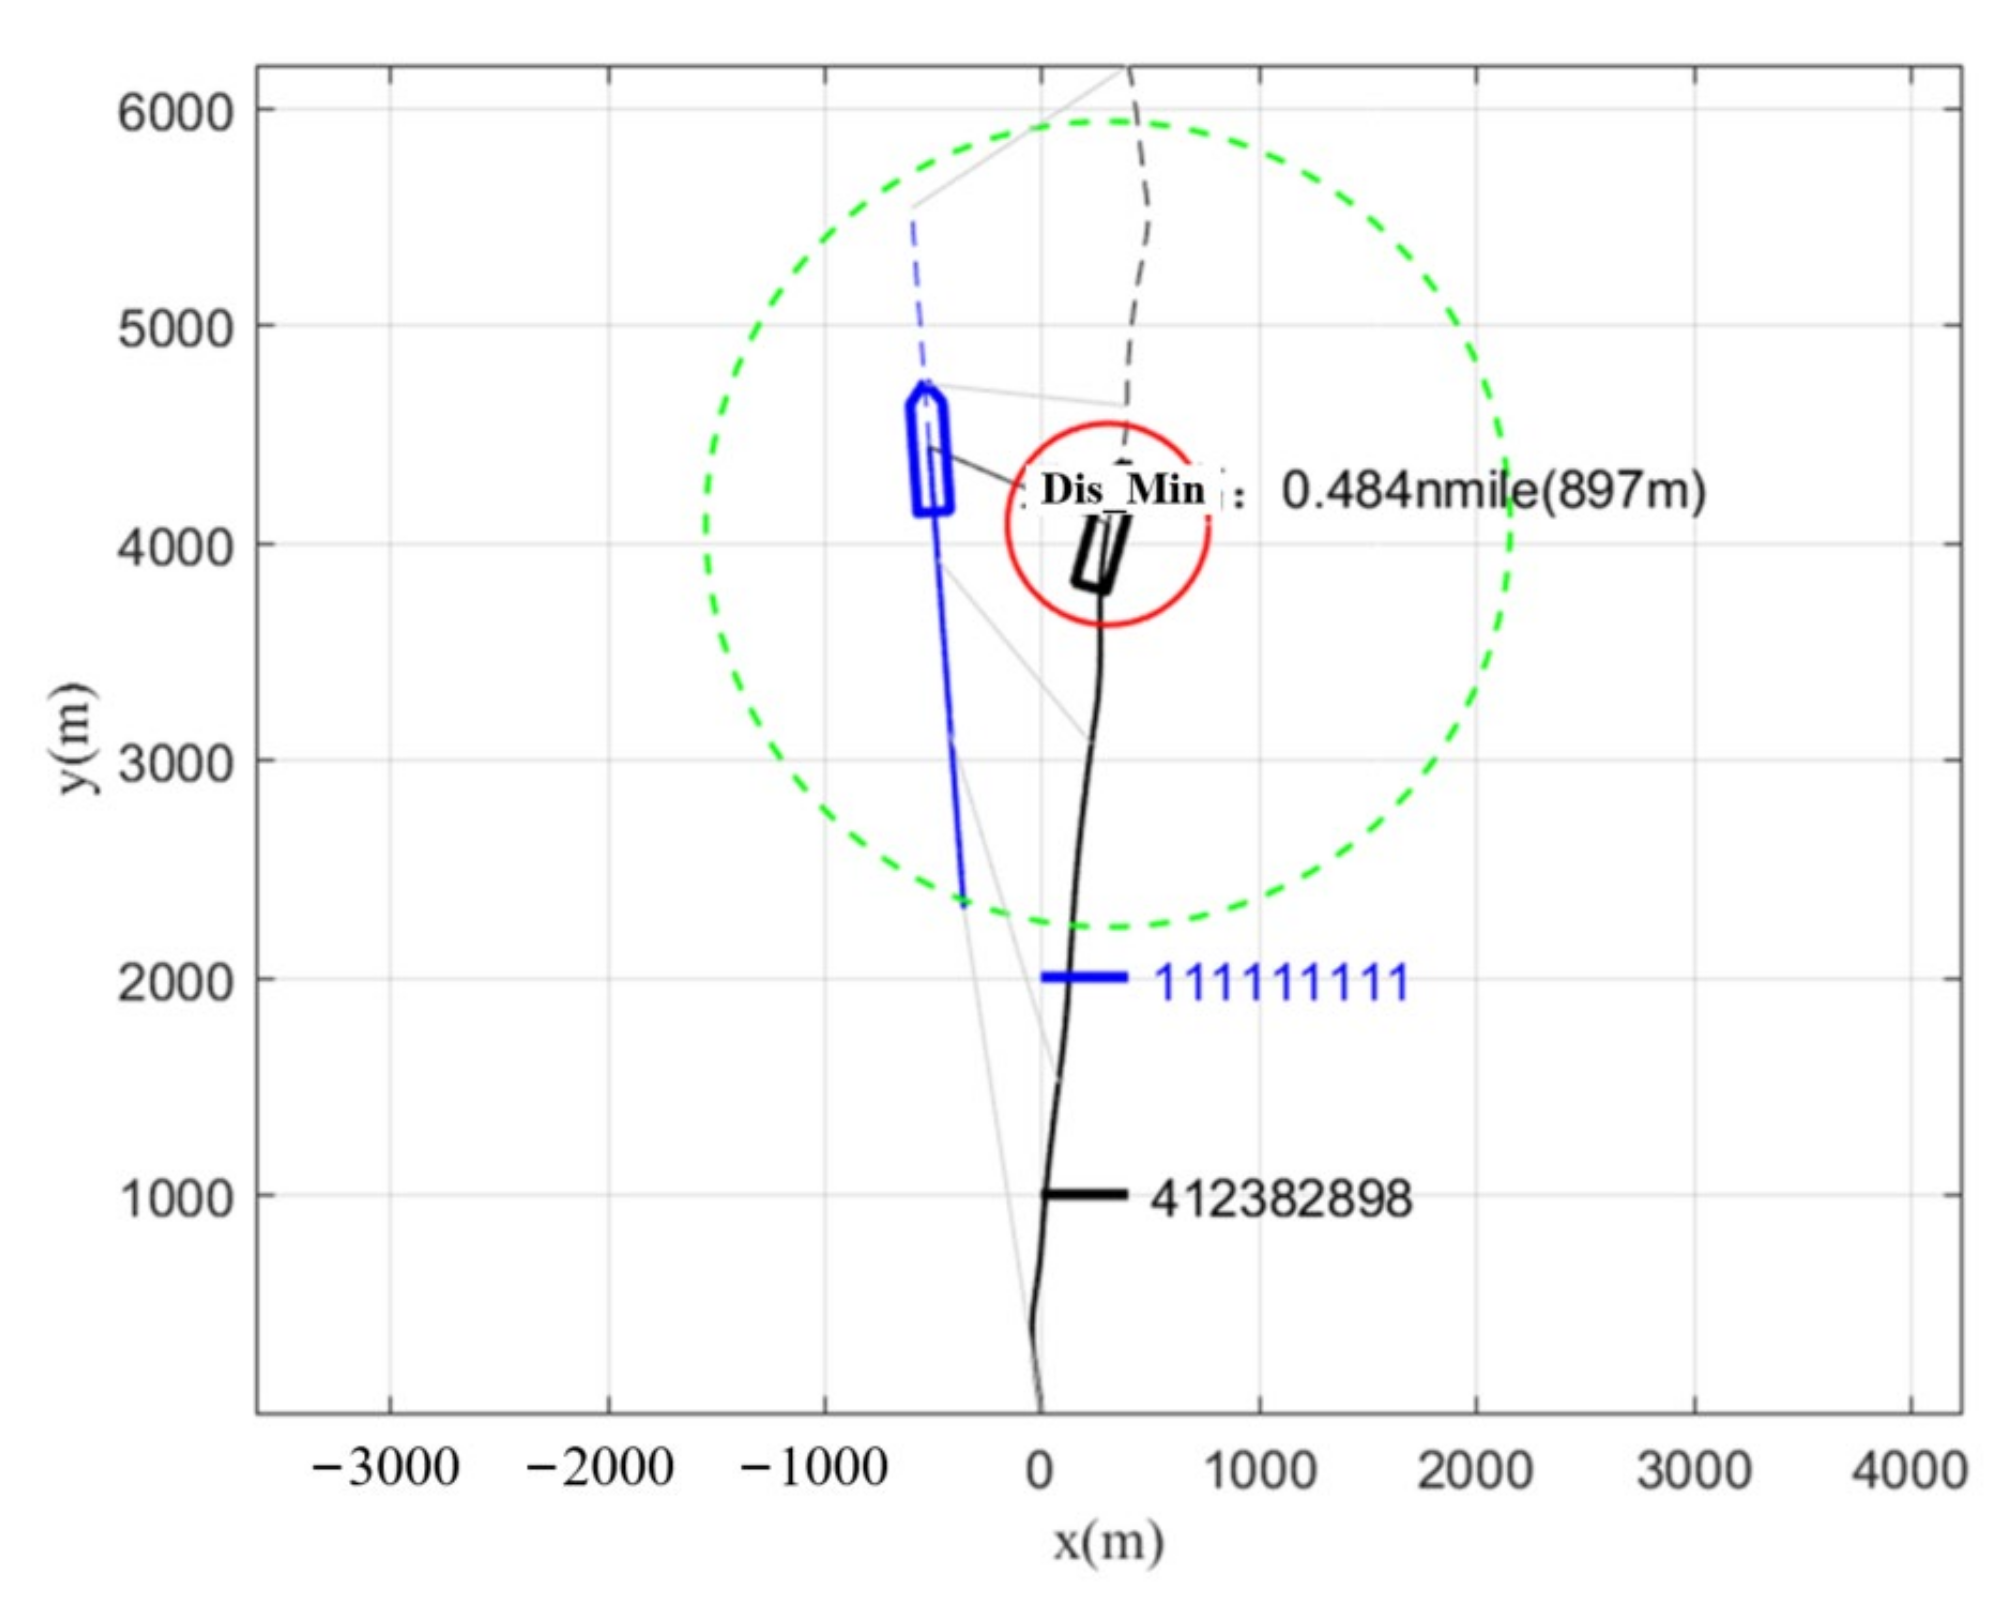
Figure 25 show the collision avoidance trajectories of the improved VO, the traditional VO, and the actual ship collision avoidance experiment in the overtaking situation. Among them, the red line in the improved VO is the navigation trajectory of the target ship, and the blue line is the navigation trajectory of the own ship. The closed graphics around the two ships represent the ship domain, with the long axis being 0.4 NM and the short axis being 0.16 NM.
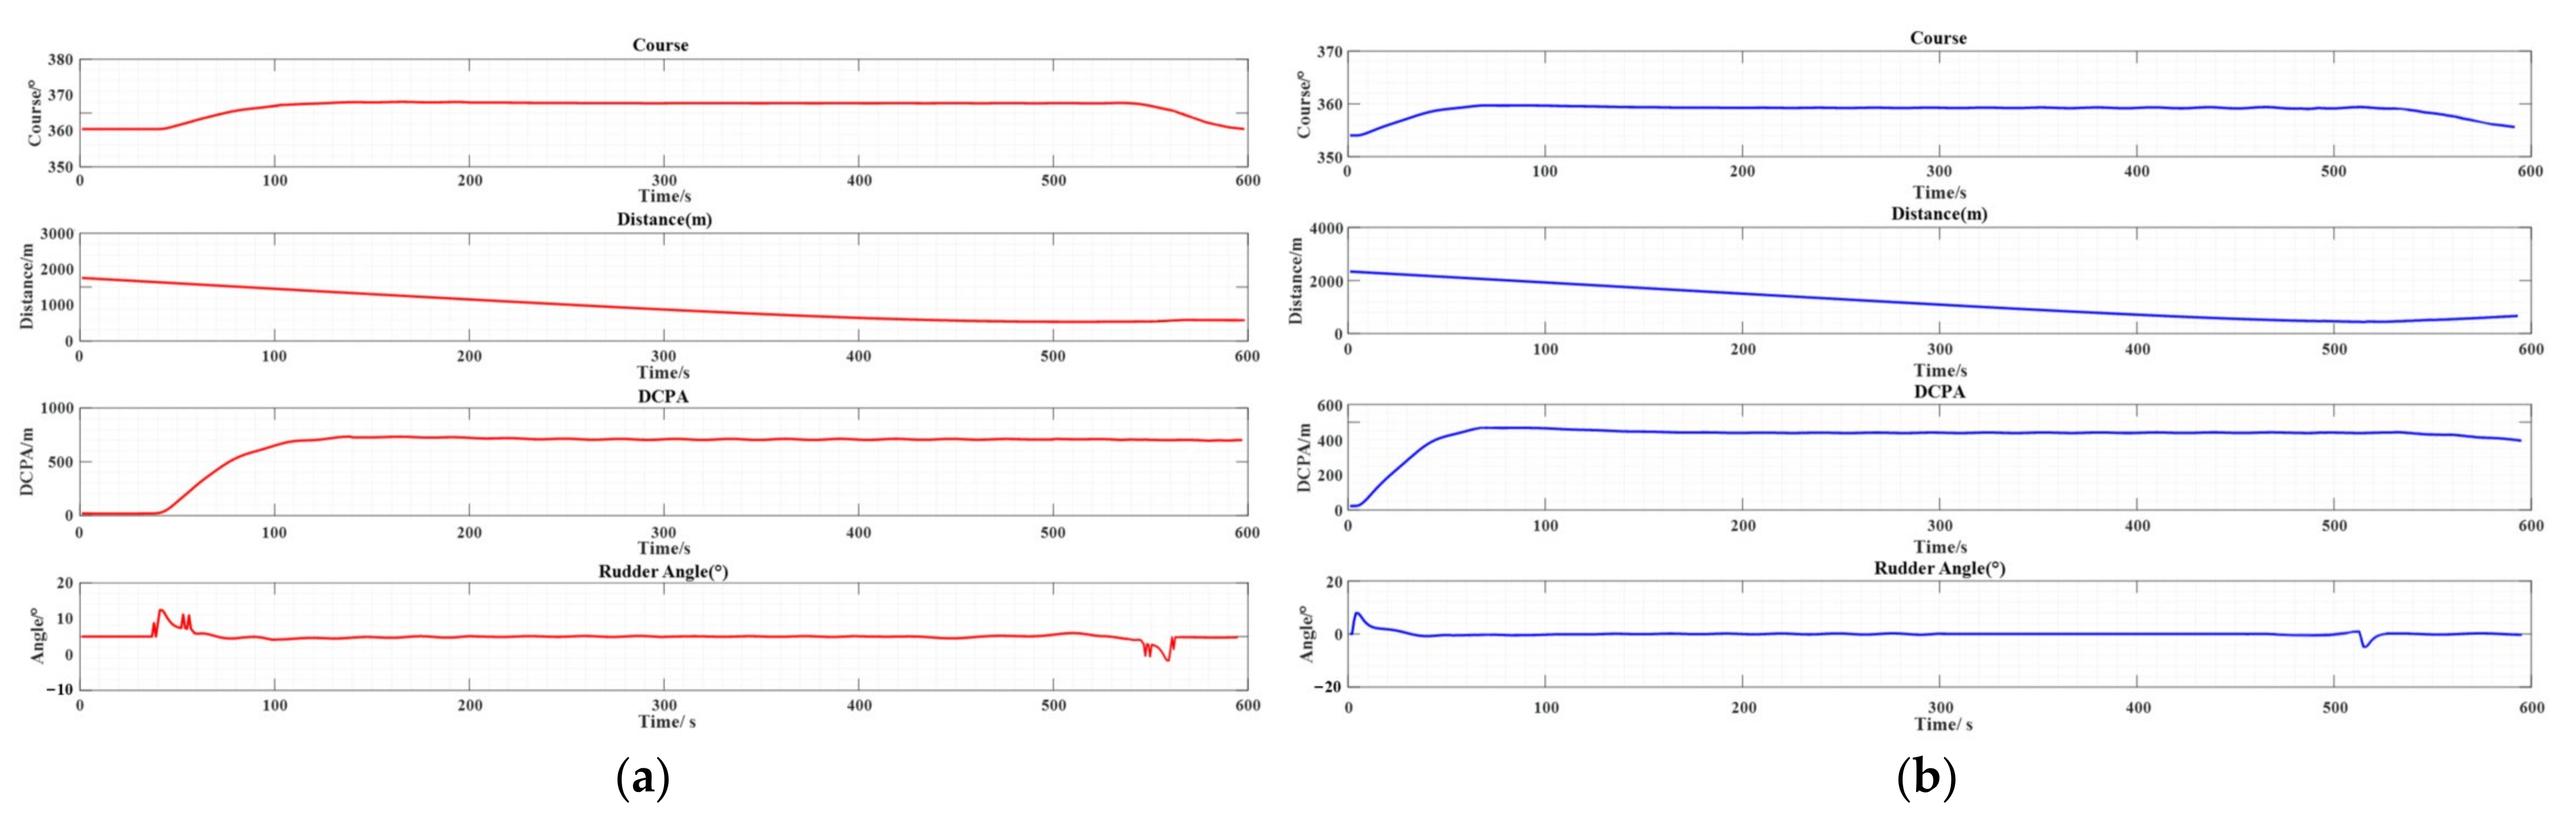
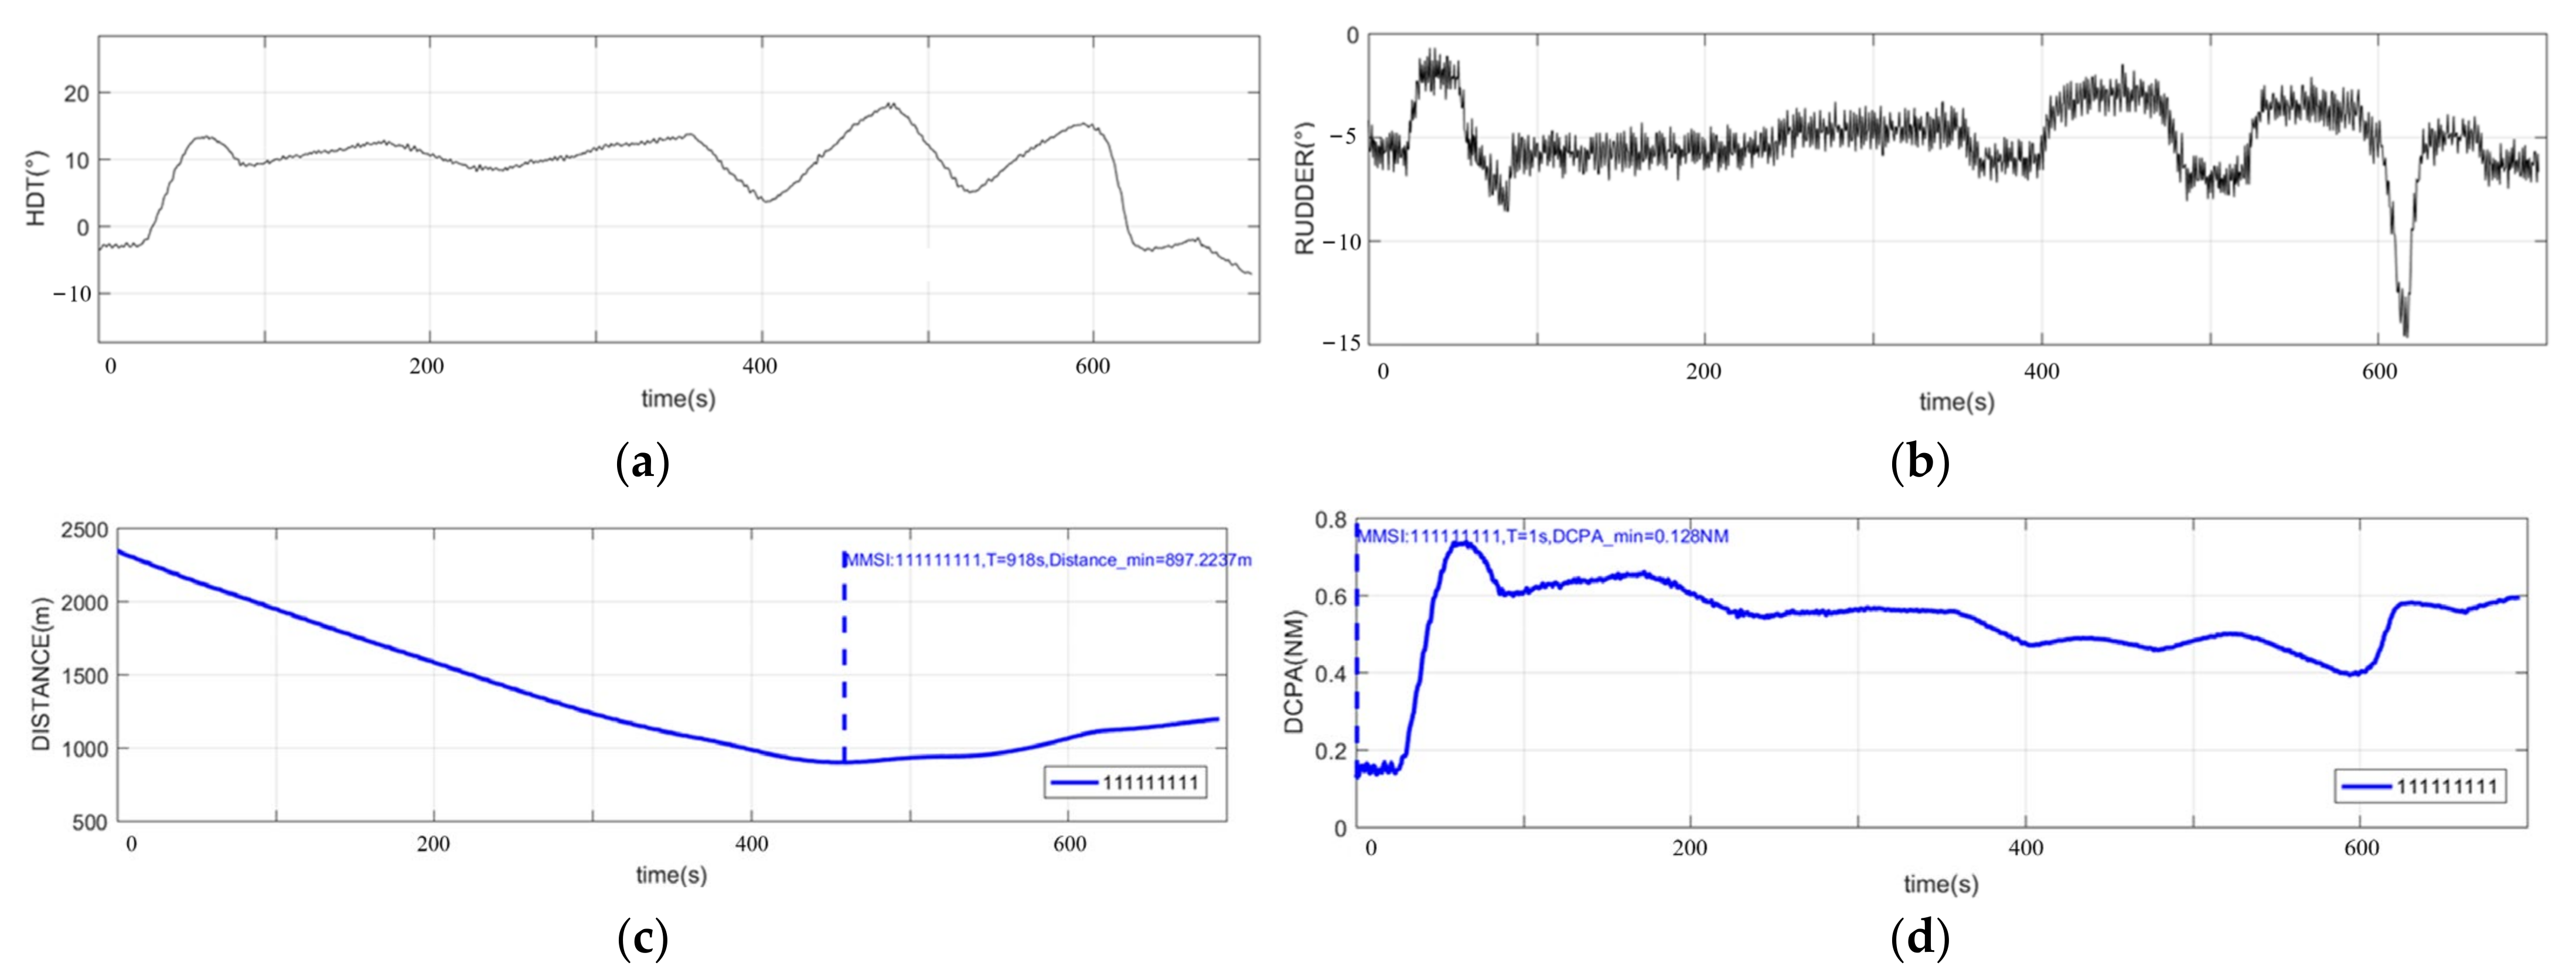
Figure 26a,b and
Figure 27 show the parameter changes of the improved VO, the traditional VO, and the actual ship experiment in the overtaking situation. The rudder angle, course,
and DCPA were analyzed under three experiments. In the improved VO, the own ship started to avoid collision at 37 s, 2200 m away from the target ship, turned right to the maximum course of 3.6°, and started returning to the original course at 562 s. The minimum of
was 717 m. In the traditional VO, the own ship started to avoid collision at 1 s, 2343 m away from the target ship, turned right to the maximum course of 0.2°, and started returning to the original course at 514 s. The minimum of
was 480 m. In the actual ship experiment, the own ship started to avoid collision at 38 s, 2200 m away from the target ship, turned right to the maximum course of 18°, and started returning to the original course at 589 s. The minimum of
was 897 m.
As shown in
Table 8, it is the evaluation system’s ranking of each index score of the three collision avoidance methods.
From the comparison of collision avoidance results in four encounter situations (head-on, starboard side crossing, port side crossing, and overtaking), it can be seen that the improved VO algorithm can strictly ensure that the ship domains of the own ship and target ship do not invade each other during collision avoidance. The minimum distance between the two ships is always greater than 0.25 NM, and the timing of starting and ending collision avoidance is relatively close to the actual ship experiment. This method can use a smaller deviation factor to complete collision avoidance at a safe distance, while taking into account safety, economy, and practicality. In the evaluation index system of collision avoidance behavior, it is significantly better than other collision avoidance methods.


