
Environmental Performance of Bulk Carriers Equipped with Synergies of Energy-Saving Technologies and Alternative Fuels

Abstract
:1. Introduction
2. Method
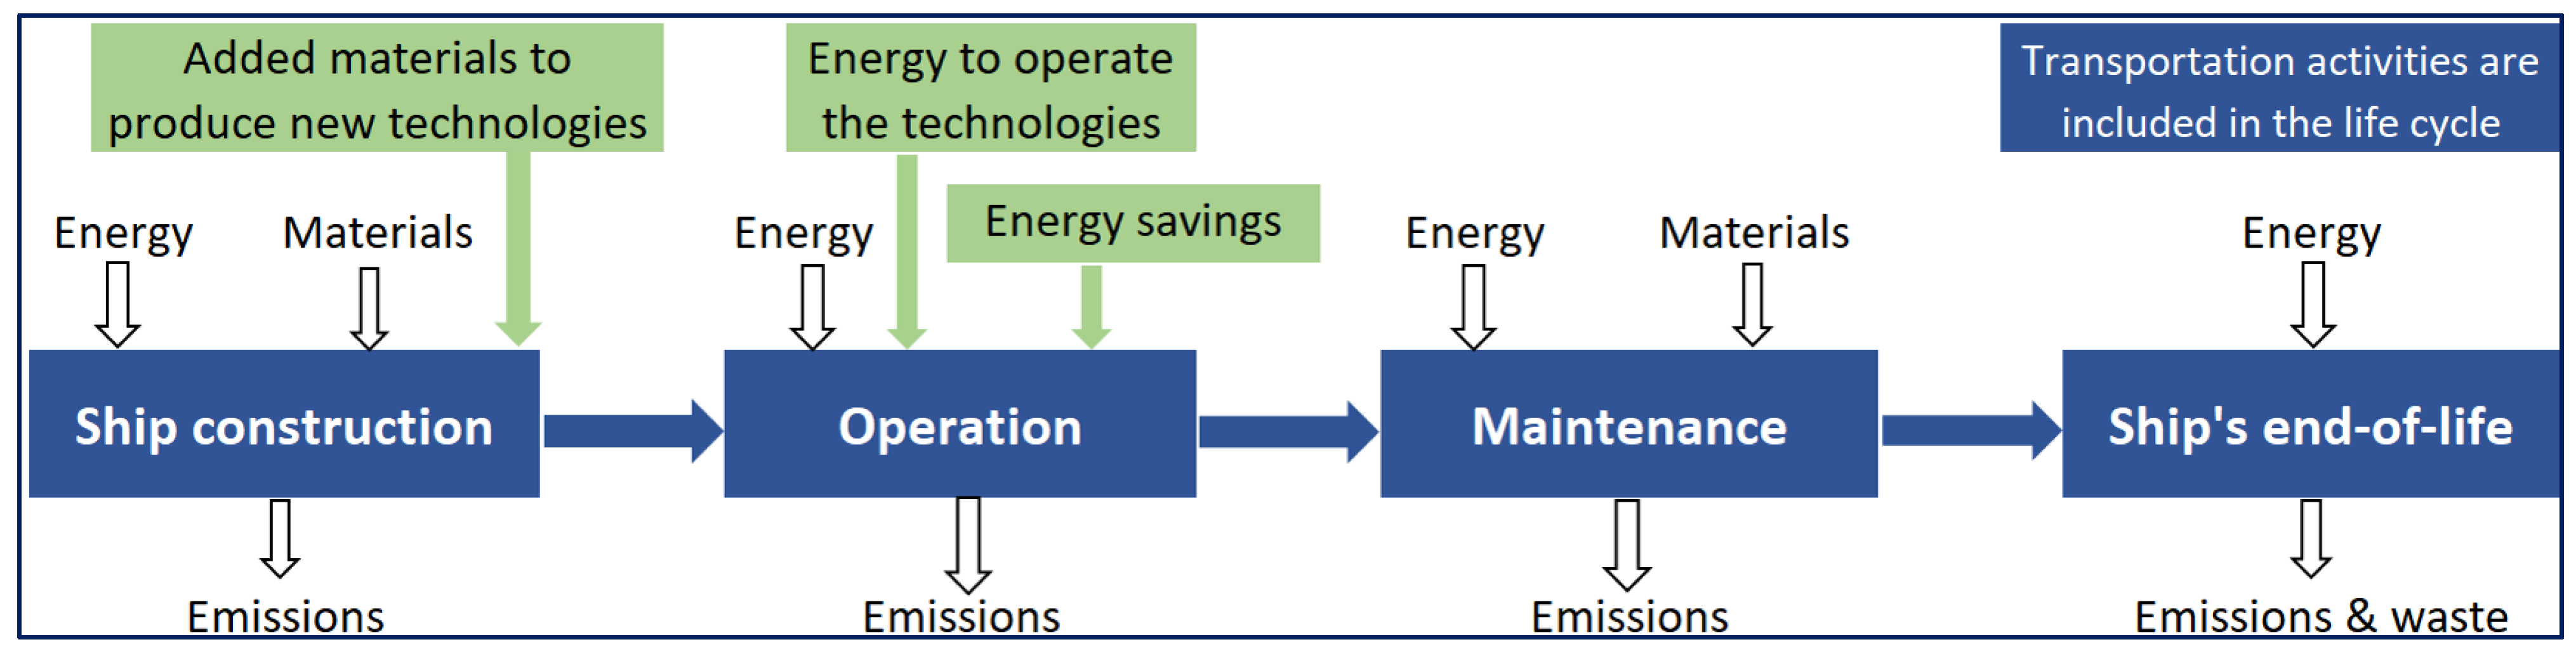
2.1. Goal and Scope Definition
- The lifetime of vessels is 25 years. After 25 years, the vessels will be retired, and the materials will be recycled.
- Waste generation and management during the ship’s life cycle, labour, and economic factors are ignored.
- Malfunction of engines, equipment, and system are also ignored in the ship’s life cycle.
- Both baseline and future vessels have the same maintenance plan. The maintenance phase will affect the transportation work amount due to the idle status of the vessel at this time.
- The difference in the transportation work and cargo capacity between the baseline vessel and future vessel are considered in the uncertainty analysis.
- The data for transportation work of the reference vessel are used to estimate the total transportation work in the entire life cycle.
2.2. Life Cycle Inventory
2.2.1. Data for Vessels’ Life Cycle Phases
2.2.2. Digital Model
2.2.3. Uncertainty Analysis and Parameter Variation Description
3. Results and Discussion
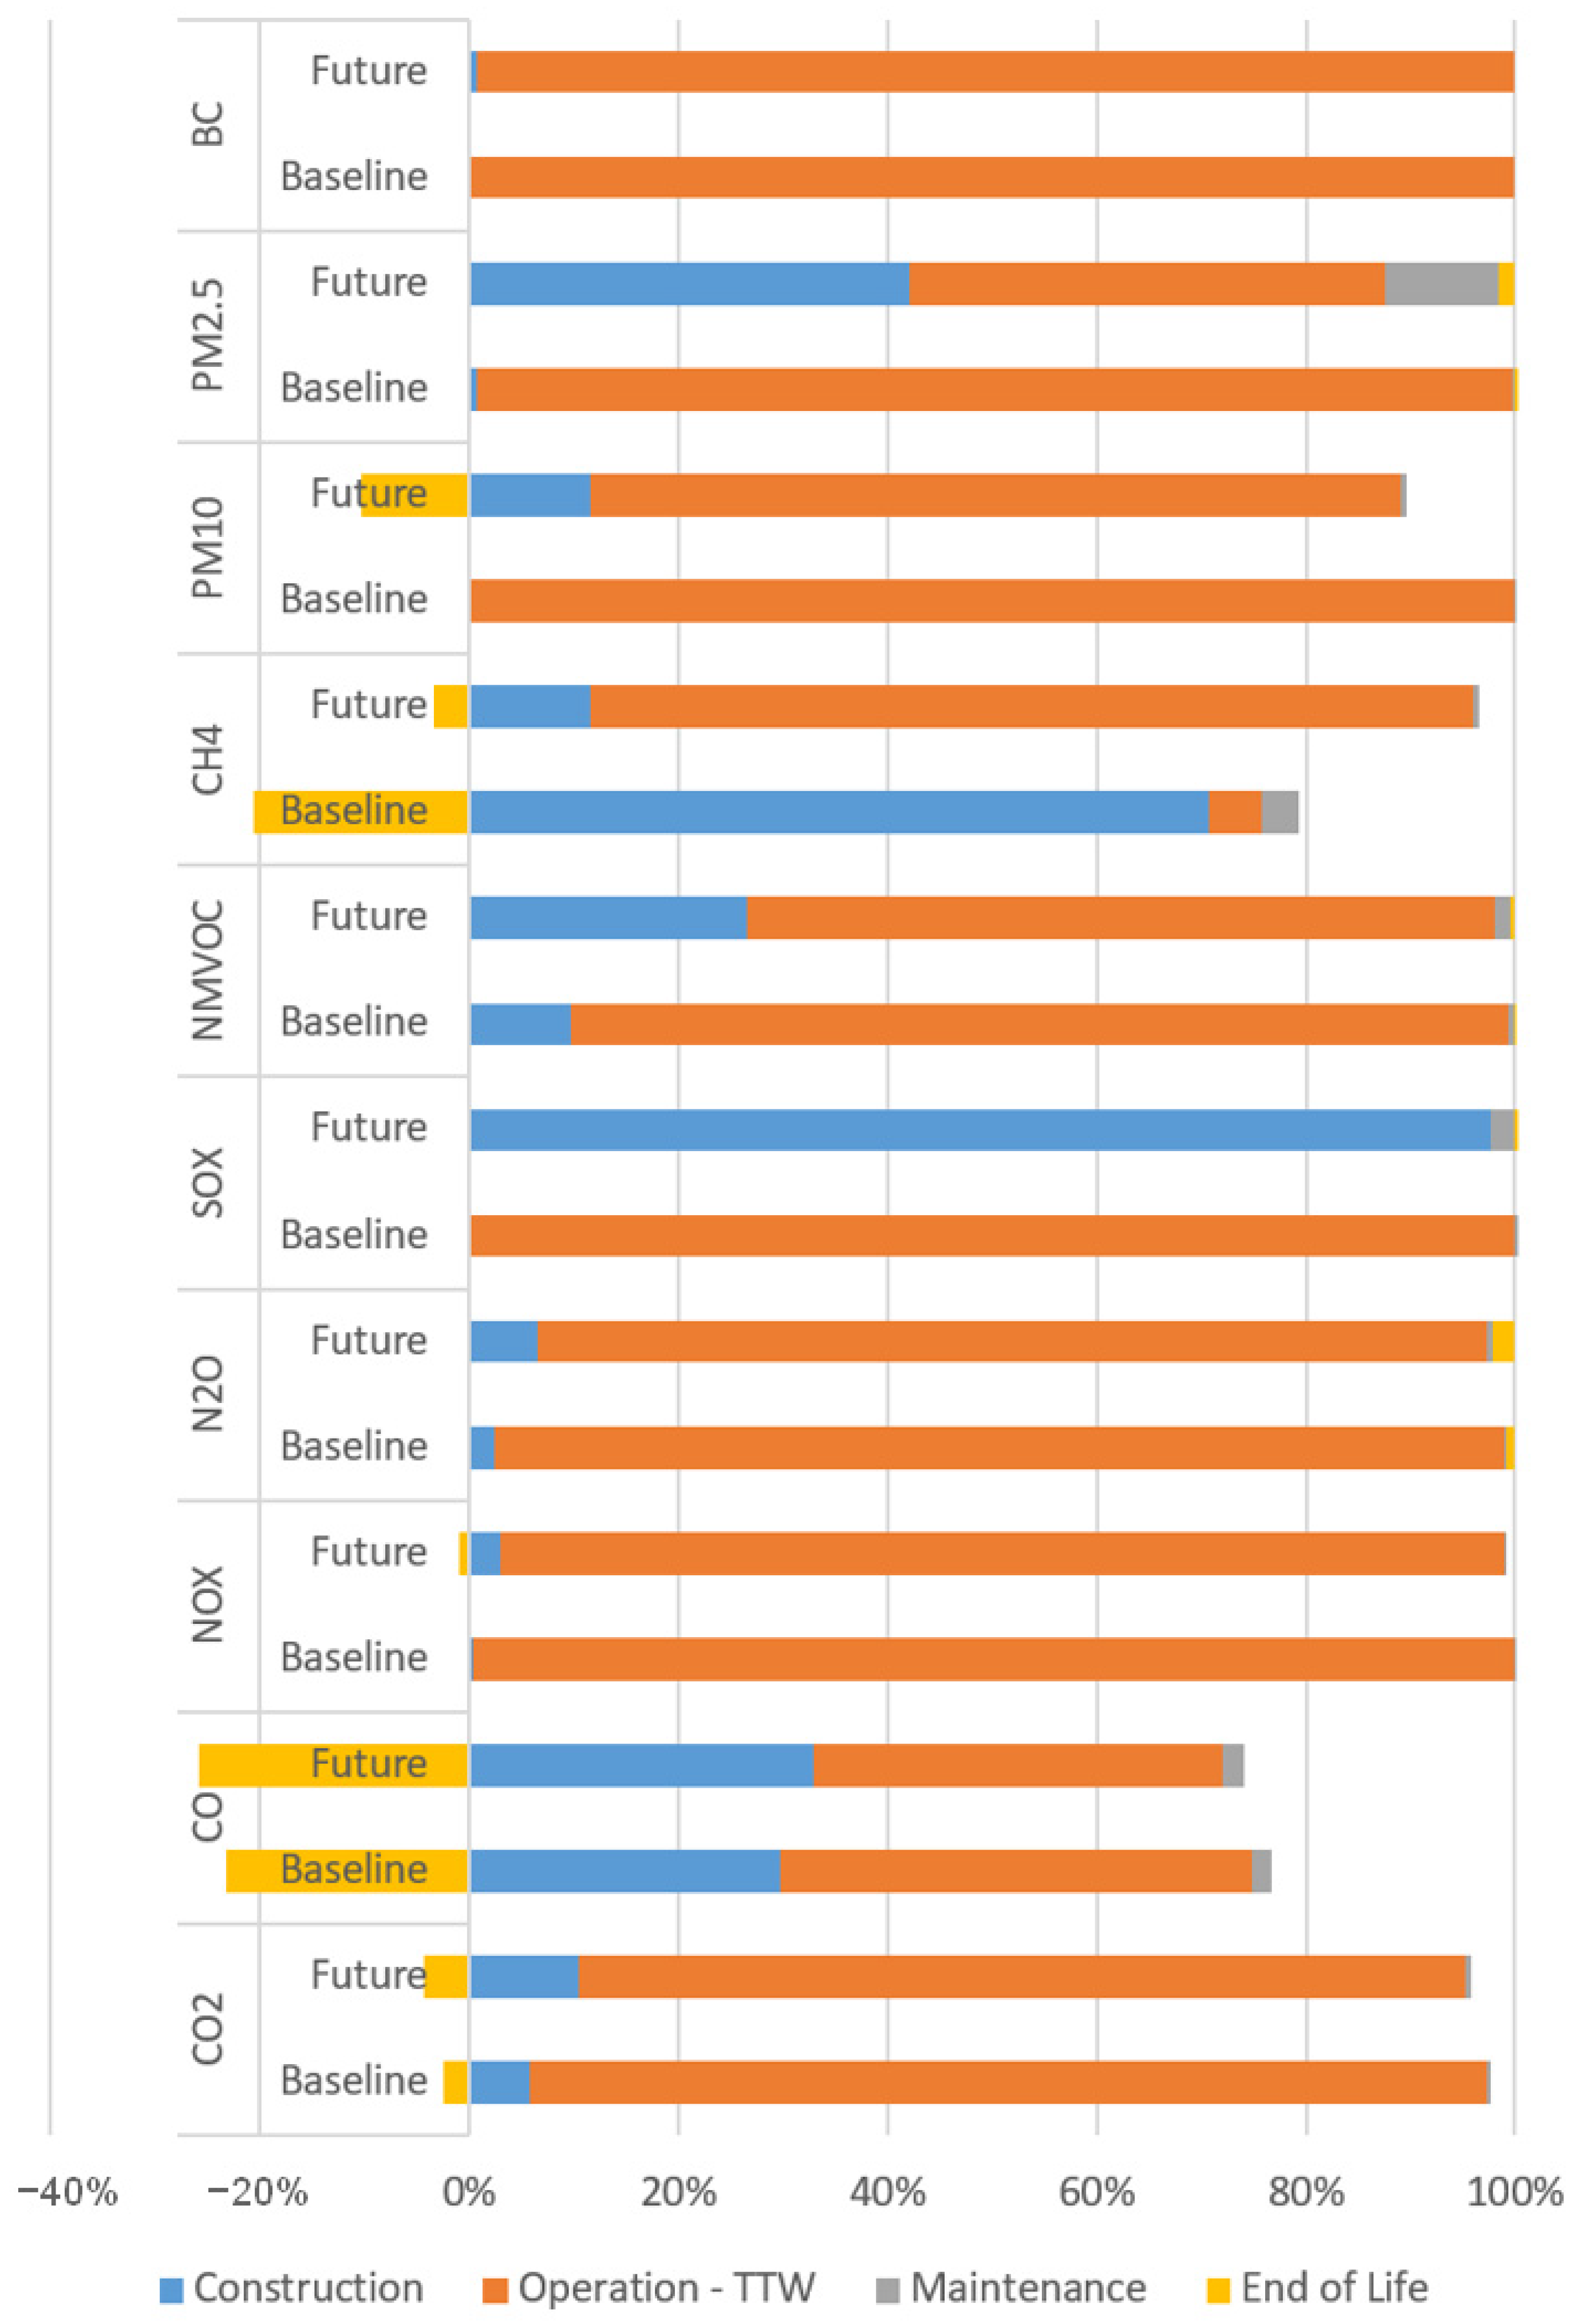
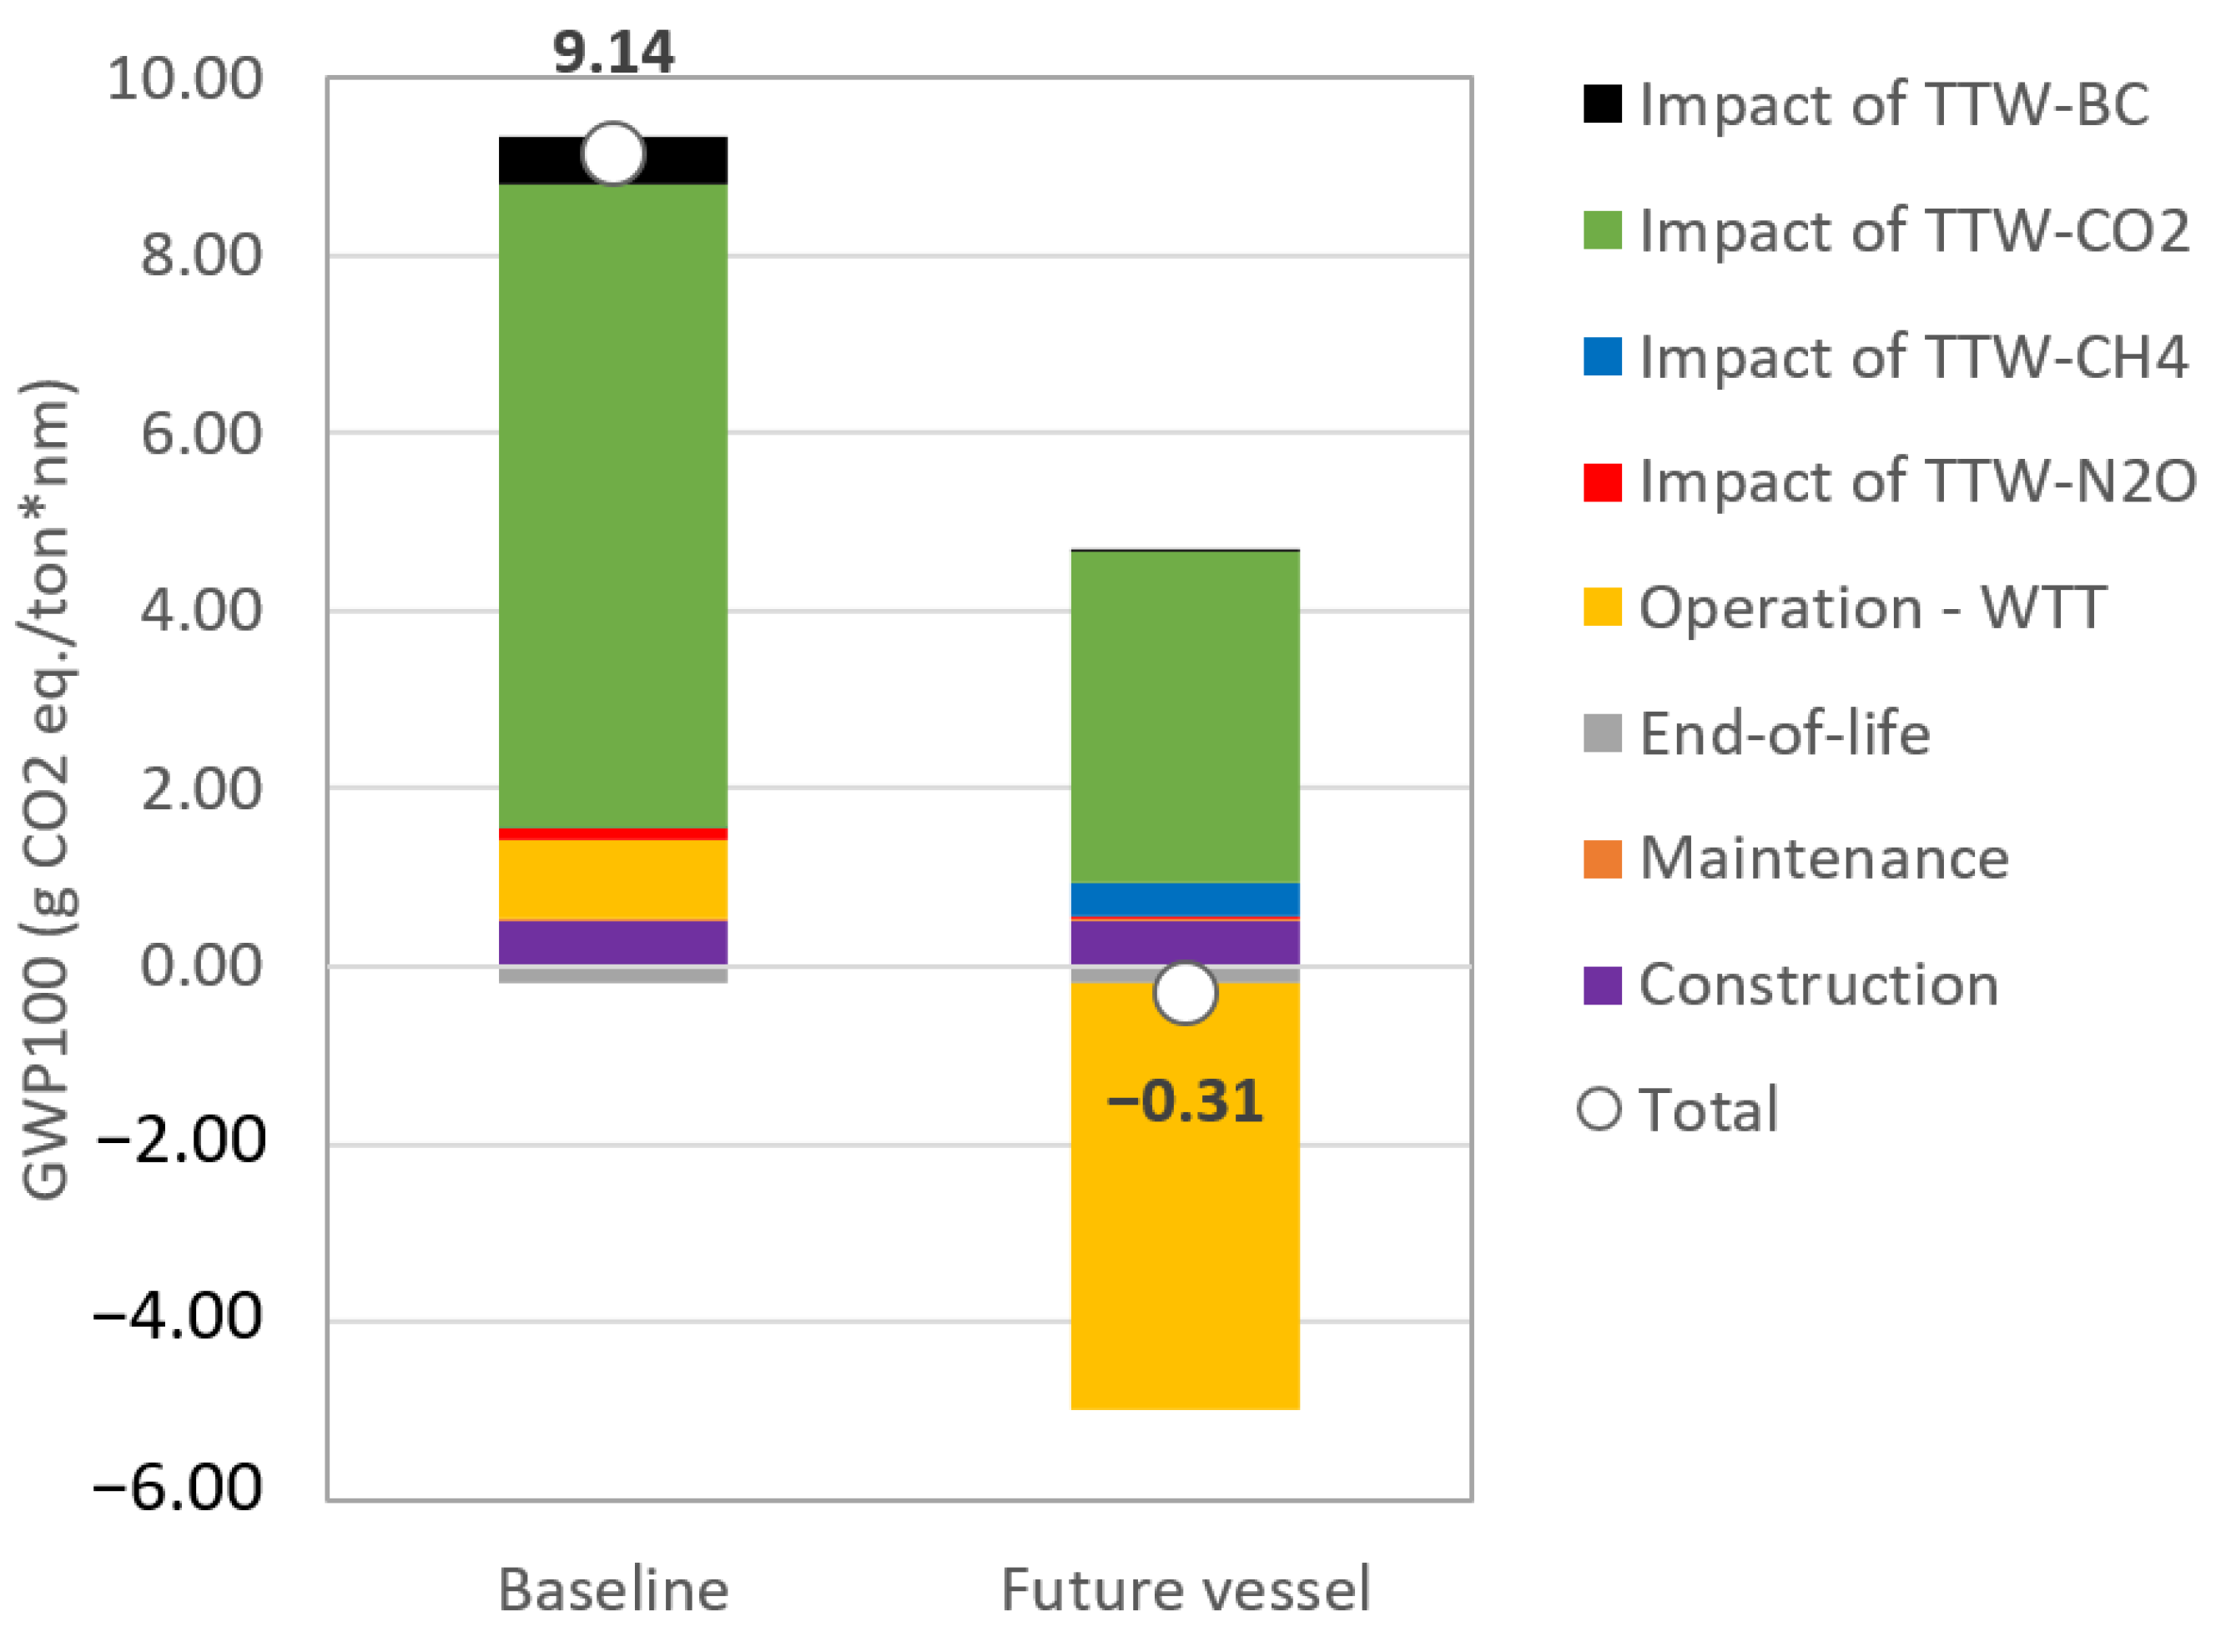
3.1. Life Cycle Emissions and GWP
3.2. Sensitivity Analysis and Parameter Variation
4. Conclusions
- The use of energy-saving techniques working in synergy and alternative fuels plays a crucial role in reducing the impacts on the environment. In order to reach zero or near-zero impact from a life cycle perspective, more technologies on-board vessels and upstream of marine fuels’ production need to be investigated and studied. Furthermore, energy-saving technologies ensure lower costs for alternative marine fuels in a ship’s operation phase.
- The use of alternative fuels could reduce the impact of ship operation and the contribution of ship construction, maintenance, and end-of-life. Therefore, the role of these phases should be considered adequately soon.
- The LCA methodology should be used as a credible tool to support maritime decarbonisation. A credible framework and guideline should be established which consider all the life cycle phases of the vessels, not the life cycle of marine fuels only. In summary, this LCA study underscores the vital importance of adopting a holistic approach to maritime sustainability, encompassing innovative technologies, alternative fuels, and a comprehensive understanding of the entire life cycle of bulk carriers. By embracing these principles, the industry can strive towards a more environmentally responsible and sustainable future.
Author Contributions
Funding
Institutional Review Board Statement
Informed Consent Statement
Data Availability Statement
Conflicts of Interest
References
- Bodansky, D. Regulating Greenhouse Gas Emissions from Ships: The Role of the International Maritime Organization. In Ocean Law Debates: The 50-Year Legacy and Emerging Issues for the Years Ahead; Scheiber, H., Oral, N., Kwon, M., Eds.; BRILL: Leiden, The Netherlands, 2016. [Google Scholar]
- IMO. Fourth IMO GHG Study 2020; IMO: London, UK, 2020; Available online: https://www.imo.org/en/ourwork/Environment/Pages/Fourth-IMO-Greenhouse-Gas-Study-2020.aspx (accessed on 16 November 2023).
- IMO. 2023 IMO Strategy on Reduction of GHG Emissions from Ships. Available online: https://wwwcdn.imo.org/localresources/en/OurWork/Environment/Documents/annex/MEPC%2080/Annex%2015.pdf (accessed on 27 September 2023).
- CHEK. Decarbonizing Shipping. Available online: https://www.projectchek.eu/ (accessed on 11 November 2023).
- Dong, D.T.; Cai, W. Life-cycle assessment of ships: The effects of fuel consumption reduction and light displacement tonnage. P. I. Mech. Eng. M-J. Eng. 2019, 234, 143–153. [Google Scholar] [CrossRef]
- ISO 14040; Environmental Management—Life Cycle Assessment—Principles and Framework. ISO: Geneva, Switzerland, 2006.
- Chatzinikolaou, S.D.; Ventikos, N.P. Holistic framework for studying ship air emissions in a life cycle perspective. Ocean Eng. 2015, 110, 113–122. [Google Scholar] [CrossRef]
- Mondello, G.; Salomone, R.; Saija, G.; Lanuzza, F.; Gulotta, T.M. Life Cycle Assessment and Life Cycle Costing for assessing maritime transport: A comprehensive literature review. Marit. Policy Manag. 2021, 50, 198–218. [Google Scholar] [CrossRef]
- Mio, A.; Fermeglia, M.; Favi, C. A critical review and normalization of the life cycle assessment outcomes in the naval sector. Bibliometric analysis and characteristics of the studies. J. Clean. Prod. 2022, 371, 133268. [Google Scholar] [CrossRef]
- Istrate, I.; Iribarren, D.; Dufour, J.; Ortiz Cebolla, R.; Arrigoni, A.; Moretto, P.; Dolci, F. Quantifying Emissions in the European Maritime Sector; Publications Office of the European Union: Luxembourg, 2022. [Google Scholar]
- IMO. MEPC 80-WP.7—Report of the Fifteenth Meeting of the Intersessional Working Group on Reduction of GHG Emissions; IMO: London, UK, 2023. [Google Scholar]
- Ecoinvent. Ecoinvent Database. 2023. Available online: https://ecoinvent.org/the-ecoinvent-database/ (accessed on 10 October 2023).
- LCA for Experts (GaBi), Stuttgart. 2023. Available online: https://sphera.com/life-cycle-assessment-lca-software/ (accessed on 10 November 2023).
- IPCC. Climate Change 2021: The Physical Science Basis. Contribution of Working Group I to the Sixth Assessment Report of the Intergovernmental Panel on Climate Change; IPCC: Geneva, Switzerland, 2021. [Google Scholar]
- Jain, K.P.; Pruyn, J.F.J.; Hopman, J.J. Quantitative assessment of material composition of end-of-life ships using onboard documentation. Resour. Conserv. Recycl. 2016, 107, 1–9. [Google Scholar] [CrossRef]
- Johnsen, T.; Fet, A.M. Screening Life Cycle Assessment of M/V Color Festival; HiÅ10/B101/R-98/009/00; Aalesund College: Ålesund, Norway, 1998. [Google Scholar]
- Kameyama, M.; Hiraoka, K.; Tauchi, H. Study on Life Cycle Impact Assessment for Ships; National Maritime Reseach Institute: Tokyo, Japan, 2007.
- National Pollutant Inventory. Emission Estimation Technique Manual for Shipbuilding Repair and Maintenance. Available online: http://www.npi.gov.au/resource/emission-estimation-technique-manual-shipbuilding-repair-and-maintenance (accessed on 27 October 2018).
- The National Shipbuilding Research Program. Particulate Emission Factors for Blasting Operations and Other Potential Sources. Available online: https://apps.dtic.mil/sti/tr/pdf/ADA447602.pdf (accessed on 10 November 2023).
- Harish, C.; Sunil, S.K. Energy Consumption and Conservation in Shipbuilding. Int. J. Innov. Res. Dev. 2015, 4, 26–31. Available online: https://api.semanticscholar.org/CorpusID:108931394 (accessed on 21 October 2023).
- Kumar, R. Ship Dismantling—A Status Report on South Asia; Euroconsult Mott MacDonald and WWF-India: New Delhi, India, 2011. [Google Scholar]
- Aage Bjørn, A.; Erik, B.; Terje, S. Decommissioning of Ships. Environmental Standards; NO. 2000-3158; Det Norske Veritas: Høvik, Norway, 2000. [Google Scholar]
- Young Power in Social Action. Ship Breaking in Bangladesh. Environmental Pollution. Available online: http://www.shipbreakingbd.info/Environment.html (accessed on 16 April 2019).
- The European Parliament and the Council of the European Union. Directive (eu) 2018/2001 of the European Parliament and of the Council of 11 December 2018 on the Promotion of the Use of Energy from Renewable Sources (Recast). Available online: https://eur-lex.europa.eu/eli/dir/2018/2001/oj (accessed on 18 November 2023).
- Wärtsilä. LNG Plants—Mini and Small Scale Liquefaction Technology; Wärtsilä: Helsinki, Finland, 2016; Available online: https://cdn.wartsila.com/docs/default-source/product-files/ogi/lng-solutions/brochure-o-ogi-lng-liquefaction.pdf (accessed on 11 January 2024).
- Lehtoranta, K.; Kuittinen, N.; Vesala, H.; Koponen, P. Methane Emissions from a State-of-the-Art LNG-Powered Vessel. Atmosphere 2023, 14, 825. [Google Scholar] [CrossRef]
- Albin, K.; Simon, A.; Tomas, R. Well-to-Wheel LCI Data for HVO Fuels on the Swedish Market. 2019. Available online: https://f3centre.se/app/uploads/f3-23-17_2019-04_Källmén-et-al_Rev_190508_FINAL.pdf (accessed on 11 January 2024).
- Brian, P.; Jens, E. HVO Fuel Proven to be Effective for Diesel Generator Sets. 2019. Available online: https://www.mtu-solutions.com/content/dam/mtu/technical-article/2022/hvo-fuel-proven-to-be-effective-for-diesel-generator-sets/WP_HVO_Proven_Effective_Diesel_Gensets_FINAL.pdf/_jcr_content/renditions/original./WP_HVO_Proven_Effective_Diesel_Gensets_FINAL.pdf (accessed on 11 January 2024).
- Pechout, M.; Kotek, M.; Jindra, P.; Macoun, D.; Hart, J.; Vojtisek-Lom, M. Comparison of hydrogenated vegetable oil and biodiesel effects on combustion, unregulated and regulated gaseous pollutants and DPF regeneration procedure in a Euro6 car. Sci. Total Environ. 2019, 696, 133748. [Google Scholar] [CrossRef] [PubMed]
- Arun, K.; Tomasz, H.; Grzegorz, M. Bulk carrier with rigid sails—Combined effects of realistic weather conditions. In Proceedings of the 23rd Hydronav 2023—International Symposium on Hydrodynamics in Ship Design, Safety, Manoeuvring and Operation, Sopot, Poland, 24–26 May 2023; pp. 44–52. [Google Scholar]
- Annika, S.; Mia, E.; Bogdan, M.; Arun, K.; Ville, W. Development in CII Performance of a Bulk Carrier, Transitioning from Today’s State of the Art to Net-Zero Design. In Proceedings of the 15th Symposium on High-Performance Marine Vehicles HIPER’23, Bernried, Germany, 18–20 September 2023; pp. 234–247. Available online: http://data.hiper-conf.info/Hiper2023_Bernried.pdf (accessed on 11 January 2024).
- Barahmand, Z.; Eikeland, M.S. Life Cycle Assessment under Uncertainty: A Scoping Review. World 2022, 3, 692–717. [Google Scholar] [CrossRef]
- Saltelli, A.; Annoni, P.; Azzini, I.; Campolongo, F.; Ratto, M.; Tarantola, S. Variance based sensitivity analysis of model output. Design and estimator for the total sensitivity index. Comput. Phys. Commun. 2010, 181, 259–270. [Google Scholar] [CrossRef]
- Selvaraj, R.; Nasir, K.T.A.; Vasa, N.J.; Nagendra, S.M.S. Monitoring of CO2 and CH4 composition in a biogas matrix from different biomass structures. Sens. Actuators B Chem. 2017, 249, 378–385. [Google Scholar] [CrossRef]

| Life Cycle Phases/Processes | Explanation/Estimation |
|---|---|
| Construction | Main material of the vessel’s hull is steel. Hull’s material composition is based on Ecoinvent version 3.8 database [12,15]. It is assumed that 5% of steel is added due to loss and reservation in cutting process. Also, 95% of 5% will be recycled and 5% of 5% will be considered as solid waste [16]. Table 2 shows the material composition of the vessel’s hull. |
| Material extraction and production | |
| Transportation from steel mill to shipyard | The ship is assumed to be built in a Japanese shipyard. The materials are transported by trucks across a distance of 200 km. |
| Electricity consumption in shipyard | On average, 145.5 kWh of electricity is consumed to process one ton of steel [17]. This value contains very high uncertainties; therefore, sensitivity analysis is considered. |
| Typical activities/processes in shipyard | Cutting process emit particulate matter and NOX due to air burned in very high temperatures. Emission factors are taken from [18]. Welding methodologies are arc welding, gas welding, and resistance welding. Processes are available in the Ecoinvent 3.8 database. Surface treatment consumes sand as abrasive media. In reality, other materials are chosen as abrasive media due to better PM performance, but the emission factors of these abrasive media are very limited. For this activity, data are taken from [19]. For the painting process, the information of paint consumption and painting area are taking from [16,20]. The process of paint production is available in Ecoinvent 3.8 database. In sea trials, 32.5 ton of fuel consumption is referred to from a bulk carrier which has similar engine power (8800 kW) [17]. |
| Maintenance | Around 6% of steel is replaced in this phase (suggested by the ship owner), and 6% of electricity in shipbuilding is consumed. The processes in this phase are similar to the construction phase. Cutting of old steel using propane as cutting gas. Propane production process is available in the Ecoinvent 3.8. CO2 emission factor in this process is based on the combustion reaction between propane and oxygen with 3 kg of CO2 emitted per 1 kg of propane used. The rate of steel to be lost and to be recycled in cutting old steel and cutting new steel is similar to the cutting process in the construction phase. |
| Ship operation | Table 3 and Table 4 present WTT carbon factors and TTW emission factors of marine fuels used in this study. |
| Fuel production (WTT) | |
| Engine operation (TTW) | |
| End-of-life | Cutting steel activities in this phase are considered as similar to cutting old steel in maintenance phase. A total of 10% of steel is considered to be lost and 90% of steel in vessel’s hull will be recycled. Residual diesel oil, polychlorinated biphenyl from plastics and cable, asbestos, antifouling paint, and glass wool are considered as waste in this phase. Data are taken from [21,22,23]. |
| Hull shredding | |
| Material recycling | |
| Toxic waste |
| Items | % LDT | Mass (ton) |
|---|---|---|
| Aluminium, wrought alloy | 0.050% | 6.3 |
| Asbestos, chrysotile type | 2.500% | 315.7 |
| Bronze | 0.150% | 18.9 |
| Copper, cathode | 0.160% | 20.2 |
| Electronic component machinery, unspecified | 1.200% | 151.5 |
| Glass wool mat | 2.500% | 315.7 |
| Glued laminated timber, average glue mix (joinery) | 1.300% | 164.2 |
| Marine engine | 6.200% | 782.9 |
| Polyethylene, high-density granulate | 1.200% | 151.5 |
| Polypropylene, granulate | 1.200% | 151.5 |
| Polystyrene, expandable | 1.200% | 151.5 |
| Polyurethane, flexible foam | 1.200% | 151.5 |
| Polyvinylidenchloride, granulate | 1.200% | 151.5 |
| Reinforcing steel | 76.800% | 9697.5 |
| Sanitary ceramics | 2.500% | 315.7 |
| Zinc | 0.700% | 88.4 |
| Total | 100% | 12,634.6 |
| Fuel Type | Value | Reference |
|---|---|---|
| VLSFO | 0.385 | Ecoinvent v3.8 [12] and Sphera database |
| MDO | 0.409 | Ecoinvent v3.8 [12] and Sphera database |
| LBG | −3.648 | RED II [24], including liquefaction process by using renewable energy |
| HVO | −1.552 | RED II [24] |
| Emissions | VLHFO | MDO | LBG | HVO *** |
|---|---|---|---|---|
| CO2 | 3.114 × 100 | 3.206 × 100 | 2.755 × 100 | 3.202 × 100 |
| CO | 2.880 × 10⁻³ | 2.590 × 10⁻³ | 3.970 × 10⁻³ | 1.501 × 10⁻³ |
| PM10 | 7.550 × 10⁻³ | 9.022 × 10⁻⁴ | 1.100 × 10⁻⁴ | 5.052 × 10⁻⁴ |
| PM2.5 | 6.940 × 10⁻³ | 8.300 × 10⁻⁴ | 1.000 × 10⁻⁴ | 4.648 × 10⁻⁴ |
| CH4 | 5.000 × 10⁻⁵ | 5.000 × 10⁻⁵ | 1.659 × 10⁻² * | 5.152 × 10⁻⁶ |
| NOX | 7.590 × 10⁻² | 5.671 × 10⁻² | 1.344 × 10⁻² | 5.514 × 10⁻² |
| N2O | 1.800 × 10⁻⁴ | 1.800 × 10⁻⁴ | 1.000 × 10⁻⁴ | 1.855 × 10⁻⁴ |
| NMVOC | 3.200 × 10⁻³ | 2.400 × 10⁻³ | 1.590 × 10⁻³ | 2.473 × 10⁻³ |
| SOX ** | 9.775 × 10⁻⁶ | 9.775 × 10⁻⁶ | 0.000 × 100 | 0.000 × 100 |
| BC | 2.600 × 10⁻⁴ | 3.800 × 10⁻⁴ | 1.900 × 10⁻⁵ | 2.271 × 10⁻⁴ |
| Vessels | Main Engines | Auxiliary Engines | Boiler | Energy Consumption * (MJ) | ||||||
|---|---|---|---|---|---|---|---|---|---|---|
| VLSFO | LBG | HVO | VLSFO | LBG | HVO | VLSFO | LGB | HVO | ||
| Baseline | 110,057 | - | - | 24,493 | - | - | 5077 | - | - | 5.613 × 10⁹ |
| Future | - | 73,550 | 2839 | - | 2825 | 218 | - | 1175 | - | 3.86 × 10⁹ |
| Factors | Units | Lower Limit | Upper Limit |
|---|---|---|---|
| Electricity consumption in shipyards | kWh/ton of steel | 72.75 | 218.25 |
| Steel reservation rate | % | 3 | 7 |
| Welding length | m/ton of steel | 70 | 110 |
| Paint consumption | kg/m2 | 0.464 | 0.696 |
| Area of sandblasting | m2 | 33,917 | 50,875 |
| Rate of steel replacement | % | 4 | 8 |
| Rate of steel to be recycled | % | 4 | 8 |
| Life time of vessels | year | 20 | 30 |
| Rate of pilot fuel * | % | 10 | 28 |
| Cargo weight change * | % | −5% | 5% |
| Operation Phase | Entire Life Cycle | |||||
|---|---|---|---|---|---|---|
| Emissions | Baseline | Future | % Reduction | Baseline | Future | % Reduction |
| GWP | 8.81 × 100 | −6.41 × 10⁻¹ | 107.3% | 9.14 × 100 | −3.05 × 10⁻¹ | 103.3% |
| CO2 | 7.25 × 100 | 3.72 × 100 | 48.6% | 7.55 × 100 | 4.02 × 100 | 46.7% |
| NOX | 1.77 × 10⁻¹ | 2.02 × 10⁻² | 88.6% | 1.77 × 10⁻¹ | 2.06 × 10⁻² | 88.3% |
| SOX | 2.27 × 10⁻² | 0.00 × 100 | 100.0% | 2.49 × 10⁻⁵ | 2.17 × 10⁻⁶ | 91.3% |
| BC | 6.05 × 10⁻⁴ | 3.61 × 10⁻⁵ | 94.0% | 6.05 × 10⁻⁴ | 3.64 × 10⁻⁵ | 94.0% |
| Baseline Vessel | Future Vessel | |||
|---|---|---|---|---|
| Parameter | Lower | Upper | Lower | Upper |
| Electricity consumption in shipyards | −0.178% | 0.178% | −0.473% | 0.473% |
| Steel reservation rate | −0.08% | 0.08% | −0.221% | 0.221% |
| Welding length | −0.02% | 0.02% | −0.07% | 0.07% |
| Paint consumption | −0.01% | 0.01% | −0.04% | 0.04% |
| Area of sandblasting | 0.00% | 0.00% | 0.00% | 0.00% |
| Rate of steel replacement | −0.03% | 0.03% | −0.09% | 0.09% |
| Rate of steel to be recycled | 0.66% | −0.66% | 2.09% | −2.09% |
| Life time of vessels | −3.74% | 3.74% | −6.33% | 6.33% |
| Rate of pilot fuel | 0.00% | 0.00% | −7.65% | 7.65% |
| Cargo weight | 0.00% | 0.00% | 7.67% | 7.67% |
Disclaimer/Publisher’s Note: The statements, opinions and data contained in all publications are solely those of the individual author(s) and contributor(s) and not of MDPI and/or the editor(s). MDPI and/or the editor(s) disclaim responsibility for any injury to people or property resulting from any ideas, methods, instructions or products referred to in the content. |
© 2024 by the authors. Licensee MDPI, Basel, Switzerland. This article is an open access article distributed under the terms and conditions of the Creative Commons Attribution (CC BY) license (https://creativecommons.org/licenses/by/4.0/).
Share and Cite
Dong, T.; Buzuku, S.; Elg, M.; Schönborn, A.; Ölcer, A.I. Environmental Performance of Bulk Carriers Equipped with Synergies of Energy-Saving Technologies and Alternative Fuels. J. Mar. Sci. Eng. 2024, 12, 425. https://doi.org/10.3390/jmse12030425
Dong T, Buzuku S, Elg M, Schönborn A, Ölcer AI. Environmental Performance of Bulk Carriers Equipped with Synergies of Energy-Saving Technologies and Alternative Fuels. Journal of Marine Science and Engineering. 2024; 12(3):425. https://doi.org/10.3390/jmse12030425
Chicago/Turabian StyleDong, Tuan, Shqipe Buzuku, Mia Elg, Alessandro Schönborn, and Aykut I. Ölcer. 2024. "Environmental Performance of Bulk Carriers Equipped with Synergies of Energy-Saving Technologies and Alternative Fuels" Journal of Marine Science and Engineering 12, no. 3: 425. https://doi.org/10.3390/jmse12030425