Article

Long-Term Assessment of Morocco’s Offshore Wind Energy Potential Using ERA5 and IFREMER Wind Data

by
Younes Zekeik
1,2,
Maria J. OrtizBevia
1,*,
Francisco J. Alvarez-Garcia
1,
Ali Haddi
2,
Youness El Mourabit
2 and
Antonio RuizdeElvira
1
1
Climate Physics Group, Departamento de Física y Matemáticas, Universidad de Alcalá, Alcalá de Henares, 28801 Madrid, Spain
2
Advanced Sciences and Technologies Laboratory, ENSA, Abdelmalek Essaadi University, Tetouan 93000, Morocco
*
Author to whom correspondence should be addressed.
J. Mar. Sci. Eng. 2024, 12(3), 460; https://doi.org/10.3390/jmse12030460
Submission received: 16 February 2024 / Revised: 2 March 2024 / Accepted: 4 March 2024 / Published: 6 March 2024
(This article belongs to the Section Marine Energy)

Abstract

:
Offshore wind energy is a promising resource for renewable energy development. Reanalysed wind data are unmatched by other wind data sources in providing a long-term assessment of wind power potential. In this study, 10 of the selected offshore locations close to the Moroccan coast were used to evaluate the ERA5 wind reanalysis dataset against the IFREMER-blended observational dataset covering the years 1993–2016. The ERA5 wind data’s capacity to represent wind variability in the area was confirmed by the results of the statistical methodologies used. All the reanalysed data scored better at capturing the observed wind variability at the southern sites than at the northern ones, where the wind variability was more complex. In a long-term evaluation from 1981 to 2020, the wind power potential in the Moroccan Atlantic coast was found to be very stable except in the northern sites and between Agadir and Bou Arich. Seven of the 10 sites considered were ranked as promising sites for offshore wind power generation, with wind power densities above 420 W/m2 at 100 m in height. Additionally, the change in signs in the variability toward the middle of the ERA5 record, which was seen at all locations and was also evident in the observations, did not significantly affect the yearly wind power density. However, the seasonal distribution of the latter was modified according to the local features of the seasonal variability.

1. Introduction

Offshore wind energy resources must be an important part of the energy mix if the international agreements on climate change prevention are to be met [1]. Europe has been at the forefront of the offshore wind industry since the first offshore wind farm was installed in 1991 at Vindeby in Eastern Denmark. Projections suggested that offshore wind farms would add between 7 and 11 GW/year from 2019 to 2024 to the global installed power. However, a spectacular take-off of installed offshore wind power is taking place, because 21 GW were added just in 2021, and the estimated installed offshore power was approximately 64.3 GW at the end of 2022 [2].
The scarce development of offshore renewable energies in Africa has been related to the lack of offshore wind studies [3,4,5]. Several studies have indicated the wind generation potential of the Atlantic Moroccan coast. Most of these were concerned with onshore locations [6,7,8], although the offshore wind potential was estimated to be 10 times that of onshore [9,10]. However, coastal onshore studies can also help to fill this gap, as their results can be extrapolated to nearby offshore areas.
Recently, a few studies have addressed the offshore wind energy topic using satellite products, either for the whole African continent, or directly focusing on the Moroccan case. Then, Ref. [5] used the Blended Sea Wind data set [11], while [12] employed mean wind speed values taken from the Global Wind Atlas [13]. Moreover, Benazzouz et al. [14] performed an assessment of potential offshore wind energy resources along the Atlantic coast of Morocco, based on 10 years (2008–2017) of satellite data observations. This work estimated the spatial and temporal variability at the seasonal time scales of wind speed and direction at nine particular sites along the Moroccan coast, and provided an atlas of the wind power density (WPD) at 80 m height for the whole Moroccan coast. The purpose of the present research was to extend that work to include the effect of interannual variability on wind resources. To attain this goal, a long-term assessment was performed with the help of 40 years of the European Centre for Medium Term Weather Forecast (ECMWF) Reanalysis version 5 (ERA5) wind data [15], which were validated with 24 years of blended remotely sensed wind observations from the Institut Francais pour la Recherche et l’Exploitation de la Mer (IFREMER) [16].
The quality of wind observations (in terms of temporal and spatial coverage) requested by the wind energy industry [17] can not be met by the observations from the meteorological stations in many regions. These circumstances have favoured the adoption of global reanalysis data as an assessment tool for wind resources [18]. However, reanalysed wind data can present unrealistic features and other shortcomings, and they need to be contrasted with observations. Several previous studies overlapped this topic, some on a global scale [19,20], and others focused on neighbouring geographical sectors, such as Europe [21], the Mediterranean Sea [22] and the coasts of Iberia [23]. Among these, a validation of ERA5 wind data at the Atlantic basin scale, performed by Campos et al. [24] using an ensemble of data from altimeters and scatterometers for the (2000–2021) period, stands out. Although this study focused on severe winds (above the 90th percentile), other general metrics, such as the mean, variance and skewness, bias and root mean square error (RMSE) were also considered. Their results showed the quality of ERA5 winds for non-extreme conditions, especially at the eastern boundary, while the extreme of the tropical cyclones were the worst represented. This study also found that negative biases of ERA5 winds with respect to observations were predominant at the basin scale.
The planning of wind power resources requires the characterisation of wind power variability, which, in turn, demands long-term assessments. In a study on wind variability in the Canary Islands, Azorin-Molina et al. [25] have found statistically significant relationships between sea wind observations and the Trade Wind Index [26], the North Atlantic Oscillation Index [27] and the Eastern Atlantic pattern Index [28], which are characterised by their interannual variability. Interannual wind variability (IAV) plays an important role in wind power production uncertainty [29,30,31]. According to some estimates, it can contribute between 10% and 25% to the uncertainty in energy yields over a 10-year period [32], although some more conservative estimations have rated it at 6% [17]. Pryor and Barthelmie [33] addressed the IAV estimation by defining wind indices, and using the wind indices in a specified period as a standard to compare those of other periods. Lee et al. compared and tested 27 methodologies for IAV assessment [34,35]. Additionally, a very low frequency variability was detected in the terrestrial wind speeds [36]. This variability was first identified as a decreasing trend (known as ‘wind stilling’ [37]) detected after 1980 and extending for almost 50 years, followed by a subsequent recovery after 2010 [38]. The seasonal characteristics of this low frequency variability of terrestrial wind speed, based on an analysis of monthly means for more than 4700 meteorological stations over the world for the period 1980–2018, have been pointed out in [39]. The global decreasing trend was determined by those in Europe (−19%), South America (−16%), Australia (−14%) and Asia (−13%), while in North America an increasing trend (+3%) was found. The effects of this trend on terrestrial wind power potential and its association with wind frequency changes were briefly discussed in [40]. Based on the power wind curve of a specific turbine, it was estimated that wind energy had a continuous decline at a rate of 10.2 TW/year during 1981–2010, followed by a reversal, with a rate of 2.65 TW/year during 2011–2021. In this case, an averaging was carried out for Africa, yielding a negligible decreasing trend.
In this study, we aim to shed light on the following four aspects:
-
Validation of ERA5 10 m reanalysed wind data set against the IFREMER blended remote sensing data in the period of 1993-2016;
-
Long-term characterisation of the spatial and temporal variability of wind offshore of Morocco;
-
Long-term evaluation of the offshore wind energy potential at 100 m height in Morocco;
-
Estimation of the long-term stability of wind resources offshore of Morocco.
The remainder of this paper is organized as follows: Section 2 presents the datasets and methodology for modelling the offshore wind potential in Morocco. The results are described and discussed in Section 3. Finally, Section 4 presents some conclusions.

2. Data and Methods

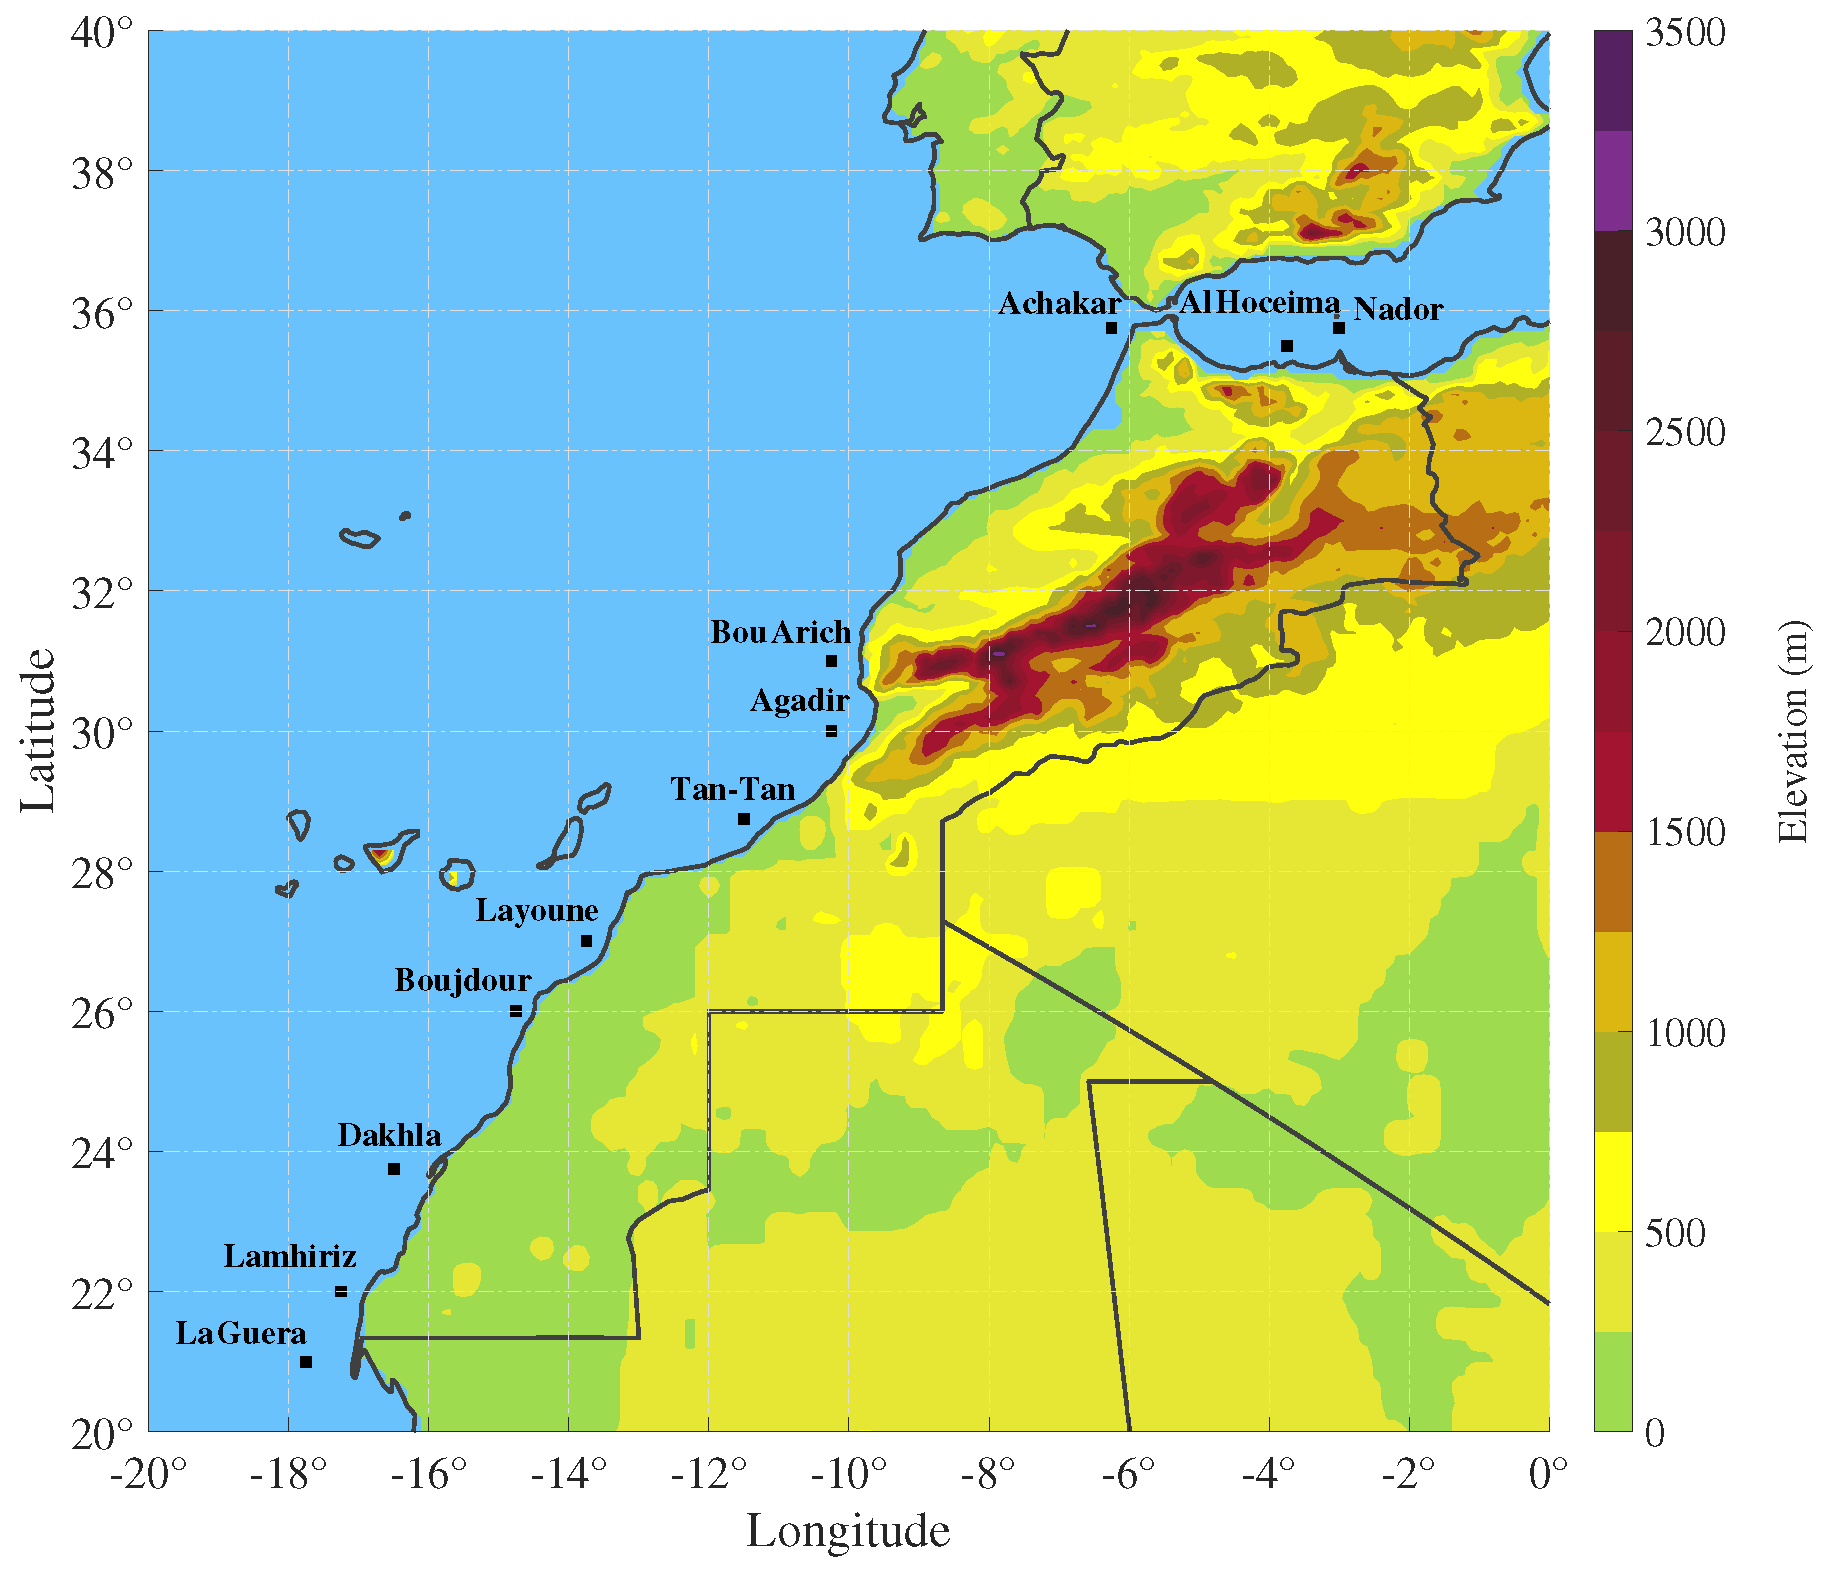
2.1. Wind Observations

The IFREMER blended wind dataset [41] was integrated by measurements of ocean surface parameters and atmospheric near surface parameters for the period of 1993–2016 that were calibrated and validated against buoy observations. As remotely sensed data (radiometer and scatterometer) present a very high resolution but irregular sampling, some atmospheric reanalysis data were used to improve the wind representation [42]. In the first stage, the European Centre for Medium Range Weather Forecast (ECMWF) operational wind analysis or ERA-Interim wind data were used. Later, the wind representation in upwelling regions, such as California, Canary and Benguela, was improved with Synthetic Aperture Radar (SAR) data and ERA5 data [43].
The data consisted of the zonal and meridional components of the wind velocity and were mapped in a 0.25° × 0.25° grid. The temporal resolution was 6 h. The wind velocities and wind direction were determined from the wind components, averaged into daily means.
The 11 sites selected for the validation were close to future offshore wind farms locations, as shown in Figure 1, and detailed in the Supplementary Materials (SM) Table S1.

2.2. Reanalysed Wind Data Sets

The ERA5 wind dataset used here is an ECMWF reanalysis, covering (1981–2020), with an improved spatial resolution of 0.25°, and containing a comprehensive list of atmospheric parameters, including wind speed and direction at different pressure levels [44]. Its high quality in modelling wind energy at multiple levels has been demonstrated in several previous studies [45,46] The 10 m wind data were used in the validation step, whereas the 100 m altitude data (the standard wind turbine height), obtained directly from the dataset [47], were used in the wind resource assessment. The time resolution chosen for the main analyses was hourly. As in the case of the IFREMER blended dataset, ERA5 wind data were converted into daily means, and the wind speed and direction were determined.

2.3. Validation

The locations were selected on the ERA5 grid, and their counterpart was identified as the closest grid point in the remotely sensed dataset. The distance between these points never exceeded 6.25 km. After having discarded the first year of IFREMER observations, due to missing data, the validation period was set from 1993 to 2016; that is, 24 years. Generally, wind observations are not fitted satisfactorily using Gaussian probability distributions. However, some research works, such as [24] or [43], include linear statistics diagnoses among their descriptors, which then become a convenient intercomparison tool. Additionally, in many wind resources assessments, such as [14], a two-parameter Weibull distribution was used to model the wind data. Therefore, for comparison, the estimates of these parameters and their confidence intervals were included in the present analysis. Finally, recent research supports the use of nonparametric statistical parameters as validation tools, considering its robustness (insensitivity to assumptions about the data nature, as, for instance, is Gaussianity) and statistical resistance (insensitivity to outliers) [48]. Such properties are relevant for the characterisation of IAV and, therefore, these estimators were also considered here.

2.3.1. Linear Statistics Validation

The linear statistical measures [49] used include the following first four moments of the empirical probability density function (PDF): mean, standard deviation, skewness (SKEW) and kurtosis (KU). The latter two are also indicators of the non-Gaussian character of the PDF. The root mean square error (RMSE), bias, mean absolute error and correlation coefficient were also calculated. Only those deemed relevant for the validation section are defined in the Appendix A ((A1)–(A7)). Moreover, the bias seasonal character was highlighted by scatterplots of ERA5 seasonal means against their observed counterparts.

2.3.2. PDF-Based Validation

Originally proposed for the statistics of extremes, the three parameter function proposed by Weibull [50], proved to be very useful for modelling wind speed [51]. Its two parameter version also proved to be very useful in wind assessment studies [52] and was adopted in wind speed assessment studies, where the third parameter could be assumed null, due to its simplicity. Here, the Weibull PDF, f ( v ) , was be expressed [53] as follows:
f ( v ) = k c v c k 1 exp v c k , for v s . > 0 , k > 1 , c > 0
where k, the shape parameter and c, the scale parameter, are taken as indicators of the data dispersion and the average speed, respectively. The Weibull parameters can be obtained through approximated relationships (detailed in the Appendix A (A8)) obtained using the Method of Moments (MOM) [54]. The differences in the PDF of the observed and modelled time series were assessed using the confidence intervals of the observed parameters.

2.3.3. Robust Statistics Validation
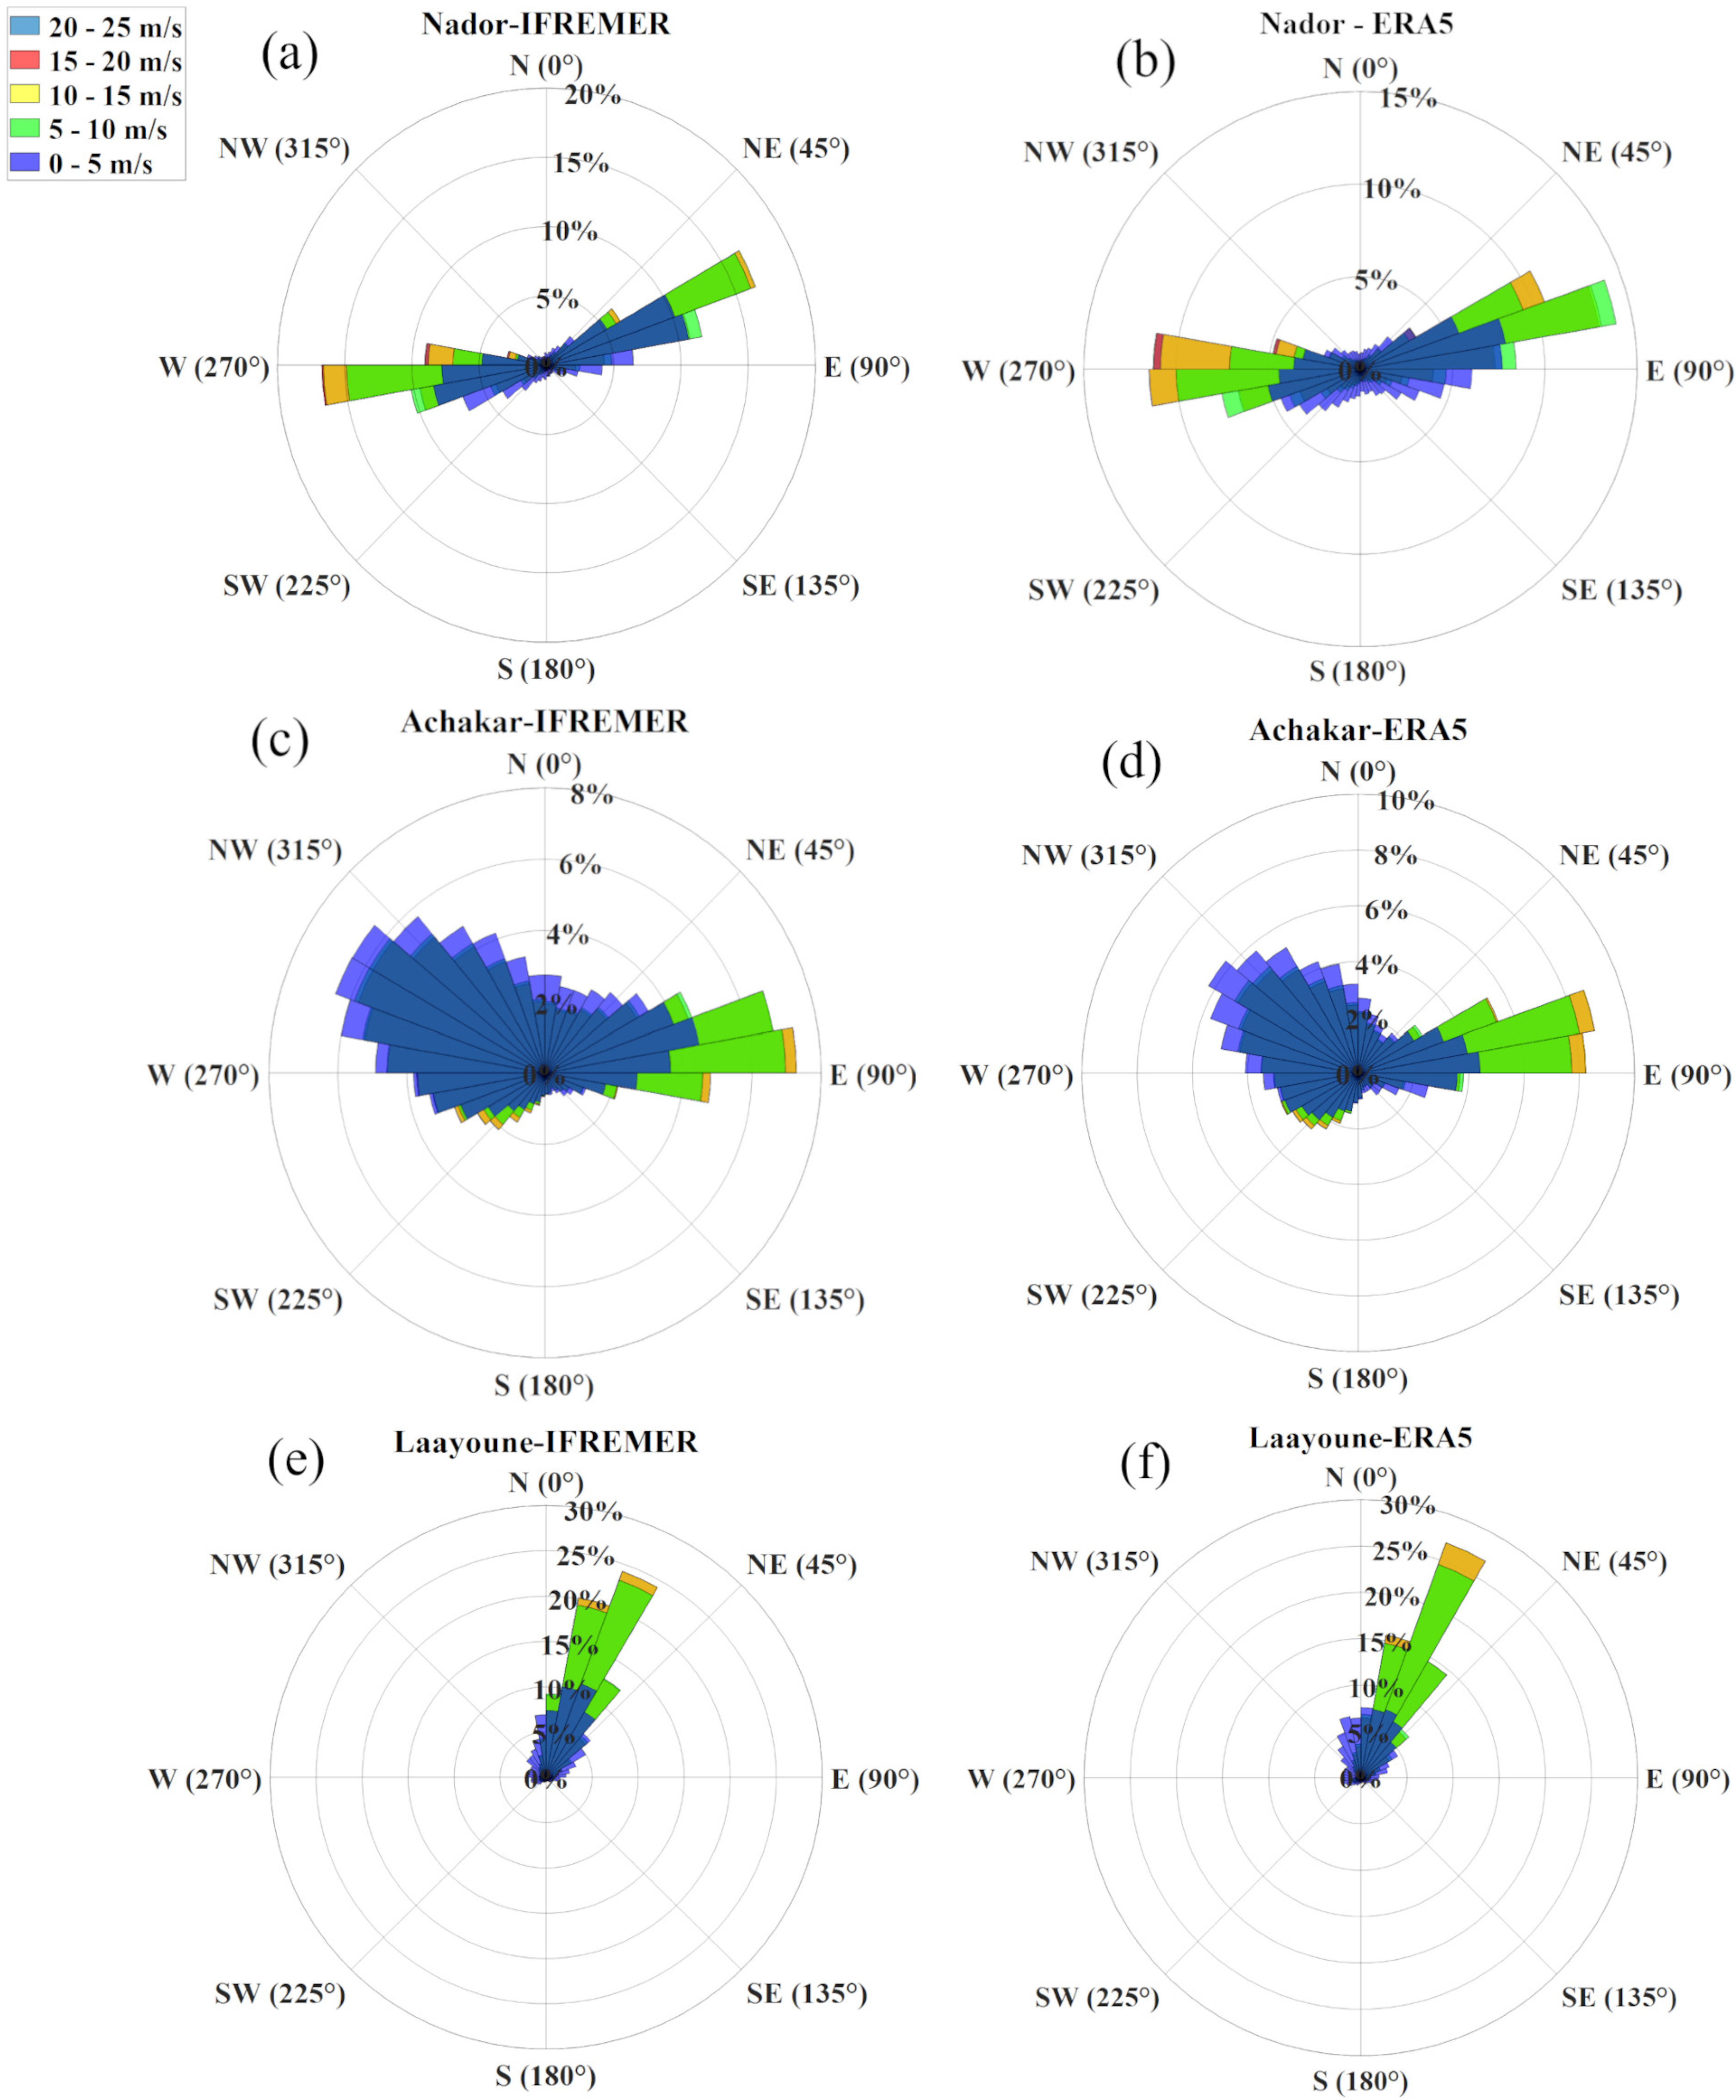
Recent studies [35] advocate for the use of non-parametric statistics in the validation of wind data, given its non-Gaussian characteristics and the known difficulties of the Weibull distribution for representing low-wind days. In these statistics, the median replaces the mean, and among the spread estimators considered are the median absolute deviation (MAD), the robust coefficient of variation (RCoV) and the Yule–Kendall Index (YKI), as defined in Appendix A (A9)–(A14).

2.3.4. Wind Roses

The characterisation of the wind speed distribution according to the different directions, known as a wind rose, at each location is an important part of the wind resource assessment.

2.3.5. Wind Power Assessment

In the present study, the hub height is assumed to be 100 m, which corresponds to the modern, more powerful, turbine height, and is also a height at which the ERA5 data are available. The necessary extrapolation of the 10 m height-observed wind speed to the hub height was performed using a logarithmic wind profile, assuming neutral stability conditions, with thermal effects removed [55], according to the following expression:
v ( z ) = V r e f ln z z 0 ln z r e f z 0
where v ( z ) is the wind speed at height z, z r e f is the reference height, V r e f is the reconstructed wind speed at this height, and z 0 , the local roughness length. Here z 0 = 0.0002 m, the sea surface roughness. Low-wind (days with velocity below v i n = 3 m/s) frequencies were calculated and validated against the remotely observed winds.
The daily wind power density (WPD) was obtained directly from the daily wind observed velocity field extrapolated to 100 m height, using the following expression [56]:
W P D = 1 2 ρ 0 v 3
where ρ 0 is the standard air density (1.225 kg/m3) and v is the wind velocity at hub height. The wind power density was also obtained from the ERA5 wind data using the same expression. The averaged wind power density (WPD), for a certain period, was obtained by averaging the daily contribution in this period either derived from the observations or from ERA5 wind data.
Wind energy stability should also be considered when evaluating wind resources because it is closely related to the conversion efficiency and lifetime of wind turbines. The fluctuation of wind resource is commonly represented by the coefficient of variation–CoV–which is defined as the ratio of the standard deviation to the mean (see Appendix A (A7)). This definition assumes a Gaussian distribution. When this can not be assumed, a non-parametric equivalent, RCoV, is defined (see Appendix A (A13)) as the ratio of the spread to the median [35].

2.3.6. Interannual Variability of the Wind Resources

The seasonal cycle accounts for a substantial part of the wind variability in most of the Earth. The characterisation of seasonal variability was performed here as monthly averages over the validation period.
Interannual variability is highlighted using spatio-temporal diagrams of annual anomalies (known in atmospheric sciences as Hovmüller diagrams). These were computed by subtracting the mean value form the yearly averages. Alternatively, seasonal anomalies were built by subtracting the seasonal mean from the seasonal averages (for instance, winter, built by averaging the December–January–February (DJF) months, or summer, built in the same way, from the June–July–August (JJA) averages).
Moreover, to detect the impact of very low frequency variability on the resources, a simplification of the method used in [35] was proposed, combined with some aspects of the Pryor and Barthelmie [29] procedure, using the validation one (1993–2016) as reference period. The resource variability was characterised by the parameter RCoV.
It consisted of a two-step procedure. The first step was intended to characterise the variability in the validation period, both in the IFREMER and ERA5 data, using descriptive statistics and bootstrap techniques. To do this, for each time series of monthly wind speed averages of N years in length, samples of m years in length were generated, discarding (N-m) years of the original series each time. From the RCoV of the samples, box plots centered on the median were generated of a height equal to the interquartile distance and whiskers corresponding to the values of 0.05 % or of 0.95 % probability. In this way, for each value of the time frame m, a box plot was generated, and the RCoV values and their stability against interannual variations in both fields could be compared. In a second step, at each of the locations considered, the ERA5 record was divided into two periods, corresponding to the first and the last 20 years of the record, (1981–2000) and (2001–2020), respectively. In this way, we aimed to establish if the changes introduced by low frequencies affected the stability of wind resources, since the first period coincided with the one of the decreasing trends in terrestrial winds, and the second included the recovery period.
To finish our evaluation on this subject, the seasonal differences in the WPD obtained from the last 20 years minus those obtained from the first 20 years were considered, in order to understand how this low frequency signal, which is very seasonal by nature, could affect the WDP seasonal distribution.

3. Results and Discussion

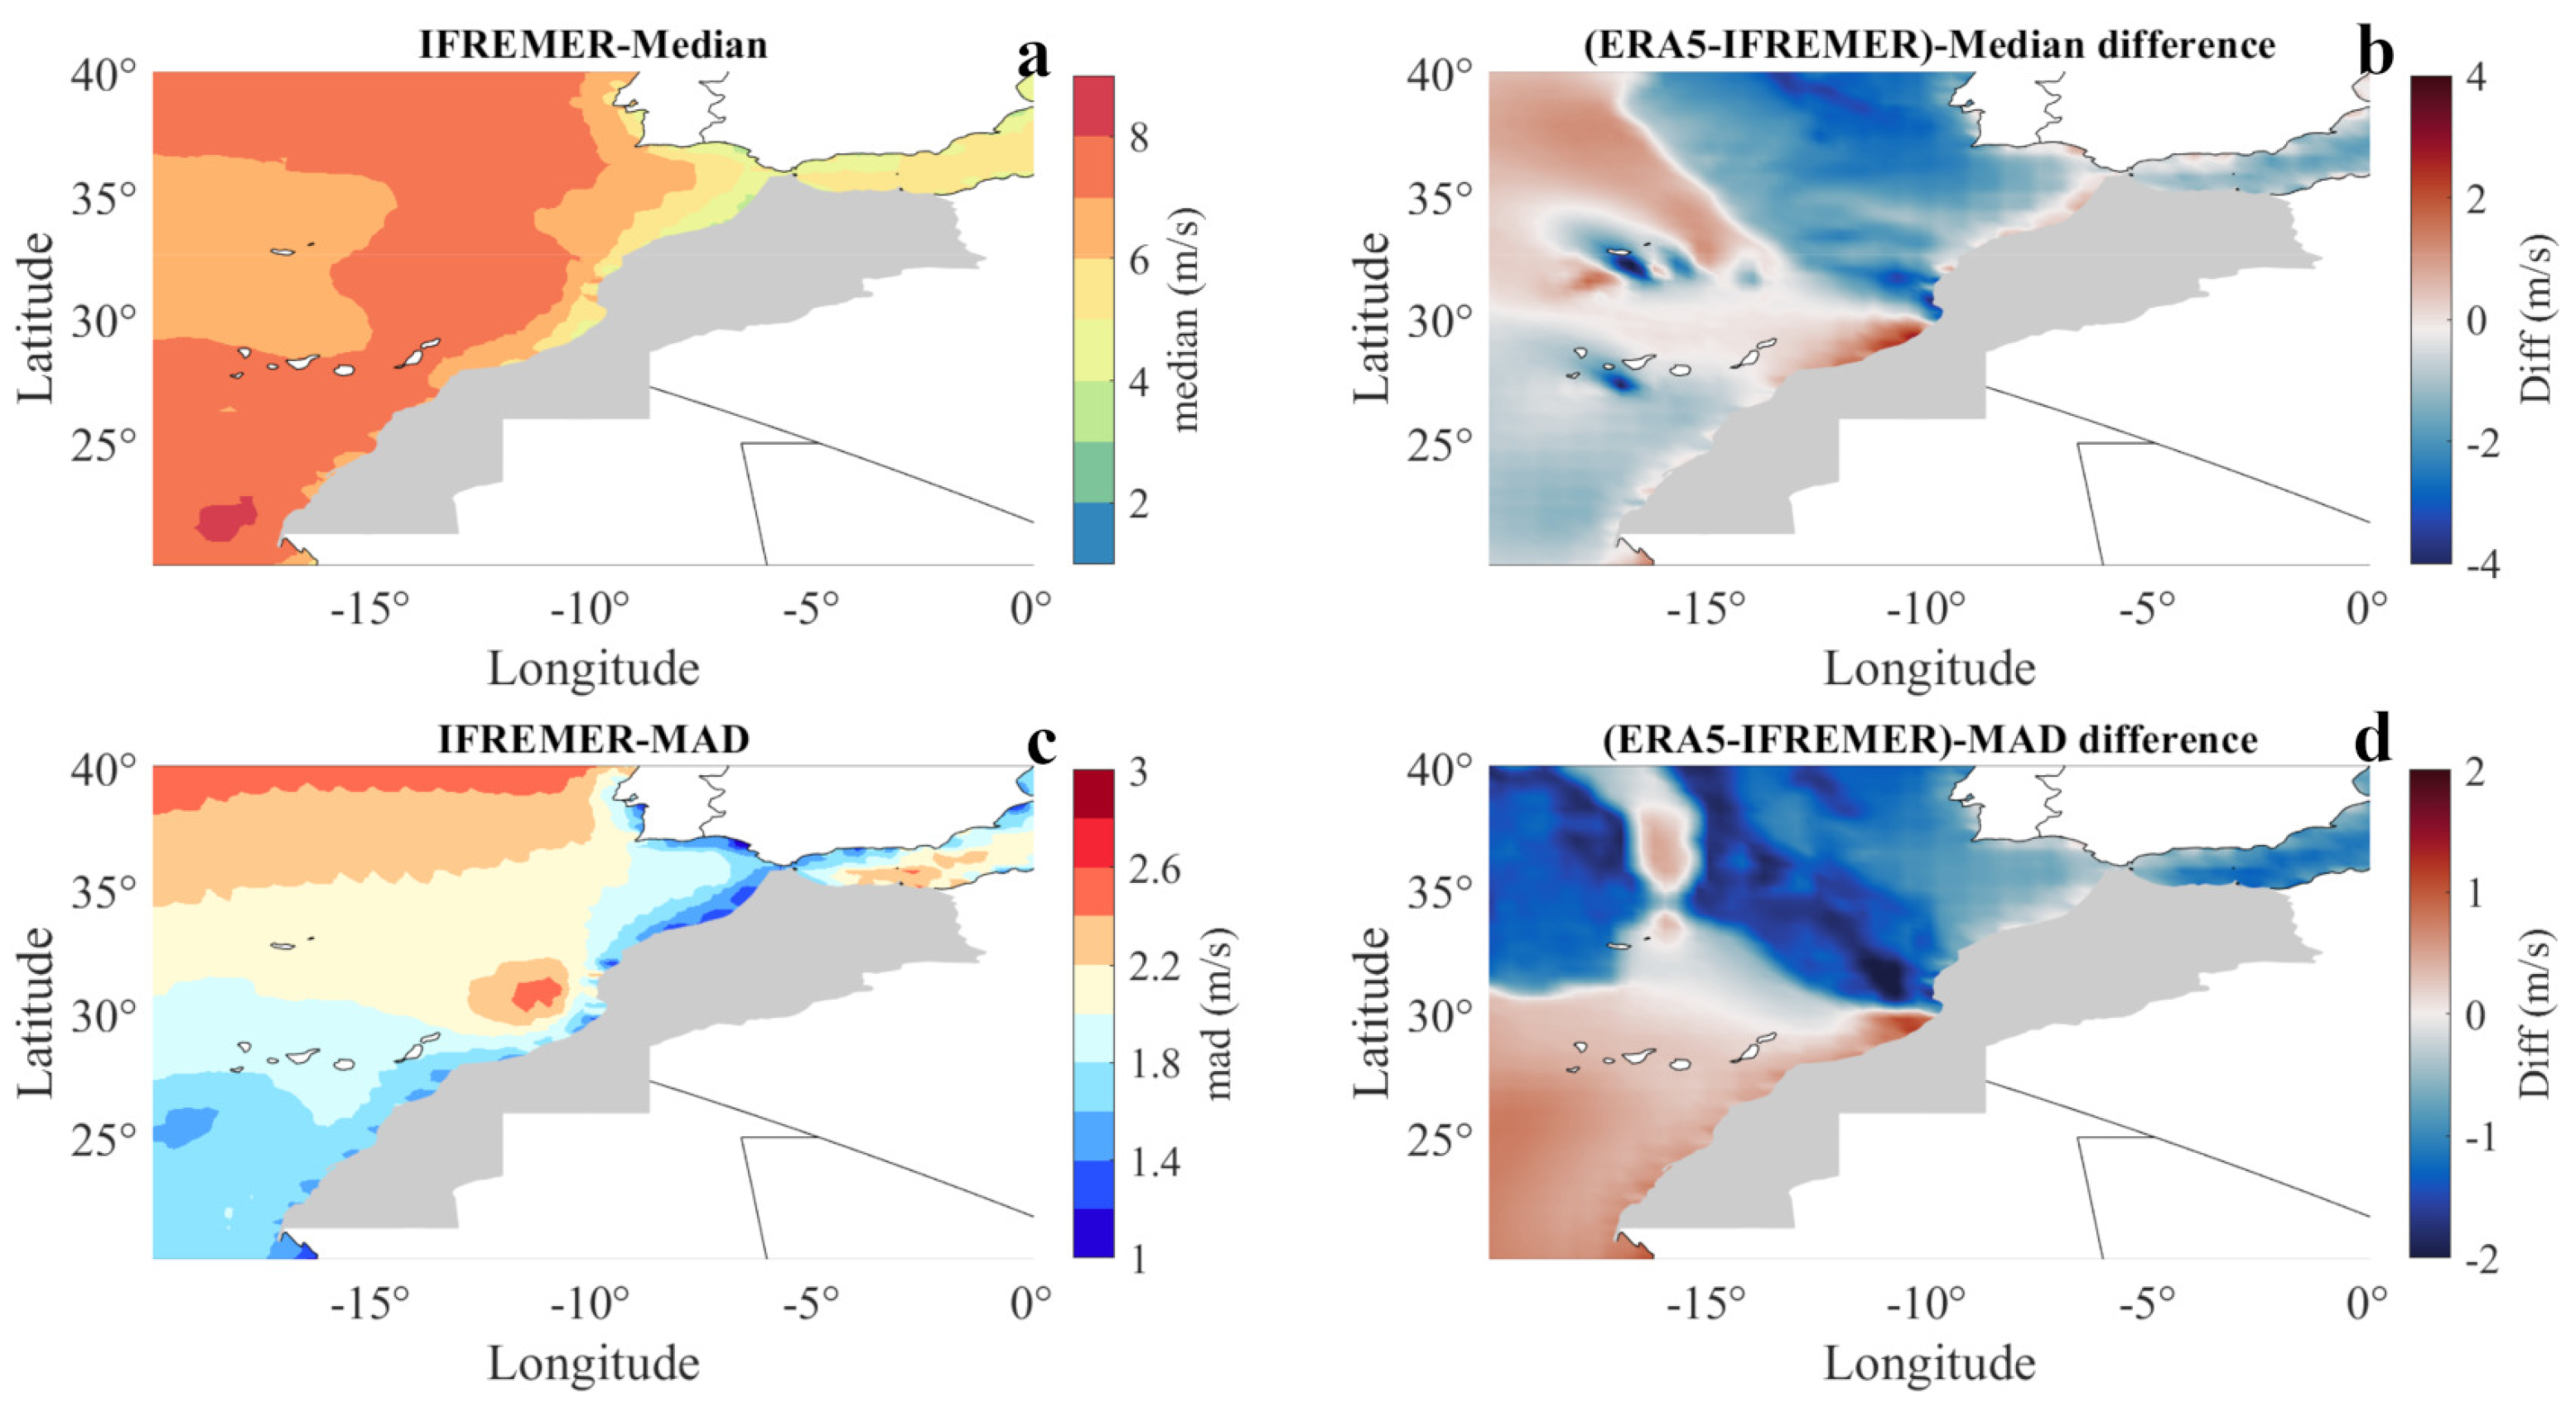
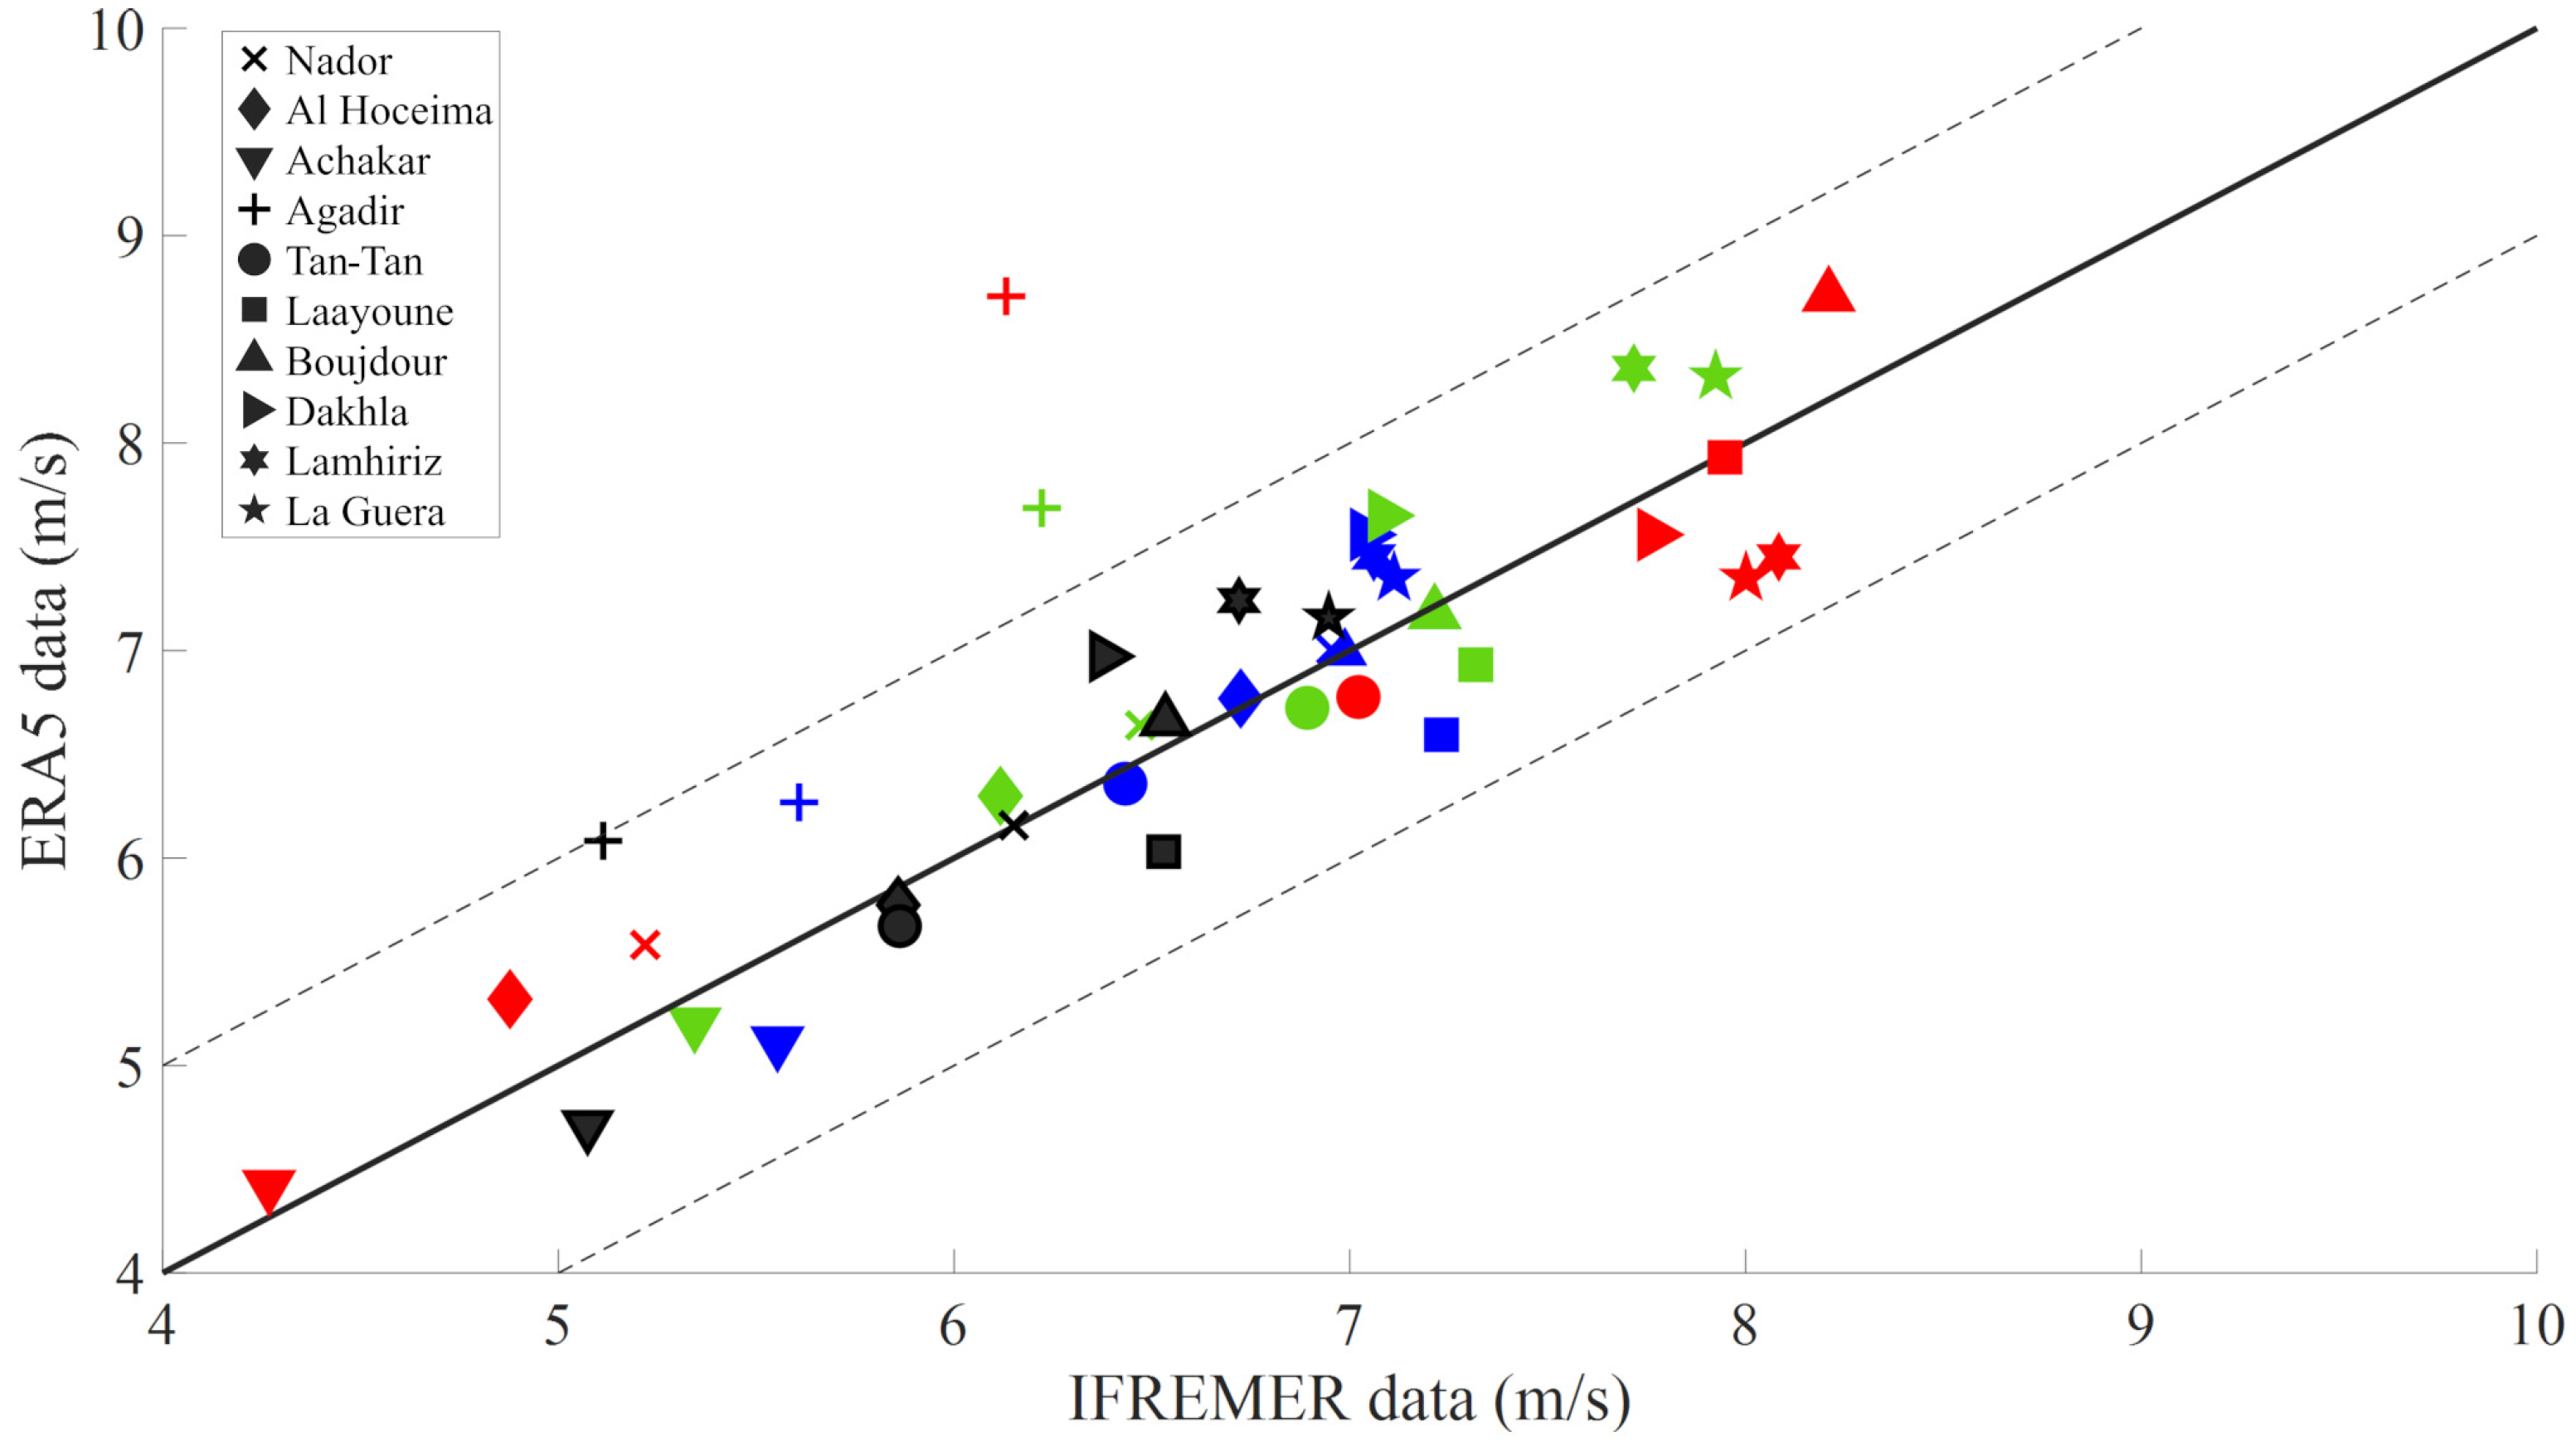
3.1. Validation of Reanalysed 10 m Height Wind Data

Before using ERA5 estimates in wind potential assessment, reanalysed wind data must be validated against their observed counterparts [57]. First, two reliable statistical estimates of the relevant spatial variabilities, the median and spread (MAD), for each of the 10 m height wind data fields in the Atlantic sector represented in Figure 1 were contrasted. Then, validation was performed by comparing the matching wind speeds at a 10 m height for the same place and time period (1993–2016) using various statistical methods. Only 5 of the 11 sites that were examined in the present study (Achakar, Tan Tan, Laayoune, Boujdour and Dakhla) coincided with the locations selected by Benazzouz et al. [14]. The sampling below Dakhla was improved by the inclusion of two additional locations.
The velocity median of the IFREMER data, represented in Figure 2a, in the region adjacent to the Moroccan coast, presented moderate winds (between 4 m/s and 6 m/s) in the Alboran Sea and the northern Atlantic coast, while near the Western Sahara coast, with the easterlies flowing along, values exceeded 7 m/s. The differences between the ERAS and the IFREMER median, represented in Figure 2b, show values exceeding 3 m/s only in the Cap Ghir Agadir Gulf region, where the Atlas Mountain Range descends to the ocean and off the Canary Islands. Except for these regions, the differences between the two fields along the coast lied below ±1 m/s. Similarly, the spread obtained from the remote sensing data, presented in Figure 2c, was below 2 m/s along the coast, except for the Cap Ghir region and the Alboran sea. The differences between ERA5 and the IFREMER spread present the following characteristic change of sign: ERA5 underestimated the observed values above Cap Ghir and underestimated it below this location.
The same differences between the Mediterranean and the southern Atlantic coast characteristics can be appreciated in some diagnostics obtained with the linear statistics tools presented in Table 1, such as the mean values and skewness (with negative values in the Saharan coast), and the kurtosis. The bias (difference between the simulated and the observed mean) presented positive values with two exceptions. Its magnitude was negligible at three of the locations considered, and below 0.5 m/s at most of them with the sole exception of Bou Arich. At this location, the bias and RMSE almost doubled the values obtained at other locations.
The median values in the northern locations were below the mean values in both fields (Table 2). This feature, together with higher RCoV values and the positive values of skewness at these places, supported the existence of long tails in the right side of the PDF (severe winds), while the values of the median exceeded the mean value at the southern locations, together with the negative values of the skewness and small RCoV values (below 0.3), are indices of long tails in the left side of the PDF (low winds). Lastly, the coincidence between the days of low wind (below the 10% probability of occurrence) in both fields (higher in the northern than in the southern places) supported the idea of ERA5 variability underestimating low-wind days frequency there (Table 2). This is not the case for severe winds, whose incidence is captured similarly in all locations.
As mentioned in the methodology, the observed and reanalysed wind speed histograms in the Atlantic sector adjacent to the Moroccan coast were fitted with a two-parameter Weibull PDF. The map of the estimates for the scale parameter c from the IFREMER observation and the ERA5 differences with respect to it, as presented in Figure 3a,b (ERA5), are very similar to those shown in Figure 2a,b. There are also similarities between the estimates for the shape parameter k from the IFREMER data and the differences in ERA5 estimated with respect to the latter, represented in Figure 3c,d, although in this case, a characteristic change of sing is noticeable.
Moreover, the time series of the 11 selected locations from observations and from ERA5 wind data were also fitted with the Weibull PDF and their scale parameter c values and shape parameter k values, together with their respective confidence intervals (with 1% probability of error), were determined, as shown in Figure 4. At 6 out of the 11 sites considered, the observed c parameter value was included in the confidence interval of the reanalysed one, but only at four of them were the observed k parameter values included in the confidence interval of the value obtained from the reanalysed field. Moreover, an inspection of the ERA5 wind PDF at Bou Arich and Agadir revealed its inability to capture the main traits of the observed PDF at the former location and its difficulties in doing the same at the latter (additional information is provided in the Supplementary Materials). Therefore, the ERA5 wind speed at the Bou Arich location could not be validated, and the results obtained for this location will not be reported further in the present study.
The limitations of ERA5 wind data in addressing some mesoscale features were highlighted in a recent study [58], which may account for its difficulties in solving complex atmospheric circulation scenarios around islands or in solving certain topographies (as, for instance, the Atlas descent into the sea at Bou Arich and nearby Agadir). The superiority of the ERA5 model over lower resolution models suggests that spatial resolution could be a significant factor in this failure [59,60].
Additionally, the scatterplot of the observed against the ERA5 seasonal mean wind velocity highlights the ERA5 wind data performance (Figure 5). Except for the case of Agadir mentioned above, the symbols representing the seasonal mean were found near the perfect fit line, with a spread below 1 m/s, and no seasonal dependence in this fitting could be observed.
Furthermore, the observed wind rose at the northern sites alternated between easterly and a westerly directions with a tiny meridional component, whereas at the southern sites, the wind rose was predominantly northerly with a small easterly component. The ERA5 reanalysis effectively captured the observed wind roses, and those at the 10 selected locations could be sorted into two groups. One example of each of the groups, and one case somehow different, are plotted in Figure 6.
It can be appreciated how the ERA5 wind data accurately captured the characteristics of the Nador and Laayoune wind roses. In the Achakar case, the agreement between the observed and the ERA5 wind roses was nothing more than satisfactory, as the north-westerly component was not fully recorded.

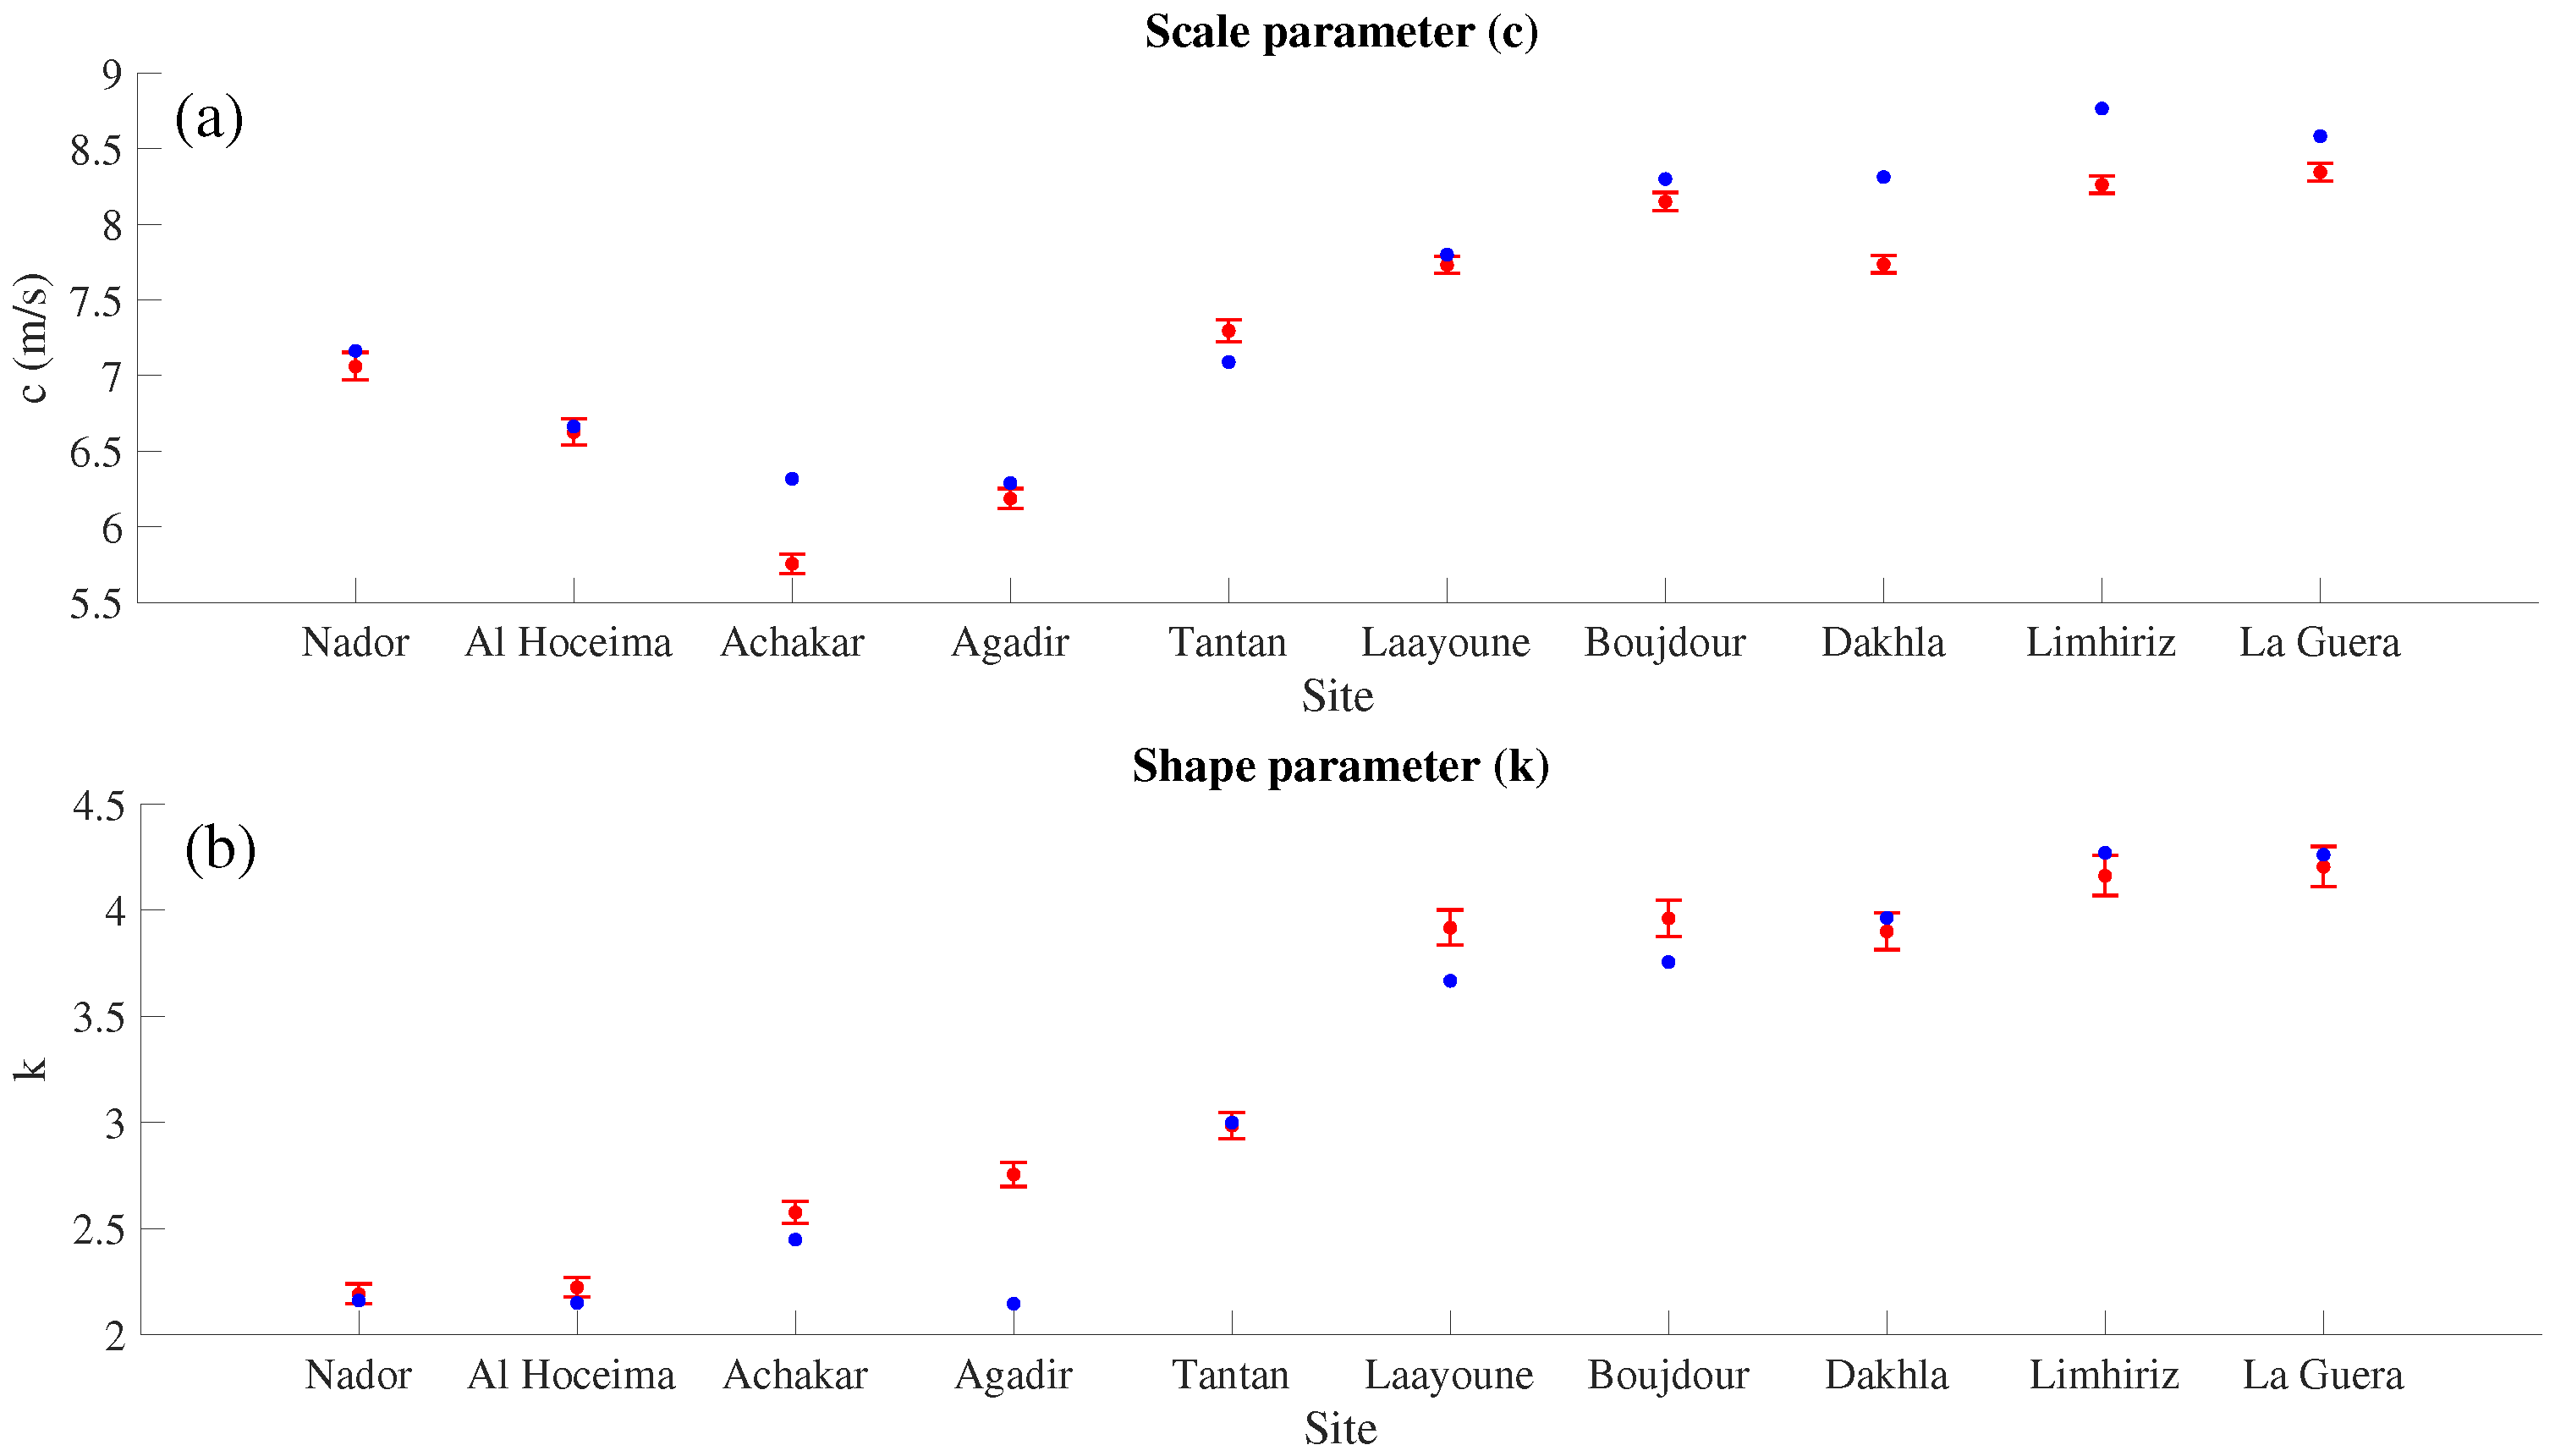
3.2. Validation of Wind Energy Resources

The projected WPD values at hub height (100 m) from the observed wind data obtained, according to the methodology, varied between 228 W/m2 (Achakar) and 582 W/m2 (La Guera) (Table 3). The corresponding values determined using ERA5 always overestimated the observed values, sometimes by more than 100 W/m2, as was the case in Lamhiriz (as can be appreciated in Figure 7). The only exception was Tan Tan, whose observed WPD was underestimated by only 36 W/m2. The results concerning the differences in WPD between the northern and southern parts of domain (values above 200 W/m2 in the north, except for the case of Nador), with a maximum of 582 W/m2 in La Guera, are in relatively good agreement with those reported in [14]. Differences in WPD magnitudes can be explained by differences in the hub heights considered (80 m there and 100 m here) by the different periods of estimation (2008–2017 there, and 1993–2016 in the case of the present study), and also by differences in the selected locations.
The seasonal evolution of the 100 m height wind anomalies (computed with respect to the absolute mean), which are represented in Figure 8, presented contrasting characteristics between the three northern stations and the others. In the former, the maximum wind speeds were reached in late autumn–winter, whereas in the latter, they were attained in summer or late spring. The seasonal differences reached 4 m/s.
To ensure the stability of the resources, the stability of the RCoV values against changes in the time frame (the number of years used to calculate them) was tested using a bootstrap procedure. A sample of the results of these calculations for two representative locations in the north (Al Hoceima) and south (Boujdour) of Morocco, is presented in Figure 9.
At both sites, the RCoV obtained from the ERA5 wind data appeared to accurately represent the value derived from the observations. The difference between the two is less than 5 % in the northern location and less than 3.5 % in the southern site. The RCoV derived from ERA5 also captured the sensitivity to the time frame found in the observations, with a slight increase at the northern location and a decrease at the southern site. Moreover, in the box plot for ERA5 data, it can be observed that in the case of Al Hoceima, only for the RCoV for the last 20 years (depicted in grey), could be rejected as being the same as the reference period one, with a 5% probability of being wrong.

3.3. Long-Term Assessment of Wind Energy Resources

Long-term variability is characterised by periodic episodes of positive and negative wind anomalies that alternate interannually, showing frequently opposite signs in the two northern stations and in the rest of them, as can be seen in the Hovmüller diagrams of Figure 10.
Furthermore, this variability had marked seasonal characteristics. For example, winter (DJF) episodes of negative wind anomalies in the central and southern regions are followed by summer (JJA) episodes of positive wind anomalies. ERA5 wind data captured these variabilities reasonably well, better in winter than in summer. Additionally, as in the ERA5 diagrams, the temporal representation has been extended to all years where satellite data were included in the reanalysis and low frequency variability was noticeable. Negative winter episodes were more frequent in the first 20 years than in the last ones, while in summer, the opposite was observed.
The seasonal anomalies can reach up to ±2.5 m/s. This might seem to be a small variation, but due to the cubic power in the definition of WPD, a difference of 2 m/s at speeds between 7 and 8 m/s could imply a variation in WPD greater than 200 W/m2, almost 30 % of the observed mean WPD value.
These are new findings. The features of interannual variability in this region were studied by Benazzouz et al. [14] only during the years 2010–2018, which corresponded to episodes of sustained positive wind anomalies in the southern regions. It was discovered here for the first time that there have been instances of sustained negative wind anomalies in the area, including those that corresponded to the years 2000–2010. Although the seasonal characteristics of the long-term trends of wind speed have been pointed out in [39], and its effects on wind power potential were briefly discussed in [40], only terrestrial winds were considered.
To better investigate how the IAV is modified by the annual cycle, seasonal versions of RCoVs, based on seasonal averages, were constructed for the period of 1981–2000 (first 20 years) and also for the period of 2001–2020 (last 20 years). Probability boxes for the first 20 years were computed for each site. In this case, the value of RCoV corresponding to the last 20 years could be rejected as equal to the value computed from the first 20 years (with a 10% probability of error) at Nador and Al Hoceima in winter (DJF) and autumn (SON). From the southern location, a significant difference (with the same probability of error) was detected only in Boujdour for winter.
These results make sense, considering that at the northern locations, the seasonal component is enhanced by the seasonal anomalies, which in the last 20 years, were predominantly positive in the winter and late autumn and predominantly negative in the summer. In the southern locations, the opposite is true; the seasonal component, negative in the winter and late autumn, is damped by the predominant anomalies during these seasons, while the positive seasonal component of the summer is damped by the negative seasonal anomalies of the last 20 years of the record there.
However, the disparities between the WPD obtained from the first 20 years and those determined from the last 20 years of ERA5 winds at each location (not shown) were comparable to or less than those found between the WPD obtained from IFREMER observations, and those derived from the ERA5 wind field in the validation period (1993–2016) at the corresponding site.
This behavior of the WPD in the region can be explained if we consider that, at a given place, the seasonal differences in WPD (of the last 20 years compared to the first ones) might present opposite signs so that when they are added they almost cancel out, as can be observed in the bar chart of Figure 11. For instance, the positive differences in the winter and spring found in Nador were almost compensated by the negative differences found in the summer and autumn. Similarly, the important positive winter difference at Boujdour is partly balanced by the negative summer and autumn differences found there. That is, although the yearly WPD is not substantially changed, there are differences in the seasonal WPD between their last 20 years and their first 20 years, computed from ERA5 wind data, and these are sustained by the ones obtained from IFREMER observations.

4. Conclusions

Although ERA5 wind data have been successfully validated against observations in many regions, recent research has highlighted some of their shortcomings in accurately simulating wind variability. In the present study, the ERA5 wind data were tested against the IFREMER remote sensing winds at representative locations offshore of the Moroccan coast, that were previously considered for wind farm development. The main conclusions obtained in the present study are as follows:
-
ERA5 wind speed and direction were successfully validated at 10 of the 11 sites considered. The analysis highlighted some problems with ERA5 reanalysis when adequately capturing low-wind days at some of the locations;
-
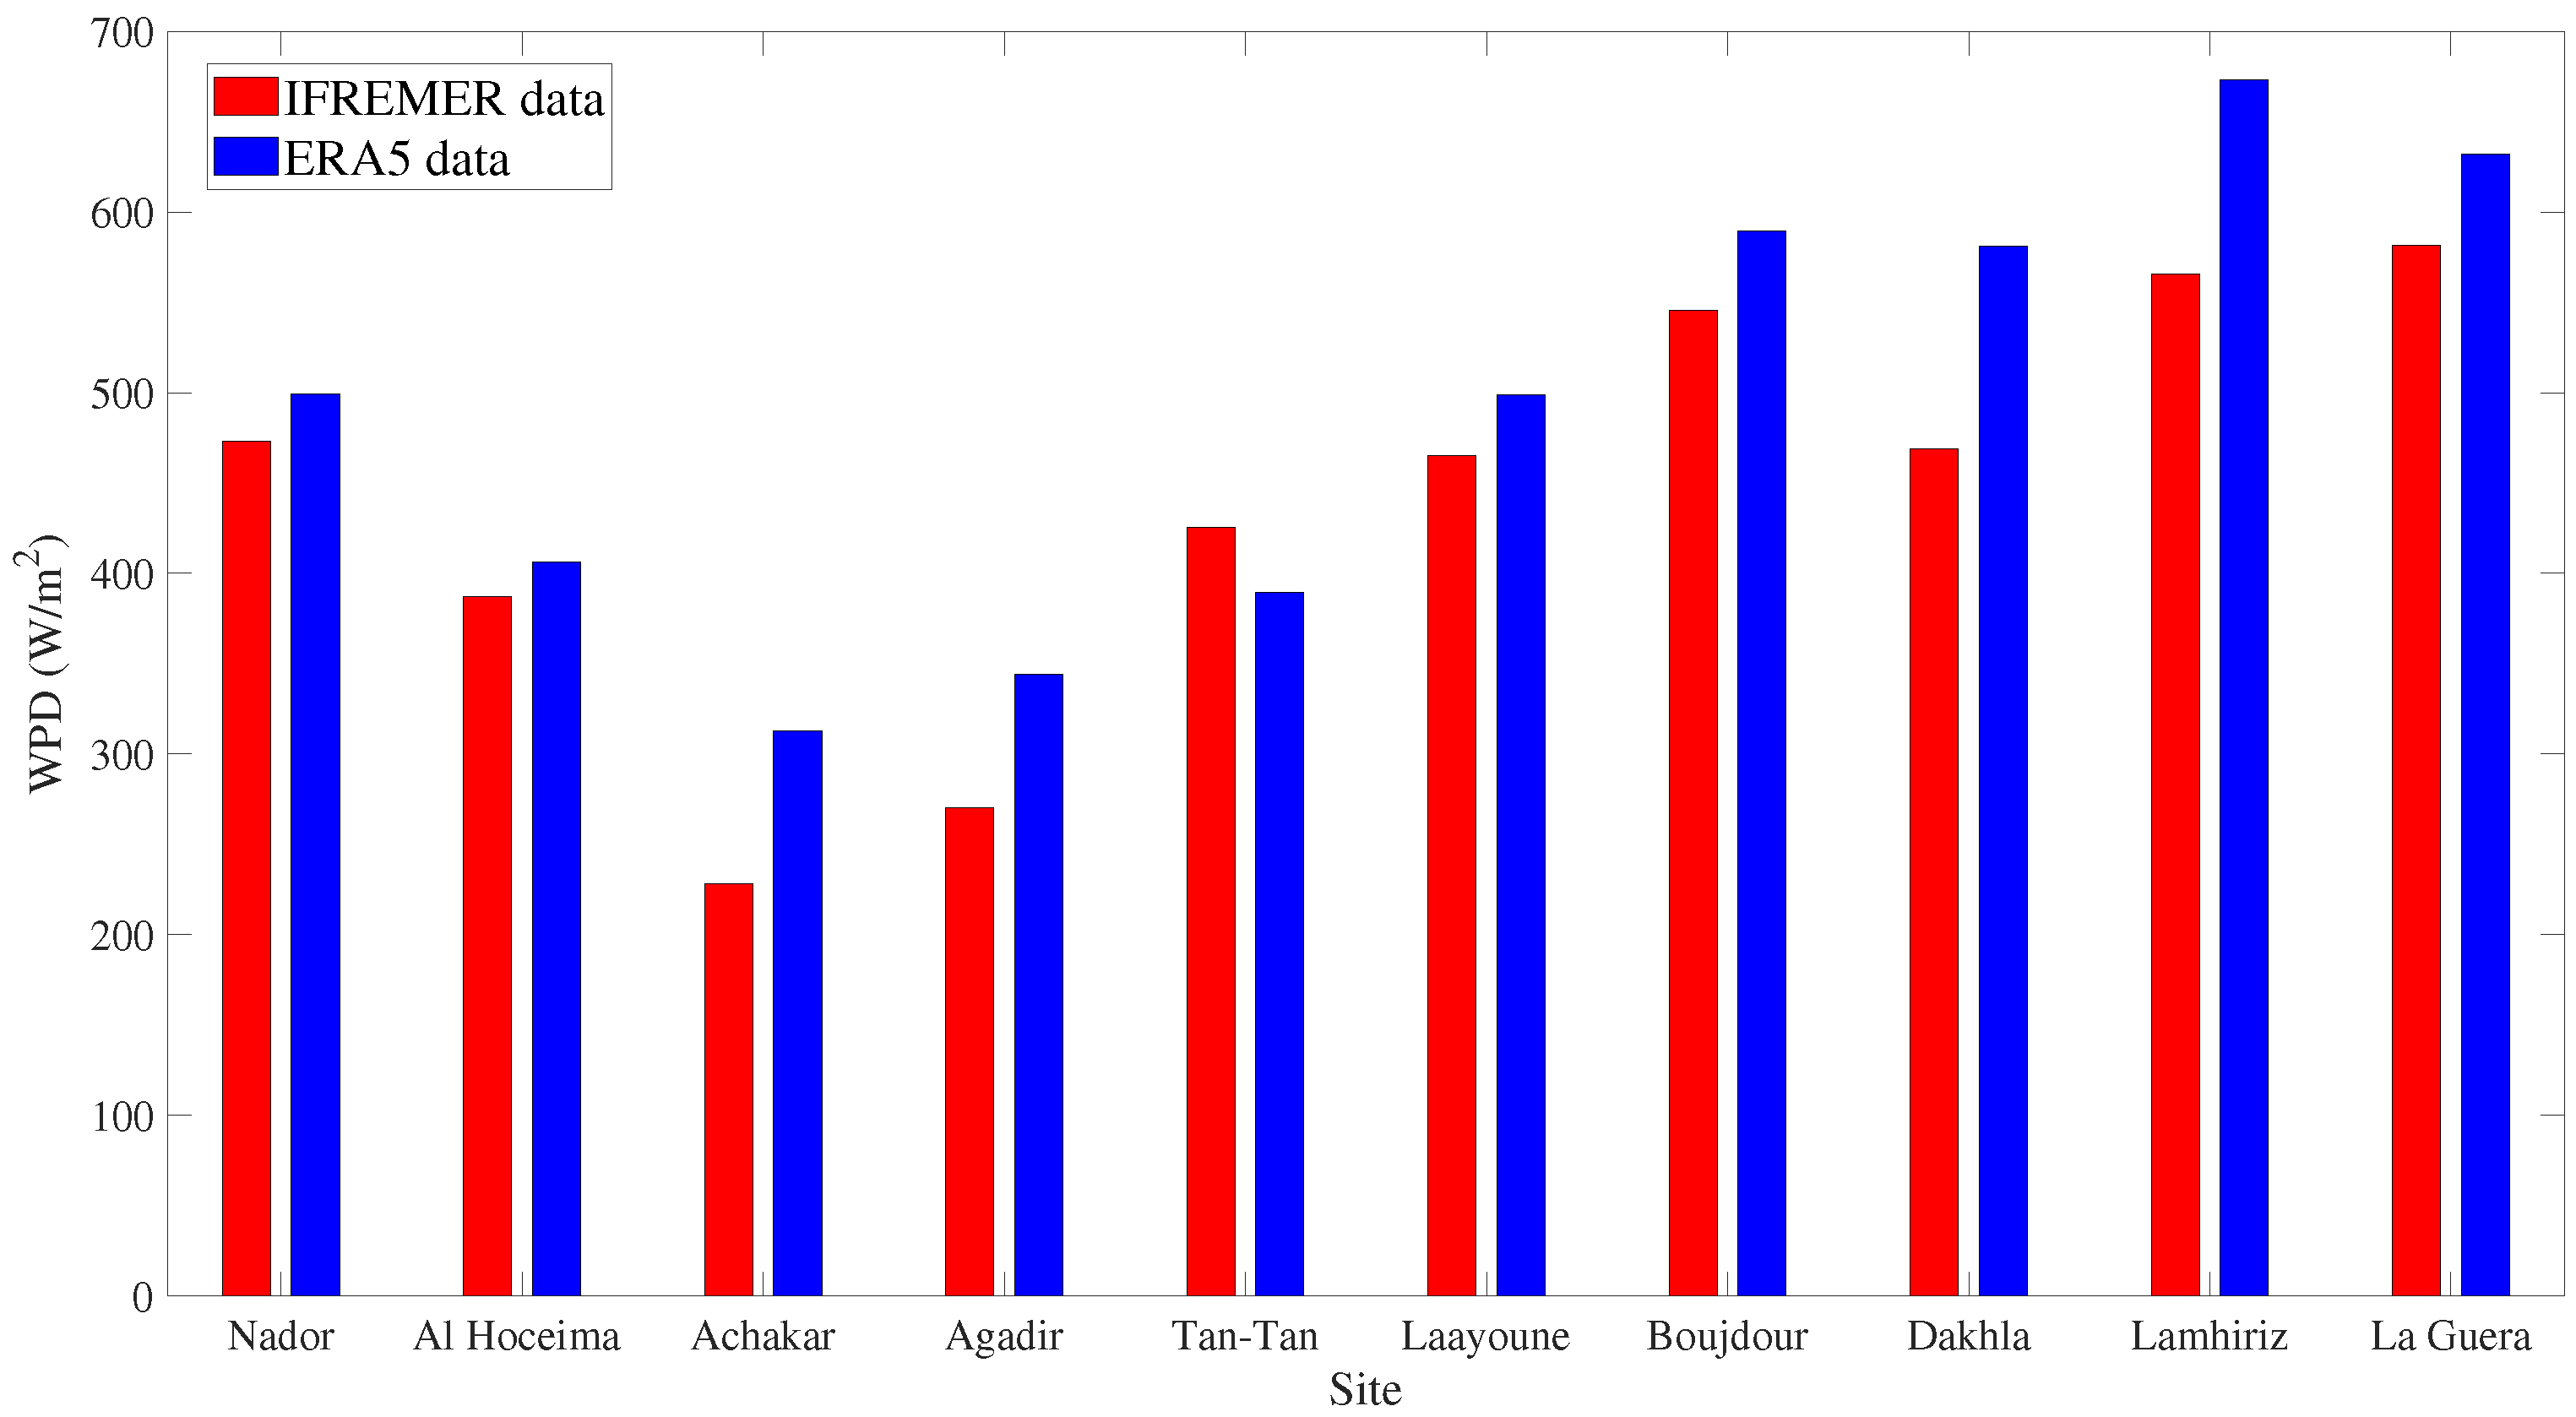
The 10 m observed wind speed was extrapolated at hub height (100 m). The WPD obtained varied between 228 W/m2 at Achakar and 582 W/m2 at La Guera. The WPD values indicated energy resources that were economically viable at Nador, and the six southern locations;
-
The 100 m ERA5 wind velocity was directly derived from the data. A comparison was made between the WPD obtained from observations and from the ERA5 wind data. The ERA5 values were close to the values obtained from observations, sometimes overestimating them by approximately 15 %. The values varied between 313 W/m2 in the north and 672 W/m2 in the south;
-
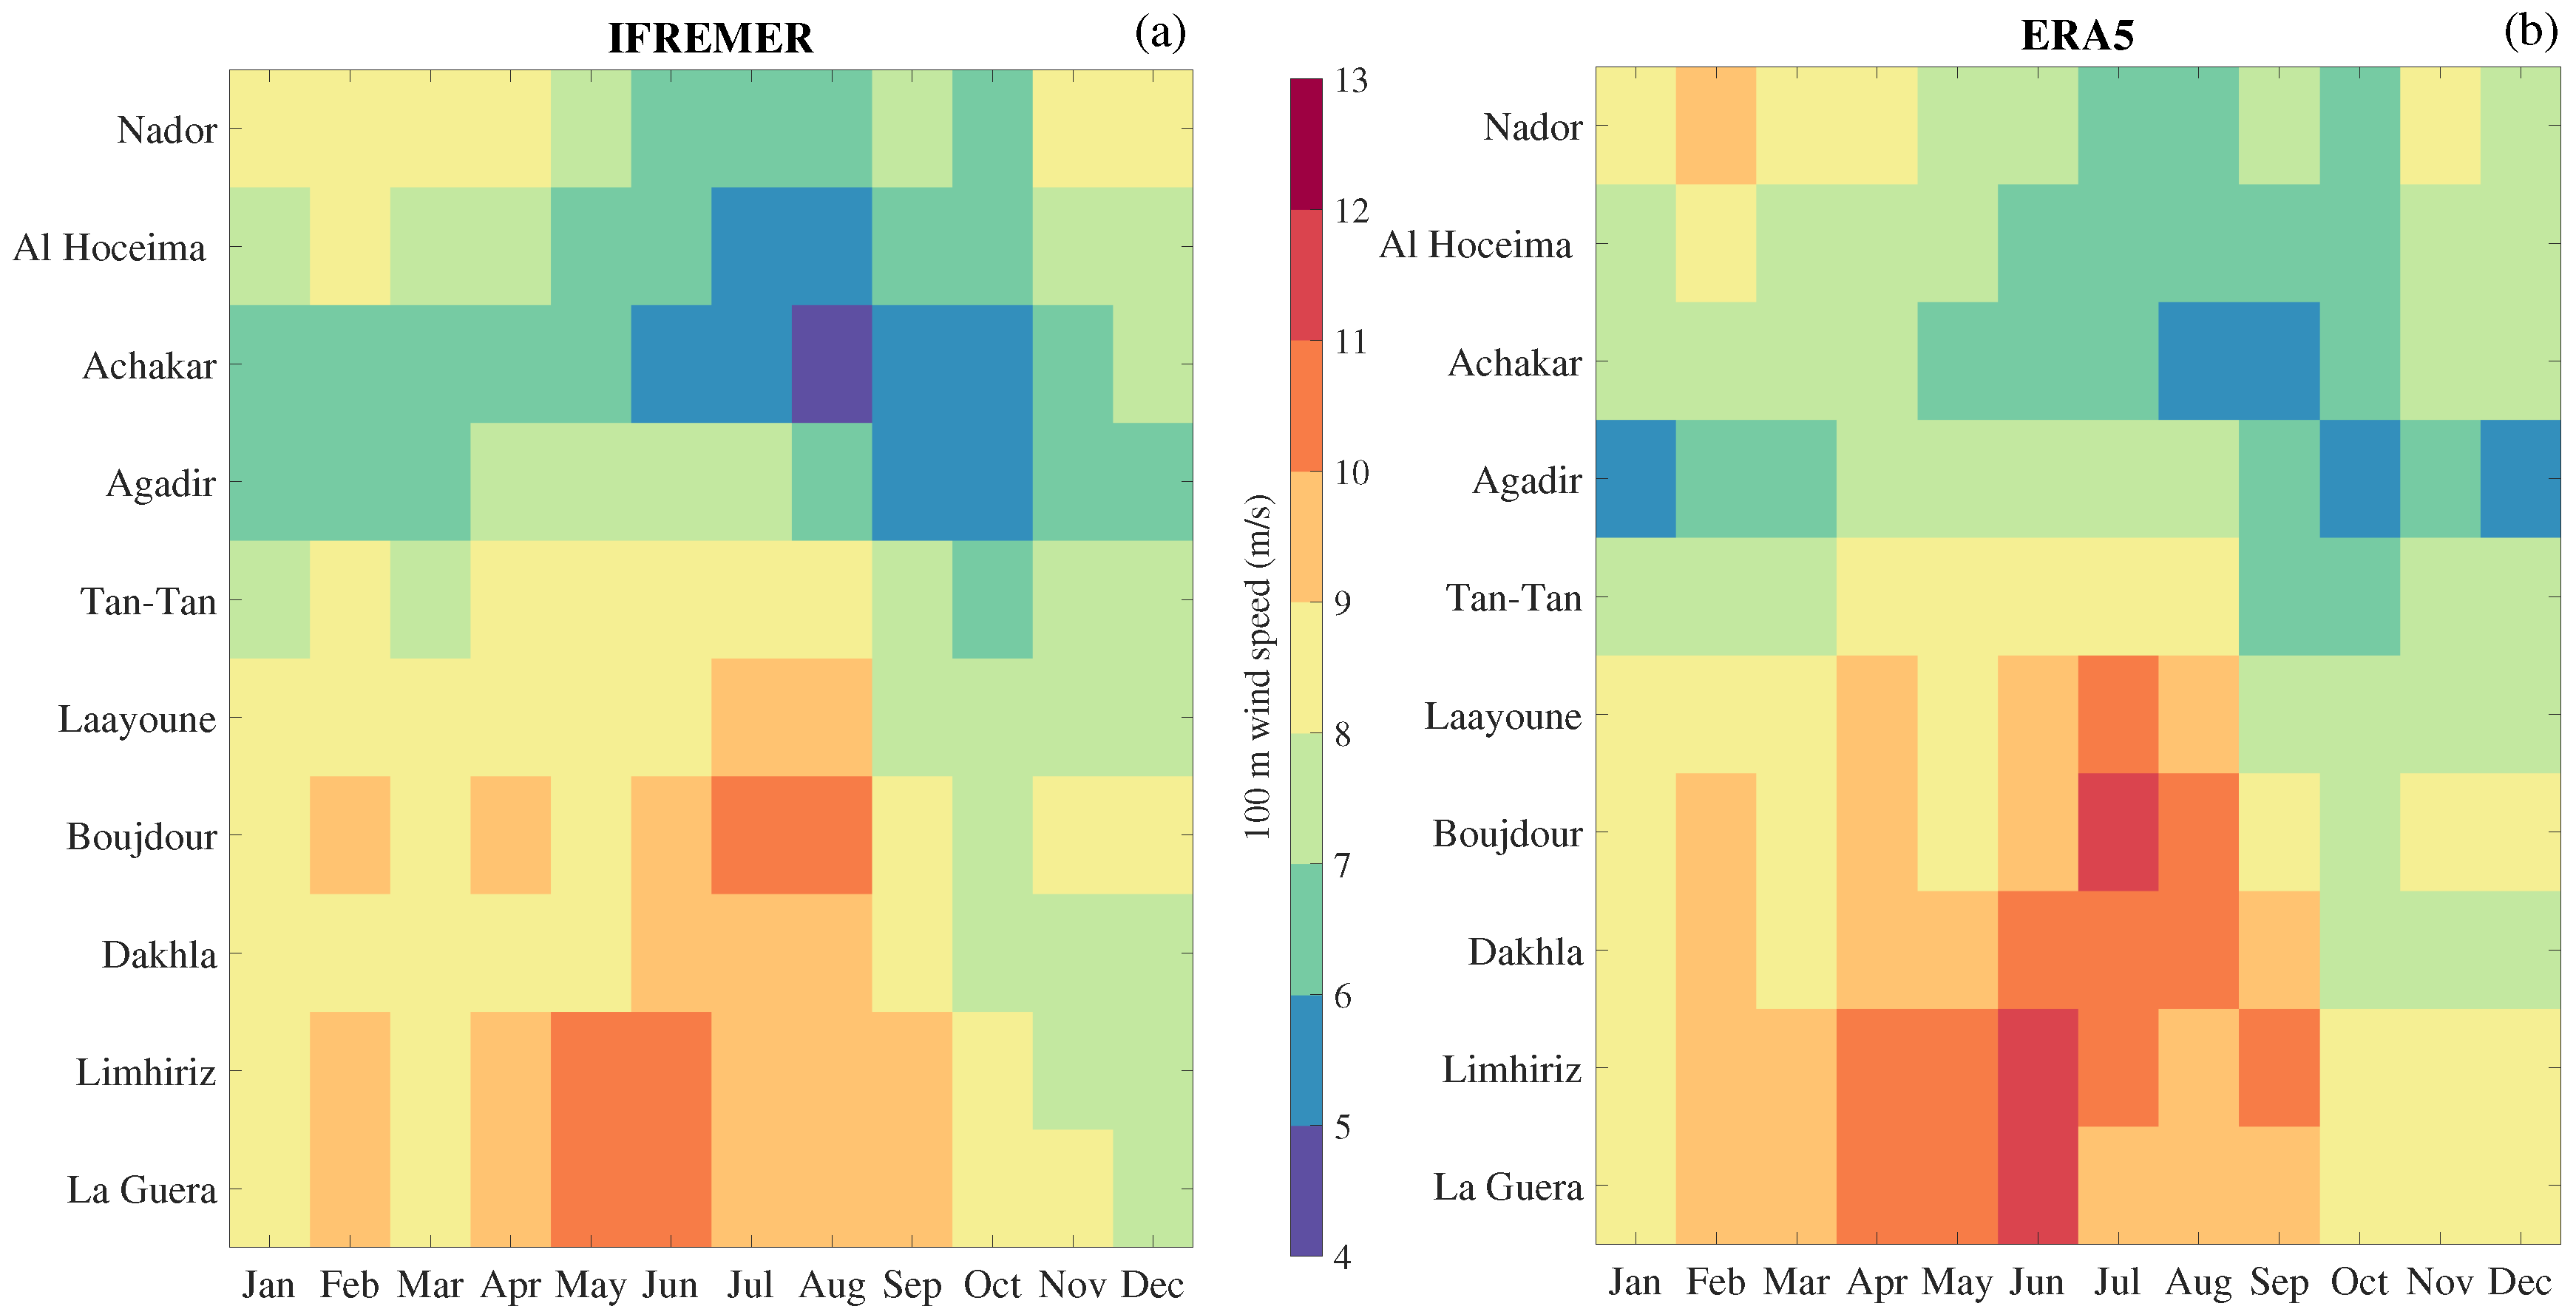
The observed seasonal cycle, with the maximum winds in the northern locations in the winter (November to April), and in the southern regions in the summer (May to August), is closely reproduced by ERA5 winds;
-
Furthermore, a long-term assessment was made possible by the longer time span covered by the ERA5 winds. This allowed for the identification of some very low frequency variabilities. In the southern portion of the domain, the winter winds were anomalously weaker from 1981 to 2011 and stronger afterward. In contrast, the summer winds in the same region were anomalously strong before 1991 and weaker thereafter until 2017;
-
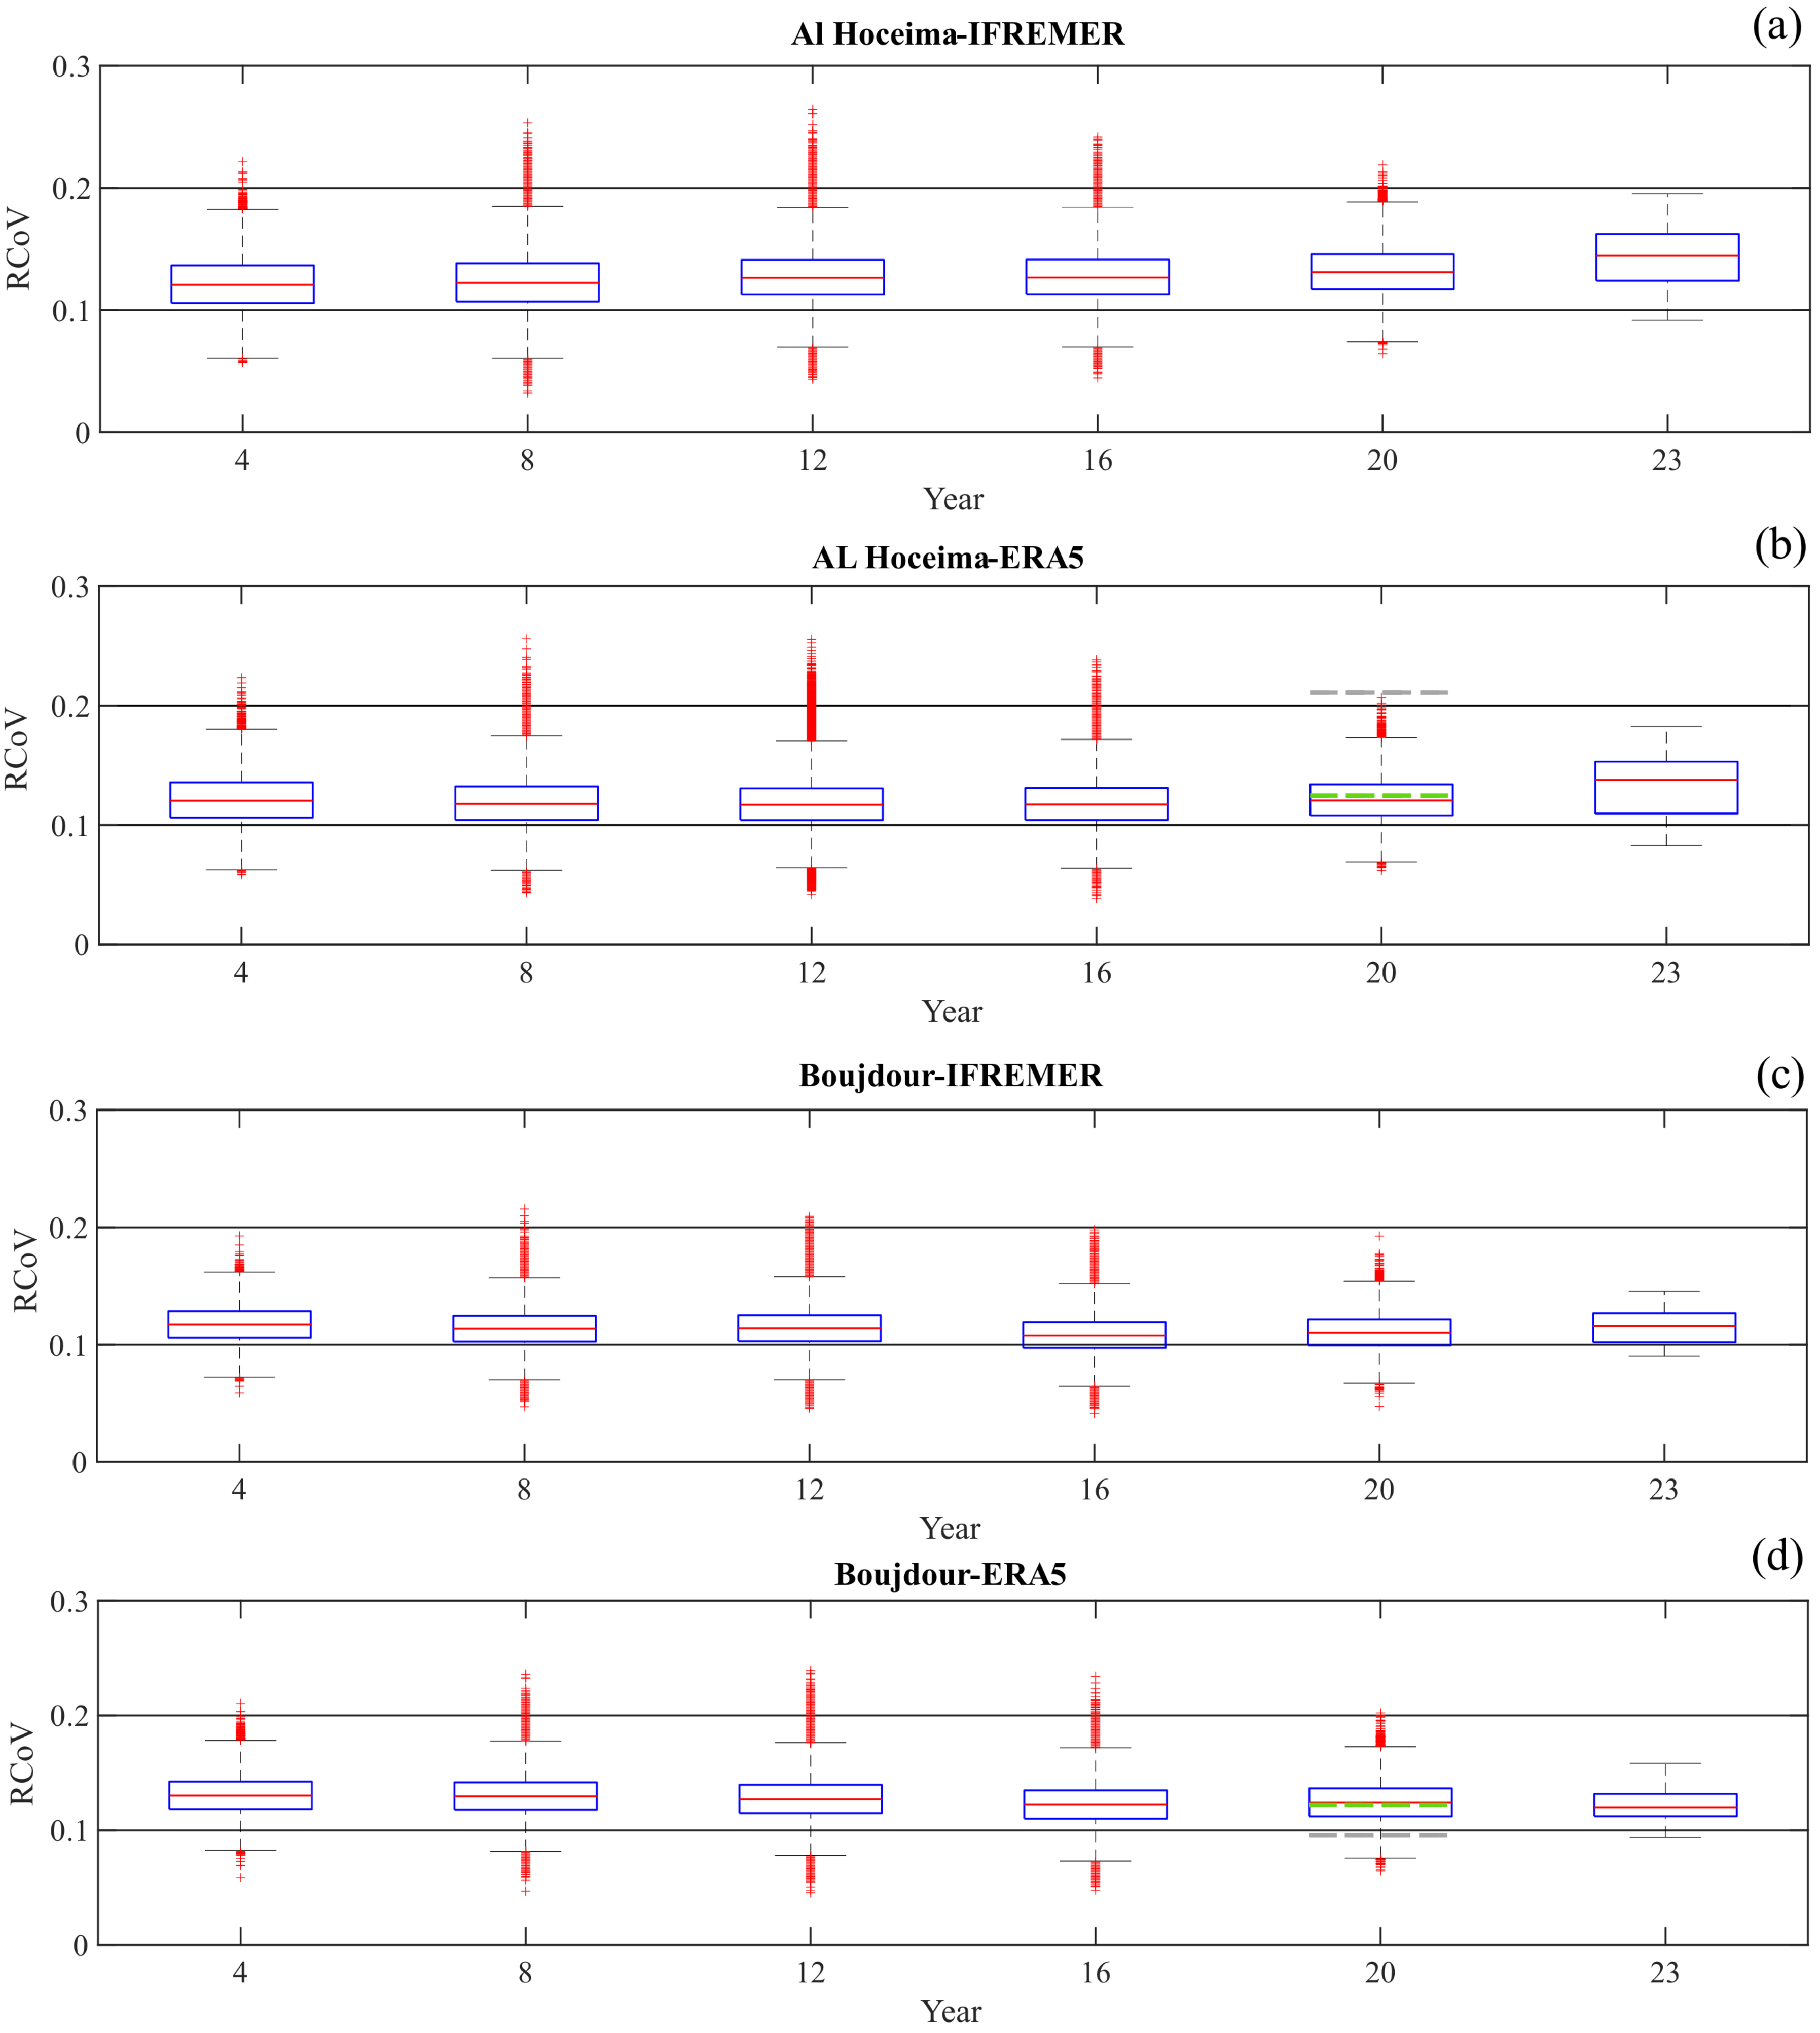
The RCoV coefficient indicates a resource that is more stable against interannual variability in the south than in the north, a feature of the observations well-reproduced in ERA5;
-
The very effects of the low frequency variability of the wind, measured by RCoV, produced increases in this parameter (which means more variability) in the last 20 years, which were statistically significant only in the northern location, in the winter and autumn;
-
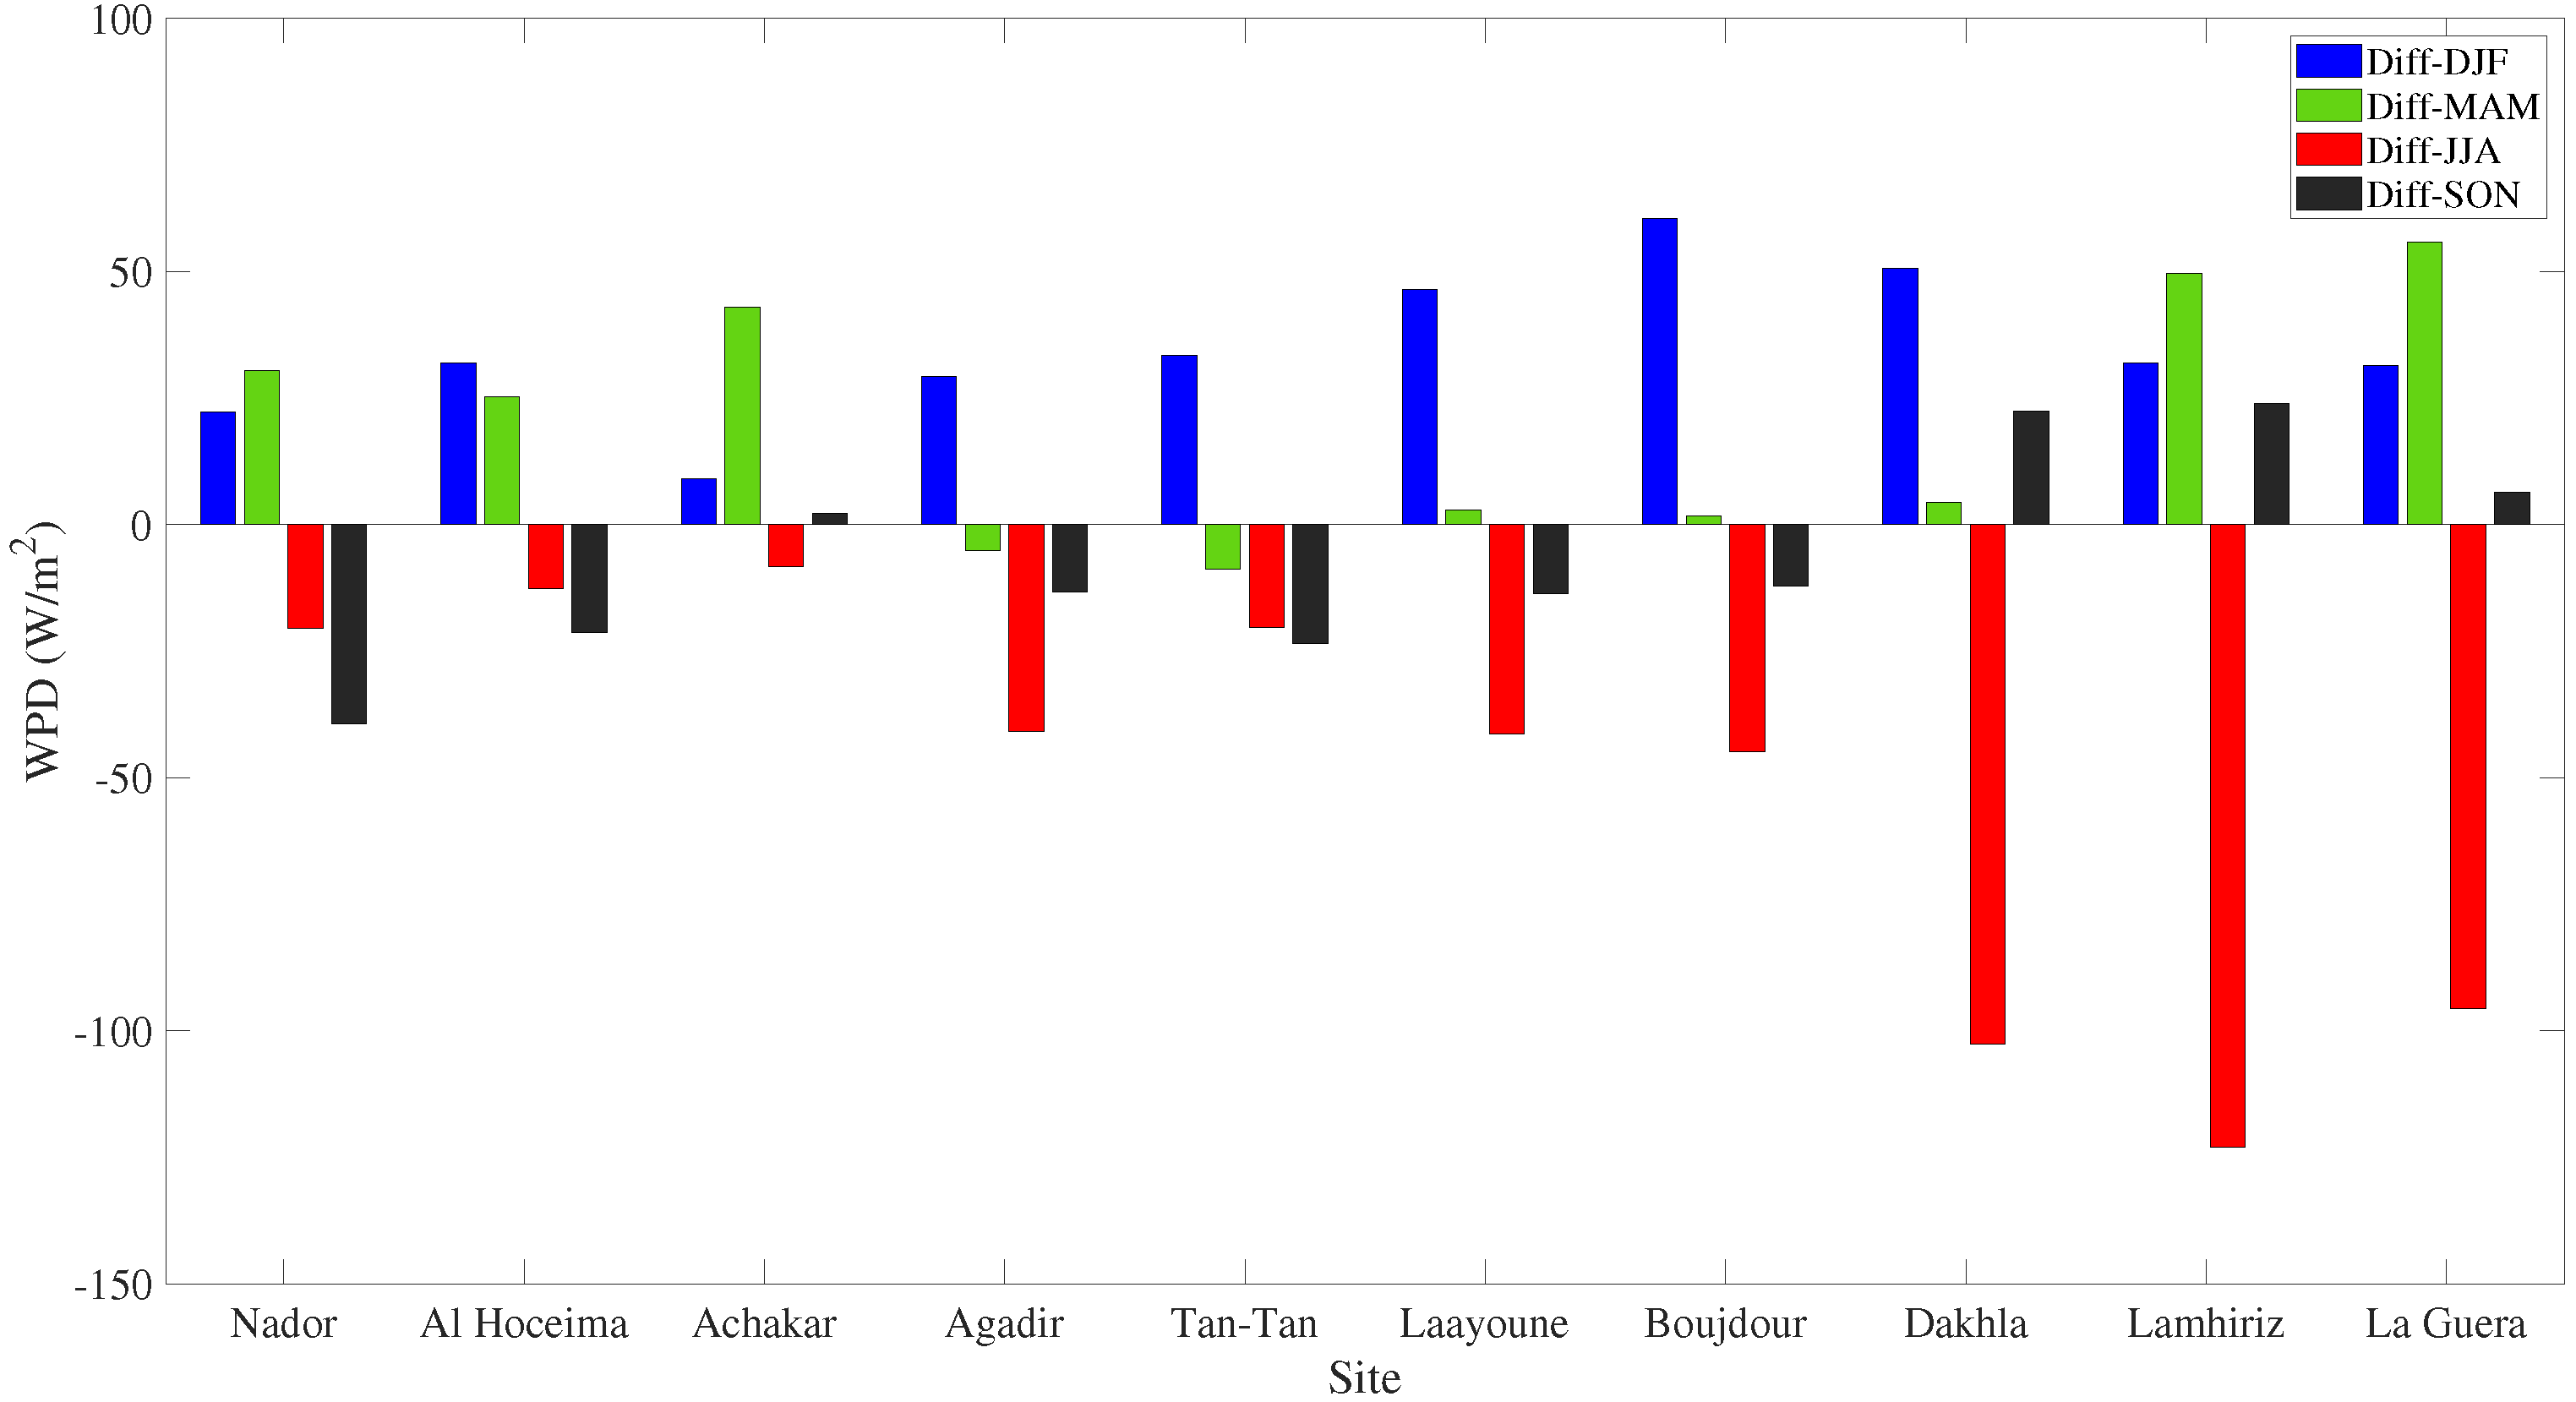
The changes in the WPD introduced by the change in the signs of the low frequency variability in the ERA5 wind data did not lead to significant differences in the yearly WPD of the last 20 years with respect to the first 20 years. The differences detected concerned the seasonal distribution of the WPD and are closely related to the months of the maximum and minimum wind speed values in the seasonal cycle at each location;
-
Although the low frequency induced changes do not significantly vary the annual energy potential, they lead to readjustments of its seasonal values that range from 10% in the northern to 20% in the southern locations. This possible redistribution must be considered by future offshore wind resource planning in the region.

Supplementary Materials

The following supporting information can be downloaded at: https://www.mdpi.com/article/10.3390/jmse12030460/s1, Table S1. Geographical coordinates of the locations used in this study. Table S2. 100 m wind classification. Figure S1. (a) Map of the mean value of the observed (IFREMER) 10 m height wind velocity (m/s) in the North Atlantic sector considered, for the validation period (1993–2016). (b) Differences between the ERA5 and the IFREMER wind velocity mean (c) as in (a) but for the standard deviation (STD) of the observed 10 m height wind velocity data. (d) as in (b) but for the wind velocity STD. Figure S2. Weibull PDF fitted to IFREMER (coloured red) and ERA5 (coloured blue) wind velocity histogramms in the period 1993–2016 at Agadir (left) and Bou Arich (right).

Author Contributions

Conceptualization, Y.Z., M.J.O. and F.J.A.-G.; data curation, Y.Z. and A.R.; formal analysis, Y.Z., M.J.O., F.J.A.-G. and A.R.; methodology, Y.Z., M.J.O., A.H. and Y.E.M.; software, Y.Z. and A.R.; supervision, M.J.O., F.J.A.-G., A.H. and Y.E.M.; validation, Y.Z., M.J.O. and F.J.A.-G.; visualization, Y.Z.; writing—original draft, Y.Z.; writing—review and editing, Y.Z., M.J.O., F.J.A.-G., A.H., Y.E.M. and A.R. All authors have read and agreed to the published version of the manuscript.

Funding

This research received no external funding.

Data Availability Statement

The ERA5 data can be obtained from Copernicus Climate Change Service and the IFREMER data from the Asia-Pacific Data Research Center (APRC) at their internet addresses as detailed in the references.

Acknowledgments

The authors acknowledge the European Centre for Medium-Range Weather Forecasts (ECMWF) and the Institut Francais pour la Recherche de la Mer (IFREMER) for producing the datasets used in this study and Ali Alrubaye for their contribution in the first stages of this research. JC Nieto-Borge is thanked for providing some computer resources on behalf of this study. The three anonymous reviewers of this paper are acknowledged for their comments.

Conflicts of Interest

The authors declare no conflicts of interest.

Appendix A

Linear statistics parameters.
X ¯ = i = 1 n X i n Mean of the X variable
S T D = i = 1 n ( X i X ¯ ) 2 ) n 1 Standard Deviation of the X variable
S K E W = m 3 / S T D 3 ; m 3 = i = 1 n ( X i X ¯ ) 3 Skewness
K U = m 4 / S T D 4 ; m 4 = i = 1 n ( X i X ¯ ) 4 Kurtosis
B i a s = R i O i Bias
R M S E = 1 n i = 1 n ( R i O i ) 2 Root Mean Square Error
C o V = S T D / X ¯ Coefficient of Variation
where Ri represents the reanalysis data, and Oi is the observed data. O ¯ and R ¯ are the observed and reanalysed sample means, respectively, and n represents the sample size.
Weibull parameters approximated relationships [45].
c = v ¯ Γ 1 + 1 k , k = S T D v ¯ ( 1.086 ) for the range 1 k 10
where Γ ( x ) is the Gamma function of x.
Robust statistics parameters
P ( x m e d ) = 0.5 Median
M A D = m e d i a n | x x m e d | Median Absolute Deviation ( MAD )
I Q R = ( Q 0.75 Q 0.25 ) Inter Quartile Range
T r i m e a n = ( Q 0.25 + 2 Q 0.5 + Q 0.75 ) / 4 Tukey s Trimean
R C o V = M A D / x m e d Robust Coefficient of Variation
Y K I = Q 0.25 2 Q 0.5 + Q 0.75 I Q R Yule Kendall Index

References

  1. Paris Agreement to the United Nations Framework Convention on Climate Change, T.I.A.S. 16-1104. Available online: https://unfccc.int/process-and-meetings/the-paris-agreement (accessed on 12 December 2015).
  2. GWEC Global Offshore Wind Report. 2022. Available online: https://gwec.net/wp-content/uploades/2020/08/Annual-wind-report-2022-digital-final-2r.pdf (accessed on 1 September 2023).
  3. Bazilian, M.; Nussbaumer, P.; Rogner, H.H.; Brew-Hammond, A.; Foster, V.; Pachauri, S.; Williams, E.; Howells, M.; Niyongabo, P.; Musaba, L.; et al. Energy access scenarios to 2030 for the power sector in sub-Saharan Africa. Util. Policy 2012, 20, 1–16. [Google Scholar] [CrossRef]
  4. Ouedraogo, N.S. Modeling sustainable long-term electricity supply-demand in Africa. Appl. Energy 2017, 190, 1047–1067. [Google Scholar] [CrossRef]
  5. Elsner, P. Continental-scale assessment of the African offshore wind energy potential: Spatial analysis of an under-appreciated renewable energy resource. Renew. Sustain. Energy Rev. 2019, 104, 394–407. [Google Scholar] [CrossRef]
  6. Ouammi, H.; Sacile, R.; Zejli, D.; Mimet, A.; Benchifra, R. Sustainability of a wind power plant. Application to different Moroccan sites. Energy 2020, 35, 4226–4236. [Google Scholar] [CrossRef]
  7. Choukri, K.; Naddani, A.; Hayani, S.M. Deep Analysis of wind variability and smoothing effect in Moroccan wind farms. Wind Eng. 2017, 41, 0309524X1770973. [Google Scholar] [CrossRef]
  8. El Kchine, Y.; Sriti, M.; El Kadri, N.D. Evaluation of wind energy potential and trends in Morocco. Helyon 2019, 5, e01830. [Google Scholar] [CrossRef]
  9. Allouhi, A.; Zamzoum, O.; Islam, M.R.; Saidur, R.; Kousksou, T.; Jamil, A.; Derouich, A. Evaluation of wind energy potential in Morocco’s coastal regions. Renew. Sust. Energy Rev. 2017, 72, 311–324. [Google Scholar] [CrossRef]
  10. Kousksou, T.; Allouhi, A.; Belattar, M.; Jamil, A.; El Rhafiki, T.; Arid, A.; Zeraouli, Y. Renewable energy potential and national policy directions for sustainable development in Morocco. Renew. Sust. Energy Rev. 2015, 47, 46–57. [Google Scholar] [CrossRef]
  11. Zhang, H.M.; Bates, J.J.; Reynolds, R.W. Assessment of composite global sampling: Sea surface wind speed. Geophys. Res. Lett. 2006, 33, 17714. [Google Scholar] [CrossRef]
  12. Taoufik, M.; Fekri, A. GIS-based multi-criteria analysis of offshore wind farm development in Morocco. Energy Convers. Manag. X 2021, 11, 100103. [Google Scholar] [CrossRef]
  13. The GlobalWind Atlas 3.1, T.U.o. Denmark, Editor. 2021. Available online: https://globalwindatlas.info (accessed on 1 December 2022).
  14. Benazzouz, A.; Mabchour, H.; Had, K.E.; Zourarah, B.; Mordane, S. Offshore Wind Energy Resource in the Kingdom of Morocco: Assessment of the Seasonal Potential Variability Based on Satellite Data. J. Mar. Sci. Eng. 2021, 9, 31. [Google Scholar] [CrossRef]
  15. Olauson, J. ERA5: The new champion of wind power modelling? Renew. Energy 2018, 126, 322–331. [Google Scholar] [CrossRef]
  16. Desbiolles, F.; Bentamy, A.R.; Blanke, B.; Roy, C.; Mestas-Nuñez, A.M.; Grodsky, S.A.; Herbette, S.; Cambon, G.; Maes, C. Two decades (1992–2012) of surface wind analysis based on satellite scatterometers observations. J. Mar. Sys. 2017, 168, 32–56. [Google Scholar] [CrossRef]
  17. Brower, M. Wind Resource Assessment: A Practical Guide to Developing a Wind Project; Wiley & Sons: Hoboken, NJ, USA, 2012. [Google Scholar]
  18. Cannon, D.J.; Brayshaw, D.J.; Methven, J.; Coker, P.J.; Lenaghan, D. Using reanalysis data to quantify extreme wind power generation statistics: A 33-year case study in Great Britain. Renew. Energy 2015, 75, 767–778. [Google Scholar] [CrossRef]
  19. Bosch, J.; Staffell, I.; Hawkes, A.D. Temporally explicit and spatially resolved global offshore wind energy potentials. Energy 2018, 163, 766–781. [Google Scholar] [CrossRef]
  20. Weiss, C.V.C.; Guanche, R.; Ondiviela, B.; Castellanos, O.F.; Juanes, J. Marine renewable energy potential: A global perspective for offshore wind and wave exploitation. Energy Convers. Manag. 2018, 177, 43–54. [Google Scholar] [CrossRef]
  21. Murcia, J.P.; Koivisto, M.J.; Luzia, G.; Olsen, B.T.; Hahmann, A.N.; Sørensen, P.E.; Als, M. Validation of European-scale simulated wind speed and wind generation time series. Appl. Energy 2022, 305, 117794. [Google Scholar] [CrossRef]
  22. Tetzner, D.; Thomas, E.; Allen, C. A Validation of ERA5 Reanalysis Data in the Southern Antarctic Peninsula—Ellsworth Land Region, and Its Implications for Ice Core Studies. Geosciences 2019, 9, 289. [Google Scholar] [CrossRef]
  23. Campos, R.M.; Guedes Soares, C. Comparison of HIPOCAS and ERA wind and wave reanalyses in the North Atlantic Ocean. Ocean Eng. 2016, 112, 320–334. [Google Scholar] [CrossRef]
  24. Campos, R.M.; Gramcianinov, C.B.; de Camargo, R.; da Silva Diaz, P.L. Assessment and calibration of ERA5 severe winds in the Atlantic Ocean using Satellite data. Remote Sens. 2022, 14, 4918. [Google Scholar] [CrossRef]
  25. Azorin-Molina, C.; Menendez, M.; McVicar, T.R.; Acevedo, A.; Vicente-Serrano, S.M.; Cuevas, E.; Minola, L.; Chen, D. Wind speed variability over the Canary Islands, 1948–2014: Focusing on trend differences at the land–ocean interface and below–above the trade-wind inversion layer. Clyn. Dyn. 2018, 50, 4061–4081. [Google Scholar] [CrossRef]
  26. Cropper, T.E.; Hanna, E. An analysis of the climate of Macaronesia, 1865–2012. Int. J. Climatol. 2014, 34, 604–632. [Google Scholar] [CrossRef]
  27. Jones, P.D.; Jonsson, T.; Wheeler, D. Extension to the North Atlantic Oscillation using early instrumental pressure observations from Gibraltar and south–west Iceland. Int. J. Climatol. 1997, 17, 1433–1450. [Google Scholar] [CrossRef]
  28. Barnston, A.G.; Livezey, R.E. Classification, seasonality and persistence of low-frequency atmospheric circulation patterns. Mon. Weather Rev. 1987, 15, 1083–1126. [Google Scholar] [CrossRef]
  29. Clifton, A.; Smith, A.; Fields, M. Wind Plant Preconstruction Energy Estimates: Current Practice and Opportunities; NREL/TP-5000-64735; National Renewable Energy Laboratory: Golden, CO, USA, 2016. Available online: https://www.nrel.gov/docs/fy16osti/64735.pdf (accessed on 12 December 2021).
  30. Pryor, S.C.; Barthelmie, R.J. Climate change impacts on wind energy: A review. Ren. Sust. Energ. Rev. 2010, 14, 430–437. [Google Scholar] [CrossRef]
  31. Pryor, S.C.; Barthelmie, R.J.; Bukovsky, M.S.; Leung, L.R.; Sakaguchi, K. Climate change impacts on wind power generation. Nat. Rev. Earth Environ. 2020, 1, 627–643. [Google Scholar] [CrossRef]
  32. Pullinger, D.; Zhang, M.; Hill, N.; Crutchley, T. Improving uncertainty estimates: Inter-annual variability in Ireland. J. Phys. Conf. Ser. 2017, 926, 012006. [Google Scholar] [CrossRef]
  33. Pryor, S.C.; Barthelmie, R.J.; Schoof, J.T. Inter-annual variability of wind indices across Europe. Wind Energy 2006, 9, 27–38. [Google Scholar] [CrossRef]
  34. Lee, J.C.Y.; Fields, M.J.; Lundquist, J.K.; Lunacek, M. Determining variabilities of non-gaussian wind speed distributions using different metrics and timescales. J. Phys. Conf. Ser. 2018, 1037, 072038. [Google Scholar] [CrossRef]
  35. Lee, J.C.Y.; Fields, M.J.; Lundquist, J.K. Assessing variability of wind speed: Comparison and validation of 29 methodologies. Wind Energ. Sci. 2018, 3, 845–888. [Google Scholar] [CrossRef]
  36. McVicar, T.R.; Roderick, M.L.; Donohue, R.J.; Li, L.T.; Van Niel, T.G.; Thomas, A.; Grieser, J.; Jhajharia, D.; Himri, Y.; Mahowald, N.M.; et al. Global review and synthesis of trends in observed terrestrial near-surface wind speeds: Implications for evaporation. J. Hydrol. 2012, 416–417, 182–205. [Google Scholar] [CrossRef]
  37. Roderick, M.L.; Rotstayn, L.D.; Farquhar, C.D.; Hobbins, M.T. On the attribution of changing pan evaporation. Geophys. Res. Lett. 2007, 34, L172103. [Google Scholar] [CrossRef]
  38. Dunn, R.J.H.; Azorin-Molina, C.; Mears, C.A.; Berrisford, P.; McVicar, T.R. Surface winds. In State of the Climate 2015. Bull. Amer. Meteor. Soc. 2016, 97, S38–S40. [Google Scholar]
  39. Zhou, L.; Zeng, Z.; Azorin-Molina, C.; Liu, Y.; Wu, J.; Wang, D.; Li, D.; Ziegler, A.D.; Dong, L. A continuous decline of Global Seasonal Wind Speed Range over Land since 1980. J. Clim. 2021, 34, 9443–9461. [Google Scholar] [CrossRef]
  40. Zhao, Y.; Liang, S.; Liu, Y.; McVicar, T.R.; Azorin-Molina, C.; Zhou, L.; Dunn, R.J.H.; Jerez, S.; Qin, Y.; Yang, X. Global assessments of spatiotemporal changes of frequency of terrestrial wind speed. Environ. Res. Lett. 2023, 18, 044048. [Google Scholar] [CrossRef]
  41. IFREMER. Satellite Product 6 Hourly LOPS Blended. Available online: https://apdrc.soest.hawai.edu/erddap/griddap (accessed on 4 September 2023).
  42. Bentamy, A.; Croize-Fillon, D.; Queffeulou, P.; Liu, C.; Roquet, H. Evaluation of High-Resolution Surface Wind Products at Global and Regional Scales. J. Oper. Oceanogr. 2009, 2, 15–27. Available online: https://archimer.ifremer.fr (accessed on 4 September 2023). [CrossRef]
  43. Bentamy, A.; Grodsky, S.A.; Cambon, G.; Tandeo, P.; Capet, X.; Roy, C.; Herbette, S.; Crouazel, A. Twenty seven years of Scatterometer Surface Wind Analysis over Eastern Boundary Upwelling Systems. Remote Sens. 2021, 13, 940. [Google Scholar] [CrossRef]
  44. ERA5: Fifth Generation of ECMWF Atmospheric Reanalyses of the Global Climate. Copernicus Climate Change Service Climate Data Store (CDS). Available online: https://cds.climate.copernicus.eu/cdsapp#!/dataset/reanalysis-era5-single-levels?tab=overview (accessed on 23 May 2021).
  45. de Assis Tavares, L.F.; Shadman, M.; de Freitas Assad, L.P.; Silva, C.; Landau, L.; Estefen, S.F. Assessment of the offshore wind technical potential for the Brazilian Southeast and South regions. Energy 2020, 196, 117097. [Google Scholar] [CrossRef]
  46. Ramon, J.; Lledó, L.; Torralba, V.; Soret, A.; Doblas-Reyes, F.J. What global reanalysis best represents near-surface winds? Q. J. R. Meteorol. Soc. 2019, 145, 3236–3251. [Google Scholar] [CrossRef]
  47. Gonzalez-Aparicio, I.; Monforti, F.; Volker, P.; Zucker, A.; Careri, F.; Huld, T.; Badger, J. Simulating European wind power generation applying statistical downscaling to reanalysis data. Appl. Energy 2017, 199, 155–168. [Google Scholar] [CrossRef]
  48. Wilks, D.S. Statistical Methods in the Atmospheric Sciences; Academic Press: Amsterdam, The Netherlands, 2011. [Google Scholar]
  49. Pal, R. Validation methodologies. In Predictive Models of Drug Sensitivity; Academic Press: Cambridge, MA, USA, 2016; pp. 83–107. [Google Scholar]
  50. Gumbel, E.J. Statistics of Extremes; Dover: New York, NY, USA, 2004. [Google Scholar]
  51. Stewart, D.A.; Essenwanger, O.M. Frequency distribution of wind speed near the surface. J. Appl. Meteorol. 1978, 17, 1633–1642. [Google Scholar] [CrossRef]
  52. Hennessey, J.P. Some aspects of wind power statistics. J. Climate Appl. Meteorol. 1977, 16, 119–128. [Google Scholar] [CrossRef]
  53. Lun, I.Y.F.; Lam, J.C. A study of Weibull parameters using long-term wind observations. Renew. Energy 2019, 20, 145–153. [Google Scholar] [CrossRef]
  54. Kocai, M.; Kilic, M.; Şahin, Y. Assessing wind energy potential using finite mixture distributions. Turkish J. Electr. Eng. Comput. Sci. 2018, 27, 2276–2294. [Google Scholar] [CrossRef]
  55. Pereira de Lucena, A.F.; Szklo, A.S.; Schaeffer, R.; Dutra, R.M. The vulnerability of wind power to climate change in Brazil. Renew. Energy 2010, 35, 904–912. [Google Scholar] [CrossRef]
  56. Koletsis, I.; Kotroni, V.; Lagouvardos, K.; Soukissian, T. Assessment of offshore wind speed and power potential over the Mediterranean and the Black Seas under future climate changes. Renew Sustain Energy Rev. 2016, 60, 234–245. [Google Scholar] [CrossRef]
  57. Carta, J.A.; Velázquez, S.; Cabrera, P. A review of measure-correlate-predict (MCP) methods used to estimate long-term wind characteristics at a target site. Renew. Sustain. Energy Rev. 2013, 27, 362–400. [Google Scholar] [CrossRef]
  58. Bolgiani, P.; Calvo-Sancho, C.; Díaz-Fernández, J.; Quitián-Hernández, L.; Sastre, M.; Santos-Muñoz, D.; Farrán, J.I.; González-Alemán, J.J.; Valero, F.; Martín, M.L. Wind kinetic energy climatology and effective resolution for the ERA5 reanalysis. Clim. Dyn. 2022, 59, 737–752. [Google Scholar] [CrossRef]
  59. Jourdier, B. Evaluation of ERA5, MERRA-2, COSMO-REA6, NEWA and AROME to simulate wind power production over France. Adv. Sci. Res. 2020, 17, 63–77. [Google Scholar] [CrossRef]
  60. Davidson, M.R.; Millstein, D. Limitations of reanalysis data for wind power applications. Wind Energy 2020, 25, 1646–1653. [Google Scholar] [CrossRef]
Figure 1. Study area with relief. The 11 locations selected for the validation of the 10 m wind data are marked with a square.
Jmse 12 00460 g001
Figure 2. (a) Median value of the observed 10 m height wind velocity (m/s) in the North Atlantic sector considered, for the validation period (1993–2016). (b) Differences between the ERA5 and the IFREMER wind velocity median. (c) As in (a) but for the spread of the observed 10 m height wind velocity data. (d) As in (b) but for the wind velocity spread.
Jmse 12 00460 g002
Figure 3. (a) Weibull c parameter values (m/s) of the observed 10 m height wind velocity (m/s) in the North Atlantic sector considered for the period (1993–2016). (b) Differences between the c parameter values estimated from ERA5 and from IFREMER wind velocity data. (c) Map of the Weibull k parameter values of the observed 10 m height wind velocity in the same sector. (d) As in (b) but for the k parameter values.
Jmse 12 00460 g003
Figure 4. (a) Weibull scale parameter scale (m/s) estimates from IFREMER and ERA5 reanalysed times series of wind data, with the corresponding 99% confidence intervals for the 10 selected locations (b) as in (a) but for the Weibull shape k parameter.
Jmse 12 00460 g004
Figure 5. Scatterplot of the seasonal mean wind velocity of the observations (x-axis) against the corresponding ones in ERA5 wind field (y-axis) at each of the ten validation sites. Winter, spring, summer and autumn climatologies are coloured in blue, green, red and black, respectively. The dashed lines delimits the planar region where the bias absolute value is ≤1 m/s.
Jmse 12 00460 g005
Figure 6. Wind roses for wind direction probabilities and wind velocities at three different locations, representative of the different wind rose types found in IFREMER observations (left column) and in ERA5 reanalysed wind data (right column). (a,b), Nador. (c,d), Achakar. (e,f) Laayoune.
Jmse 12 00460 g006
Figure 7. Mean wind power density (WPD) at 100 m height derived from IFREMER wind observations (coloured in red) and from ERA5 reanalysed wind data (in blue) from 1993 to 2016 at the 10 selected sites.
Jmse 12 00460 g007
Figure 8. (a) Seasonal evolution (Hovmüller diagram) of 100 m height mean wind speed for the period 1993–2016 obtained from IFREMER wind field. (b) as in (a) but for 100 m height mean wind speed obtained from ERA5 reanalysed wind data.
Jmse 12 00460 g008
Figure 9. (a) Box plots of 100 m height wind speed RCoV obtained from observed monthly averages of wind speed data for different time frames, from 4 to 23 years at Al Hoceima site.(b) As in (a) but from ERA5 monthly averages. (c) As in (a) but at Boujdour site. (d) As in (b) but at Boujdour site. The discontinuous line at the 20 year position (corresponding to the 20 years time frame) signals the value of the RCoV for the first (1981–2000) period (green line) and for the (2001–2020) period (grey discontinuous line).
Jmse 12 00460 g009
Figure 10. (a) Seasonal anomalies (Hovmüller diagram) of winter (DJF) IFREMER remotely sensed wind speed for the period (1993–2016). (b) As in (a) but for summer (JJA) seasonal anomalies of wind speed. (c) As in (a) but for ERA5 winter seasonal anomalies with respect to the same period. (d) As in (b) but for the ERA5 summer seasonal anomalies with respect to the same period.
Jmse 12 00460 g010
Figure 11. Differences (W/m2) in the seasonal WPD obtained from the last 20 years minus the WPD obtained from the first 20 years of ERA5 winds, in winter (DJF), spring (MAM), summer (JJA), and autumn (SON) at the 10 sites considered.
Jmse 12 00460 g011
Table 1. Estimates of linear statistics parameters for observed and ERA5 wind data.
SiteDataMeanSKEWKUPercentiles
(95%)
BiasRMSE
1 NadorIfremer6.230.663.0511.24+0.090.92
ERA56.320.632.8612.12
2 Al HoceimaIfremer5.850.703.1211.16+0.031.19
ERA55.880.723.0711.42
3 AchakarIfremer5.101.024.019.20+0.491.10
ERA55.590.913.4210.40
4 Bou ArichIfremer6.200.392.5110.41+1.642.30
ERA57.840.162.0113.67
5 AgadirIfremer5.730.602.919.79−0.181.34
ERA55.550.813.2510.88
6 Tan TanIfremer6.510.422.8410.59−0.180.69
ERA56.330.392.9510.26
7 LayouneIfremer7.000.022.7010.16+0.090.74
ERA57.09−0.112.5810.48
8 BoujdourIfremer7.38−0.162.5110.62+0.140.68
ERA57.52−0.222.5511.02
9 DakhlaIfremer6.99−0.292.4910.06+0.530.86
ERA57.52−0.422.6210.71
10 LamhirizIfremer7.49−0.452.5410.48+0.480.79
ERA57.970.552.7111.91
11 La GueraIfremer7.57−0.452.5210.55+0.220.65
ERA57.79−0.492.6410.85
Table 2. Estimates of robust statistics parameters for observed and ERA5 wind data. The two last columns express the percent of coincidence in wind days extremes values between the two data sets.
SiteDataMedianMADRCoVYKIP10% Days
(%)
P90% Days
(%)
1 NadorIfremer5.832.160.370.099983
ERA55.872.160.360.08
2 Al HoceimaIfremer5.421.980.360.11 91 77
ERA55.542.150.390.10
3 AchakarIfremer4.641.230.260.19 73 76
ERA54.201.180.280.31
4 Bou ArichIfremer6.011.890.310.04 40 72
ERA57.712.960.380.00
5 AgadirIfremer5.441.640.300.08 61 77
ERA56.792.720.400.08
6 Tan TanIfremer6.381.730.270.01 83 85
ERA56.201.600.260.02
7 LaayouneIfremer7.051.400.20−0.03 60 76
ERA56.911.470.21−0.04
8 BoujdourIfremer7.531.530.20−0.08 58 75
ERA57.471.590.21−0.04
9 DakhlaIfremer7.221.470.20−0.11 41 40
ERA57.881.510.19−0.10
10 LamhirizIfremer7.811.480.19−0.15 40 73
ERA58.281.490.18−0.14
11 La GueraIfremer7.901.500.19−0.16 41 74
ERA58.071.520.19−0.13
Table 3. Statistical estimates of 100 m wind variability (mean, WPD, wind power class, number of low-wind days) at the 10 locations selected after validation. The estimates for site 4 (Bou Arich) are not included because this site’s wind velocity was not successfully simulated in ERA5 wind data.
SiteDataMeanWPD
(W/m2)
Wind Power
Class
L-W Days
(v < 3 m/s)
1 NadorIfremer7.56473C3732
ERA57.67499C3763
2 Al HoceimaIfremer7.09387C2810
ERA57.13406C2877
3 AchakarIfremer6.19228C1436
ERA56.77313C2373
5 AgadirIfremer6.66270C2300
ERA56.73344C2947
6 Tan TanIfremer7.89425C3146
ERA57.67389C2230
7 LaayouneIfremer8.49465C340
ERA58.60499C3118
8 BoujdourIfremer8.94545C344
ERA59.11590C4105
9 DakhlaIfremer8.48469C3134
ERA59.12581C4157
10 LamhirizIfremer9.09506C496
ERA59.66673C582
11 La GueraIfremer9.18582C478
ERA59.45632C496
Disclaimer/Publisher’s Note: The statements, opinions and data contained in all publications are solely those of the individual author(s) and contributor(s) and not of MDPI and/or the editor(s). MDPI and/or the editor(s) disclaim responsibility for any injury to people or property resulting from any ideas, methods, instructions or products referred to in the content.

