Robust Fish Recognition Using Foundation Models toward Automatic Fish Resource Management


Abstract
:1. Introduction
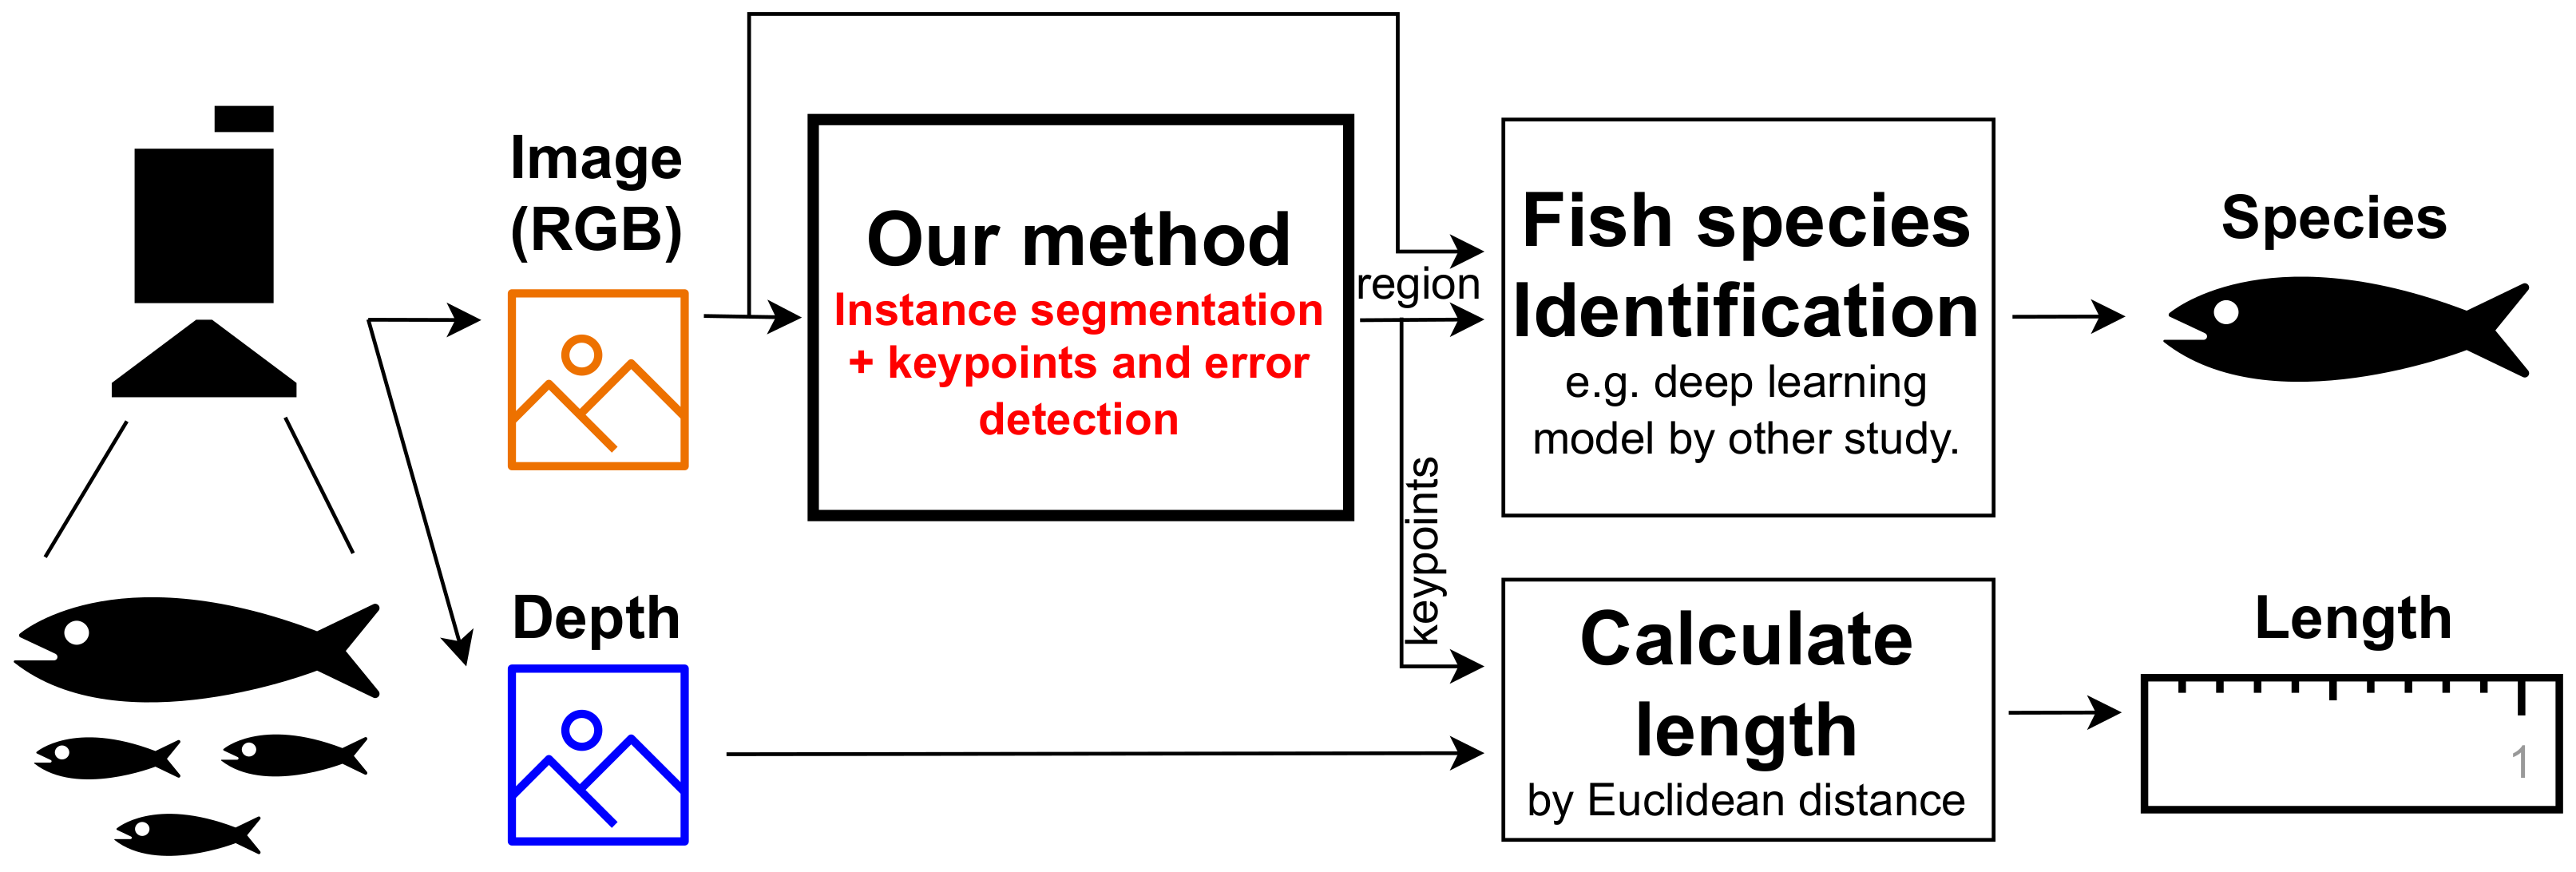
- (A)
- Instance segmentation:(Input) RGB image including any fish.(Output) Region masks for each fish.
- (B)
- Keypoints detection:(Input) RGB image cropped in the region of one fish.(Output) XY coordinates of the nine defined keypoints of the fish.
- (C)
- Species identification:(Input) RGB image cropped in the region of one fish.(Output) The species name of the fish.
- (D)
- Calculate length:(Input) XY coordinates of keypoints and depth information.(Output) Some length types, such as standard, fork, and total length.
- (E)
- Error check:(Input) RGB image cropped in the region of one fish.(Output) Determination of whether the fish image is suitable for resource survey or not.
- We devised (A) an instance segmentation model applicable to resource surveys in diverse environments through prompt engineering for the capabilities of the foundational model, grounded-segment-anything (Grounded-SAM). Additionally, we validated the method’s performance using benchmark datasets and self-captured market images, showcasing, for the first time, the utility of Grounded-SAM in detecting fish regions for resource surveys.
- We proposed this by utilizing the foundation model; for instance, for segmentation, subsequent detection models can be trained with the assumption of a single catch per image and removed background information. Building on this assumption, we devised robust (B) keypoint detection and (E) error-checking models, demonstrating their effectiveness through validation.
- To facilitate the training of the models above, we created and released the fish image bank (FIB) dataset. This dataset is a new benchmark for fish detection and image synthesis, comprising 405 4K-resolution images, each featuring distinct fish species. The dataset was meticulously annotated with labels for fish specie, region masks, and keypoints.
2. Proposed Method
2.1. Overall Process and Advantages
2.2. Instance Segmentation by Foundation Models
2.2.1. Foundation Models
2.2.2. Prompt Engineering
2.3. Keypoint and Error Detection by FIB
2.3.1. FIB
2.3.2. Keypoint Detection
2.3.3. Error Check
3. Experimental Settings
- RQ1
- Can the instance segmentation performance of the foundation models, Grounded-SAM, be effectively employed in various resource survey environments without additional training (robustness to fish species, background environment, and density)?
- RQ2
- Does the keypoint detection model, trained on FIB and coupled with background removal, offer robust keypoint detection across diverse environments and fish species?
- RQ3
- Can the error-checking model identify detection errors made by the foundation models in images taken in a real environment?
4. Results
4.1. RQ1. Instance Segmentation Performance
- Fish detection is feasible even in dense placements but becomes challenging when fish overlap in the depth direction, particularly when decreasing the confidence of “fish” in the Grounding DINO.
- Instances of missing detection occur when only a portion of the head or tail is visible at the screen’s edge, as illustrated in Figure 8a.
4.2. RQ2. Keypoint Detection Performance
4.3. RQ3. Error-Checking Performance
4.4. Robustness to Species
5. Conclusions
Author Contributions
Funding
Institutional Review Board Statement
Informed Consent Statement
Data Availability Statement
Acknowledgments
Conflicts of Interest
| 1 | Grounded-SAM: https://github.com/IDEA-Research/Grounded-Segment-Anything (accessed on 1 February 2024) |
| 2 | Segmentation anything https://github.com/facebookresearch/segment-anything (accessed on 1 February 2024) |
| 3 | github: coco-annotator: https://github.com/jsbroks/coco-annotator (accessed on 1 February 2024) |
| 4 | Web Sakana Zukan by Zukan.com, Inc., Chiyoda-ku, Tokyo, Japan. https://zukan.com/fish/ (accessed on 1 February 2024) |
References
- Keimer, A.; Laurent-Brouty, N.; Farokhi, F.; Signargout, H.; Cvetkovic, V.; Bayen, A.M.; Johansson, K.H. Information Patterns in the Modeling and Design of Mobility Management Services. Proc. IEEE 2018, 106, 554–576. [Google Scholar] [CrossRef]
- Chen, X.; Lv, S.; long Shang, W.; Wu, H.; Xian, J.; Song, C. Ship energy consumption analysis and carbon emission exploitation via spatial-temporal maritime data. Appl. Energy 2024, 360, 122886. [Google Scholar] [CrossRef]
- Worm, B.; Hilborn, R.; Baum, J.K.; Branch, T.A.; Collie, J.S.; Costello, C.; Fogarty, M.J.; Fulton, E.A.; Hutchings, J.A.; Jennings, S.; et al. Rebuilding global fisheries. Science 2009, 325, 578–585. [Google Scholar] [CrossRef] [PubMed]
- Xu, P.; Xie, M.; Zhou, W.; Suo, A. Research on Fishery Resource Assessment and Sustainable Utilization (FRASU) during 1990–2020: A bibliometric review. Glob. Ecol. Conserv. 2021, 29, e01720. [Google Scholar] [CrossRef]
- Garcia, R.; Prados, R.; Quintana, J.; Tempelaar, A.; Gracias, N.; Rosen, S.; Vågstøl, H.; Løvall, K. Automatic segmentation of fish using deep learning with application to fish size measurement. ICES J. Mar. Sci. 2019, 77, 1354–1366. [Google Scholar] [CrossRef]
- Álvarez-Ellacuría, A.; Palmer, M.; Catalán, I.A.; Lisani, J.L. Image-based, unsupervised estimation of fish size from commercial landings using deep learning. ICES J. Mar. Sci. 2019, 77, 1330–1339. [Google Scholar] [CrossRef]
- Tseng, C.H.; Kuo, Y.F. Detecting and counting harvested fish and identifying fish types in electronic monitoring system videos using deep convolutional neural networks. ICES J. Mar. Sci. 2020, 77, 1367–1378. [Google Scholar] [CrossRef]
- He, K.; Gkioxari, G.; Dollar, P.; Girshick, R. Mask R-CNN. IEEE Trans. Pattern Anal. Mach. Intell. 2020, 42, 386–397. [Google Scholar] [CrossRef]
- Bravata, N.; Kelly, D.; Eickholt, J.; Bryan, J.; Miehls, S.; Zielinski, D. Applications of deep convolutional neural networks to predict length, circumference, and weight from mostly dewatered images of fish. Ecol. Evol. 2020, 10, 9313–9325. [Google Scholar] [CrossRef]
- Saleh, A.; Sheaves, M.; Jerry, D.; Rahimi Azghadi, M. Applications of deep learning in fish habitat monitoring: A tutorial and survey. Expert Syst. Appl. 2024, 238, 121841. [Google Scholar] [CrossRef]
- Suo, F.; Huang, K.; Ling, G.; Li, Y.; Xiang, J. Fish Keypoints Detection for Ecology Monitoring Based on Underwater Visual Intelligence. In Proceedings of the 2020 16th International Conference on Control, Automation, Robotics and Vision (ICARCV), Shenzhen, China, 13–15 December 2020; pp. 542–547. [Google Scholar]
- Yu, Y.; Zhang, H.; Yuan, F. Key point detection method for fish size measurement based on deep learning. IET Image Proc. 2023, 17, 4142–4158. [Google Scholar] [CrossRef]
- Dong, J.; Shangguan, X.; Zhou, K.; Gan, Y.; Fan, H.; Chen, L. A detection-regression based framework for fish keypoints detection. Intell. Mar. Technol. Syst. 2023, 1, 9. [Google Scholar] [CrossRef]
- Zhou, X.; Wang, D.; Krähenbühl, P. Objects as Points. arXiv 2019, arXiv:1904.07850. [Google Scholar]
- Boom, B.J.; Huang, P.X.; He, J.; Fisher, R.B. Supporting ground-truth annotation of image datasets using clustering. In Proceedings of the 21st International Conference on Pattern Recognition (ICPR2012), Tsukuba, Japan, 11–15 November 2012; pp. 1542–1545. [Google Scholar]
- Ulucan, O.; Karakaya, D.; Turkan, M. A Large-Scale Dataset for Fish Segmentation and Classification. In Proceedings of the 2020 Innovations in Intelligent Systems and Applications Conference (ASYU), Istanbul, Turkey, 15–17 October 2020; pp. 1–5. [Google Scholar]
- Garcia-d’Urso, N.; Galan-Cuenca, A.; Pérez-Sánchez, P.; Climent-Pérez, P.; Fuster-Guillo, A.; Azorin-Lopez, J.; Saval-Calvo, M.; Guillén-Nieto, J.E.; Soler-Capdepón, G. The DeepFish computer vision dataset for fish instance segmentation, classification, and size estimation. Sci. Data 2022, 9, 287. [Google Scholar] [CrossRef]
- Hasegawa, T.; Kondo, K.; Senou, H. Transferable Deep Learning Model for the Identification of Fish Species for Various Fishing Grounds. J. Mar. Sci. Eng. 2024, 12, 415. [Google Scholar] [CrossRef]
- Shah, S.Z.H.; Rauf, H.T.; IkramUllah, M.; Khalid, M.S.; Farooq, M.; Fatima, M.; Bukhari, S.A.C. Fish-Pak: Fish species dataset from Pakistan for visual features based classification. Data Brief 2019, 27, 104565. [Google Scholar] [CrossRef]
- Zhuang, P.; Wang, Y.; Qiao, Y. WildFish: A Large Benchmark for Fish Recognition in the Wild. In Proceedings of the 26th ACM International Conference on Multimedia, Seoul, Republic of Korea, 22–26 October 2018; pp. 1301–1309. [Google Scholar]
- Zhuang, P.; Wang, Y.; Qiao, Y. Wildfish++: A Comprehensive Fish Benchmark for Multimedia Research. IEEE Trans. Multimed. 2021, 23, 3603–3617. [Google Scholar] [CrossRef]
- Hasegawa, T.; Tanaka, M. Few-shot Fish Length Recognition by Mask R-CNN for Fisheries Resource Management. IPSJ Trans. Consum. Devices Syst. 2022, 12, 38–48. (In Japanese) [Google Scholar]
- Radford, A.; Kim, J.W.; Hallacy, C.; Ramesh, A.; Goh, G.; Agarwal, S.; Sastry, G.; Askell, A.; Mishkin, P.; Clark, J.; et al. Learning Transferable Visual Models From Natural Language Supervision. In Proceedings of the 38th International Conference on Machine Learning, PMLR, Online, 18–24 July 2021; Volume 139, pp. 8748–8763. [Google Scholar]
- Liu, S.; Zeng, Z.; Ren, T.; Li, F.; Zhang, H.; Yang, J.; Li, C.; Yang, J.; Su, H.; Zhu, J.; et al. Grounding DINO: Marrying DINO with Grounded Pre-Training for Open-Set Object Detection. arXiv 2023, arXiv:2303.05499. [Google Scholar]
- Kirillov, A.; Mintun, E.; Ravi, N.; Mao, H.; Rolland, C.; Gustafson, L.; Xiao, T.; Whitehead, S.; Berg, A.C.; Lo, W.Y.; et al. Segment Anything. In Proceedings of the IEEE/CVF International Conference on Computer Vision, Paris, France, 2–3 October 2023; pp. 4015–4026. [Google Scholar]
- Zhang, C.; Liu, L.; Cui, Y.; Huang, G.; Lin, W.; Yang, Y.; Hu, Y. A Comprehensive Survey on Segment Anything Model for Vision and Beyond. arXiv 2023, arXiv:2305.08196. [Google Scholar]
- Ren, S.; Luzi, F.; Lahrichi, S.; Kassaw, K.; Collins, L.M.; Bradbury, K.; Malof, J.M. Segment anything, from space? In Proceedings of the IEEE/CVF Winter Conference on Applications of Computer Vision, Waikoloa, HI, USA, 1–10 January 2024; pp. 8355–8365. [Google Scholar]
- Huang, Y.; Yang, X.; Liu, L.; Zhou, H.; Chang, A.; Zhou, X.; Chen, R.; Yu, J.; Chen, J.; Chen, C.; et al. Segment anything model for medical images? Med. Image Anal. 2024, 92, 103061. [Google Scholar] [CrossRef]
- Li, L.H.; Zhang, P.; Zhang, H.; Yang, J.; Li, C.; Zhong, Y.; Wang, L.; Yuan, L.; Zhang, L.; Hwang, J.N.; et al. Grounded Language-Image Pre-training. In Proceedings of the 2022 IEEE/CVF Conference on Computer Vision and Pattern Recognition (CVPR), New Orleans, LA, USA, 19–24 June 2022; pp. 10955–10965. [Google Scholar]
- Caron, M.; Touvron, H.; Misra, I.; Jegou, H.; Mairal, J.; Bojanowski, P.; Joulin, A. Emerging Properties in Self-Supervised Vision Transformers. In Proceedings of the 2021 IEEE/CVF International Conference on Computer Vision (ICCV), Virtual, 11–17 October 2021; pp. 9630–9640. [Google Scholar]
- Zhang, C.; Puspitasari, F.D.; Zheng, S.; Li, C.; Qiao, Y.; Kang, T.; Shan, X.; Zhang, C.; Qin, C.; Rameau, F.; et al. A Survey on Segment Anything Model (SAM): Vision Foundation Model Meets Prompt Engineering. arXiv 2023, arXiv:2306.06211. [Google Scholar]
- Lowe, D.G. Distinctive Image Features from Scale-Invariant Keypoints. Int. J. Comput. Vis. 2004, 60, 91–110. [Google Scholar] [CrossRef]
- Bay, H.; Tuytelaars, T.; Van Gool, L. SURF: Speeded Up Robust Features. In Computer Vision—ECCV 2006; Springer: Berlin/Heidelberg, Germany, 2006; pp. 404–417. [Google Scholar]
- Prokop, K.; Połap, D. Heuristic-based image stitching algorithm with automation of parameters for smart solutions. Expert Syst. Appl. 2024, 241, 122792. [Google Scholar] [CrossRef]
- Kendall, A.; Grimes, M.; Cipolla, R. PoseNet: A Convolutional Network for Real-Time 6-DOF Camera Relocalization. In Proceedings of the 2015 IEEE International Conference on Computer Vision (ICCV), Santiago, Chile, 7–13 December 2015; pp. 2938–2946. [Google Scholar]
- Zhong, Z.; Zheng, L.; Kang, G.; Li, S.; Yang, Y. Random Erasing Data Augmentation. AAAI 2020, 34, 13001–13008. [Google Scholar] [CrossRef]
- He, K.; Zhang, X.; Ren, S.; Sun, J. Deep Residual Learning for Image Recognition. In Proceedings of the 2016 IEEE Conference on Computer Vision and Pattern Recognition (CVPR), Las Vegas, NV, USA, 27–30 June 2016; pp. 770–778. [Google Scholar]
- Hasegawa, T.; Tanaka, M. Validation of the effectiveness of Detic as a zero-shot fish catch recognition system. In Proceedings of the 11th IIAE International Conference on Industrial Application Engineering (ICIAE), Okinawa, Japan, 26–30 March 2023. [Google Scholar]
- Sun, K.; Xiao, B.; Liu, D.; Wang, J. Deep High-Resolution Representation Learning for Human Pose Estimation. In Proceedings of the 2019 IEEE/CVF Conference on Computer Vision and Pattern Recognition (CVPR), Long Beach, CA, USA, 15–20 June 2019; pp. 5686–5696. [Google Scholar]
- Xu, Y.; Zhang, J.; Zhang, Q.; Tao, D. ViTPose: Simple Vision Transformer Baselines for Human Pose Estimation. Adv. Neural Inf. Process. Syst. 2022, 35, 38571–38584. [Google Scholar]
- Geng, Z.; Wang, C.; Wei, Y.; Liu, Z.; Li, H.; Hu, H. Human Pose as Compositional Tokens. In Proceedings of the 2023 IEEE/CVF Conference on Computer Vision and Pattern Recognition (CVPR), Vancouver, BC, Canada, 17–24 June 2023; pp. 660–671. [Google Scholar]
- Dai, H.; Ma, C.; Liu, Z.; Li, Y.; Shu, P.; Wei, X.; Zhao, L.; Wu, Z.; Zeng, F.; Zhu, D.; et al. SAMAug: Point Prompt Augmentation for Segment Anything Model. arXiv 2023, arXiv:2307.01187. [Google Scholar]


| # of Pics. | # of Fishes | # of Species | IS (mAP) | IS (Ratio) | KP (Ratio) | EC (Ratio) | |
|---|---|---|---|---|---|---|---|
| FIB | 405 | 405 | 24 | ✓ | ✗ | ✗ | ✗ |
| Multiple (1) | 12 | 97 | 9 | ✓ | |||
| Multiple (2) | 86 | 553 | 26 | ✓ | ✓ | ✓ | |
| Webfish | 842 | 842 | 205 | ✗ | ✓ | ✓ |
| # of Picts. | # of Fishes | # of Species | Date | Resolution | |
|---|---|---|---|---|---|
| Lab1 | 9 | 132 | 8 | 11 March 2021 | full HD |
| Lab2 | 24 | 102 | 5 | 1 April 2021 | full HD |
| Lab3 | 12 | 87 | 5 | 21 July 2022 | 4 K |
| Lab4 | 5 | 79 | 6 | 11 May 2023 | 4K |
| Market1 | 12 | 39 | 8 | 4 March 2021 | 4K |
| Market2 | 11 | 43 | 11 | 21 April 202 | 4K |
| Market3 | 13 | 71 | 11 | 7 December 2023 | 4K |
| Total | 86 | 553 | 26 |
| mAP | AP50 | AP75 | AR1 | AR10 | AR100 | |
|---|---|---|---|---|---|---|
| FIB | 0.997 | 0.998 | 0.998 | 0.999 | 0.999 | 0.999 |
| Multiple (1) | 0.864 | 0.976 | 0.976 | 0.114 | 0.760 | 0.889 |
| Recall [%] | Precision [%] | Fishes | Success | Misdetection | Union | |
|---|---|---|---|---|---|---|
| Lab1 | 70.8 | 100.0 | 130 | 92 | 0 | 0 |
| Lab2 | 98.0 | 100.0 | 102 | 100 | 0 | 0 |
| Lab3 | 100.0 | 100.0 | 89 | 89 | 0 | 0 |
| Lab4 | 59.0 | 97.9 | 78 | 46 | 0 | 1 |
| Market1 | 79.5 | 96.9 | 39 | 31 | 0 | 1 |
| Market2 | 68.2 | 90.9 | 44 | 30 | 1 | 2 |
| Market3 | 32.5 | 86.2 | 77 | 25 | 0 | 4 |
| Mask Condition | Env. | Mostly Correct | Part of Tail Missing | Critical Missing |
|---|---|---|---|---|
| Correct mask | Lab1 | 48 (85.7%) | 6 (10.7%) | 2 (3.6%) |
| Lab2 | 66 (78.6%) | 11 (13.1%) | 7 (8.3%) | |
| Lab3 | 61 (76.3%) | 13 (16.3%) | 6 (7.5%) | |
| Lab4 | 27 (84.4%) | 4 (12.5%) | 1 (3.1%) | |
| Market1 | 9 (90.0%) | 1 (10.0%) | 0 (0.0%) | |
| Market2 | 8 (66.7%) | 3 (25.0%) | 1 (8.3%) | |
| Market3 | 3 (50.0%) | 3 (50.0%) | 0 (0.0%) | |
| Total | 222 (79.3%) | 41 (14.6%) | 17 (6.1%) | |
| Part of mask missing | Lab1 | 1 (14.3%) | 6 (85.7%) | 0 (0.0%) |
| Lab4 | 3 (33.3%) | 0 (0.0%) | 6 (66.7%) | |
| Market1 | 6 (35.3%) | 8 (47.1%) | 3 (17.6%) | |
| Market2 | 6 (54.5%) | 5 (45.5%) | 0 (0.0%) | |
| Market3 | 5 (50.0%) | 4 (40.0%) | 1 (10.0%) | |
| Total | 21 (38.9%) | 23 (42.6%) | 10 (18.5%) |
| Pred.\True | Correct Mask | Excess Mask | Part of Mask Missing | Critical Missing |
|---|---|---|---|---|
| Correct | 228 | 0 | 19 | 75 |
| Missing | 52 | 3 | 35 | 71 |
| Recall | 80.6% | 53.0% | ||
| Precision | 70.8% | 65.8% | ||
| F1 score | 75.4% | 58.7% | ||
| Accuracy | 69.2% | |||
| Macro F1 score | 67.0% | |||
| Pred.\True | Correct Mask | Excess Mask | Part of Mask Missing | Critical Missing |
|---|---|---|---|---|
| Correct | 211 | 0 | 19 | 28 |
| Missing | 69 | 3 | 35 | 118 |
| Recall | 74.6% | 76.5% | ||
| Precision | 81.8% | 68.0% | ||
| F1 score | 78.0% | 72.0% | ||
| Accuracy | 75.4% | |||
| Macro F1 score | 75.0% | |||
| Pred.\True | Single | Multiple |
|---|---|---|
| Single | 443 | 2 |
| Multiple | 30 | 8 |
| Recall | 93.7% | 80.0% |
| Precision | 99.6% | 21.1% |
| F1 score | 96.5% | 33.3% |
| Accuracy | 93.4% | |
| Macro F1 score | 64.9% | |
| Order | # of Fish | IS | KP (Strict) | KP |
|---|---|---|---|---|
| Perciformes | 417 | 94.0% | 42.4% | 72.2% |
| Pleuronectiformes | 151 | 92.7% | 18.5% | 63.6% |
| Aulopiformes | 87 | 97.7% | 63.2% | 89.7% |
| Clupeiformes | 30 | 96.7% | 76.7% | 93.3% |
| Tetraodontiformes | 29 | 100.0% | 48.3% | 89.7% |
| Stomiiformes | 23 | 91.3% | 56.5% | 73.9% |
| Beloniformes | 17 | 88.2% | 47.1% | 58.8% |
| Gadiformes | 16 | 81.3% | 62.5% | 81.3% |
| Anguilliformes | 15 | 93.3% | 20.0% | 46.7% |
| Lophiiformes | 10 | 90.0% | 10.0% | 30.0% |
| Zeiformes | 10 | 90.0% | 20.0% | 50.0% |
| Ophidiiformes | 5 | 100.0% | 0.0% | 100.0% |
| Beryciformes | 5 | 100.0% | 60.0% | 100.0% |
| Salmoniformes | 5 | 100.0% | 100.0% | 100.0% |
| Gasterosteiformes | 5 | 80.0% | 0.0% | 20.0% |
| Myliobatiformes | 5 | 100.0% | 0.0% | 20.0% |
| Mugiliformes | 5 | 100.0% | 60.0% | 100.0% |
| Argentiniformes | 4 | 100.0% | 75.0% | 100.0% |
| Lampriformes | 3 | 100.0% | 0.0% | 33.3% |
| Total | 842 | 94.1% | 41.3% | 72.6% |
Disclaimer/Publisher’s Note: The statements, opinions and data contained in all publications are solely those of the individual author(s) and contributor(s) and not of MDPI and/or the editor(s). MDPI and/or the editor(s) disclaim responsibility for any injury to people or property resulting from any ideas, methods, instructions or products referred to in the content. |
© 2024 by the authors. Licensee MDPI, Basel, Switzerland. This article is an open access article distributed under the terms and conditions of the Creative Commons Attribution (CC BY) license (https://creativecommons.org/licenses/by/4.0/).
Share and Cite
Hasegawa, T.; Nakano, D. Robust Fish Recognition Using Foundation Models toward Automatic Fish Resource Management. J. Mar. Sci. Eng. 2024, 12, 488. https://doi.org/10.3390/jmse12030488
Hasegawa T, Nakano D. Robust Fish Recognition Using Foundation Models toward Automatic Fish Resource Management. Journal of Marine Science and Engineering. 2024; 12(3):488. https://doi.org/10.3390/jmse12030488
Chicago/Turabian StyleHasegawa, Tatsuhito, and Daichi Nakano. 2024. "Robust Fish Recognition Using Foundation Models toward Automatic Fish Resource Management" Journal of Marine Science and Engineering 12, no. 3: 488. https://doi.org/10.3390/jmse12030488
APA StyleHasegawa, T., & Nakano, D. (2024). Robust Fish Recognition Using Foundation Models toward Automatic Fish Resource Management. Journal of Marine Science and Engineering, 12(3), 488. https://doi.org/10.3390/jmse12030488